


Abstract
The ORCI project aims to develop an AI-based decision-support tool to assist air traffic controllers in complex TMA operations, taking Barcelona’s transitions as the primary use case. Using historical radar data, the tool has been trained to predict spacing between consecutive arrivals based on real-time vectoring commands. A data-processing pipeline was developed to clean, classify and validate flight trajectories, and synthetic samples were generated to enable a wider variety of situations. Explainable ML models achieved a mean absolute error of around 0.38 NM, demonstrating strong predictive capability. The results show the potential of ORCI to improve sequencing efficiency and runway throughput.
1. Introduction
The ORCI project aims to develop an AI-based decision-support tool designed to assist air traffic controllers (ATCOs) in managing high-complexity Terminal Maneuvering Area (TMA) environments, with a specific focus on the transition procedures used in Barcelona. Previous analyses of arrival traffic conducted within internal company projects, such as ATENEA, have shown that aircraft typically maintain an average excess spacing of around 1 NM beyond the theoretical separation of 2.5 NM in threshold (THR), suggesting that a potential increase in runway threshold could be achieved through more consistent spacing management.
In addition to internal studies, SESAR research initiatives such as Optimised Runway Delivery (ORD) [1] and its enhanced version (eORD) [2] have demonstrated that optimized spacing delivery on final approach, supported by advanced separation concepts and machine-learning-based speed predictions, can significantly increase runway throughput at capacity-constrained airports while maintaining safety and controller workload. These studies highlight the benefits of data-driven decision-support tools to reduce unnecessary spacing buffers, similar to the eOSD tool, which employs machine learning to accurately predict aircraft trajectories and wind impact to optimize spacing delivery [3]. Furthermore, providing visual indicators on radar screens has been shown to assist controllers in adjusting aircraft positions to match separation minima more effectively [4].
In line with these findings, ORCI uses historical radar data to train machine learning models capable of predicting the expected spacing between consecutive arrivals at the localizer when a vectoring instruction is issued. By providing real-time estimations of the resulting spacing, the tool could help ATCOs anticipate the impact of their tactical decisions, reduce excessive spacing variability and ultimately improve runway throughput and operational efficiency.
This paper is structured as follows: Section 2 describes the Barcelona airport use case, focusing on the arrival operations to RWY 24R and the associated RNAV transition procedures. Section 3 presents the methodology, including data processing, the extraction of additional geometric parameters, the generation of synthetic trajectories, and the validation of the resulting datasets. Section 4 reports and discusses the main results obtained from different machine learning models.
2. Barcelona’s Approach Procedures to RWY 24R
Barcelona El Prat airport is the second largest airport in Spain, exceeding 49.8 million passengers and 319,000 operations in 2023 [5]. The airport has three take-off and landing zones, thus obtaining three runways in service, two in parallel called 06L/24R and 06R/24L, and a cross runway 02/20 [6].
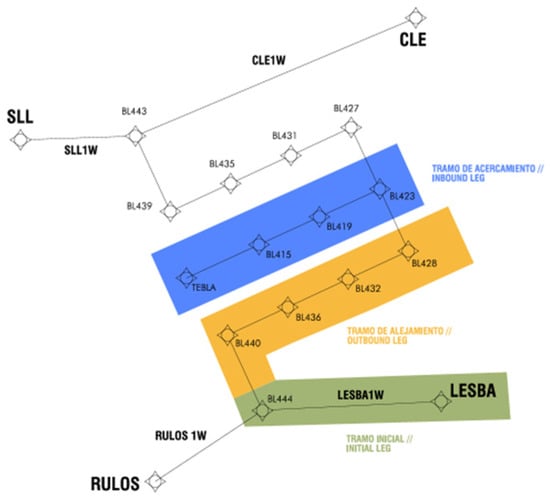
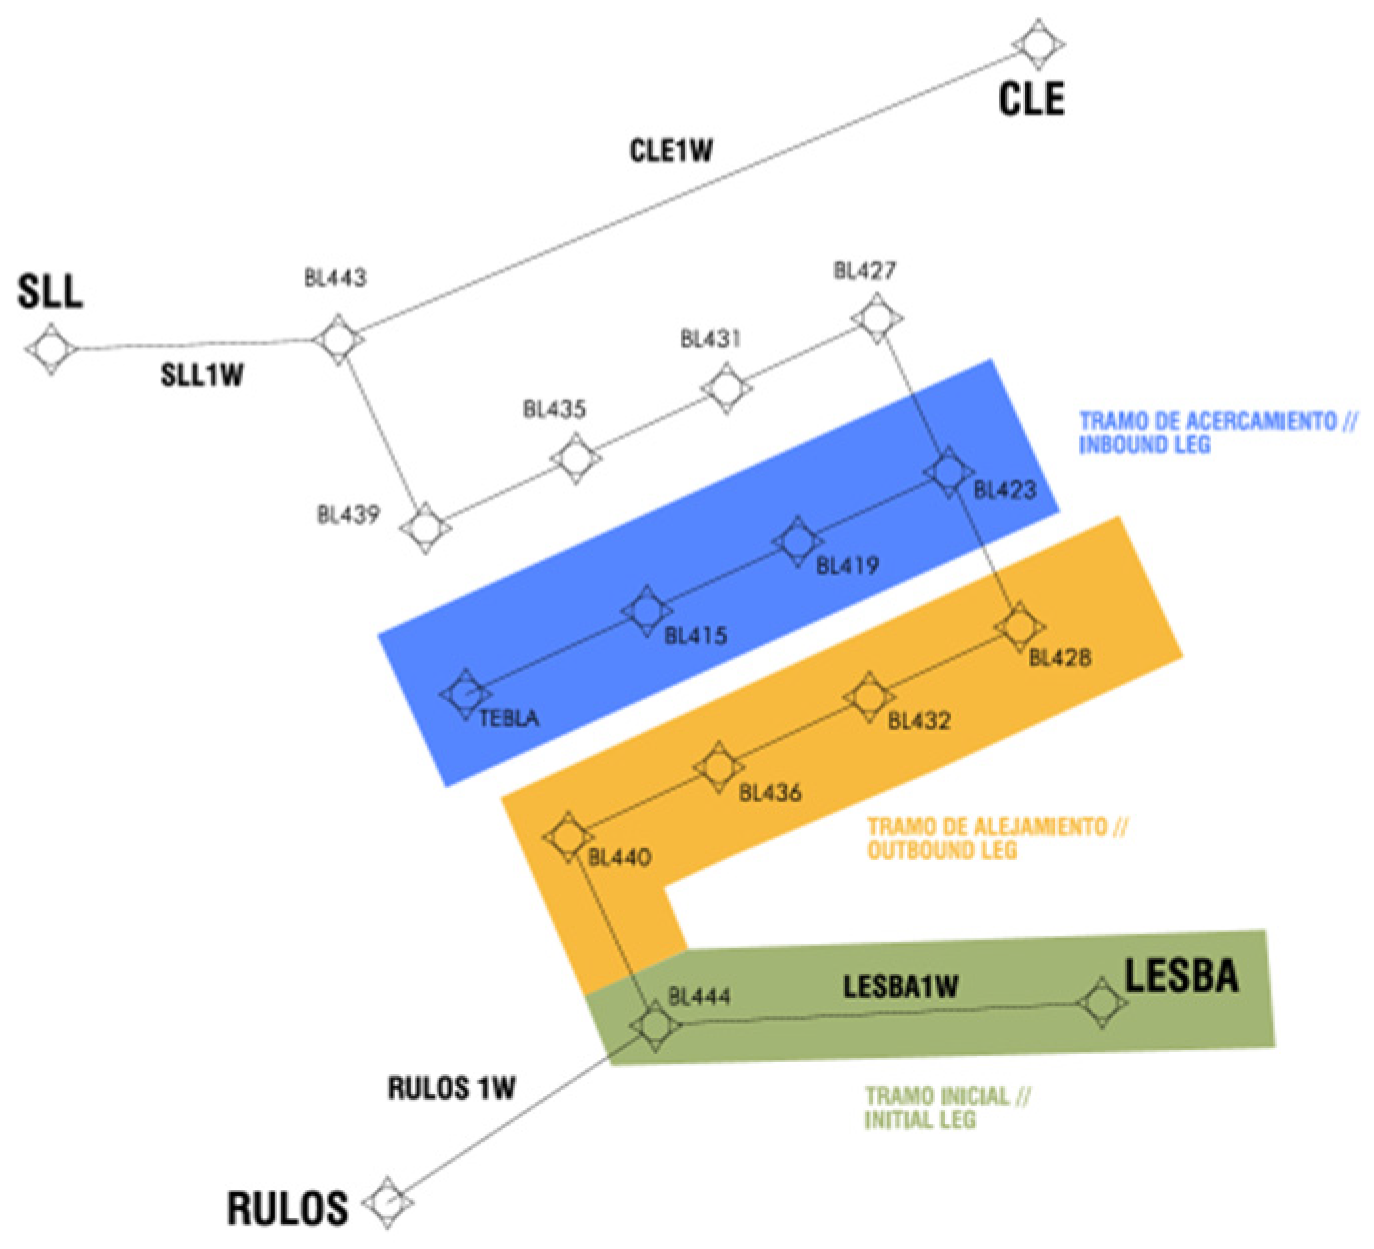
The ORCI project focuses on the West Parallel Runways configuration at Barcelona airport, which is the most used configuration, with landing operations conducted on RWY 24R. Arrivals to this runway are managed through RNAV1 instrument approach procedures known as transitions, which are specifically designed to sequence inbound traffic at high-density airports. An RNAV transition (Figure 1) is a published procedure consisting of: one initial segment, one outbound leg and one inbound leg, which links a STAR (from an IAF or some earlier point) to a point from which it is possible to accomplish the final approach segment of an approach procedure to the ILS or equivalent approach [7]. This procedural design provides inherent demand elasticity: during periods of increased traffic demand, aircraft are instructed to fly longer outbound legs, effectively absorbing delay within the approach structure itself. As a result, traffic spacing can be managed tactically without resorting to conventional holding patterns, improving both efficiency and predictability in arrival sequencing.
Figure 1.
RNAV1 transition procedure. LEBL RWY 24R [7].
3. Methodology
The data used for the project consist of radar track information from aircraft operations in the Barcelona TMA. Data were collected during the summer months of 2023, from July 1st to September 30th. These records include timestamp, positional coordinates, flight level (FL), indicated air speed (IAS), ground speed (GS), heading (HDG) and wake turbulence for each detected target, with an update rate of 5 s approximately.
3.1. Data Treatment
The data used in this study were provided by ENAIRE (Madrid, Spain), the Spanish Air Navigation Service Provider (ANSP), and obtained from their radar system.
The data-processing workflow is designed to focus exclusively on landing operations at LEBL (Barcelona airport) by filtering out departing and transiting flights. The initial dataset comprised approximately 10,000 operations, of which around 3000 corresponded to arrivals to RWY 24R. This number is further reduced after applying the additional filtering criteria described in Section 3.1.2.
3.1.1. Transition Parametrization
The ORCI project focusses on landing operations on RWY 24R, excluding all the operations related to other runways. Moreover, only flights executing the transition maneuver described in Section 2, with trajectories showing a reasonable similarity to the published chart, were retained. To achieve this, several mathematical operations are performed to derive additional parameters from the original flight data.
The distance from each radar trace to several critical reference points is computed using the Haversine Equation (1), which provides the shortest distance between two points on a sphere and accurately represents separations over the Earth’s surface.
- ;
- .
Furthermore, several straight segments have been defined as key elements of the transition approach, such as the localizer and outbound paths. To compute the distance of each radar point to these reference lines, the perpendicular distance from a point to a straight line (using local approximation) is applied:
where:
- A, B, C are the coefficients of the straight-line equation defining the final approach path. These coefficients are obtained by computing the line that connects the THR of RWY 24R and TEBLA.
- Lon (rad) and Lat (rad) are the longitude and latitude of the trajectory point in radians.
- R is the Earth’s radius used for local distance approximation.
Using these equations, the following additional parameters are calculated:
- Turning point: the moment when the aircraft begins the final turn toward the localizer and leaves the corresponding outbound segment (north or south).
- Localizer interception point: the moment when the turn has finished and intercepts the localizer.
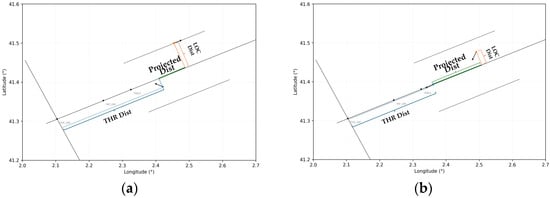
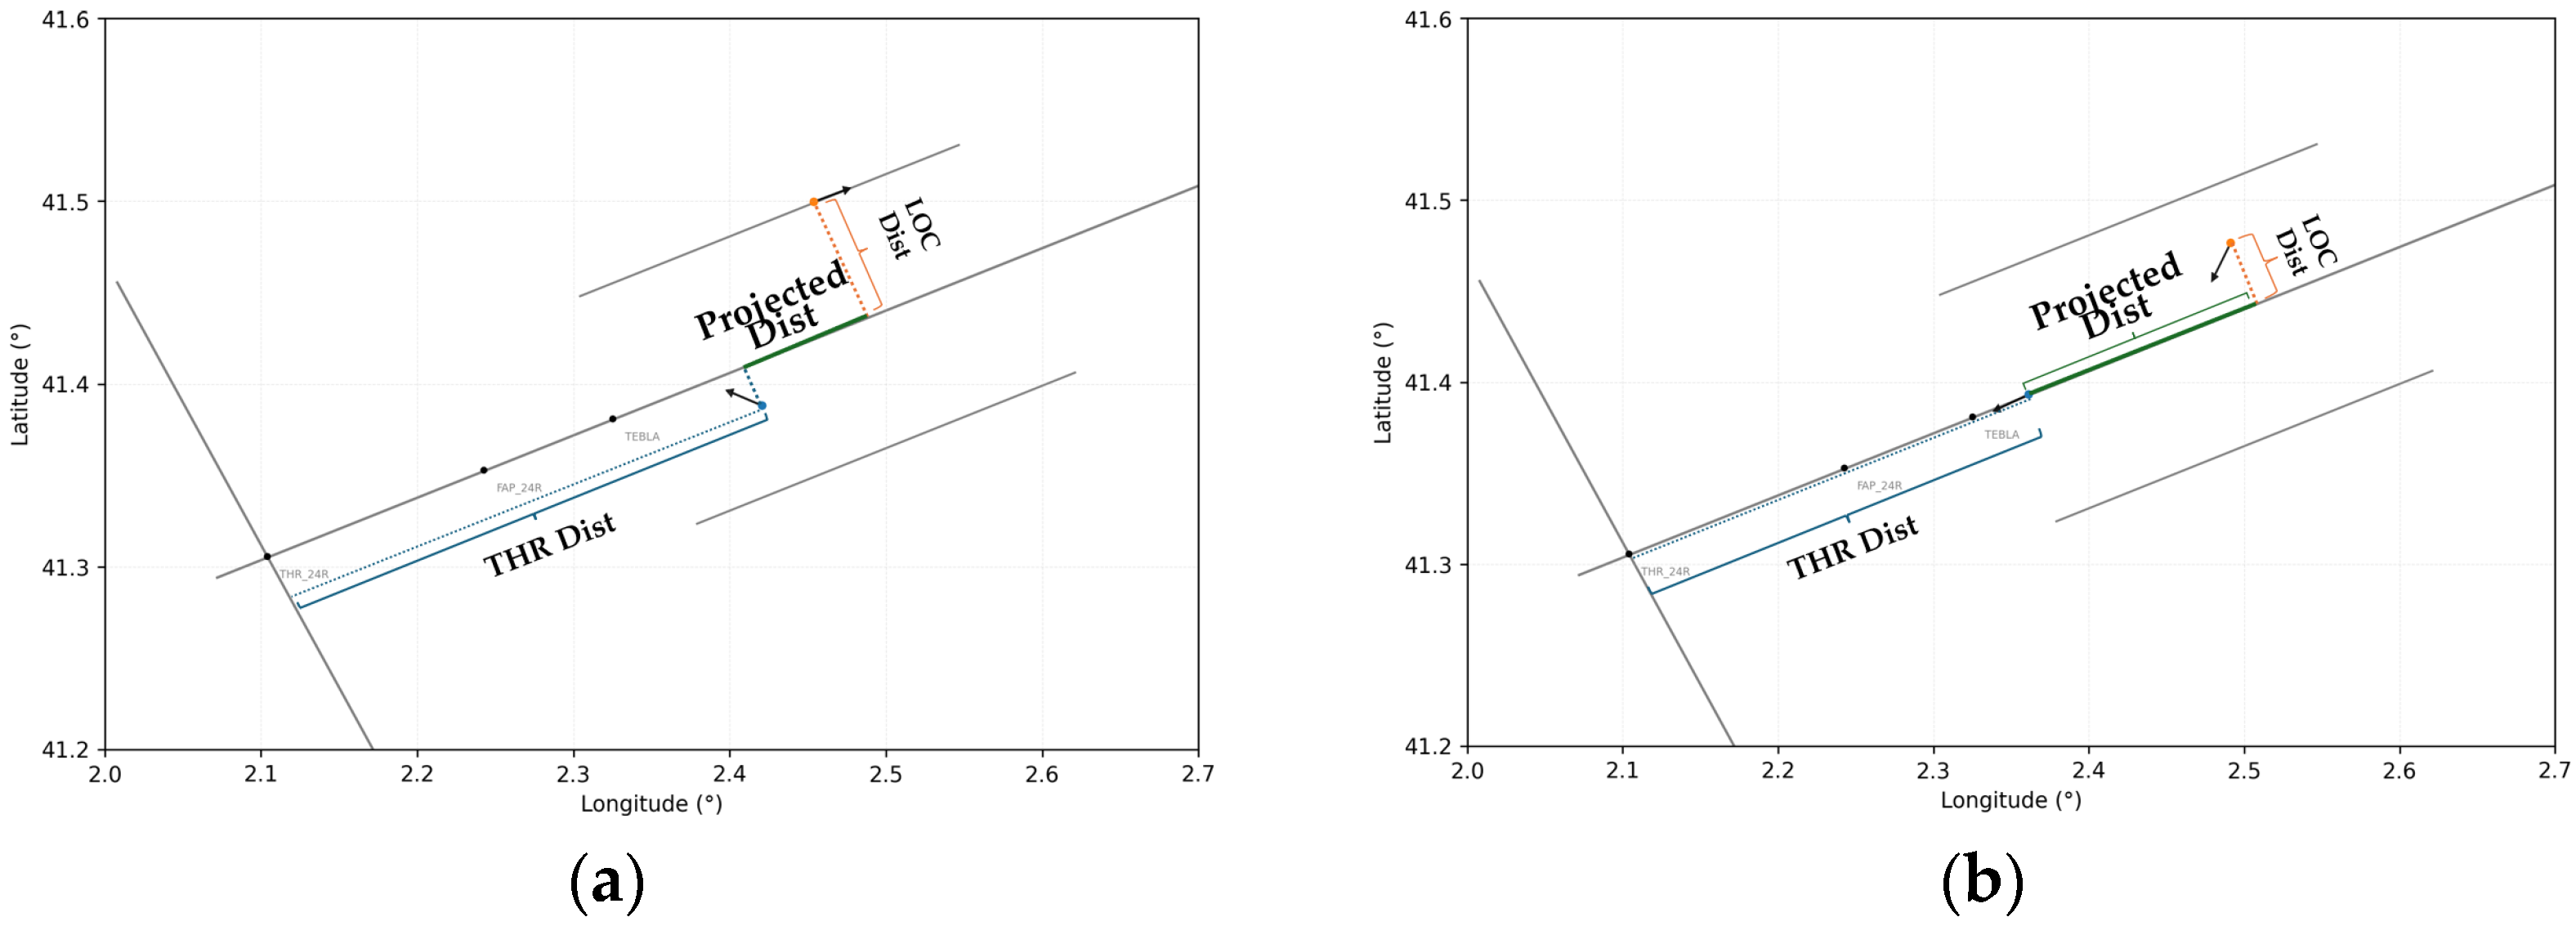
- Projected threshold distance: the shortest distance between the aircraft and the line perpendicular to the runway axis that passes through the THR (See Figure 2).
- Projected localizer distance: the shortest distance between the aircraft and LOC (see Figure 2).
Figure 2.
Relative distances between a pair of aircraft: (a) before the follower initiates the turn, (b) when the follower intercepts the LOC, the prediction path.
The main objective of ORCI is to predict the spacing between two consecutive aircraft at the point where the follower intercepts the localizer. For this purpose, each aircraft is paired with the one immediately ahead, designating the first to land as the preceding aircraft and the second as the follower. For subsequent pairs, the same aircraft may act as a follower in one pair and as the preceding aircraft in the next, depending on its position in the landing sequence.
For each aircraft pair, the relative distances projected onto the localizer and threshold axes are computed at two key stages: immediately before the follower initiates the turn toward the localizer (Figure 2a) and at the moment it intercepts the localizer (Figure 2b), which serves as the prediction target.
3.1.2. Trajectory Validation
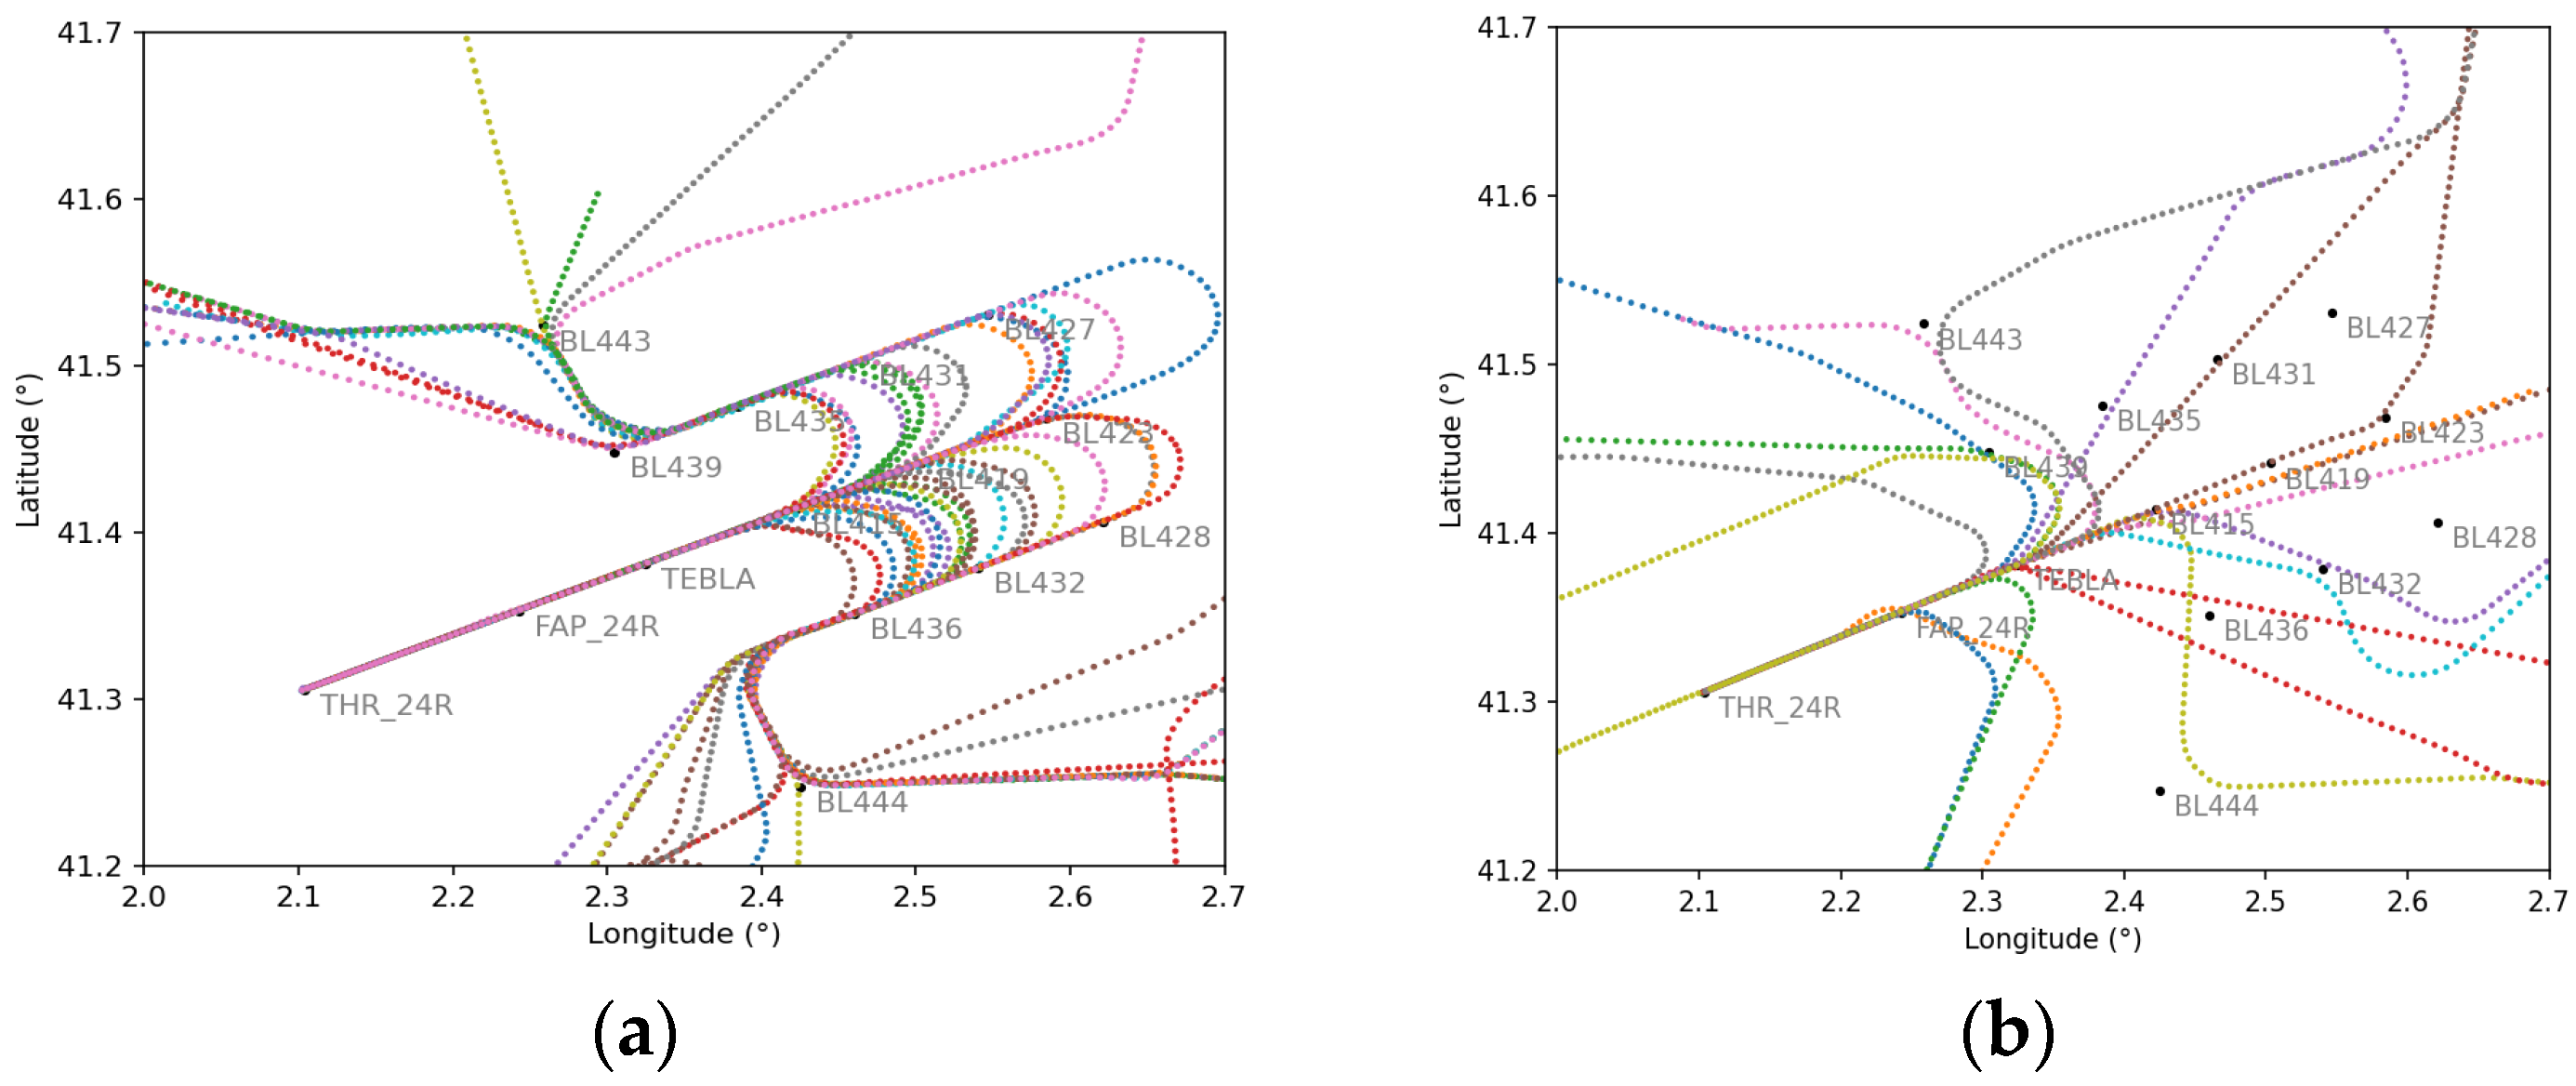
Given that the ML models will be trained using real radar track data, it is necessary to perform careful cleaning and selection of the trajectories to be used for training. Although the trombone procedure is clearly defined, in many situations, it is not strictly followed. For example, during periods of low traffic demand, the trombone may not be used. Instead, the flights are vectored directly to the IF (TEBLA). Therefore, in this section, flights will be selected based on adherence to the defined approach procedure, ensuring that only representative trajectories are included for model training.
In Figure 3, different trajectory cases represent not valid and valid cases, where the aircraft follows the transition procedure.
Figure 3.
(a) Flights considered valid for model training. (b) Flights considered not valid flights.
3.1.3. Creating Synthetic Flight Pairs
Since the ML models are trained using real traffic data, the diversity of scenarios is inherently limited to what occurs in actual operations. However, for ORCI to provide reliable predictions, it must be able to handle a wider variety of scenarios, including extreme or unlikely situations that may not appear in the historical data.
To achieve this, synthetic training lessons are created, manipulating the times of the preceding aircraft in each valid pair of flights by advancing or delaying it in short second increments, leaving the follower “frozen” without altering the real 3D trajectories. In this way, a single flight pair can be used to generate synthetic scenarios with reduced or increased spacing relative to the actual case. Table 1 presents examples of these variations for identical follower conditions. This process allows for the creation a full spectrum of possible scenarios, including:
Table 1.
Synthetic samples derived from the original data (follower columns remain static).
- Real operative situations.
- Excessive spacing situations.
- Situations where the follower aircraft virtually overtakes or even collides with the preceding (which do not happen in real life).
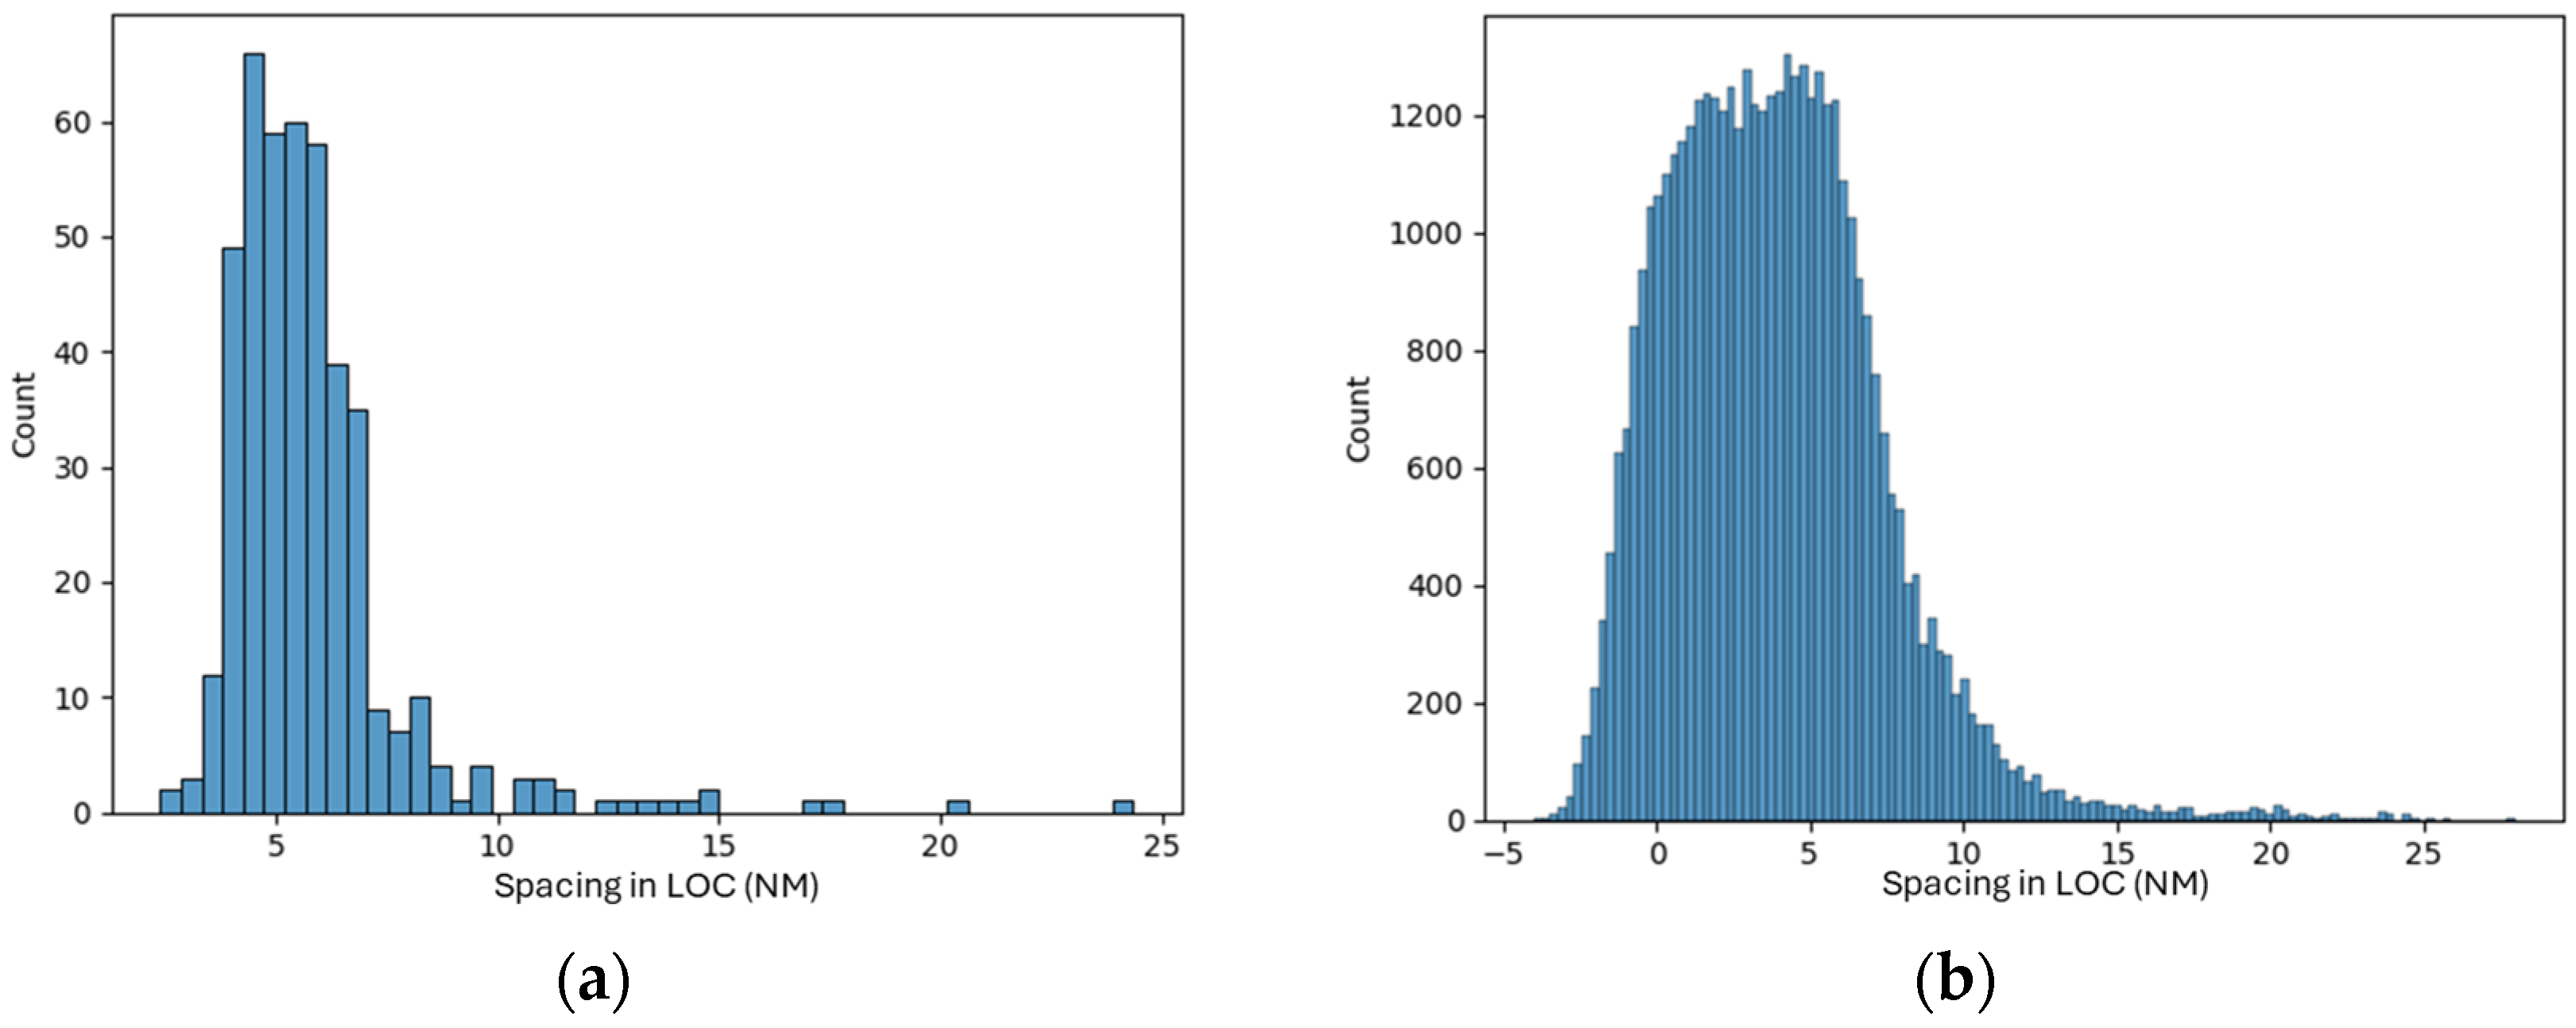
By training the models on an augmented dataset built from approximately 3200 real flights and expanded to around 55,000 samples through synthetic generation, the models are able to capture a wider range of operational scenarios. In Figure 4, the histogram on the left shows the distribution of real LOC inter distances, centered around 5 NM, while the histogram on the right illustrates the distribution after generating the synthetic samples.
Figure 4.
Separation in LOC before (a) and after (b) the generation of the synthetic data.
This process not only increases the number of available training instances, it also expands the range of separation values covered, going from −2 to approximately 8 NM (where negative separation means that the preceding overtakes the leader) and providing the model with exposure to both tighter and wider spacing scenarios than those observed in real operations.
3.2. Machine Learning Datasets and Training
The dataset includes information for both the follower and the preceding aircraft at the theoretical moment when the turn instruction is commanded. Some columns contain data directly extracted from the flight information at that instant, while other columns are derived features. Finally, the dataset includes the target column, which represents the separation on the LOC once the follower aircraft intercepts it (see Table 2).
Table 2.
Variables and features of the dataset prepared to train the ML models.
The training and test sets were split by allocating three weeks, one of each month to the test dataset and the remaining weeks to the training set, resulting in an approximate training and test ratio of 75–25%. This temporal separation was chosen to prevent synthetic samples derived from the same flight from appearing in both datasets.
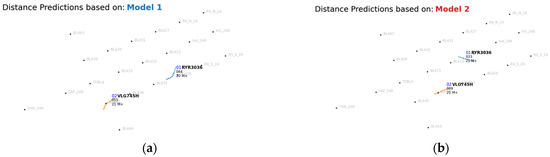
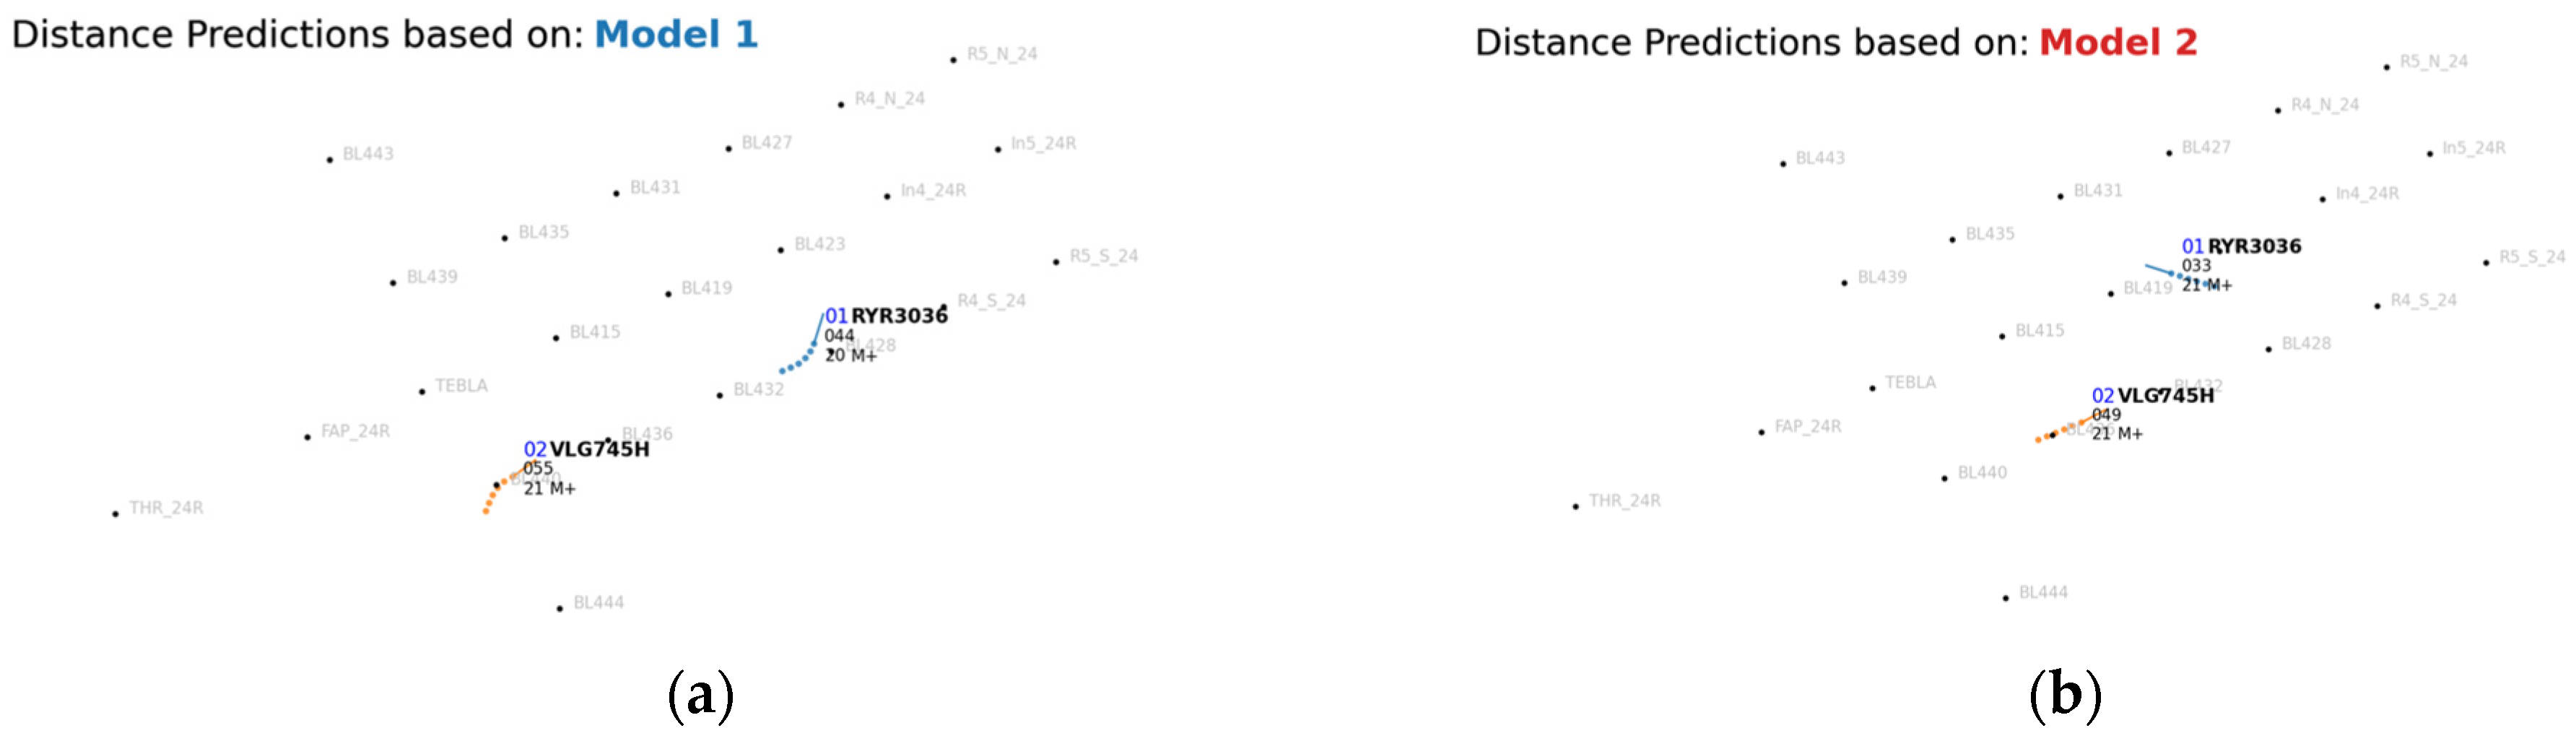
The turn is divided into two segments, with a separate ML model trained for each segment where the trigger is the preceding aircraft’s heading deviation from LOC:
- The first model addresses the initial part of the turn, which represents a greater challenge due to more dynamic conditions, as the aircraft are diverging from each other and preceding conditions change rapidly (see Figure 5a).
- The second model focuses on the last part: when the preceding aircraft is completing the turn or has already intercepted the LOC, resulting in more steady conditions compared to the initial part of the turn (see Figure 5b).
Figure 5.
Segmentation of the turn to LOC for model training: (a) initial segment corresponding to Model 1; (b) final segment corresponding to Model 2.
The training of explainable ML models has been prioritized, specifically linear regressions, which provide a good tradeoff between traceability and performance.
4. Results
In this section, the results of the model training and evaluation are presented. Initially, a standard linear regression model was trained. However, from an operational standpoint, not all types of prediction errors have the same implications. Here, the error is defined as the difference between the predicted and the actual spacing (). In this formulation, positive errors correspond to cases where the aircraft are closer than predicted, representing the undesirable side of the distribution from a safety perspective.
To address this, a second iteration was performed using a weighted linear regression approach. An additional column containing the prediction errors from the first iteration was created, and a weight column was defined according to the error range, assigning higher weights to positive errors. This allows the model to prioritize learning from these critical cases, reducing positive deviations.
The conventional linear regression models achieved a mean absolute error (MAE) of approximately 0.38 NM, while the weighted models obtained an MAE of around 0.45 NM. This performance is considered satisfactory, given that usual spacing between two aircraft in LOC is 4.5 NM and, during high-demand periods, the average excess spacing typically reaches about 1 NM. This means that, on average, the spacing is being reduced by more than half relative to the excess distance.
The detailed results for each model and evaluation metrics are presented in Table 3.
Table 3.
Comparation of the different evaluation metrics for each LR and weighted LR model.
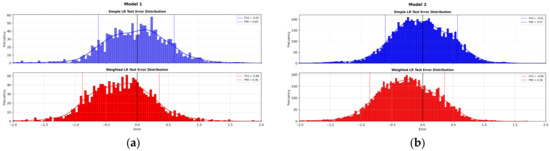
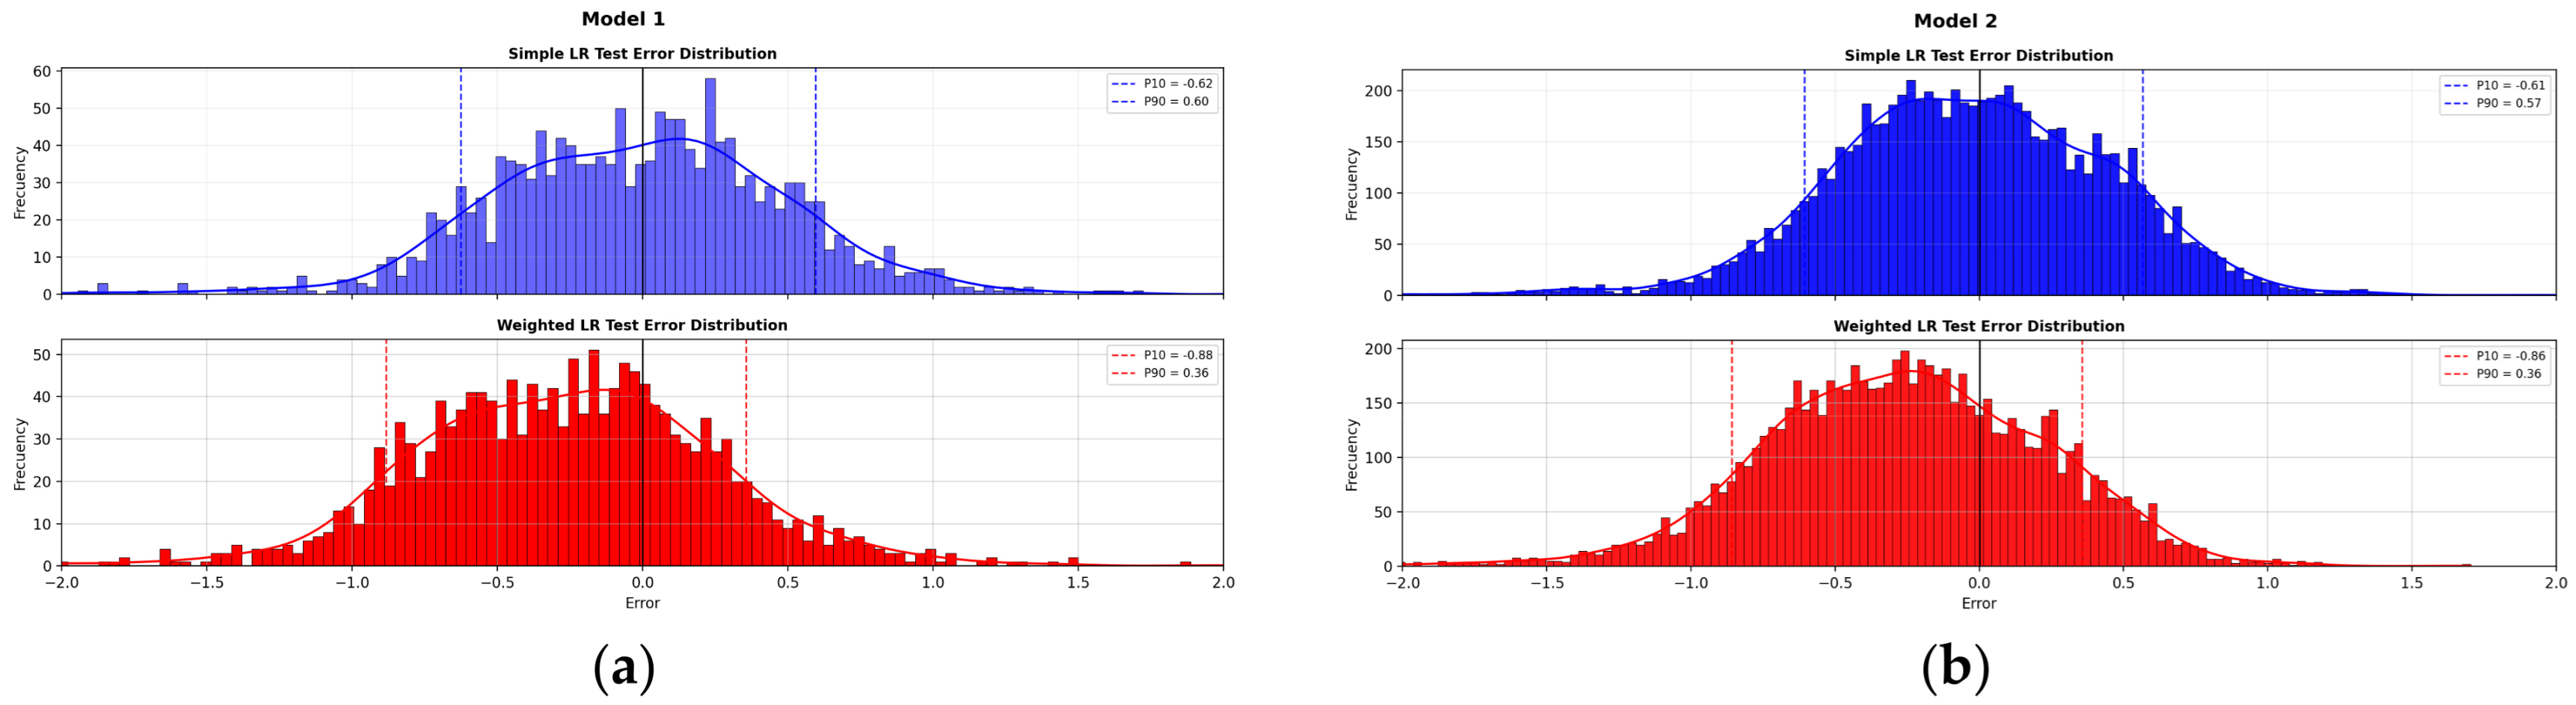
The training and test histogram distributions (see Figure 6) of the errors and metrics are similar, indicating that the models do not suffer from overfitting and the predictive performance observed during training is reliable using unseen operational data. The errors follow a normal-distribution shape. As noted previously, errors are slightly larger in Model 1, which is consistent with its task of predicting under more dynamic conditions during the initial part of the turn.
Figure 6.
(a) Test error histogram for Model 1 using standard linear regression and weighted linear regression. (b) Test error histogram for Model 2 using standard linear regression and weighted linear regression.
Applying the weighted regression slightly increases the MAE across both models and datasets; however, this does not imply that the weighted models perform worse. The weighting was intentionally applied to prioritize learning from positive errors, which are more critical from an operational perspective. As a result, errors on the “non-conservative” side are reduced by approximately 75% and the higher percentiles (p90) show substantial improvement, reducing the risk of overestimating aircraft real spacing. This trade-off reflects a deliberate focus on operationally meaningful metrics rather than global error minimization.
5. Conclusions
The results of this exploratory study are promising within the scope of the project, demonstrating ORCI’s potential as a decision support tool to enhance ATCO awareness during approach operations. By providing real-time estimations of the resulting spacing, the tool could help ATCOs anticipate the impact of their tactical decisions, reduce excessive spacing variability, and ultimately improve runway throughput and overall operational efficiency.
The next step will involve validation with ATCOs to assess the tool’s usability and operational value. These activities will help confirm ORCI’s potential to support decision-making and reduce ATCO workload without altering existing procedures.
Author Contributions
Conceptualization, R.B., A.M.-V. and J.M.R.; methodology, R.B. and A.M.-V.; software, R.B. and A.M.-V.; validation, R.B. and A.M.-V.; formal analysis, R.B. and A.M.-V.; investigation, R.B. and A.M.-V.; data curation, R.B. and A.M.-V.; writing—original draft preparation, R.B. and A.M.-V.; writing—review and editing, R.B., A.M.-V. and J.M.R.; supervision, J.M.R. All authors have read and agreed to the published version of the manuscript.
Funding
This project has received funding from the SESAR 3 Joint Undertaking under grant agreement No. 101167539 under the European Union’s Horizon Europe research and innovation programme.
Institutional Review Board Statement
Not applicable.
Informed Consent Statement
Not applicable.
Data Availability Statement
The data presented in this study are available on request from the corresponding author. Access to the data is restricted due to a non-disclosure agreement (NDA) with ENAIRE, the collaborating organization that provided the radar information.
Acknowledgments
The authors would like to thank ENAIRE for providing access to the radar data used in this study, as well as for the valuable operational knowledge contributed by its ATCOs. The authors also acknowledge ISA Software (Paris, France) for their support in the validation activities and for their technical expertise. Additionally, the authors acknowledge the use of LLMs as an aid for text revision and refinement during the preparation of this manuscript.
Conflicts of Interest
Author Rita Bañón, Alejandro Mateo-Vendrell and José Manuel Rísquez are employed by the company INECO. All authors declare that the research was conducted in the absence of any commercial or financial relationships that could be construed as a potential conflict of interest.
References
- SESAR JU. Optimised Runway Delivery–Final Approach. Available online: https://www.sesarju.eu/sesar-solutions/optimised-runway-delivery-final-approach (accessed on 19 January 2026).
- SESAR JU. Enhanced Optimised Runway Delivery for Arrivals (eORD) with Machine Learning. Available online: https://www.sesarju.eu/sesar-solutions/enhanced-optimised-runway-delivery-arrivals-eord-machine-learning (accessed on 19 January 2026).
- De Petris, L.; De Visscher, I.; Stempfel, G.; Jacques, A.; Saidi, M.; Morgan, C.C. Machine Learning Supporting Enhanced Optimized Spacing Delivery between Consecutive Departing Aircraft. J. Phys. Conf. Ser. 2023, 2526, 012108. [Google Scholar] [CrossRef] [Scilit]
- Toratani, D.; Yoshihara, T.; Fujii, N.; Senoguchi, A.; Yamada, I. Investigation of Support Algorithm for Air Traffic Controllers’ Arrival Separation Management. IFAC-Pap. 2021, 54, 146–152. [Google Scholar] [CrossRef] [Scilit]
- AENA Estadísticas de Tráfico Aéreo. Available online: https://www.aena.es/es/estadisticas/inicio.html (accessed on 12 August 2025).
- Aeropuerto Barcelona–El Prat. Available online: https://www.aeropuertobarcelona-elprat.com/ingl/index.html (accessed on 12 August 2025).
- AIC Spain 03/22. Barcelona TMA Restructuring–Phase I (Project BRAIN). 24 March 2022. Published in AIP Spain. Available online: https://aip.enaire.es/AIP/contenido_AIC/I/LE_Circ_2022_I_03_en.pdf (accessed on 16 April 2026).

Disclaimer/Publisher’s Note: The statements, opinions and data contained in all publications are solely those of the individual author(s) and contributor(s) and not of MDPI and/or the editor(s). MDPI and/or the editor(s) disclaim responsibility for any injury to people or property resulting from any ideas, methods, instructions or products referred to in the content. |
© 2026 by the authors. Licensee MDPI, Basel, Switzerland. This article is an open access article distributed under the terms and conditions of the Creative Commons Attribution (CC BY) license.