


Abstract
Contrail emissions are aviation’s largest non-CO2 contribution to global climate change. According to the Schmidt–Appleman criterion, potential future aircraft propulsion systems may enhance contrail formation relative to conventional engines through three mechanisms: (1) increased overall efficiency, (2) the use of hydrogen as fuel, and (3) external cooling in low-temperature fuel cell propulsion systems, which is the most critical factor. This paper presents the thermodynamic background and a system concept for contrail prevention applicable to conventional gas turbines, hydrogen combustion, and fuel cell propulsion systems. First, it is shown that fuel cell propulsion and hydrogen combustion exhibit equivalent thermodynamic contrail propensity when fuel cell exhaust is mixed with cooling air, analogous to core–bypass mixing in a conventional turbofan engines. Second, contrail mitigation via controlled condensation of exhaust water vapor is analyzed. It is demonstrated that the required cooling for LT-PEM fuel cell systems is 3–5 times lower than for turbofan engines, due to the already extensive thermal management in fuel cells. Since contrail avoidance is only necessary in ice supersaturated regions, a control scheme is proposed that limits condensation to the minimum required amount of water, thereby significantly reducing the overall drag impact. Avoiding contrail formation could provide a substantial climate benefit for future propulsion architectures.
1. Introduction
Aviation contributes to global climate change through both CO2 and non-CO2 effects. Among the latter, contrail cirrus clouds have been identified as a dominant short-term radiative forcing component [1,2]. Contrails form when moist exhaust gases mix with cold ambient air, and condensation and subsequent freezing occur if the resulting mixture crosses the saturation line in the vapor pressure e–temperature T diagram [3,4,5].
Hydrogen-fueled propulsion systems release about 2.6 times more moisture per unit of energy than kerosene, strongly increasing contrail probability [5,6,7]. While hydrogen combustion increases contrail likelihood, low-temperature proton-exchange membrane (LT-PEM) fuel cells introduce an additional challenge: low exhaust temperatures due to external cooling lead to very high supersaturation conditions [6,7].
Contrail mitigation strategies [8,9] include, for example, modifications to fuel composition [5,10], power source [11], and engine efficiency [12], as well as adjustments to flight routing and altitude [5,13]. Additional approaches involve the use of fuel additives [14], droplet injection techniques [15], and condensation-based concepts [5,16,17].
This paper makes two contributions. First, it shows that the contrail propensity of LT-PEM fuel cell systems can be greatly reduced through appropriate mixing of exhaust and cooling air, analogous to core–bypass mixing in a turbofan engine. In this process, both fan losses and the kinetic energy deficit arising from non-ideal propulsive efficiency are converted into thermal energy within the plume.
Second, it investigates water condensation in the exhaust and demonstrates that the required cooling is 3–5 times lower for a LT-PEM fuel cell than for a turbofan engine, due to the already extensive cooling in fuel cells. Since contrail avoidance is only required when flying through ice supersaturated regions (ISSRs), a control scheme is proposed that triggers condensation only up to the minimum required amount of water, thereby significantly reducing the overall drag impact.
2. Theoretical Background
2.1. Microphysics of Contrail Evolution
Contrail formation and its climate impact can be analyzed in five steps: (1) water vapor supersaturation, (2) droplet formation, (3) droplet freezing, (4) ice crystal persistence, and (5) radiative forcing [18]. The paper focuses on the first step of water vapor supersaturation, with the remaining steps briefly summarized as follows:
- Droplet formation depends on time, supersaturation and the presence of condensation nuclei [19,20,21]. In the absence of condensation nuclei (homogeneous nucleation) extremely high supersaturations can be required (500–20,000% ), but abundant atmospheric nuclei enable droplets at 100.1–101% [22], where is the relative humidity with respect to liquid water. Furthermore, engine-emitted particles strongly influence droplet number and contrail optical properties [23,24].
- Droplet freezing occurs with high probability at ambient temperatures below about −38 °C [5,25]. Freezing depends on time, temperature, and ice nucleus availability [21,26]. Direct ice formation from vapor is far less likely [5].
- Ice crystal persistence in ISSRs enable ice crystals to grow, spread and form cirrus clouds [5,27,28].
- Radiative forcing of contrail cirrus clouds depends on location and diurnal cycle [29,30]. They can produce a cooling effect during daytime and a warming effect at night, but are expected to yield a net warming contribution [1,2,30,31,32].
2.2. Schmidt–Appleman Theory and Mixing Thermodynamics
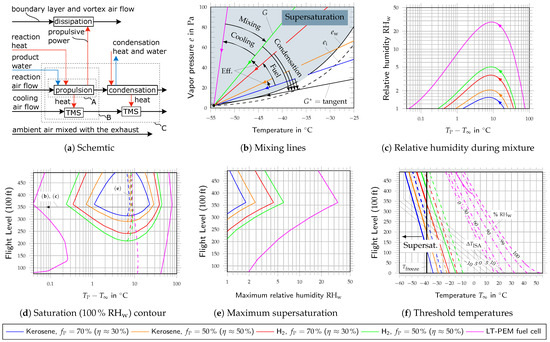
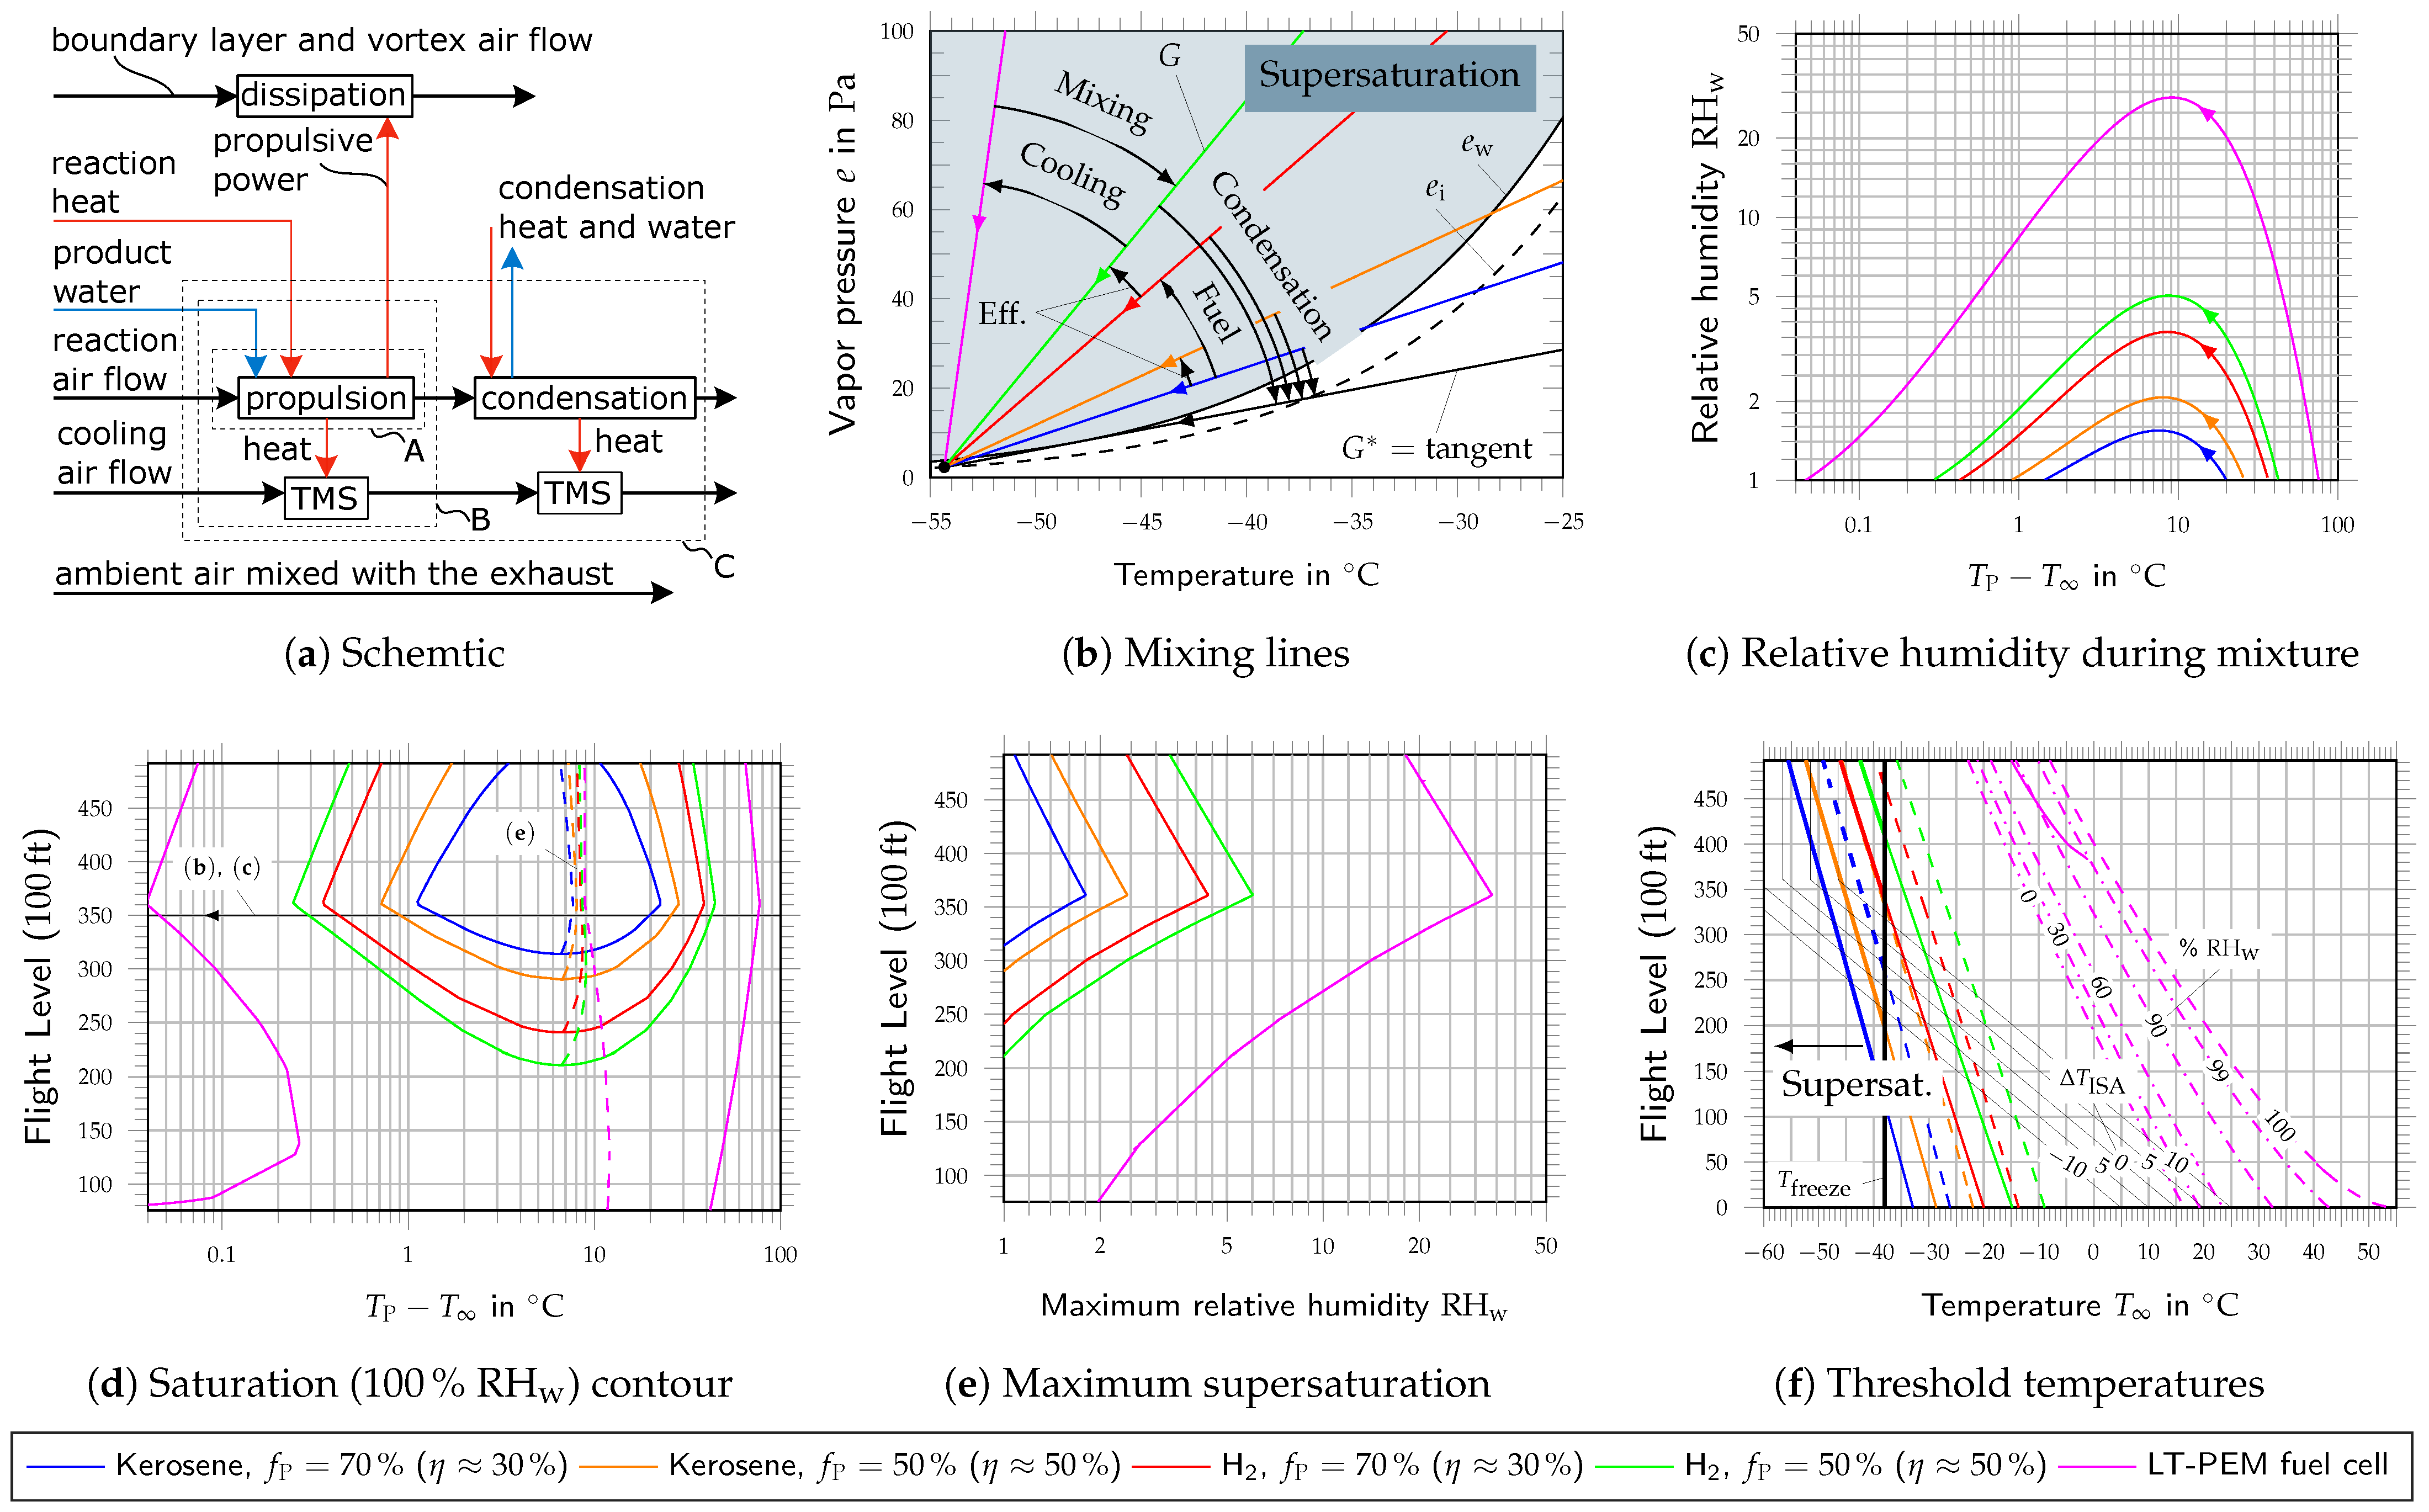
Schmidt (1941) [3] used the Mollier chart [33] and modeled contrail formation as a steam-injection process adding heat and moisture (see Figure 1a, system boundary A). In the Mollier chart [33] (analogous to the psychrometric chart) this steam-injection appears as a straight line, independent of the air-to-fuel ratio. The mixture of exhaust and ambient air follows this line toward ambient conditions as dilution increases (see Figure 1b, colored arrows).
Figure 1.
(a) Schematic of contrail formation processes; color-coded paths denote air flow (black), water (H2O, blue), and heat/energy transfer (red), with dashed lines indicating system boundaries A–C; (b) mixing lines at ; (c) relative humidity during mixture at ; (d) characteristic points during mixture as contour plot: saturation (100% , solid lines) and maximum supersaturation (dashed lines); (e) maximum relative humidity ; (b–d) ambient conditions: 0, 100% ; (f) threshold temperatures, ambient conditions: 100% (solid lines), 100% (dashed lines); legend applies to (b–f); LT-PEM fuel cell propulsion assumes an outlet temperature of 80 °C, and an equivalence ratio of 0.5 (air surplus of 2).
Schmidt further concluded that only a fraction of the combustion heat (relative to the lower heating value, ) enters the plume at supersaturation-relevant dilutions. As an example he used a piston-engine aircraft of his time, and assumed that the heat rejected to the exhaust (50%), the heat rejected to the cooling system (20%) and the propeller losses () enter the plume before supersaturation is likely to happen, while the remaining 24%, which he assumed to be split between friction at the aircraft skin and dissipation in the vortex pair, mixes with the exhaust only at higher dilutions, and is hence to be excluded in the calculations (see Figure 1a, system boundary B).
While Schmidt (1941) [3] based his assessment on ice saturation, Appleman (1953) [4] noted that contrails initially require supersaturation with respect to liquid water, droplet formation and subsequent freezing. Further early contrail observations and explanatory approaches besides those of Schmidt and Appleman are summarized by Schumann (1996) [5]. The current literature [5,6,7,8,9,12] usually expresses the Schmidt–Appleman theory (SAT) in terms of temperature T and vapor partial pressure e. The increase in temperature and the change in vapor pressure can be approximated as follows [5]:
where is the fraction of the reaction heat transferred to the plume at saturation-relevant dilution; m is the mass; 1004 J/(kg K) is the mean ambient specific heat capacity at constant pressure [5]; p is the pressure; y is the molar fraction; n is the amount of substance; M is the molar mass and . Here, the plume denotes the mixture of exhaust gases and entrained ambient air. Subscripts denote ambient, plume, fuel, air and water quantities; and denotes the difference of plume with respect to ambient.
For conventional gas turbine engines, the fraction of reaction heat transferred to the plume, , is commonly approximated as , where is the overall propulsive efficiency [5]. For the previous example according to Schmidt (1941) [3], a plume heat fraction % corresponds to an overall propulsive efficiency %. Additional effects, such as, power off-takes, heat rejection or electric power supply can be included into the plume heat fraction as well [6]. For example, preheating liquid hydrogen in the engine reduces the plume heat fraction by about 3% [6]. For kerosene, the lower heating value is defined based on the liquid fuel reference state; therefore only sensible heat of the plume state and fuel tank state relative to the reference state contribute to the plume heat fraction , which is typically negligible. Equation (1) neglects the sensible specific enthalpy and species contributions of reactants and products relative to the non-reacting air mass . Richardson (2025) [6] extended this theory to include these effects, as well as inflow/outflow velocities and non-ideal gas effects; however, for first-order estimates at saturation-relevant dilutions, these factors remain relatively small [5,6].
The ratio of vapor pressure change to temperature change , the mixing-line slope,
is independent of the fuel-to-air mass ratio . Consequently, if condensation is neglected, the plume’s evolution is characterized by a straight mixing line of slope G in the vapor pressure–temperature (e–T) diagram, as illustrated in Figure 1b. According to the SAT, the plume state moves along this line from exhaust conditions toward ambient conditions.
2.3. Comparative Analysis of Propulsion Systems
Figure 1b presents exemplary mixing lines for different propulsion systems (colors): hydrogen and kerosene combustion at overall efficiencies and (equivalently, plume heat fractions and ), as well as LT-PEM fuel cell propulsion with an exhaust temperature and an equivalence ratio of 0.5 (air surplus of 2). For the LT-PEM case, the mixing-line slope is evaluated directly from the exhaust state , where the exhaust vapor pressure is determined from the equivalence ratio. Ambient conditions are: flight level (35,000 ft ≈ 10,668 m), , and 100% . Here, is the deviation from the International Standard Atmosphere (ISA) temperature (see Figure 1f); and are the relative humidity with respect to ice and liquid water; and and are the saturation vapor pressures over ice and liquid water. Arrows indicate the evolution of the plume state.
All propulsion systems cross the saturation curve with respect to liquid water, indicating possible droplet formation. The mixing-line slope G increases due to: (1) higher efficiency; (2) hydrogen compared to kerosene, increasing the moisture per unit of energy ; and (3) external cooling in LT-PEM fuel cell propulsion. The three effects are labeled as Eff., Fuel, and Cooling in Figure 1b. As identified by Schmidt (1941) [3] (see Figure 1a, system boundary B), mixing cooling air with the exhaust prior to the onset of supersaturation cancels the cooling effect. This results in the same mixing-line slope G for both LT-PEM fuel cells and hydrogen combustion, provided they share the same plume heat fraction [34]. Further reduction in the mixing-line slope G by condensation is discussed in Section 3.
Figure 1c is an alternative representation of Figure 1b. It shows the supersaturation () for the same propulsion systems and ambient conditions as in Figure 1b. A logarithmic y-axis for the temperature difference is used with either four or five linearly spaced minor ticks between any two major ticks. Again arrows indicate the evolution of the plume state. The temperature difference relates to the dilution factor by , that is, . An increase in efficiency, the use of hydrogen fuel, and external cooling leads to (1) higher maximum supersaturation, (2) saturation occurring at larger temperature differences (i.e., lower dilution), (3) supersaturation persisting to lower temperature differences (i.e., higher dilution), and (4) a steeper increase in supersaturation. Consequently, higher supersaturation, and thus smaller droplets with larger surface-to-volume ratio, are likely, particularly for a reduced amount of condensation nuclei.
Figure 1d generalizes three characteristic mixing points along the plume evolution—two intersections with 100% (solid) and the point of maximum supersaturation (dashed)—as a function of flight level, , forming a contour-like representation. Ambient conditions and propulsion system parameters are kept identical to those in Figure 1b,c. The black horizontal line marks the flight level considered in Figure 1b,c. Figure 1d illustrates how the supersaturation contour expands with increasing efficiency, hydrogen fuel, and external cooling. Notably, the temperature difference at maximum supersaturation remains approximately constant across the cases considered.
Figure 1e generalizes the maximum supersaturation with respect to liquid water as shown in Figure 1c as a function of flight level, , using the same ambient conditions () and propulsion system parameters as before. The horizontal axis is logarithmic, with either four or five linearly spaced minor ticks between consecutive major ticks. Maximum supersaturation increases with altitude up to 11,000 m and decreases thereafter. This change in slope is primarily an artefact of the ISA temperature profile. At very high altitudes, contrail formation becomes less likely in any case, since the ambient relative humidity is typically below ice saturation [27]. At 11,000 m, the maximum supersaturation reaches 1.8 for kerosene propulsion (2.4 for ), 4.4 for hydrogen combustion (6.0 for ), and 33.8 for LT-PEM fuel-cell propulsion. This underscores the pronounced increase in supersaturation for LT-PEM fuel cell systems, which far exceeds the levels seen in conventional combustion-based propulsion.
Figure 1f shows threshold temperatures as a function of flight level, . Colors distinguish the propulsion systems, while line styles indicate ambient relative humidity: solid lines correspond to 100% , dashed lines to 100% , and dash-dotted lines to additional relative humidity levels for LT-PEM fuel-cell propulsion (). Lines of constant deviation from the International Standard Atmosphere are shown for .
The threshold temperature is defined as the maximum temperature at which saturation is reached for a given ambient pressure, ambient humidity, and propulsion system [3,4,5]. Supersaturation occurs whenever the ambient temperature falls below this threshold. Threshold temperatures for LT-PEM fuel-cell propulsion shown in Figure 1f differ from those reported in (Figure 7) [6], as they are based on a fixed fuel-cell operating point (fixed exhaust temperature and fixed equivalence ratio, which determines the vapour pressure difference ) rather than a prescribed mixing-line slope G, which may better represent controlled LT-PEM fuel cell operation.
A homogeneous freezing threshold of −38 °C is additionally indicated. Below this temperature, droplet freezing is highly likely. Threshold temperatures above are shown with thin lines, indicating that homogeneous freezing is the more restrictive condition for contrail formation. Conversely, bold lines denote cases where the threshold temperature lies below , meaning that saturation is the limiting constraint.
Overall, Figure 1f demonstrates that increasing efficiency, the use of hydrogen fuel, and external cooling in LT-PEM fuel-cell systems significantly raise threshold temperatures. As a result, supersaturation conditions can occur at higher ambient temperatures and lower altitudes. In particular, LT-PEM fuel-cell propulsion enables droplet formation over a wide range of atmospheric conditions. The results further highlight the growing relevance of the homogeneous freezing limit, which becomes the dominant constraint for hydrogen-based propulsion systems. Additional experimental studies and flight measurements could help refine and further strengthen confidence in this limit [35].
3. Condensation
3.1. Thermodynamic Formulation
Schmidt (1941) [3] already suggested removing water from the exhaust by condensation, but considered it impractical due to the mass and drag of the required heat exchangers. For gas turbines, condensation concepts were later examined by Taylor et al. (2015) [16] and Kaiser et al. (2022) [17].
Condensation can be incorporated into the SAT by introducing a modified mixing-line slope , as follows:
where denotes the fraction of product water that is condensed. The enthalpy difference is approximated by the latent heat of vaporization at standard conditions, . This simplification is justified as the lower heating value is several orders of magnitude larger than , rendering the temperature-dependent variation of the latter negligible. Here, and denote gaseous and liquid water, respectively, while is the plume temperature and the outlet temperature at which liquid water leaves the control volume.
Equation (3) shows that condensation has two effects: (1) removal of water and (2) addition of latent heat to the exhaust (see also Figure 1a, system boundary C). Next, Equation (3) can be rearranged as:
where g is the ratio of mixing-line slopes and is the ratio of enthalpy of evaporation to reaction heat transfered to the plume. The ratio occurs also for condensation in the plume [5].
To ensure contrail avoidance, a mixing-line slope can be targeted such that it is tangential to the saturation curve , as indicated in Figure 1b. Since contrail formation generally requires some supersaturation [4], a less conservative criterion may also be considered. Applying Equation (4), this approach first determines the required condensation fraction ; second, the necessary vapor pressure at the condenser outlet, ; and finally, the required condenser temperature, , which depends on condenser performance and where denotes the saturation temperature.
3.2. System Architecture and Control Logic
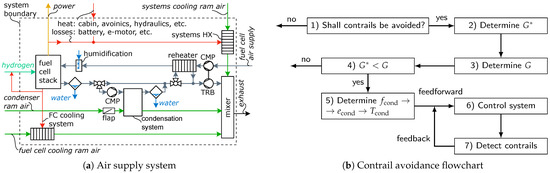
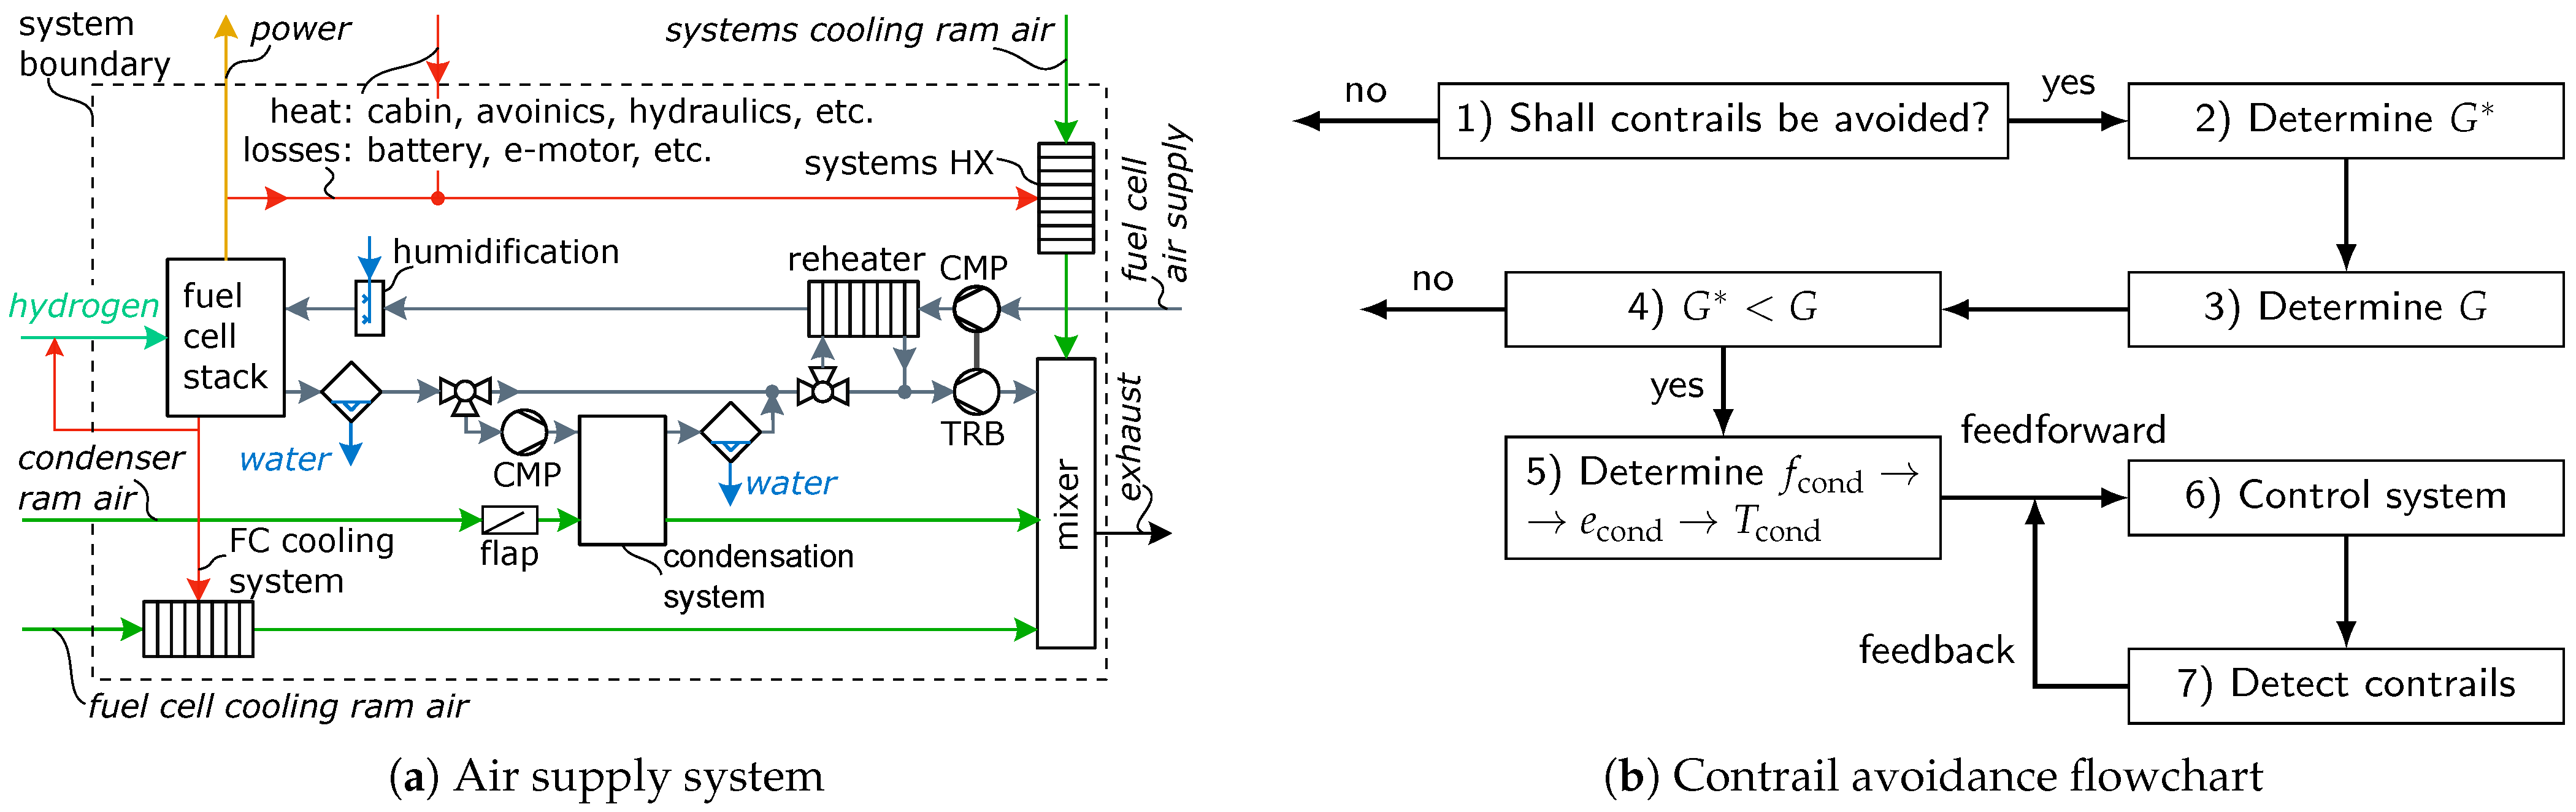
Figure 2b outlines the resulting design and control logic. The controller aims to maintain the effective slope below a critical value by adjusting (1) cooling air mass flow via a flap or (2) condenser pressure via a variable-speed compressor (CMP), see Figure 2a. Ideally, the controller would have access to ambient conditions (pressure, temperature and humidity) and the overall propulsive efficiency. In practice, however, the high visual detectability of contrails can compensate for missing information.
Figure 2.
(a) Air supply architecture where components use upright text and mass/energy flows use italic text, with colors indicating fuel cell air supply (grey), cooling air (green), liquid water (blue), hydrogen (teal), heat (red), and electric power (orange); the system boundary (dashed) is equivalent to system boundary C in Figure 1a; (b) contrail avoidance flowchart.
Figure 2a shows a potential air supply system for LT-PEM fuel cells enabling contrail avoidance by (1) partial condensation of water vapor in the fuel-cell exhaust, optionally above stack pressure, followed by (2) mixing the remaining moist exhaust with dry cooling air. The mixing can be achieved by a dedicated system or in the propeller wake. Schmidt (1941) [3] already stressed the importance of appropriate mixing of the exhaust with cooling air, suggesting that additional waste heat—such as that from electric motors, power electronics, or gearboxes—could be beneficially directed into the plume.
Furthermore, Figure 2a illustrates potential enhancements enabled by integrated water management. The cooled condenser outlet can be routed through a reheater to lower the compressor discharge temperature while increasing turbine (TRB) inlet temperature, potentially eliminating a dedicated air-supply cooler. The recovered liquid water may also serve as humidification at the cathode inlet, avoiding separate humidifiers, provided fuel cell purity requirements are satisfied [36]. The condensed water can be stored in a tank and used for evaporative cooling under high cooling demands or emergencies. To prevent icing in the condenser for low ambient temperatures, a liquid cooling loop can be used for heat transfer in the condensation system.
3.3. Analysis of Condensation Requirements
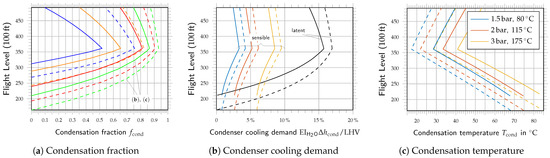
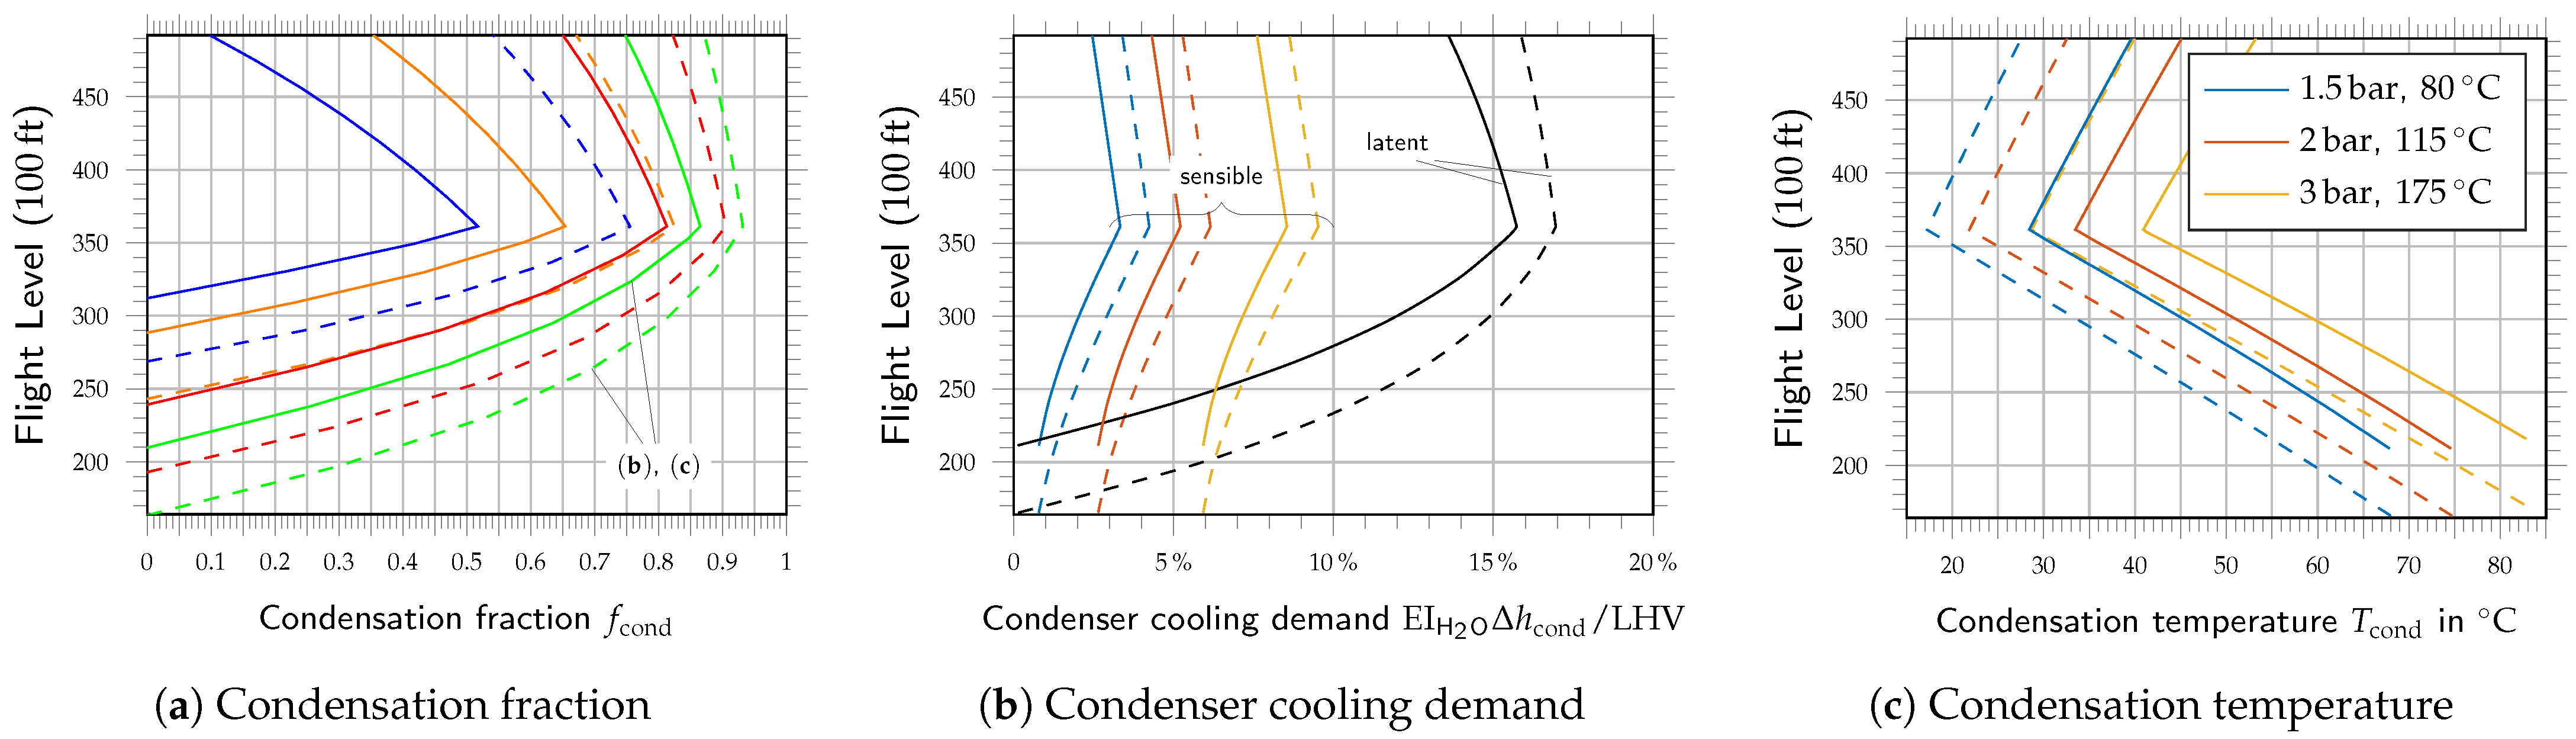
Figure 3 shows condensation fraction , condensation temperature and relative condensation cooling demand depending on the flight level, . The results assume ISA ambient temperature, , with ambient humidity at 100% (solid lines) and 100% (dashed lines).
Figure 3.
(a) Condensation fraction (colors as in Figure 1); fuel cell results match hydrogen combustion for identical plume heat fraction , regardless of exhaust temperature or equivalence ratio, assuming effective mixing; (b) relative condensation cooling demand ; (c) condensation temperature ; (b,c) LT-PEM fuel cell, plume heat fraction (efficiency ), equivalence ratio of 0.5 (air surplus of 2); colors indicate condenser inlet conditions (see legend in (c); (a–c) results vary by flight level, , at ambient temperature and ambient humidity 100% (solid) and 100% (dashed).
Figure 3a shows the required condensation fraction for different propulsion systems, using the color scheme from Figure 1. Notably, LT-PEM fuel cell results are implicitly represented by the hydrogen combustion curves; regardless of the exhaust temperature and equivalence ratio these are directly applicable under equivalent plume heat fractions, , assuming effective mixing between exhaust and cooling air. As shown, the condensation fraction increases with (1) higher overall propulsive efficiency, (2) the use of hydrogen fuel, (3) altitude up to the tropopause (11,000 m), and (4) higher ambient humidity.
The total heat rejected in the condenser comprises latent and sensible heat. The latent heat contribution, calculated based on a reference state of 25 °C, scales linearly with the condensation fraction as . Sensible heat removal is additionally required to reach the condensation temperature and satisfy the reference state. For complete condensation (), the latent heat fraction is 18.2% for hydrogen and 7.1% for kerosene. Consequently, the latent cooling demand can be derived from Figure 3a by scaling the shown condensation fraction values, , by the respective latent heat fractions, .
Figure 3b,c show the condensation in LT-PEM fuel cell exhaust. They consider hydrogen fuel, a plume heat fraction of 50% (efficiency ), and an equivalence ratio of 0.5 (air surplus of 2), consistent with the green curves in Figure 3a. The colors in Figure 3b,c represent different inlet pressure-temperature pairs: 1.5 bar, 80 °C; 2 bar, 115 °C; 3 bar, 175 °C, see legend in Figure 3c. The inlet temperatures result from compression starting from 1.5 bar and 80 °C, assuming an isentropic efficiency of 80%.
In Figure 3b, the black lines represent the latent cooling demand, which remains independent of condensation pressure. The colored lines show the additional sensible cooling required to enable condensation. This sensible cooling demand increases with higher condenser inlet temperatures, reaching up to 9.5% in the most demanding case. While high-pressure condensation offers better density and temperature margins, it introduces additional sensible cooling requirements and compression losses. Furthermore, the sensible demand is sensitive to the air surplus; an increased equivalence ratio reduces the cooling requirement, and vice versa.
Figure 3c shows the required condenser outlet temperature , assuming ideal condensation. The required condenser outlet temperature decreases as condensation fraction increases and rises with higher inlet pressures. The most restrictive case (11,000 m, 100% , 1.5 bar, 80 °C) requires a condenser outlet temperature of 17.2 °C assuming ideal condensation. Even if non-ideal condensation requires lower temperatures, e.g., 10 °C, the risk of icing remains small. However, the small temperature margin to ambient conditions may pose a design challenge.
Condensation is particularly effective for LT-PEM fuel cells because fuel cells are already heavily cooled, drastically reducing sensible cooling demand. In contrast, gas turbines operate at far higher exhaust temperatures, necessitating the removal of substantial sensible heat. While exact values depend on the low pressure turbine outlet temperature, the sensible cooling demand for gas turbines is in the order of fuel cell cooling, that is, roughly 50% with respect to the lower heating value . For this reason, the total condenser cooling demand increases from 10–20% with respect to the lower heating value for fuel cells to 60–70% for hydrogen combustion and 55–60% for kerosene, assuming a plume heat fraction 50% (overall propulsive efficiency 50%). Lower overall propulsive efficiencies would further increase these requirements. Nevertheless, concepts like the Water-Enhanced Turbofan (WET) [17] integrate cooling, condensation and water separation in gas turbines, and may enable prevention of contrails for gas turbine architectures.
4. Conclusions
Contrail formation remains a major environmental challenge for future aviation, particularly for LT-PEM fuel cell propulsion. Owing to its (1) high efficiency, (2) hydrogen as fuel, and (3) external cooling, LT-PEM fuel cell propulsion exhibit a strongest inherent tendency to satisfy the Schmidt–Appleman criterion across wide portions of the flight envelope.
First, their contrail propensity can be greatly reduced by appropriate mixing of the fuel cell exhaust and the fuel cell cooling air, analogous to core–bypass mixing in a conventional turbofan engine. Second, further reducing the mixing-line slope G through controlled exhaust-water condensation offers an effective mitigation route, but introduces the trade-off of contrail suppression vs. system complexity and weight. Despite the Merendith effect it can be assumed that condensation creates drag. However, contrail avoidance is predominantly required when flying through ISSRs, which can reduce the overall drag impact relative to continuous condensation along the flight path.
Preliminary system estimates for LT-PEM fuel cell propulsion indicate that condensing roughly 50% of the product water at flight level up to 90% at flight level is sufficient to prevent saturation. The condensation is associated with a cooling demand increase of about 10% to 20% with respect to the lower heating value . While kerosene combustion requires less condensation, it can be expected that the higher exhaust temperatures yield a 3–5 times higher cooling demand compared to fuel cells, which benefit from already being heavily cooled.
The paper underscores the importance of the homogeneous freezing temperature as a critical constraint for contrail formation in the case of hydrogen propulsion, highlighting that experimental studies and flight tests could help strengthen confidence in this limit. The homogeneous freezing limit corresponds to an altitude constraint of roughly 8000 m to 8500 m (flight level to ). While regional aircraft commonly fly at lower altitudes, contrail prevention for hydrogen-powered short- and medium-range aircraft becomes increasingly important.
Further work could include overall aircraft design feasibility, experimental validation under realistic cruise conditions, optimization of condenser and heat-exchanger architectures in terms of drag, and a quantitative assessment of the net climate benefit of full contrail avoidance. Successfully avoiding contrails could, however, provide a substantial climate benefit for future propulsion systems.
Author Contributions
Conceptualization, R.G.; methodology, R.G.; software, R.G.; validation, R.G.; formal analysis, R.G.; investigation, R.G.; resources, R.G.; data curation, R.G.; writing—original draft preparation, R.G.; writing—review and editing, R.G.; visualization, R.G.; supervision, F.L.J.v.d.L.; project administration, F.L.J.v.d.L.; funding acquisition, F.L.J.v.d.L. All authors have read and agreed to the published version of the manuscript.
Funding
This work was carried out as part of the European project TheMa4HERA. The project is supported by the Clean Aviation Joint Undertaking and its members, and was funded by the European Union under grant agreement no. 101102008.
Institutional Review Board Statement
Not applicable.
Informed Consent Statement
Not applicable.
Data Availability Statement
Data belongs to the TheMa4HERA project under grant agreement no. 101102008 and cannot be shared without the explicit consent of the consortium.
Conflicts of Interest
The authors declare no conflicts of interest.
References
- Lee, D.S.; Fahey, D.W.; Forster, P.M.; Newton, P.J.; Wit, R.C.; Lim, L.L.; Owen, B.; Sausen, R. Aviation and global climate change in the 21st century. Atmos. Environ. 2009, 43, 3520–3537. [Google Scholar] [CrossRef] [Scilit]
- Lee, D.; Fahey, D.; Skowron, A.; Allen, M.; Burkhardt, U.; Chen, Q.; Doherty, S.; Freeman, S.; Forster, P.; Fuglestvedt, J.; et al. The contribution of global aviation to anthropogenic climate forcing for 2000 to 2018. Atmos. Environ. 2021, 244, 117834. [Google Scholar] [CrossRef] [Scilit]
- Schmidt, E. Die Entstehung von Eisnebel aus den Auspuffgasen von Flugmotoren; Verlag R. Oldenbourg: München, Germany, 1941; Available online: https://elib.dlr.de/107948/ (accessed on 4 May 2025).
- Appleman, H. The Formation of Exhaust Condensation Trails by Jet Aircraft. Bull. Am. Meteorol. Soc. 1953, 34, 14–20. [Google Scholar] [CrossRef] [Scilit]
- Schumann, U. On conditions for contrail formation from aircraft exhausts. Meteorol. Z. 1996, 5, 4–23. [Google Scholar] [CrossRef] [Scilit]
- Richardson, E.S. Contrail Formation Criterion for Assessment of Alternative Propulsion Technologies. J. Propuls. Power 2025, 41, 264–276. [Google Scholar] [CrossRef] [Scilit]
- Gierens, K. Theory of Contrail Formation for Fuel Cells. Aerospace 2021, 8, 164. [Google Scholar] [CrossRef] [Scilit]
- Gierens, K.M.; Lim, L.; Eleftheratos, K. A review of various strategies for contrail avoidance. Open Atmos. Sci. J. 2008, 2, 1–7. [Google Scholar] [CrossRef] [Scilit]
- Noppel, F.; Singh, R. Overview on contrail and cirrus cloud avoidance technology. J. Aircr. 2007, 44, 1721–1726. [Google Scholar] [CrossRef] [Scilit]
- Lee, M.; Denniss, A.; Stuttard, M.; Agnew, M. Contrail Suppression. EP4418237A1, 21 August 2024. [Google Scholar]
- Swann, P.; Fletcher, P.; Pellegrini, A.; Kulathasan, A. Aircraft Electrically-Assisted Propulsion Control System. US10435165B2, 8 October 2019. [Google Scholar]
- Haglind, F. Potential of lowering the contrail formation of aircraft exhausts by engine re-design. Aerosp. Sci. Technol. 2008, 12, 490–497. [Google Scholar] [CrossRef] [Scilit]
- Williams, V.; Noland, R.B.; Toumi, R. Air transport cruise altitude restrictions to minimize contrail formation. Clim. Policy 2003, 3, 207–219. [Google Scholar] [CrossRef] [Scilit]
- Gierens, K. Are fuel additives a viable contrail mitigation option? Atmos. Environ. 2007, 41, 4548–4552. [Google Scholar] [CrossRef] [Scilit]
- Wittmann, T. Energy Conversion Arrangement and Aircraft Comprising Same. EP4574678A1, 25 June 2025. [Google Scholar]
- Taylor, M.D.; Noppel, F.G.; Singh, R. A Gas Turbine Engine. EP1852590B1, 30 September 2015. [Google Scholar]
- Kaiser, S.; Schmitz, O.; Ziegler, P.; Klingels, H. The Water-Enhanced Turbofan as Enabler for Climate-Neutral Aviation. Appl. Sci. 2022, 12, 12431. [Google Scholar] [CrossRef] [Scilit]
- Wittmann, T. Contrails and Contrail Mitigation for Fuel Cell Aircraft. Presented at Deutscher Luft- und Raumfahrtkongress (DLRK), Augsburg, Germany, 23–25 September 2025. [Google Scholar]
- Pruppacher, H.R.; Klett, J.D. Microphysics of Clouds and Precipitation; Springer: Dordrecht, Netherlands, 2010. [Google Scholar] [CrossRef] [Scilit]
- Wölk, J.; Strey, R.; Heath, C.H.; Wyslouzil, B.E. Empirical function for homogeneous water nucleation rates. J. Chem. Phys. 2002, 117, 4954–4960. [Google Scholar] [CrossRef] [Scilit]
- Kärcher, B.; Burkhardt, U.; Bier, A.; Bock, L.; Ford, I.J. The microphysical pathway to contrail formation. J. Geophys. Res. Atmos. 2015, 120, 7893–7927. [Google Scholar] [CrossRef] [Scilit]
- Seinfeld, J.H.; Pandis, S.N. Atmospheric Chemistry and Physics: From Air Pollution to Climate Change; John Wiley & Sons: Hoboken, NJ, USA, 2016. [Google Scholar]
- Märkl, R.S.; Voigt, C.; Sauer, D.; Dischl, R.K.; Kaufmann, S.; Harlaß, T.; Hahn, V.; Roiger, A.; Weiß-Rehm, C.; Burkhardt, U.; et al. Powering aircraft with 100% sustainable aviation fuel reduces ice crystals in contrails. Atmos. Chem. Phys. 2024, 24, 3813–3837. [Google Scholar] [CrossRef] [Scilit]
- Voigt, C.; Märkl, R.; Sauer, D.; Dischl, R.; Renard, C.; Seeliger, K.; Yu, F.; Kaufmann, S.; Bräuer, T.; Jurkat-Witschas, T.; et al. Substantial aircraft contrail formation at low soot emission levels. Nature 2026, 652, 112–118. [Google Scholar] [CrossRef] [Scilit]
- Murphy, D.M.; Koop, T. Review of the vapour pressures of ice and supercooled water for atmospheric applications. Q. J. R. Meteorol. Soc. 2005, 131, 1539–1565. [Google Scholar] [CrossRef] [Scilit]
- Bacer, S.; Sullivan, S.C.; Karydis, V.A.; Barahona, D.; Krämer, M.; Nenes, A.; Tost, H.; Tsimpidi, A.P.; Lelieveld, J.; Pozzer, A. Implementation of a comprehensive ice crystal formation parameterization for cirrus and mixed-phase clouds in the EMAC model (based on MESSy 2.53). Geosci. Model Dev. 2018, 11, 4021–4041. [Google Scholar] [CrossRef] [Scilit]
- Petzold, A.; Neis, P.; Rütimann, M.; Rohs, S.; Berkes, F.; Smit, H.G.J.; Krämer, M.; Spelten, N.; Spichtinger, P.; Nédélec, P.; et al. Ice-supersaturated air masses in the northern mid-latitudes from regular in situ observations by passenger aircraft: Vertical distribution, seasonality and tropospheric fingerprint. Atmos. Chem. Phys. 2020, 20, 8157–8179. [Google Scholar] [CrossRef] [Scilit]
- Irvine, E.A.; Shine, K.P. Ice supersaturation and the potential for contrail formation in a changing climate. Earth Syst. Dyn. 2015, 6, 555–568. [Google Scholar] [CrossRef] [Scilit]
- Stuber, N.; Forster, P.; Rädel, G.; Shine, K. The importance of the diurnal and annual cycle of air traffic for contrail radiative forcing. Nature 2006, 441, 864–867. [Google Scholar] [CrossRef] [Scilit]
- Meerkötter, R.; Schumann, U.; Doelling, D.R.; Minnis, P.; Nakajima, T.; Tsushima, Y. Radiative forcing by contrails. Ann. Geophys. 1999, 17, 1080–1094. [Google Scholar] [CrossRef]
- Myhre, G.; Stordal, F. On the tradeoff of the solar and thermal infrared radiative impact of contrails. Geophys. Res. Lett. 2001, 28, 3119–3122. [Google Scholar] [CrossRef] [Scilit]
- Singh, D.K.; Sanyal, S.; Wuebbles, D.J. Understanding the role of contrails and contrail cirrus in climate change: A global perspective. Atmos. Chem. Phys. 2024, 24, 9219–9262. [Google Scholar] [CrossRef] [Scilit]
- Mollier, R. Ein neues Diagramm fuer Dampf-luft-gemische. Z. VDI 1923, 67, 869–872. [Google Scholar]
- Wittmann, T. Energy Conversion Arrangement, Energy System and Aircraft Comprising Same. EP4574670A1, 25 June 2025. [Google Scholar]
- Airbus UpNext; German Aerospace Center (DLR). Blue Condor: Hydrogen-Powered Contrail Characterization Campaign; Airbus: Toulouse, France, 2023; Available online: https://www.airbus.com/en/newsroom/stories/2023-11-contrail-chasing-blue-condor-makes-airbus-first-full-hydrogen-powered (accessed on 5 June 2025).
- Hwang, S.H.; Kim, M.S. An experimental study on the cathode humidification and evaporative cooling of polymer electrolyte membrane fuel cells using direct water injection method at high current densities. Appl. Therm. Eng. 2016, 99, 635–644. [Google Scholar] [CrossRef] [Scilit]
Disclaimer/Publisher’s Note: The statements, opinions and data contained in all publications are solely those of the individual author(s) and contributor(s) and not of MDPI and/or the editor(s). MDPI and/or the editor(s) disclaim responsibility for any injury to people or property resulting from any ideas, methods, instructions or products referred to in the content. |
© 2026 by the authors. Licensee MDPI, Basel, Switzerland. This article is an open access article distributed under the terms and conditions of the Creative Commons Attribution (CC BY) license.