


Abstract
Stock price prediction remains a prominent area of interest among investors due to its potential impact on financial decision making. We developed a deep learning-based system for stock market analysis, forecasting, and automated trading. Utilizing historical financial data, technical indicators, and sentiment information, long short-term memory (LSTM) networks were employed to model and predict stock price movements. The predicted outcomes were integrated into a rule-based automated trading system to simulate real-time buy and sell decisions. Experimental evaluations conducted on the Taiwan Stock Exchange (TWSE) indicate that the developed model surpasses baseline models in both prediction accuracy and trading profitability. The system presents the capability of deep learning to improve forecasting precision and facilitate intelligent, automated trading strategies within contemporary financial markets.
1. Introduction
In financial investment, decision making is often influenced by external factors such as market sentiment, breaking news, and economic policies. These rapidly changing variables cause significant volatility in investor behavior, frequently causing strategies to change based on emotion rather than data-driven insight. Moreover, the authenticity and timeliness of such external information are not always guaranteed, posing a substantial risk of misinformation that may result in irreparable financial losses [1,2,3].
This research aims to address these challenges by developing a system that leverages automated technologies for stock market analysis, forecasting, and trading, and provide investors with robust and objective tools that mitigate the impact of human emotion and enhance the efficiency of investment decisions. To achieve this, we used the data from the Taiwan Stock Market, a dynamic and significant Asian financial hub [4].
We employed web scraping techniques to automatically acquire relevant data of selected investment targets within the Taiwan Stock Market. We also implemented automated data processing and calculated technical indicators derived from the data. A deep learning model was used for the predictive analysis of stock price movements. The results deliver a reliable auxiliary decision-making tool and an automated trading program.
This article is structured as follows. Section 1 provides an introduction to the study. Section 2 reviews related work in the field. Section 3 outlines the proposed research methodology. Section 4 details the experimental design and implementation. Section 5 presents the results and offers a comprehensive discussion. Finally, Section 6 concludes the paper and suggests directions for future research.
2. Related Work
2.1. Stock Analysis
Over the past decade, stock market forecasting and algorithmic trading have become prominent areas of research. Scholars have explored a wide range of analytical approaches, evolving from traditional statistical models to more advanced machine learning and deep learning techniques [5,6].
Traditional methods, such as autoregressive integrated moving average (ARIMA) and linear regression, have long been utilized for time series forecasting [7]. These models are well suited for capturing linear trends and short-term dependencies. However, they often struggle with the nonlinear, chaotic behavior that is characteristic of financial markets. To address these limitations, machine learning approaches such as support vector machines (SVM), random forests, and gradient boosting have been introduced [8,9,10]. These models capture complex nonlinear relationships among financial indicators with improved predictive accuracy. Despite their advantages, they still rely on manually crafted features and may fall short in modeling long-range temporal dependencies, which are critical for time series prediction.
In contrast, deep learning is a transformative technology in financial prediction. Recurrent neural networks (RNNs), and particularly long short-term memory (LSTM) networks, are capable of learning hierarchical and temporal representations directly from raw sequential data [11,12]. LSTM models, by their designs, are highly effective in capturing long-term dependencies and mitigating issues, including vanishing gradients that hamper traditional RNNs. As a result, LSTM-based models significantly outperform traditional statistical and machine learning techniques in forecasting stock price trends, volatility, and market behavior. The evolution of these methods is summarized in Table 1.
Table 1.
Evolution of stock analysis methods.
2.2. Deep Learning for Stock Prediction
LSTM-based models have become a cornerstone of stock price prediction, as they were designed to overcome the vanishing gradient problem in standard RNNs to retain long-term dependencies and capture sequential patterns more effectively. Fischer and Krauss applied LSTM to predict directional movements of the S&P 500 stocks [13]. Their model, trained on historical closing prices and technical indicators, outperformed logistic regression and random forest classifiers, highlighting the superior temporal modeling capabilities of LSTM networks.
Beyond standard LSTM, gated recurrent units (GRU) are used with similar performance with fewer parameters, leading to faster training times [14]. Hybrid architectures combining LSTM with convolutional neural networks (CNNs) have also gained traction [15,16]. In the models, CNNs extract local spatial features from multivariate input data (e.g., prices, volume, indicators), which are fed into LSTM layers to model the temporal dependencies. This fusion has shown improvements in predictive accuracy, as CNNs denoise the input and highlight important patterns.
Another important development is the introduction of attention mechanisms and Transformers, which have revolutionized natural language processing and are now being applied to financial time series. Different from RNNs, Transformers process entire sequences in parallel and attend to any part of the sequence, making them efficient and potentially more accurate. The temporal fusion transformer (TFT), for example, has been used for multivariate time series forecasting and demonstrated robust performance in both short-term and long-term stock predictions [17].
Additionally, the incorporation of sentiment analysis into deep learning forecasting models has become promising. News headlines, financial reports, and social media data are processed using natural language processing (NLP) models, such as BERT or LSTM-based sentiment classifiers [18,19]. These sentiment scores are then integrated as additional features into forecasting models, enabling them to react to market-moving events and public perception.
Despite these advancements, challenges remain. Financial time series are often affected by external factors like political events, regulatory changes, and global crises, which are difficult to model solely through historical price data. Furthermore, overfitting is a common issue due to the high dimensionality and noise in stock data. To mitigate this, regularization techniques, dropout layers, and careful validation using walk-forward or cross-validation methods are applied.
In summary, deep learning has significantly enhanced the ability to forecast stock prices by leveraging architectures that model non-linearity and long-term dependencies. Ongoing research continues to refine these models by integrating multiple data sources, optimizing network architectures, and improving training methodologies for more robust and reliable market predictions.
2.3. Automated Trading with Deep Learning
Automated trading, also known as algorithmic trading, involves using computer algorithms to execute buy or sell orders based on predefined strategies [20]. With deep learning, these strategies have evolved from rule-based systems to data-driven models capable of learning complex patterns from historical and real-time market data. Deep learning has enabled trading systems to make more adaptive and informed decisions, reducing human bias and increasing execution speed and efficiency.
One of the most significant advances in this area is the application of deep reinforcement learning (DRL) [21,22]. While supervised learning earns from labeled data, DRL agents learn by interacting with the environment and receiving rewards or penalties based on their actions. This approach is particularly well-suited for financial markets, where the goal is to maximize cumulative returns over time. DRL algorithms have been applied to trading tasks. Deep Q-Networks (DQN) learn value-based policies to decide the best action (buy, sell, hold) given a market state [23]. Policy gradient methods, such as proximal policy optimization (PPO) and advantage actor-critic (A2C), optimize decision making by directly adjusting the policy based on performance [24,25]. These models continuously adapt their strategies in response to new market conditions, improving robustness in dynamic environments.
Deng et al. demonstrated the effectiveness of DRL in portfolio management, where a deep learning agent allocates assets dynamically to maximize returns and manage risk [26]. DRL learns complex strategies that outperform traditional models and static allocation methods. To build such systems, deep learning models process a wide range of inputs, including historical price data, technical indicators, and even textual sentiment from financial news or social media. Multimodal deep learning architectures combine these heterogeneous data sources to create richer representations of the market state. These systems often use reward functions tailored to financial goals, such as maximizing profit, minimizing drawdown, or optimizing the Sharpe ratio.
Despite their advantages, DRL-based trading systems face several challenges. Market environments are noisy, non-stationary, and partially observable, making it difficult for agents to generalize across different market regimes. Moreover, overfitting to historical data and a lack of interpretability limit real-world deployment. As such, robust backtesting, risk management strategies, and regulatory compliance are essential when implementing deep learning-driven automated trading systems.
Deep learning has significantly advanced automated trading, enabling systems that can adapt, learn, and optimize in complex market environments. Continued research in this area promises to further improve the intelligence and reliability of algorithmic trading strategies.
3. Methodology
We employed a deep learning-based automated trading system that integrates web crawling for data collection, rigorous preprocessing for feature engineering, LSTM models for time-series prediction, and a real-time decision-making model for executing and monitoring trades with embedded risk management and performance evaluation mechanisms.
3.1. Web Crawling
The principle of web crawling is to simulate user browsing behavior by automatically sending requests to target websites and retrieving hypertext markup language (HTML) responses [27,28]. Crawlers use parsing libraries (such as Python Beautiful Soup 4.13.0) or regular expressions to extract desired data from the HTML content. After parsing, the data is stored in files or databases for further analysis. These crawlers are designed based on the website structure, uniform resource locator patterns, and webpage elements to efficiently collect large amounts of information.
3.2. Data Preprocessing
Raw data is transformed into a format that models can understand and process effectively. This involves data cleaning (e.g., handling missing and outlier values), feature selection and engineering (selecting features most relevant to the target variable), and standardization or normalization (scaling data to a consistent range or distribution). Through data preprocessing, model accuracy and training efficiency are enhanced while minimizing noise and irrelevant information.
3.3. Principles of LSTM Model
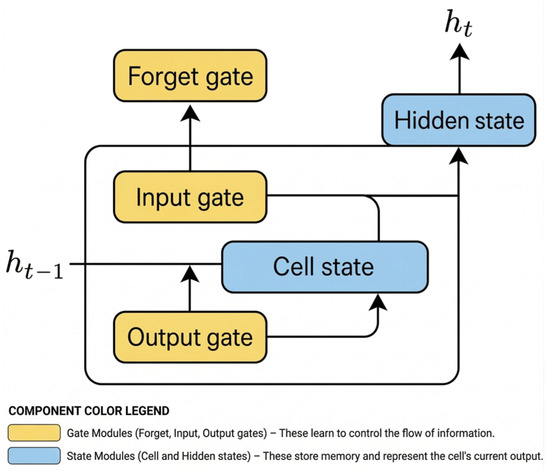
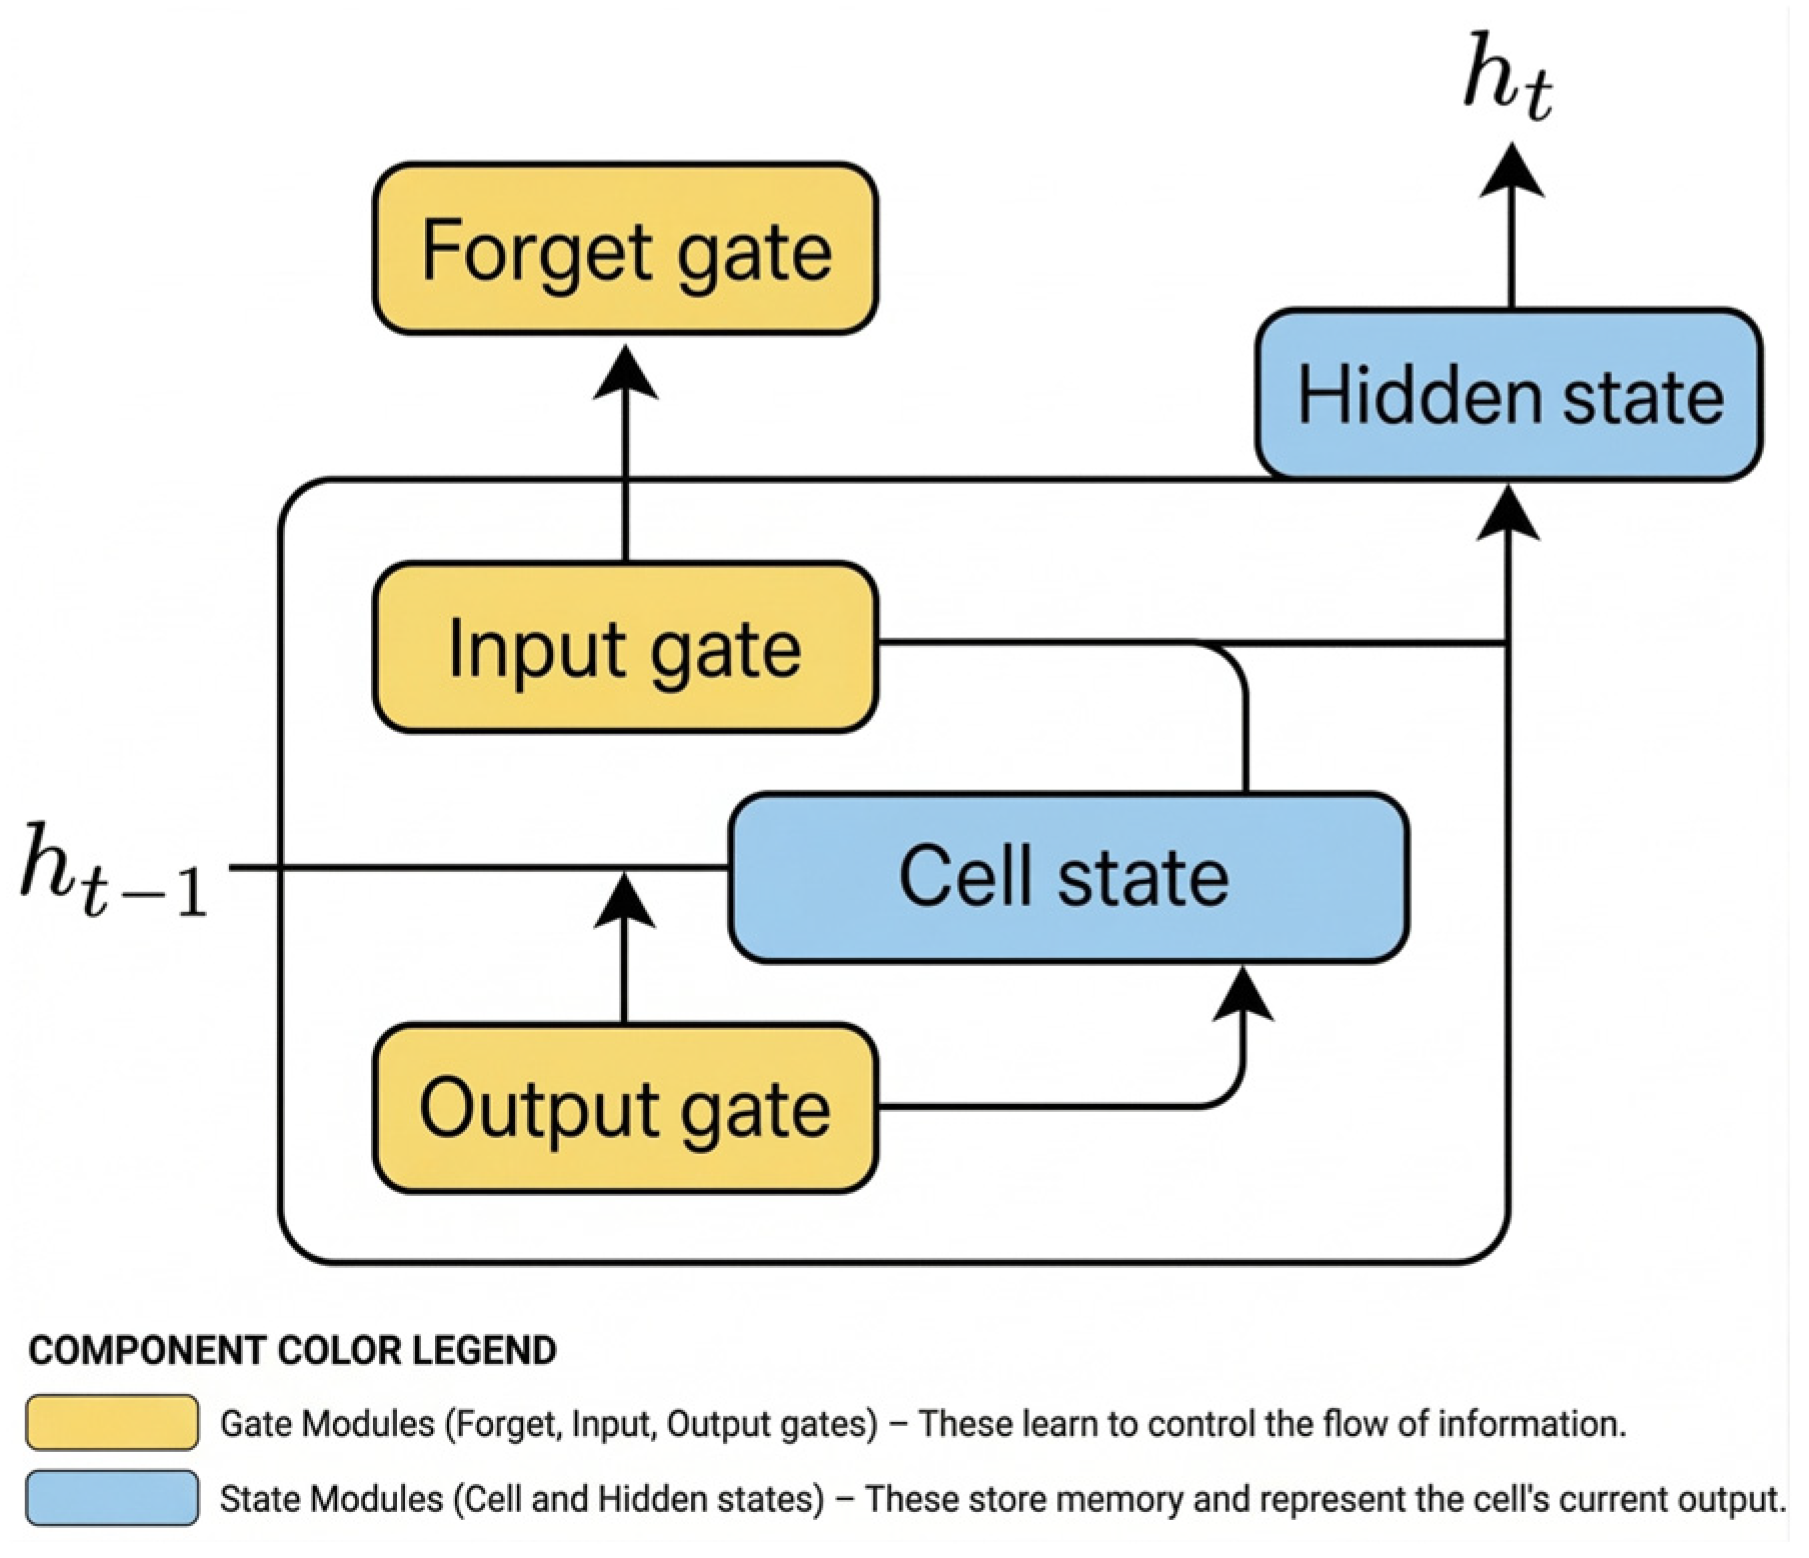
LSTM is designed for handling and predicting time series data, such as stock prices, speech, or language models. LSTM has a unique architecture that selectively retains or forgets information through gate mechanisms [12,13]. The LSTM block consists of three gates and one memory cell, as shown in Figure 1. These gates collaborate to control information flow, enabling LSTM to model long-term dependencies effectively. For instance, in sentiment analysis, LSTM processes each word sequentially and updates its cell and hidden states accordingly to ultimately represent the sentiment of the entire sentence.
Figure 1.
LSTM unit.
- Input gate: Controls which information enters the memory cell.
- Forget gate: Decides which information to discard from the cell state.
- Output gate: Determines the information to output.
- Memory cell: Stores and updates sequential information.
- Hidden state: Contains the short-term memory passed to the next time step.
3.4. Automated Trading System
The automated trading system developed in this study operates through a structured sequence of processes designed to forecast stock trends and execute trades with minimal human intervention. Initially, the system collects historical stock prices and technical indicators from external sources. These data are then used to train predictive models, such as LSTM networks or other machine learning algorithms, to forecast future price movements. To enhance prediction accuracy, technical indicators, including the relative strength index (RSI), moving average convergence divergence (MACD), and Bollinger Bands, are computed. The model learns to identify patterns in price movements based on these features during the training phase.
Once predictions are generated, the system proceeds to strategy decision making, where it determines whether to buy, sell, or hold assets based on anticipated market trends. To manage risk effectively, the system incorporates stop-loss and take-profit mechanisms, which help prevent significant losses and secure profits within predefined thresholds. Upon making a trading decision, the system automatically executes buy or sell orders and logs each transaction with relevant details such as time, price, volume, and profit or loss.
Before deployment, the system undergoes backtesting using historical data to validate its strategies. Performance metrics, including equity curves and drawdown plots, are generated to refine and optimize the trading logic. During live operation, the system continuously monitors real-time market data and dynamically adjusts its strategies in response to market fluctuations, including modifications to risk parameters and trading rules.
The implementation of this system begins with data collection, where historical stock data are extracted using web scraping techniques and the yfinance library, a Python-based tool that facilitates access to Yahoo Finance data. To ensure data integrity, cross-verification is performed to eliminate omissions and errors. The collected data are then processed to compute various technical indicators, such as MA5, MA20, and MA60 moving averages, volatility and momentum indicators, RSI, MACD and signal lines, and the upper and lower bands of Bollinger Bands.
Visualization tools such as Matplotlib 3.10.1 and Seaborn 0.13.2 are employed to graph these indicators alongside stock price movements, providing intuitive insights into market trends. LSTM networks are used to predict future price movements, and the results are visualized to enhance interpretability. The predictions are quantified and integrated into trading strategies for automated execution. Finally, the system is backtested across short-, medium-, and long-term trading scenarios to evaluate its return rates and overall performance.
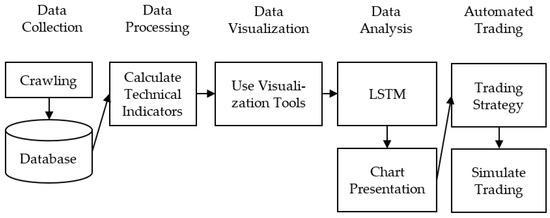
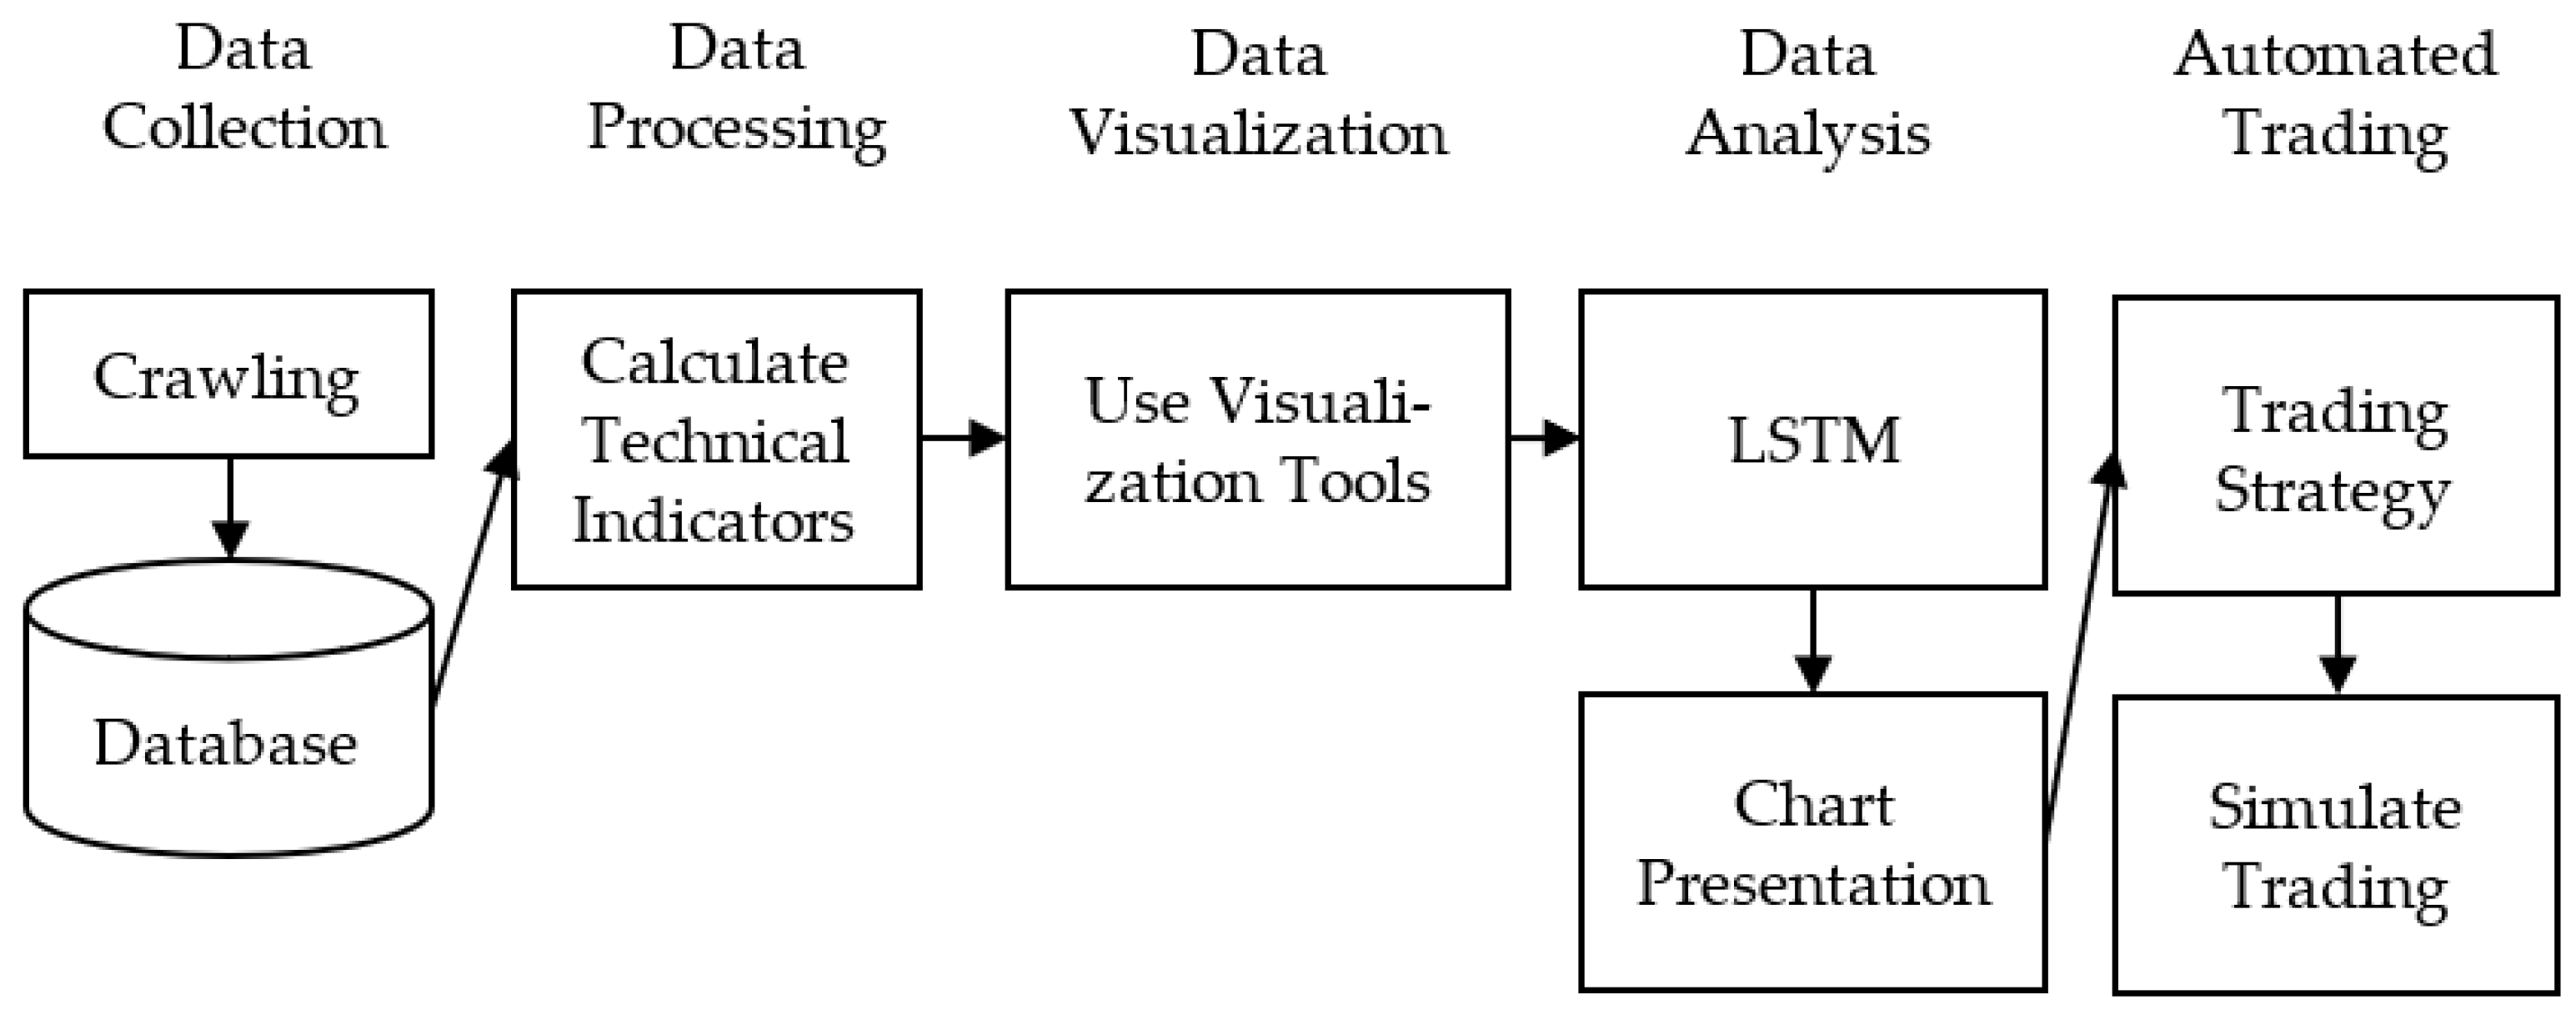
Figure 2 shows the flow where collected investment target data is stored in a database for subsequent processing and analysis. The processed data is visualized and used for training and prediction through machine learning. The model’s results are then quantified and fed into the automated trading program to execute trades.
Figure 2.
System implementation process.
4. Experiment
4.1. Dataset
The dataset was created by extracting relevant historical stock market data for a selection of Taiwan stocks (tickers: 1216, 2002, 2324, 2379, 2382, 2408, 2412, 2454, 2610, 2633, 3037), covering the period from 27 March 2000 to 26 December 2024. This compilation provides an overview of key companies across various sectors in Taiwan’s stock market, as shown in Table 2.
Table 2.
Profiles of selected stocks.
Historical stock price data was collected using web scraping tools such as yfinance, which provided daily trading information, including open, high, low, close prices, volume, and adjusted close for each asset. Once collected, the raw data underwent preprocessing to ensure it was suitable for input into machine learning models.
- Data cleaning: Handle missing values by replacing all NaNs and infinite values (positive or negative) with zero to ensure data integrity. Outliers are managed to reduce their impact on the model, and the clip() method is used on multiple features to trim extreme values.
- Technical indicator calculation: Integrate multiple indicators as input features for the model.
- Normalization: Apply MinMaxScaler to scale the stock price data to a 0–1 range.
- Feature engineering: Includes returns, volatility, RSI, MACD, momentum, moving average trends (MA Trend), Bollinger Bands position, and volume change.
- Feature standardization: All features are standardized or limited to specific ranges. For example, RSI is scaled to 0–1, returns are capped at ±10%, volatility at 0–50%, and momentum at ±20%.
4.2. Prediction Model
LSTM networks are used to train a model for predicting stock price trends. The data preparation includes the following.
- Input structure: A rolling window of 60 consecutive days of technical indicator data as input features are used.
- Output structure: Binary labels (up = 1, down = 0) are generated based on the return over the next 5 days.
Table 3.
Model architecture.
Table 4.
Training parameters.
4.3. Automated Trading Strategy
The automated trading strategy is executed for trades based on model predictions with the following steps.
- 1.
- Market trend judgment: Determine the current market trend using moving averages MA5 and MA20:
- Bull market: MA5 > MA20; system favors opening positions and scaling in due to potential uptrend.
- Bear market: MA5 ≤ MA20; system becomes conservative, limiting position size and entry frequency.
- 2.
- Entry conditions: Execute buy orders when the following conditions are met:
- Prediction value: Model generates a score between 0 and 1; closer to 1 indicates a higher chance of an upward trend.
- Prediction thresholds: Entry threshold is 0.65 (risk control mode) or 0.55 (normal mode). Buy signals are only valid in bullish markets or if risk control conditions are met.
- Position sizing: Position size is calculated based on the prediction value and current price. Under risk control mode, position size is reduced by 30%.
- 3.
- Smart scaling-in strategy: Add to positions when prices decline:
- Price drop + prediction: If the price drops by 5% and the prediction value is above 0.65, the system increases the position. Each scale-in uses the same position size as the original entry, up to four times.
- Scaling conditions: Depends on current holdings, price changes, and prediction confidence to ensure rational scaling.
- 4.
- Stop-loss logic: Automatically exit positions to prevent excessive loss:
- Stop-loss rate: Predefined stop-loss at 7% decline triggers exit.
- Dynamic adjustment: If the prediction value drops below 0.35, the stop-loss threshold is adjusted to reduce risk.
- 5.
- Take-profit logic: Sell positions in stages when profit targets are reached:
- Tiered exit: Targets are set at 30, 25, 20, 15, and 10% gains. Partial exits occur at each level.
- For example, at 30% profit, sell 100% of the position; at 25%, sell 30%, and so on.
- Once all tiers are achieved, the position is marked as “mature” and no further action is taken.
- 6.
- Risk management: Several mechanisms are used to control risk:
- Dynamic stop-loss: Adjusts based on low prediction confidence (e.g., below 0.35).
- Risk control mode: Increases entry threshold to 0.65, limits position size to 70% of the original size, and reduces frequency of scaling-in.
- Position management: Even in bullish scenarios, only up to 80% of funds are allocated to avoid over-concentration.
- 7.
- Trade logging and updates: Every trade (entry, scale-in, stop-loss, take-profit) is recorded, and portfolio status is updated accordingly:
- Log transactions: Record stock code, date, action type, quantity, price, and prediction result.
- Update state: Reflect the latest trade status, including last trade date, number of scale-ins, and maturity state.
- Trade interval check: Ensure a minimum interval between trades to prevent overtrading.
4.4. Backtesting and Evaluation
Backtesting and evaluation are conducted to validate the effectiveness and risk control of the strategy and model through historical data backtesting with the following steps.
- 1.
- Initial setup
- Initial capital: Set at NT$1,000,000 for backtesting purposes.
- Investment targets: Use a diverse set of stocks across different industries to test strategy robustness.
- Simulated trading: Execute simulated trades based on historical data and model predictions to evaluate performance over short, medium, and long terms.
- 2.
- Evaluation metrics
- Total return: Measure the total asset growth during backtesting to assess long-term profitability.
- Max drawdown: Identify the largest decline from peak value to measure risk.
- Sharpe ratio: A key metric for risk-adjusted return, proposed by William Sharpe in 1966, to help compare different investment strategies considering both return and volatility [29].
5. Results and Discussion
Experimental Results
- 1.
- Return performance
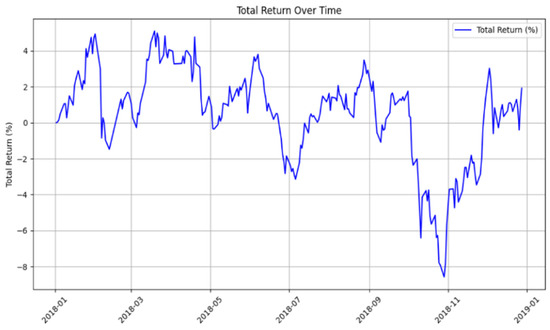
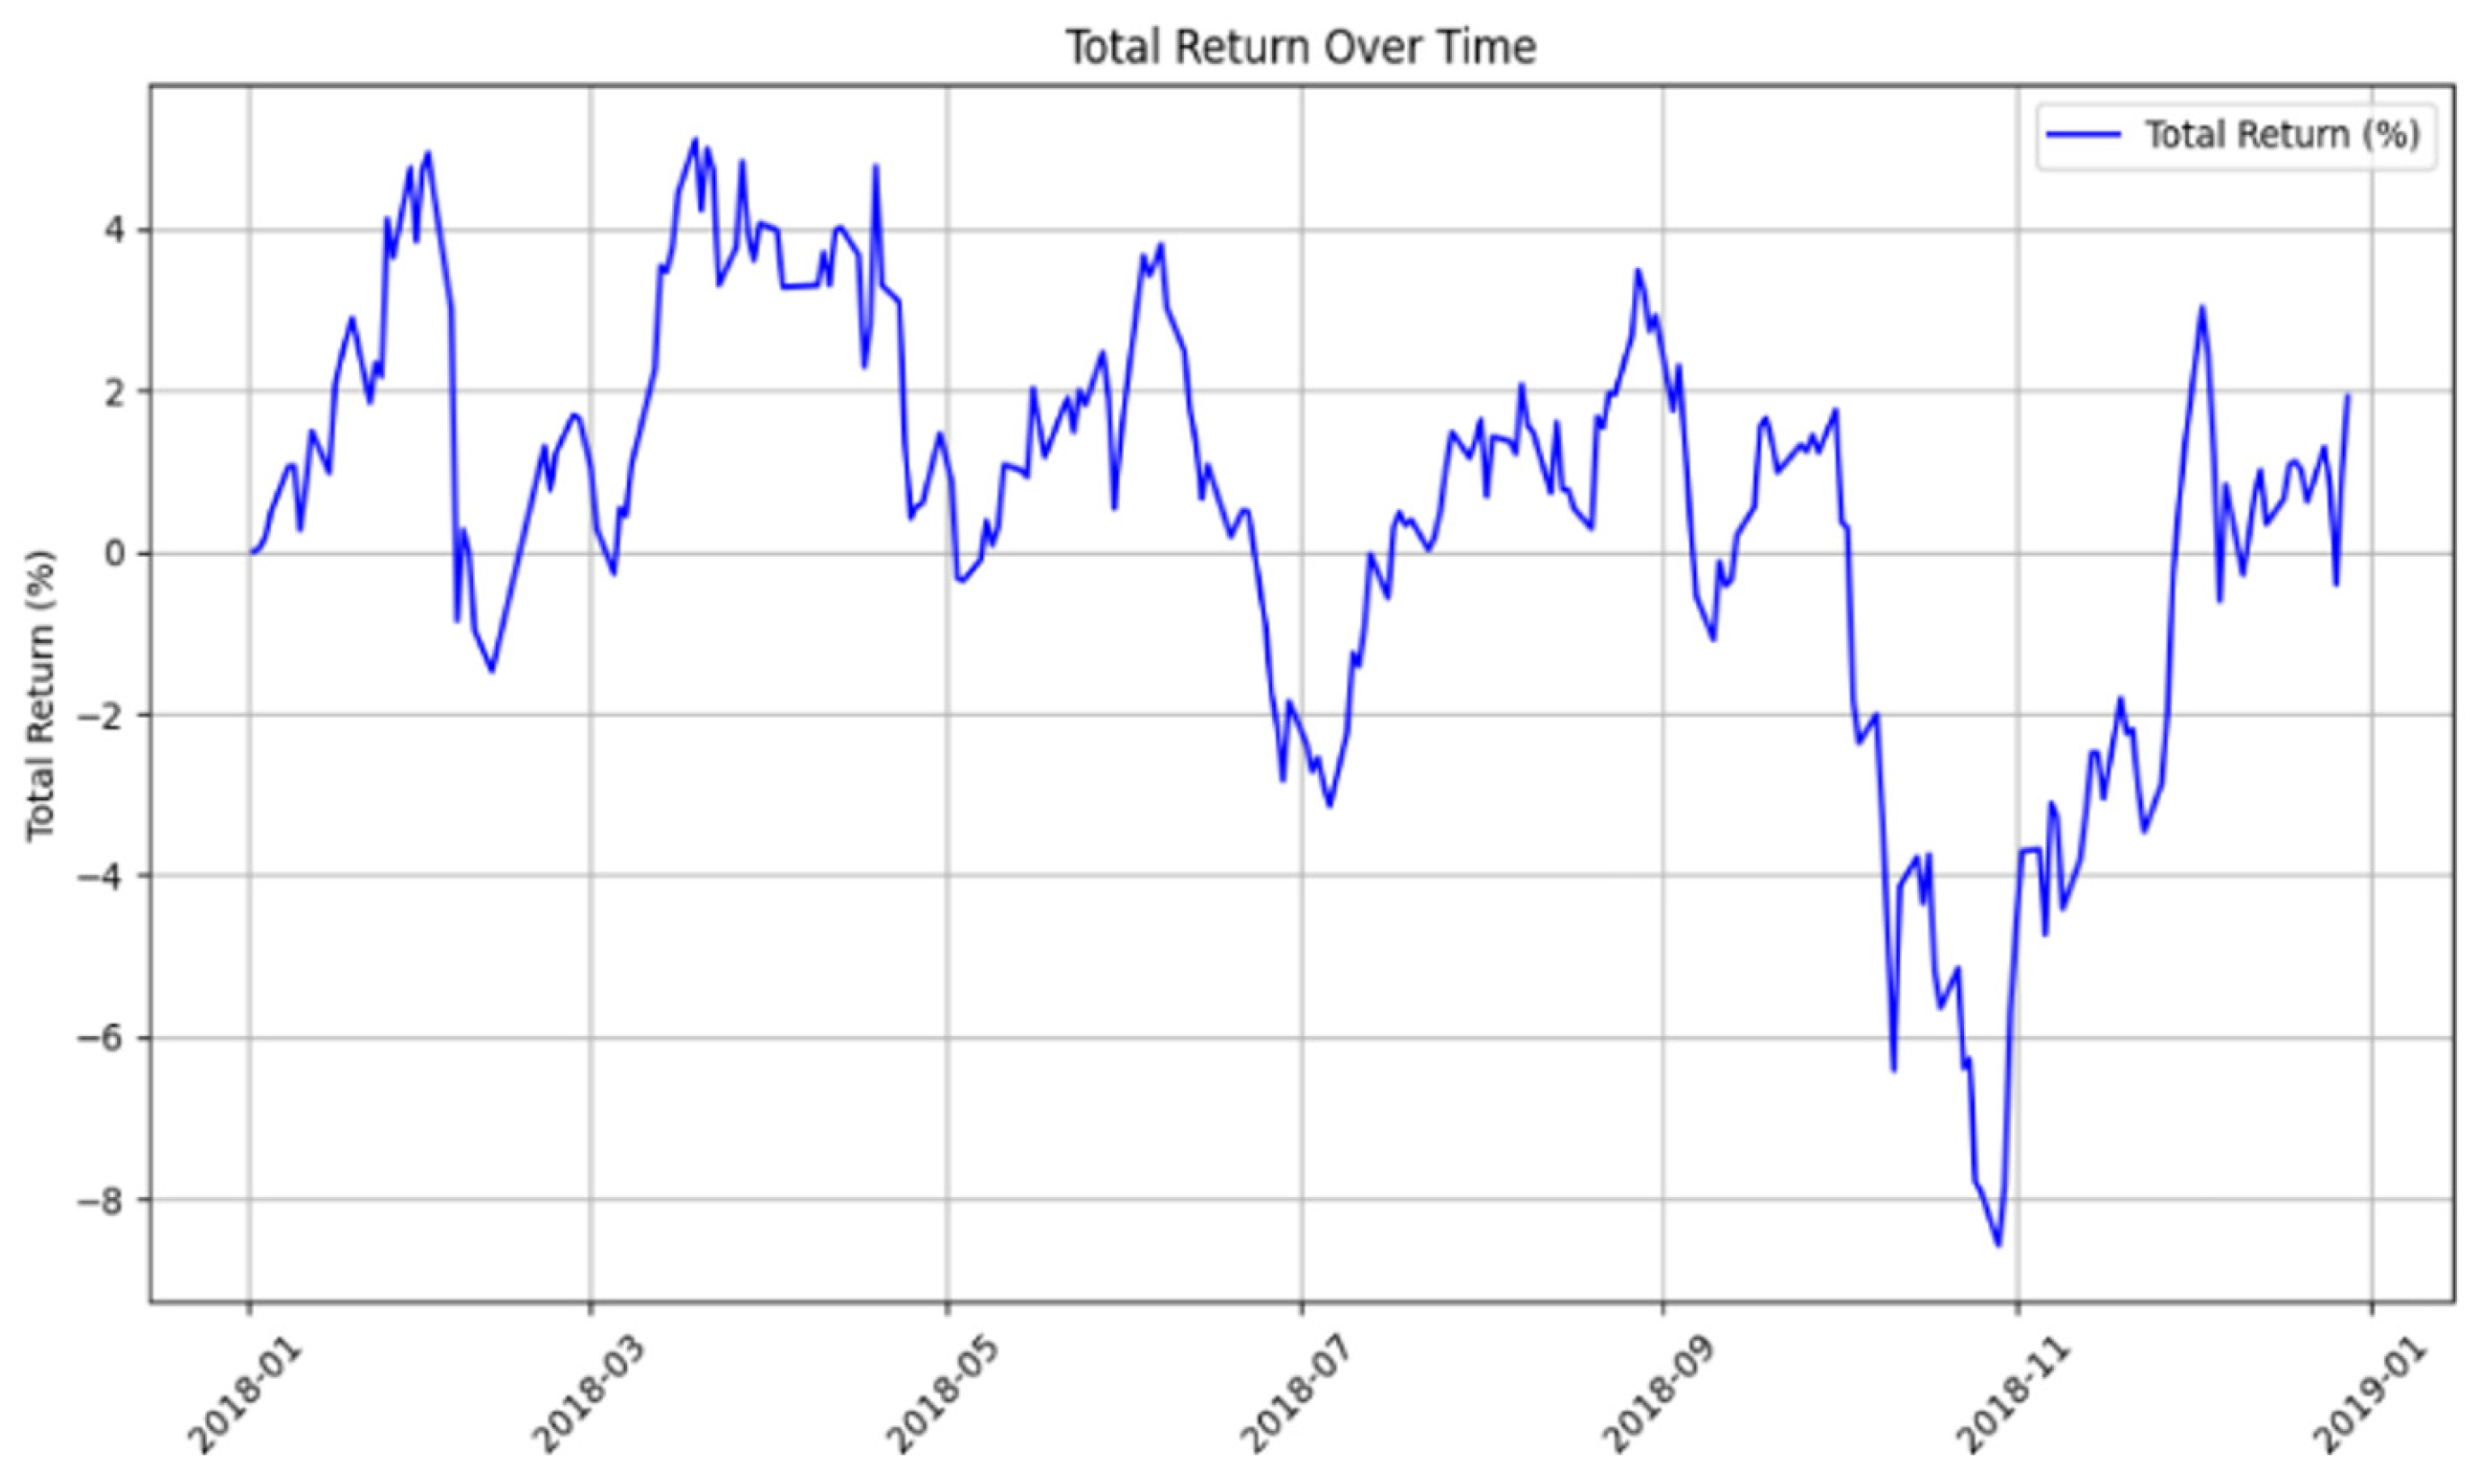
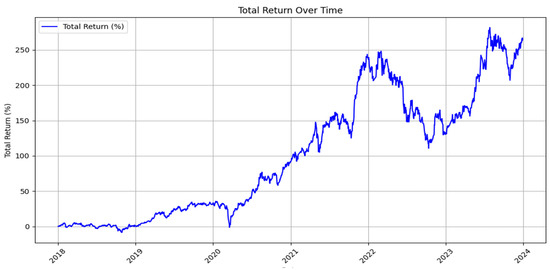
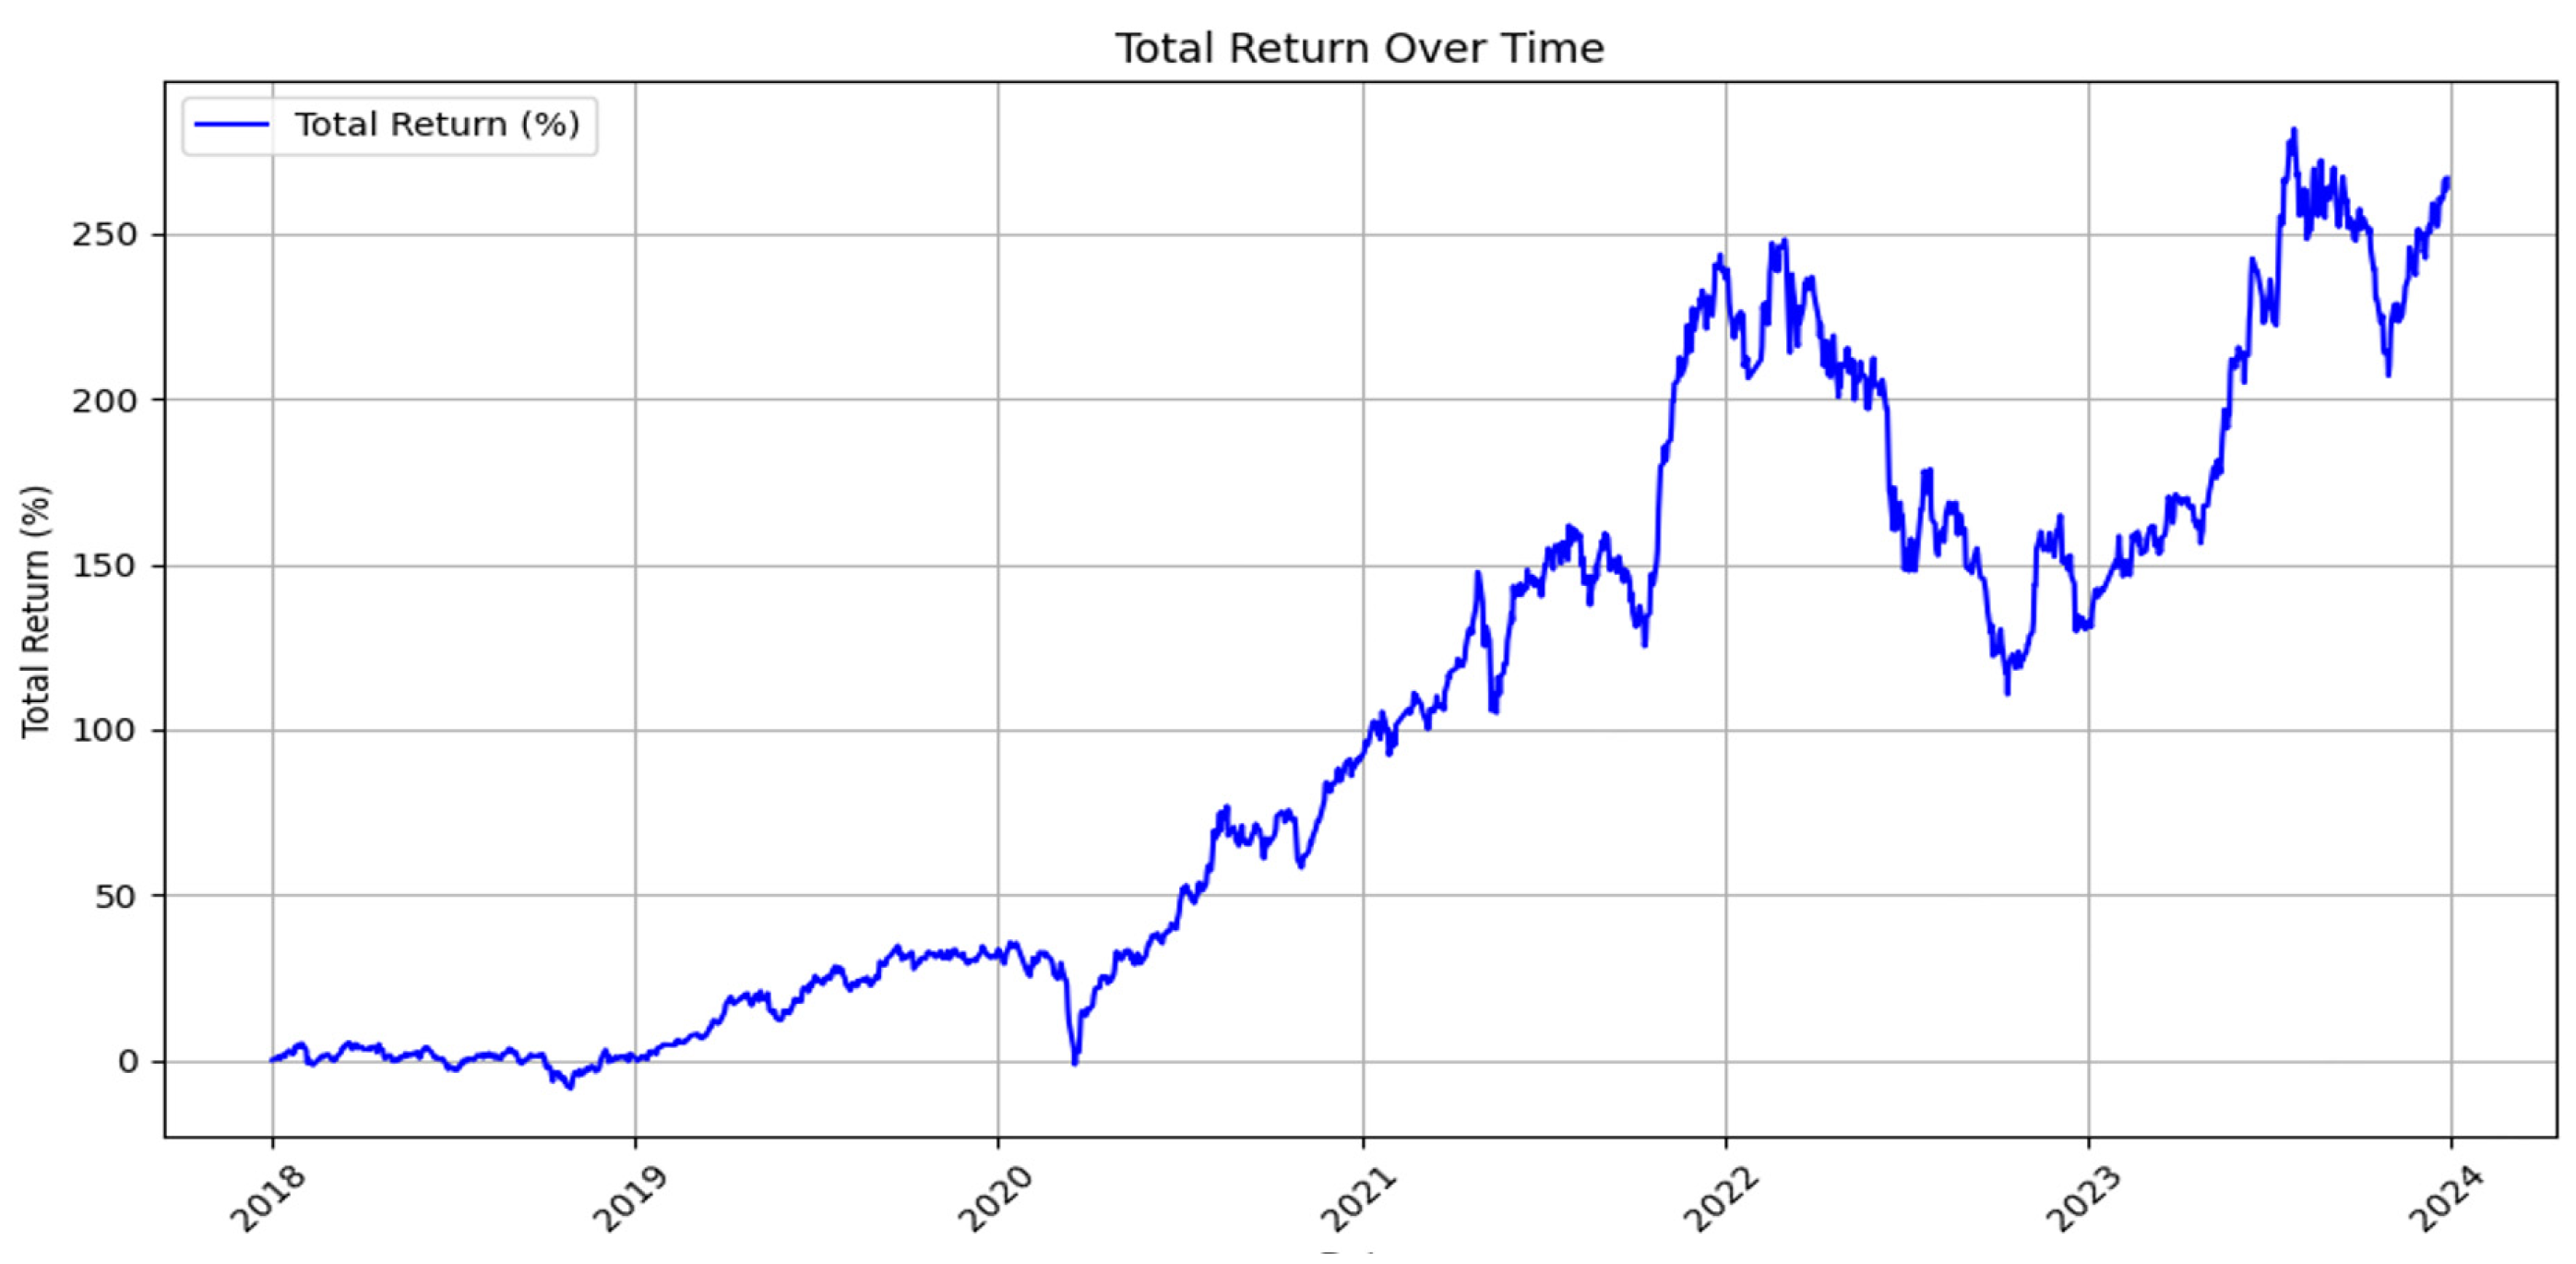
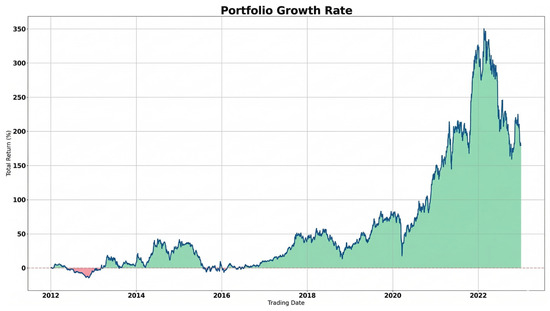
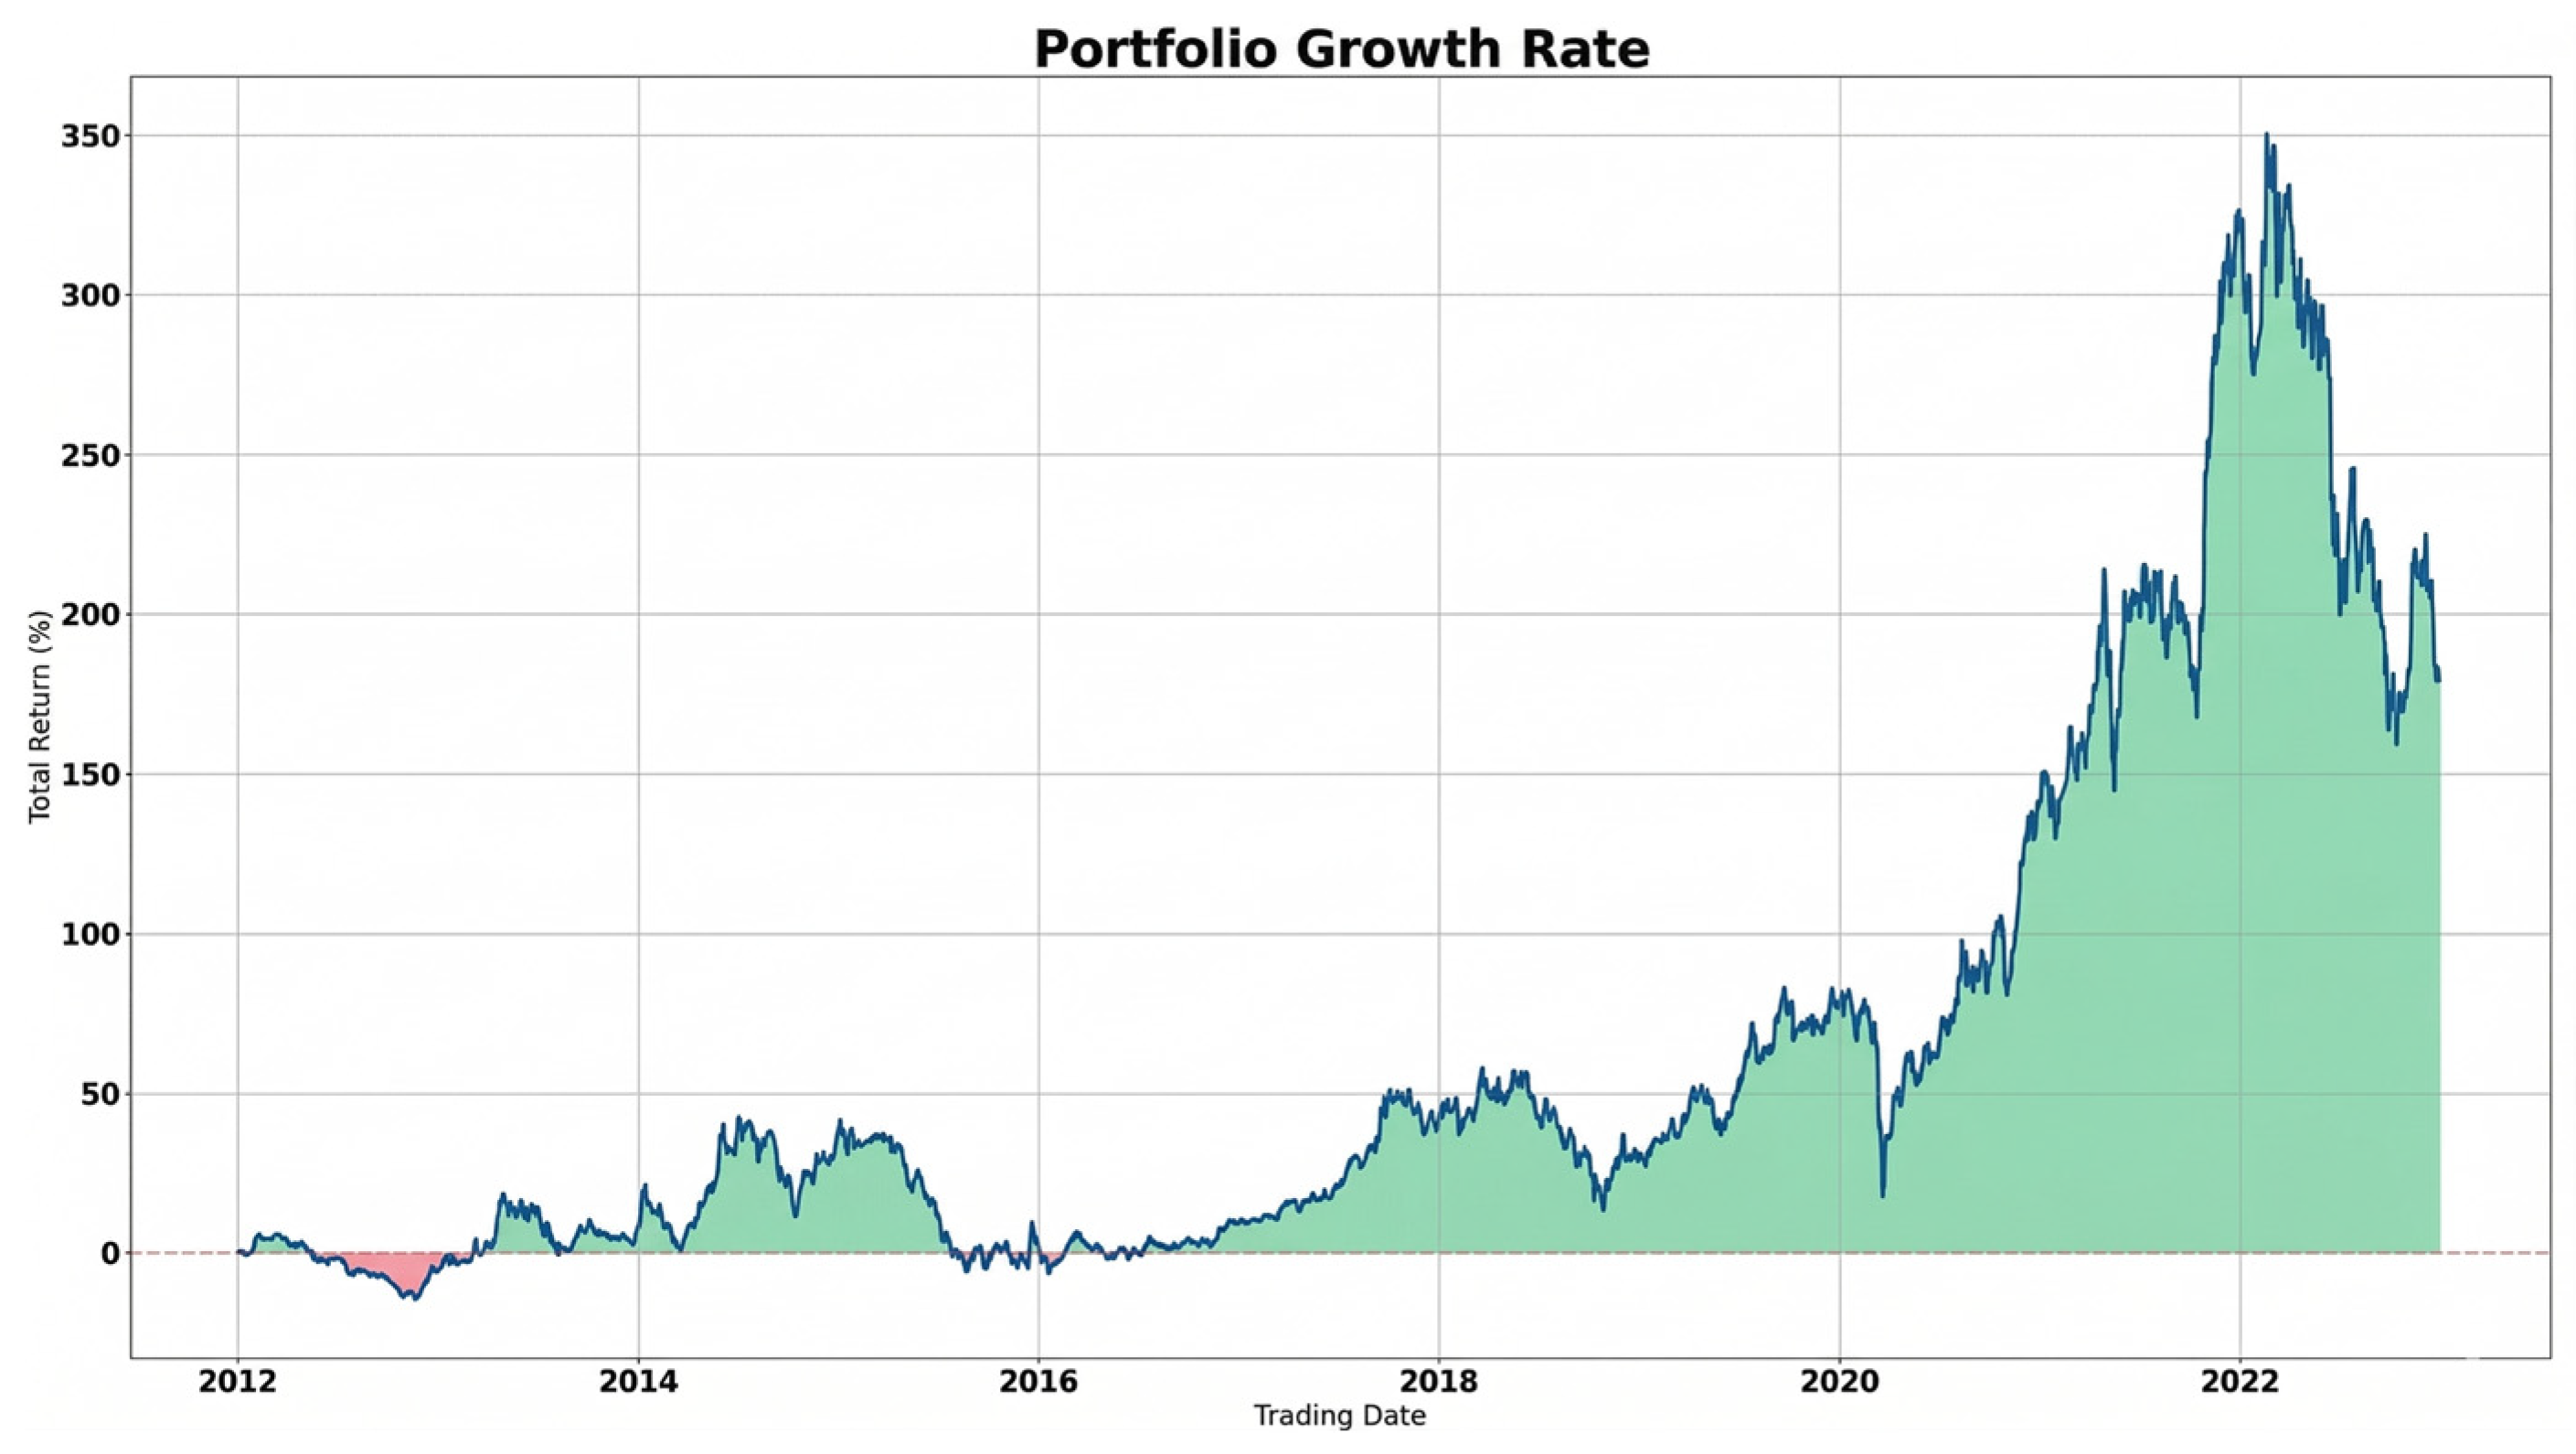
Backtesting is effective in evaluating the performance of the developed stock prediction methods. In this study, we conducted 1-year, 6-year, and 11-year backtests and compared the results with the initial investment of the equal-weighted portfolio. The results are summarized in Table 5, Table 6 and Table 7. The total return over time is illustrated in Figure 3, Figure 4 and Figure 5.
Table 5.
Short-term backtest (1 year).
Table 6.
Mid-term backtest (6 years).
Table 7.
Long-term backtest (11 years).
Figure 3.
Short-term (1 year) total return over time.
Figure 4.
Mid-term (6 years) total return over time.
Figure 5.
Long-term (11 years) total return over time where gains are shaded in mint green and losses in pinkish-red respectively.
- 2.
- Model accuracy: The LSTM model demonstrated good performance in time-series stock price prediction, effectively capturing overall price trends and providing a reliable foundation for trading strategies.
- 3.
- Strategy effectiveness: The opening and position-adding strategies based on predictions effectively enhanced overall portfolio returns. Strict risk management measures played a critical role in minimizing capital loss.
The results showed that the developed system enabled a positive return. The system outperformed the equal-weighted portfolio in the mid-term total return. The system demonstrates notable stability, as evidenced by consistent monthly profits across diverse market conditions, suggesting its adaptability and robustness. However, certain limitations remain. While the model effectively predicts short-term price trends, its reliance solely on technical indicators and historical data restricts its responsiveness to external influences such as macroeconomic policies, geopolitical developments, and unforeseen global events. These factors can significantly impact market behavior but are not captured within the current feature set.
To address these limitations and enhance predictive performance, future improvements are required; a broader range of external data sources, including financial reports, economic indicators, and news sentiment should be incorporated. Enriching the input features with such contextual information can improve the model’s ability to anticipate complex market dynamics. Additionally, exploring alternative deep learning architectures, such as Transformer-based models or hybrid approaches, enables better capacity to model nonlinear relationships and temporal dependencies inherent in financial time series data.
6. Conclusions and Future Work
By employing a deep learning model for stock price prediction, we integrated with automated trading strategies to achieve stable returns across varying time horizons. The experimental results validate several key findings. First, the LSTM model, recognized for its robust sequence modeling capabilities, demonstrates effectiveness in capturing stock market trends despite the presence of numerous external variables. Second, the proposed trading strategy, incorporating entry timing, position scaling, and risk control mechanisms, substantially enhances portfolio performance while mitigating drawdown risk. The model exhibits consistent profitability across short-, medium-, and long-term backtesting scenarios. Third, the importance of risk management is underscored in volatile market conditions. Backtest results indicate that the maximum drawdown remained below 20%, confirming the system’s capacity to protect capital and maintain investment stability.
Further research is needed to integrate additional external data sources, such as macroeconomic indicators and financial statements, to enrich the feature set and improve predictive accuracy. Moreover, exploring advanced deep learning architectures and enhancing the model’s adaptability to complex market dynamics will be central to further development.
Overall, the system developed demonstrates the feasibility and potential of combining deep learning techniques with automated trading strategies. It also offers a practical and effective framework for stock market forecasting and execution, providing substantial value to investors engaged in quantitative trading.
Author Contributions
Conceptualization, C.-C.C. and C.-H.W.; methodology, C.-H.W., J.-T.W. and P.-H.C.; software, J.-T.W. and P.-H.C.; validation, S.H.; formal analysis, S.H.; data curation, P.-H.C.; writing—original draft preparation, C.-C.C.; writing—review and editing, S.H.; visualization, J.-T.W. All authors have read and agreed to the published version of the manuscript.
Funding
This research received no external funding.
Institutional Review Board Statement
Not applicable.
Informed Consent Statement
Not applicable.
Data Availability Statement
The data presented in this study are available upon request from the corresponding authors.
Conflicts of Interest
The authors declare no conflicts of interest.
References
- Lo, A.W.; MacKinlay, A.C. A non-random walk down Wall Street. In A Non-Random Walk Down Wall Street; Princeton University Press: Princeton, NJ, USA, 2011. [Google Scholar]
- Graham, B.; McGowan, B. The Intelligent Investor; HarperBusiness Essentials: New York, NY, USA, 2003. [Google Scholar]
- Fisher, P.A. Common Stocks and Uncommon Profits and Other Writings; John Wiley & Sons: Hoboken, NJ, USA, 2003. [Google Scholar]
- Lin, M.-C. I Make My Living as a Shareholder; Good Morning Press: Mumbai, India, 2018. (In Chinese) [Google Scholar]
- Shah, D.; Isah, H.; Zulkernine, F. Stock Market Analysis: A Review and Taxonomy of Prediction Techniques. Int. J. Financial Stud. 2019, 7, 26. [Google Scholar] [CrossRef] [Scilit]
- Edwards, R.D.; Magee, J.; Bassetti, W.C. Technical Analysis of Stock Trends; CRC Press: Boca Raton, FL, USA, 2018. [Google Scholar]
- Box, G.E.; Pierce, D.A. Distribution of residual autocorrelations in autoregressive-integrated moving average time series models. J. Am. Stat. Assoc. 1970, 65, 1509–1526. [Google Scholar] [CrossRef]
- Hearst, M.A.; Dumais, S.T.; Osuna, E.; Platt, J.; Scholkopf, B. Support vector machines. IEEE Intell. Syst. Their Appl. 1998, 13, 18–28. [Google Scholar] [CrossRef] [Scilit]
- Breiman, L. Random forests. Mach. Learn. 2001, 45, 5–32. [Google Scholar] [CrossRef] [Scilit]
- Natekin, A.; Knoll, A. Gradient boosting machines, a tutorial. Front. Neurorobotics 2013, 7, 21. [Google Scholar] [CrossRef] [Scilit] [PubMed]
- Medsker, L.R.; Jain, L. Recurrent neural networks. Des. Appl. 2001, 5, 2. [Google Scholar]
- Graves, A.; Graves, A. Long short-term memory. In Supervised Sequence Labelling with Recurrent Neural Networks; Springer: Berlin/Heidelberg, Germany, 2012; pp. 37–45. [Google Scholar]
- Fischer, T.; Krauss, C. Deep learning with long short-term memory networks for financial market predictions. Eur. J. Oper. Res. 2018, 270, 654–669. [Google Scholar] [CrossRef] [Scilit]
- Chung, J.; Gulcehre, C.; Cho, K.; Bengio, Y. Empirical evaluation of gated recurrent neural networks on sequence modeling. arXiv 2014, arXiv:1412.3555. [Google Scholar] [CrossRef] [Scilit]
- Li, Z.; Liu, F.; Yang, W.; Peng, S.; Zhou, J. A survey of convolutional neural networks: Analysis, applications, and prospects. IEEE Trans. Neural Netw. Learn. Syst. 2021, 33, 6999–7019. [Google Scholar] [CrossRef] [Scilit] [PubMed]
- O’shea, K.; Nash, R. An introduction to convolutional neural networks. arXiv 2015, arXiv:1511.08458. [Google Scholar] [CrossRef] [Scilit]
- Lim, B.; Arık, S.Ö.; Loeff, N.; Pfister, T. Temporal fusion transformers for interpretable multi-horizon time series forecasting. Int. J. Forecast. 2021, 37, 1748–1764. [Google Scholar] [CrossRef] [Scilit]
- Chowdhary, K.; Chowdhary, K.R. Natural language processing. In Fundamentals of Artificial Intelligence; Springer: New Delhi, India, 2020; pp. 603–649. [Google Scholar]
- Koroteev, M.V. BERT: A review of applications in natural language processing and understanding. arXiv 2021, arXiv:2103.11943. [Google Scholar] [CrossRef] [Scilit]
- Huang, B.; Huan, Y.; Xu, L.D.; Zheng, L.; Zou, Z. Automated trading systems statistical and machine learning methods and hardware implementation: A survey. Enterp. Inf. Syst. 2019, 13, 132–144. [Google Scholar] [CrossRef] [Scilit]
- Li, Y. Deep reinforcement learning: An overview. arXiv 2017, arXiv:1701.07274. [Google Scholar]
- Arulkumaran, K.; Deisenroth, M.P.; Brundage, M.; Bharath, A.A. Deep reinforcement learning: A brief survey. IEEE Signal Process. Mag. 2017, 34, 26–38. [Google Scholar] [CrossRef] [Scilit]
- Huang, Y. Deep Q-networks. In Deep Reinforcement Learning: Fundamentals, Research and Applications; Springer: Singapore, 2020; pp. 135–160. [Google Scholar]
- Schulman, J.; Wolski, F.; Dhariwal, P.; Radford, A.; Klimov, O. Proximal policy optimization algorithms. arXiv 2017, arXiv:1707.06347. [Google Scholar] [CrossRef] [Scilit]
- Babaeizadeh, M.; Frosio, I.; Tyree, S.; Clemons, J.; Kautz, J. Reinforcement learning through asynchronous advantage actor-critic on a gpu. arXiv 2016, arXiv:1611.06256. [Google Scholar]
- Deng, Y.; Bao, F.; Kong, Y.; Ren, Z.; Dai, Q. Deep direct reinforcement learning for financial signal representation and trading. IEEE Trans. Neural Netw. Learn. Syst. 2016, 28, 653–664. [Google Scholar] [CrossRef] [Scilit] [PubMed]
- Kausar, M.A.; Dhaka, V.S.; Singh, S.K. Web crawler: A review. Int. J. Comput. Appl. 2013, 63, 31–36. [Google Scholar] [CrossRef] [Scilit]
- Patel, J.M. Getting Structured Data from the Internet: Running Web Crawlers/Scrapers on a Big Data Production Scale; Apress: New York, NY, USA, 2020. [Google Scholar]
- Sharpe, W.F. The sharpe ratio. J. Portf. Manag. 1994, 21, 49–58. [Google Scholar] [CrossRef] [Scilit]

Disclaimer/Publisher’s Note: The statements, opinions and data contained in all publications are solely those of the individual author(s) and contributor(s) and not of MDPI and/or the editor(s). MDPI and/or the editor(s) disclaim responsibility for any injury to people or property resulting from any ideas, methods, instructions or products referred to in the content. |
© 2026 by the authors. Licensee MDPI, Basel, Switzerland. This article is an open access article distributed under the terms and conditions of the Creative Commons Attribution (CC BY) license.