


Abstract
The accurate and timely identification of urban building footprints is critical for sustainable urban planning and disaster management. Traditional remote sensing methods for this task often face limitations in scalability, accuracy, and adaptability to complex urban morphologies. This paper addresses these challenges by developing and evaluating a novel data-centric framework that synergistically integrates Graph Neural Networks (GNNs) with zero-shot superpixel segmentation derived from the Segment Anything Model (SAM) applied to Sentinel-2 imagery. A cornerstone of our methodology is a rigorous assessment of OpenStreetMap (OSM) data, refined through temporal NDVI stability analysis to generate high-quality ground truth. We propose an optimized UrbanGraphSAGE model, enhanced with spectral data augmentation and trained using a robust loss function with label smoothing to mitigate label noise. In the complex urban landscape of Algiers, Algeria, our approach achieves a Test F1-Score of 0.7131, demonstrating highly competitive performance with standard pixel-based baselines like U-Net while offering significant topological and computational advantages. Specifically, our model operates with merely 19,585 parameters—orders of magnitude fewer than pixel-based CNNs. A rigorous Gold Standard evaluation against manually labeled imagery confirms the model’s high recall (0.8484) and reliability for automated urban monitoring.
1. Introduction
Rapid global urbanization presents profound challenges for sustainable development, infrastructure planning, and disaster risk management. Accurate and up-to-date geospatial data on the built environment, particularly building footprints, is a fundamental requirement for addressing these challenges. While satellite remote sensing offers a scalable means to monitor urban areas, the spectral complexity and morphological diversity of urban landscapes pose significant challenges for traditional automated extraction methods.
Deep learning, particularly Convolutional Neural Networks (CNNs), has advanced automated feature extraction, but its reliance on grid-like data presents limitations when modeling irregularly shaped urban features [1]. This has motivated the exploration of alternative architectures, such as Graph Neural Networks (GNNs), which can explicitly model the contextual and spatial relationships inherent in geospatial data [2]. However, the performance of any supervised learning model, including GNNs, is fundamentally dependent on the quality of its training data. The use of unassessed Volunteered Geographic Information (VGI) from sources like OpenStreetMap (OSM) can introduce significant label noise, limiting model performance and reliability [3].
To address these dual challenges of model architecture and data quality, this paper introduces a novel, data-centric framework for building footprint extraction. We make the following primary contributions: (1) We propose and evaluate a GNN architecture, UrbanGraphSAGE, which operates on superpixel-segmented Sentinel-2 imagery to learn contextual representations of urban features. (2) We introduce a rigorous and replicable methodology for assessing and refining OSM data by cross-validating it with other large-scale open building datasets and performing temporal stability analysis. (3) We demonstrate that this data-centric approach, enhanced with spectral data augmentation, achieves strong performance in the complex urban environment of Algiers, Algeria, providing a robust framework for automated urban monitoring.
2. Related Work
The extraction of building footprints from remote sensing imagery is a widely studied field. Early methods relied on handcrafted features and traditional machine learning, but the last decade has been dominated by deep learning approaches.
2.1. Deep Learning for Building Footprint Extraction
Modern building footprint extraction is largely accomplished using deep learning, especially semantic segmentation models based on CNNs. Architectures like Fully Convolutional Networks (FCNs) and U-Net [4] have become standard baselines, demonstrating strong performance on high-resolution aerial and satellite imagery. Variants such as DeepLabv3+ and Mask R-CNN have further improved accuracy by incorporating techniques like atrous convolution and instance segmentation. However, these methods operate on a regular pixel grid and can struggle to model the complex, non-Euclidean relationships and irregular shapes characteristic of urban environments.
2.2. Graph Neural Networks in Remote Sensing
Graph Neural Networks (GNNs) have emerged as a powerful alternative for analyzing data with an underlying graph structure. In remote sensing, this is often achieved by first segmenting an image into perceptually meaningful regions (superpixels) and then representing them as a graph, where nodes are superpixels and edges represent adjacency [5,6]. GNNs can learn features based on both the intrinsic properties of an object (node features) and its spatial context by passing messages between neighboring nodes. Architectures like Graph Convolutional Networks (GCNs) and GraphSAGE have shown promise for land cover classification, as they explicitly leverage the relational information that is lost in pixel-based methods. Our work builds on this paradigm by applying a customized GraphSAGE model specifically to the challenge of building footprint extraction from medium-resolution imagery.
2.3. VGI and OpenStreetMap Data Quality
The performance of any supervised model is fundamentally dependent on the quality of its training data. VGI, and OSM in particular, is an invaluable source of free, global geospatial data. However, its crowdsourced nature leads to significant heterogeneity in data quality, with spatial and temporal variations in completeness, positional accuracy, and thematic correctness. This has led to a dedicated field of research focused on VGI quality assessment. Methods range from intrinsic analysis (examining contributor history) to extrinsic validation, which compares VGI data against authoritative reference datasets. Our work contributes to this area by developing a multi-source extrinsic validation pipeline that combines several large-scale, open datasets to create a high-confidence ground truth layer.
3. Methodology
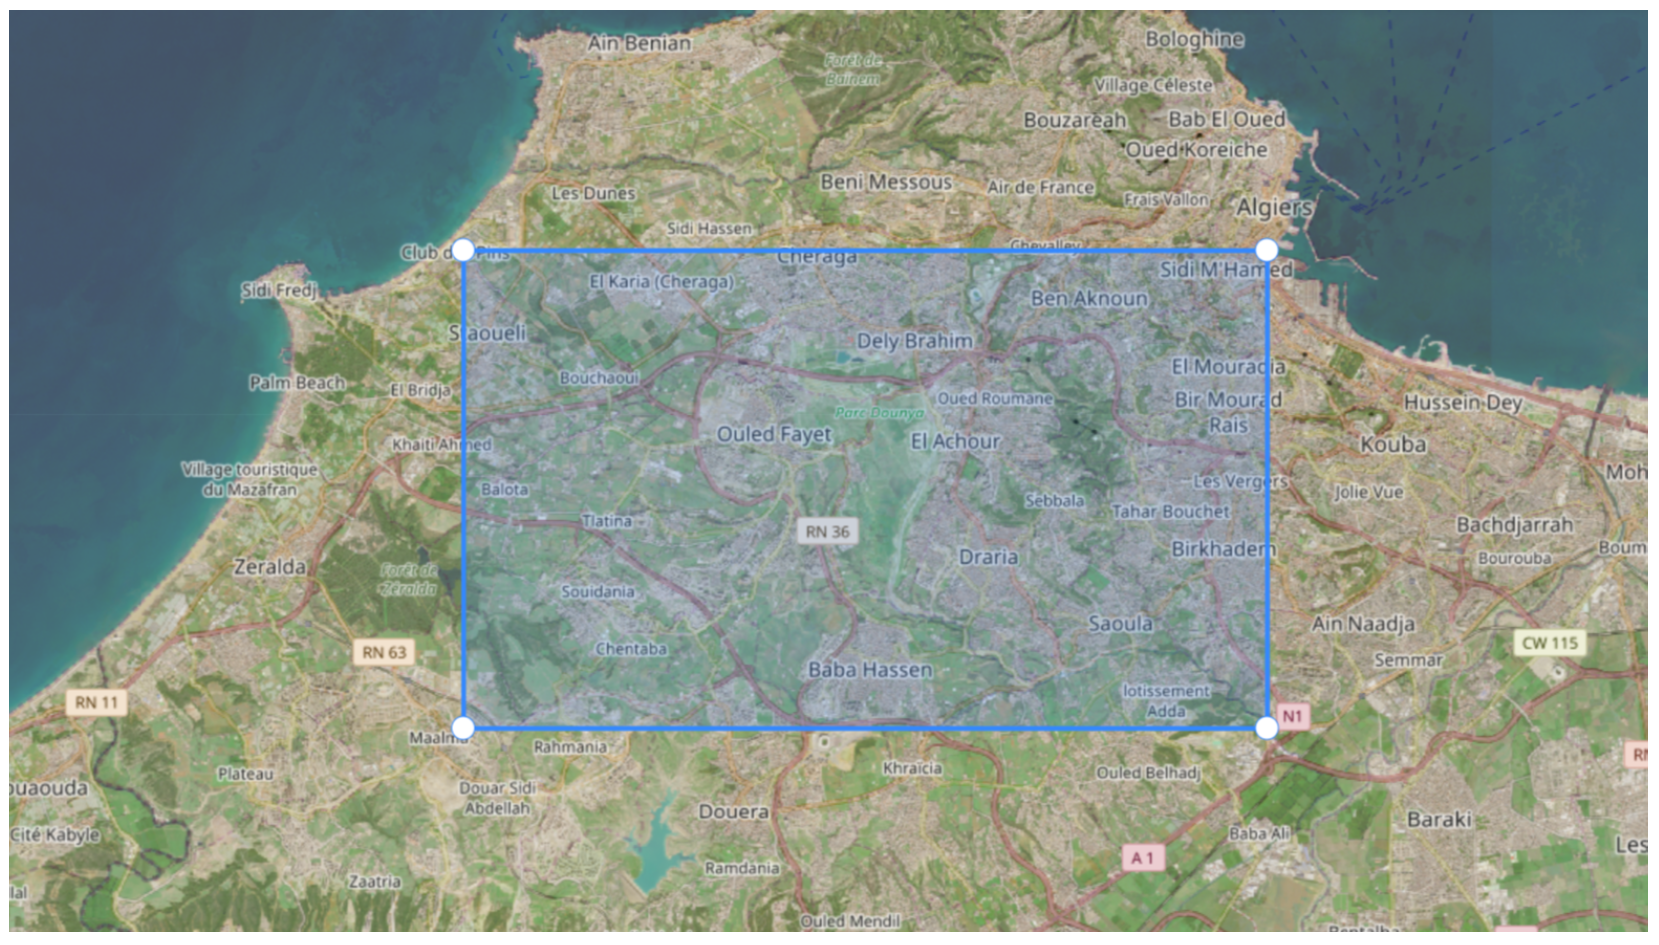
Our framework for urban building footprint extraction integrates a data-centric ground truth generation pipeline with a GNN-based classification model. The study was conducted in a 145.8 km2 Area of Interest (AOI) in Algiers, Algeria, a region characterized by diverse urban morphology (Figure 1). The entire workflow, from data preprocessing to model training, was implemented in Python (Version 3.10) using libraries such as GeoPandas, Rasterio, Scikit-image, and PyTorch (version 1.9.0) Geometric.
Figure 1.
The selected Area of Interest (AOI) in Algiers, Algeria. (Base map data source: OpenStreetMap contributors.)
3.1. Data Acquisition and Assessed Ground Truth Generation
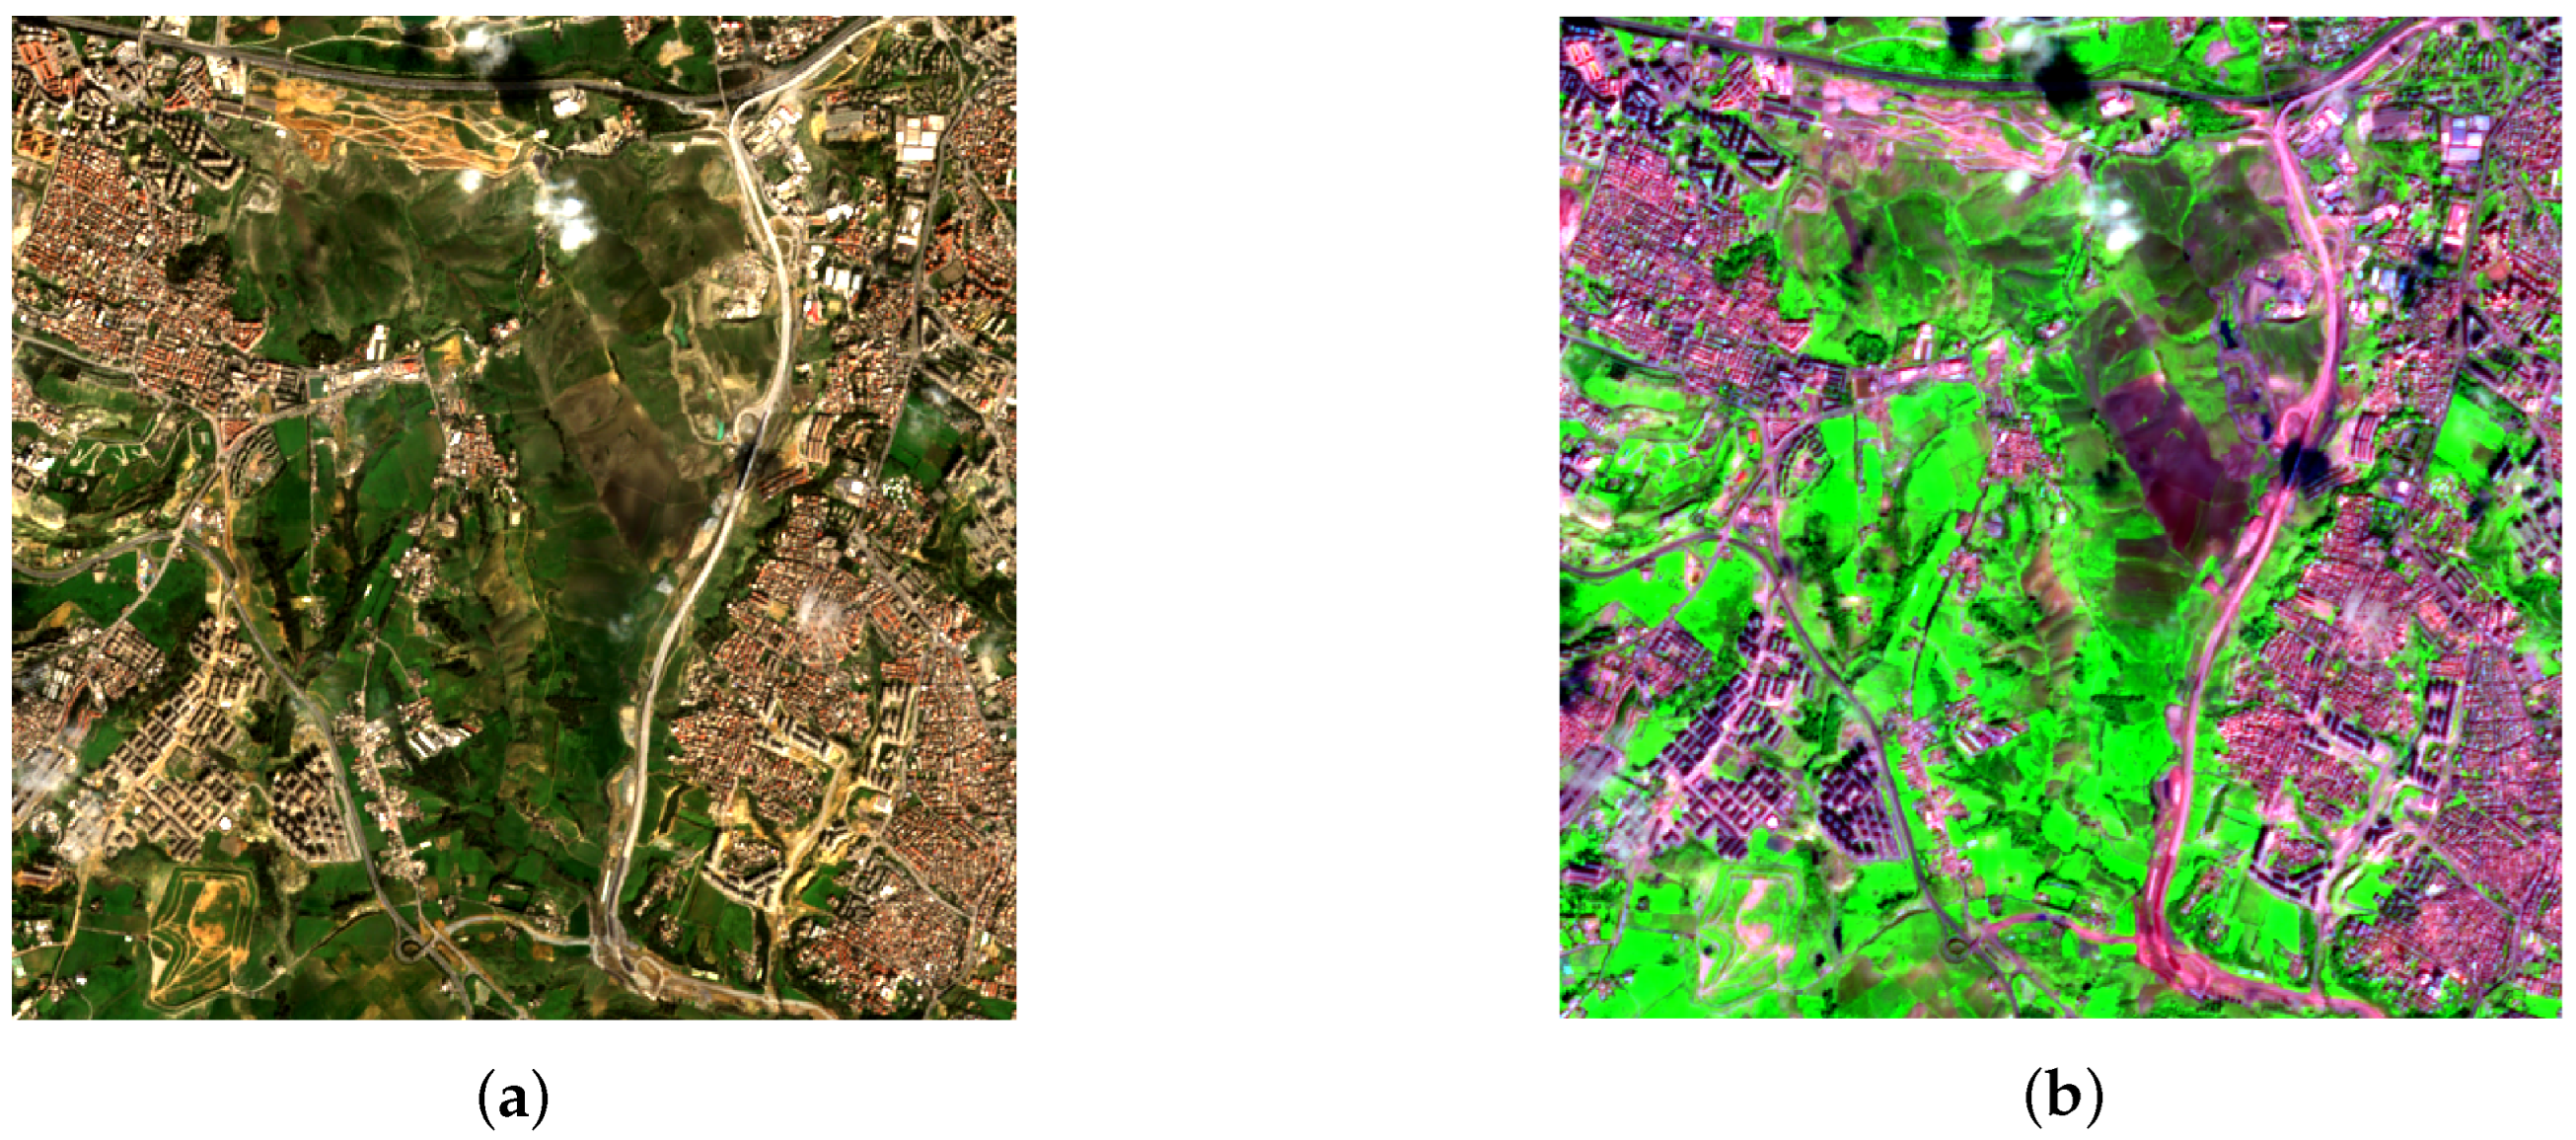
The primary satellite data utilized were Level-2A Sentinel-2 images [7], chosen for their 10–20 m spatial resolution and free availability. A 15-channel composite image was created for the Algiers AOI, stacking 12 spectral bands (resampled to 10 m using bilinear interpolation) and 3 derived spectral indices: NDVI [8], NDBI [9], and NDSI (Figure 2).
Figure 2.
Spectral visualization of the study area. (a) True Color composite (Bands 4, 3, 2) showing standard visual appearance. (b) False Color Urban composite (Bands 12, 8, 4) leveraging Short-Wave Infrared (SWIR). This band combination highlights building materials (appearing in white/purple tones) more distinctly against vegetation and bare soil, visually justifying the feature selection results.
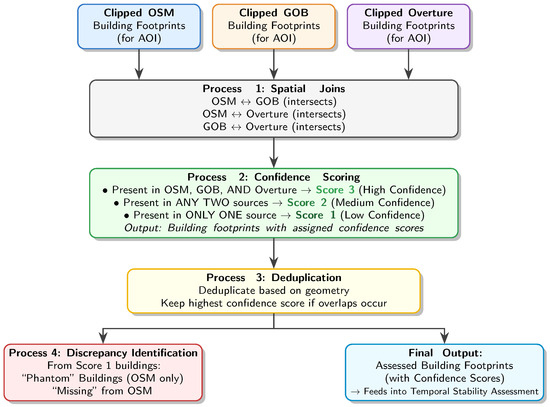
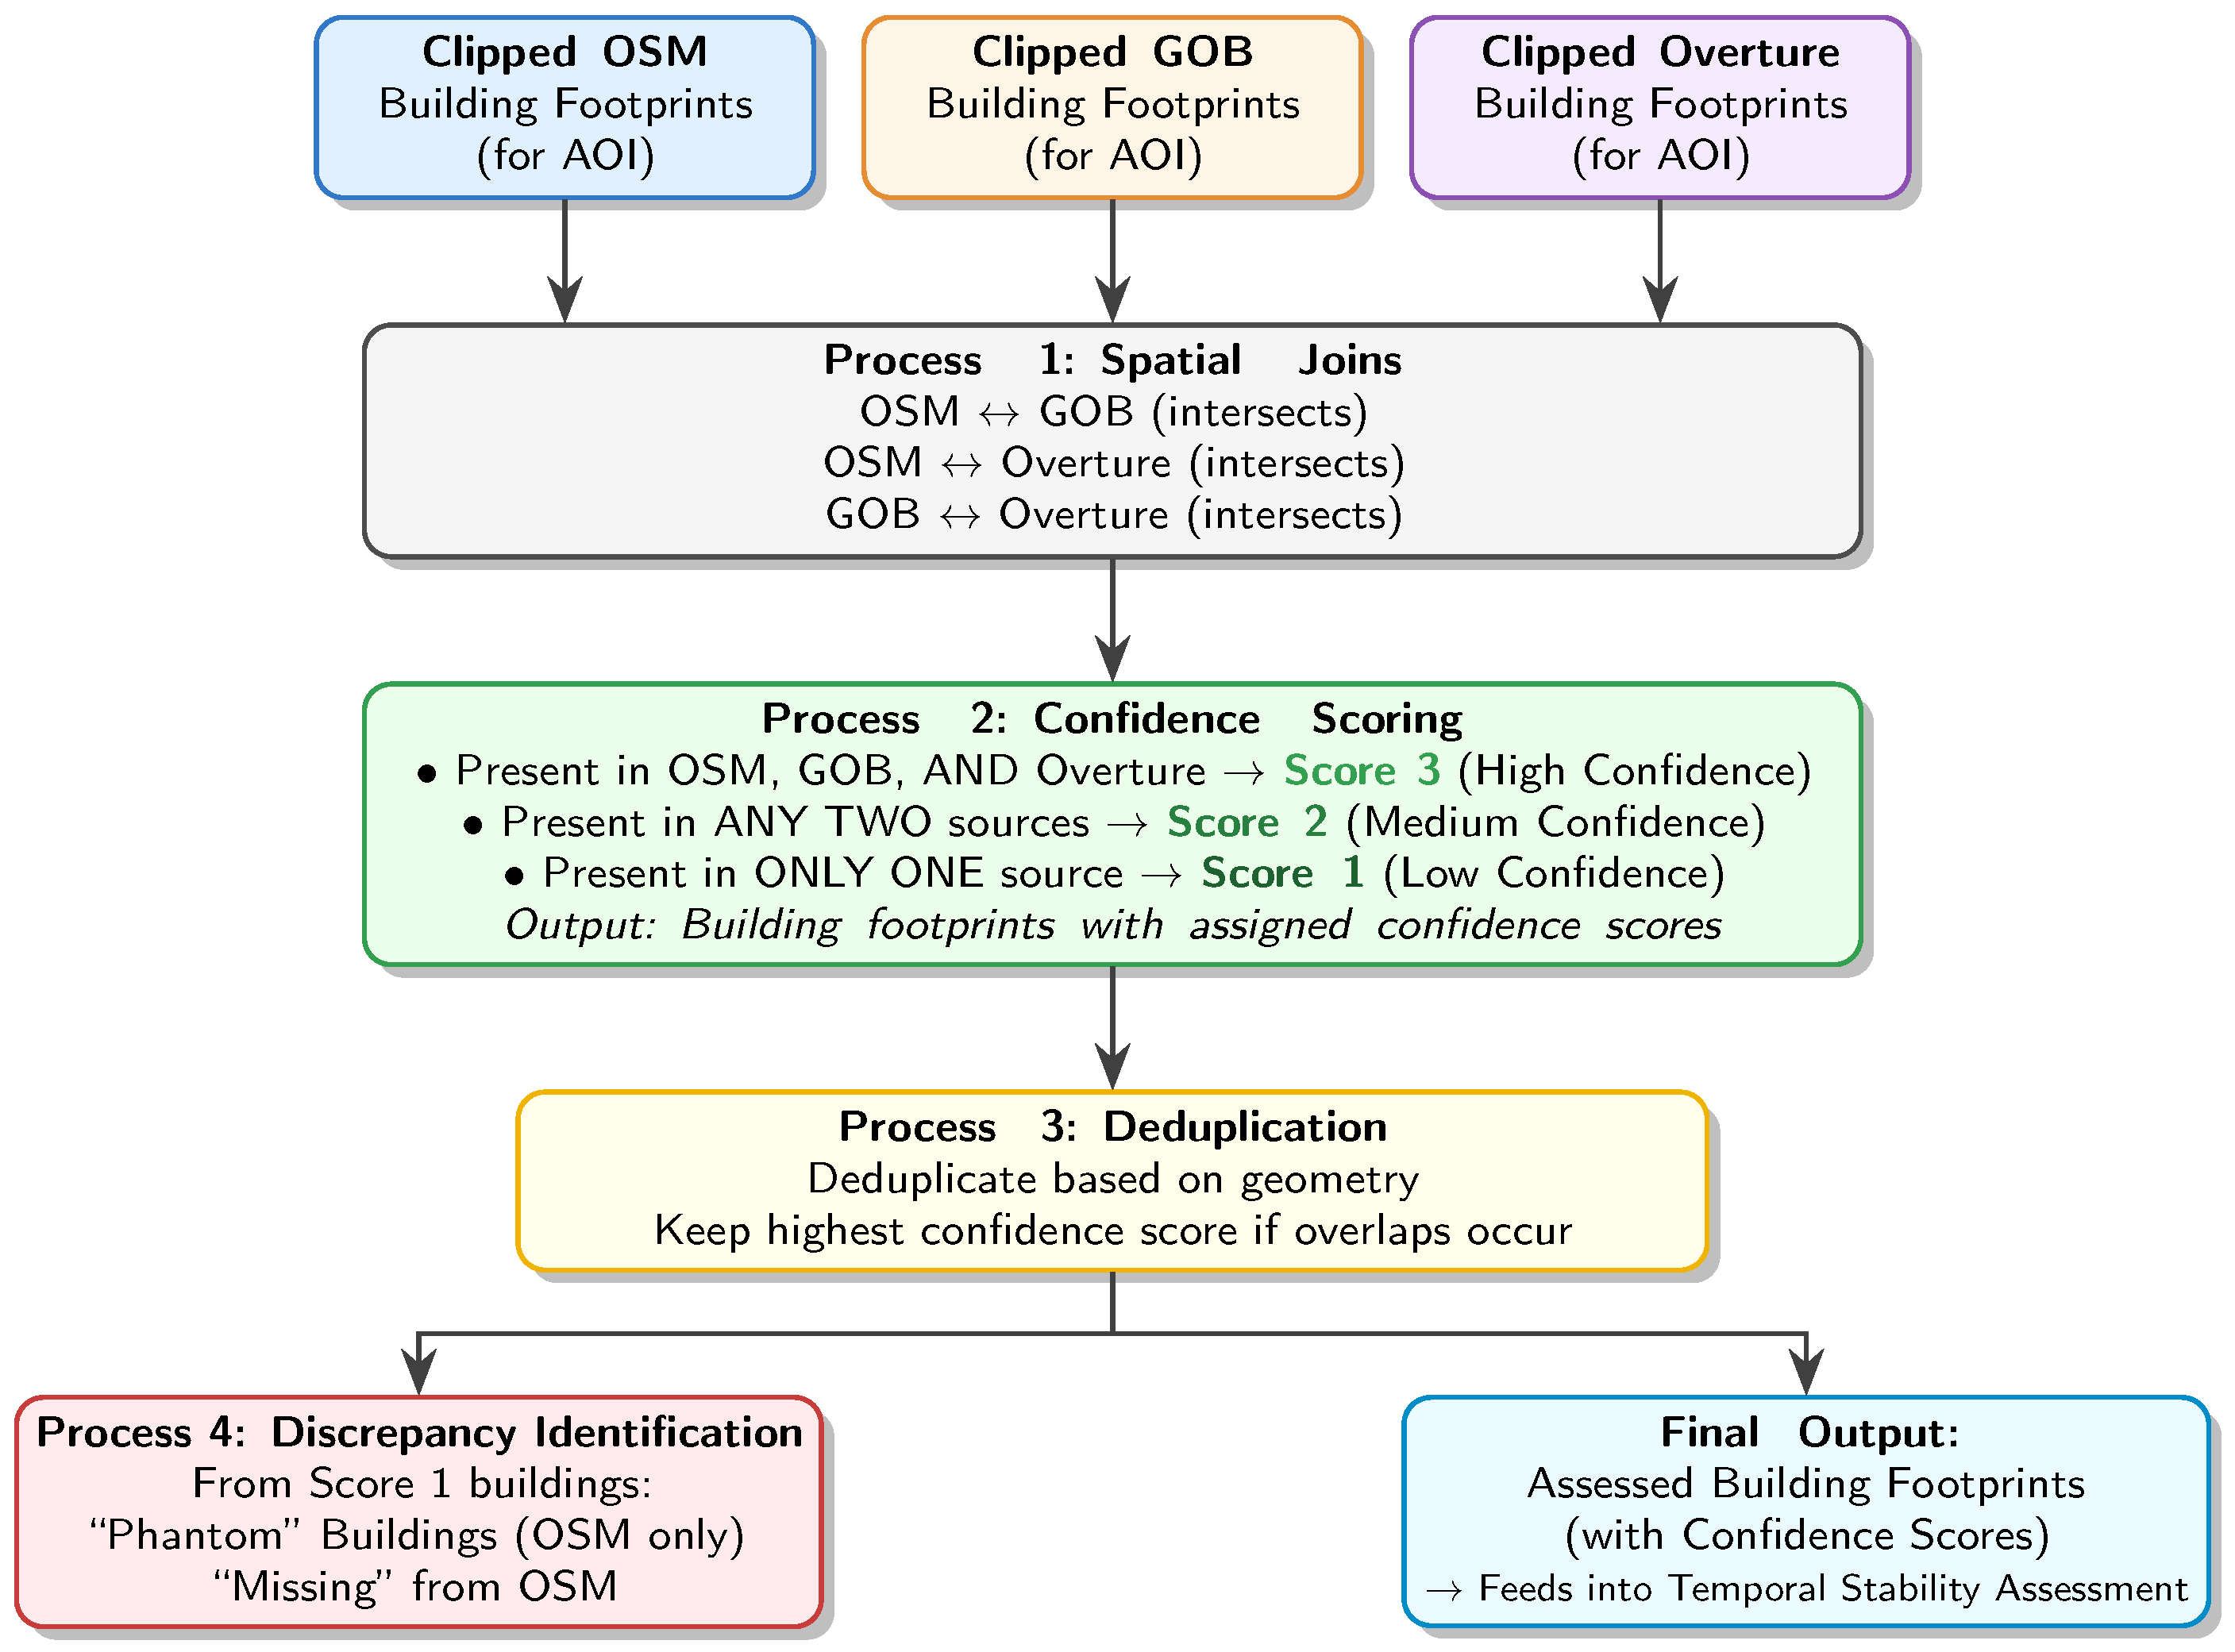
Recognizing the quality variability of VGI, we developed and implemented a rigorous, multi-stage pipeline to generate high-confidence ground truth labels, as visualized in Figure 3. This systematic process begins by collecting building footprints from three open-source datasets: OpenStreetMap (OSM), Google Open Buildings [10], and Overture Maps [11]. It then applies a multi-source cross-validation and temporal stability analysis to produce a final, reliable set of building footprints. Quantitatively, this rigorous cross-validation filtered out 7 unverified “phantom” buildings originally present in the raw OSM data and, more critically, integrated 11,670 previously missing structures confirmed by Google Open Buildings and Overture. This process resulted in a final, highly refined set of 88,638 reliable building footprints—a 15.1% structural increase in label completeness over the baseline OSM dataset (76,975 buildings). These assessed footprints were then rasterized to create a definitive binary ground truth mask for model training and evaluation.
Figure 3.
The multi-source cross-validation process for OSM data quality assessment uses spatial joins and confidence scoring to produce a unique set of assessed building footprints.
3.2. Superpixel Generation via Segment Anything Model (SAM)
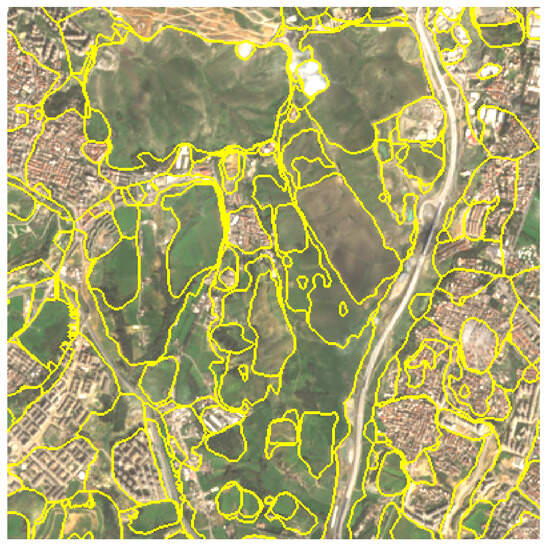
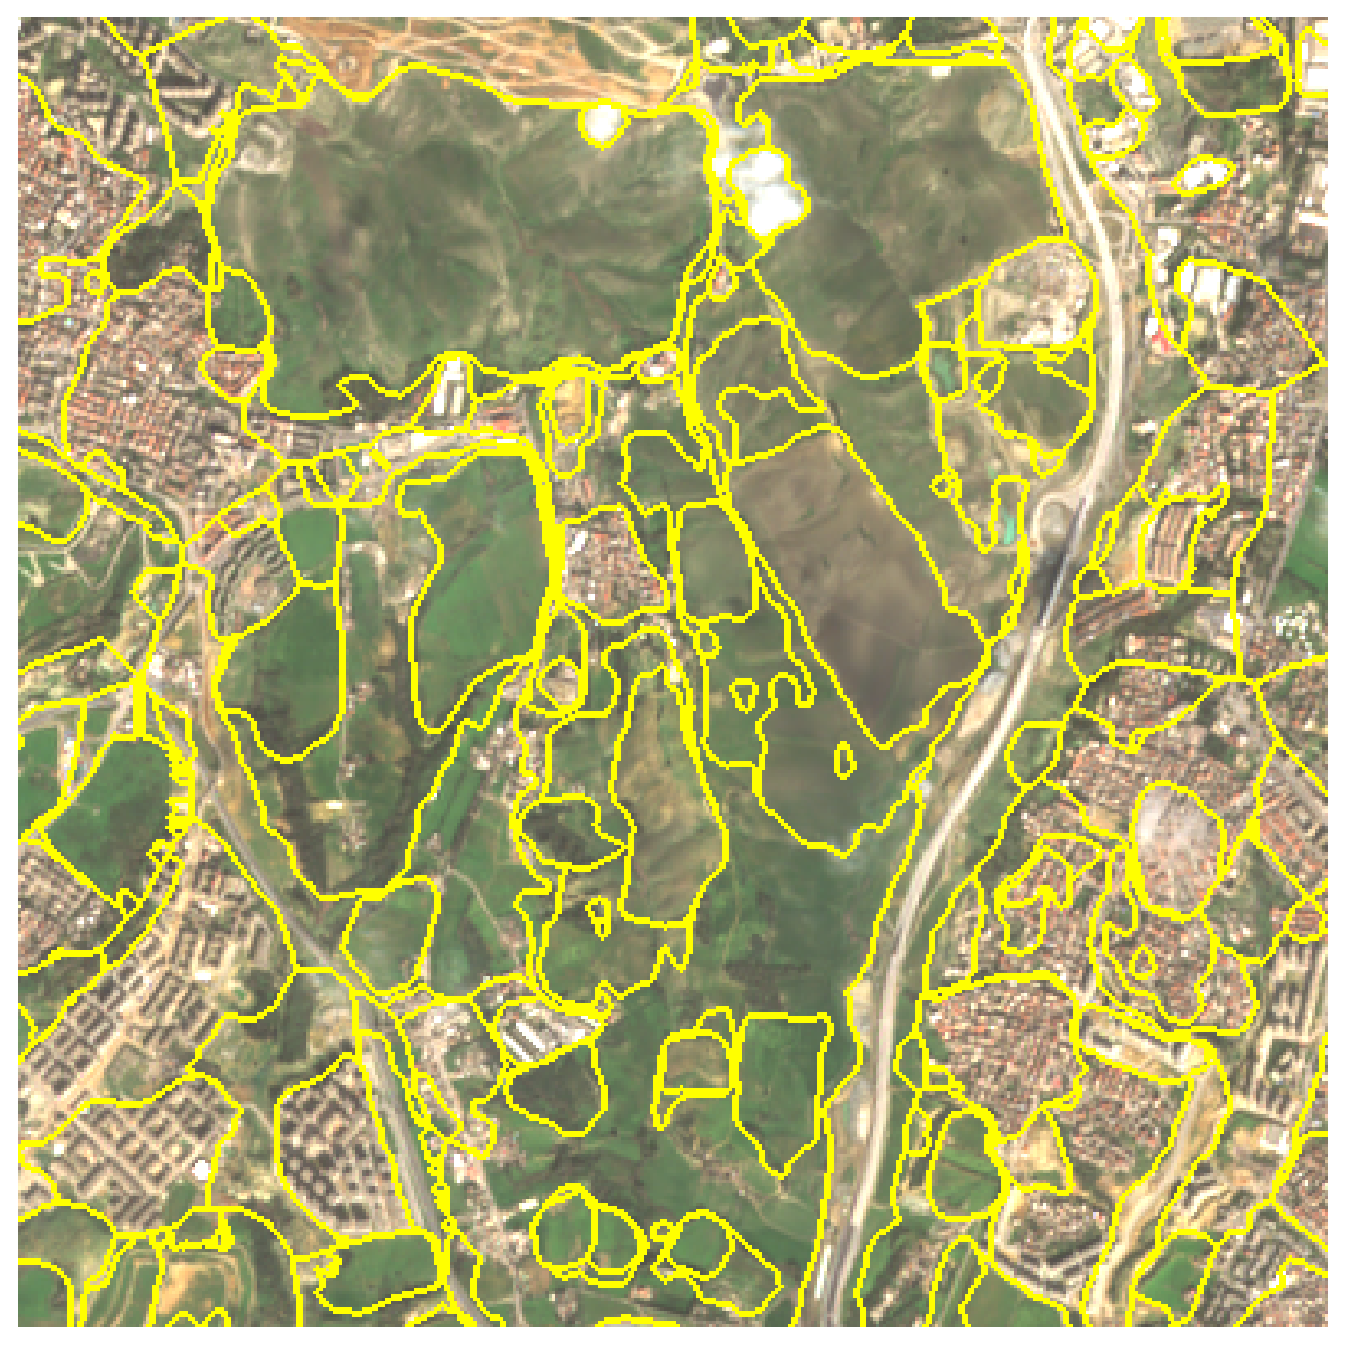
To transform the grid-based satellite imagery into a graph structure, we employ a superpixel segmentation approach (Algorithm 1). Unlike traditional clustering algorithms (e.g., SLIC), which rely strictly on iterative local color and spatial similarity—often resulting in arbitrary, blocky segments that fail to capture complex geometric structures in medium-resolution imagery—we utilize the Segment Anything Model (SAM) [12], a foundational vision model. SAM leverages deep semantic understanding to generate superpixels that better align with actual object boundaries, offering a distinct structural advantage over SLIC’s purely low-level pixel grouping. We adapted SAM for remote sensing by feeding it the 3-channel RGB bands of the Sentinel-2 imagery. We configured SAM in an automatic mask generation mode with high-density point sampling (64 points per side) and disabled post-processing merging to force an over-segmentation of the scene. This results in perceptually meaningful “superpixels” that adhere tightly to object boundaries (buildings, roads) rather than arbitrary grid shapes, as shown in Figure 4. These segments serve as the nodes (V) in our graph .
| Algorithm 1 Superpixel Generation (SAM) and Graph Construction |
1. Generate SAM Segments:
2. Extract Node Features:
3. Construct Graph:
|
Figure 4.
Visualizing the superpixel segmentation generated by the Segment Anything Model (SAM) on Sentinel-2 imagery. The yellow boundaries demonstrate SAM’s capability to adhere to object edges (buildings, roads) even at 10m resolution, creating semantically meaningful nodes for the GNN.
3.3. UrbanGraphSAGE Model Architecture
We designed a GNN model, termed UrbanGraphSAGE, based on the GraphSAGE architecture for its inductive capabilities. The core of the architecture is the SAGEConv layer, which updates a node’s feature representation by aggregating information from its local neighborhood. For a given node v at layer k, the update process with a ‘mean’ aggregator is defined by two steps:
- 1.
- Aggregate: A mean of the feature vectors from the set of neighboring nodes is computed:
- 2.
- Update: The aggregated neighborhood vector is concatenated with the node’s own previous layer’s feature vector , and the result is passed through a linear layer with a weight matrix and a non-linear activation function (ReLU in our case):
Our model consists of a stack of three such SAGEConv blocks, each followed by BatchNorm, a ReLU activation, and Dropout (). The dropout rate was empirically selected to mitigate overfitting on the relatively dense superpixel graph. To leverage features learned at different scales, we use a Jumping Knowledge (JK) layer [13] in “cat” mode to concatenate the final output representations from all three blocks for each node. This results in a 192-dimensional feature vector, which is then passed to a final linear classifier with a sigmoid activation to produce a building probability score.
3.4. Training and Evaluation
To enhance model robustness, we employed an image-level spectral data augmentation strategy. For each training epoch, two new versions of the composite image were generated by stochastically applying Gaussian blur, brightness adjustments, and contrast modifications. The entire superpixel graph construction process was re-run on these augmented images. The model was trained for 150 epochs using an AdamW optimizer [14], at which point the validation loss plateaued, indicating convergence without overfitting.
To effectively handle class imbalance and potential label noise inherent in VGI data, we utilized a Robust Hybrid Loss function. This function combines Focal Loss () and Dice Loss (). Crucially, we incorporated Label Smoothing () into the Focal Loss component. Instead of forcing the model to predict hard 0 or 1 probabilities, label smoothing adjusts the targets to 0.05 and 0.95. This regularization technique prevents the model from becoming over-confident on potentially mislabeled training examples (noisy OSM data), thereby improving generalization. The final loss is defined as
The weighting coefficients (0.7 and 0.3) were determined through empirical sensitivity testing on a validation subset. This specific ratio proved optimal for prioritizing the focal loss—which handles the severe class imbalance and hard-to-classify background nodes—while still leveraging the Dice loss to ensure structural overlap.
The model’s performance was compared against GCN and GAT architectures trained under identical conditions.
4. Results
This section presents the quantitative and qualitative results of our experiments. We evaluate the performance of our proposed UrbanGraphSAGE model, compare it against other GNN architectures, and analyze the impact of our key methodological components.
4.1. UrbanGraphSAGE Model Performance
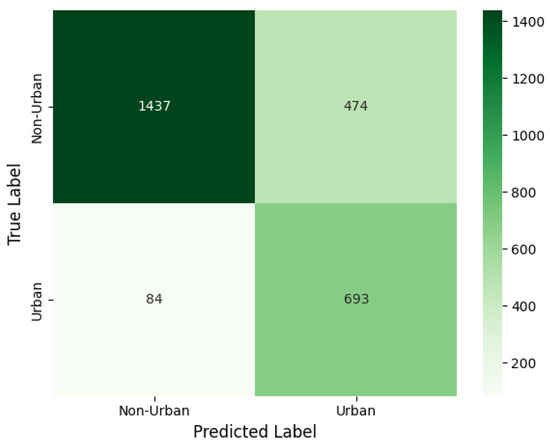
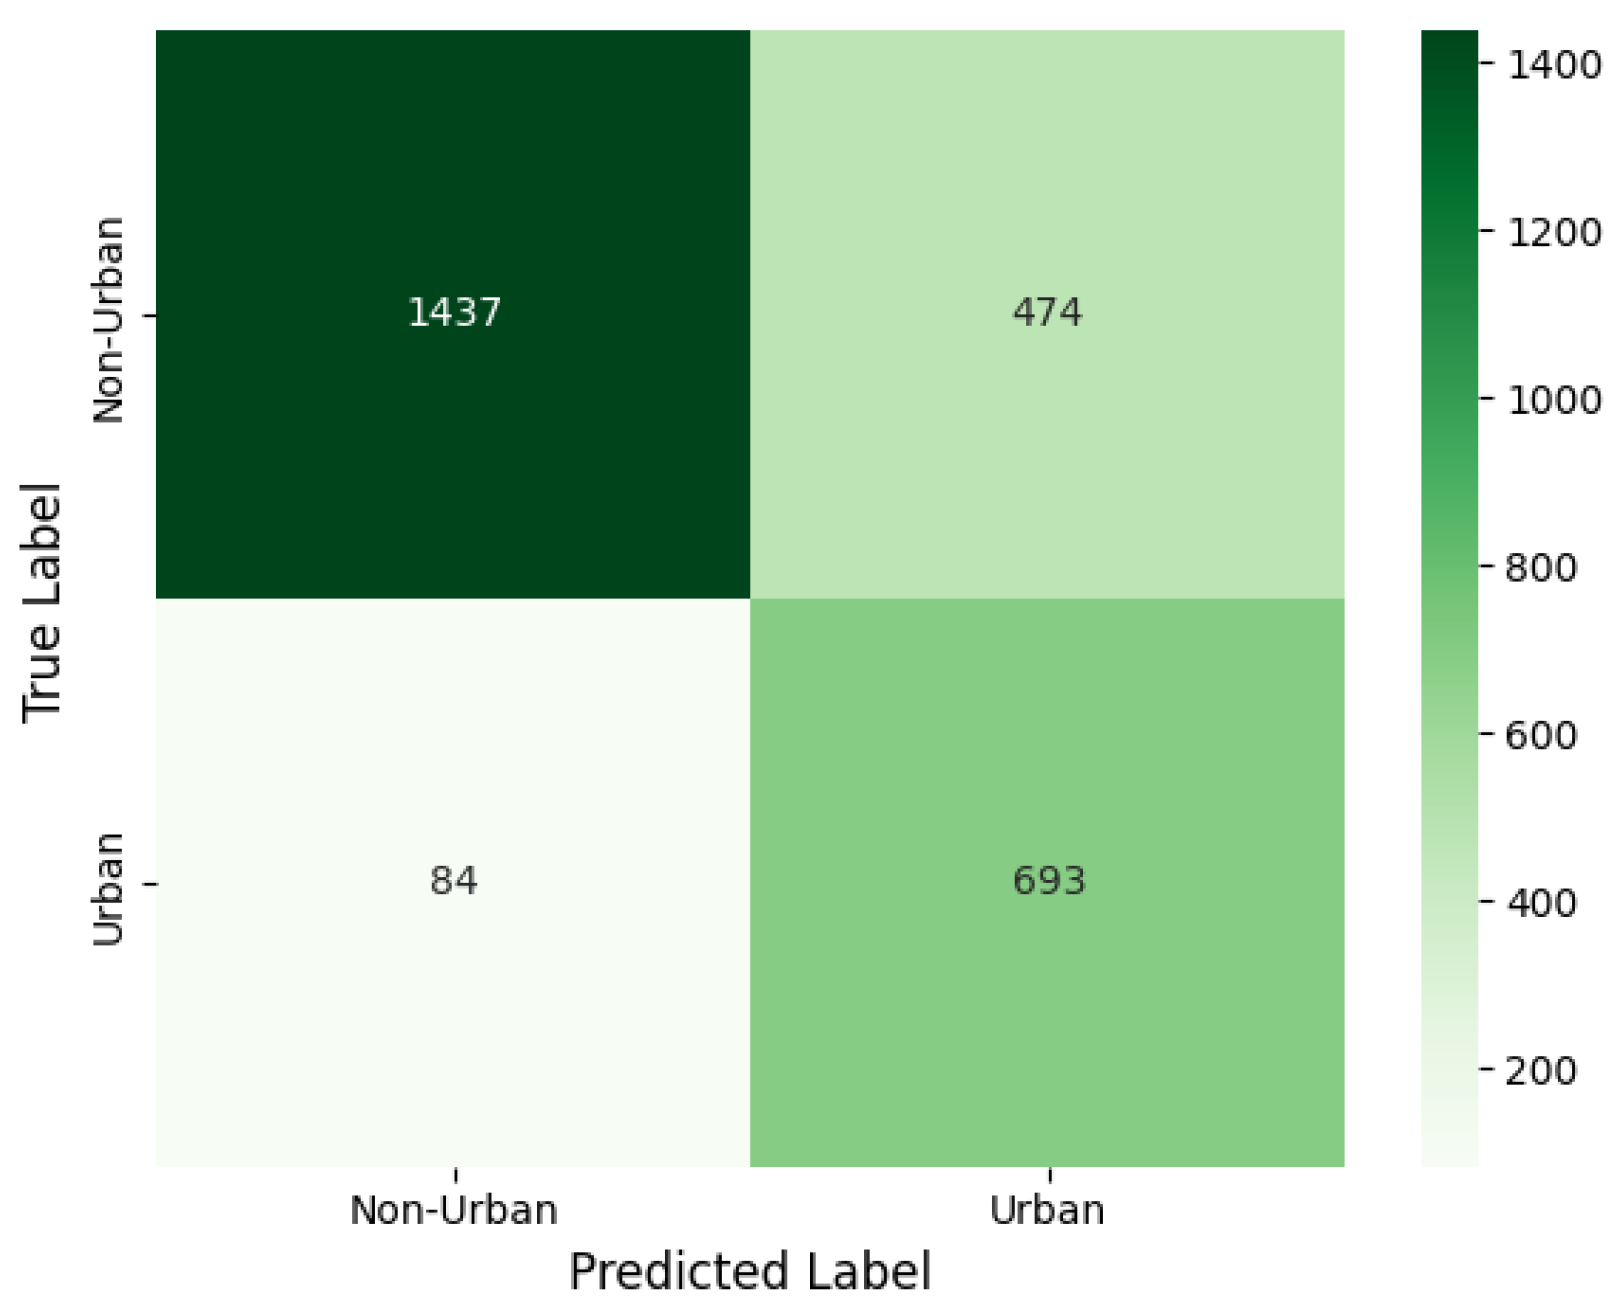
The optimized UrbanGraphSAGE model, trained on SAM-generated superpixels with the robust label-smoothed loss function, demonstrated strong performance on the held-out test set. The model achieved a Test F1-Score of 0.7131, indicating a reliable balance between precision and recall in the complex urban landscape of Algiers. A key strength of the model is its high recall of 0.8829, effectively minimizing omission errors. The detailed performance metrics are summarized in Table 1, and the confusion matrix is visualized in Figure 5. An analysis of the confusion matrix reveals a clear contrast between omission and commission errors. While the model demonstrates an excellent true positive rate (missing very few actual urban nodes, reflected in the 0.8829 recall), it struggles with false positives, misclassifying a notable portion of background nodes as buildings. Despite these commission errors, the robust training strategy successfully prevented overfitting to noisy labels, resulting in a generalized model capable of handling the broader spectral heterogeneity of the test data.
Table 1.
Performance metrics of the optimized UrbanGraphSAGE model (SAM nodes + Top-5 Features + Robust Loss) on the test set.
Figure 5.
Confusion matrix for the optimized UrbanGraphSAGE model. The model correctly identifies the vast majority of urban nodes (High Recall) while maintaining reasonable precision against complex background features.
4.2. Comparative Analysis with SOTA Baselines
To benchmark our graph-based approach, we compared it against internal GNN variants and established State-of-the-Art (SOTA) pixel-based deep learning models trained on the same data. The pixel-based baselines included U-Net (ResNet-34 backbone), LinkNet, and DeepLabV3+ (MobileNet V2 backbone).
As shown in Table 2, our optimized UrbanGraphSAGE model achieves a competitive F1-Score of 0.7131, surpassing the efficient LinkNet and DeepLabV3+ models and performing comparably to the industry-standard U-Net (0.7112). Crucially, UrbanGraphSAGE achieves this result with only 19,585 trainable parameters, compared to the 24.4 million parameters required by the ResNet-34 U-Net. This massive computational efficiency confirms that graph-based modeling, when combined with high-quality superpixels, offers a significantly leaner and structurally aware alternative to resource-heavy CNNs.
Table 2.
Comprehensive performance comparison of the proposed UrbanGraphSAGE framework against internal graph-based baselines and SOTA pixel-based methods.
In terms of operational computational cost, UrbanGraphSAGE presents a distinct trade-off compared to pixel-based models. While dense CNNs require substantial memory to process millions of pixels per batch, our GNN operates on a highly compressed representation (thousands of superpixel nodes), significantly reducing the memory footprint and forward-pass time during training. However, this efficiency in the network phase is offset by the preprocessing overhead required for SAM-based superpixel generation and graph construction. Consequently, while overall end-to-end inference times are comparable to pixel-based baselines, the graph-based approach offers distinct advantages in memory-constrained training environments.
5. Discussion
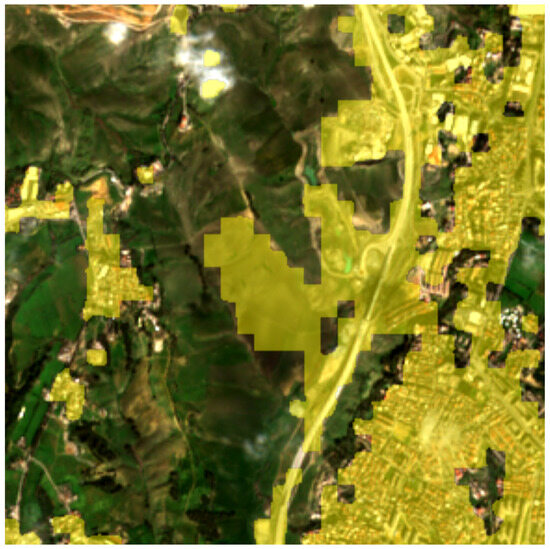
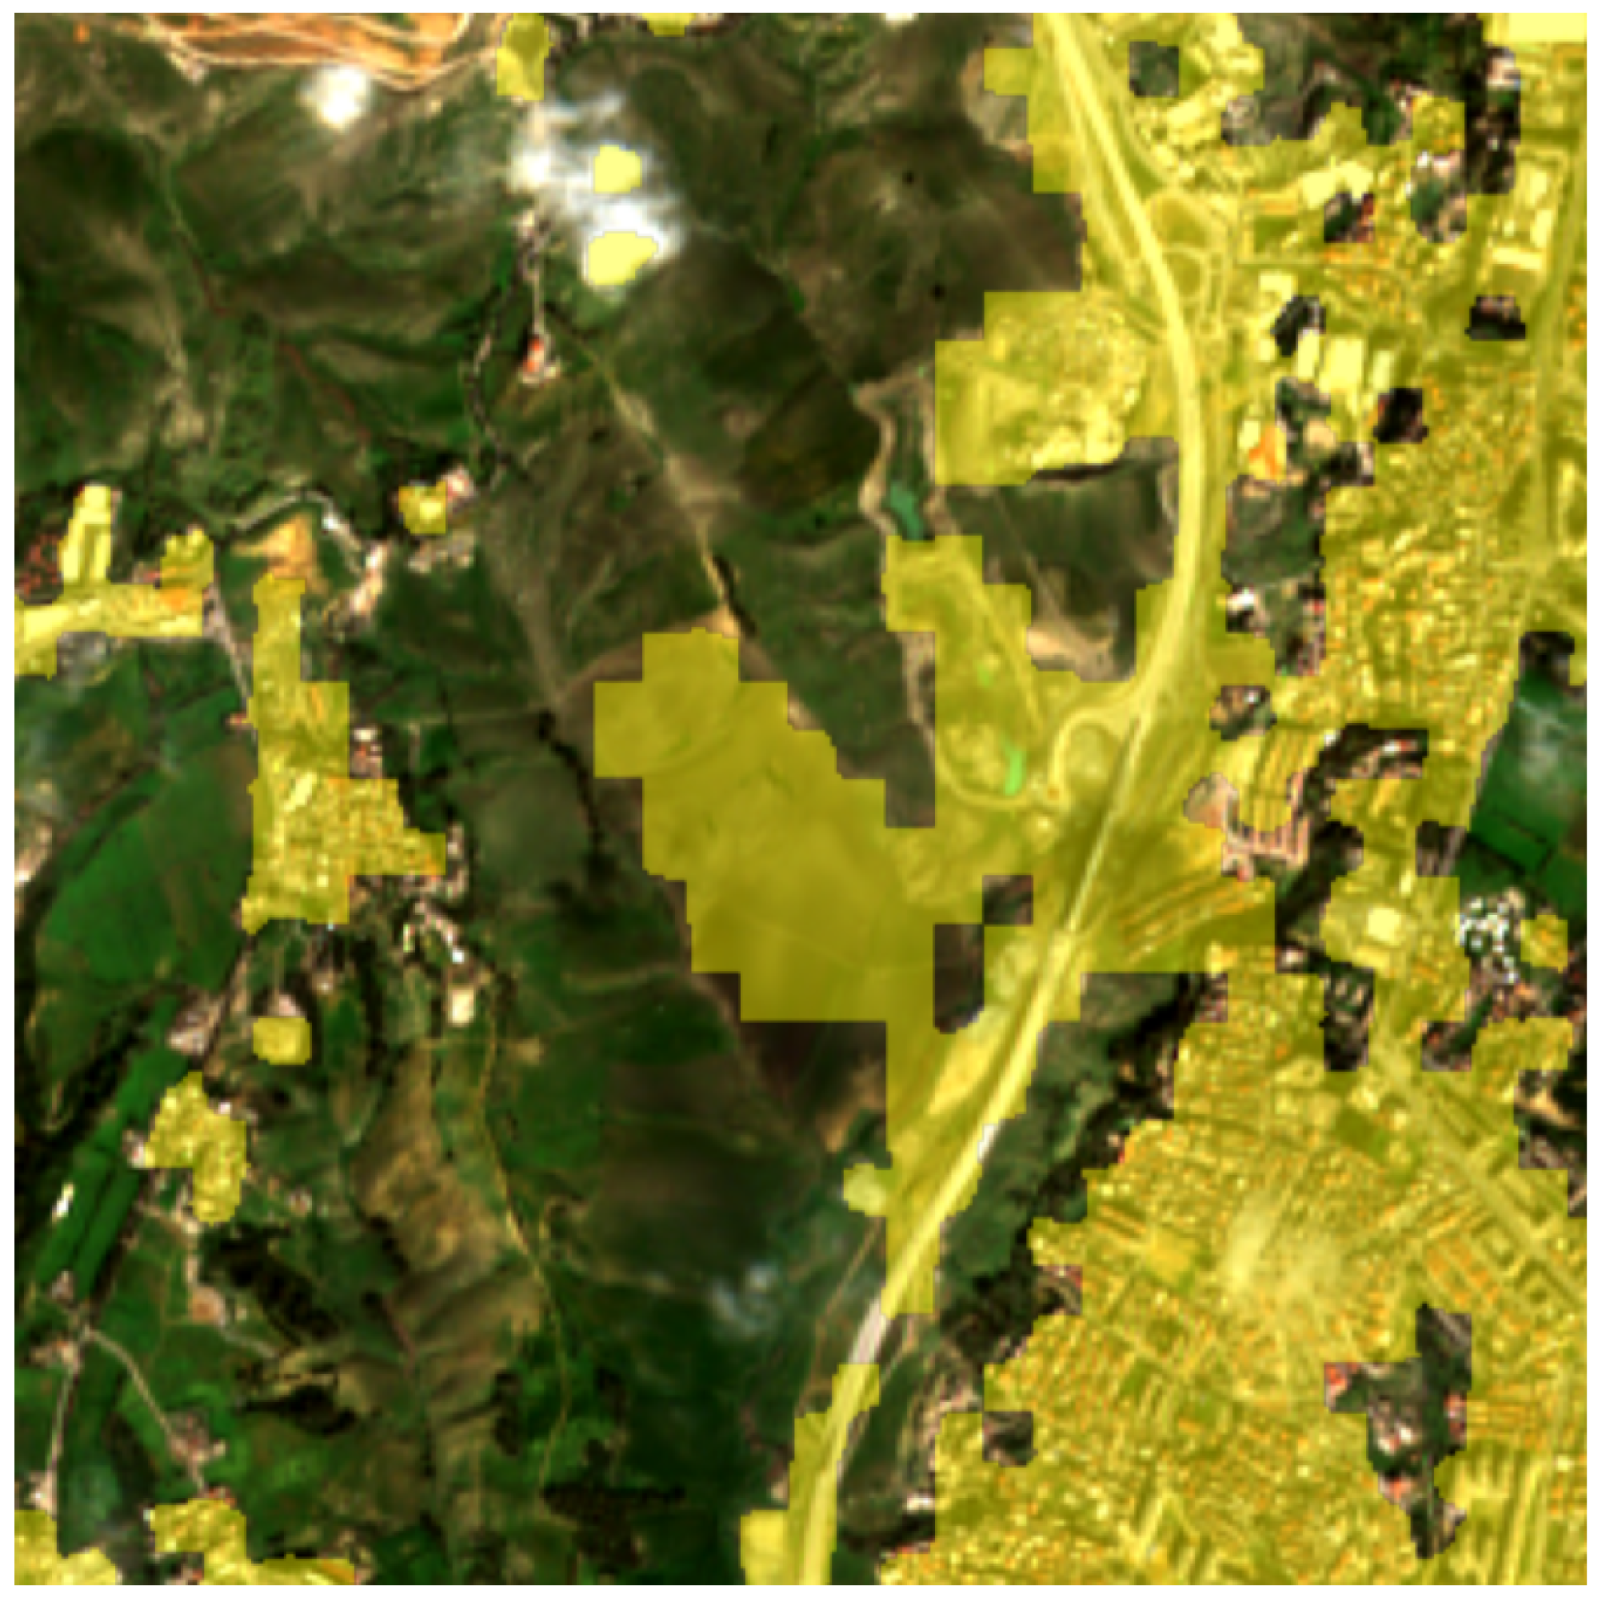
The results demonstrate the considerable efficacy of our proposed framework. The final UrbanGraphSAGE model’s high recall (0.8829) is a particularly significant outcome. This suggests the model is highly effective at minimizing omission errors, a critical attribute for applications like disaster management or creating comprehensive building inventories, where failing to detect an existing building can have severe consequences. This performance is largely attributable to our choice of a Robust Hybrid Loss function, which balances class weights and directly optimizes for segmentation overlap. The more moderate precision (0.5981) reflects this higher rate of false positives, highlighting the persistent challenge of spectral confusion in medium-resolution imagery. A deeper analysis of these commission errors reveals that they primarily occur in areas with bare soil, rocky outcrops, or paved non-building impervious surfaces (such as large parking lots or urban plazas). In the specific context of Algiers, many buildings feature flat concrete rooftops that share nearly identical reflectance values with surrounding dry, bare earth across the Sentinel-2 optical and SWIR bands (Figure 6). Furthermore, the 10 m spatial resolution frequently results in mixed pixels, causing the GNN to aggregate neighborhood features from dense urban infrastructure that closely mimic building characteristics, thereby over-predicting the building class.
Figure 6.
Qualitative example illustrating a commission error (false positive) due to spectral confusion. The model has incorrectly classified a large area of dark bare soil as ‘building’ (yellow overlay), demonstrating the primary challenge limiting the model’s precision in arid urban contexts.
Our findings strongly validate the data-centric philosophy underpinning this research. The systematic assessment of OSM data was crucial for creating a high-fidelity training set, which is foundational to a reliable model. By promoting buildings confirmed by multiple sources or by temporal NDVI analysis, we systematically addressed the severe omission noise inherent in the raw VGI, increasing the dataset completeness by over 15% (adding 11,670 verified structures). This quantitative refinement is critical, as relying solely on the incomplete raw OSM dataset would have forced the model to treat thousands of valid buildings as background noise, which severely degrades training stability and recall. Furthermore, the quantifiable improvement from spectral data augmentation (an F1-Score increase of 0.0282) underscores its importance as an effective regularization technique. It forced the model to learn features invariant to minor atmospheric and illumination changes, enhancing its generalization capabilities.
The comparative analysis of GNN architectures provides valuable insights. The similar, strong performance of UrbanGraphSAGE and GCN suggests that robust neighborhood aggregation is a highly effective mechanism for this task. The slight advantage of UrbanGraphSAGE may stem from its use of a Jumping Knowledge layer, which allows for multi-scale feature fusion and can help mitigate the over-smoothing that can occur in deeper GNNs. The significant underperformance of the GAT model suggests that while attention mechanisms are powerful, they may be less suited to the inherent noise and feature heterogeneity present in superpixel graphs derived from real-world, medium-resolution satellite imagery or may require more extensive tuning to perform optimally.
Finally, it is important to acknowledge the limitations of this study, primarily driven by the 10 m spatial resolution of Sentinel-2. This resolution inherently restricts the ability to accurately delineate very small or complex structures. Specifically, sub-pixel buildings (those occupying less than 100 m2) are inextricably merged with surrounding background features during the satellite’s imaging process. In our framework, these highly aggregated pixels are either absorbed into larger background superpixels or misclassified due to mixed spectral signatures, representing an inherent physical limitation of medium-resolution data rather than a flaw in the model architecture. While our data assessment pipeline was rigorous, it still relies on large-scale open datasets that may contain shared systematic biases. Lastly, the model was optimized for the specific urban and environmental context of Algiers; its direct application to other regions may require fine-tuning or adaptation.
6. Conclusions
This paper presented a novel framework for urban building footprint extraction, addressing the dual challenges of complex urban morphologies and inconsistent ground truth data in remote sensing applications. We successfully integrated a Graph Neural Network (GNN) architecture with a rigorous, data-centric pipeline for assessing and refining OpenStreetMap (OSM) data using multi-source cross-validation and temporal analysis.
Our results demonstrated that the proposed UrbanGraphSAGE model, trained on the curated ground truth and enhanced with spectral augmentation, can effectively and robustly extract building footprints from medium-resolution Sentinel-2 imagery. The model achieved a high recall of 0.8829 and a test F1-Score of 0.7131 in the diverse urban environment of Algiers. While the F1-Score is highly competitive with state-of-the-art pixel-based baselines like U-Net, the true advantage of our framework lies in its structural awareness and massive parameter efficiency, requiring over 1000× fewer parameters to achieve equivalent accuracy.
The primary contribution of this research is a validated, end-to-end methodology that tackles the critical bottleneck of ground truth quality. By systematically curating open data sources, our framework enables the robust application of advanced GNNs for scalable urban monitoring. This work underscores the potential of combining data-centric AI with graph-based deep learning and provides a meaningful step forward in developing more automated, accurate, and responsive systems for understanding our planet’s evolving urban landscapes.
Author Contributions
Conceptualization, A.A. and M.I.; methodology, A.A.; software, A.A.; validation, A.A. and M.E.A.L.; formal analysis, A.A.; investigation, A.A.; resources, M.I. and M.E.A.L.; data curation, A.A.; writing—original draft preparation, A.A.; writing—review and editing, M.I. and M.E.A.L.; supervision, M.I. and M.E.A.L. All authors have read and agreed to the published version of the manuscript.
Funding
This research received no external funding.
Data Availability Statement
Publicly available datasets were analyzed in this study (Sentinel-2, OpenStreetMap, Google Open Buildings). The processed graph datasets and assessed ground truth masks generated during this study are openly available on Zenodo at (accessed on 20 January 2026). https://zenodo.org/records/18310903.
Acknowledgments
This research was supported by the Algerian Space Agency (ASAL). During the preparation of this work, the authors used an AI tool (Gemini 2.5, Google) to review and refine the English language and formatting of the manuscript. After using this tool, the authors reviewed and edited the content as needed and take full responsibility for the content of the publication.
Conflicts of Interest
The authors declare no conflicts of interest.
References
- Zhu, X.X.; Tuia, D.; Mou, L.; Xia, G.S.; Zhang, L.; Xu, F.; Fraundorfer, F. Deep learning in remote sensing: A comprehensive review and list of resources. IEEE Geosci. Remote Sens. Mag. 2017, 5, 8–36. [Google Scholar] [CrossRef] [Scilit]
- Kipf, T.N.; Welling, M. Semi-supervised classification with graph convolutional networks. arXiv 2016, arXiv:1609.02907. [Google Scholar]
- Herfort, B.; Lautenbach, S.; Porto de Albuquerque, J.; Anderson, J.; Zipf, A. Investigating the digital divide in OpenStreetMap: Spatio-temporal analysis of inequalities in global urban building completeness. Int. J. Geogr. Inf. Sci. 2021, 35, 1963–1990. [Google Scholar]
- Ronneberger, O.; Fischer, P.; Brox, T. U-Net: Convolutional networks for biomedical image segmentation. In Proceedings of the Medical Image Computing and Computer-Assisted Intervention (MICCAI), Munich, Germany, 5–9 October 2015; pp. 234–241. [Google Scholar]
- Achanta, R.; Shaji, A.; Smith, K.; Lucchi, A.; Fua, P.; Süsstrunk, S. SLIC superpixels compared to state-of-the-art superpixel methods. IEEE Trans. Pattern Anal. Mach. Intell. 2012, 34, 2274–2282. [Google Scholar] [CrossRef] [Scilit] [PubMed]
- Shi, Y.; Li, Q.; Zhu, X. Building footprint extraction with graph convolutional network. arXiv 2023, arXiv:2305.04499. [Google Scholar] [CrossRef] [Scilit]
- European Space Agency. Sentinel-2 User Handbook. 2015. Available online: https://sentinels.copernicus.eu/documents/247904/685211/Sentinel-2_User_Handbook (accessed on 10 June 2025).
- Tucker, C.J. Red and photographic infrared linear combinations for monitoring vegetation. Remote Sens. Environ. 1979, 8, 127–150. [Google Scholar] [CrossRef] [Scilit]
- Zha, Y.; Gao, J.; Ni, S. Use of normalized difference built-up index in automatically mapping urban areas from TM imagery. Int. J. Remote Sens. 2003, 24, 583–594. [Google Scholar] [CrossRef] [Scilit]
- Google Research. Google Open Buildings. 2021. Available online: https://sites.research.google/open-buildings/ (accessed on 10 June 2025).
- Overture Maps Foundation. Overture Maps Data. 2023. Available online: https://overturemaps.org/ (accessed on 10 June 2025).
- Kirillov, A.; Mintun, E.; Ravi, N.; Mao, H.; Rolland, C.; Gustafson, L.; Xiao, T.; Whitehead, S.; Berg, A.C.; Lo, W.Y.; et al. Segment Anything. In Proceedings of the IEEE/CVF International Conference on Computer Vision (ICCV), Paris, France, 4–6 October 2023; pp. 4015–4026. [Google Scholar]
- Xu, K.; Li, C.; Tian, Y.; Sonobe, T.; Kawarabayashi, K.; Jegelka, S. Representation learning on graphs with jumping knowledge networks. In Proceedings of the International Conference on Machine Learning (ICML), Stockholm, Sweden, 10–15 July 2018; pp. 5453–5462. [Google Scholar]
- Loshchilov, I.; Hutter, F. Decoupled weight decay regularization. In Proceedings of the International Conference on Learning Representations (ICLR), New Orleans, LA, USA, 6–9 May 2019. [Google Scholar]

Disclaimer/Publisher’s Note: The statements, opinions and data contained in all publications are solely those of the individual author(s) and contributor(s) and not of MDPI and/or the editor(s). MDPI and/or the editor(s) disclaim responsibility for any injury to people or property resulting from any ideas, methods, instructions or products referred to in the content. |
© 2026 by the authors. Licensee MDPI, Basel, Switzerland. This article is an open access article distributed under the terms and conditions of the Creative Commons Attribution (CC BY) license.