


Abstract
Existing origin-destination (OD) forecasting models struggle to jointly capture local topology and global flow patterns in urban mobility. Therefore, we developed a multi-view spatio-temporal network (MVSTN), a novel dual-branch spatio-temporal model that integrates a graph convolutional network-based local spatial relationship module for static and dynamic graph modeling, and a self-attention-based global similarity module for learning latent mobility similarities. MVSTN achieves superior performance on multiple real-world datasets, particularly in long-term forecasts, highlighting its practical value for intelligent transportation systems.
1. Introduction
With rapid urbanization, city traffic systems have grown increasingly complex and unpredictable [1]. Forecasting transportation demand between regions is vital for improving mobility and optimizing limited resources. The origin-destination (OD) matrix, which records trip volumes between regions, is a key tool for understanding traffic flows [2].
OD forecasting faces the following challenges.
- Complex spatio-temporal dependenciesTraffic flows are influenced by factors such as station layout, inter-station distance, and unexpected events, leading to non-linear and highly dynamic patterns that static models struggle to capture [2,3].
- 2.
- Insufficient modeling of dynamic flow relationshipsExisting methods often fail to effectively capture evolving inter-regional dependencies and the impact of real-time external factors such as weather or accidents, limiting their responsiveness [3].
- 3.
- Poor integration of static and dynamic featuresMany approaches treat static (e.g., road structure) and dynamic (e.g., flow data) features separately, missing the opportunity to jointly model them, which reduces flexibility and predictive accuracy in real-world scenarios.
To address these challenges, we developed a multi-view spatio-temporal network (MVSTN) that combines graph convolutional networks (GCNs) [4] and self-attention [5]. GCNs capture local spatial structure from static and dynamic graphs, while self-attention models global flow patterns. Together, they enable accurate, adaptable OD forecasting. Using MVSTN, we modeled static and dynamic spatial graphs and designed a flow similarity block using self-attention to capture latent flow patterns. MVSTN was validated on three real-world datasets, where it consistently outperforms state-of-the-art methods across various forecasting scenarios.
2. Related Work
Related studies on OD matrix forecasting are grouped into traditional methods, deep learning models, and memory updating approaches. Traditional methods, such as regression [6] and Bayesian estimation [7], offer simplicity and interpretability but struggle to model the non-linear, spatio-temporal nature of traffic flows. Deep learning models, including convolutional neural networks and long short-term memory networks [2,8], enhance temporal and spatial learning, while graph-based approaches, including GCNs [4], improve spatial representation. However, these models often face scalability and efficiency issues. Memory updating approaches aim to capture real-time changes through memory mechanisms and evolving graphs, with recent methods such as CDOD [9] showing improved adaptability. The developed MVSTN combines multi-view GCNs and self-attention to effectively model both static and dynamic spatial features, achieving more accurate and responsive OD predictions.
Construction of Graphs
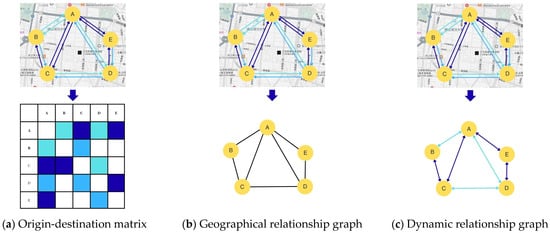
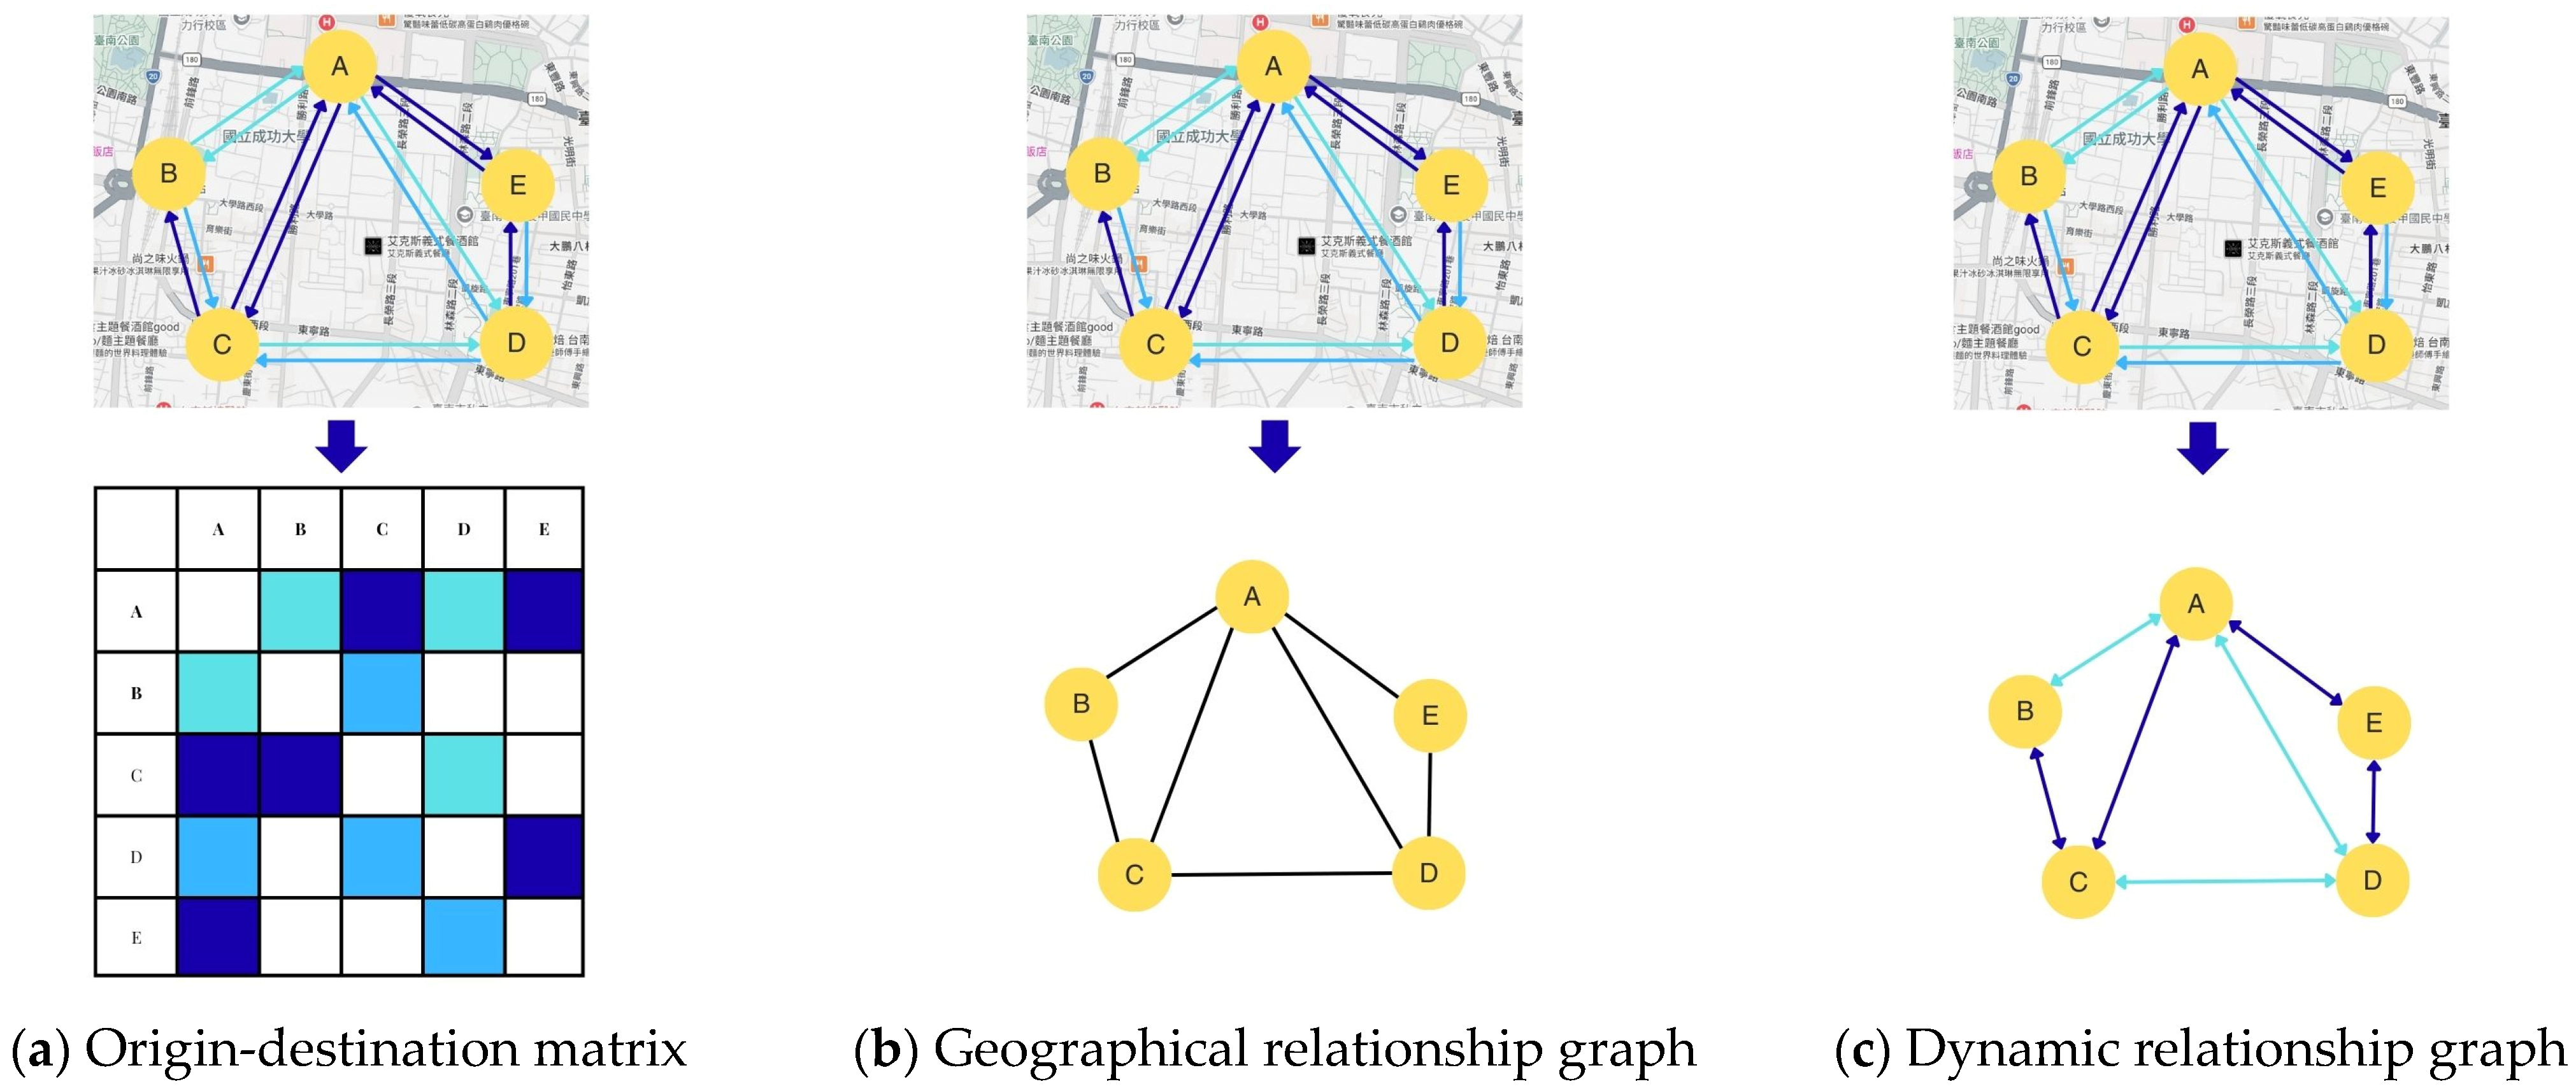
Figure 1 illustrates the concepts and graph structures used in MVSTN. Each node corresponds to a traffic region, such as a station or administrative area. The OD matrix captures traffic flow between nodes during a given time interval.
Figure 1.
Origin-destination matrix and graph construction. The arrows in the upper figure represent the directional traffic flow, where the color intensity indicates different flow magnitudes. Figures (a–c) in the lower panel show the results transformed into an OD matrix, a geographical relationship graph, and a dynamic relationship graph, respectively.
To model spatial and dynamic relationships, we construct two types of graphs.
- The geographical relationship graph [10] shows how areas are connected based on the road network. This is a static graph where nearby regions are linked.
- A dynamic relationship graph represents traffic flow patterns between regions. This graph is built from OD flow data and reflects the similarity and interaction strength between regions over time.
We predicted future OD matrices. Given past OD data, geographic information, dynamic relationships, and external factors like weather, our goal is to accurately forecast the OD matrix for the next time intervals.
3. Methodology
3.1. Model Architecture
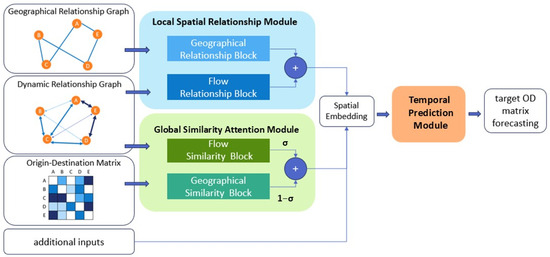
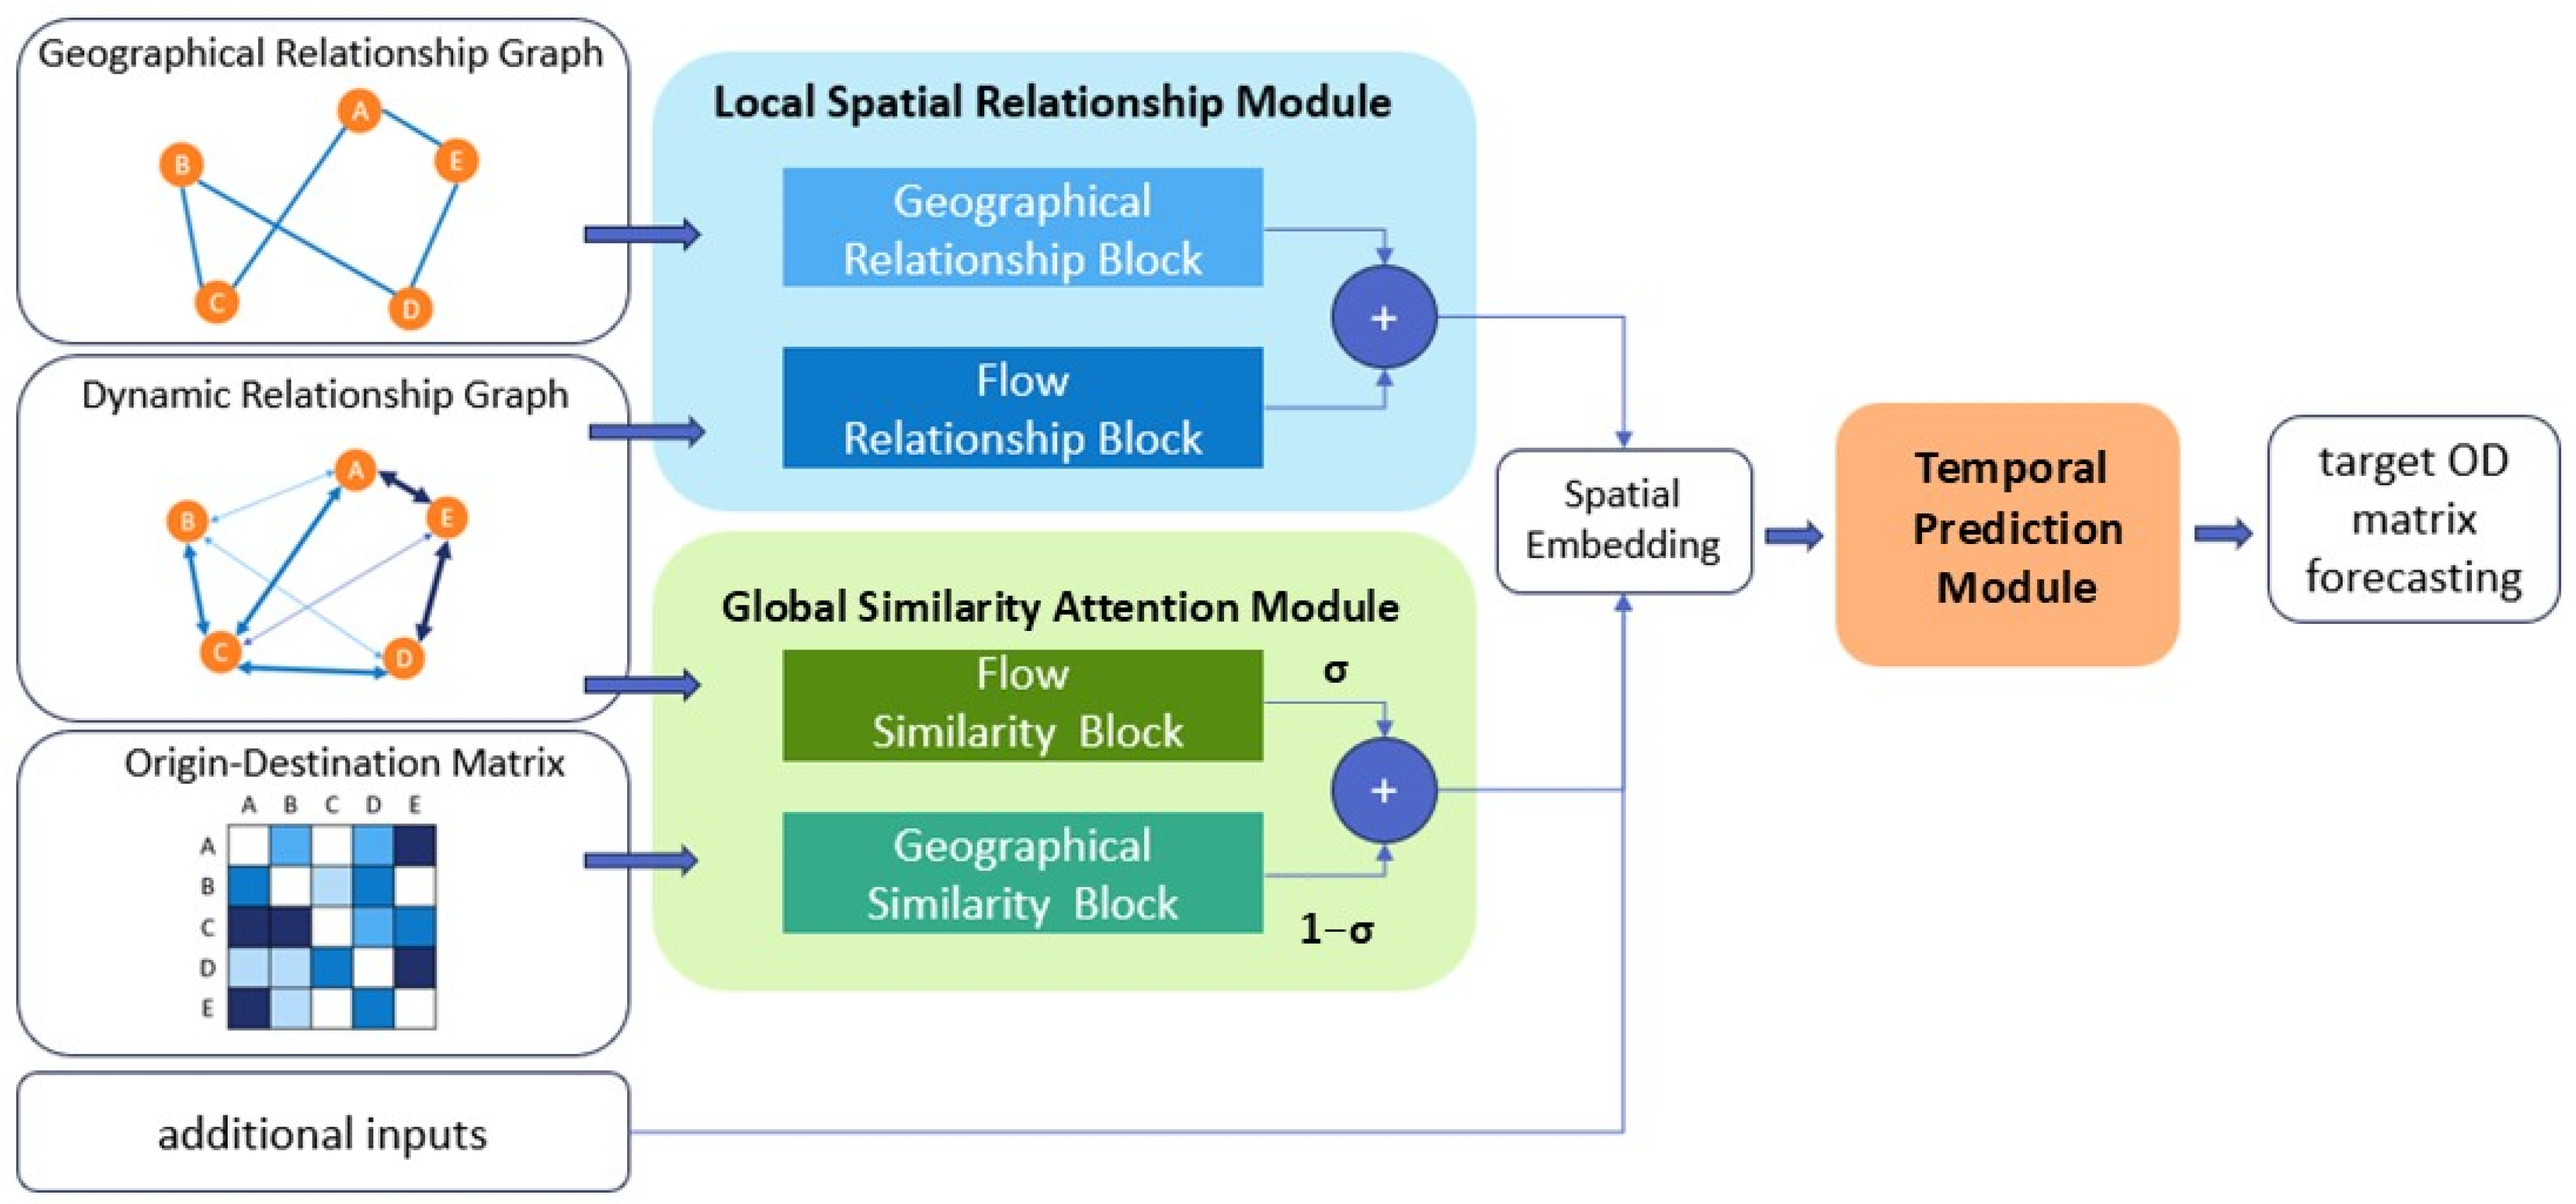
As shown in Figure 2, the MVSTN framework first processes the OD matrix and related graphs through two spatial modules. The local spatial relationship module uses GCNs to capture local correlations from the geographic and dynamic relationship graphs. In parallel, the global similarity attention module applies a self-attention mechanism to the OD matrix and dynamic relationship graph, capturing broader spatial dependencies and temporal variations. The resulting spatial features are then passed to a two-layer gated recurrent unit (GRU) network, which models temporal patterns and predicts future OD matrices. By combining these components, MVSTN effectively captures complex spatio-temporal relationships for accurate and robust OD forecasting.
Figure 2.
Architecture of the MVSTN framework.
3.1.1. Local Spatial Relationship Module
The local spatial relationship module focuses on capturing the localized spatial dependencies in the traffic network. It contains the following components.
- Geographical relationship block: This block applies GCNs to the geographical relationship graph, which encodes the static structure of the road network. By learning from adjacent regions, it captures the inherent spatial patterns based on geographic proximity.
- Flow relationship block: This block also uses GCNs, but processes the Dynamic Relationship Graph, which represents the real-time flow interactions between regions. By learning from dynamic flow patterns, it captures short-term variations and the evolving relationships between areas.
These two blocks extract different aspects of the spatial information—one from static connectivity and the other from dynamic flow similarity—and provide a comprehensive understanding of the traffic network’s local spatial structure.
3.1.2. Global Similarity Attention Module
The Global similarity attention module aims to capture long-range spatial dependencies and uncover hidden relationships between non-contiguous spatial units. This module consists of three main components.
- Geographical similarity block: This block applies a self-attention mechanism to the OD matrix, learning functional similarities between regions that may not be directly connected but share similar spatial or temporal patterns.
- Flow similarity block: This block uses self-attention on the Dynamic Relationship Graph to capture evolving flow-based similarities between areas, identifying hidden traffic flow patterns across the network.
- Similarity gate: To balance the contributions of the two similarity blocks, the Similarity Gate dynamically adjusts the weights of static and dynamic similarities, enhancing the model’s ability to flexibly integrate both types of features under different traffic scenarios.
The modules collectively enable the model to go beyond local connections and dynamically focus on globally relevant regions, enhancing the spatial representation of the OD forecasting task. Additional external factors, such as weather data, are incorporated alongside the outputs of the local spatial relationship and global similarity attention modules. All inputs are fused into a unified spatial representation through fully connected layers, which serve as input to the temporal attention module.
3.1.3. Temporal Attention Module
The spatial features are passed to a two-layer gated recurrent unit (GRU) framework, which models the temporal dependencies of traffic flows. The GRU encoder captures sequential patterns from historical data, while the decoder generates multi-step predictions for future time intervals. This design allows the model to learn both short-term fluctuations and long-term periodic trends in the traffic flow. After receiving the GRU decoder result, we obtain the target OD matrices by concatenating the predicted results with the target length.
4. Result and Discussion
4.1. Datasets
We experimented with three real-world datasets from different domains, covering both traffic flow and crowd mobility.
- The New York City Taxi (TaxiNYC) dataset [10] contains over 40 million taxi trips in Manhattan, aggregated into 69 zones at 30 min intervals. Data from January to June 2019 is used for training, July for validation, and August for testing.
- The New York City Bike (BikeNYC) dataset [11] includes public bike-sharing trip data collected in the same 69 zones and time range as TaxiNYC, also at 30 min resolution and with the same data split.
- The Japanese Human Trajectory (JHT) dataset [12] includes over 5 million mobility records across Japan’s 47 prefectures, with daily resolution. Data from 2020 is used for training, January 2021 for validation, and February 2021 for testing.
- For TaxiNYC and BikeNYC, we incorporate weather data [11] (e.g., temperature, Humidity, wind speed) and 23 categorical conditions. Numerical features are normalized to [0, 1], and categorical features are one-hot encoded.
4.2. Baselines
We evaluated MVSTN against a wide range of baseline models, categorized into three groups: sequence-based models, which focus on temporal patterns without modeling spatial relationships (e.g., recurrent neural networks with LSTM [13]); spatio-temporal models, which incorporate spatial and temporal dependencies using grid-based or graph-based structures (e.g., spatio-temporal graph convolutional network (STGCN) [14], Graph Enhanced Multi-scale Learning (GEML) [15], contextual spatio-temporal network (CSTN) [11], multi-path graph convolutional network (MPGCN) [16]); and dynamic graph learning models, which adaptively learn evolving spatial relationships through graph construction and message passing (e.g., origin-destination convolution recurrent network (ODCRN) [12], contextual modeling for OD prediction (CMOD) [17], cross-domain OD prediction (CDOD) [9]). These baselines cover the major modeling paradigms for OD prediction, allowing for a comprehensive evaluation of MVSTN’s effectiveness under different forecasting scenarios.
4.3. Evaluation Metrics and Experiment Settings
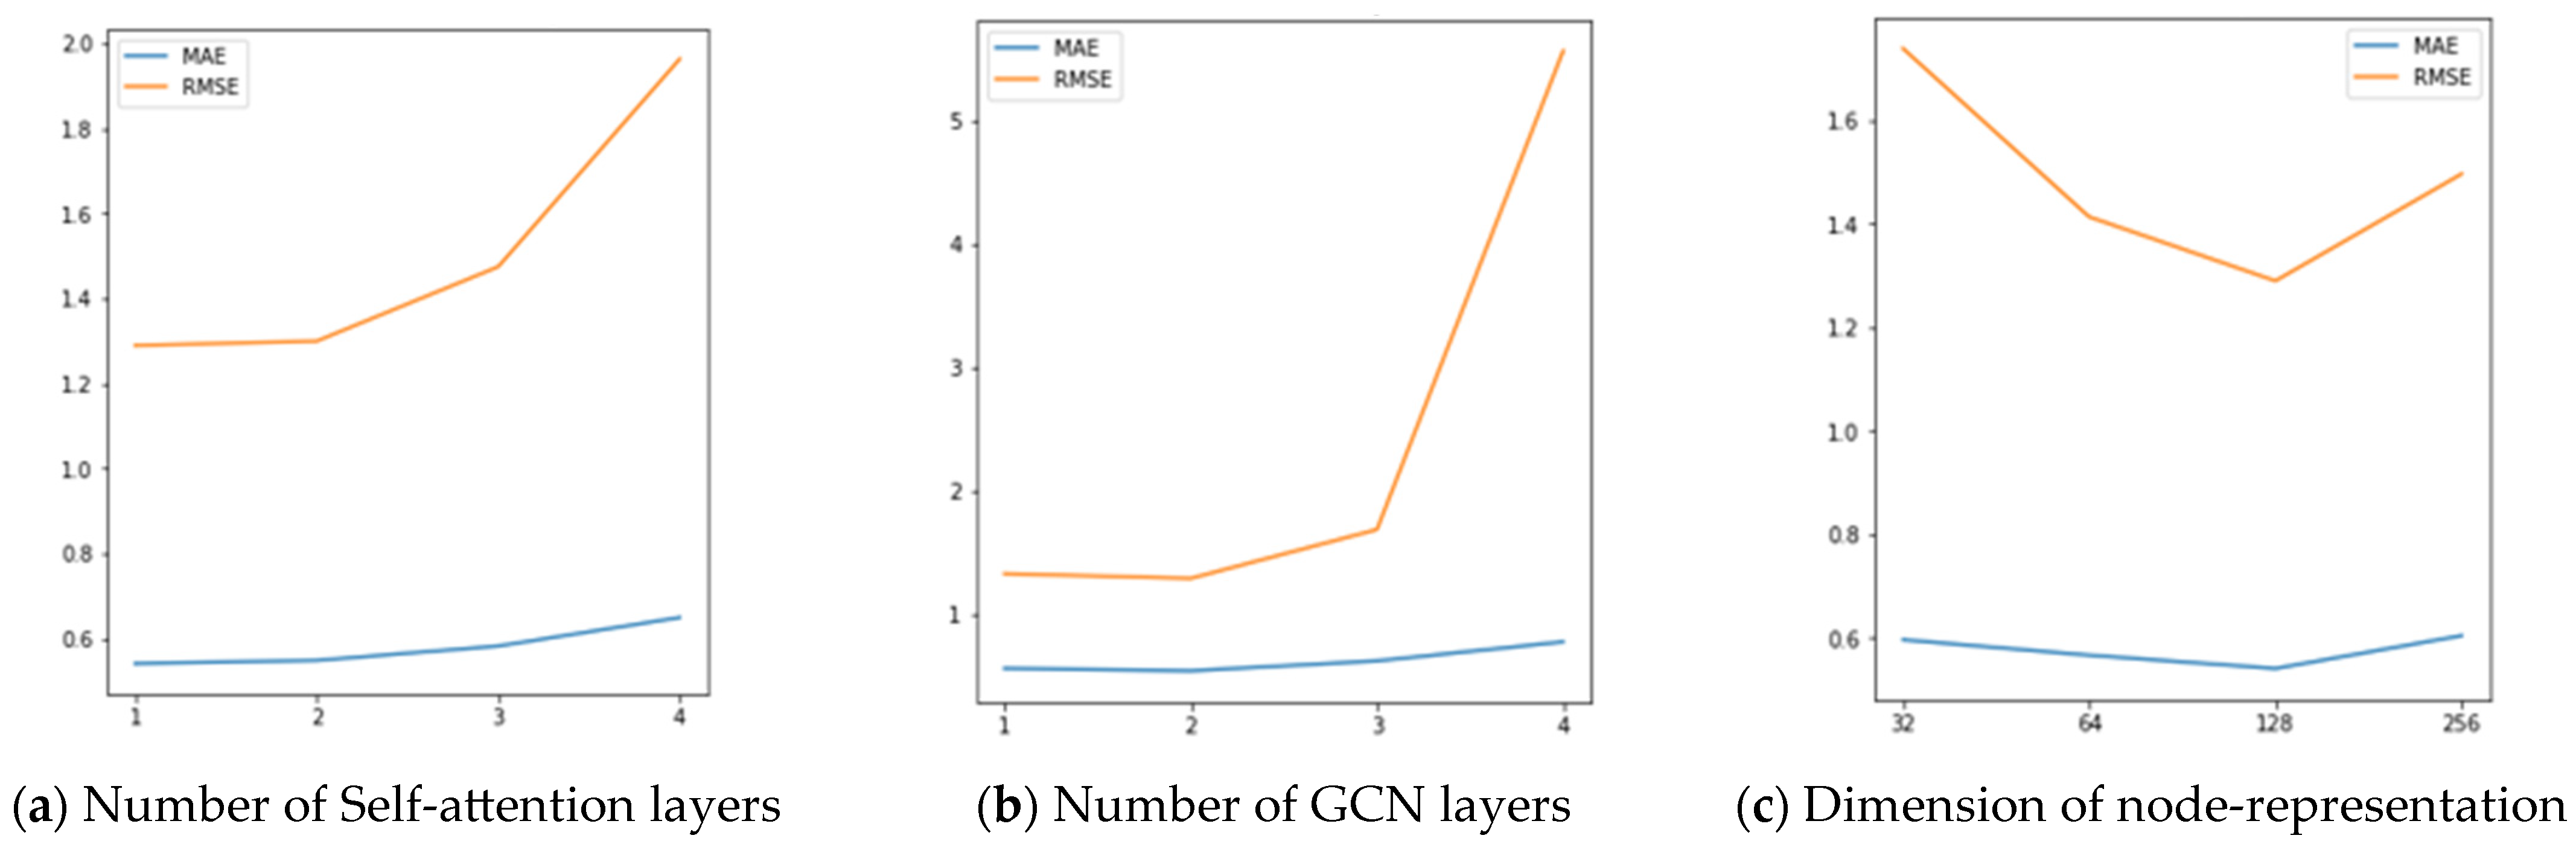
We evaluated the prediction performance using mean absolute error (MAE) and root mean square error (RMSE). These metrics measure the difference between the predicted and actual OD matrices, reflecting the overall prediction accuracy. MVSTN was executed with the following hyperparameter settings: In the model, we configured the number of GCN layers and self-attention layers to be 2. We used the Adam optimizer in this training process and set the learning rate to 1 × 10⁻³. For the feature representation, the dimension of node embeddings was set as 128. For the training operation, we set training epochs to 500 and the batch size to 64.
4.4. Performance Comparison
We evaluated the prediction performance of MVSTN against multiple baselines across different datasets and spatio-temporal scenarios. Through experiments on TaxiNYC (Table 1), BikeNYC (Table 2), and JHT (Table 3) datasets, we demonstrate that MVSTN consistently outperforms traditional models and existing spatio-temporal neural networks in both MAE and RMSE. The results highlight MVSTN’s ability to capture complex spatio-temporal patterns and its adaptability to varying data sparsity and flow dynamics. We also analyze the model’s performance under different prediction horizons and show that it maintains stable accuracy across both short-term and long-term forecasting tasks. The best performance is highlighted in bold, and the second-best performance is underlined.
Table 1.
Performance comparison on TaxiNYC dataset.
Table 2.
Performance comparison on the BikeNYC dataset.
Table 3.
Performance comparison on the JHT dataset.
4.5. Ablation Study and Hyperparameter Sensitivity Study
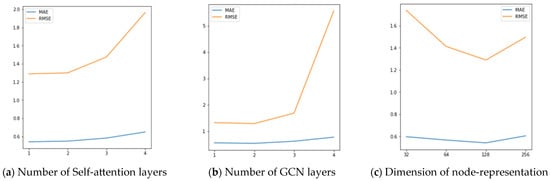
To validate the effectiveness of key components and assess model robustness, we conduct an ablation study (Table 4 and Table 5) and a hyperparameter sensitivity analysis (Figure 3). The ablation results demonstrate that both the Local Spatial Relationship Module and the Global Similarity Attention Module contribute significantly to overall performance. In particular, the dynamic relationship graph plays a crucial role in capturing dynamic flow patterns. Removing any of these modules results in a notable decline in prediction accuracy, highlighting their importance in the MVSTN framework.
Table 4.
Ablation study on short-term forecasting.
Table 5.
Ablation study on long-term forecasting.
Figure 3.
Effect of hyperparameter.
Additionally, we analyzed the impact of hyperparameters such as the number of attention heads, GCN layers, and GRU hidden dimensions. Results indicate that while increasing model capacity improves performance initially, overly complex settings may cause overfitting or diminishing returns. These analyses confirm that MVSTN’s design and parameter settings effectively balance model complexity and predictive accuracy.
5. Conclusions
We developed MVSTN for OD matrix forecasting. By integrating graph convolution and self-attention mechanisms, MVSTN effectively captures both local spatial structures and global dynamic flow patterns. Experimental results on three real-world datasets demonstrate that MVSTN achieves superior accuracy compared to existing methods, especially in scenarios with complex traffic dynamics and sparse OD data. The study highlights the importance of combining static and dynamic spatial relationships and modeling fine-grained temporal patterns for accurate transportation demand forecasting.
It is necessary to explore several extensions of MVSTN. First, we aim to improve its scalability for larger-scale urban traffic networks and longer forecasting horizons. Second, incorporating additional dynamic factors such as social events or real-time traffic incidents may further enhance the model’s adaptability. Finally, extending the MVSTN framework to other domains, such as logistics or public health mobility analysis, could broaden its applicability beyond urban transportation forecasting.
Author Contributions
Conceptualization, Y.-A.C.; methodology, Y.-A.C. and B.-Y.Z.; software, Y.-A.C. and B.-Y.Z.; validation, Y.-A.C. and B.-Y.Z.; formal analysis, Y.-A.C. and B.-Y.Z.; investigation, B.-Y.Z., Y.-A.C., S.-H.Y. and D.H.; resources, B.-Y.Z.; data curation, Y.-A.C. and B.-Y.Z.; writing—original draft preparation, B.-Y.Z., Y.-A.C., S.-H.Y. and D.H.; writing—review and editing, B.-Y.Z., Y.-A.C., S.-H.Y., D.H. and H.-P.H.; visualization, B.-Y.Z.; supervision, H.-P.H. and F.L.; project administration, B.-Y.Z. and H.-P.H.; funding acquisition, H.-P.H. All authors have read and agreed to the published version of the manuscript.
Funding
This research was funded by the National Science and Technology Council (NSTC) of Taiwan under grants 112-2221-E-006-150-MY3 and 114-2628-E-006-005-MY3.
Institutional Review Board Statement
Not applicable.
Informed Consent Statement
Not applicable.
Data Availability Statement
The original data presented in the study are openly available in TaxiNYC: https://www.kaggle.com/competitions/new-york-city-taxi-fare-prediction, accessed on 30 July 2024. BikeNYC: https://citibikenyc.com/system-data, accessed on 30 July 2024. JHT: https://github.com/deepkashiwa20/ODCRN, accessed on 30 July 2024.
Conflicts of Interest
The authors declare no conflicts of interest.
References
- Zhang, Y.; Li, B.; Qian, S. Ridesharing and digital resilience for urban anomalies: Evidence from the New York City taxi market. Inf. Syst. Res. 2023, 34, 1775–1790. [Google Scholar] [CrossRef] [Scilit]
- Peng, D.; Huang, M.; Xing, Z. Taxi origin and destination demand prediction based on deep learning: A review. Digit. Transp. Saf. 2023, 2, 176–189. [Google Scholar] [CrossRef] [Scilit]
- Wang, Y.; Currim, F.; Ram, S. Deep learning of spatiotemporal patterns for urban mobility prediction using big data. Inf. Syst. Res. 2022, 33, 579–598. [Google Scholar] [CrossRef] [Scilit]
- Kipf, T.N.; Welling, M. Semi-Supervised Classification with Graph Convolutional Networks. arXiv 2016, arXiv:1609.02907. [Google Scholar]
- Vaswani, A.; Shazeer, N.; Parmar, N.; Uszkoreit, J.; Jones, L.; Gomez, A.N.; Kaiser, Ł.; Polosukhin, I. Attention is All You Need. arXiv 2017, arXiv:1706.03762. [Google Scholar]
- Williams, B.M.; Hoel, L.A. Modeling and forecasting vehicular traffic flow as a seasonal ARIMA process: Theoretical basis and empirical results. J. Transp. Eng. 2003, 129, 664–672. [Google Scholar] [CrossRef] [Scilit]
- Fei, X.; Lu, C.-C.; Liu, K. A Bayesian dynamic linear model approach for real-time short-term freeway travel time prediction. Transp. Res. Part C Emerg. Technol. 2011, 19, 1306–1318. [Google Scholar] [CrossRef] [Scilit]
- Cao, P.; Dai, F.; Liu, G.; Yang, J.; Huang, B. A survey of traffic prediction based on deep neural network: Data, methods and challenges. In Cloud Computing; Khosravi, M.R., He, Q., Dai, H., Eds.; Springer International Publishing: Cham, Switzerland, 2022; pp. 17–29. [Google Scholar] [CrossRef] [Scilit]
- Xu, Y.; Han, L.; Zhu, T.; Sun, L.; Du, B.; Lv, W. Continuous-Time and Discrete-Time Representation Learning for Origin-Destination Demand Prediction. IEEE Trans. Intell. Transp. Syst. 2024, 25, 2382–2393. [Google Scholar] [CrossRef] [Scilit]
- Wang, C.; Wang, L.; Wei, S.; Sun, Y.; Liu, B.; Yan, L. STN-GCN: Spatial and Temporal Normalization Graph Convolutional Neural Networks for Traffic Flow Forecasting. Electronics 2023, 12, 3158. [Google Scholar] [CrossRef] [Scilit]
- Liu, L.; Qiu, Z.; Li, G.; Wang, Q.; Ouyang, W.; Lin, L. Contextualized Spatial–Temporal Network for Taxi Origin-Destination Demand Prediction. IEEE Trans. Intell. Transp. Syst. 2019, 20, 3875–3887. [Google Scholar] [CrossRef] [Scilit]
- Jiang, R.; Wang, Z.; Cai, Z.; Yang, C.; Fan, Z.; Xia, T.; Matsubara, G.; Mizuseki, H.; Song, X.; Shibasaki, R. Countrywide Origin-Destination Matrix Prediction and Its Application for COVID-19. In Machine Learning and Knowledge Discovery in Databases. Applied Data Science Track, Proceedings of the European Conference on Machine Learning and Principles and Practice of Knowledge Discovery in Databases (ECML PKDD 2021), Bilbao, Spain, 13–17 September 2021; Springer: Cham, Switzerland, 2021; Volume 12978, pp. 319–334. [Google Scholar] [CrossRef] [Scilit]
- Hochreiter, S.; Schmidhuber, J. Long short-term memory. Neural Comput. 1997, 9, 1735–1780. [Google Scholar] [CrossRef] [Scilit] [PubMed]
- Yu, B.; Yin, H.; Zhu, Z. Spatio-temporal Graph Convolutional Neural Network: A Deep Learning Framework for Traffic Forecasting. In Proceedings of the 27th International Joint Conference on Artificial Intelligence (IJCAI 2018), Stockholm, Sweden, 13–19 July 2018; pp. 3634–3640. [Google Scholar] [CrossRef] [Scilit]
- Wang, Y.; Yin, H.; Chen, H.; Wo, T.; Xu, J.; Zheng, K. Origin-Destination Matrix Prediction via Graph Convolution: A New Perspective of Passenger Demand Modeling. In Proceedings of the 25th ACM SIGKDD International Conference on Knowledge Discovery and Data Mining (KDD 2019), Anchorage, AK, USA, 4–8 August 2019; pp. 1227–1235. [Google Scholar] [CrossRef] [Scilit]
- Shi, H.; Yao, Q.; Guo, Q.; Li, Y.; Zhang, L.; Ye, J.; Li, Y.; Liu, Y. Predicting Origin-Destination Flow via Multi-Perspective Graph Convolutional Network. In Proceedings of the IEEE 36th International Conference on Data Engineering (ICDE 2020), Dallas, TX, USA, 20–24 April 2020; pp. 1818–1821. [Google Scholar] [CrossRef] [Scilit]
- Han, L.; Ma, X.; Sun, L.; Du, B.; Fu, Y.; Lv, W.; Xiong, H. Continuous-Time and Multi-Level Graph Representation Learning for Origin-Destination Demand Prediction. In Proceedings of the 28th ACM SIGKDD International Conference on Knowledge Discovery and Data Mining (KDD 2022), Washington DC, USA, 14–18 August 2022; pp. 516–524. [Google Scholar] [CrossRef] [Scilit]

Disclaimer/Publisher’s Note: The statements, opinions and data contained in all publications are solely those of the individual author(s) and contributor(s) and not of MDPI and/or the editor(s). MDPI and/or the editor(s) disclaim responsibility for any injury to people or property resulting from any ideas, methods, instructions or products referred to in the content. |
© 2026 by the authors. Licensee MDPI, Basel, Switzerland. This article is an open access article distributed under the terms and conditions of the Creative Commons Attribution (CC BY) license.