


Abstract
The tilt angle of photovoltaic (PV) modules strongly influences long-term energy yield, land-use efficiency, and the resulting cost of power generation, particularly under diverse climatic conditions. This study presents a systematic framework for optimizing the monthly tilt angle of PV modules with the objective of minimizing power cost while maintaining high energy output. The proposed methodology integrates solar geometry, monthly global and diffuse irradiance data, shading-constrained array layout, land-use modeling, and economic evaluation to determine location-specific optimal tilt configurations. Unlike conventional fixed-tilt or energy-only optimization approaches, the proposed framework explicitly incorporates inter-row shading constraints and land-use efficiency into power-cost-based tilt optimization. The framework was applied to multiple geographically distinct locations across Pakistan, representing different climatic regions. The results show that power cost is highly sensitive to tilt angle and exhibits a clear minimum at moderate inclinations. For Lahore and Islamabad, the average annual power cost at a 0° tilt angle was 4.3475 $/kW and 4.4128 $/kW, respectively, decreasing to 3.3596 $/kW and 3.266 $/kW at a 40° tilt angle, before increasing to 7.6390 $/kW and 6.5197 $/kW at 90°. For RYK and Karachi, the cost declined from 3.309 $/kW and 2.8189 $/kW at 0° to 2.7138 $/kW and 2.4707 $/kW at a 30° tilt angle, before rising sharply at steeper inclinations. Overall, the study confirms that monthly or seasonally adjusted tilt angles provide a superior balance between energy generation and power cost compared with fixed-tilt systems, enabling location-specific and cost-effective PV system design for large-scale deployment in Pakistan.
1. Introduction
The electrical output of photovoltaic (PV) modules is governed by a combination of environmental and operational factors, including incident solar radiation (SR), ambient temperature, relative humidity, wind speed, and surface soiling caused by dust accumulation [1,2]. Among these parameters, the inclination or tilt angle of PV modules plays a central role in determining the amount of solar radiation intercepted over daily, seasonal, and annual cycles. The optimal tilt angle (OTA) defines the angular position of a PV module with respect to the horizontal plane and directly influences long-term energy yield [3,4]. The OTA is not a fixed quantity and varies with geographical latitude, solar geometry, and prevailing meteorological conditions. Although dual-axis or single-axis solar tracking systems can continuously adjust the tilt angle in real time, their high capital and maintenance costs make them economically unattractive for most large-scale and utility-scale PV installations. Consequently, commercial PV plants commonly operate with a fixed annual tilt angle or, at best, a limited number of seasonal adjustments [5,6].
In addition to tilt angle, the performance and economic viability of photovoltaic (PV) systems are influenced by a range of environmental, operational, and financial parameters. Module operating temperature plays a critical role in determining conversion efficiency, as increased cell temperature reduces the open-circuit voltage and overall power output due to the negative temperature coefficient of semiconductor materials. In hot climatic regions, elevated module temperatures can significantly decrease annual energy yield. Surface soiling caused by dust deposition and suspended particulate matter further degrades system performance by reducing transmittance and limiting effective irradiance absorption, particularly in arid and semi-arid environments [2]. Wind speed may partially offset thermal losses by enhancing convective cooling, thereby moderating temperature-induced efficiency degradation. Over long operational lifetimes, module performance degradation also contributes to a gradual decline in energy production, directly affecting techno-economic metrics such as levelized cost of energy (LCOE) [7]. At the system level, inverter efficiency, wiring losses, mismatch losses, and availability factors must also be considered when estimating realistic annual output. From an economic perspective, capital investment cost, operation and maintenance (O&M) expenditure, land acquisition cost, financing structure, and discount rate significantly influence cost-per-unit-power and LCOE calculations [8]. Although these parameters collectively determine overall system performance, the present study specifically investigates tilt-angle-induced geometric effects, particularly inter-row shading constraints and land-use efficiency, which simultaneously influence energy capture and installed power cost in large-scale PV installations.
A substantial body of the literature has investigated methods for determining OTA using analytical and empirical formulations [1,9,10]. In the Gulf Cooperation Council region, OTA values were estimated using geographical coordinates and subsequently validated against PVWatts simulations, with results indicating that monthly tilt adjustments could enhance annual energy output by approximately 10.9% [11]. A related study across multiple cities in Saudi Arabia reported that revising tilt angles six times per year allows the system to capture nearly 99.5% of the available solar radiation [12]. In China, monthly, seasonal, and annual OTA values were computed for different climatic zones using long-term meteorological datasets, revealing that the annual OTA closely tracks site latitude [13]. Further investigations demonstrated that OTA values across Chinese regions range from approximately 14.5° to 49.1° [14]. Other studies have extended OTA analysis to include economic considerations, showing that optimized tilt configurations can simultaneously increase energy yield and reduce generation costs [15].
The levelized cost of energy (LCOE) has emerged as a widely adopted techno-economic indicator for evaluating and comparing the cost-effectiveness of power generation technologies. It expresses the average cost per unit of electricity generated over a system’s operational lifetime, incorporating capital expenditure, operation and maintenance (O&M) costs, and energy production [16,17]. Despite its limitations—including simplified treatment of project-specific factors, sensitivity to uncertain future inputs, and assumptions regarding financing and degradation rates [18,19]—LCOE remains a standard metric for assessing both conventional power plants (e.g., nuclear and thermal systems) and renewable energy technologies such as PV, wind, and hydropower.
Several studies have refined LCOE estimation for PV systems by incorporating degradation effects, grid-parity considerations, and integration costs associated with balancing and infrastructure requirements [20,21,22]. Comprehensive LCOE frameworks now account for investment cost, O&M expenditure, performance degradation, and uncertainty in future system behavior [8]. Parametric analyses have further examined the influence of system price, discount rate, tax policy, and capacity factor on LCOE outcomes [23], as well as the impact of PV module degradation over long operational periods [7]. Applications of LCOE have also been extended to prosumer-based energy systems [24] and distributed generation planning frameworks. Using stochastic modeling approaches, previous research reported LCOE values for commercial PV systems in the range of 10–18 cents/kWh [25]. Long-term performance assessments of grid-connected PV installations have shown annual generation of approximately 16,700 MWh with corresponding LCOE values close to 0.109 USD/kWh [26].
Against this background, the present study focuses on monthly optimization of the tilt angle of PV modules with the objective of minimizing installed power cost while maintaining or enhancing energy yield. The proposed optimization framework integrates key physical, geographical, and economic variables, including site latitude and longitude, monthly global and diffuse horizontal irradiance (GHI and DHI), solar declination and azimuth angles, module tilt and altitude angles, average daylight duration, available land area, module efficiency, inter-module spacing, and overall PV system cost. Temporal variations in these parameters over the annual cycle are explicitly considered.
In addition, a new analytical expression is developed to relate the number of PV modules to the effective land area required after accounting for spacing constraints imposed by shading avoidance. To examine the influence of latitude and regional climate on system performance, geographically distinct locations representing major climatic regions of Pakistan are selected. This allows a systematic assessment of how monthly tilt optimization affects energy generation, land utilization, and installed power cost under diverse climatic conditions.
Scientific Contribution of This Study
While previous studies have primarily determined optimal tilt angles based on maximizing annual or seasonal solar radiation, such approaches often overlook the economic consequences of tilt-induced spacing requirements and land-use efficiency. In practical utility-scale PV installations, tilt angle selection influences not only radiation interception but also inter-row shading distance, module packing density, and total installed capacity within a given land area. Therefore, the tilt angle that maximizes energy yield does not necessarily minimize installed power cost. The present study advances the existing literature by explicitly coupling geometric shading constraints and land-utilization effects with economic performance evaluation. By shifting the optimization objective from energy maximization to cost minimization, the proposed framework provides a more realistic design criterion for large-scale PV systems where land availability and capital investment significantly impact economic feasibility.
2. Methodology
2.1. Optimal Tilt Angle Calculation
The optimal tilt angle (OTA) of the PV modules was determined using standard solar geometry relationships. These equations [1,17], as presented in Table 1, describe the apparent position of the sun and the resulting solar radiation incident on an inclined surface.
Table 1.
Equation for the calculation of the optimal tilt angle [1,17].
2.2. Photovoltaic Array Sizing
The sizing of the PV array is based on the total number of modules connected in series and parallel to form the complete system. The total number of PV modules, (), is initially expressed as using Equation (10) [17]:
To determine the number of PV modules that can be installed within a square land area (A) at a specified tilt angle (β), spacing constraints imposed by shading avoidance were incorporated. The total number of modules is obtained using Equations (11) and (12) [17]:
2.3. Monthly Energy Generation and Average Power
The average output power of the PV array is determined using the module efficiency (), the monthly electrical energy production (), the average daily daylight duration (), and the number of days in the selected month () is calculated using Equation (13) [17]:
2.4. Assessment of Power Cost
Power cost, () represents the monetary value of one unit of installed power capacity and is expressed in USD/kW. It is calculated using the total PV system cost (), the number of installed modules (), and the average output power () is calculated using Equation (14) [17].
2.5. Computational Framework
The computational procedure adopted in this study integrates solar geometry, irradiance modeling, PV array layout, and economic evaluation to estimate monthly energy generation, average output power, and power cost. The overall methodology is conceptually adapted from the optimization framework proposed by Tamoor et al. [17], with modifications introduced to emphasize power-cost-based performance assessment. The optimization outcomes are primarily governed by the selected tilt angle, geographical location, month of the year, PV system investment cost, module efficiency, and available land area. For each selected site and month, the geographical coordinates and calendar date are first used to compute key solar parameters, including daylight duration, global horizontal irradiance (GHI), diffuse horizontal irradiance (DHI), declination angle, and solar azimuth angle. These parameters, together with the selected tilt angle and the corresponding solar altitude angle, are then employed to determine the total solar radiation incident on the inclined PV surface.
The tilt angle, solar altitude angle, and azimuth angle are subsequently utilized to estimate the minimum permissible spacing between adjacent PV module rows in order to prevent inter-row shading and the associated loss of power output. This spacing constraint is incorporated into the land-use model to determine the effective area available for module installation at each tilt configuration. Monthly electrical energy generation is calculated using the total radiation incident on the tilted surface, together with module efficiency and daylight duration. Based on this energy yield, the average output power of the PV array is evaluated for each month.
The maximum number of PV modules that can be installed within the designated land area is then computed using the optimized tilt angle, the minimum spacing requirement, and the available ground area. Using the resulting module count and the corresponding average output power, the power cost is determined from the total PV system investment cost. This integrated framework enables a consistent assessment of how monthly tilt-angle variation influences energy yield, land utilization, average output power, and power cost for different geographical locations.
3. Results and Discussion
3.1. Optimal Tilt Angle and Power Cost for Multiple Locations
This section examines the effect of photovoltaic (PV) module tilt angle (TA) on the power cost of PV systems installed at different locations across Pakistan, together with the associated variation in output power. Four representative cities were selected to capture the climatic diversity of the central, southern, northern, and coastal regions of the country, namely Lahore, Rahim Yar Khan (RYK), Islamabad, and Karachi. Pakistan covers a wide latitudinal range and exhibits substantial spatial variation in climatic conditions, including differences in ambient temperature, humidity, and solar resource availability. Lahore and Faisalabad are characterized by hot and humid conditions, RYK experiences a warm and relatively dry climate, while Islamabad generally exhibits more moderate temperatures. Karachi, located along the southern coastline, benefits from relatively stable solar availability throughout the year. These contrasting climatic characteristics allow a systematic assessment of how tilt-angle variation influences power cost under diverse environmental conditions.
3.1.1. Lahore
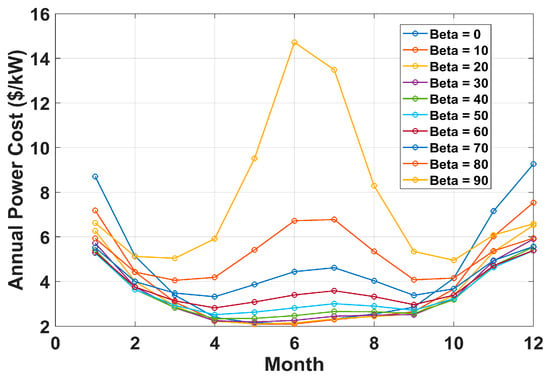
The annual variation in power cost with tilt angle for Lahore is illustrated in Figure 1 for tilt angles ranging from 0° to 90°. The results show that power cost increases at extreme tilt angles, particularly during summer months for steep inclinations and during winter months for shallow inclinations. During winter (January and December), power cost is highest at low tilt angles and decreases steadily as the tilt angle increases up to approximately 50°, after which a slight increase is observed at steeper angles. For example, in January, the power cost decreases from about 8.71 $/kW at 0° to approximately 5.28 $/kW at 50°, before rising again to around 6.62 $/kW at 90°. A similar trend is observed in December, where the cost drops from roughly 9.26 $/kW at 0° to about 5.38 $/kW at 50°.
Figure 1.
Annual variation in power cost as a function of tilt angle for Lahore.
In summer months, the minimum power cost occurs at relatively low tilt angles. In June, the cost reaches a minimum of approximately 2.10 $/kW near a tilt angle of 10°, after which it increases sharply, exceeding 14 $/kW at 90°. July exhibits a comparable trend, with the minimum cost again occurring near 10°. On an annual basis, Lahore shows a gradual increase in power cost beyond moderate tilt angles. The lowest annual power cost of approximately 2.10 $/kW occurs near 10°, while values rise steadily beyond 40° and become excessively high at very steep tilt angles.
3.1.2. Rahim Yar Khan
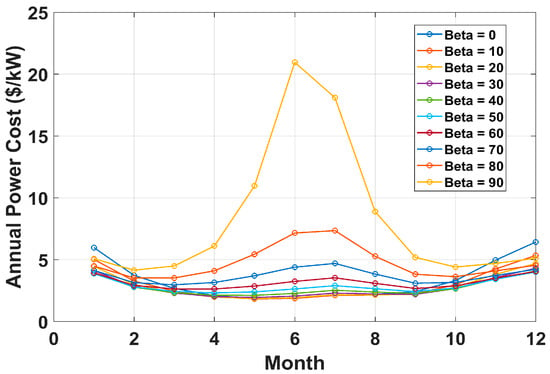
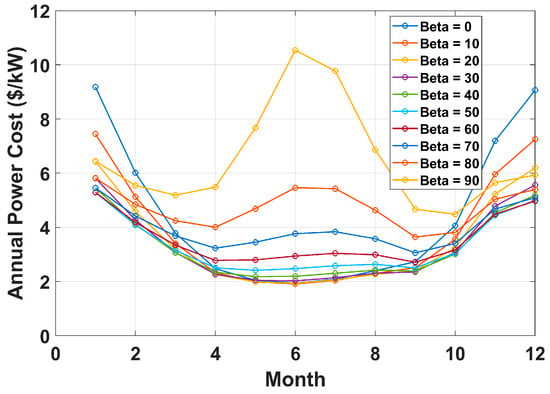
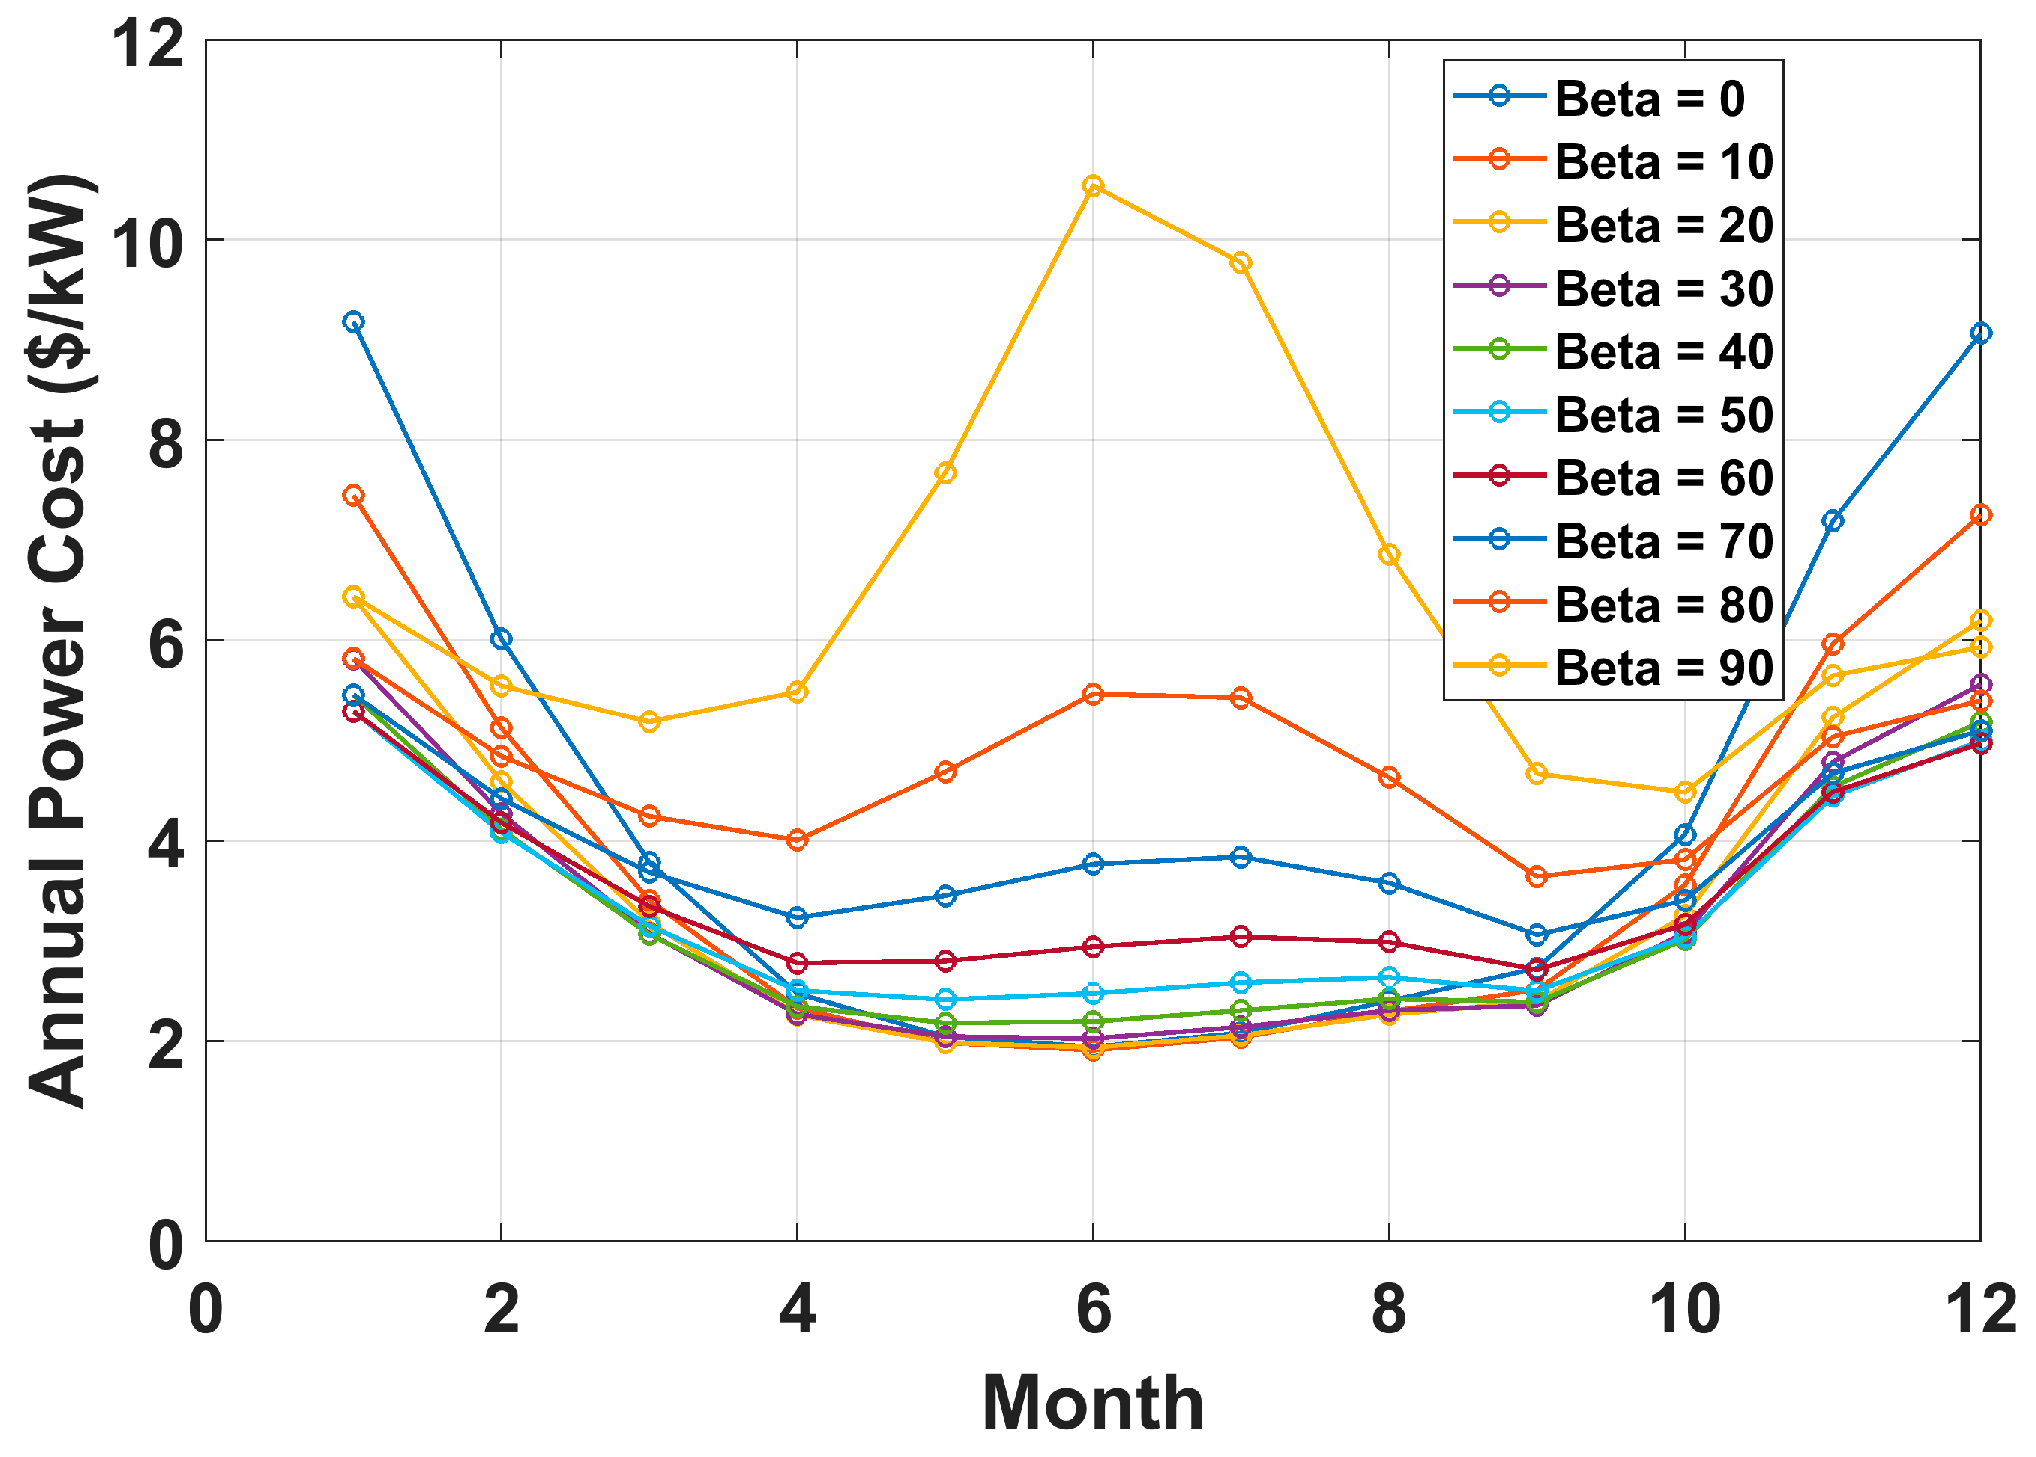
The variation in annual power cost with tilt angle for RYK is presented in Figure 2. Similar to Lahore, the power cost in RYK increases at extreme tilt angles and reaches its minimum at low to moderate inclinations. In winter months, increasing the tilt angle from 0° to about 50° leads to a noticeable reduction in power cost. For instance, in January, the cost declines from approximately 5.99 $/kW at 0° to around 3.88 $/kW at 50°, followed by a slight increase at steeper angles. A comparable pattern is observed in December.
Figure 2.
Annual variation in power cost as a function of tilt angle for RYK.
In summer, the minimum power cost occurs at low tilt angles. In May, the cost reaches a minimum of approximately 1.83 $/kW at a tilt angle close to 10°, before increasing rapidly to values exceeding 10 $/kW at 90°. July shows a similar trend, with the minimum cost again occurring near 10°. On an annual basis, RYK exhibits the lowest power cost at a tilt angle in the range of approximately 10–20°, with values close to 1.87 $/kW. Beyond this range, the cost increases steadily and becomes extremely high at steep inclinations.
3.1.3. Islamabad
Figure 3 illustrates the variation in annual power cost with tilt angle for Islamabad. As observed for the other cities, extreme tilt angles lead to significantly higher power costs. In winter months, increasing the tilt angle from 0° to approximately 50° results in a consistent reduction in power cost. For example, in January, the cost declines from around 9.18 $/kW at 0° to about 5.29 $/kW at 50°, before rising again at higher tilt angles. November follows a similar trend. In summer, the minimum power cost occurs at relatively low tilt angles. In May, the cost reaches a minimum of approximately 1.98 $/kW near 10°, while in July, a comparable minimum of about 2.04 $/kW is observed at the same inclination. On an annual basis, Islamabad exhibits its minimum power cost near 10–20°, with values close to 1.91–1.94 $/kW. Beyond 40°, the power cost increases steadily, reaching values above 10 $/kW at 90°.
Figure 3.
Annual variation in power cost as a function of tilt angle for Islamabad.
3.1.4. Karachi
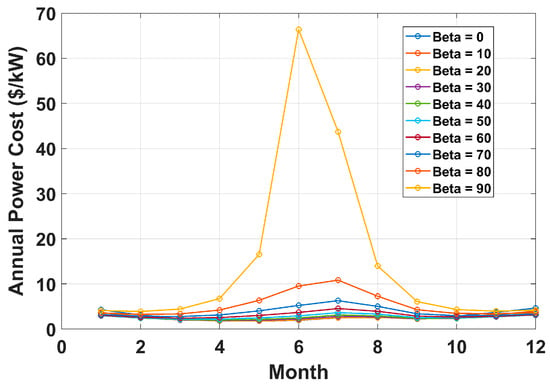
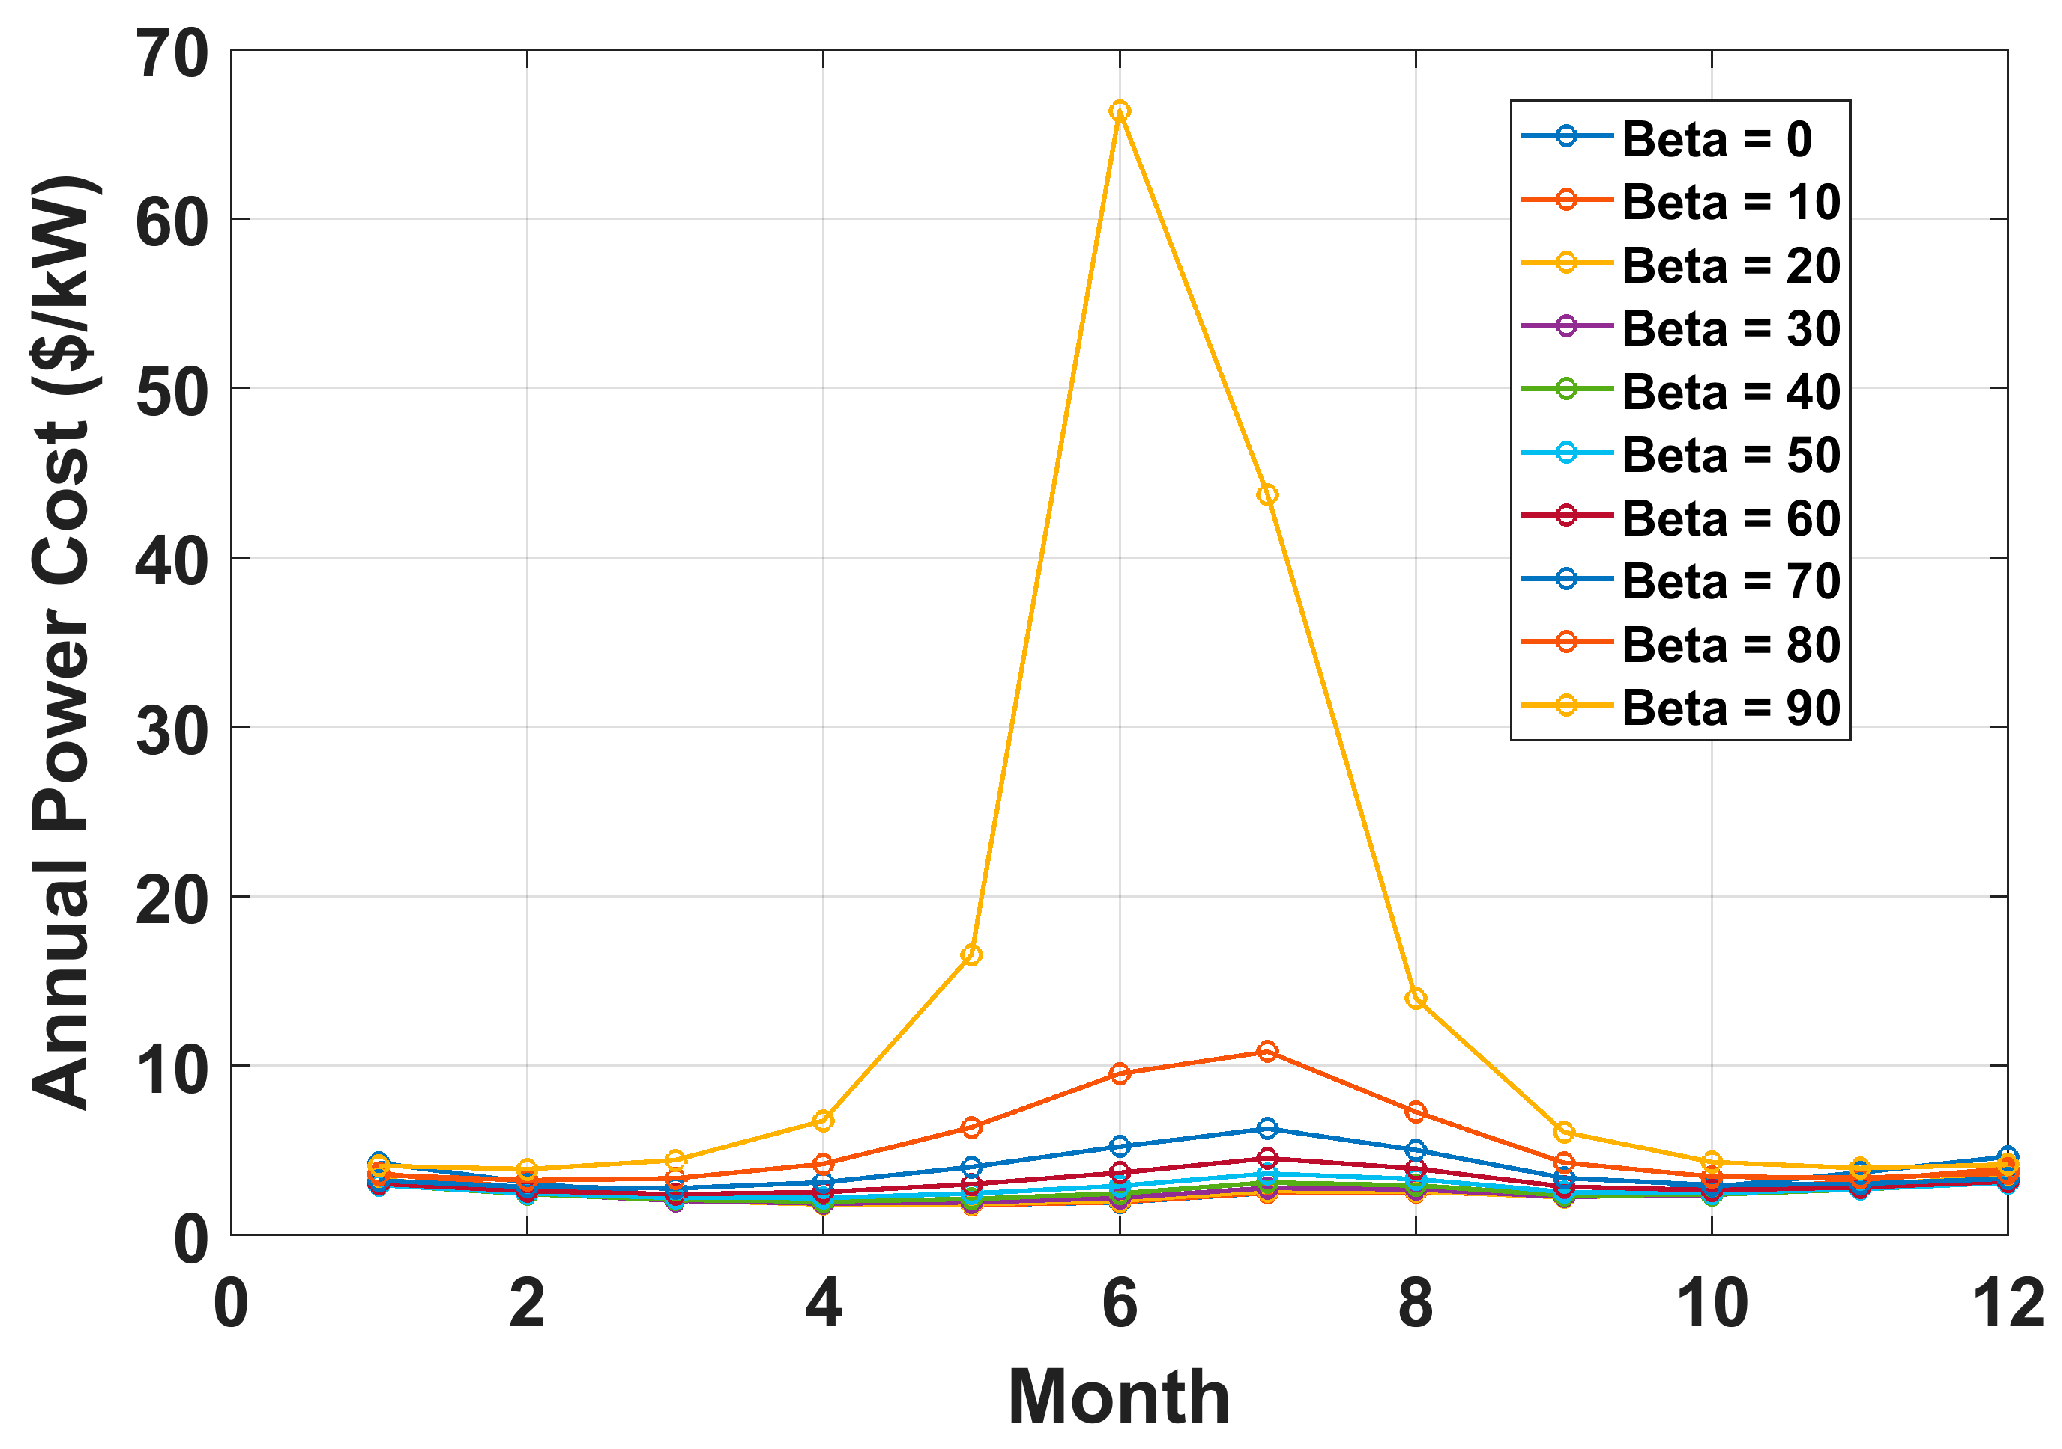
The annual power cost trends for Karachi are shown in Figure 4. Compared with inland cities, Karachi exhibits lower overall power costs at moderate tilt angles due to its relatively high and stable solar availability. In winter months, increasing the tilt angle from 0° to about 40–50° results in a reduction in power cost. For example, in January, the cost decreases from approximately 4.25 $/kW at 0° to around 2.95 $/kW at 50°. November shows a similar decreasing trend. In summer, the minimum power cost again occurs at low tilt angles. In May, the cost reaches a minimum of about 1.77 $/kW near 10°, after which it increases rapidly, exceeding 16 $/kW at 90°. July displays an even steeper increase at high tilt angles, with power cost exceeding 40 $/kW at 90°. On an annual basis, Karachi exhibits its minimum power cost near 10–20°, with values around 1.93–2.03 $/kW. These results indicate that low and moderate tilt angles provide the most favorable balance between energy generation and installation efficiency, whereas steep tilt angles are economically unattractive due to sharply reduced energy yield.
Figure 4.
Annual variation in power cost as a function of tilt angle for Karachi.
3.1.5. Comparative Analysis of Average Annual Power Cost
A comparative assessment of the average annual power cost for the selected cities reveals clear regional differences in optimal tilt angles. For Lahore and Islamabad, the average annual power cost at a 0° tilt angle is approximately 4.35 $/kW and 4.41 $/kW, respectively. In both cities, the cost decreases to a minimum near 40°, reaching approximately 3.36 $/kW for Lahore and 3.27 $/kW for Islamabad. Beyond this point, the power cost increases steadily and exceeds approximately 6.5–7.6 $/kW at 90°.
For RYK and Karachi, the minimum average annual power cost occurs at lower tilt angles. In RYK, the cost decreases from about 3.31 $/kW at 0° to approximately 2.71 $/kW near 30°, before increasing to over 8.18 $/kW at 90°. Karachi shows a similar trend, with the cost decreasing from about 2.82 $/kW at 0° to approximately 2.47 $/kW near 30°, followed by a sharp increase to nearly 9.85 $/kW at 90°. Overall, these results confirm that moderate tilt angles yield the lowest power cost across all locations. Northern cities favor slightly higher tilt angles, whereas southern cities achieve minimum cost at lower inclinations. Very steep tilt angles are consistently associated with high power costs due to substantial reductions in annual energy yield.
3.1.6. Relationship Between Energy-Maximizing and Cost-Minimizing Tilt Angles
The results reveal that the tilt angle corresponding to maximum annual energy generation does not necessarily coincide with the tilt angle that minimizes installed power cost. While increasing tilt angle may improve winter radiation interception, it simultaneously increases the projected module height and required inter-row spacing to prevent shading. Greater spacing reduces module packing density within a fixed land area, thereby decreasing total installed capacity and increasing cost per unit of installed power. Conversely, very low tilt angles allow higher module density but may reduce seasonal energy capture. The optimal economic configuration, therefore, results from balancing radiation efficiency and land-use efficiency. This finding highlights the importance of integrating geometric and economic constraints into tilt-angle optimization for large-scale PV systems.
3.1.7. Sensitivity of Power Cost to Land-Use Constraints
Power cost exhibits strong sensitivity to tilt-angle variation primarily due to its influence on row spacing and land utilization efficiency. As the tilt angle increases, the required inter-row distance increases to avoid shading during low solar altitude periods. This reduces the number of modules that can be installed within a fixed land area, thereby lowering total installed capacity. Since system investment cost does not decrease proportionally with module reduction, the cost per unit installed power increases significantly at steep tilt angles. This geometric constraint explains the sharp cost escalation observed beyond moderate inclinations across all studied locations. These findings confirm that land-use efficiency is a critical determinant of economically optimal tilt configuration.
3.2. Applicability and Universality of the Proposed Framework
The proposed tilt-angle optimization framework is inherently generalizable and is not geographically restricted to the climatic conditions of Pakistan. The methodology is constructed upon fundamental solar geometry relationships—including declination angle, hour angle, zenith angle, and solar altitude—together with irradiance transposition models, shading-constrained inter-row spacing formulations, and techno-economic cost evaluation equations. Since these governing relationships are physics-based and independent of region-specific empirical assumptions, the framework remains valid for any geographical location provided that accurate local input data are available.
The model requires standard PV design inputs, including site-specific geographical coordinates (latitude and longitude), long-term meteorological datasets such as GHI, DHI, ambient temperature, daylight duration, land availability constraints, module specifications, and economic parameters such as capital investment, O&M cost, and discount rate. Because these parameters are universally employed in photovoltaic system planning, the computational procedure can be directly transferred to other regions without structural modification of the optimization algorithm.
The framework is adaptable to diverse climatic conditions. In high-latitude regions with low solar altitude angles and pronounced seasonal variability, the method captures the increased sensitivity of tilt angle to winter radiation interception and row-spacing requirements. In desert climates characterized by high irradiance and significant soiling effects, region-specific meteorological and performance correction factors can be incorporated. Similarly, in tropical environments with elevated diffuse radiation fractions, irradiance decomposition can be adjusted using locally calibrated models. Future validation using internationally recognized databases such as NASA-SSE, Meteonorm, or PVGIS, along with uncertainty quantification approaches, would further strengthen the global robustness and transferability of the proposed optimization framework.
4. Conclusions
This study presented a practical and systematic framework for optimizing the tilt angle (TA) of photovoltaic (PV) modules with the objective of improving system performance and reducing power cost. The proposed approach consists of two main stages. In the first stage, the optimal tilt angle (OTA) for each month is identified by maximizing the expected energy yield. In the second stage, the corresponding monthly tilt configurations are evaluated in terms of their influence on long-term system performance and power cost. To capture regional climatic diversity, multiple locations representing the central, southern, northern, eastern, and western regions of Pakistan were considered. The average annual power cost was evaluated for tilt angles ranging from 0° to 90° in increments of 10° for each selected city. For Lahore and Islamabad, the average annual power cost at a 0° tilt angle was approximately 4.35 $/kW and 4.41 $/kW, respectively. In both cities, the power cost decreased to a minimum near a tilt angle of 40°, reaching approximately 3.36 $/kW for Lahore and 3.27 $/kW for Islamabad, before increasing steadily to about 7.64 $/kW and 6.52 $/kW at 90°.
For RYK and Karachi, the minimum average annual power cost occurred at lower tilt angles. In RYK, the power cost declined from approximately 3.31 $/kW at 0° to about 2.71 $/kW near 30° and then increased to over 8.18 $/kW at 90°. Karachi exhibited a similar pattern, with the cost decreasing from roughly 2.82 $/kW at 0° to approximately 2.47 $/kW near 30°, followed by a sharp rise to nearly 10.85 $/kW at 90°. The corresponding annual average output power also showed a strong dependence on tilt angle. At a 0° tilt angle, the average output power for Lahore, RYK, Islamabad, and Karachi was approximately 993.19 kW, 1192.5 kW, 1016.7 kW, and 1276.5 kW, respectively. When the tilt angle was increased to 90°, the output power dropped substantially to about 272.0 kW for Lahore, 301.21 kW for RYK, 292.65 kW for Islamabad, and 299.38 kW for Karachi. These results clearly indicate that extreme tilt angles lead to significant reductions in energy yield and correspondingly higher power costs.
Overall, the findings confirm that monthly or seasonal adjustment of the tilt angle provides a more favorable balance between energy generation and economic performance than fixed-tilt configurations. Moderate tilt angles consistently yielded the lowest power cost across all locations, with northern cities favoring slightly higher inclinations and southern cities achieving minimum cost at lower tilt angles. These trends highlight the importance of accounting for regional climatic and geographical variations when designing PV systems. This research contributes to the enhancement of output power and cost efficiency in utility-scale PV installations. By integrating long-term solar radiation data with tilt-angle optimization, the proposed framework enables location-specific PV system designs that are particularly relevant for expanding renewable energy capacity in Pakistan. Such tailored system designs are essential for supporting national energy security goals and progress toward carbon neutrality.
Future work may extend this framework by incorporating machine learning–based tilt prediction models, uncertainty quantification, and climate-change-adjusted irradiance projections to further improve the robustness and adaptability of PV system optimization.
Funding
This research received no external funding.
Institutional Review Board Statement
Not applicable.
Data Availability Statement
The original contributions presented in this study are included in the article. Further inquiries can be directed to the corresponding author.
Acknowledgments
An AI-based language editing tool was used to assist in improving the grammar, spelling, and readability of this manuscript. All scientific content, results, and conclusions are solely those of the author.
Conflicts of Interest
The author declares no conflicts of interest.
References
- Tamoor, M.; Bhatti, A.R.; Farhan, M.; Rasool, A.; Sherefa, A. Optimizing tilt angle of PV modules for different locations using isotropic and anisotropic models to maximize power output. Sci. Rep. 2024, 14, 30197. [Google Scholar] [CrossRef] [Scilit] [PubMed]
- Tamoor, M.; Hussain, M.I.; Bhatti, A.R.; Miran, S.; Arif, W.; Kiren, T.; Lee, G.H. Investigation of dust pollutants and the impact of suspended particulate matter on the performance of photovoltaic systems. Front. Energy Res. 2022, 10, 1017293. [Google Scholar] [CrossRef] [Scilit]
- Lu, N.; Qin, J. Optimization of tilt angle for PV in China with long-term hourly surface solar radiation. Renew. Energy 2024, 229, 120741. [Google Scholar] [CrossRef] [Scilit]
- Muniyandi, V.; Majji, V.K.R.; Ravindra, M.; Adireddy, R.; Balasubramanian, A.K. Feature selection-based Irradiance Forecast for Efficient Operation of a Stand-alone PV System. Green Energy Intell. Transp. 2025, 5, 100308. [Google Scholar] [CrossRef] [Scilit]
- Rodrigo, P.M.; Mouhib, E.; Fernandez, E.F.; Almonacid, F.; Rosas-Caro, J.C. Comprehensive ground coverage analysis of large-scale fixed-tilt bifacial photovoltaic plants. Renew. Sustain. Energy Rev. 2024, 192, 114229. [Google Scholar] [CrossRef] [Scilit]
- Sadeghi, R.; Parenti, M.; Memme, S.; Fossa, M.; Morchio, S. A Review and Comparative Analysis of Solar Tracking Systems. Energies 2025, 18, 2553. [Google Scholar] [CrossRef] [Scilit]
- Limmanee, A.; Songtrai, S.; Udomdachanut, N.; Kaewniyompanit, S.; Sato, Y.; Nakaishi, M.; Kittisontirak, S.; Sriprapha, K.; Sakamoto, Y. Degradation analysis of photovoltaic modules under tropical climatic conditions and its impacts on LCOE. Renew. Energy 2017, 102, 199–204. [Google Scholar] [CrossRef] [Scilit]
- Shen, W.; Chen, X.; Qiu, J.; Hayward, J.A.; Sayeef, S.; Osman, P.; Meng, K.; Dong, Z.Y. A comprehensive review of variable renewable energy levelized cost of electricity. Renew. Sustain. Energy Rev. 2020, 133, 110301. [Google Scholar] [CrossRef] [Scilit]
- Chinchilla, M.; Santos-Martin, D.; Carpintero-Renteria, M.; Lemon, S. Worldwide annual optimum tilt angle model for solar collectors and photovoltaic systems in the absence of site meteorological data. Appl. Energy 2021, 281, 116056. [Google Scholar] [CrossRef] [Scilit]
- Riad, S.; Bekkioui, N.; Simo-Tagne, M.; Macmanus Chinenye, N.; Lamrani, B.; Ez-Zahraouy, H. Application of artificial neuronal networks for the prediction of monthly photovoltaic power using tilt angle as input in Rabat city, Morocco. Int. J. Ambient Energy 2024, 45, 2365809. [Google Scholar] [CrossRef] [Scilit]
- Melhem, R.; Shaker, Y. Optimum tilt angle and solar radiation of photovoltaic modules for gulf collaboration council countries. Int. J. Energy Res. 2023, 2023, 8381696. [Google Scholar] [CrossRef] [Scilit]
- Kaddoura, T.O.; Ramli, M.A.; Al-Turki, Y.A. On the estimation of the optimum tilt angle of PV panel in Saudi Arabia. Renew. Sustain. Energy Rev. 2016, 65, 626–634. [Google Scholar] [CrossRef] [Scilit]
- Zang, H.; Guo, M.; Wei, Z.; Sun, G. Determination of the optimal tilt angle of solar collectors for different climates of China. Sustainability 2016, 8, 654. [Google Scholar] [CrossRef] [Scilit]
- Jing, J.; Zhou, Y.; Wang, L.; Liu, Y.; Wang, D. The spatial distribution of China’s solar energy resources and the optimum tilt angle and power generation potential of PV systems. Energy Convers. Manag. 2023, 283, 116912. [Google Scholar] [CrossRef] [Scilit]
- Chudinzow, D.; Klenk, M.; Eltrop, L. Impact of field design and location on the techno-economic performance of fixed-tilt and single-axis tracked bifacial photovoltaic power plants. Sol. Energy 2020, 207, 564–578. [Google Scholar] [CrossRef] [Scilit]
- Veronese, E.; Manzolini, G.; Moser, D. Improving the traditional levelized cost of electricity approach by including the integration costs in the techno-economic evaluation of future photovoltaic plants. Int. J. Energy Res. 2021, 45, 9252–9269. [Google Scholar] [CrossRef] [Scilit]
- Tamoor, M.; Bhatti, A.R.; Farhan, M. An improved approach for enhancing the PV system efficiency through optimization of tilt angle. Sol. Energy 2025, 297, 113607. [Google Scholar] [CrossRef] [Scilit]
- Choi, D.; Eom, J.; Cho, C. Integrating market and technology uncertainties into the projected cost of power technologies: A case of Korea. Energy Strategy Rev. 2023, 45, 101046. [Google Scholar] [CrossRef] [Scilit]
- Sung, S.; Jung, W. Economic competitiveness evaluation of the energy sources: Comparison between a financial model and levelized cost of electricity analysis. Energies 2019, 12, 4101. [Google Scholar] [CrossRef] [Scilit]
- Saranyaa, J.S. A comprehensive survey on the current trends in improvising the renewable energy incorporated global power system market. IEEE Access 2023, 11, 24016–24038. [Google Scholar] [CrossRef] [Scilit]
- Wang, R.; Hasanefendic, S.; Von Hauff, E.; Bossink, B. The cost of photovoltaics: Re-evaluating grid parity for PV systems in China. Renew. Energy 2022, 194, 469–481. [Google Scholar] [CrossRef] [Scilit]
- Lebedeva, K.; Borodinecs, A.; Palcikovskis, A.; Wawerka, R.; Skandalos, N. Estimation of LCOE for PV electricity production in the Baltic States-Latvia, Lithuania and Estonia until 2050. Renew. Sustain. Energy Transit. 2025, 7, 100110. [Google Scholar] [CrossRef] [Scilit]
- Comello, S.; Reichelstein, S.; Sahoo, A. The road ahead for solar PV power. Renew. Sustain. Energy Rev. 2018, 92, 744–756. [Google Scholar] [CrossRef] [Scilit]
- Kästel, P.; Gilroy-Scott, B. Economics of pooling small local electricity prosumers—LCOE & self-consumption. Renew. Sustain. Energy Rev. 2015, 51, 718–729. [Google Scholar] [CrossRef] [Scilit]
- Lee, C.Y.; Ahn, J. Stochastic modeling of the levelized cost of electricity for solar PV. Energies 2020, 13, 3017. [Google Scholar] [CrossRef] [Scilit]
- Oloya, I.T.; Gutu, T.J.; Adaramola, M.S. Techno-economic assessment of 10 MW centralised grid-tied solar photovoltaic system in Uganda. Case Stud. Therm. Eng. 2021, 25, 100928. [Google Scholar] [CrossRef] [Scilit]
Disclaimer/Publisher’s Note: The statements, opinions and data contained in all publications are solely those of the individual author(s) and contributor(s) and not of MDPI and/or the editor(s). MDPI and/or the editor(s) disclaim responsibility for any injury to people or property resulting from any ideas, methods, instructions or products referred to in the content. |
© 2026 by the author. Licensee MDPI, Basel, Switzerland. This article is an open access article distributed under the terms and conditions of the Creative Commons Attribution (CC BY) license.