


Abstract
This study examined the influence of temperature on the physicochemical and morphological properties of biochar from green pea peels. Biochar was produced by thermal degradation of the feedstock under Na2CO3 catalyst at temperatures of 300–800 °C. Characterization techniques revealed the biochar’s surface area increased from 0.6836 m2/g to a maximum of 683.2 m2/g, whereas the mean pore diameter decreased from 161.67 nm in GP300 to 2.1778 nm in GP800. Moreover, the high temperatures led to greater carbonization, aromatization, and stability. Additionally, the HHVs ranged from 16.56 to 23.6 MJ/kg compared with 15.50 MJ/kg in the feedstock, making the produced biochar materials highly suitable for multifaceted applications.
1. Introduction
The global surge in energy demand, driven by an increasing population and rising living standards, has warranted the exploitation of fossil fuels. These are anthropogenic sources of greenhouse gases with climatic consequences such as desertification, global warming, hurricanes, and heat waves [1]. An emergent exploration of abundant, sustainable alternatives such as biomass is paramount to offset greenhouse gas emissions and limit dependence on fossil fuels [2]. A promising strategy to reduce atmospheric CO2 concentrations during energy production is the thermal degradation of biogenic waste materials [3]. This utilizes methods such as pyrolysis, gasification, and liquefaction to produce high-value energy materials. By far, pyrolysis has gained the highest reliability and popularity owing to its ability to convert biomass into solid biochar, gaseous syngas, and liquid bio-oil [4].
Biochar refers to a recalcitrant, highly carbonized solid fraction obtained from the pyrolysis of biomass sources in anoxic or partially oxic environments. Biochar is derived from crop residue feedstocks such as rice husks, millet straw, peels, and bagasse [5]. Compared to other carbon materials, biochar is cheap, reliable, eco-friendly, and easily modifiable for a wide range of applications. The precursor biomass feedstock strongly influences the chemical and physical characteristics of the resultant products [6]. Besides feedstock properties, pyrolytic conditions such as temperature, heating rate, and residence time are significant factors in the rearrangement of the solid phase and the structural evolution of biochar [7]. There have not been viable studies on the influence of pyrolytic temperature on biochar produced from green pea peels incorporated with sodium carbonate catalysts.
The main purpose of this study is to investigate the properties of biochar produced by thermal catalytic degradation of green pea pods with a sodium carbonate catalyst. The choice of green pea was due to its popularity as a winter crop in China, Egypt, and India, resulting in large volumes of perishable waste. Parameters for the evaluation of physicochemical and structural properties of biochar were analyzed by characterisations techniques.
2. Materials and Methods
2.1. Materials and Reagents
Green pea peels (GPP) were obtained from a local market in Alexandria, Egypt. Sodium carbonate and hydrochloric acid (37%) were procured from (Darmstadt, Germany), while sodium hydroxide (98%) was obtained from (Fine chem, Mumbai, India).
2.2. Methods
GPPs were sun-dried for 48 h, followed by an oven for 48 h at 105 °C until constant weight. The peels were crushed in an electric blender, and particles of sizes smaller than 212 µm were obtained.
Biochar synthesis was performed as follows. Approximately 1 g of Na2CO3 was dissolved in 50 mL of distilled water. An amount of 10 g of GPP was soaked in the solution and dried in an oven to constant weight. The dried biomass feedstock and the catalyst were placed in a ceramic crucible with a tight-fitting lid. The crucible was heated in a muffle furnace, in an anoxic environment created by purging nitrogen at a temperature of 300–800 °C at a ramping rate of 27 °C/min for 2 h. The resultant brown solid was leached using 10% 0.1 M HCl solution, followed by washing with distilled water. The biochar obtained was designated GP300, GP400, GP500, GP600, GP700, and GP800, with the number corresponding to the preparation temperature.
The solid and energy yield were calculated from Equations (1) and (2), respectively [8];
2.3. Characterisations
The elemental quantities of carbon, hydrogen, nitrogen, sulphur, and oxygen were determined by ultimate analysis. The higher heating values of the feedstocks and chars were determined by an oxygen bomb calorimeter (Labtron, Camberley, UK). The nitrogen gas sorption/desorption technique was used to determine changes in BET surface area and the BJH pore distribution at −196 °C (Microtrac MRB Belsorp, Osaka, Japan). The peels and char samples were degassed by exposure to a high vacuum at 180 °C overnight. The changes in texture and morphology were examined by high-resolution Scanning Electron Microscopy (SEM) (JEOL JSM-6360LA, Tokyo, Japan) operated at high voltage, with samples supported on Pd to ensure good electrical conductivity. The amorphous and crystalline phase changes in the produced char materials were determined using X-ray powder Diffraction (XRD) Bruker D2 phase (Karlsruhe, Germany). Inorganic constituents were determined by X-ray Fluorescence (XRF) from Rigaku, Tokyo, Japan. Changes in functional groups were detected using Fourier Transform Infrared Spectroscopy (FTIR) (Shimadzu 8400s, Kyoto, Japan) over the spectral range of 400–4000 cm−1.
3. Results and Discussions
3.1. Biochar Yield
The changes in biochar yield with temperature increase are illustrated in Table S1. From the results, the increase in temperature negatively correlated with biochar yield, a phenomenon attributed to the condensation polymerization of lignocellulosic plant tissues [9]. In the degradation of lignocellulosic materials, moisture, hemicellulose, cellulose, and lignin break off at temperatures below 150 °C, 220–315 °C, 315–400 °C, and above 500 °C, respectively. Consequently, the biochar yield decreased from 48.33% in GP300 to 29.62% in GP500. The highest attainable char yield in GP300 was due to the degradation of hemicellulose, whereas those of GP300 and GP400 resulted from the degradation of cellulose [10]. Moreover, the yield fundamentally decreased from 29.62% in GP500 to 17.46% in 800 biochar materials. The scenario can be attributed to the primary degradation of organic feedstock at higher temperatures and to the secondary decomposition of biochar residue during charring and devolatilization reactions [11].
3.2. Elemental Compositions and Molar Indices of the Synthesized Biochar Materials
From the elemental composition results, the carbon percentage increased from 57.46% in the feedstock to 77.28% in GP800, indicating a higher degree of carbonization and a structural transformation toward a more condensed aromatic carbon. Moreover, the hydrogen and oxygen contents were fundamentally reduced from 5.72% to 1.49% and 39.86% to 18.42% in the same materials. The plausible causes could be attributed to the fracture of chemical bonds in macromolecular biomass, releasing hydrogen and oxygen while attaining a more hydrophobic structure, as similarly observed by R. Chartejee et al. [1]. Meanwhile a peculiar increase in sulphur content between 500 and 600 °C could be attributed to sulphur speciation where inorganic sulphur is converted to stable organosulphur [12].
Meanwhile, based on the molar ratios, the pea waste feedstock had higher H/C and O/C than the produced biochar materials, as similarly observed by S. Mary et al. [13]. The indices O/C and H/C decreased from 0.837 to 0.238 and from 0.093 to 0.019, respectively, in GP300 to GP800 materials. The decrease in the O/C ratio is attributed to dehydration reactions that yield less hydrophilic biochar, while the reduction in H/C indicates a greater degree of carbonization [10]. Furthermore, the synthesized biochar materials meet the permissible thresholds of the European Biochar Certificate for the molar indices O/C and H/C, which are lower than 0.4 and 0.7, respectively [14].
3.3. Higher Heating Values (HHV) and Energy Yield of the Biochar Materials
The HHV of green pea peels feedstock and biochar materials shown in Table S1 revealed an elevation from 15.50 MJ/kg in feedstock to 23.6 MJ/kg in the GP400 materials, followed by a decline from 20.23 MJ/kg in GP500 to 16.56 MJ/kg in GP800. The increase in HHV could be attributed to the rise in carbonization degree, the decline in oxygen content, and the release of volatile matter [9]. The decline in the HHV in chars’ materials produced between 500 and 800 °C conforms to the “dilution effect” similarly observed by A. Selvarajoo et al., resulting from the concentration of ash at higher temperatures which affects fuel combustion [15]. Moreover, the energy content obtained at lower temperatures was higher than that at higher temperatures; for example, the energy yield decreased from 70.83% in GP300 to 18.59% in GP800. This behaviour can be attributed to the reduction in biochar yield with increasing pyrolytic temperature [15]. Therefore, it can be inferred that biochar materials synthesized using the above protocol at lower temperatures are more recommendable for energy production than those synthesized at higher temperatures [15].
3.4. Composition of Inorganic Minerals in the Biochar
The mineralogic changes in biochar with temperature are shown in Table S2. The results revealed an abundance of metal oxides in biochar, with specific quantities increasing with increasing pyrolysis temperatures, as similarly observed by M. Waqas et al. [16]. The concentrations of most metal oxides in the biochar materials were higher than those in the precursor feedstock. Such behaviour can be attributed to the degradation of organic constituents, which in turn led to the buildup of inorganic content. Some compounds, such as K2O, increased from 3.78% at 300 °C to 5.28% at 500 °C and then decreased to 1.4% at 800 °C. Such scenarios also occurred with Al2O3, CaO, Na2O3, and others, without any clear trend. Notably, the presence of K2O, CaO, N2O, and P2O5 makes the resulting biochar highly beneficial for agriculture, whereas Al2O3 and SiO2 provide aluminol and silanol groups for adsorption, and MnO, NiO, and Fe2O3 make the material suitable as a catalyst.
3.5. Functional Properties of Synthesized Biochar Materials
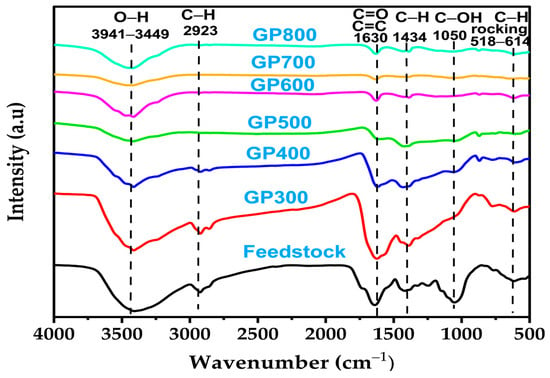
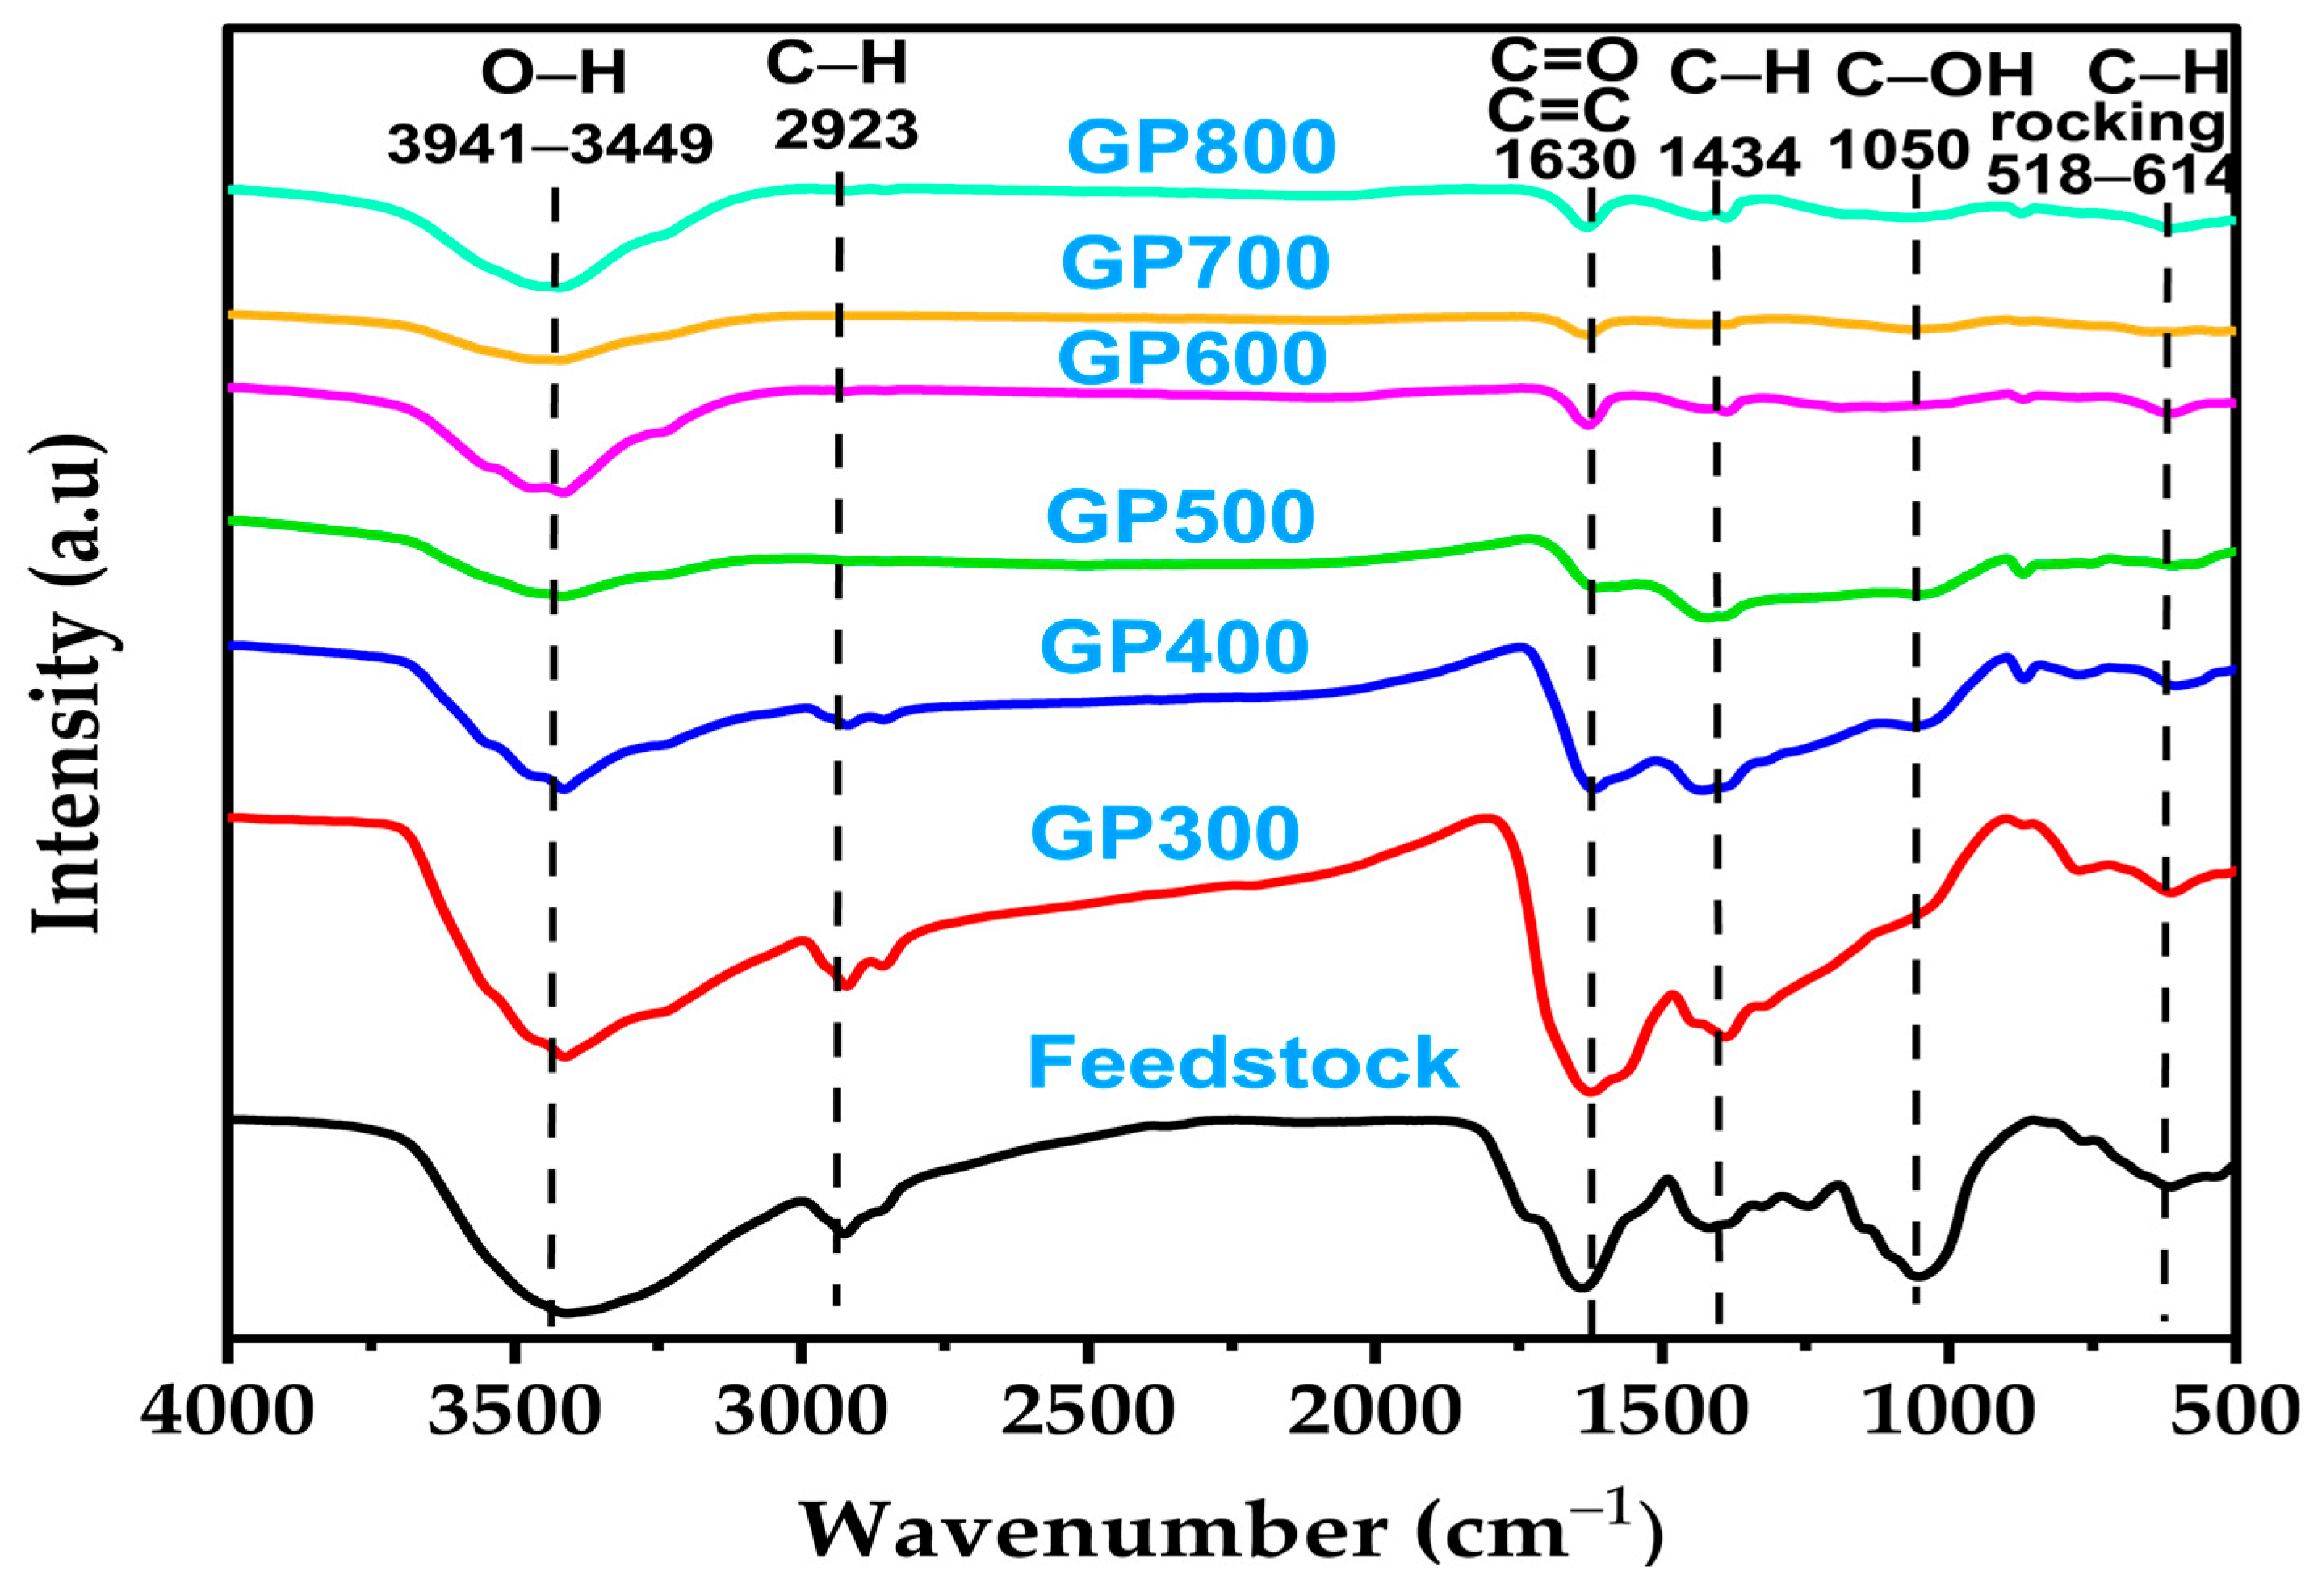
The FTIR spectra of green pea peel and the synthesized biochar are in Figure 1. A strong peak dominates the spectrum of peel feedstock at 3405 cm−1, associated with O-H vibration stretching and strong hydrogen bonding [17]. However, the peak intensity diminishes with carbonization temperature, indicating the loss of bonded water and volatile compounds [18]. Intense absorption bands also appeared at 2923 cm−1, ascribing to SP2 C-H stretching of aliphatic alkane and evidence of lignin in the feedstock [19]. The peak intensity weakens in biochar material produced between 300 and 400 °C and later disappears in GP600, attributed to the breakdown of lignin in the char matrix. The band at 1600–1650 cm−1 in the feedstock or prepared biochar corresponds to the C=C and C=O stretching of aromatic rings [10]. The peak and intensity of the band decrease at higher charring temperatures due to the removal of polar functional groups. However, the elimination of polar functional groups exposed the C=C bonds, thereby increasing aromaticity and decreasing polarity. This supports findings that biochar produced below 400 °C exhibited aliphatic C structure, while biochar produced above 400 °C exhibited polycyclic aromatic C structure. Similarly, another band at 614 cm−1 ascribed to the C-Br stretch of an aliphatic bromoalkane [13]. However, these peaks disappeared at higher temperatures, indicating thermal degradation. Therefore, temperature influences functional groups by dehydrating lignocellulosic content and its destruction.
Figure 1.
Changes in functional groups of biochar materials.
3.6. BET Surface Area and Pore Properties of the Biochar
The biochar materials produced at higher pyrolysis temperatures exhibited increasing BET surface area and pore volume, as shown in Table 1, due to the degradation of cellulose, lignin, and hemicellulose within the biochar matrix [20]. Moreover, the impregnated sodium carbonate catalyst penetrates the feedstock structures and initiates cleavage of hydrogen bonds, producing volatile compounds that improve biochar’s pore properties. The GP300 and GP400 materials showed increases in surface area and pore volume from 0.68361 to 1.967 m2/g and from 0.02763 to 0.0394 cm3/g, respectively, as temperatures increased from 300 to 400 °C. In the GP500 material, the surface area increased to 3.6367 m2/g, a scenario associated with improved devolatilization, the creation of voids or pores, and the loss of volatile organic compounds during the degradation of cellulose and hemicellulose [11]. The phenomenon was accompanied by the transformation of char structural mean pore diameter from macropores in GP300 and GP400 to mesopores in GP500, GP600, GP700, and GP800 in accordance with IUPAC nomenclature [21]. In the GP500 material, the decrement in total pore volume is due to the rupture of organic constituents within hemicellulose. The large 32-fold increase in surface area from 3.6367 m2/g to 178 m2/g and total pore volume from 0.0099 cm3/g to 0.0233 cm3/g is ascribed to the thermal degradation of heat-resistant lignin, accompanied by the production of methane and hydrogen gas. The GP700 and GP800 materials exhibited surface areas of 379.82 m2/g and 683.23 m2/g, respectively, attributed to further breakdown of the residual organic structure and aromatic condensation, leading to greater volatile production and the creation of pores [1].
Table 1.
Pore distribution of the synthesized biochar.
3.7. Crystallographic Studies of the Produced Biochar
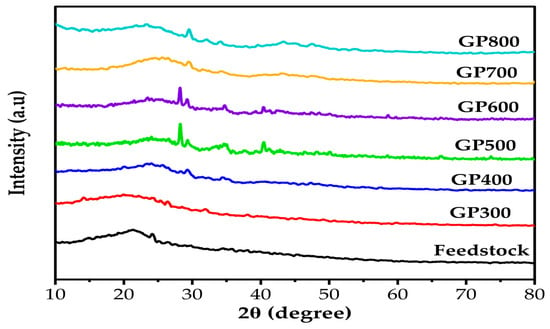
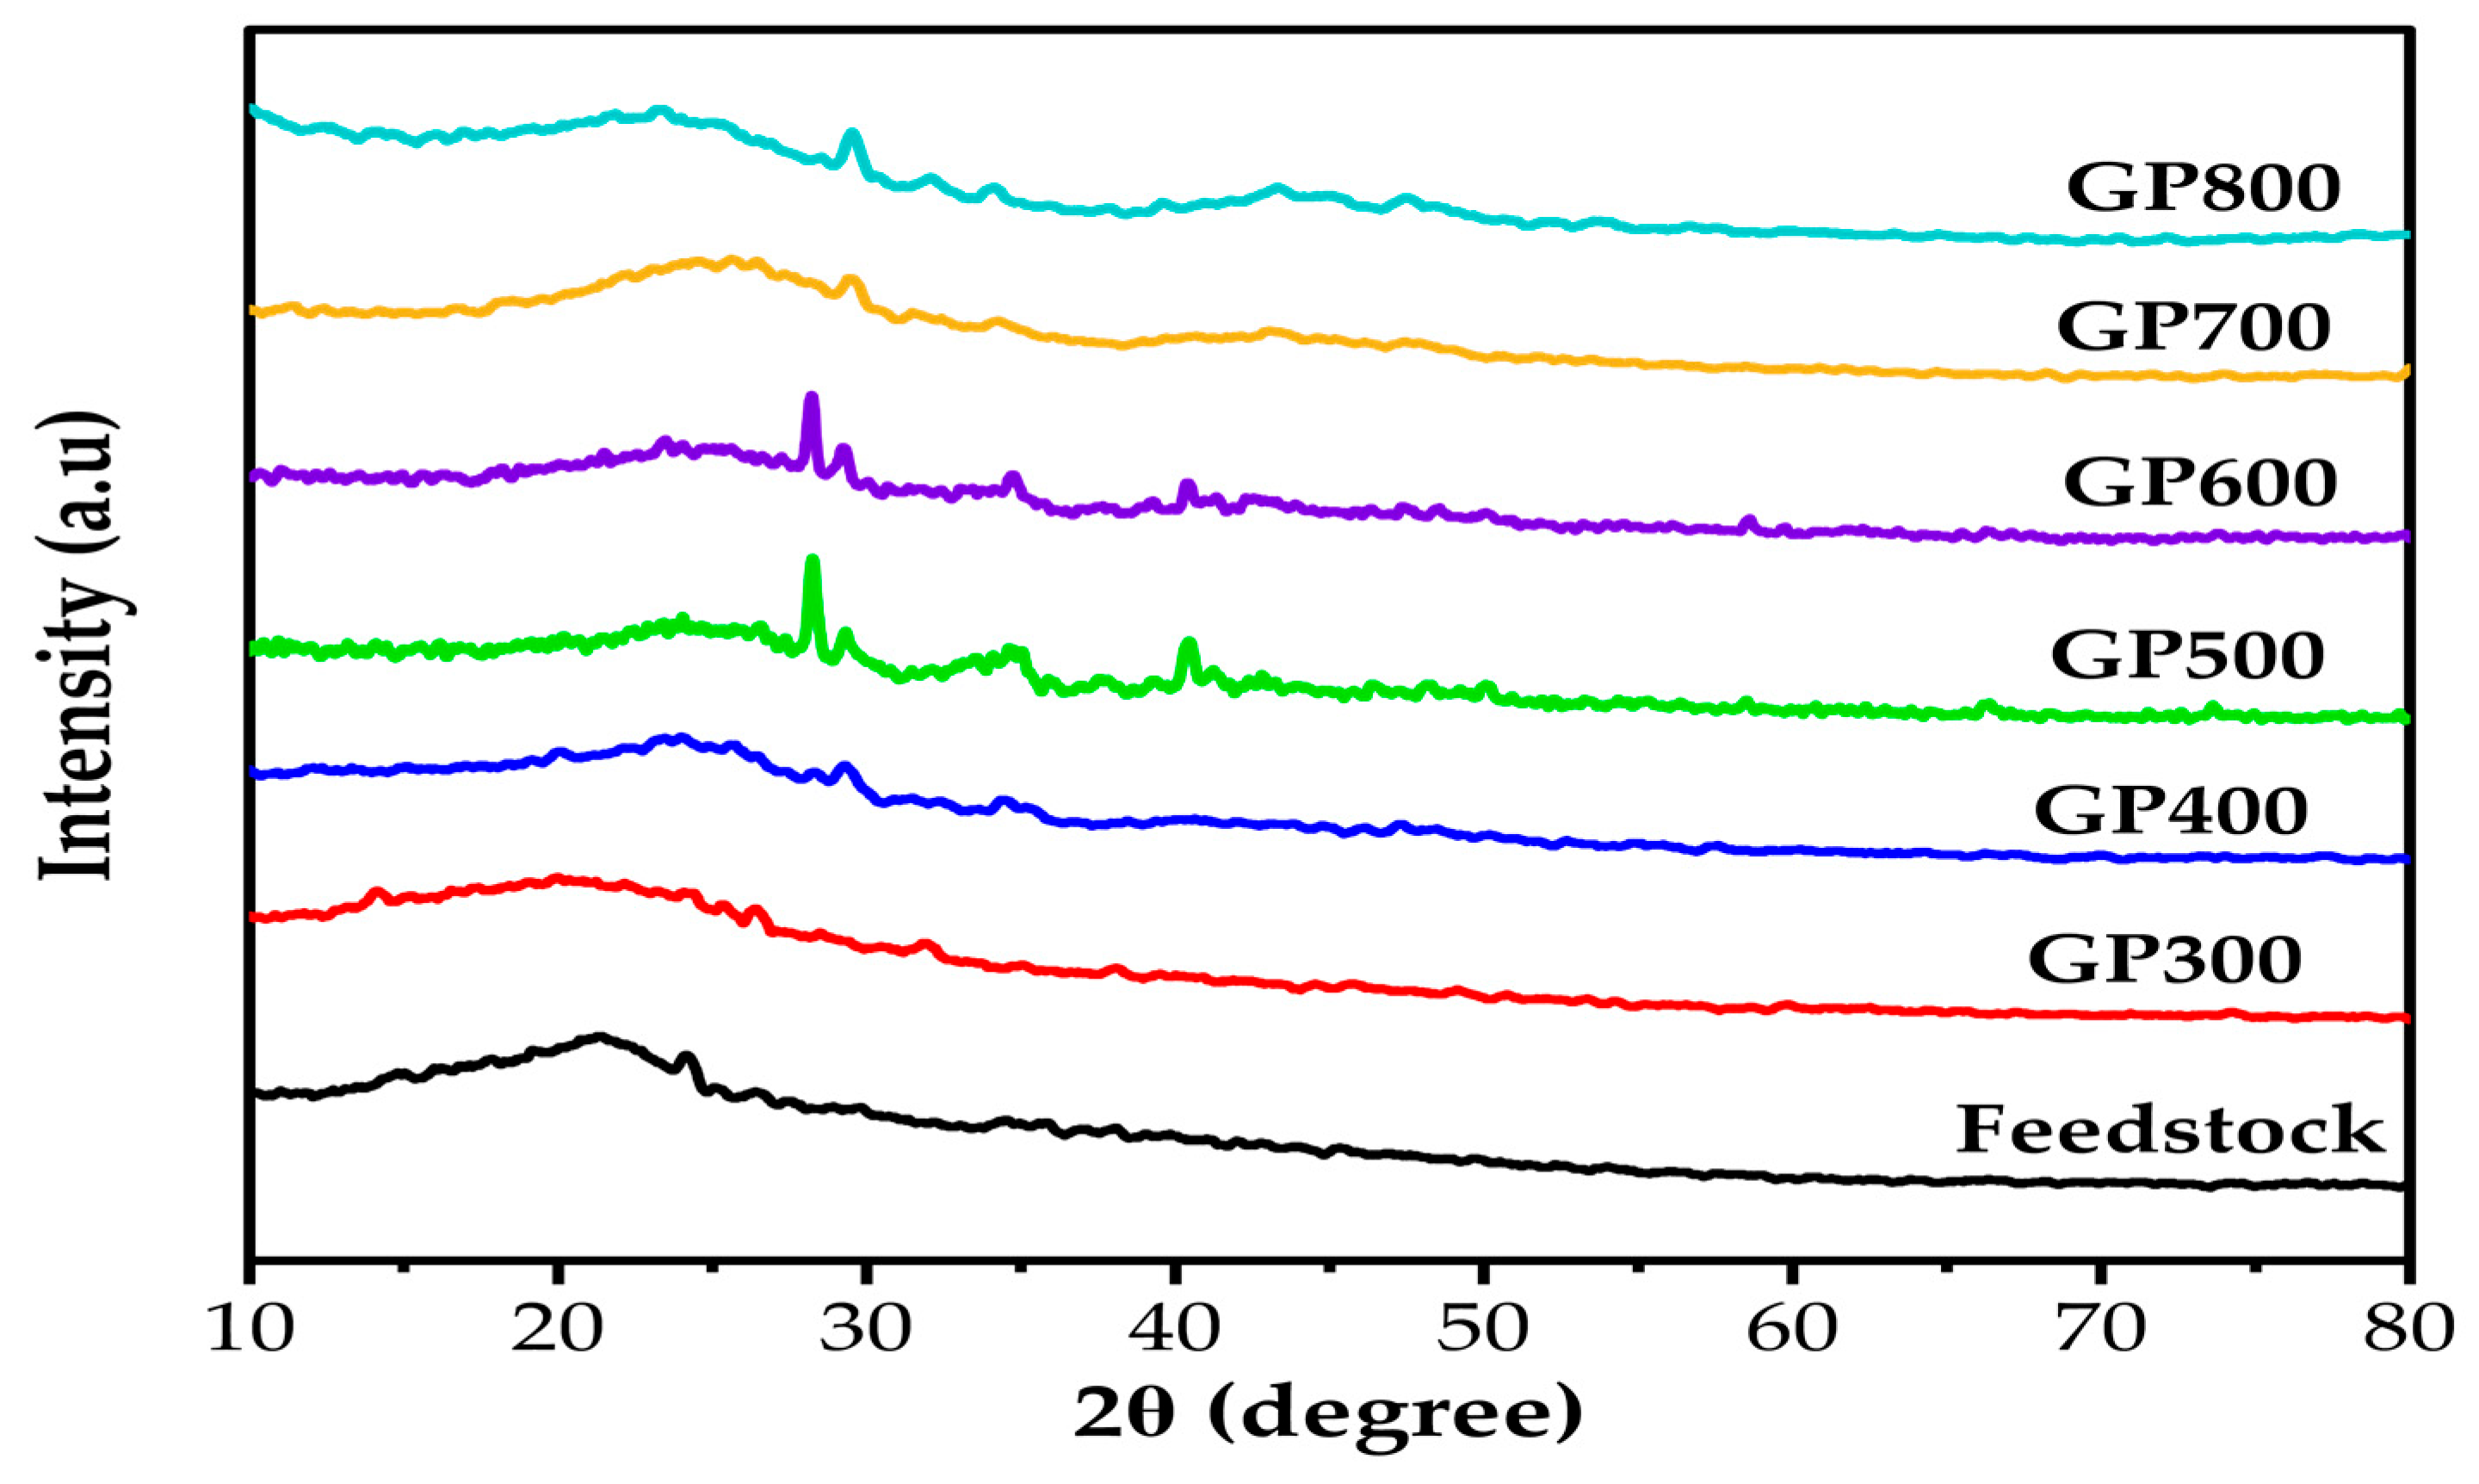
From Figure 2, a broad diffraction peak at 2θ between 17 and 25° is observed in the feedstock. This is an exhibition of a predominant amorphous enriched phase with large quantities of cellulose in the samples, as observed in other biomass feedstocks [22]. This is consistent with the findings of W. Tongpoothorn [23]. With increasing pyrolysis temperature, the peak position shifts to higher angles while its intensity decreases. Moreover, the rise in pyrolysis temperature enables the shrinkage of the cellulose graphitic structure from the microcrystalline layer present in the biochar, thereby increasing the formation of crystalline carbon and its transformation into more stable carbon [24].
Figure 2.
XRD pattern studies of the produced biochar materials.
In the GP500 and GP600 materials, new diffraction peaks are observed at 29.5° and 40.4°, corresponding to the Miller indices 110 (JCPDS No. 072-2091) and 520 (JCPDS No. 049-1720). These planes indicate the presence of fullerite crystals of C60 carbon at 40.4° and C8 carbon at 29.5° [25]. Nevertheless, fullerite and C8 carbon crystals diminish in GP700 and GP800 materials, producing a broad peak at 2θ of 20–30° and 40–50° with corresponding miler planes of 002 and 101, respectively. These characteristic peaks confirm activated graphitic carbon synthesis according to (JCPDS No 75-1621) [26].
3.8. Morphological Changes in the Produced Biochar
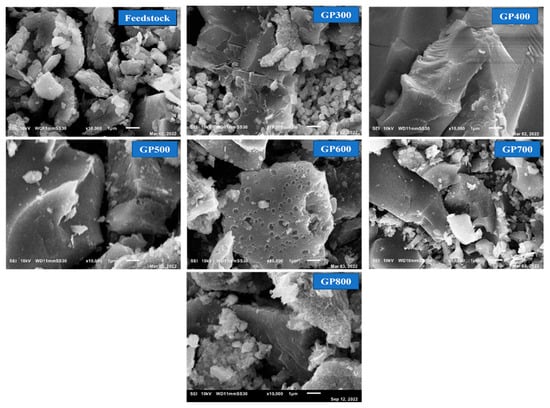
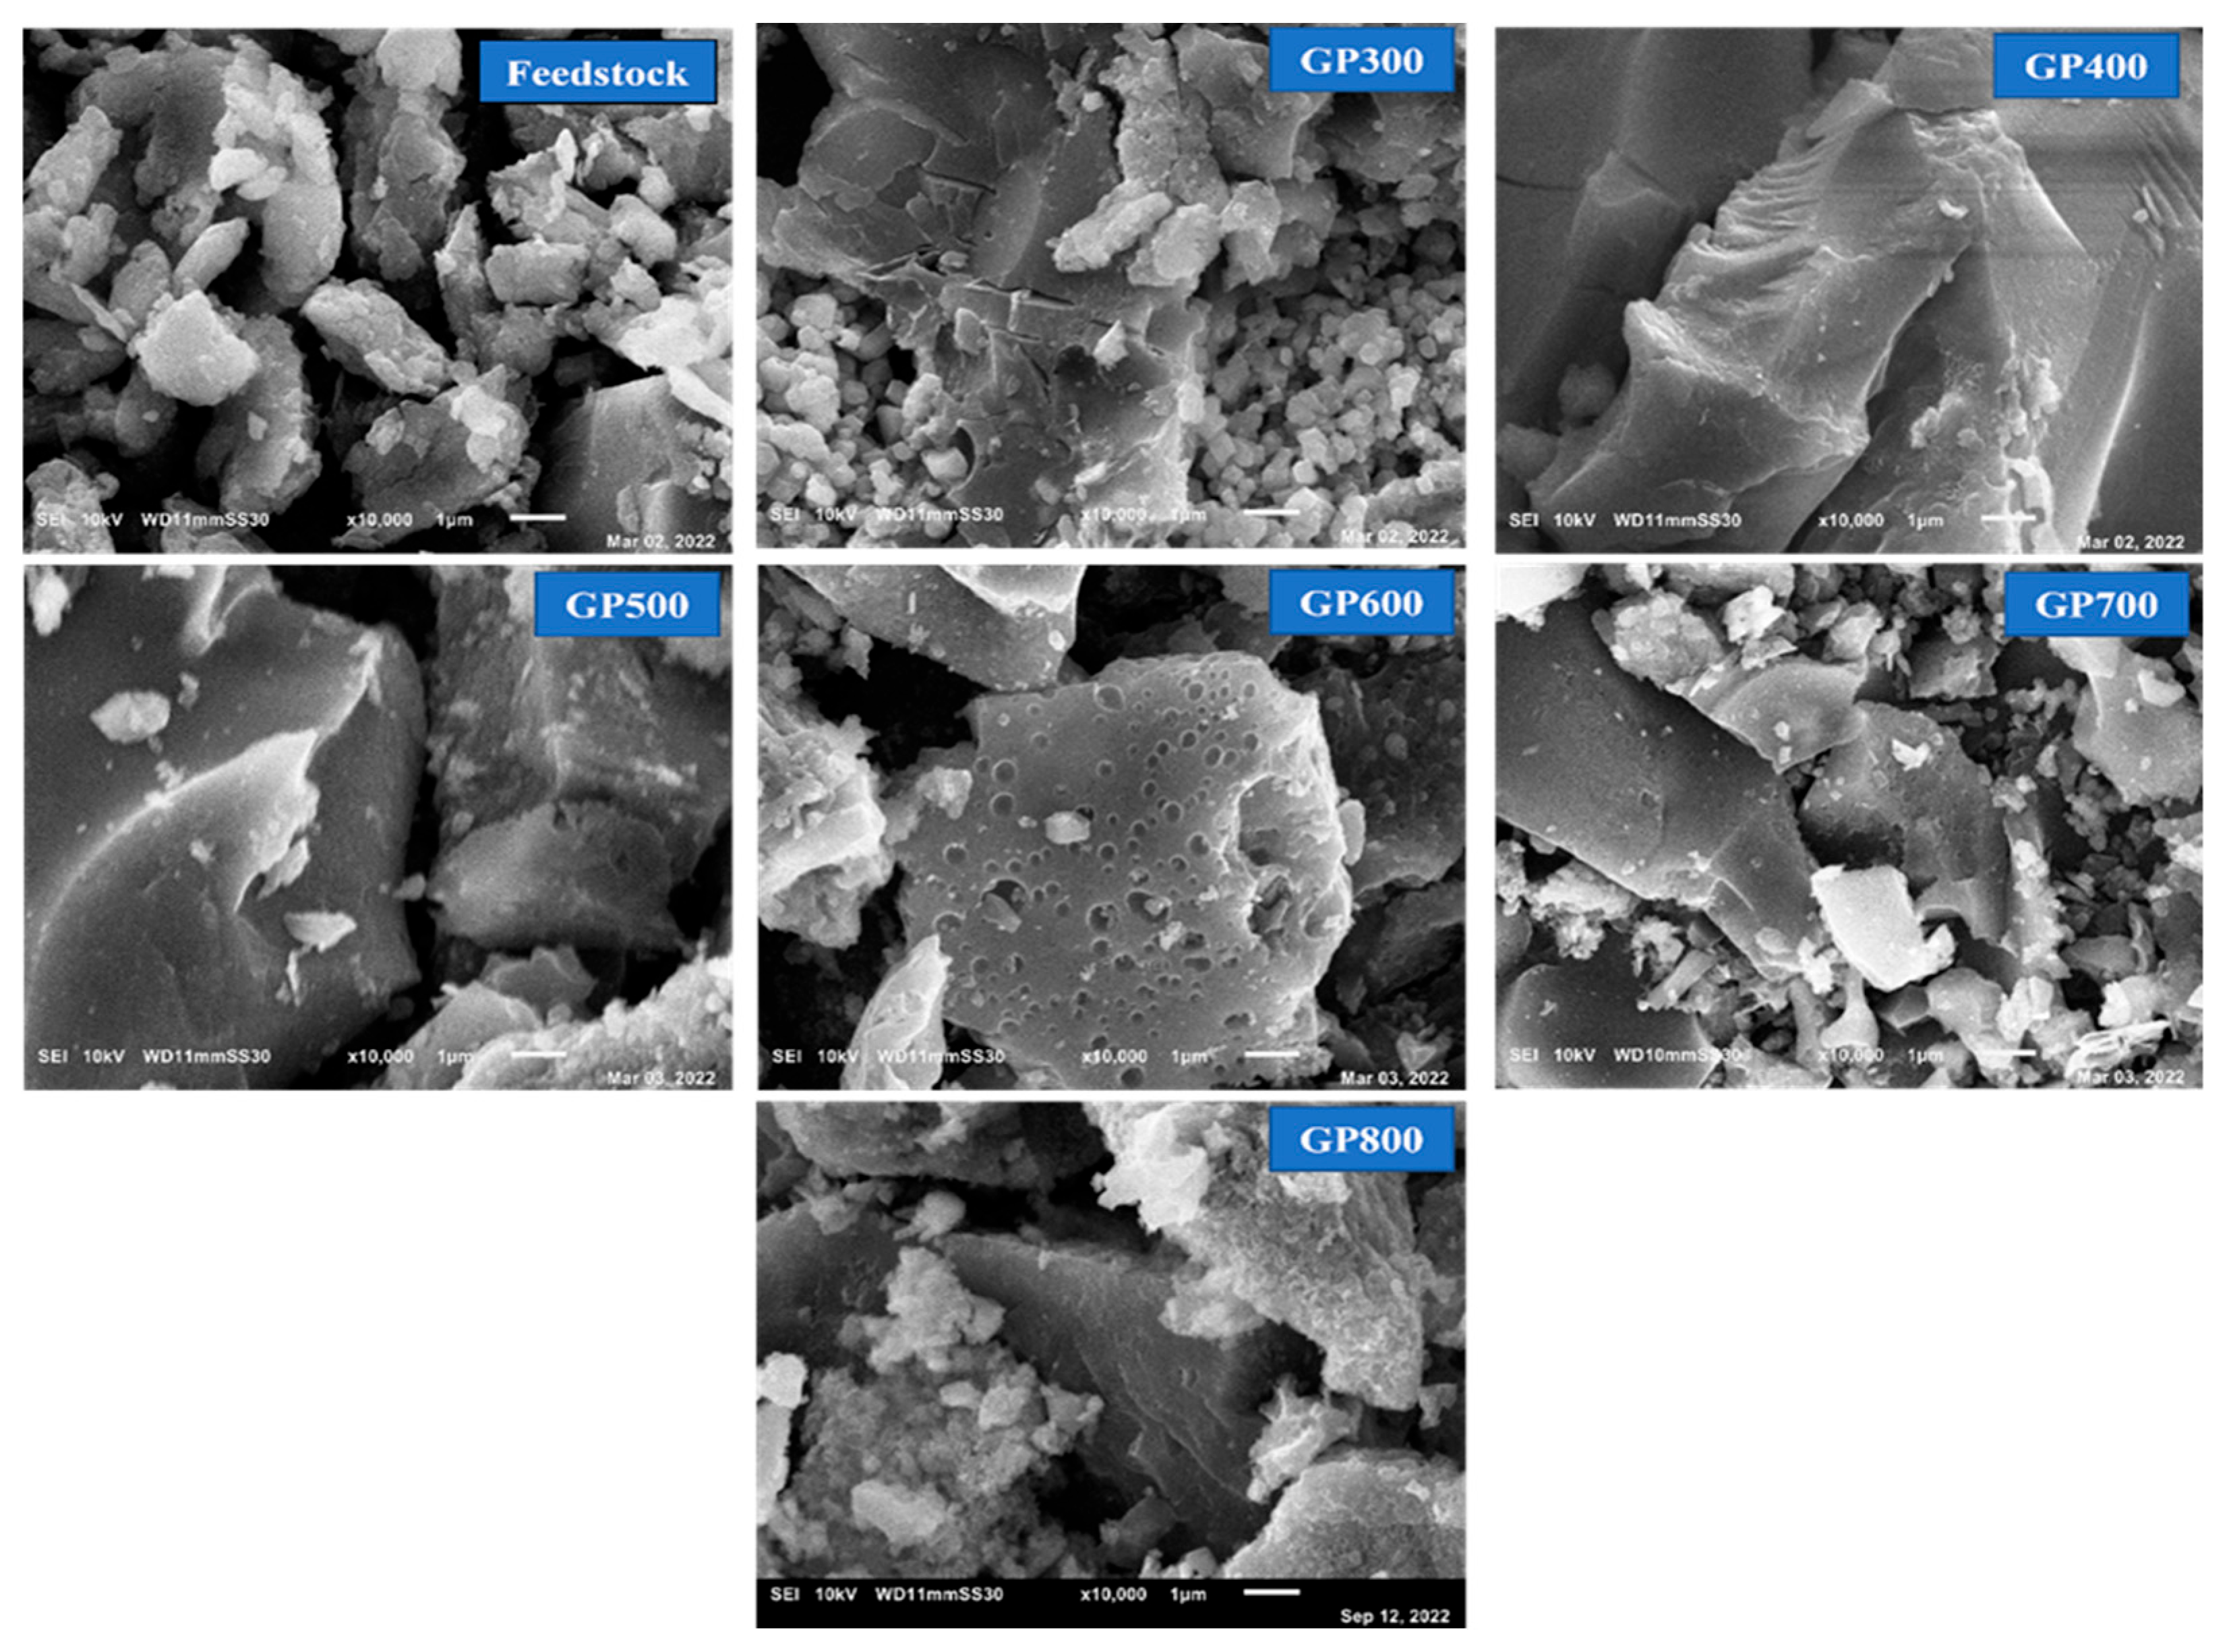
The SEM analysis, which provided a photographic illustration of the materials (Figure 3), revealed a significant surface transformation resulting from enhanced volatilization induced by increased thermal input. Biochar materials produced at lower temperatures were dense and macroporous. In contrast, those synthesized at higher temperatures were mesoporous, with numerous crevices and pores, as indicated by surface area and pore volume analysis [16]. It is paramount to note that biochar synthesized at low temperatures (300–400 °C) is enriched in the organic structure; however, 500–800 °C promotes the degradation of organic material, causing the production of tar, which in turn fills the pores, causing a decrease in the sizes of the pores.
Figure 3.
Morphological changes in biochar at different temperatures.
4. Conclusions
In this work, the authors successfully studied the impact of temperature on biochar’s chemical and physical properties under sodium carbonate catalyst impregnation. The carbon content increased with temperature, whereas oxygen decreased. Additionally, the pore properties of the specific surface area, average pore diameter, and pore volume significantly change. Furthermore, notable changes in morphology, functional groups, and crystallography were observed. Therefore, temperature plays a significant role in pyrolytic processes, leading to char materials with multifaceted roles in wastewater treatment, energy applications, carbon sequestration, and soil amendments.
Supplementary Materials
The following supporting information can be downloaded at: https://www.mdpi.com/article/10.3390/engproc2025117049/s1, Table S1: Elemental composition, molar ratios, and calorific properties of biochar; Table S2: Mineralogic composition of biochar.
Author Contributions
Methodology, K.S.; validation, N.O.R.; formal analysis, N.O.R. and K.S.; investigation, N.O.R.; writing—original draft preparation, N.O.R. and K.S.; writing—review and editing, K.S. and H.S.; supervision, H.S. All authors have read and agreed to the published version of the manuscript.
Funding
The research was partially supported by TICAD 7, Egypt-Japan University of Science and Technology (E-JUST) and Japan International Corporation Agency (JICA).
Institutional Review Board Statement
Not applicable.
Informed Consent Statement
Not applicable.
Data Availability Statement
The original contributions presented in this study are included in the article/Supplementary Materials. Further inquiries can be directed to the corresponding author.
Acknowledgments
The authors thank Egypt-Japan University of Science and Technology and its staff in the Environmental and Engineering Department for their warm support during this study.
Conflicts of Interest
The authors declare no conflict of interest.
References
- Chatterjee, R.; Sajjadi, B.; Chen, W.; Mattern, D.L.; Hammer, N.; Raman, V.; Dorris, A. Effect of Pyrolysis Temperature on PhysicoChemical Properties and Acoustic-Based Amination of Biochar for Efficient CO2 Adsorption. Front. Energy Res. 2020, 8, 85. [Google Scholar] [CrossRef] [Scilit]
- Kim, K.H.; Kim, J.Y.; Cho, T.S.; Choi, J.W. Influence of pyrolysis temperature on physicochemical properties of biochar obtained from the fast pyrolysis of pitch pine (Pinus rigida). Bioresour. Technol. 2012, 118, 158–162. [Google Scholar] [CrossRef] [Scilit] [PubMed]
- Mohanty, P.; Nanda, S.; Pant, K.K.; Naik, S.; Kozinski, J.A.; Dalai, A.K. Evaluation of the physiochemical development of biochars obtained from pyrolysis of wheat straw, timothy grass and pinewood: Effects of heating rate. J. Anal. Appl. Pyrolysis 2013, 104, 485–493. [Google Scholar] [CrossRef] [Scilit]
- Suliman, W.; Harsh, J.B.; Abu-Lail, N.I.; Fortuna, A.M.; Dallmeyer, I.; Garcia-Perez, M. Influence of feedstock source and pyrolysis temperature on biochar bulk and surface properties. Biomass Bioenergy 2016, 84, 37–48. [Google Scholar] [CrossRef] [Scilit]
- Purakayastha, T.J.; Kumari, S.; Pathak, H. Characterisation, stability, and microbial effects of four biochars produced from crop residues. Geoderma 2015, 239–240, 293–303. [Google Scholar] [CrossRef] [Scilit]
- Zhang, J.; Liu, J.; Liu, R. Effects of pyrolysis temperature and heating time on biochar obtained from the pyrolysis of straw and lignosulfonate. Bioresour. Technol. 2015, 176, 288–291. [Google Scholar] [CrossRef] [Scilit]
- Angin, D. Effect of pyrolysis temperature and heating rate on biochar obtained from pyrolysis of safflower seed press cake. Bioresour. Technol. 2013, 128, 593–597. [Google Scholar] [CrossRef] [Scilit]
- Rubangakene, N.O.; Elwardany, A.; Fujii, M.; Sekiguchi, H.; Shokry, H. Influence of Impregnation of Sodium Carbonate Catalyst on Physicochemical Properties of Biochar. Eng. Proc. 2023, 37, 77. [Google Scholar] [CrossRef] [Scilit]
- He, X.; Liu, Z.; Niu, W.; Yang, L.; Zhou, T.; Qin, D.; Niu, Z.; Yuan, Q. Effects of pyrolysis temperature on the physicochemical properties of gas and biochar obtained from pyrolysis of crop residues. Energy 2018, 143, 746–756. [Google Scholar] [CrossRef] [Scilit]
- Al-wabel, M.I.; Alomran, A.; El-naggar, A.H.; Elsayed, M.; Nadim, A. Pyrolysis temperature induced changes in characteristics and chemical composition of biochar produced from conocarpus wastes. Bioresour. Technol. 2013, 131, 374–379. [Google Scholar] [CrossRef] [Scilit]
- Noor, N.M.; Shariff, A.; Abdullah, N.; Syairah, N.; Aziz, M. Temperature effect on biochar properties from slow pyrolysis of coconut flesh waste. Malays. J. Fundam. Appl. Sci. 2019, 15, 153–158. [Google Scholar] [CrossRef] [Scilit]
- Cheah, S.; Malone, S.C.; Feik, C.J. Speciation of sulfur in Biochar Produced from Pyrolysis and Gasification of Oak and Corn Stover. Environ. Sci. Technol. 2014, 48, 8474–8480. [Google Scholar] [CrossRef] [Scilit] [PubMed]
- Mary, S.; Niveditha, S.; Ramalakshmi, B. Production, characterization and evaluation of biochar from pod (Pisum sativum), leaf (Brassica oleracea) and peel (Citrus sinensis) wastes. Int. J. Recycl. Org. Waste Agric. 2016, 5, 43–53. [Google Scholar] [CrossRef] [Scilit]
- European Biochar Certificate. Guidelines for a Sustainable Production of Biochar Version 10.1 of 10th Jan 2022. 2022, pp. 1–63. Available online: https://european-biochar.org (accessed on 17 November 2025).
- Selvarajoo, A.; Oochit, D. Effect of pyrolysis temperature on product yields of palm fibre and its biochar characteristics. Mater. Sci. Energy Technol. 2020, 3, 575–583. [Google Scholar] [CrossRef] [Scilit]
- Waqas, M.; Aburiazaiza, A.S.; Miandad, R.; Rehan, M.; Barakat, M.A.; Nizami, A.S. Development of biochar as fuel and catalyst in energy recovery technologies. J. Clean. Prod. 2018, 188, 477–488. [Google Scholar] [CrossRef] [Scilit]
- Liu, Y.; Paskevicius, M.; Wang, H.; Parkinson, G.; Veder, J.P.; Hu, X.; Li, C.Z. Role of O-containing functional groups in biochar during the catalytic steam reforming of tar using the biochar as a catalyst. Fuel 2019, 253, 441–448. [Google Scholar] [CrossRef] [Scilit]
- Usman, A.R.A.; Abduljabbar, A.; Vithanage, M.; Sik, Y.; Ahmad, M.; Ahmad, M.; Elfaki, J.; Abdulazeem, S.S.; Al-wabel, M.I. Journal of Analytical and Applied Pyrolysis Biochar production from date palm waste: Charring temperature induced changes in composition and surface chemistry. J. Anal. Appl. Pyrolysis 2015, 115, 392–400. [Google Scholar] [CrossRef] [Scilit]
- Rubangakene, N.O.; Safo, K.; Shokry, H. Enhanced decontamination of cationic and anionic dye from aqueous solutions using Hybrid ultrasonicated eggshell biochar nanomaterial: Statistical optimization model, techno—Economic and sustainable approach. Environ. Sci. Pollut. Res. 2025, 32, 12304–12327. [Google Scholar] [CrossRef] [Scilit]
- Yuan, H.; Lu, T.; Huang, H.; Zhao, D.; Kobayashi, N.; Chen, Y. Influence of pyrolysis temperature on physical and chemical properties of biochar made from sewage sludge. J. Anal. Appl. Pyrolysis 2015, 112, 284–289. [Google Scholar] [CrossRef] [Scilit]
- Jia, Y.; Shi, S.; Liu, J.; Su, S.; Liang, Q.; Zeng, X.; Li, T. Study of the effect of pyrolysis temperature on the Cd2+ adsorption characteristics of biochar. Appl. Sci. 2018, 8, 1019. [Google Scholar] [CrossRef] [Scilit]
- Azargohar, R.; Nanda, S.; Kozinski, J.A.; Dalai, A.K.; Sutarto, R. Effects of temperature on the physicochemical characteristics of fast pyrolysis bio-chars derived from Canadian waste biomass. Fuel 2014, 125, 90–100. [Google Scholar] [CrossRef] [Scilit]
- Tongpoothorn, W.; Sriuttha, M.; Homchan, P.; Chanthai, S.; Ruangviriyachai, C. Preparation of activated carbon derived from Jatropha curcas fruit shell by simple thermo-chemical activation and characterization of their physico-chemical properties. Chem. Eng. Res. Des. 2010, 89, 335–340. [Google Scholar] [CrossRef] [Scilit]
- Liu, Y.; Zhu, Z.; Zhang, J.; Yang, X. Simulate the Process of Preparing Biochar by Pyrolysis of Biomass via Aspen Plus and Evaluate Its Economic; Springer: Berlin/Heidelberg, Germany, 2021; pp. 1–20. [Google Scholar]
- Zhang, J.; Huang, B.; Chen, L.; Du, J.; Li, W.; Luo, Z. Pyrolysis kinetics of hulless barley straw using the distributed activation energy model (DAEM) by the TG/DTA technique and SEM/XRD characterizations for hulless barley straw derived biochar. Braz. J. Chem. Eng. 2018, 35, 1039–1050. [Google Scholar] [CrossRef] [Scilit]
- Liu, X.Y.; Huang, M.; Ma, H.L.; Zhang, Z.Q.; Gao, J.M.; Zhu, Y.L.; Han, X.J.; Guo, X.Y. Preparation of a carbon-based solid acid catalyst by sulfonating activated carbon in a chemical reduction process. Molecules 2010, 15, 7188–7196. [Google Scholar] [CrossRef] [Scilit] [PubMed]

Disclaimer/Publisher’s Note: The statements, opinions and data contained in all publications are solely those of the individual author(s) and contributor(s) and not of MDPI and/or the editor(s). MDPI and/or the editor(s) disclaim responsibility for any injury to people or property resulting from any ideas, methods, instructions or products referred to in the content. |
© 2026 by the authors. Licensee MDPI, Basel, Switzerland. This article is an open access article distributed under the terms and conditions of the Creative Commons Attribution (CC BY) license.