


Abstract
Background: This study aimed to determine the prevalence of osteosarcopenia and evaluate the diagnostic performance of phase angle, derived from bioelectrical impedance analysis, in identifying osteosarcopenia among older adults with type 2 diabetes mellitus. Method: A cross-sectional study was conducted with 147 participants aged 60 years or older, recruited from an outpatient clinic in Thailand between during 2024. Osteosarcopenia was diagnosed when criteria for both sarcopenia, defined by low skeletal muscle mass and either reduced handgrip strength or impaired physical performance, and osteoporosis, defined by a T-score of −2.5 or lower on dual-energy X-ray absorptiometry, were met. Participant characteristics, physical function, laboratory values, and body composition data were collected. Univariable Firth’s penalized logistic regression identified low body mass index and a lower phase angle as independent predictors of osteosarcopenia. Results: The overall prevalence of osteosarcopenia was 7.5 percent. Receiver operating characteristic curve analysis showed strong diagnostic performance of phase angle, with an area under the curve of 0.865. A cutoff value of less than 4.0 degrees achieved 100% sensitivity, 62.5% specificity, and 100% negative predictive value. These findings suggest that phase angle may be a practical, noninvasive screening tool for identifying older adults with type 2 diabetes mellitus who are at risk for osteosarcopenia. Its application in routine clinical settings could enable earlier intervention and reduce long-term complications associated with musculoskeletal decline in this vulnerable population.
1. Introduction
Osteosarcopenia (OS), defined as the coexistence of sarcopenia and osteoporosis, signifies a severe decline in musculoskeletal health among older adults [1,2]. Because muscle and bone share mechanical, metabolic, and inflammatory pathways, OS reflects a combined deterioration that increases the risk of falls, fractures, disability, poor quality of life, and mortality beyond that of either condition alone [2,3,4,5,6,7]. Its reported prevalence ranges from 10.9% to over 20%, depending on the population, diagnostic criteria, and clinical setting [8]. Early detection is therefore essential to prevent functional decline and reduce the healthcare burden in aging populations [9].
Older adults with type 2 diabetes mellitus (T2DM) are particularly vulnerable to OS [10]. Age-related musculoskeletal decline [11], together with chronic hyperglycemia, insulin resistance, oxidative stress, and low-grade inflammation, impairs muscle protein synthesis, accelerates bone loss, and reduces bone quality [12,13]. Diabetes-related complications, including neuropathy, retinopathy, and vascular insufficiency, further impair mobility and increase fall risk [14]. However, OS remains underdiagnosed in this population, partly because standard assessments, such as physical performance testing and dual-energy X-ray absorptiometry, may be time-consuming or inaccessible in routine outpatient care [15].
Phase angle (PhA), derived from bioelectrical impedance analysis, is a simple, noninvasive marker of cellular membrane integrity, body cell mass, and tissue quality [16]. Low PhA has been associated with poor prognosis in several clinical conditions [17,18,19], and growing evidence links it to sarcopenia, low muscle quality, reduced bone mineral density, and osteoporosis [20,21,22]. Because PhA may reflect the shared deterioration of muscle and bone, it has strong potential as a practical screening marker for OS.
Although low PhA has been reported to predict OS and mortality in community-dwelling older adults, evidence in patients with T2DM remains limited [23]. Therefore, this study aimed to determine the prevalence of OS and to evaluate the diagnostic performance of PhA for identifying OS in older adults with T2DM. These findings may support the use of PhA as an accessible screening tool for early detection of musculoskeletal decline in this high-risk population.
2. Materials and Methods
2.1. Study Design and Participants
This cross-sectional study was conducted at the outpatient clinic of Phramongkutklao Hospital, Bangkok, Thailand during 2024. Eligible participants were adults aged ≥ 60 years with a confirmed diagnosis of T2DM for at least one year. Patients were enrolled consecutively after providing written informed consent. Sample size estimation was based on a prior study by Pechmann et al., which reported a prevalence of OS in patients with T2DM of 11.9% [24]. Because this was a cross-sectional study based on available clinical data. All eligible patients during the study period were included in the analysis. A total of 147 patients were enrolled.
Exclusion criteria included active malignancy, poorly controlled comorbidities, neuromuscular disorders, or immobility that prevented physical performance testing. Patients currently taking medications known to affect muscle or bone metabolism, such as corticosteroids or hormonal therapy, were also excluded.
2.2. Data Collection
Data were collected via structured face-to-face interviews and electronic medical record review using a standardized case report form. Collected variables included demographics, diabetes duration, comorbidities, family history, smoking and alcohol use, educational level, and current medications. Laboratory assessments were obtained from fasting blood samples and included fasting plasma glucose, glycated hemoglobin (HbA1c), serum albumin, 25-hydroxyvitamin D, high-sensitivity C-reactive protein (hs-CRP), blood urea nitrogen (BUN), creatinine, uric acid, triglycerides, HDL-C, and LDL-C. Urinary biomarkers included urine albumin and creatinine concentrations. Participants receiving bone-active medications (e.g., denosumab, bisphosphonates) were not excluded, as this study aimed to characterize a real-world clinical population; medication use was recorded but not used to adjust the regression analysis. Body composition was assessed using a BIA device (InBody® 970; InBody Co., Ltd., Seoul, Republic of Korea) to determine skeletal muscle mass, fat mass, and PhA. BMD was measured by DXA, with osteoporosis defined as a T-score ≤ −2.5 at the lumbar spine, total hip, femoral neck, or distal radius, with the diagnosis based on the lowest T-score among these sites.
2.3. Bioelectrical Impedance Analysis and Phase Angle Measurement
Body composition was assessed using a multifrequency BIA device (InBody®). To ensure consistent, reliable measurements, participants were instructed to fast overnight, avoid physical exertion for at least 8 h, and empty their bladder immediately before the assessment. During the BIA procedure, individuals stood barefoot on the device’s foot electrodes and lightly grasped the hand electrodes, with their arms resting in a neutral, fully extended position alongside the body. Electrode contact was secured by ensuring proper alignment of all fingers and proper placement of the feet on the designated sensor regions to optimize signal accuracy. The validity of multifrequency BIA devices, including InBody systems, for assessing body composition in older adults with T2DM has been previously established, with high agreement observed against dual-energy X-ray absorptiometry [25]. Nevertheless, PhA measurements remain susceptible to physiological and device-related factors, including hydration status, skin temperature, and instrument characteristics, which should be considered when interpreting the results.
Phase angle (PhA) was automatically calculated by the device using the following formula:
where Xc represents reactance, and R represents resistance.
2.4. Definition of Sarcopenia and Functional Assessment
Sarcopenia was diagnosed using the 2019 criteria from the Asian Working Group for Sarcopenia (AWGS), defined by a low skeletal muscle mass index (SMI < 7.0 kg/m2 for men and <5.7 kg/m2 for women) in combination with either low handgrip strength or impaired physical performance. Handgrip strength was assessed using a dynamometer. Physical performance was evaluated using the five-time chair stand test, and gait speed was measured over a 4.5 m walk [26]. OS was diagnosed when a participant met the criteria for both sarcopenia, as defined by AWGS 2019, and osteoporosis, defined as a T-score ≤ −2.5 at any measured site on DXA (lumbar spine, hip, femoral neck, or distal radius) [27]. The AWGS 2019 criteria were selected because they provide ethnicity-specific diagnostic thresholds validated for Asian populations, including Thai older adults, whereas the European Working Group on Sarcopenia in Older People 2 (EWGSOP2) criteria were derived primarily from European cohorts and may not be directly applicable to our study population.
2.5. Statistical Analysis
All analyses were conducted using SPSS version 29.0 (IBM Corp., Armonk, NY, USA). Continuous variables are reported as mean ± standard deviation (SD) for normally distributed data or as median with interquartile range (IQR) for skewed data. Categorical variables are presented as frequencies and percentages. Comparisons between the OS and non-OS groups were conducted using independent t-tests or Mann–Whitney U tests for continuous variables and chi-square or Fisher’s exact tests for categorical variables, as appropriate.
Univariate logistic regression analysis was conducted to assess associations between clinical and laboratory parameters and OS. Given the limited number of osteosarcopenia events (n = 11), variables with a p-value < 0.1 in the univariate analysis were re-analyzed using Firth’s penalized logistic regression to correct for small-sample bias; a multivariable model was not performed given the high risk of overfitting with this events-per-variable ratio.
The diagnostic performance of phase angle in identifying OS was evaluated using receiver operating characteristic (ROC) curve analysis. The area under the curve (AUC), sensitivity, specificity, positive predictive value, negative predictive value, and diagnostic accuracy were calculated. The optimal cutoff point for phase angle was determined using Youden’s index. A two-sided p-value < 0.05 was considered statistically significant.
2.6. Ethical Approval
This study was approved by the Institutional Review Board of the Royal Thai Army Medical Department, Bangkok, Thailand (IRBRTA R153h/66). All procedures involving human participants were conducted in accordance with the ethical standards of the institutional and national research committees and with the 1964 Declaration of Helsinki and its later amendments. Written informed consent was obtained from all participants before their inclusion in the study.
2.7. Data Availability
The datasets collected and analyzed in the current study are not publicly available due to institutional data protection policies, but they are available from the corresponding author upon reasonable request.
3. Results
3.1. Study Population Characteristics and Osteosarcopenia Prevalence
A total of 147 older adults with T2DM were enrolled in the study. The majority were female (72.8%), with a mean age of 73.0 ± 0.61 years. The most common comorbidities were dyslipidemia (87.1%) and hypertension (77.6%). Other comorbid conditions included cerebrovascular disease (16.3%), coronary artery disease or prior myocardial infarction (6.8%), and inactive cancer (6.2%). The median duration of diabetes was 10 years (IQR 5–20), and 69.4% of participants reported a family history of diabetes. Most patients had at least a secondary school education, while 30.1% had completed only primary education. Smoking and alcohol use were infrequent (1.4% and 8.2%, respectively) (Table 1).
Table 1.
Baseline characteristics of T2DM patients.
Regarding medication use, the majority were prescribed metformin (80.1%), statins (85.0%), and renin–angiotensin system (RAS) inhibitors (53.1%). Use of sodium-glucose cotransporter 2 inhibitors (SGLT-2i) and dipeptidyl peptidase-4 inhibitors (DPP-4i) was reported in 34.0% and 35.4% of participants, respectively. Notably, Denosumab use was significantly higher in patients with OS (18.2% vs. 2.2%, p = 0.045), whereas none of the osteosarcopenic patients were receiving SGLT-2 inhibitors (0.0% vs. 36.8%, p = 0.016). Polypharmacy, defined as the use of more than five medications, was observed in 3.4% of patients. Neuropathy screening using the monofilament test yielded abnormal results in 17.1% of patients, and diabetic retinopathy was observed in 11.6% (Table S1).
The overall prevalence of OS in this cohort was 7.5%. Among OS cases, affected individuals were significantly older (mean age 79.5 ± 2.0 vs. 72.9 ± 0.6 years, p = 0.004) and more likely to have received only primary education (72.7% vs. 26.7%, p = 0.009). There were no statistically significant differences between the groups in sex distribution, diabetes duration, prevalence of hypertension or dyslipidemia, smoking or alcohol use, or use of most other medication classes (Table 1).
3.2. Clinical, Physical, and Laboratory Profiles
In the assessment of physical fitness, patients with OS had significantly higher SARC-Calf scores than those without the condition. The median SARC-Calf score in the OS group was 13 (IQR 10–16), compared with 2 (IQR 1–5) in the non-OS group (p = 0.003). Furthermore, 63.6% of osteosarcopenic patients had a SARC-Calf score > 11, compared with 15.4% in the non-OS group (p = 0.001), indicating more severe impairment in sarcopenia-related domains. Other measures, including walking time, exercise frequency, fatigue, and frailty phenotype, did not significantly differ between the two groups (Table 2).
Table 2.
Physical fitness measurements of T2DM patients.
Body composition analysis revealed marked differences between groups. Patients with OS had significantly lower weight (46.15 ± 6.97 vs. 64.22 ± 12.92 kg, p < 0.001), height (152.82 ± 5.17 vs. 157.28 ± 7.33 cm, p = 0.049), and BMI (19.75 ± 2.72 vs. 25.91 ± 4.60 kg/m2, p < 0.001). A majority (72.7%) of osteosarcopenic patients fell within the normal BMI category, whereas 77.9% of non-osteosarcopenic patients were classified as overweight (p < 0.001). Additionally, the OS group had significantly lower calf circumference (31.57 ± 2.32 vs. 36.22 ± 4.93 cm, p = 0.002), waist circumference (82.91 ± 8.23 vs. 91.69 ± 13.57 cm, p = 0.037), and neck circumference (34.05 ± 2.31 vs. 37.91 ± 4.60 cm, p = 0.006) (Table 3).
Table 3.
Body composition measurement of T2DM patients.
Functional performance, as assessed by the five-time chair stand test, was significantly worse in the OS group (median 24.4 s vs. 16.9 s, p = 0.049). However, no statistically significant differences were observed in gait speed or in the proportion with impaired gait speed (<1 m/s), though trends toward slower performance were noted in the OS group. Handgrip strength was also significantly lower in this group (14.67 ± 6.07 vs. 19.36 ± 7.19 kg, p = 0.038). Body fat mass and skeletal muscle mass index (SMI) were significantly reduced in the OS group (SMI: 4.97 ± 0.49 vs. 6.49 ± 1.10 kg/m2, p < 0.001) (Table 3).
Laboratory evaluation showed that patients with OS had a significantly lower phase angle (3.25 ± 0.50 vs. 4.11 ± 0.62 degrees, p < 0.001). Hematologic parameters, including hemoglobin (11.09 ± 0.49 vs. 12.7 ± 0.15 g/dL, p = 0.004) and hematocrit (34.37 ± 1.44 vs. 38.95 ± 0.45%, p = 0.007), were also significantly reduced. Alkaline phosphatase (ALP) levels were lower in the OS group (58 [IQR 46–66] vs. 72.5 [IQR 60–91] U/L, p = 0.017). DXA demonstrated significantly lower bone mineral density in patients with OS across all measured sites. T-scores were significantly lower at the lumbar spine (−1.8 vs. −0.3), hip (−1.9 vs. −0.7), femoral neck (−2.3 vs. −1.3), and distal 1/3 radius (−3.69 vs. −0.98) (p < 0.01 for all) (Table S2).
3.3. Factors Associated with Osteosarcopenia
Univariate analysis of variables with a p-value less than 0.1 identified significant factors affecting the occurrence of osteosarcopenia (p < 0.05), including age (Crude OR 1.80 [95% CI 1.16, 2.78]), primary school education (Crude OR 6.62 [95% CI 1.80, 24.32]), SARC-Calf score >11 (Crude OR 8.95 [95% CI 2.55, 31.44]), BMI (Crude OR 1.70 [95% CI 1.28, 2.10]), calf circumference (Crude OR 1.13 [95% CI 1.01, 1.26]), waist circumference (Crude OR 1.04 [95% CI 1.00, 1.08]), neck circumference (Crude OR 1.55 [95% CI 1.16, 2.06]), five-time chair stand (Crude OR 1.08 [95% CI 1.00, 1.17]), handgrip strength (Crude OR 1.11 [95% CI 1.00, 1.24]), body fat mass (Crude OR 1.19 [95% CI 1.05, 1.33]), skeletal muscle mass index (Crude OR 7.13 [95% CI 2.57, 19.77]), phase angle (Crude OR 10.37 [95% CI 2.97, 36.21]), hematocrit (Crude OR 1.16 [95% CI 1.04, 1.31]), and hemoglobin (Crude OR 1.68 [95% CI 1.15, 2.45]) (Table S3).
3.4. Diagnostic Performance of Phase Angle
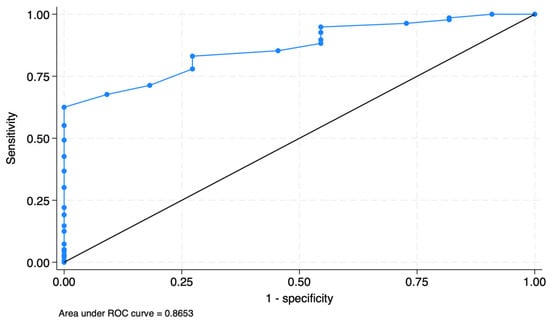
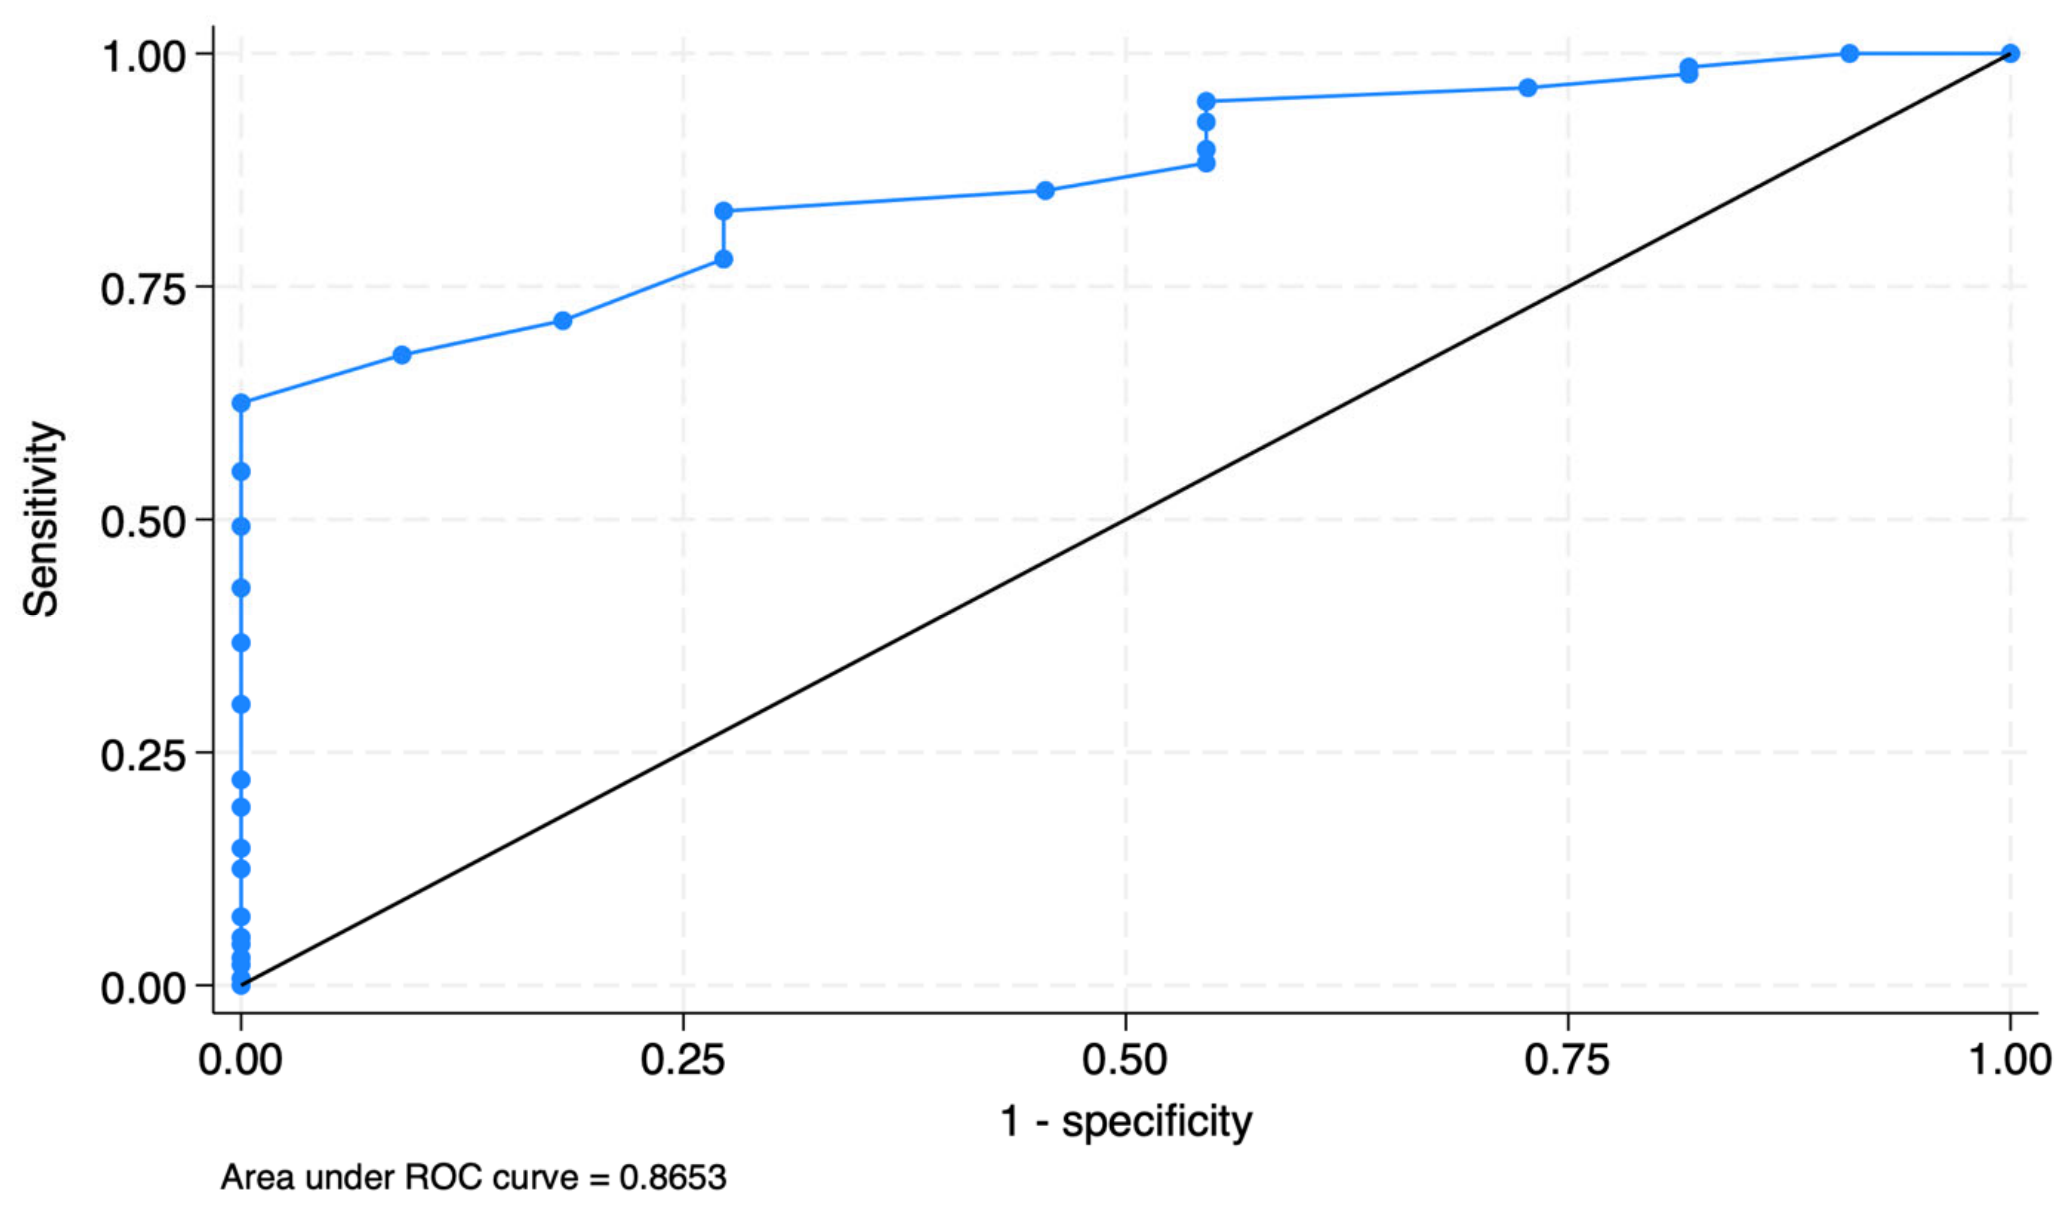
ROC analysis showed that phase angle had high diagnostic accuracy for OS, with an area under the curve (AUC) of 0.865 (95% CI: 0.783–0.947; p < 0.001). The optimal cutoff value, determined using the maximum Youden’s index, was <4.0° (Figure 1; Table 4).
Figure 1.
Receiver operating characteristic (ROC) curve analysis of phase angle for predicting osteosarcopenia.
Table 4.
Performance of phase angle for predicting osteosarcopenia in T2DM patients.
At this threshold, phase angle achieved 100.0% sensitivity (95% CI: 71.6–100.0%) and 62.5% specificity (95% CI: 53.8–70.6%). The negative predictive value was 100.0%, and the overall diagnostic accuracy was 65.3%, supporting the utility of phase angle as a noninvasive screening biomarker for OS in older adults with T2DM (Table 5).
Table 5.
Diagnostic test evaluation of phase angle.
4. Discussion
To our knowledge, this is the first study to determine a cutoff value for PhA to identify OS in elderly patients with T2DM. This study examined the prevalence and clinical characteristics of OS in older adults with T2DM and evaluated the diagnostic utility of BIA-derived PhA. Among the 147 participants, the prevalence of OS was 7.5%, reflecting a clinically relevant burden of musculoskeletal decline in this population. Univariable Firth’s penalized logistic regression analysis identified low BMI and reduced PhA as independent predictors of OS. Additionally, PhA demonstrated excellent diagnostic performance, with an AUC of 0.865 and 100% sensitivity at the optimal cutoff point of <4.0°. These findings underscore the potential of PhA as a simple, noninvasive screening tool for OS in older adults with T2DM.
In this study, the prevalence of OS among older adults with T2DM was 7.5%, which appears lower than the prevalence reported in several studies. Prior European studies have shown wide variation in prevalence, ranging from 1.5% to 32.7%, depending on the study setting and population characteristics. For example, a Danish community-based study reported a prevalence of 1.5%, compared with 8% in a German hospital cohort, 14.2% in an Austrian hospital population, and as high as 32.7% in a French inpatient sample [28,29,30,31]. In Australia, the prevalence has been reported at 36% [32]. Higher rates have also been observed in Asian populations, with reported prevalence ranging from 11.9% to 39.3% [33,34,35,36]. Several factors may explain these discrepancies. First, many previous studies included hospitalized or functionally impaired individuals, whereas the present study enrolled relatively well-functioning, ambulatory outpatients, which may account for the lower observed prevalence [36]. Second, differences in ethnicity, baseline body composition, dietary patterns, and physical activity levels may influence musculoskeletal health across populations [37,38]. Lastly, variations in research methodology, such as differences in diagnostic criteria for sarcopenia and the anatomical sites assessed for bone density, may contribute to inconsistencies in prevalence estimates [39,40]. These findings underscore the importance of generating context-specific data to inform appropriate screening strategies for OS in older adults with T2DM.
The present study demonstrated that PhA was strongly and significantly associated with OS in older adults with T2DM, with lower PhA associated with a substantially increased risk of OS. Furthermore, PhA showed excellent diagnostic performance, with a cutoff value of <4.0° yielding 100% sensitivity and a negative predictive value of 100%. These findings suggest that PhA may serve as a reliable screening tool to rule out OS in high-risk populations. In comparison, a study by Sepúlveda-Loyola et al. identified a PhA cutoff value of ≤6.07° with lower diagnostic performance (AUC 0.687) than that observed in our study [23]. Notably, their study was conducted in community-dwelling older adults and did not specifically target individuals with T2DM, which may explain the higher threshold and reduced accuracy. The enhanced discriminative performance in our study may reflect the distinct pathophysiological features of the diabetic population, such as altered body composition and systemic inflammation, which further impact cellular health and membrane integrity [41,42].
An important consideration when interpreting these findings is that the median HbA1c in our cohort was relatively well controlled at 6.8%. The pathophysiology of diabetes-related bone and muscle degradation is closely linked to the accumulation of advanced glycation end-products (AGEs), chronic inflammation, and oxidative stress, which are typically more pronounced in patients with poorly controlled, longstanding hyperglycemia. As our study population predominantly had good glycemic control, our findings—including the proposed PhA cutoff—may not be directly generalizable to individuals with poorly controlled diabetes, in whom greater AGE accumulation and microvascular complications could further alter musculoskeletal integrity and shift the optimal diagnostic threshold. External validation in cohorts with a broader range of glycemic control is therefore warranted.
The clinical implications of these findings are substantial. Given the growing burden of musculoskeletal decline in the aging diabetic population [43], early detection of OS is crucial to initiate timely interventions that can prevent disability, falls, and fractures. Identifying PhA as an independent, highly sensitive screening marker offers a practical alternative to more resource-intensive diagnostic tools such as DXA. Widely available, cost-effective, and noninvasive, PhA is well suited for routine use in outpatient care [44]. Incorporating PhA into standard assessment may help clinicians better stratify risk, monitor disease progression, and tailor interventions such as resistance training, nutritional optimization, or pharmacologic management to preserve musculoskeletal function. These findings support the potential role of PhA as a valuable addition to clinical screening algorithms for OS in older adults with T2DM. Although the identified PhA cutoff demonstrated excellent sensitivity, its moderate specificity indicates a relatively high false-positive rate. Therefore, PhA should be regarded as a screening tool to identify individuals requiring further evaluation rather than as a definitive diagnostic test for osteosarcopenia.
This study has several strengths. It is among the first to investigate the diagnostic utility of PhA specifically in older adults with T2DM. The study employed standardized criteria for diagnosing sarcopenia and osteoporosis and included a comprehensive assessment of body composition, physical function, and bioelectrical parameters, which enhance the robustness and clinical relevance of the findings. However, several limitations should be noted. First, the cross-sectional design does not permit determination of a causal relationship between PhA and the development of OS. Second, the study was conducted at a single center with a modest sample size, which may affect the generalizability of the results. Third, although BIA is a convenient tool, PhA values can be influenced by hydration status and measurement conditions, which may introduce variability. Hydration status was not independently assessed at the time of measurement, and its potential influence on PhA values could not be fully accounted for, particularly among participants with diabetic nephropathy, in whom fluid balance is more likely to be altered. In addition, denosumab use was significantly more common among participants with osteosarcopenia, which likely reflects prior treatment for pre-existing osteoporosis rather than an independent risk factor. Because bone-active therapies may partially modify bone mineral density and thereby mask the true severity of underlying bone loss, their use could introduce reverse-causality bias or attenuate the observed association between phase angle and osteosarcopenia; this should be considered when interpreting our findings. We also acknowledge a potential circularity in our diagnostic approach: both skeletal muscle mass index (used to diagnose sarcopenia) and phase angle are derived from the same bioelectrical impedance analysis session. However, phase angle is calculated directly from raw resistance and reactance values, whereas skeletal muscle mass index is estimated using separate, proprietary regression equations; although related, these represent distinct physiological constructs. Nonetheless, this shared measurement origin should be considered when interpreting the diagnostic performance of phase angle for osteosarcopenia in this study. Additionally, this study did not perform repeated PhA measurements within participants to formally assess test–retest reliability; although InBody devices have demonstrated good reproducibility in previous studies of other populations, repeatability specific to older adults with T2DM was not evaluated in the present cohort and should be addressed in future studies. Lastly, the relatively low prevalence of OS in the sample may limit statistical power for subgroup analysis. These limitations should be addressed in future studies with longitudinal designs and larger, multicenter cohorts.
5. Conclusions
PhA demonstrated excellent diagnostic performance and may serve as a practical, noninvasive rule-out screening tool in older adults with T2DM, particularly in outpatient settings. Given its moderate specificity, a positive PhA screen should prompt further diagnostic evaluation (e.g., DXA and functional assessment) rather than be used to confirm the diagnosis of osteosarcopenia. These findings highlight the potential value of incorporating PhA into routine clinical assessments to identify patients at risk of musculoskeletal decline. Further longitudinal studies with larger and more diverse populations are warranted to validate these findings and to determine whether early interventions based on PhA monitoring can improve clinical outcomes in this high-risk population.
Supplementary Materials
The following supporting information can be downloaded at: https://www.mdpi.com/article/10.3390/diabetology7080149/s1, Table S1: Baseline characteristics of T2DM patients; Table S2: Laboratory and bone mineral density result of T2DM patient. Table S3: Univariable of factors associated with osteosarcopenia.
Author Contributions
T.L., J.P., M.P. and K.L. designed the study and collected and managed the data. T.L., J.P., M.P., K.L., C.B. and T.S. interpreted the findings and drafted the manuscript. P.S. supervised the study and critically reviewed the manuscript. All authors have read and agreed to the published version of the manuscript.
Funding
This research was supported by a grant from the Thai Osteoporosis Foundation (TOPF). The funding organization had no role in the study design, data collection, analysis, interpretation, or manuscript preparation.
Institutional Review Board Statement
The study was approved by the Institutional Review Board of the Royal Thai Army Medical Department (Approval Code: IRBRTA R153h/66), with an approval date of 26 January 2024.
Informed Consent Statement
Informed consent was obtained from all subjects involved in the study.
Data Availability Statement
The original contributions presented in this study are included in the article/Supplementary Materials. Further inquiries can be directed to the corresponding author.
Conflicts of Interest
The authors declare no conflicts of interest.
References
- Clynes, M.A.; Gregson, C.L.; Bruyère, O.; Cooper, C.; Dennison, E.M. Osteosarcopenia: Where osteoporosis and sarcopenia collide. Rheumatology 2021, 60, 529–537. [Google Scholar] [CrossRef] [Scilit] [PubMed]
- Kirk, B.; Zanker, J.; Duque, G. Osteosarcopenia: Epidemiology, diagnosis, and treatment—Facts and numbers. J. Cachexia Sarcopenia Muscle 2020, 11, 609–618. [Google Scholar] [CrossRef] [Scilit] [PubMed]
- Colón, C.J.P.; Molina-Vicenty, I.L.; Frontera-Rodríguez, M.; García-Ferré, A.; Rivera, B.P.; Cintrón-Vélez, G.; Rivera, B.P.; Cintrón-Vélez, G.; Frontera-Rodríguez, S. Muscle and Bone Mass Loss in the Elderly Population: Advances in diagnosis and treatment. J. Biomed. 2018, 3, 40–49. [Google Scholar] [CrossRef] [Scilit] [PubMed]
- Binkley, N.; Buehring, B. Beyond FRAX®: It’s Time to Consider “Sarco-Osteopenia”. J. Clin. Densitom. 2009, 12, 413–416. [Google Scholar] [CrossRef] [Scilit] [PubMed]
- Pisani, P.; Renna, M.D.; Conversano, F.; Casciaro, E.; Di Paola, M.; Quarta, E.; Muratore, M.; Casciaro, S. Major osteoporotic fragility fractures: Risk factor updates and societal impact. World J. Orthop. 2016, 7, 171. [Google Scholar] [CrossRef] [Scilit] [PubMed]
- Shimada, H.; Suzuki, T.; Doi, T.; Lee, S.; Nakakubo, S.; Makino, K.; Arai, H. Impact of osteosarcopenia on disability and mortality among Japanese older adults. J. Cachexia Sarcopenia Muscle 2023, 14, 1107–1116. [Google Scholar] [CrossRef] [Scilit] [PubMed]
- Teng, Z.; Zhu, Y.; Teng, Y.; Long, Q.; Hao, Q.; Yu, X.; Yang, L.; Lv, Y.; Liu, J.; Zeng, Y.; et al. The analysis of osteosarcopenia as a risk factor for fractures, mortality, and falls. Osteoporos. Int. 2021, 32, 2173–2183. [Google Scholar] [CrossRef] [Scilit] [PubMed]
- Chen, S.; Xu, X.; Gong, H.; Chen, R.; Guan, L.; Yan, X.; Zhou, L.; Yang, Y.; Wang, J.; Zhou, J.; et al. Global epidemiological features and impact of osteosarcopenia: A comprehensive meta-analysis and systematic review. J. Cachexia Sarcopenia Muscle 2024, 15, 8–20. [Google Scholar] [PubMed]
- Smit, A.E.; Meijer, O.C.; Winter, E.M. The multi-faceted nature of age-associated osteoporosis. Bone Rep. 2024, 20, 101750. [Google Scholar] [CrossRef] [Scilit] [PubMed]
- Xiao, T.; Zou, S.; Luo, T.; Lai, J.; Ying, J.; Lin, M. Prevalence and risk factors of osteosarcopenia in elderly patients with uncontrolled type 2 diabetes. Endocrine 2024, 87, 59–66. [Google Scholar] [CrossRef] [Scilit] [PubMed]
- Leser, J.M.; Harriot, A.; Buck, H.V.; Ward, C.W.; Stains, J.P. Aging, Osteo-Sarcopenia, and Musculoskeletal Mechano-Transduction. Front. Rehabil. Sci. 2021, 2, 782848. [Google Scholar] [CrossRef] [Scilit] [PubMed]
- Gaur, K.; Mohapatra, L.; Wal, P.; Parveen, A.; Kumar, S.; Gupta, V. Deciphering the mechanisms and effects of hyperglycemia on skeletal muscle atrophy. Metab. Open 2024, 24, 100332. [Google Scholar] [CrossRef] [Scilit] [PubMed]
- Napoli, N.; Chandran, M.; Pierroz, D.D.; Abrahamsen, B.; Schwartz, A.V.; Ferrari, S.L. Mechanisms of diabetes mellitus-induced bone fragility. Nat. Rev. Endocrinol. 2017, 13, 208–219. [Google Scholar] [CrossRef] [Scilit] [PubMed]
- D’Silva, L.J.; Lin, J.; Staecker, H.; Whitney, S.L.; Kluding, P.M. Impact of Diabetic Complications on Balance and Falls: Contribution of the Vestibular System. Phys. Ther. 2016, 96, 400–409. [Google Scholar] [CrossRef] [Scilit] [PubMed]
- Nguyen, H.G.; Lieu, K.B.; Ho-Le, T.P.; Ho-Pham, L.T.; Nguyen, T.V. Discordance between quantitative ultrasound and dual-energy X-ray absorptiometry in bone mineral density: The Vietnam Osteoporosis Study. Osteoporos. Sarcopenia 2021, 7, 6–10. [Google Scholar] [CrossRef] [Scilit] [PubMed]
- da Costa Pereira, J.P.; Rebouças, A.d.S.; Prado, C.M.; Gonzalez, M.C.; Cabral, P.C.; Diniz, A.d.S.; Fayh, A.P.T.; Silva, F.M. Phase angle as a marker of muscle quality: A systematic review and meta-analysis. Clin. Nutr. 2024, 43, 308–326. [Google Scholar] [CrossRef] [Scilit] [PubMed]
- Shin, J.; Hwang, J.H.; Han, M.; Cha, R.H.; Kang, S.H.; An, W.S.; Kim, J.C.; Kim, S.H. Phase angle as a marker for muscle health and quality of life in patients with chronic kidney disease. Clin. Nutr. 2022, 41, 1651–1659. [Google Scholar] [CrossRef] [Scilit] [PubMed]
- Axelsson, L.; Silander, E.; Bosaeus, I.; Hammerlid, E. Bioelectrical phase angle at diagnosis as a prognostic factor for survival in advanced head and neck cancer. Eur. Arch. Otorhinolaryngol. 2018, 275, 2379–2386. [Google Scholar] [CrossRef] [Scilit] [PubMed]
- Vicenski, P.P.; Naslowski, J.B.; Rabito, E.I.; Gonzalez, M.C.; Madalozzo Schieferdecker, M.E. Unveiling mortality predictors: Exploring phase angle as a prognostic indicator in adult and elderly patients on home enteral nutrition in curitiba. Clin. Nutr. Open Sci. 2024, 58, 326–336. [Google Scholar] [CrossRef] [Scilit]
- Wu, H.; Ding, P.; Wu, J.; Yang, P.; Tian, Y.; Zhao, Q. Phase angle derived from bioelectrical impedance analysis as a marker for predicting sarcopenia. Front. Nutr. 2022, 9, 1060224. [Google Scholar] [CrossRef] [Scilit] [PubMed]
- Tanaka, S.; Ando, K.; Kobayashi, K.; Hida, T.; Ito, K.; Tsushima, M.; Morozumi, M.; Machino, M.; Ota, K.; Seki, T.; et al. A low phase angle measured with bioelectrical impedance analysis is associated with osteoporosis and is a risk factor for osteoporosis in community-dwelling people: The Yakumo study. Arch. Osteoporos. 2018, 13, 39. [Google Scholar] [CrossRef] [Scilit] [PubMed]
- Han, B.G.; Pak, D.; Lee, J.Y.; Kim, J.S.; Yang, J.W.; Kim, S. Interaction Effect of Phase Angle and Age on Femoral Neck Bone Mineral Density in Patients with Non-Dialysis Chronic Kidney Disease Stage 5. Nutrients 2023, 15, 1680. [Google Scholar] [CrossRef] [Scilit] [PubMed]
- Sepulveda-loyola, W.; De Barros Morselli, J.; Araya-Quintanilla, F.; Teixeira, D.; Alvarez-Bustos, A.; Molari, M.; Valenzuela-Fuenzalida, J.J.; Probst, V.S. Clinical impact of osteosarcopenia on mortality, physical function and chronic inflammation: A 9-year follow up cohort study. Nutr. Clínica Dietética Hosp. 2023, 43, 133–140. [Google Scholar] [CrossRef] [Scilit]
- Pechmann, L.M.; Petterle, R.R.; Moreira, C.A.; Borba, V.Z.C. Osteosarcopenia and trabecular bone score in patients with type 2 diabetes mellitus. Arch. Endocrinol. Metab. 2021, 65, 801–810. [Google Scholar] [CrossRef] [Scilit] [PubMed]
- Buch, A.; Ben-Yehuda, A.; Rouach, V.; Maier, A.B.; Greenman, Y.; Izkhakov, E.; Stern, N.; Eldor, R. Validation of a multi-frequency bioelectrical impedance analysis device for the assessment of body composition in older adults with type 2 diabetes. Nutr. Diabetes 2022, 12, 47. [Google Scholar] [CrossRef] [Scilit] [PubMed]
- Chen, L.K.; Woo, J.; Assantachai, P.; Auyeung, T.W.; Chou, M.Y.; Iijima, K.; Jang, H.C.; Kang, L.; Kim, M.; Kim, S.; et al. Asian Working Group for Sarcopenia: 2019 Consensus Update on Sarcopenia Diagnosis and Treatment. J. Am. Med. Dir. Assoc. 2020, 21, 300–307.e2. [Google Scholar] [CrossRef] [Scilit] [PubMed]
- Kanis, J.A.; McCloskey, E.V.; Johansson, H.; Oden, A.; Melton, L.J.; Khaltaev, N. A reference standard for the description of osteoporosis. Bone 2008, 42, 467–475. [Google Scholar] [CrossRef] [Scilit] [PubMed]
- Nielsen, B.R.; Andersen, H.E.; Haddock, B.; Hovind, P.; Schwarz, P.; Suetta, C. Prevalence of muscle dysfunction concomitant with osteoporosis in a home-dwelling Danish population aged 65–93 years—The Copenhagen Sarcopenia Study. Exp. Gerontol. 2020, 138, 110974. [Google Scholar] [CrossRef] [Scilit] [PubMed]
- Pourhassan, M.; Buehring, B.; Stervbo, U.; Rahmann, S.; Mölder, F.; Rütten, S.; Trampisch, U.; Babel, N.; Westhoff, T.H.; Wirth, R. Osteosarcopenia, an Asymmetrical Overlap of Two Connected Syndromes: Data from the OsteoSys Study. Nutrients 2021, 13, 3786. [Google Scholar] [CrossRef] [Scilit] [PubMed]
- Mathieu, M.; Guillot, P.; Riaudel, T.; Boureau, A.S.; Chapelet, G.; Brouessard, C.; de Decker, L.; Berrut, G. Association between Bone Mineral Density and Fat Mass Independent of Lean Mass and Physical Activity in Women Aged 75 or Older. Nutrients 2021, 13, 1994. [Google Scholar] [CrossRef] [Scilit] [PubMed]
- Reiss, J.; Iglseder, B.; Alzner, R.; Mayr-Pirker, B.; Pirich, C.; Kässmann, H.; Kreutzer, M.; Dovjak, P.; Reiter, R. Sarcopenia and osteoporosis are interrelated in geriatric inpatients. Z. Gerontol. Geriatr. 2019, 52, 688–693. [Google Scholar] [CrossRef] [Scilit] [PubMed]
- Bani Hassan, E.; Vogrin, S.; Hernandez Viña, I.; Boersma, D.; Suriyaarachchi, P.; Duque, G. Hemoglobin Levels are Low in Sarcopenic and Osteosarcopenic Older Persons. Calcif. Tissue Int. 2020, 107, 135–142. [Google Scholar] [CrossRef] [Scilit] [PubMed]
- Chew, J.; Yeo, A.; Yew, S.; Tan, C.N.; Lim, J.P.; Hafizah Ismail, N.; Lim, W.S. Nutrition Mediates the Relationship between Osteosarcopenia and Frailty: A Pathway Analysis. Nutrients 2020, 12, 2957. [Google Scholar] [CrossRef] [Scilit] [PubMed]
- Saeki, C.; Kanai, T.; Nakano, M.; Oikawa, T.; Torisu, Y.; Abo, M.; Saruta, M.; Tsubota, A. Relationship between Osteosarcopenia and Frailty in Patients with Chronic Liver Disease. J. Clin. Med. 2020, 9, 2381. [Google Scholar] [CrossRef] [Scilit] [PubMed]
- Okayama, A.; Nakayama, N.; Kashiwa, K.; Horinouchi, Y.; Fukusaki, H.; Nakamura, H.; Katayama, S. Prevalence of Sarcopenia and Its Association with Quality of Life, Postural Stability, and Past Incidence of Falls in Postmenopausal Women with Osteoporosis: A Cross-Sectional Study. Healthcare 2022, 10, 192. [Google Scholar] [CrossRef] [Scilit] [PubMed]
- Yoo, J.I.; Kim, H.; Ha, Y.C.; Kwon, H.B.; Koo, K.H. Osteosarcopenia in Patients with Hip Fracture Is Related with High Mortality. J. Korean Med. Sci. 2018, 33, 37–45. [Google Scholar] [CrossRef] [Scilit] [PubMed]
- Karnes, J.H.; Arora, A.; Feng, J.; Steiner, H.E.; Sulieman, L.; Boerwinkle, E.; Clark, C.; Cicek, M.; Cohn, E.; Gebo, K.; et al. Racial, ethnic, and gender differences in obesity and body fat distribution: An All of Us Research Program demonstration project. PLoS ONE 2021, 16, e0255583. [Google Scholar] [CrossRef] [Scilit] [PubMed]
- Yu, T.; Oguma, Y.; Asakura, K.; Takayama, M.; Abe, Y.; Arai, Y. The relationship between dietary pattern and physical activity combinations to physical performance in 85+ Japanese population: A cross-sectional study from the TOOTH study. Arch. Gerontol. Geriatr. Plus 2024, 1, 100038. [Google Scholar] [CrossRef] [Scilit]
- Chiu, W.C.; Kao, T.W.; Peng, T.C. Prevalence of sarcopenia in Asian older adults: A comparison of nine diagnostic criteria across different regions. Exp. Gerontol. 2025, 202, 112721. [Google Scholar] [CrossRef] [Scilit] [PubMed]
- Azami, A.; Anari, H.; Iranparvar, M.; Azizi, A.; Habibzadeh, A. Comparison of Bone Mineral Densitometry at 2 Sites Versus 3 Sites in Patients Suspicious for Osteoporosis. Clin. Med. Insights Arthritis Musculoskelet. Disord. 2019, 12, 1179544119849017. [Google Scholar] [CrossRef] [Scilit] [PubMed]
- Park, S.W.; Goodpaster, B.H.; Lee, J.S.; Kuller, L.H.; Boudreau, R.; de Rekeneire, N.; Harris, T.B.; Kritchevsky, S.; Tylavsky, F.A.; Nevitt, M.; et al. Excessive Loss of Skeletal Muscle Mass in Older Adults With Type 2 Diabetes. Diabetes Care 2009, 32, 1993–1997. [Google Scholar] [CrossRef] [Scilit] [PubMed]
- Zhao, L.; Hu, H.; Zhang, L.; Liu, Z.; Huang, Y.; Liu, Q.; Jin, L.; Zhu, M.; Zhang, L. Inflammation in diabetes complications: Molecular mechanisms and therapeutic interventions. MedComm 2024, 5, e516. [Google Scholar] [CrossRef] [Scilit] [PubMed]
- Izzo, A.; Massimino, E.; Riccardi, G.; Della Pepa, G. A Narrative Review on Sarcopenia in Type 2 Diabetes Mellitus: Prevalence and Associated Factors. Nutrients 2021, 13, 183. [Google Scholar] [CrossRef] [Scilit] [PubMed]
- Gomes, K.; Desbrow, B.; Irwin, C.; Roberts, S. Patient and Staff Perceptions on Using Bioelectrical Impedance Analysis in an Outpatient Haemodialysis Setting: A Qualitative Descriptive Study. Healthcare 2022, 10, 1205. [Google Scholar] [CrossRef] [Scilit] [PubMed]

Disclaimer/Publisher’s Note: The statements, opinions and data contained in all publications are solely those of the individual author(s) and contributor(s) and not of MDPI and/or the editor(s). MDPI and/or the editor(s) disclaim responsibility for any injury to people or property resulting from any ideas, methods, instructions or products referred to in the content. |
© 2026 by the authors. Licensee MDPI, Basel, Switzerland. This article is an open access article distributed under the terms and conditions of the Creative Commons Attribution (CC BY) license.