


Abstract
Background: Type 1 diabetes (T1D) is a complex autoimmune disease demonstrating substantial heterogeneity in age of onset, residual C-peptide levels, clinical outcomes, and therapeutic response. Although the autoimmune classification of T1D has traditionally relied on detection of autoantibodies indicating B-cell involvement, studies targeting total CD3+ T cells have underscored the importance of T-cell regulation. Th40 cells, a pathogenic subset of CD3+ T cells, first identified in NOD mice, become significantly increased during diabetogenesis. Human subjects with T1D exhibit variable but significantly elevated Th40 levels in peripheral blood. Methods: To target pathogenic effector Th40 cells, we developed OPT101, a 15-mer peptide, and found that it interacts with CD40 in association with an activated integrin, identifying a novel inflammatory receptor complex. We conducted a phase 1b, double-blind, first-in-human clinical trial to evaluate OPT101 and met the primary objectives of safety and tolerability. Results: OPT101 generated only Grade 1 and 2 adverse events. Across eight doses, administered over six weeks, no product-related immune suppression was observed. Secondary objectives included immunologic outcomes and potential efficacy. Subjects with higher Th40 levels had low or undetectable C-peptide, higher (>7.0%) HbA1c, and elevated inflammatory cytokines. Th40 levels were significantly higher in subjects diagnosed before age eighteen. OPT101 treatment significantly reduced Th40 percentages without cell ablation, increased Treg levels, and decreased inflammatory cytokines. Serum blood glucose levels and HbA1c were significantly reduced by visit 8 in treated subjects. In two subjects, 11 and 13 years post-diagnosis, with undetectable C-peptide at screening, C-peptide became detectable post-treatment. Conclusions: OPT101 proved safe and effective in human T1D subjects with only mild and a few moderate adverse events. In this short-term study, OPT101 improved beta cell functions thus warranting further exploration.
1. Introduction
Diabetes is a complex disease that is better described as a heterogenous spectrum of subtypes defined by distinct functional and pathobiological mechanisms with a common outcome [1,2,3]. The multiple subtypes have been described by clinical variables and a machine learning approach to include severe autoimmune diabetes (SAID), severe insulin-deficient diabetes (SIDD), severe insulin-resistant diabetes (SIRD), and mild age-related diabetes (MARD) [4,5,6]. Classically defined type 1 diabetes (T1D), or autoimmune diabetes, is more heterogenous than originally described, exemplified by variation in the age of onset, variable disease progression differences within patients, varied levels of residual insulin production as suggested by C-peptide detection, differences in immune contributors, and differences in therapeutic response [1]. Defining the autoimmune component has relied solely on the presence of one or more of five autoantibodies, particularly GAD-antibody (GADA), which is more common in later-onset disease [7,8,9,10]. The cumulative autoimmunity results in severe beta cell failure represented by low or rapidly declining C-peptide, early insulin dependence, and an elevated percentage of glycated HbA1c [11,12].
For cases of insulin-dependent diabetes, the standard of care involves life-long insulin therapy, yet only a small number of people with T1D achieve the American Diabetes Association (ADA) goal (<6.5%) for glycated hemoglobin A1c (HbA1c) [13]. Clearly, replacing insulin does not impact disease cause or persistence. Disease-modifying, particularly immune-modulating, therapies have improved disease control and, in some cases, delayed onset. Currently, approaches include T-cell-directed therapies such as teplizumab, anti-thymocyte globulin, and abatacept as well as antigen-specific therapies targeting insulin and GAD. These approaches attempt tolerance induction, and, recently, a combination of T-cell-directed and tolerogenic therapies have been employed [14]. There has been some success in delaying T1D onset, and TeplizumabTM has been FDA-approved for T1D prevention [15]. However, those therapies have created multiple adverse events including immune suppression. There is a need to expand the portfolio of available therapies and better-defined biomarkers. An ideal scenario is biomarkers that describe theratypes of T1D patients who would benefit from the directed therapeutic approach.
In murine T1D models, the disease process begins when peripheral macrophages and dendritic cells invade the pancreatic islets, followed by T and B lymphocytes that intensify and maintain insulitis. Insulitis causes either complete loss or a substantial decrease in insulin production. However, many human patients retain measurable (residual) C-peptide, even 20 years post-diagnosis [16]. Nonetheless, those subjects require exogenous insulin to maintain glycemic control and avoid life-threatening ketoacidosis. Among islet infiltrating cells are a subset of CD4+ T cells that express the CD40 receptor, Th40 cells [17]. In young (3-week-old) NOD mice prior to islet infiltration, Th40 cells are dramatically increased in pancreatic lymph nodes and become detectable in islets. Chronologically, as NOD mice develop T1D, Th40 cell numbers increase in the peripheral blood and spleen and remain elevated throughout the lifespan [18]. When isolated from diabetic NOD or from pre-diabetic pancreatic lymph nodes, Th40 cells transfer T1D to NOD.scid recipients [18]. In translational studies, peripheral blood percentages and numbers of Th40 cells are significantly increased in human T1D subjects compared to healthy controls (HCs) [19]. Th40 cell number expansions were shown in high-risk, autoantibody-positive stage 1 and stage 2 T1D subjects correlating with disease development [19]. We propose Th40 cell number and percentage increases as biomarkers for autoimmune inflammation [19] and that targeting those cells rather than all T cells will achieve a beneficial theratype approach.
On Th40 cells, CD40 functions as a costimulatory molecule that induces multiple inflammatory cytokines, including IFNγ, TNFα, IL1β, IL-6, and IL-17. Initial attempts to regulate CD40 interaction with its primary ligand CD154 focused on monoclonal antibodies targeting CD154, but cases of thrombotic emboli were reported [20,21]. As an alternative to monoclonal antibodies, we developed small peptides, up to 15-amino acids, to target CD40-CD154 interaction. The peptides were derived from the CD154 protein sequence and include a motif described by crystallography and mutational analysis to interact with the CD40 receptor. Mechanistic studies revealed that the OPT101 peptide interacts with CD40 when associated with activated integrins, thereby defining a novel disease target, a CD40/Integrin complex [22]. Studies were conducted using OPT101 where the peptide prevented diabetes onset and, importantly, performed as an intervention, reversing hyperglycemia in NOD mice.
Here, we report on a first-in-human double-blinded, clinical safety study of OPT101. A phase 1a single ascending dose (SAD) study was conducted in healthy controls that was expanded to a multiple-ascending-dose (MAD) phase 1b clinical study in adults with T1D. This study’s primary objective was to assess the safety and tolerability of OPT101 in T1D. Secondary objectives included collection and analysis of immunological and metabolic data to examine possible biological effects.
2. Methods
2.1. Investigational Product
The investigational product is a 15-mer peptide derived from the published sequence of murine CD154, which is 87% identical to the human sequence and contains the highly conserved lysine (K), glycine (G), tyrosine (Y), tyrosine (Y) motif that was shown to interact with CD40 [23]. OPT101 was formulated as a clinical-stage investigational product suitable for parenteral administration, using a pharmaceutically acceptable excipient. An Investigational New Drug (IND) application was approved by the FDA for use of OPT101 in human subjects. Using double-blind, randomized drug to placebo (2:1) phase 1a single ascending dose (SAD) in healthy control (HC) subjects and phase 1b multiple ascending dose (MAD) in T1D subjects, clinical trials were conducted at contract research organizations (CRO) operating under FDA-compliant quality systems and applicable Good Laboratory Practice (GLP) regulations in the United States. The primary objective was to obtain safety/tolerability data, but data were also obtained to assess biological activity including immunologic effects of OPT101 in T1D. A phase 2 clinical trial (ClinicalTrials.gov NCT06964087) was FDA-sanctioned and is currently under way.
2.2. Phase 1b MAD Trial Design
The phase 1b multiple-ascending-dose (MAD; ClinicalTrials.gov NCT04589403) study was preceded by an OPT101 preclinical toxicology study in beagle dogs and rats and a first-in-human phase 1a study (NCT04589403) in healthy volunteers. The phase 1a (NCT04589403) dosing schedule was set by FDA, starting at 0.423 mg/kg with a 2.6-times dose increase factor. Each dose was tested in 2 subjects with 1 placebo; each dose was reviewed by medical advisor and data safety monitoring committee (DSMC) and deemed safe before proceeding to the next dose. The final dose tested was 7.3 mg/kg at which several moderate and severe AEs occurred. The decision was made and approved by FDA to advance the next two lower doses, 2.8 and 1.1 mg/kg, for phase 1b. Stopping rules were based on severity of AEs. Adults, 18–60 years of age with diagnosed Stage 3 T1D, both male and female, were enrolled (Table 1). Because this was a first-in-disease safety and tolerability study, there was no focus on new onset or younger patients; therefore, eligible participants could be diagnosed for up to 20 years prior to enrollment. At this point, residual C-peptide, autoantibody (Aab) or HLA haplotypes were not used as inclusion criteria. Exclusion criteria were consistent with those applied in the phase 1a study in healthy subjects (Supplemental Information). Dosing occurred on Days 1, 4, 7, 14, 21, 28, 35, and 42. The study duration was six weeks with a two-week follow-up and was conducted under FDA oversight in accordance with an active Investigational New Drug (IND) application. An independent medical monitor and the DSMC provided continual safety oversight.
Table 1.
Demographics: Males and females ages ≥ 18 years diagnosed with T1D within the last 20 years were recruited and consented to the study. Subjects underwent physical examination and reported medical history. All subjects were receiving daily insulin. Subjects demonstrated normal values on all laboratory tests prior to enrollment. Subjects had not participated in other T1D clinical trials.
2.3. Phase 1b Treatment
Phase 1b (NCT0548943) was a double-blind, randomized drug–placebo (2:1) study with six drug recipients and three placebo recipients for the 1.1 mg/kg cohort and the same design for the 2.8 mg/kg cohort. Baseline blood chemistry and complete blood counts (CBC) were collected at screening and again pre-dosing at visit 1. OPT101 investigational product was at a concentration of 20 mg/mL in 10 mM acetate buffer with 5% glucose and was diluted in saline for a total volume of 60 mL to achieve the correct dose for each subject. Treatment was administered via IV infusion over 30 min; placebo cohort received an infusion of saline only. At visit 1, first infusion, subjects were monitored on site for 8 h. Blood and urine samples were collected prior to and post each infusion. Percent glycated HbA1c and C-peptide tests were conducted prior to treatment. At end of study (EOS), blood and urine analysis, mixed meal tolerance test (MMTT), C-peptide test, and HbA1c determination were performed. After the 1.1 mg/kg cohort was completed, the DSMC reviewed the clinical data and determined it was safe to proceed to the 2.8 mg/kg dose. After the 2.8 mg/kg cohort was completed, the DMSC determined the drug was safe at that dose. A study report was submitted to the FDA. A flow diagram of participants describing group allocations and treatments is included (Supplementary Figure S2).
The primary objective was to assess the safety and tolerability of multiple ascending doses of OPT101 compared with placebo in T1D patients. The secondary objectives were to assess the biologic and immunologic effects of OPT101 and to assess the clinical activity of multiple ascending doses of OPT101. These parameters include changes in immunological variables, glycated HbA1c, C-peptide, and fasting plasma glucose.
2.4. Pharmacokinetics
A total of eight 30 min IV treatments with 1.1 or 2.8 mg/kg doses of OPT101, or placebo, were administrated to a total of 18 subjects, 9 per cohort (6 active/3 placebo) on Days 0, 3, 7 and 14, then weekly (Days 21, 28, 35, and 42), for a total of 6 weeks. Every subject was monitored for 8 h on Day 1 (visit 1) and Day 42 (visit 8) post-treatment for safety and to allow for PK samples to be collected. On the Day 0 and Day 42 infusions, serum samples were collected for PK at the following times: within 1 h prior to the start of infusion, 15 min after the start of the infusion, 5 min before end of infusion (EOI), 5 min following EOI, and at 30 min, 1, 4 and 8 h after EOI. In addition, peak and trough samples were collected on dosing Day 28 within 1 h prior to the start of infusion and 5 min following the completion of the infusion. The most notable finding from the pharmacokinetic data was the significant decrease in serum levels at 5 min post-EOI. This shows the clearance of OPT101 is very fast after end of infusion. The distribution phase (alpha half-life) was 3.3 ± 2.8 min for 1.1 mg/kg and 1.8 ± 0.90 min for 2.8 mg/kg. The terminal elimination phase (beta half-life) of clearance is slow 435 ± 119.4 min for 1.1 mg/kg and 429.7 ± 119.4 min for 2.8 mg/kg. In general, there appeared to be an increase in exposure at the higher dose of OPT101. However, all pre-dose values were below the limit of quantification; therefore, an accumulation of OPT101 was not observed. Anti-drug antibodies were not detected at end of study.
2.5. Mixed Meal Tolerance Test (MMTT) and C-Peptide
Prior to first infusion, subjects were asked to fast for 12 h and then given a standard liquid MMTT (BoostTM; 237 mL; 41 g carbohydrates, 20 g combined glucose and sucrose) consumed within 5 min; the same amount was given to each subject. Further, 120 min after consuming, blood was collected for C-peptide analysis that was performed by Quest Labs. At end of study, 2 weeks after final dose, the C-peptide MMTT test was repeated. Percent glycated HbA1c was performed at the same time. Blood glucose values were obtained from blood chemistry panels collected at each visit.
2.6. Phase 1b Research Sample Analysis
Peripheral blood samples, 10 mL, were collected from brachial vein for immunophenotyping and inflammatory cytokine determination. Samples were obtained at visits 1, 4, and 8 then shipped overnight to sponsor. Blood was processed using Ficoll density gradient centrifugation to obtain peripheral blood mononuclear cells (PBMCs) that were cryopreserved until analysis. Research samples were blinded until end of study. Cells were analyzed via flow cytometry using a Cytoflex-S cytometer (Beckman Coulter, Indianapolis, IN, USA), and data were analyzed using FlowJo software, version 10.10.1 (BD Biosciences, Franklin Lakes, NJ, USA). PBMCs were thawed and suspended in a buffer of PBS, 0.5% bovine serum albumin, and 2 mM EDTA. Cells were immunophenotyped with antibodies for T cells, including CD3, CD4, CD8, CD25, and CD127, that were commercially available from Invitrogen, Carlsbad, CA, USA. Anti-CD40, clone G28-5, was produced and fluorescenated in house. B-cell antibodies to CD19, CD20, and HLA-DR were from Thermo Fisher Scientific, Waltham MA, USA. Intracellular stains included FoxP3, Interferon-gamma (IFNγ) and tumor necrosis factor-alpha (TNFα) from Invitrogen. For intracellular stains, cells were permeabilized using a commercial permeabilization buffer (Invitrogen). For analysis of CD4 T cells, events were gated on lymphocytes (FSC vs. SSC) followed by CD3 versus CD4, and percent CD3+CD4+ is reported. For CD8 T cells, the same gating as for CD4 T cells was used, except CD8 was assessed. For B cells, events were gated on lymphocytes then on CD3-negativity followed by HLA-DR versus CD19, and HLA-DR+CD19+ percentages are reported. For Th40 cells, events were gated on lymphocytes then CD3, and the amount of CD4+CD40+ T cells of the total CD4+ T-cell population was assessed. For regulatory T cells (Tregs), events were gated on lymphocytes and CD3, and then CD4+CD127loFoxP3+ cell levels were assessed. For cytokines, events were gated on lymphocytes then CD3; then, the percentage of CD4+cytokine+ was assessed.
2.7. Statistical Analysis
Statistical analysis was performed using Graph Pad Prism software Version 9.5.1. Paired and unpaired t-tests, mixed effects analysis or ANOVA with either Dunnett’s or Tukey’s multiple comparison tests were performed as appropriate (see figure legends for specifics). Alpha was set to 0.05. Statistical significance was set at p < 0.05. Data are expressed as means ± SEM.
3. Results
3.1. Subjects
A total of eighteen subjects were enrolled, randomized, and completed the study. Six were dosed with OPT101 at 1.1 mg/kg, six at 2.8 mg/kg, and six received placebo infusions. No subjects withdrew from the 1.1 or 2.8 mg/kg dose cohorts. One subject in the placebo group was diagnosed with pneumonia and was withdrawn by the investigator; an additional placebo subject was enrolled and received five infusions of saline. The age distribution of the subjects is shown in Table 1 and Supplemental Figure S1. The seemingly largest difference was age at diagnosis, with cohort 1.1 mg/kg at 12.6 years and cohort 2.8 mg/kg at 21.5 years; however, this difference did not achieve statistical significance (Supplemental Figure S1). The 1.1 mg/kg cohort also had the longest disease duration, 14 years, but not significantly different from the other cohorts, 8.5 and 11 years for 2.8 mg/kg and placebo, respectively (Supplemental Figure S1).
3.2. Safety and Tolerability of OPT101
The primary objective was safety and tolerability. Adverse events (AEs) were graded according to The Common Terminology Criteria for Adverse Events (CTCAE). The grade refers to the severity of the AE, and the CTCAE displays Grades 1 through 5 (Grade 1—mild; Grade 2—moderate; Grade 3—severe; Grade 4—life-threatening; Grade 5—death). The total number of AEs, 90 events, throughout this study is listed in Table 2. In both the 1.1 and 2.8 mg/kg cohorts, all treatment-emergent AEs were Grade 1 and 2. In placebo, Grade 1, 2, and 3 occurred. Of all reported events, regardless of assessed relatedness to OPT101, in the 1.1 mg/kg cohort, 23 of 25 (92%) were Grade 1, and 2 (8%) were Grade 2 (Table 2). In the 2.8 mg/kg cohort, a total of 43 AEs were reported, of which 33 (76.7%) were Grade 1 and 10 (23.3%) were Grade 2 (Table 2). In the placebo group, 13 of 22 (59.1%) AEs were Grade 1, 8 (36.4%) were Grade 2, and 1 (4.5%, pneumonia, resulting in withdrawal) was Grade 3 (Table 2). The most frequent AEs included infusion site reactions, swelling, feeling hot, and mild abdominal pain. Moderate AEs included infusion site reactions, two infections in the 1.1 mg/kg cohort, one infection in the 2.8 mg/kg cohort and seven infections in the placebo cohort (Table 3). Nervous system issues reported were paresthesia (the most common), dizziness, burning sensation, and one migraine that was assessed as not likely to be drug related (Table 3). A decrease in ferritin levels was the most frequent observed Grade 2, moderate laboratory abnormality and was evaluated further. Among the AEs that were deemed definitely related to treatment, none occurred in the 1.1 mg/kg cohort, and 26 occurred in the 2.8 mg/kg cohort, where 20 (76.9%) were Grade 1 and 6 (23.1%) were Grade 2 (Table 4). The AEs at 2.8 mg/kg included injection site reactions, with an increased number at this dose likely due to the 2.6-times increase in protein. The predominant moderate AE was ferritin reduction, which appeared to respond in a dose-dependent manner. OPT101 was deemed not to be immune-suppressive.
Table 2.
Summary of all possible treatment-emergent adverse events (TEAEs). At each visit, subjects were clinically examined and reported any potential adverse events. The number of AEs within 1.1 mg/kg, 2.8 mg/kg and placebo was recorded. The percentage of total within each subgroup is in parentheses.
Table 3.
Multiple-dose treatment-emergent adverse events (TEAEs) in OPT101-treated T1D subjects. Using the common terminology criteria for adverse events (CTCAEs), AEs were recorded. Each specific adverse event is listed by system organ class. The number of events and the percentage (parentheses) for each are listed for the 1.1 mg/kg, 2.8 mg/kg and placebo doses. The last row is cumulative numbers. Each participant received only 1 dose level and received 8 doses of OPT101or placebo over 42 days. X = number of TEAEs, (%) = percentage of participants with ≥1 TEAE; MedDRA = Medical Dictionary for Regulatory Activities; PT = preferred term; MAD = multiple ascending dose; SOC = system organ class.
Table 4.
Treatment-emergent adverse events definitely related to treatment. Review of AEs was made by each site PI and the Op-T medical advisor and classified as definite. All definite AEs occurred in the 2.8 mg/kg and placebo groups, suggesting a dose–response relationship.
3.3. Acute-Phase Reactants
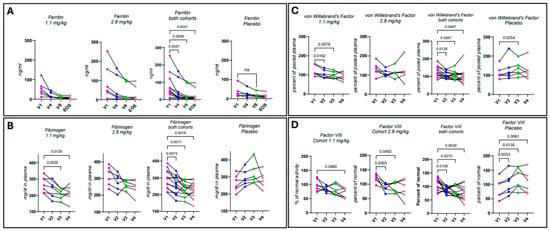
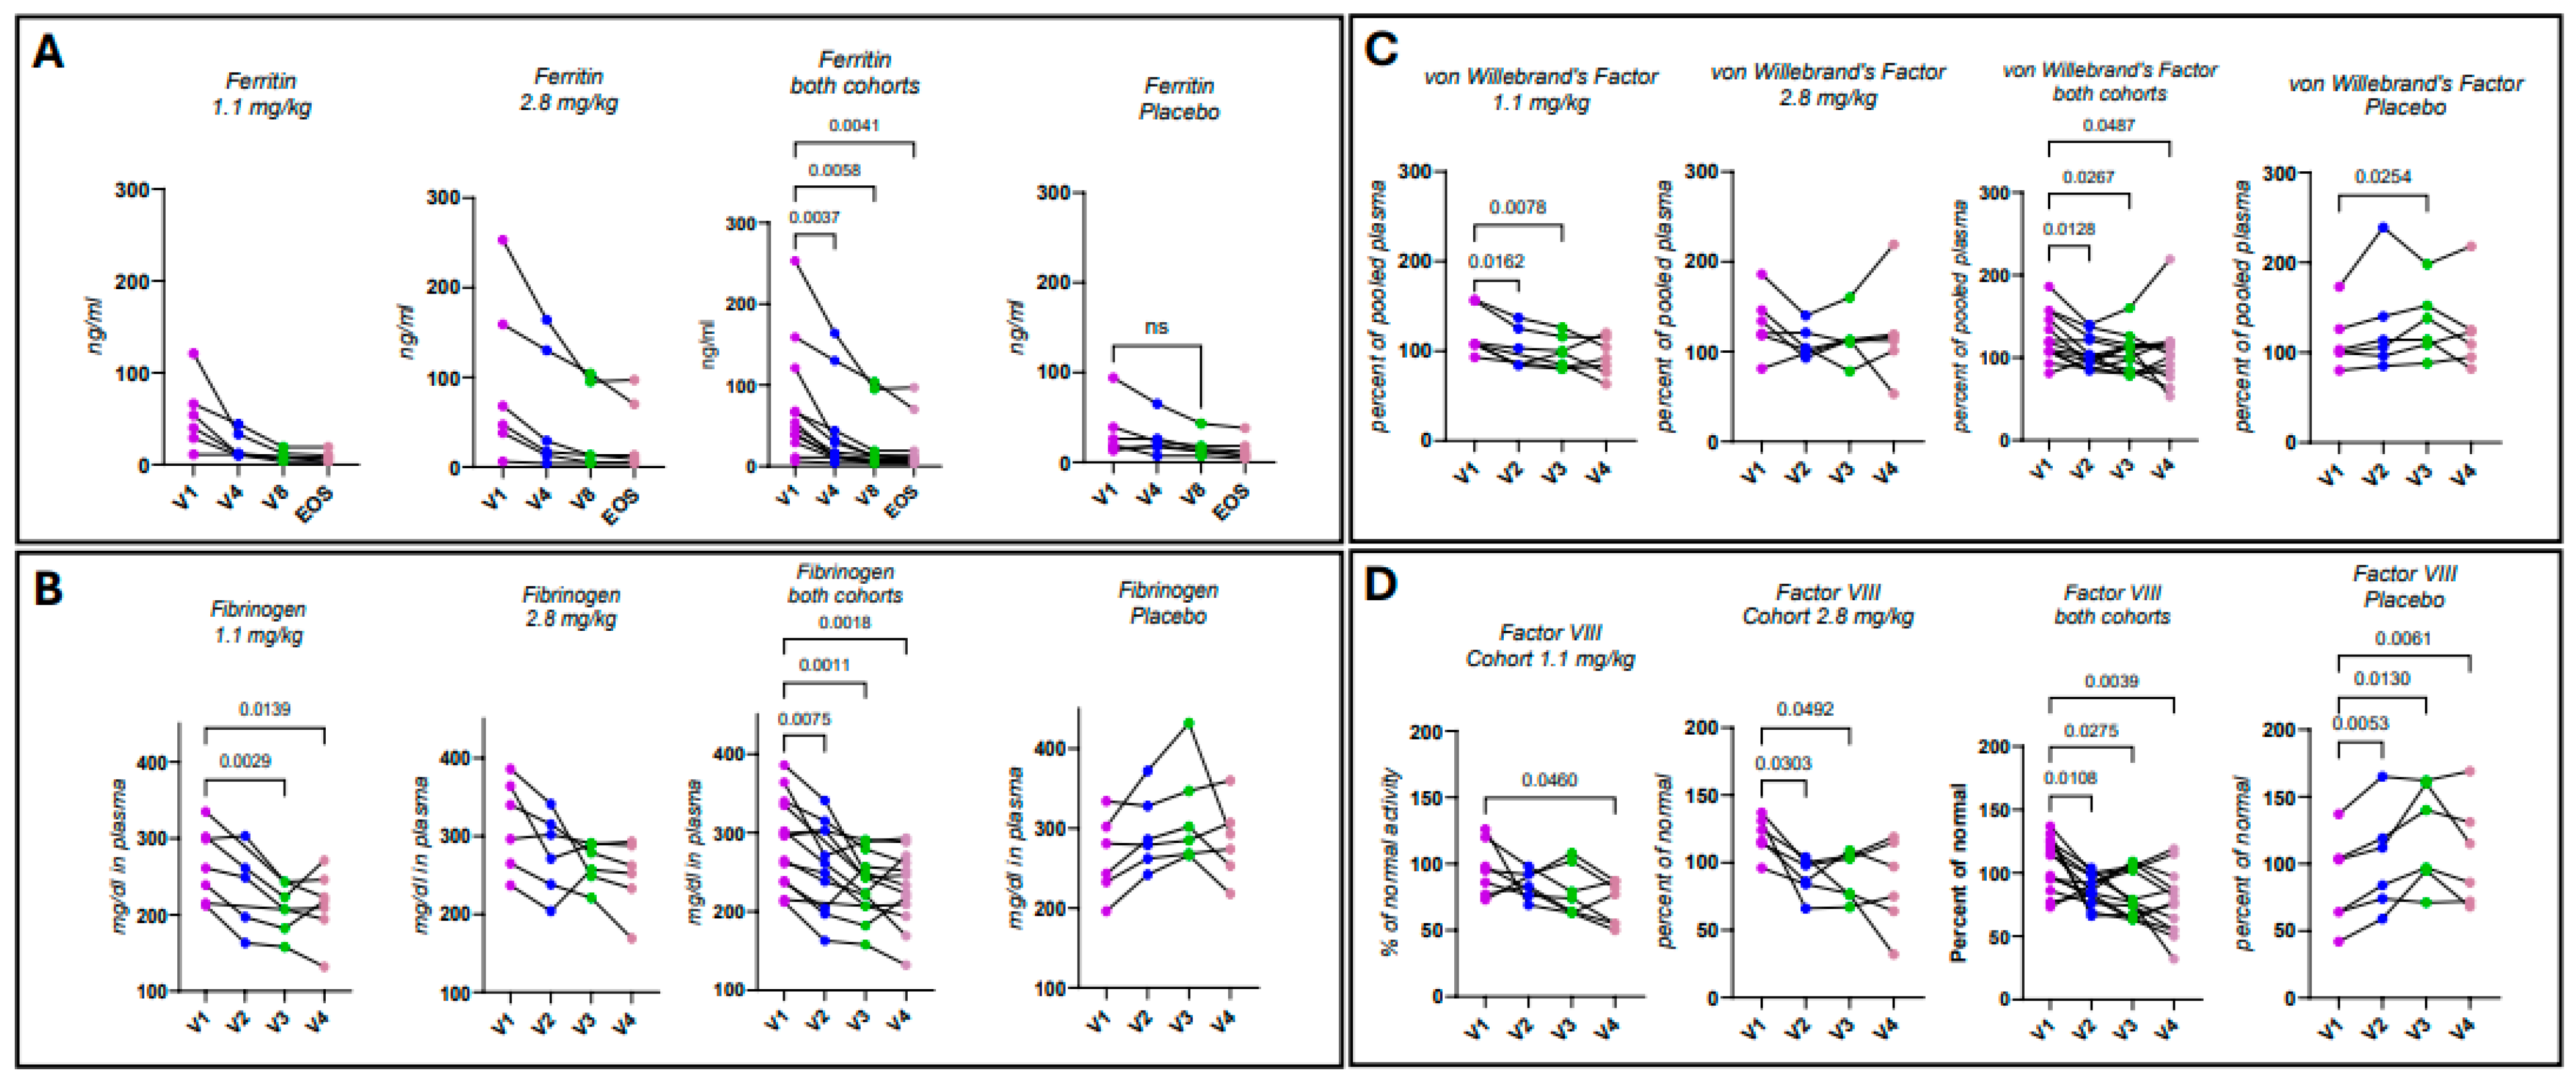
Ferritin is an intracellular storage protein that maintains iron homeostasis, acting as a buffer against iron deficiency and overload [24]. Acute and chronic inflammation results in ferritin release, leading to high serum ferritin levels, designating it as a positive acute-phase reactant [25,26]. Low ferritin is typically associated with anemia resulting from internal bleeding or iron deficiency. Mechanistic reductions in ferritin protein are poorly understood and not well studied. In this study, an unexpected reduction in plasma ferritin levels occurred (Figure 1) and was noted as a possible AE. A trend of decreased ferritin occurred in both treatment cohorts but did not achieve significance (Figure 1A). However, if both treatment cohorts were analyzed together, a significant decrease was achieved at visits 4, 8, and end of study (EOS; Figure 1A; p = 0.0037, p = 0.0058, and p = 0.0041, respectively). Subjects did not exhibit any signs of blood loss or low iron. Hematocrit, hemoglobin, and red blood cell counts remained normal throughout the treatment period; serum iron levels remained normal, and fecal occult blood testing was negative. Randomly at screening, all placebo subjects had ferritin levels below 100 ng/mL, while in the 1.1 mg/kg cohort, one subject was above 100 ng/mL, and in the 2.8 mg/kg cohort, two subjects were above 100 ng/mL (Figure 1A). In the treatment cohorts, subjects over 100 ng/mL including one subject at 243 ng/mL had substantially reduced ferritin with OPT101 treatment (Figure 1A). No further change in ferritin had occurred in any of the cohorts at EOS. A Board-Certified hematologist was consulted, reviewed all the data and deemed OPT101 did not cause blood loss.
Figure 1.
OPT101 reduces acute-phase reactants. Blood samples were drawn at visits (V) 1, 2, 3, 4, 8, and end of study (EOS), as indicated. (A) Ferritin, (B) fibrinogen, (C) von Willebrand’s Factor (vWF), and (D) Factor VIII were measured. p-values are indicated in the graphs and are from repeated measures one-way ANOVA or mixed effects analysis (when some data points were missing) with Dunnett’s multiple comparisons test.
Thrombotic emboli occurred when anti-CD154 monoclonal antibodies unexpectedly targeted platelets [20]. Given that history, we monitored coagulation factors, including fibrinogen (Figure 1B), von Willebrand factor (vWF; Figure 1C), and Factor VIII (Figure 1D), during dosing of OPT101. In addition to reflecting coagulation activity, each of these proteins are acute-phase reactants [25]. OPT101 dosing reduced fibrinogen, achieving significance in the 1.1 mg/kg cohort at visits 3 and 4 (Figure 1B; p = 0.0029 and p = 0.0139, respectively). In the 2.8 mg/kg cohort, there was a downward trend that did not achieve significance (Figure 1B). However, when both treatment cohorts were analyzed together, there were significant decreases in fibrinogen at visits 2, 3, and 4 (Figure 1B; p = 0.0075, p = 0.0011, and p = 0.0018, respectively). In the placebo cohort, fibrinogen levels trended upward, consistent with chronic inflammation (Figure 1B). In the 1.1 mg/kg cohort, vWF was significantly reduced by OPT101 treatment at visits 2 and 3 but not at visit 4 (Figure 1C; p = 0.0162 and p = 0.0078, respectively). In the 2.8 mg/kg cohort, there was no significant change. When both treatment cohorts were analyzed together, vWF decreased significantly at visits 2, 3, and 4 (Figure 1C; p = 0.0128, p = 0.0267, and p = 0.0487, respectively). The placebo cohort had an upward trajectory with a significant difference in vWF at visit 3, which was no longer present at visit 4 (Figure 1C; p = 0.0254). The 1.1 mg/kg cohort achieved a significant reduction in Factor VIII by visit 4 (Figure 1D; p = 0.0460). In the 2.8 mg/kg cohort, there was a significant decrease in Factor VIII at visits 2 and 3, which was no longer present at visit 4 (Figure 1D; p = 0.0303 and p = 0.0492, respectively). When both treatment cohorts were analyzed together, there was an associated significant decrease in Factor VIII at visits 2, 3, and 4 (Figure 1D; p = 0.0108, p = 0.0275, and p = 0.0039, respectively.) In placebo, Factor VIII increased significantly at visits 2, 3, and 4 (Figure 1D; p = 0.0053, p = 0.0130, p = 0.0061, respectively), consistent with chronic inflammation. No coagulation or bleeding disorder-related AEs were reported in any treatment group. D-dimers were assessed, with no changes detected over the study period.
3.4. Effects of OPT101 Treatment on Metabolic Parameters
There were no significant changes when comparing albumin and globulin, the main serum proteins, between the different cohorts. Liver- and kidney-associated markers ALT, AST, ALP, creatine, BUN, and eGFR remained within normal ranges without significant changes during treatment.
3.5. Immunologic Outcomes
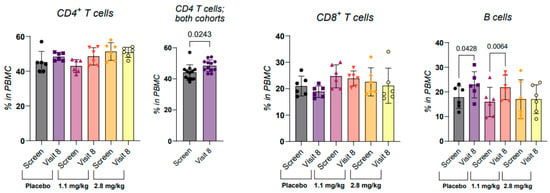
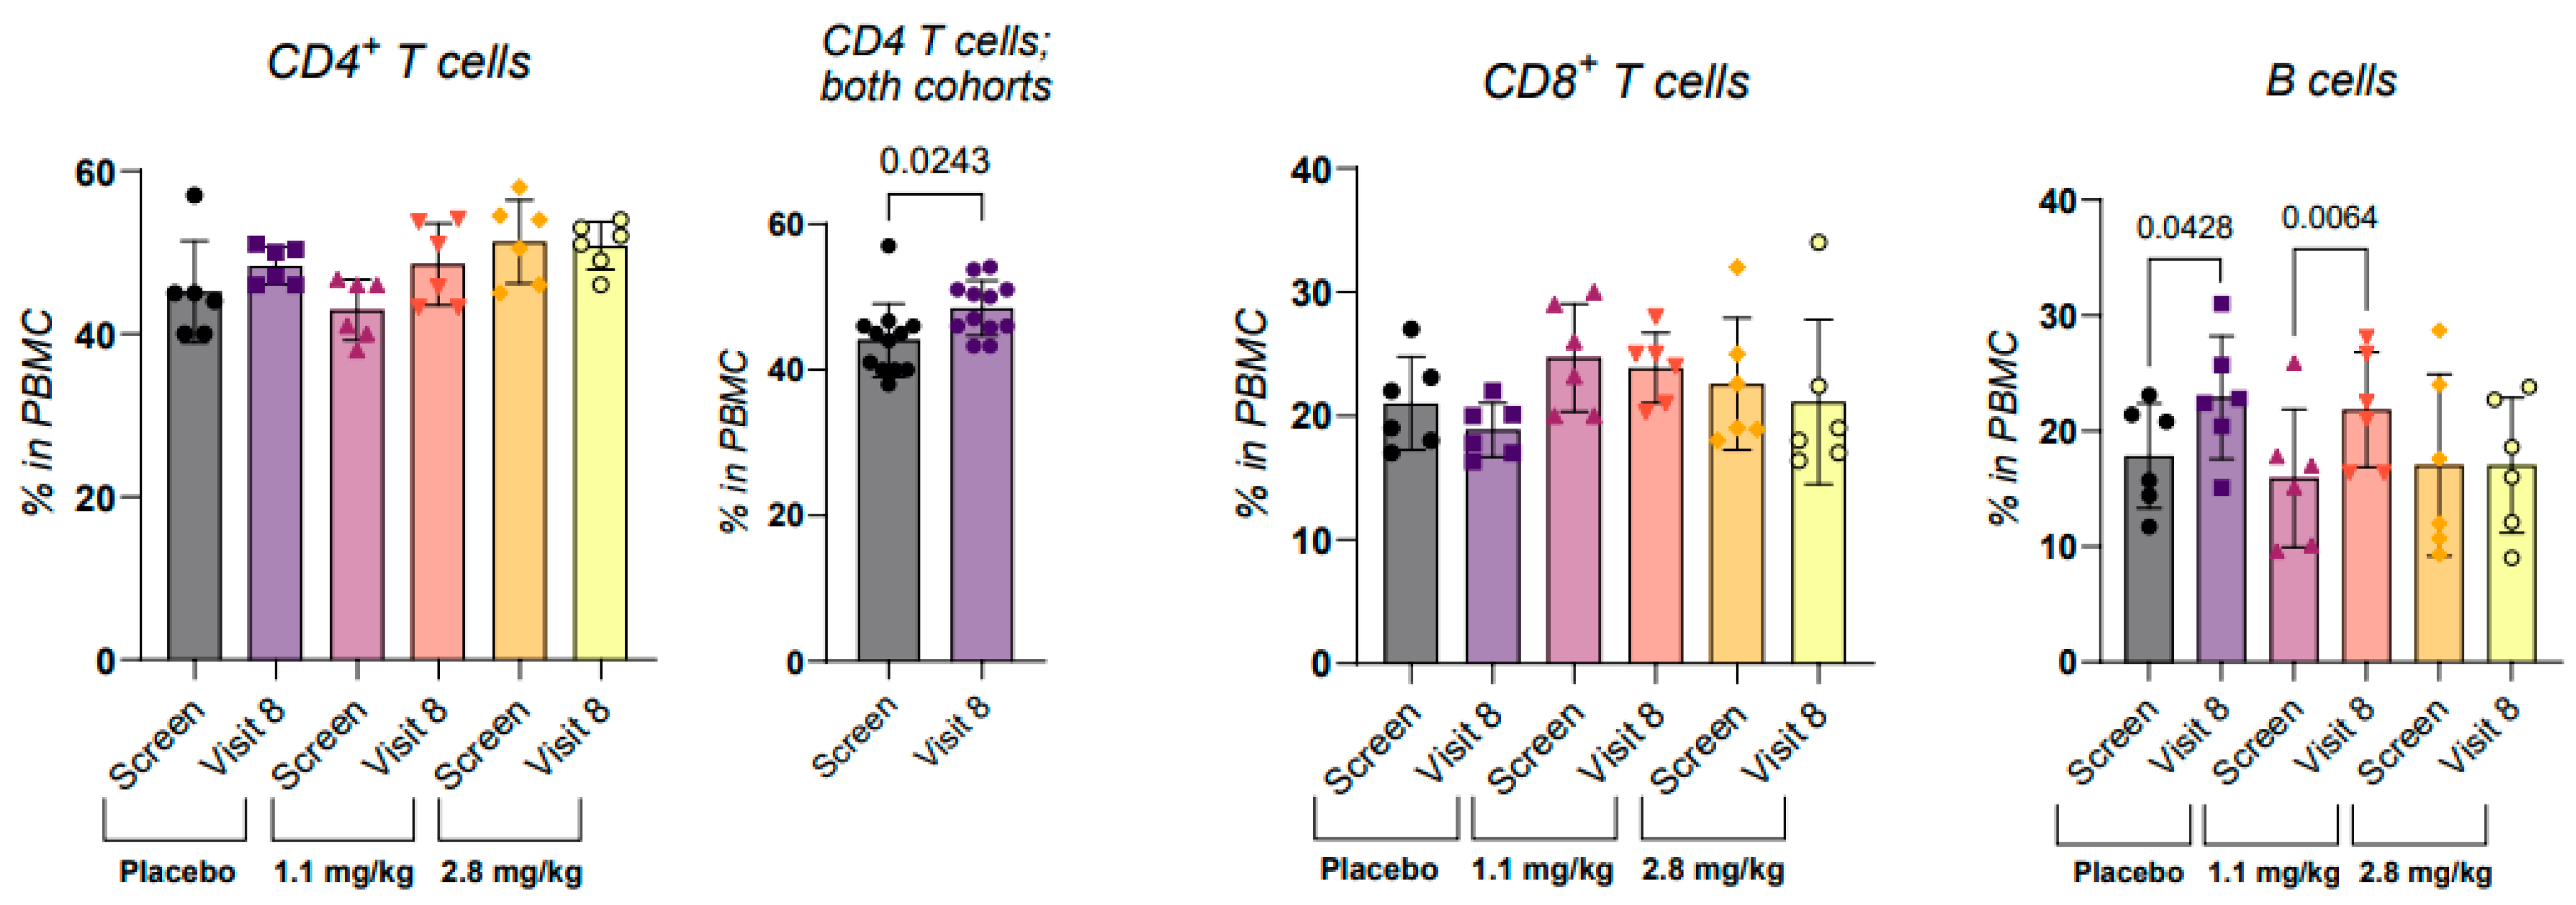
Because targeting CD40 impacts immune responses, it was important to assess the potential risk of immune suppression when evaluating this first-in-class drug. B cells are described as CD40 expressors, along with macrophages and dendritic cells. We have shown that CD4+CD40+ T cells, Th40 cells, are prominent during autoimmune disease including T1D [19,27,28]. OPT101 did not affect total lymphocytes, platelets, monocytes, or neutrophils based on complete blood count (CBC) analysis during dosing or at EOS. CBC reports did not specify lymphocyte types; therefore, we measured CD4+ and CD8+ T cells, as well as B cells, in research samples. OPT101 treatment had no impact on the CD4+ and CD8+ T-cell populations over the course of the study. B cells were slightly increased in the two treatment cohorts (Figure 2; 1.1 mg/kg p = 0.0428 and 2.8 mg/kg p = 0.0064).
Figure 2.
OPT101 does not cause lymphopenia. Peripheral blood mononuclear cells (PBMCs) were prepared at screening and visit 8 and were stained for CD3, CD4, CD8, HLA-DR, and CD19. Cells were gated on lymphocytes then on CD3+ or CD3−. CD4 and CD8 T-cell percentages in the CD3+ gate as well as HLA-DR+CD19+ in the CD3− gate are shown. p-values in the graphs are from paired two-tailed t-tests.
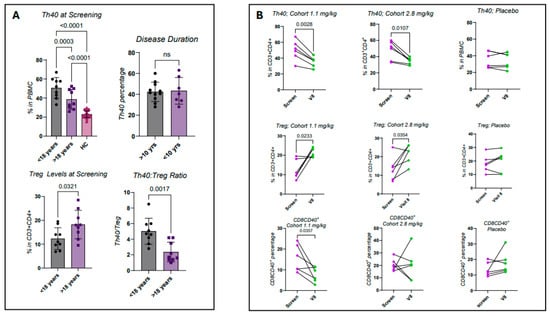
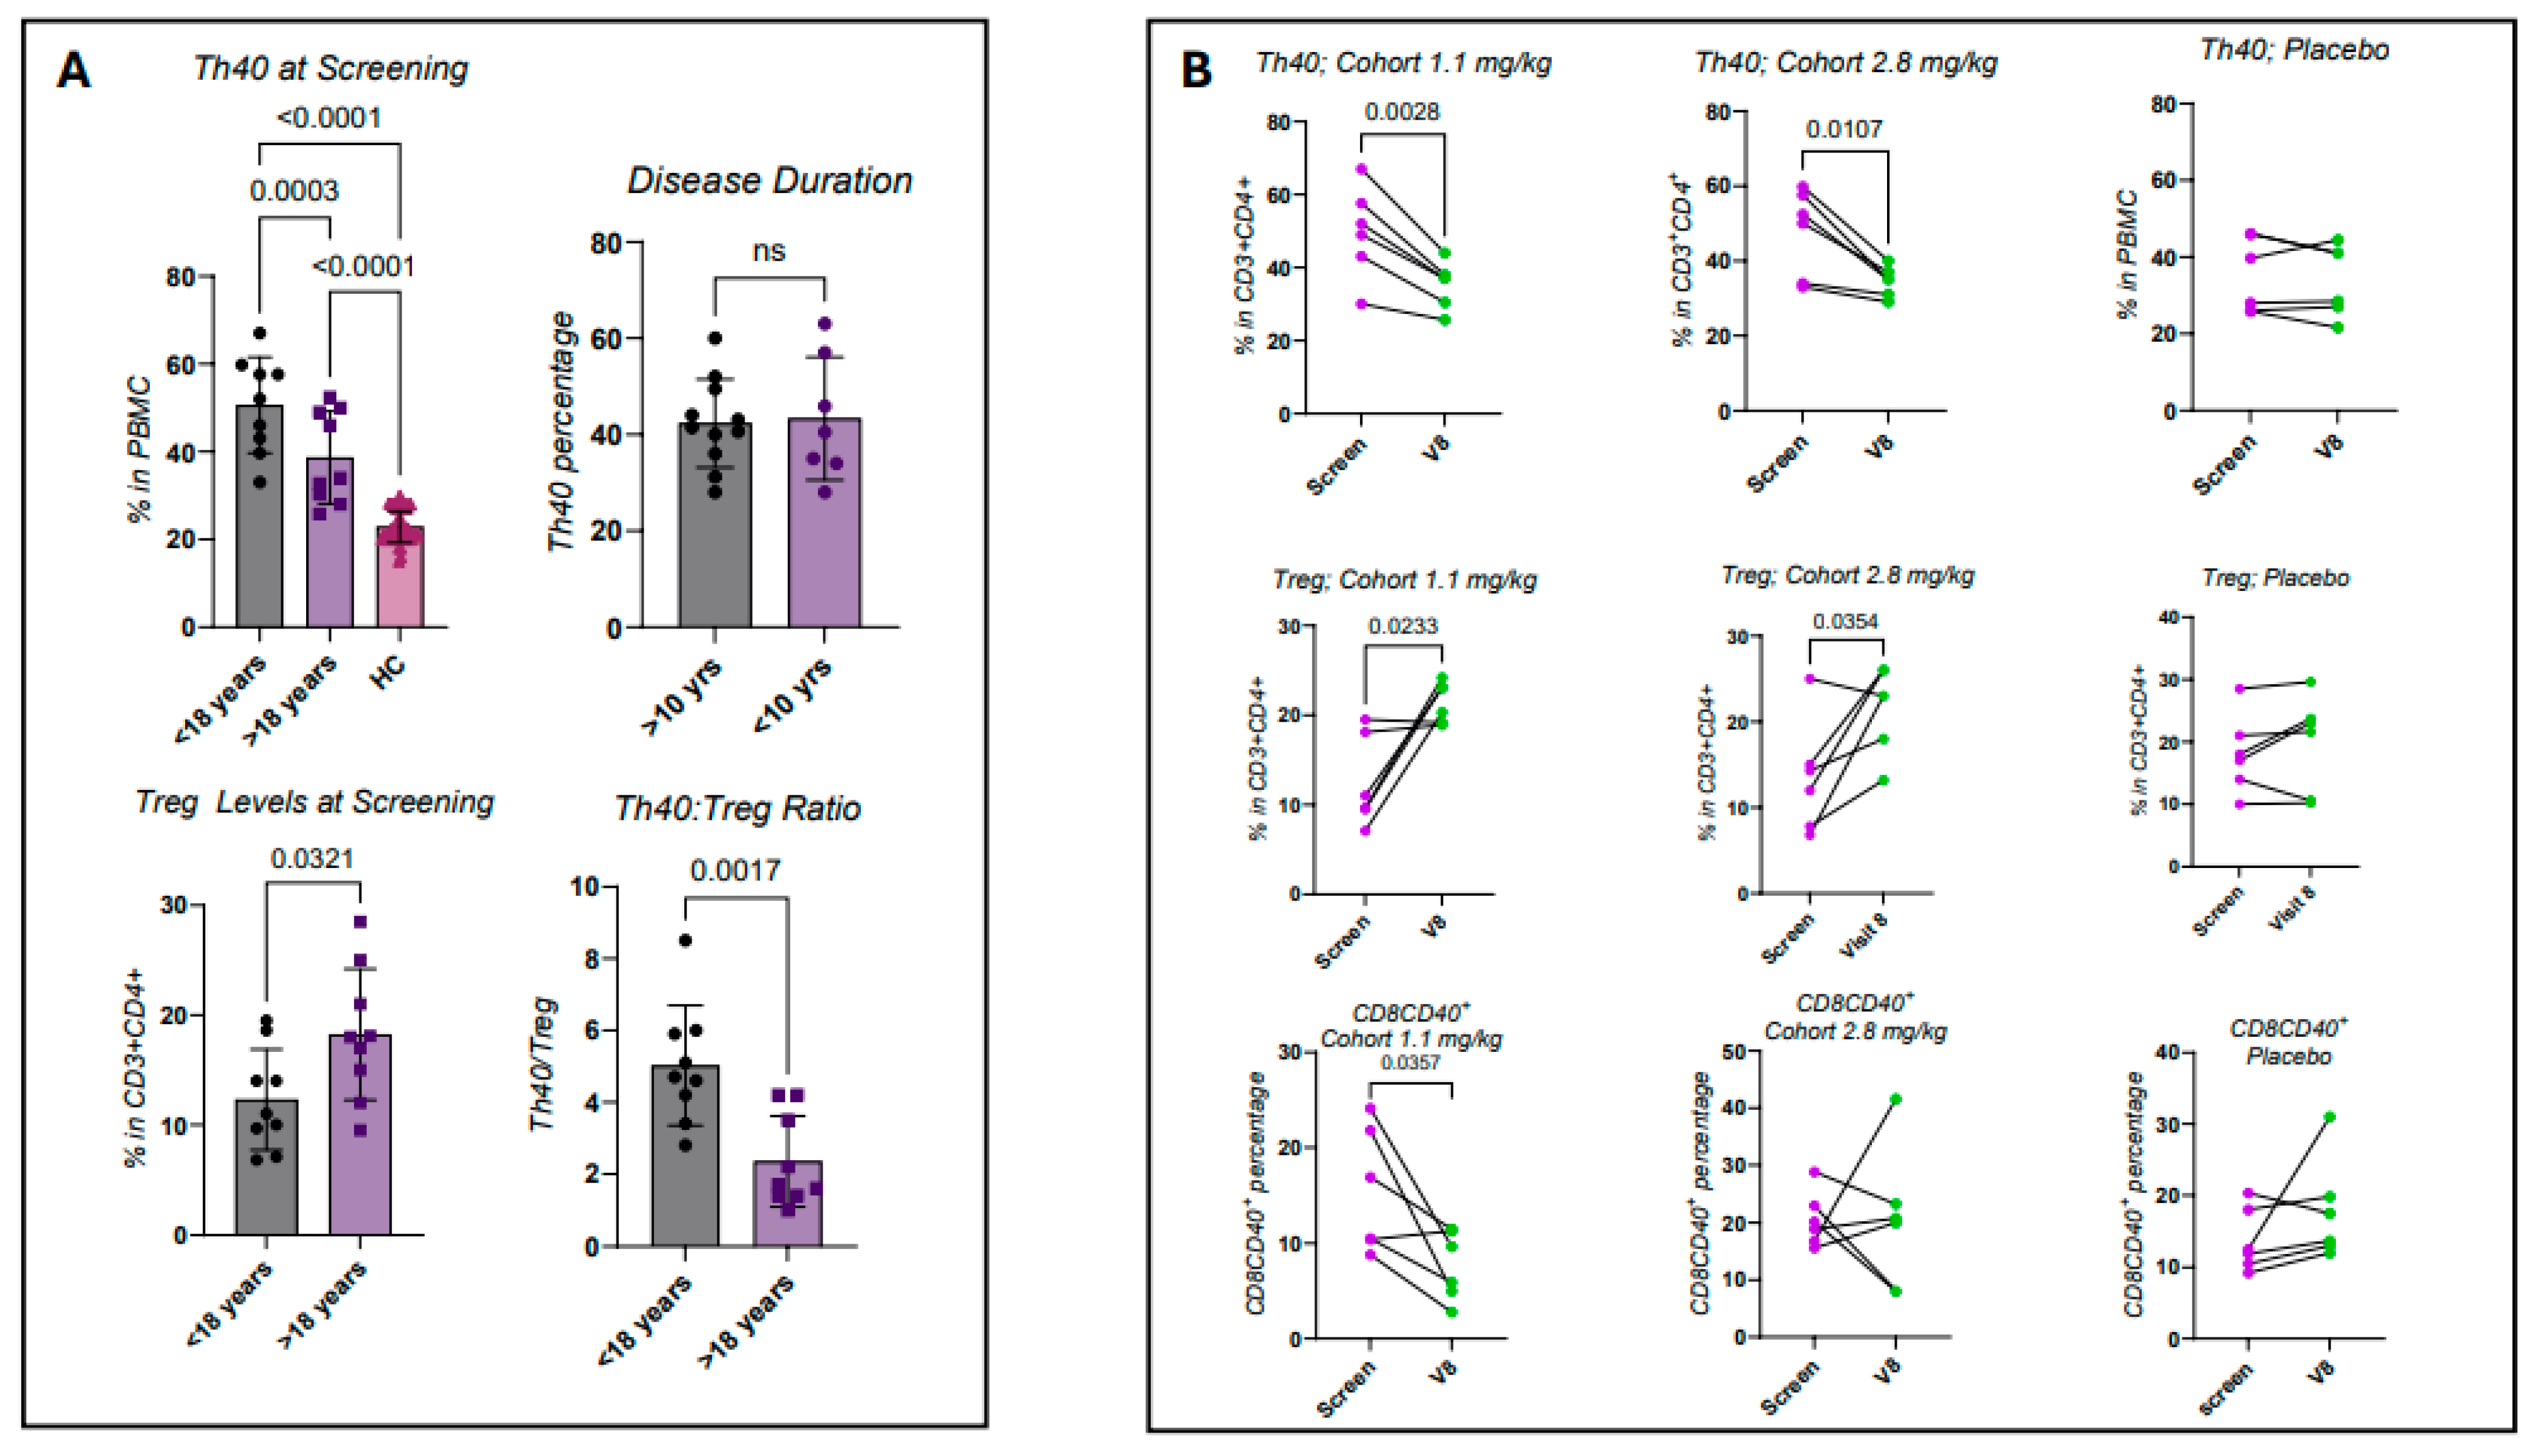
Helper T cells were further subdivided into Th40 (pathogenic effector) and regulatory T cells (Treg). Th40 pathogenicity was described in the NOD mouse model, canine diabetes mellitus [29], and human Stage 1, Stage 2, and Stage 3 diabetes [19]. T1D subjects showed elevated Th40 cells compared to healthy control (HC), with those whose disease began before 18 years of age having higher percentages than those who were older than 18 years at disease onset (Figure 3A; <18 years—p < 0.0001, >18 years—p < 0.0001). In the two disease onset groups, Th40 levels were also significantly different from each other (Figure 3A; p = 0.0003). Disease duration did not affect Th40 levels (Figure 3A). In a previous report, we showed that Th40 increases in T1D occur irrespective of HLA haplotype [28]. Treg levels were notably lower in early-onset subjects (Figure 3A; p = 0.0321), leading to a higher Th40 to Treg ratio, indicative of dysregulated inflammatory conditions (Figure 3A; p = 0.0017).
Figure 3.
Th40:Treg ratios differ depending on age of T1D onset and OPT101 improves the ratio. Peripheral blood mononuclear cells (PBMCs) were prepared at screening and visit 8 and were stained for CD3, CD4, CD40, and FoxP3. Cells were gated on lymphocytes then on CD3+. (A) Th40 cell (CD4+CD40+) percentages of total CD4 and Treg (CD4+FoxP3+) percentages in the CD3+ gate at screening are shown as a function of age at onset as well as disease duration. Th40:Treg ratio at screening is depicted as well. (B) Th40 percentages of total CD4, Treg percentages and CD8CD40+ (CD4-CD40+) of total CD8 in CD3+ gated cells are shown. p-values in the graphs are from paired two-tailed t-tests except in the upper-left graph in A where a one-way ANOVA with Tukey’s multiple comparisons test was used.
At EOS, both dose levels were associated with significant Th40 cell reductions (Figure 3B; 1.1 mg/kg—p = 0.0028, 2.8 mg/kg—p = 0.0107). No change in Th40 cell levels was observed in the placebo group (Figure 3B). OPT101 in both dose cohorts was associated with increases in classically defined Tregs (Figure 3B; 1.1 mg/kg p = 0.0233, 2.8 mg/kg p = 0.0354). No change in Tregs was observed in the placebo cohort (Figure 3B). Randomly at screening, the placebo group had lower baseline Th40 levels than the OPT101 treatment cohorts and, conversely, a higher Treg baseline. Those values did not change over the course of the study. CD8+CD40+ T cells have been reported [30]. When examining those cells, there was a significant decrease in the 1.1 mg/kg cohort at visit 8 (Figure 3B; p = 0.0357) but no change in the 2.8 mg/kg cohort or placebo. Collectively, these findings support the immunologic safety profile of OPT101 in subjects with T1D and indicate that a targeted anti-inflammatory biological effect can be attributed to OPT101.
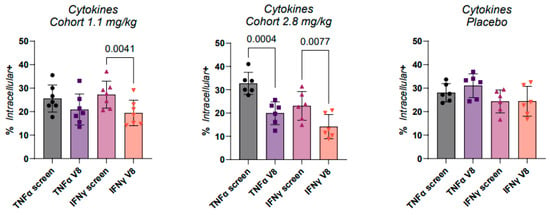
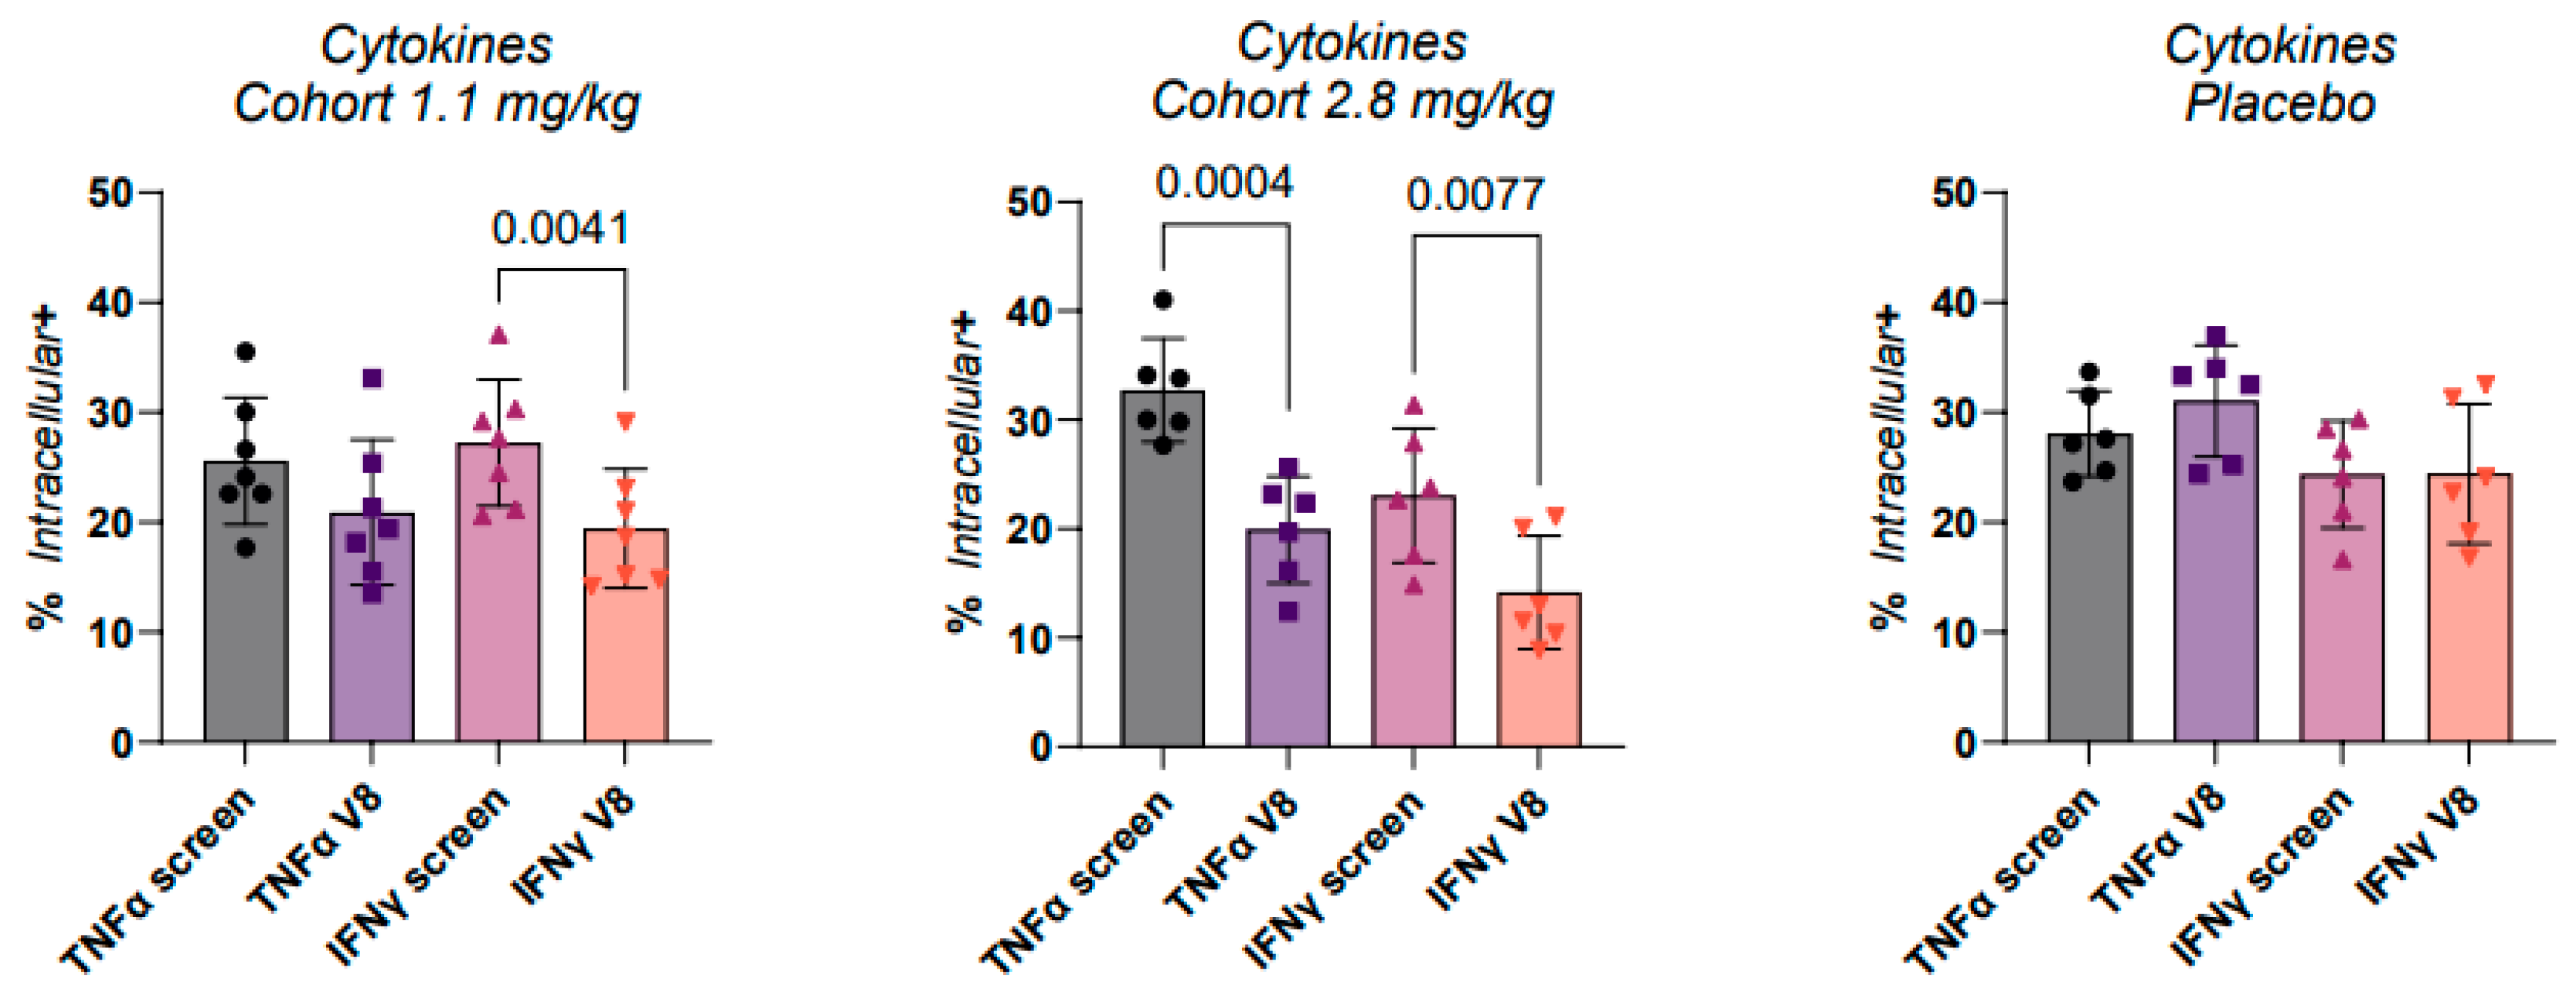
Another approach to address chronic inflammation was to examine the intracellular levels of the inflammatory cytokines interferon-gamma (IFNγ) and tumor necrosis factor-alpha (TNFα) within PBMCs of all subjects. Intracellular cytokine levels in CD3+CD4+ helper T cells were determined at screening and compared to visit 8, after six weeks of treatment (Figure 4). In the 1.1 mg/kg cohort, IFNγ was significantly reduced at visit 8 (Figure 4; p = 0.0041). In the 2.8 mg/kg cohort, both TNFα and IFNγ were significantly reduced at visit 8 (Figure 4; p = 0.0004 and p = 0.0077, respectively), consistent with a dose effect. There were no significant changes in the placebo group, although TNFα trended upward (Figure 4).
Figure 4.
OPT101 lowers the level of intracellular inflammatory cytokines. Peripheral blood mononuclear cells (PBMCs) were prepared at screening and visit 8 and were stained for CD3, CD4, and either TNFα or IFNγ. Cells were gated on lymphocytes then on CD3+ and percentages of CD4+cytokine+ are reported from that gate. p-values in the graphs are from paired two-tailed t-tests.
3.6. OPT101 Effect on Serum Glucose, Glycated HbA1c, and C-Peptide
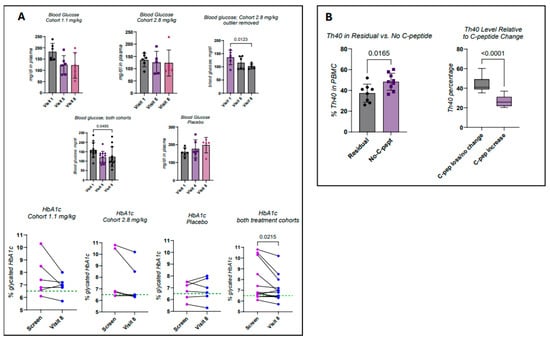
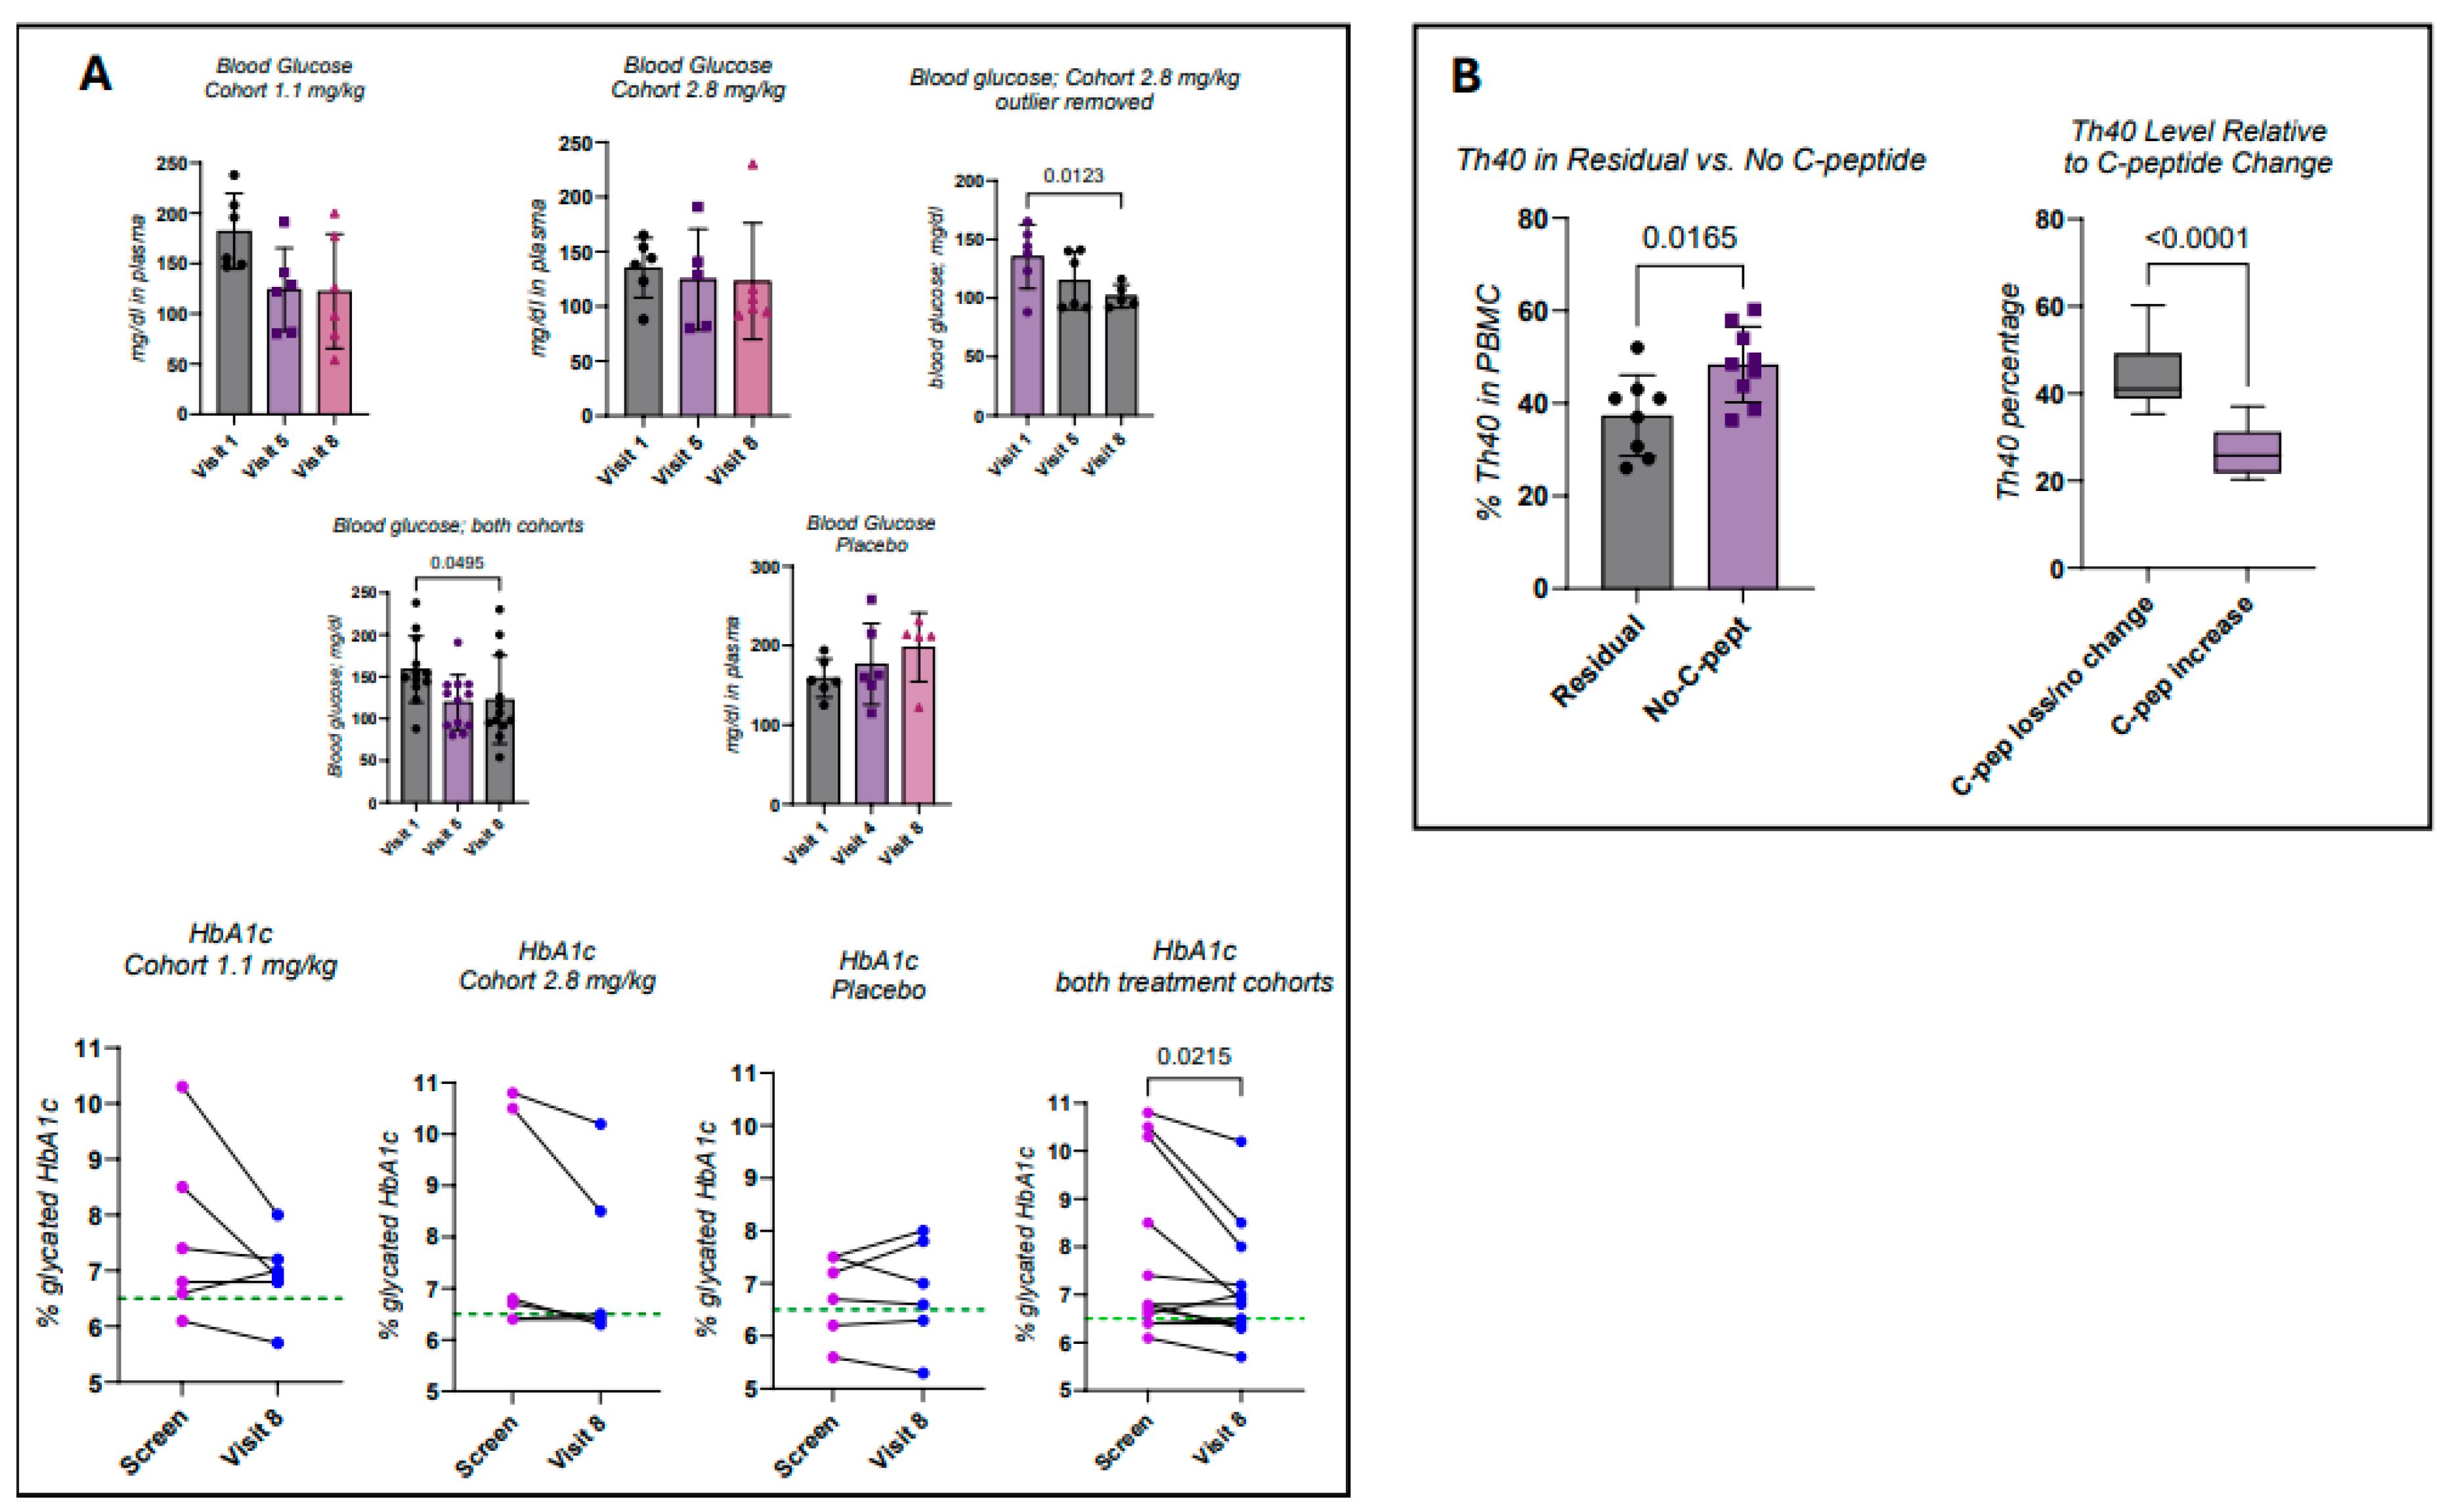
Blood glucose was obtained from blood chemistry collected over the six-week treatment period. In the 1.1 mg/kg cohort, there was a trend towards glucose lowering, comparing visit 1 (prior to treatment) with visit 5 (3 weeks of treatment) and visit 8 (final dose at 6 weeks) that did not achieve significance (Figure 5A). In the 2.8 mg/kg cohort, blood glucose also trended lower but did not achieve significance (Figure 5A). However, if the one outlier at visit 8 was removed, significance was reached at visit 8 in the 2.8 mg/kg cohort (Figure 5A; p = 0.0123). If all subjects in the two treatment groups were analyzed together, a significant decrease in blood glucose was achieved (Figure 5A; p = 0.0495). Meanwhile, although not significant, the blood glucose in the placebo group trended upward (Figure 5A).
Figure 5.
OPT101 may affect blood glucose levels and lower HbA1c. (A) Fasting blood glucose was measured in blood chemistry panels at visits 1, 5, and 8, and HbA1c was assessed at screening and visit 8. (B) Th40 levels were assessed in subjects with residual C-peptide compared to levels in subjects with no detectable C-peptide. Th40 levels were also assessed in subjects who did not experience C-peptide increase or who had no residual C-peptide and were compared to subjects that experienced an increase in C-peptide. In (A), p-values in the blood glucose graphs are from mixed effects analysis with Dunnett’s multiple comparison or Friedman test ANOVA with Dunn’s multiple comparisons test, and, in the HbA1c graph, paired two-tailed t-test was used. In (B), p-values are from unpaired two-tailed t-tests.
The percentage of glycated hemoglobulin A1c (HbA1c) was measured at screening and again at EOS. In parallel with a downward trend in blood glucose, percentages of glycated HbA1c declined across both treatment cohorts. At screening, participants with an HbA1c below 6.5%, the target recommended by the American Diabetes Association, were present in each group. In the 1.1 mg/kg cohort, the participants with screening levels of glycated HbA1c above 7% decreased their percentages by visit 8 (Figure 5A). A reduction in HbA1c was also observed in the 2.8 mg/kg group, especially in those subjects with high screening percentages (Figure 5A). The decrease did not achieve significance in either treatment group. However, when subjects from both cohorts were analyzed together, there was a significant decrease in HbA1c by visit 8 (Figure 5A; p = 0.0322). Within the placebo group, three subjects demonstrated increased HbA1c values (Figure 5A). Post-study analysis showed that subjects with the highest baseline HbA1c were randomly distributed within the 1.1 and 2.8 mg/kg treatment groups.
An MMTT was administered at screening and again at EOS. Of all the eighteen enrolled subjects, eight (44.4%) had detectable (residual) C-peptide levels; the assay limit of detection was 0.1 ng/mL. Participants were randomly assigned to treatment groups irrespective of their C-peptide levels. In the 1.1 mg/kg group, two subjects had residual C-peptide, while three participants in the 2.8 mg/kg group and three in the placebo group had residual C-peptide. At EOS, there was no significant change in C-peptide in the OPT101-treated groups, and all subjects remained in normal, stimulated by MMTT C-peptide range, 1.0–4.5 ng/mL. Interestingly, however, following treatment, one participant in the 1.1 mg/kg cohort, disease duration 13 years, who originally had no detectable C-peptide, exhibited detectable C-peptide post-treatment. In the 2.8 mg/kg cohort, a subject with an 11-year disease duration transitioned from undetectable to detectable. Regardless of treatment or placebo groups, when considering subjects that had residual C-peptide, the Th40 cell percentage was significantly lower than in subjects with no detectable C-peptide (Figure 5B; p = 0.0165). Also, in subjects who showed a C-peptide increase, regardless of treatment assignment or placebo, Th40 cell percentages were lower than in subjects who did not experience a C-peptide increase (Figure 5B). These preliminary observations suggest an association between Th40 cell frequency and beta cell function, which was the basis for the hypothesis that regulating Th40 cells through OPT101 could improve beta cell function and C-peptide responses. This hypothesis will be tested in a phase 2A clinical trial.
4. Discussion
The idea that T1D is a homogeneous disease with a ‘one-size-fits-all’ treatment strategy has proven incorrect. Recent developments addressing the heterogeneity in disease pathogenesis reveal how complicated this disease is and provide suggestions as to why current therapeutic approaches have underperformed [6,31,32]. Heterogeneity in disease pathogenesis is demonstrated through multiple points, including the variable contributions of innate and adaptive immune cells involved in disease development and progression and by the diverse responses to available disease-modifying therapies [33]. Diabetes was historically described as a childhood disease, but 50–65% of new diagnoses are in patients greater than 18 years old [33]. Younger age at diagnosis is associated with faster disease progression, plasma B cells, and more CD8+ T cells within the insulitic lesion [34]. Here, younger diagnosed subjects have significantly greater Th40 cell numbers and lower classic Treg numbers than subjects diagnosed when older. Defining the autoimmune component of T1D has focused on the presence of autoantibodies, including anti-insulin, anti-ZnTr8, anti-IAA, and anti-GAD (GADA) [5]. Thus, the focus for decades has been on the B-cell contribution. However, an interventional approach targeting CD3, the classic T-cell receptor activation molecule found on all T cells, was developed and demonstrated a crucial role for T cells [35]. Outcomes were promising; beta cell function, measured as C-peptide detection in serum, was preserved for up to 2 years with a modest reduction in insulin dosing [36,37]. Concerns arose because the primary treatment goals, reduction in HbA1c and lowering of blood glucose, were not met and lymphopenia, immune suppression, was a common occurrence [36,37]. In addition, while C-peptide loss was slowed significantly, it nonetheless continually declined. In a prevention study, Teplizumab (anti-CD3) increased the median time to T1D diagnosis to 48.4 months, while placebo was 24.4 months [38]. Forty-three percent of patients went on to develop T1D [38]. These approaches further demonstrate patient heterogeneity and suggest that targeting pathogenic effector T cells have therapeutic merit; thus, a more nuanced approach to better target pathogenic effector cells would be a noted improvement.
An advance in better defining the autoimmune contribution was the description of CD40 expressing CD4+ T helper cells, Th40, as pathogenic effector cells in T1D. Th40 cells were shown to be pathogenic in NOD mice and in human T1D [28] and recently in canine diabetes mellitus (CDM) [39]. In CDM, treatment with a small peptide (OPT501 an OPT101 equivalent peptide) dramatically improved diabetes. In treated dogs, Th40 cell levels were significantly reduced, daily blood glucose levels were significantly reduced, and fructosamine, an alternate to HbA1c as an indicator of disease progression, was dramatically reduced. Additionally, increases in C-peptide levels that indicate the preservation of beta cell function were observed [39].
The current study demonstrates the safety and tolerability in human T1D subjects of the OPT101 peptide targeting a novel inflammatory receptor. Importantly, the approach modulates rather than ablates CD40 signals. All OPT101-related AEs were Grades 1 or 2. Previous approaches to regulate CD40-mediated inflammation used monoclonal antibodies, which created thrombotic events [20]. OPT101 treatment created no aberrant coagulation events. Prothrombin time and activated partial thromboplastin time (aPTT) were examined, with no changes relative to treatment. In addition, no excessive bleeding AEs were noted during this study. The favorable safety profile of OPT101 provides an opportunity for long-term treatment duration. Due to its safety profile, OPT101 should be considered for prevention.
Over the study period, no lymphopenia was observed in the T- or B-cell compartments, and immune suppression did not occur, as evidenced by the lack of infections. Analysis showed that treated subjects had fewer pathogenic Th40 cells, more classic Tregs, and an improved Th40 to Treg ratio. During T1D, dysregulated CD40 leads to excessive inflammatory cytokine production from Th40 cells, macrophages, and other cells, disrupting immune homeostasis. The inflammatory cytokines TNFα and IFNγ were reduced, not ablated, by OPT101 in this study. This is important considering that constitutive expression of cytokines is necessary for maintaining immunologic homeostasis, regulating cell survival, and priming the immune system for a rapid response to pathogens [40].
An important observation in this study was the reduction in blood glucose after only 6 weeks of treatment. The reduction was not significant in the 1.1 mg/kg cohort and was only significant in the 2.8 mg/kg cohort when one outlier was removed. The number of treated subjects in this study was low, and it is possible that with larger numbers, an outlier would not affect the statistical significance. The outlier could also represent a drug non-responder. When all OPT101-treated subjects were analyzed together using a non-parametric one-way ANOVA, the blood glucose-lowering effect achieved significance by visit 8. Blood glucose levels can vary daily, and, therefore, another measure of glucose management was employed. When analyzing all OPT101-treated subjects together, percent glycated HbA1c was significantly lowered by OPT101 after 6 weeks of treatment. These observations are preliminary and were the basis for the hypothesis that targeting Th40 cells can be clinically relevant in T1D, which will be explored in a phase 2A efficacy clinical trial.
This study suggests an inverse relationship between C-peptide levels and Th40 cell levels. A higher level of Th40 cells was indicative of low or undetectable C-peptide. This observation suggests that higher chronic inflammatory conditions support disrupted beta cell function in terms of insulin production reflected by C-peptide detection. Regardless, lowering Th40 cell levels and inflammation overall may shape a microenvironment that promotes or allows renewed insulin production. Two subjects who, at enrollment, had undetectable C-peptide post-MMTT became detectable after 6 weeks of treatment. The subjects were 11 and 13 years post-diagnosis. In the placebo group, subjects with undetectable C-peptide at screening remained unchanged post-MMTT. These very preliminary findings are intriguing and support further exploration of reducing CD40-mediated inflammation, Th40 cell actions in particular, as a T1D clinical advance.
Weaknesses in this study include the small sample size, short treatment period, and IV route of administration. Safety and tolerability were the primary endpoints, which were clearly established. Given the weaknesses, any observed efficacy endpoints achieving significance are remarkable and warrant further investigation. A longer treatment duration may allow for the inflammatory dysregulation to dissipate and bring about homeostasis. A shorter disease duration may afford more residual, functional beta-islet cells that can be encouraged to increase insulin production and perhaps even regenerate more functional beta cells. The improvements seen in long-term, greater than 10 years post-onset, participants suggest that this approach has distinct advantages over previous ones and requires further exploration. The data suggest that Th40 cell percentages can assist in defining the SAID subgroup of autoimmune diabetes and suggests a theratype. We developed and are testing a subcutaneous route of administration for OPT101 in a phase 2A clinical trial (ClinicalTrials.gov ID NCT06964087). Based on this study, enrollment criteria include Th40 levels greater than 35% of total CD4+ (theratype) and detectable C-peptide. The phase 2A duration will be 52 weeks.
In conclusion, the safety and tolerability of OPT101, as well as the data suggesting a biological effect, warrant future prolonged OPT101 treatment, which will further address the potential beneficial therapeutic effects in T1D. The current report demonstrates short-term safety, 6 weeks of treatment and a 2-week follow-up. From the data obtained, we hypothesize that targeting CD40 and Th40 cells, particularly long term, could be clinically beneficial.
Supplementary Materials
The following supporting information can be downloaded at: https://www.mdpi.com/article/10.3390/diabetology7080148/s1, Figure S1: Age demographics of Phase 1b participants. Subjects 18 years or older diagnosed with Stage 3 type 1 diabetes were recruited, consented and enrolled in the study. (A) The age distribution of each treatment group and placebo is shown. (B) Age of subjects at diagnosis for each treatment group and placebo is shown. (C) Disease duration for each treatment group and placebo is shown. Figure S2: The CONSORT Flow Diagram for patient enrollment. Reference [41] is cited in the Supplementary Materials.
Author Contributions
Conceptualization and methodology D.H.W., M.G.Y. and R.B.; methodology, validation, formal analysis, D.H.W. and G.M.V.; investigation, D.H.W., G.M.V. and D.M.W.; resources, D.M.W.; data curation, D.H.W., G.M.V. and D.M.W.; writing—original draft preparation, G.M.V., M.G.Y. and D.H.W.; writing—review and editing, D.H.W., G.M.V., M.G.Y. and R.B.; project administration, D.M.W.; funding acquisition, D.H.W. All authors have read and agreed to the published version of the manuscript.
Funding
The research was funded by Op-T LLC.
Institutional Review Board Statement
Institutional Review Board (IRB) approval was obtained from Advarra (610 Merriweather Dr, Columbia MD 21044); protocol number Pro00062919; approval date: 11 May 2022.
Informed Consent Statement
Informed consent was obtained from all subjects involved in the study. Subjects were de-identified and cannot be identified from the study materials.
Data Availability Statement
The original contributions presented in the study are included in the article and in Supplementary Material. Further inquiries can be directed to the corresponding author.
Conflicts of Interest
D.H.W. is co-founder and chief scientific officer for Op-T LLC. R.B. is medical review officer for Op-T LLC; G.M.V. is a contractor for Op-T LLC. D.M.W. is chief operations officer for Op-T LLC. Op-T LLC had no role in the design of the study; in the collection, analyses, or interpretation of data; in the writing of the manuscript; or in the decision to publish the results.
References
- Battaglia, M.; Ahmed, S.; Anderson, M.S.; Atkinson, M.A.; Becker, D.; Bingley, P.J.; Bosi, E.; Brusko, T.M.; DiMeglio, L.A.; Evans-Molina, C.; et al. Introducing the Endotype Concept to Address the Challenge of Disease Heterogeneity in Type 1 Diabetes. Diabetes Care 2020, 43, 5–12. [Google Scholar] [PubMed]
- DeBerg, H.A.; Baloh, C.H.; DeGottardi, Q.; Hou, J.; Johansson, A.; Newell, E.; Laidlaw, T.M.; Sanda, S.; Shamji, M.; Durham, S.; et al. Differential effects of subcutaneous and sublingual immunotherapy on timothy grass-specific TH2 CD4+ T-cell subsets. J. Allergy Clin. Immunol. 2026, in press. [Google Scholar] [CrossRef] [Scilit] [PubMed]
- Li, J.; Zhang, Y.; Ye, Y.; Li, D.; Liu, Y.; Lee, E.; Zhang, M.; Dai, X.; Zhang, X.; Wang, S.; et al. Pancreatic beta cells control glucose homeostasis via the secretion of exosomal miR-29 family. J. Extracell. Vesicles 2021, 10, e12055. [Google Scholar] [CrossRef] [Scilit] [PubMed]
- Asplund, O.; Thangam, M.; Prasad, R.B.; Lejonberg, C.; Ekstrom, O.; Hakaste, L.; Smith, J.G.; Rosengren, A.H.; Oscarsson, J.; Carlsson, B.; et al. Comorbidities and mortality in subgroups of adults with diabetes with up to 14 years follow-up: A prospective cohort study in Sweden. Lancet Diabetes Endocrinol. 2026, 14, 29–40. [Google Scholar] [CrossRef] [Scilit] [PubMed]
- Taurbekova, B.; Sarsenov, R.; Yaqoob, M.M.; Atageldiyeva, K.; Semenova, Y.; Fazli, S.; Starodubov, A.; Angalieva, A.; Sarria-Santamera, A. Cluster Analysis in Diabetes Research: A Systematic Review Enhanced by a Cross-Sectional Study. J. Clin. Med. 2025, 14, 3588. [Google Scholar] [CrossRef] [Scilit] [PubMed]
- Singh, A.; Samajdar, S.S.; Singh, A.K.; Tiwaskar, M.H.; Joshi, S.R. Revisiting Diabetes Classification: Insights Challenges and Clinical Relevance of the ANDIS Framework in the Indian Context. J. Assoc. Physicians India 2025, 73, 66–72. [Google Scholar] [CrossRef] [Scilit] [PubMed]
- Wei, J.; Wu, H.; Wang, N.; Zhu, J.; Anjana, R.M.; Sokolov, A.V.; Schioth, H.B.; Mohan, V.; Tan, X. Integrative proteomic analysis provides novel therapeutic insights for etiological subtypes of diabetes. Diabetes Obes. Metab. 2025, 27, 6894–6904. [Google Scholar] [CrossRef] [Scilit] [PubMed]
- Patel, S.K.; Ma, C.S.; Fourlanos, S.; Greenfield, J.R. Clinical, immunogenetic and metabolic characteristics of autoantibody-negative and autoantibody-positive type 1 diabetes. Diabetologia 2026, 69, 600–609. [Google Scholar] [PubMed]
- Loffler, S.; Frigo, F.; Hochfellner, D.; Frohlich-Reiterer, E.; Aziz, F.; Kubesch, H.; Pieber, T.; Sourij, H.; Aberer, F. Clinical Characteristics and Predictors of Glycemic Control During the First 24 Months After Diagnosis of Type 1 Diabetes. Biomedicines 2026, 14, 690. [Google Scholar] [CrossRef] [Scilit] [PubMed]
- Lee, D.H.; Jeon, H.J.; Oh, T.K. Evaluation of Clinical, Laboratory and Immunological Characteristics in the Early Onset (Diagnosed Age < 30 Years Old) Patients with Type 2 Diabetes. J. Korean Med. Sci. 2026, 41, e77. [Google Scholar] [CrossRef] [Scilit] [PubMed]
- Tuomi, T.; Santoro, N.; Caprio, S.; Cai, M.; Weng, J.; Groop, L. The many faces of diabetes: A disease with increasing heterogeneity. Lancet 2014, 383, 1084–1094. [Google Scholar] [CrossRef] [Scilit] [PubMed]
- Sladek, R. The many faces of diabetes: Addressing heterogeneity of a complex disease. Lancet Diabetes Endocrinol. 2018, 6, 348–349. [Google Scholar] [CrossRef] [Scilit] [PubMed]
- Foster, N.C.; Beck, R.W.; Miller, K.M.; Clements, M.A.; Rickels, M.R.; DiMeglio, L.A.; Maahs, D.M.; Tamborlane, W.V.; Bergenstal, R.; Smith, E.; et al. State of Type 1 Diabetes Management and Outcomes from the T1D Exchange in 2016–2018. Diabetes Technol. Ther. 2019, 21, 66–72. [Google Scholar] [CrossRef] [Scilit] [PubMed]
- Mathieu, C.; Wiedeman, A.; Cerosaletti, K.; Long, S.A.; Serti, E.; Cooney, L.; Vermeiren, J.; Caluwaerts, S.; Van Huynegem, K.; Steidler, L.; et al. A first-in-human, open-label Phase 1b and a randomised, double-blind Phase 2a clinical trial in recent-onset type 1 diabetes with AG019 as monotherapy and in combination with teplizumab. Diabetologia 2024, 67, 27–41. [Google Scholar] [CrossRef] [Scilit] [PubMed]
- Rendell, M. Pharmacotherapy of type 1 diabetes—Part 3: Tomorrow. Expert. Opin. Pharmacother. 2025, 26, 535–550. [Google Scholar] [CrossRef] [Scilit] [PubMed]
- Wang, L.; Lovejoy, N.F.; Faustman, D.L. Persistence of prolonged C-peptide production in type 1 diabetes as measured with an ultrasensitive C-peptide assay. Diabetes Care 2012, 35, 465–470. [Google Scholar] [CrossRef] [Scilit] [PubMed]
- Baker, R.L.; Wagner, D.H., Jr.; Haskins, K. CD40 on NOD CD4 T cells contributes to their activation and pathogenicity. J. Autoimmun. 2008, 31, 385–392. [Google Scholar] [CrossRef] [Scilit] [PubMed]
- Waid, D.M.; Vaitaitis, G.M.; Wagner, D.H., Jr. Peripheral CD4loCD40+ auto-aggressive T cell expansion during insulin-dependent diabetes mellitus. Eur. J. Immunol. 2004, 34, 1488–1497. [Google Scholar] [CrossRef] [Scilit] [PubMed]
- Vaitaitis, G.M.; Rihanek, M.; Alkanani, A.K.; Waid, D.M.; Gottlieb, P.A.; Wagner, D.H. Type 1 Diabetes TrialNet Study Group. Biomarker Discovery in Pre-Type 1 Diabetes; Th40 Cells as a Predictive Risk Factor. J. Clin. Endocrinol. Metab. 2019, 104, 4127–4142. [Google Scholar] [CrossRef] [Scilit] [PubMed]
- Koyama, I.; Kawai, T.; Andrews, D.; Boskovic, S.; Nadazdin, O.; Wee, S.L.; Sogawa, H.; Wu, D.L.; Smith, R.N.; Colvin, R.B.; et al. Thrombophilia associated with anti-CD154 monoclonal antibody treatment and its prophylaxis in nonhuman primates. Transplantation 2004, 77, 460–462. [Google Scholar] [CrossRef] [Scilit] [PubMed]
- Mirabet, M.; Barrabes, J.A.; Quiroga, A.; Garcia-Dorado, D. Platelet pro-aggregatory effects of CD40L monoclonal antibody. Mol. Immunol. 2008, 45, 937–944. [Google Scholar] [CrossRef] [Scilit] [PubMed]
- Vaitaitis, G.M.; Wagner, D.H., Jr. Modulating CD40 and integrin signaling in the proinflammatory nexus using a 15-amino-acid peptide, KGYY15. J. Biol. Chem. 2023, 299, 104625. [Google Scholar] [CrossRef] [Scilit] [PubMed]
- Bajorath, J.; Chalupny, N.J.; Marken, J.S.; Siadak, A.W.; Skonier, J.; Gordon, M.; Hollenbaugh, D.; Noelle, R.J.; Ochs, H.D.; Aruffo, A. Identification of residues on CD40 and its ligand which are critical for the receptor-ligand interaction. Biochemistry 1995, 34, 1833–1844. [Google Scholar] [CrossRef] [Scilit] [PubMed]
- Philpott, C.C.; Meyron-Holtz, E.G. Cellular Iron Homeostasis. Adv. Exp. Med. Biol. 2025, 1480, 17–31. [Google Scholar] [CrossRef] [Scilit] [PubMed]
- Carcillo, J.A.; Shakoory, B. Cytokine Storm and Sepsis-Induced Multiple Organ Dysfunction Syndrome. Adv. Exp. Med. Biol. 2024, 1448, 441–457. [Google Scholar] [CrossRef] [Scilit] [PubMed]
- Lazovic, B.; Dmitrovic, R.; Simonovic, I.; Esquinas, A.M. Cytokine Release Syndrome (CRS) in Severe COVID-19 Patients: Two Controversial and Interesting Case Reports and Literature Review. Tanaffos 2023, 22, 167–171. [Google Scholar] [PubMed]
- Siebert, J.C.; Inokuma, M.; Waid, D.M.; Pennock, N.D.; Vaitaitis, G.M.; Disis, M.L.; Dunne, J.F.; Wagner, D.H., Jr.; Maecker, H.T. An analytical workflow for investigating cytokine profiles. Cytometry A 2008, 73, 289–298. [Google Scholar] [CrossRef] [Scilit] [PubMed]
- Waid, D.M.; Wagner, R.J.; Putnam, A.; Vaitaitis, G.M.; Pennock, N.D.; Calverley, D.C.; Gottlieb, P.; Wagner, D.H., Jr. A unique T cell subset described as CD4loCD40+ T cells (TCD40) in human type 1 diabetes. Clin. Immunol. 2007, 124, 138–148. [Google Scholar] [CrossRef] [Scilit] [PubMed]
- Vaitaitis, G.; Webb, T.; Webb, C.; Sharkey, C.; Sharkey, S.; Waid, D.; Wagner, D.H. Canine diabetes mellitus demonstrates multiple markers of chronic inflammation including Th40 cell increases and elevated systemic-immune inflammation index, consistent with autoimmune dysregulation. Front. Immunol. 2023, 14, 1319947. [Google Scholar] [CrossRef] [Scilit] [PubMed]
- Bourgeois, C.; Rocha, B.; Tanchot, C. A role for CD40 expression on CD8+ T cells in the generation of CD8+ T cell memory. Science 2002, 297, 2060–2063. [Google Scholar] [CrossRef] [Scilit] [PubMed]
- Gao, S.Y.; Huang, Y.G.; Wang, L.B.; Zhang, Q.W.; Chang, G.Y.; Li, J.; Hu, F.H.; Ding, Y.; Wang, X.M. Age-related heterogeneity of type 1 diabetes mellitus in children: A single-center retrospective study. World J. Pediatr. 2026, 22, 247–257. [Google Scholar] [CrossRef] [Scilit] [PubMed]
- Rohmann, N.; Epe, J.; Geisler, C.; Schlicht, K.; Turk, K.; Hartmann, K.; Kruse, L.; Koppenhagen, J.; Kohestani, A.Y.; Adam, T.; et al. Comprehensive evaluation of diabetes subtypes in a European cohort reveals stronger differences of lifestyle, education and psychosocial parameters compared to metabolic or inflammatory factors. Cardiovasc. Diabetol. 2025, 24, 99. [Google Scholar] [CrossRef] [Scilit] [PubMed]
- Foster, T.P.; Bruggeman, B.S.; Haller, M.J. Emerging Immunotherapies for Disease Modification of Type 1 Diabetes. Drugs 2025, 85, 457–473. [Google Scholar] [CrossRef] [Scilit] [PubMed]
- Leete, P.; Mallone, R.; Richardson, S.J.; Sosenko, J.M.; Redondo, M.J.; Evans-Molina, C. The Effect of Age on the Progression and Severity of Type 1 Diabetes: Potential Effects on Disease Mechanisms. Curr. Diab Rep. 2018, 18, 115. [Google Scholar] [CrossRef] [Scilit] [PubMed]
- Herold, K.C.; Gitelman, S.E.; Ehlers, M.R.; Gottlieb, P.A.; Greenbaum, C.J.; Hagopian, W.; Boyle, K.D.; Keyes-Elstein, L.; Aggarwal, S.; Phippard, D.; et al. Teplizumab (anti-CD3 mAb) treatment preserves C-peptide responses in patients with new-onset type 1 diabetes in a randomized controlled trial: Metabolic and immunologic features at baseline identify a subgroup of responders. Diabetes 2013, 62, 3766–3774. [Google Scholar] [PubMed]
- Hagopian, W.; Ferry, R.J., Jr.; Sherry, N.; Carlin, D.; Bonvini, E.; Johnson, S.; Stein, K.E.; Koenig, S.; Daifotis, A.G.; Herold, K.C.; et al. Teplizumab preserves C-peptide in recent-onset type 1 diabetes: Two-year results from the randomized, placebo-controlled Protege trial. Diabetes 2013, 62, 3901–3908. [Google Scholar] [PubMed]
- Sherry, N.; Hagopian, W.; Ludvigsson, J.; Jain, S.M.; Wahlen, J.; Ferry, R.J., Jr.; Bode, B.; Aronoff, S.; Holland, C.; Carlin, D.; et al. Teplizumab for treatment of type 1 diabetes (Protege study): 1-year results from a randomised, placebo-controlled trial. Lancet 2011, 378, 487–497. [Google Scholar] [CrossRef] [Scilit] [PubMed]
- Herold, K.C.; Bundy, B.N.; Long, S.A.; Bluestone, J.A.; DiMeglio, L.A.; Dufort, M.J.; Gitelman, S.E.; Gottlieb, P.A.; Krischer, J.P.; Linsley, P.S.; et al. An Anti-CD3 Antibody, Teplizumab, in Relatives at Risk for Type 1 Diabetes. N. Engl. J. Med. 2019, 381, 603–613. [Google Scholar] [CrossRef] [Scilit] [PubMed]
- Vaitaitis, G.M.; Waid, D.M.; Sharkey, C.; Sharkey, S.; Webb, T.L.; Webb, C.; Wagner, D.H., Jr. A CD40-targeting peptide, OPT501, modulates inflammation in canine diabetes mellitus improving clinical outcomes. Front. Immunol. 2026, 17, 1759373. [Google Scholar] [CrossRef] [Scilit] [PubMed]
- Zipp, F.; Bittner, S.; Schafer, D.P. Cytokines as emerging regulators of central nervous system synapses. Immunity 2023, 56, 914–925. [Google Scholar] [CrossRef] [Scilit] [PubMed]
- Hopewell, S.; Chan, A.W.; Collins, G.S.; Hróbjartsson, A.; Moher, D.; Schulz, K.F.; Tunn, R.; Aggarwal, R.; Berkwits, M.; Berlin, J.A.; et al. CONSORT 2025 Statement: Updated guideline for reporting randomised trials. BMJ 2025, 389, e081123. [Google Scholar] [CrossRef] [Scilit] [PubMed]

Disclaimer/Publisher’s Note: The statements, opinions and data contained in all publications are solely those of the individual author(s) and contributor(s) and not of MDPI and/or the editor(s). MDPI and/or the editor(s) disclaim responsibility for any injury to people or property resulting from any ideas, methods, instructions or products referred to in the content. |
© 2026 by the authors. Licensee MDPI, Basel, Switzerland. This article is an open access article distributed under the terms and conditions of the Creative Commons Attribution (CC BY) license.