


Abstract
Background/Objectives: Diabetic retinopathy (DR) is one of the most common microvascular complications in type 2 diabetes mellitus (T2DM), in which oxidative stress, inflammation and angiogenic pathways are associated with the development and progression beyond glycemic control. Serum trace element levels (Cu, Zn, Fe, Mg, Cr, Mn, Cd, and Se), antioxidant enzyme activities (superoxide dismutase (SOD) and glutathione peroxidase (GSH-Px)) were measured in patients with T2DM, with and without DR, as well as in healthy controls, and their associations with the presence and severity of DR were evaluated. Methods: 61 T2DM patients, 27 healthy controls. Patients with T2DM were classified into T2DM without DR (n = 30) and T2DM with DR (n = 31). Non-proliferative DR (NPDR, n = 19) and proliferative DR (PDR, n = 12) were classified as the T2DM with DR group. Inductively coupled plasma–mass spectrometry (ICP-MS) was used to quantify serum trace elements. SOD and GSH-Px activities were measured using colorimetric assays. Results: Significant differences were observed in trace element levels and antioxidant enzyme activities among the study groups (p < 0.001 to 0.05). The DR subgroup had lower levels of Cr, Cu and Se compared to the T2DM without DR group; Cd, Zn and Mn were also higher in the T2DM with DR than in the T2DM without DR group. Fe levels were significantly higher in the PDR subgroup than in the T2DM without DR group (p < 0.001). The PDR group showed greater declines of Cr, Cu and GSH-Px compared to NPDR while higher values for Mn, Fe, and Zn were obtained (p < 0.001). Several biomarkers remained significantly associated with DR after adjustment for metabolic variables. Correlation analysis between trace elements, and antioxidant enzymes showed significant associations. Conclusions: Trace element imbalance, and reduced antioxidant enzyme activities may contribute to the development and progression of DR in T2DM. These findings suggest that oxidative stress and micronutrient imbalance may be linked to DR-related biochemical alterations.
1. Introduction
Diabetic retinopathy (DR) is a significant microvascular complication of type 2 diabetes mellitus (T2DM) and a leading cause of vision loss [1]. Clinically, diabetic retinopathy is classified as non-proliferative (NPDR) or proliferative (PDR) stages [2]. While disease duration and inadequate glycemic control are considered key risk factors for DR, disease development can differ in individuals with similar metabolic characteristics [3]. Several authors reported that glycemic control alone, as reflected by HbA1c levels, does not fully explain the development of vision-threatening diabetic retinopathy in certain populations [4]. Therefore, such systemic and pathogenic factors beyond glycemic control may also be involved in disease progression.
Oxidative stress and chronic inflammation may be associated with DR [5,6]. Trace elements are critically important in the regulation of redox balance, insulin signaling, and antioxidant defense systems [7,8]. In particular, chromium (Cr), magnesium (Mg), zinc (Zn), manganese (Mn), and selenium (Se) have been shown to enhance insulin action and play a role in glucose metabolism [9,10,11,12]. Furthermore, Zn and Cu act as cofactors for the superoxide dismutase (SOD) enzyme; Se is a key component of glutathione peroxidase (GSH-Px), and these enzymes play a critical role in the detoxification of reactive oxygen species [11,13,14,15,16]. Studies have reported that trace element imbalances are associated with inflammation and oxidative stress [16,17,18].
Evidence of trace element imbalances in T2DM is growing, but their impact concerning DR development and severity and on antioxidant enzyme activities is still unclear. This study is one of the few that evaluates trace elements, and antioxidant enzyme activities in conjunction with diabetic retinopathy (DR) severity. Therefore, our study aimed to evaluate serum trace element levels (Cu, Zn, Fe, Mg, Cr, Mn, Cd, and Se), and antioxidant enzyme activities (GSH-Px and SOD) in individuals with T2DM, DR, and healthy controls, and to investigate their associations with the presence and severity of DR.
2. Materials and Methods
2.1. Study Design and Population
This single-center, cross-sectional case–control study was conducted at Niğde Ömer Halisdemir University Training and Research Hospital. This study was supported by the Scientific Research Projects Coordination Unit of Niğde Ömer Halisdemir University (SAT 2021/5-BAGEP). The study included patients with T2DM who had been followed up in the Internal Medicine outpatient clinic for at least 10 years. A total of 61 T2DM patients were included in the study. T2DM was diagnosed according to the American Diabetes Association (ADA) diagnostic criteria [19], including fasting plasma glucose ≥ 126 mg/dL, 2 h plasma glucose ≥ 200 mg/dL during an oral glucose tolerance test, HbA1c ≥ 6.5%, or a previous clinical diagnosis of diabetes.
Among these patients, 30 showed no signs of diabetic retinopathy (DR) during ophthalmological examination and were classified as the “T2DM without DR” group; 31 patients were diagnosed with DR at the Ophthalmology Clinic after fundus examination and were classified as the “T2DM with DR” group, for whom treatment is ongoing. Thus, the diabetic cohort consisted of two main groups: T2DM without DR (n = 30) and T2DM with DR (n = 31). Fundus examination in the patient group T2DM with DR was performed using optical coherence tomography (OCT; Cirrus 4000 HD-OCT, Zeiss Meditec, Jena, Germany) and fundus fluorescein angiography. Based on clinical examination data, they were divided into two separate groups: NPDR (n = 19) and PDR (n = 12). In addition, a healthy control group (n = 27) was formed from hospital staff and patient relatives who voluntarily agreed to participate in the study. Although a small proportion of the control group consisted of patient relatives, all control participants were carefully screened to exclude diabetes and other relevant systemic diseases, thereby minimizing potential selection bias. Efforts were made to match the control and patient groups in terms of age and sex distribution. Participants from all three patient categories were excluded if they had any retinal condition aside from diabetic retinopathy in the “T2DM with DR” group. Additionally, those with comorbidities such as diabetic nephropathy, coronary artery disease, cancer, organ failure, polycystic ovary syndrome, ulcerative colitis, inflammatory diseases, pregnancy, renal issues, or systemic autoimmune disorders like rheumatoid arthritis were also disqualified. Furthermore, individuals with hormonal imbalances unrelated to T2DM and/or obesity were not included. Individuals in the control group had no history of diabetes or any systemic disease. When forming the control group, individuals with a history of diabetes or any systemic disease, as well as those who were pregnant, had insulin resistance, or had prediabetes, were excluded. Written informed consent was obtained from all participants. This research was approved by the Nigde Omer Halisdemir University Non-Interventional Clinical Research Ethics Committee (No. 2020/55) and the study was conducted in accordance with the principles of the Declaration of Helsinki.
2.2. Chemicals and Reagents
For trace element analysis, pure nitric acid (Carlo Erba Reagents, Val-de-Reuil, France), hydrogen peroxide (Merck KGaA, Darmstadt, Germany), standard mixture solution (Chem-Lab, 23 elements ICP-QC standard solutions, Zedelgem, Belgium), internal standard terbium (Inorganic Ventures, Christiansburg, VA, USA) and ultrapure water (Millipore, Synerg UV, Molsheim, France) were used.
2.3. Collection of Blood Samples
After obtaining written informed consent from all participants, a venous blood sample of 5 mL was drawn from each individual into two standard biochemistry tubes. The samples were subsequently subjected to centrifugation at a speed of 3000 rpm for a duration of 5 min. Following this process, the resulting sera were carefully transferred into eppendorf tubes and stored at −80 °C until analysis.
2.4. Measurement of Trace Element Levels
Serum levels of trace elements, including Cu, Cr, Cd, Mg, Mn, Fe, Zn, and Se, were assessed through inductively coupled plasma mass spectrometry (ICP-MS; Thermo iCAP RQ, Scientific iCAP RQ, Bremen, Germany) after conducting microwave-assisted digestion (MARS 6, CEM Corporation, Matthews, NC, USA). Calibration curves were established utilizing multi-element standard solutions with terbium (Tb) serving as an internal standard. Calibration curves showed good linearity (R2 > 0.99) for all elements. The limits of detection (LOD) for the analyzed elements were in the ppb range and were determined based on calibration curves obtained from the ICP-MS system. Throughout the analysis, quality control measures such as blank and standard assessments were implemented. Each sample underwent triplicate analysis, and findings were reported in parts per billion (ppb or µg/L).
2.5. Determination of SOD and GSH-Px Activities
The serum samples from participants in the T2DM with DR, T2DM without DR, and control groups were analyzed for SOD activity using kits developed based on the colorimetric method utilizing hydroxylamine (Elabscience Biotechnology Co., Ltd., Wuhan, China, Cat No. E-BC-K022-M). Subsequently, GSH-Px levels were assessed using kits formulated according to the colorimetric method that employs dinitrobenzoic acid (Elabscience Biotechnology Co., Ltd., Wuhan, China, Cat No. E-BC-K096-M). The kit protocols used in enzyme activities were carefully followed and all samples were analyzed triplicate to ensure reproducibility.
2.6. Statistical Analysis
Data were analyzed using SPSS version 18. The Kolmogorov–Smirnov and Shapiro–Wilk tests were applied to evaluate the normality of data distribution. Variables with normal distribution were compared between study groups using one-way ANOVA, followed by Tukey’s post hoc test for multiple comparisons. Non-normally distributed data were analyzed using the Kruskal–Wallis test, and pairwise group comparisons were conducted with the Mann–Whitney U test, with Bonferroni correction applied for multiple comparisons. To assess the independent association of each biomarker with the presence of diabetic retinopathy, multivariable binary logistic regression analyses were performed for each biomarker separately, with HbA1c, BMI, and diabetes duration included as covariates. Pearson and Spearman correlation analyses were performed to assess relationships between biochemical parameters within each group. For correlation analyses, the Benjamini–Hochberg false discovery rate (FDR) correction was applied within each group. Results were presented as mean ± standard deviation for parametric data and as median (IQR) for non-parametric data. A p-value of ≤0.05 was considered statistically significant.
3. Results
Demographic and biochemical data of the study groups are shown in Table 1. No statistically significant differences were observed among the control, T2DM without DR, NPDR, and PDR groups in terms of mean age, sex and BMI distribution. Similarly, no statistically significant difference was found among the patient groups in terms of duration of diabetes. However, the difference between the patient and control groups in terms of glucose and HbA1c levels was statistically significant (Table 1).
Table 1.
Age and gender distribution of the study groups.
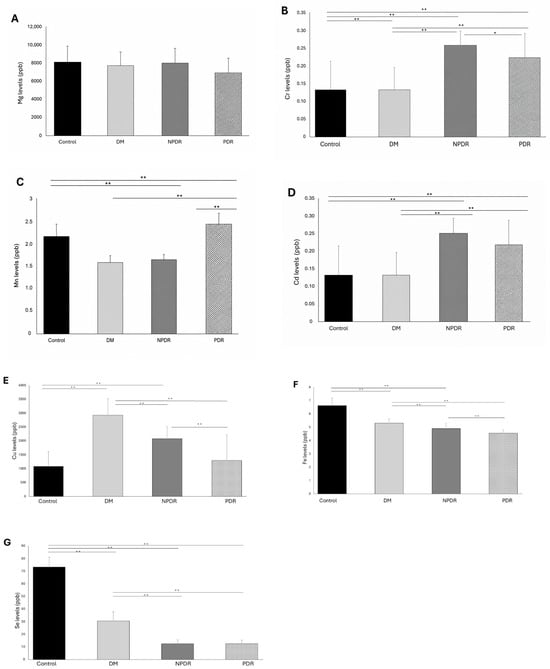
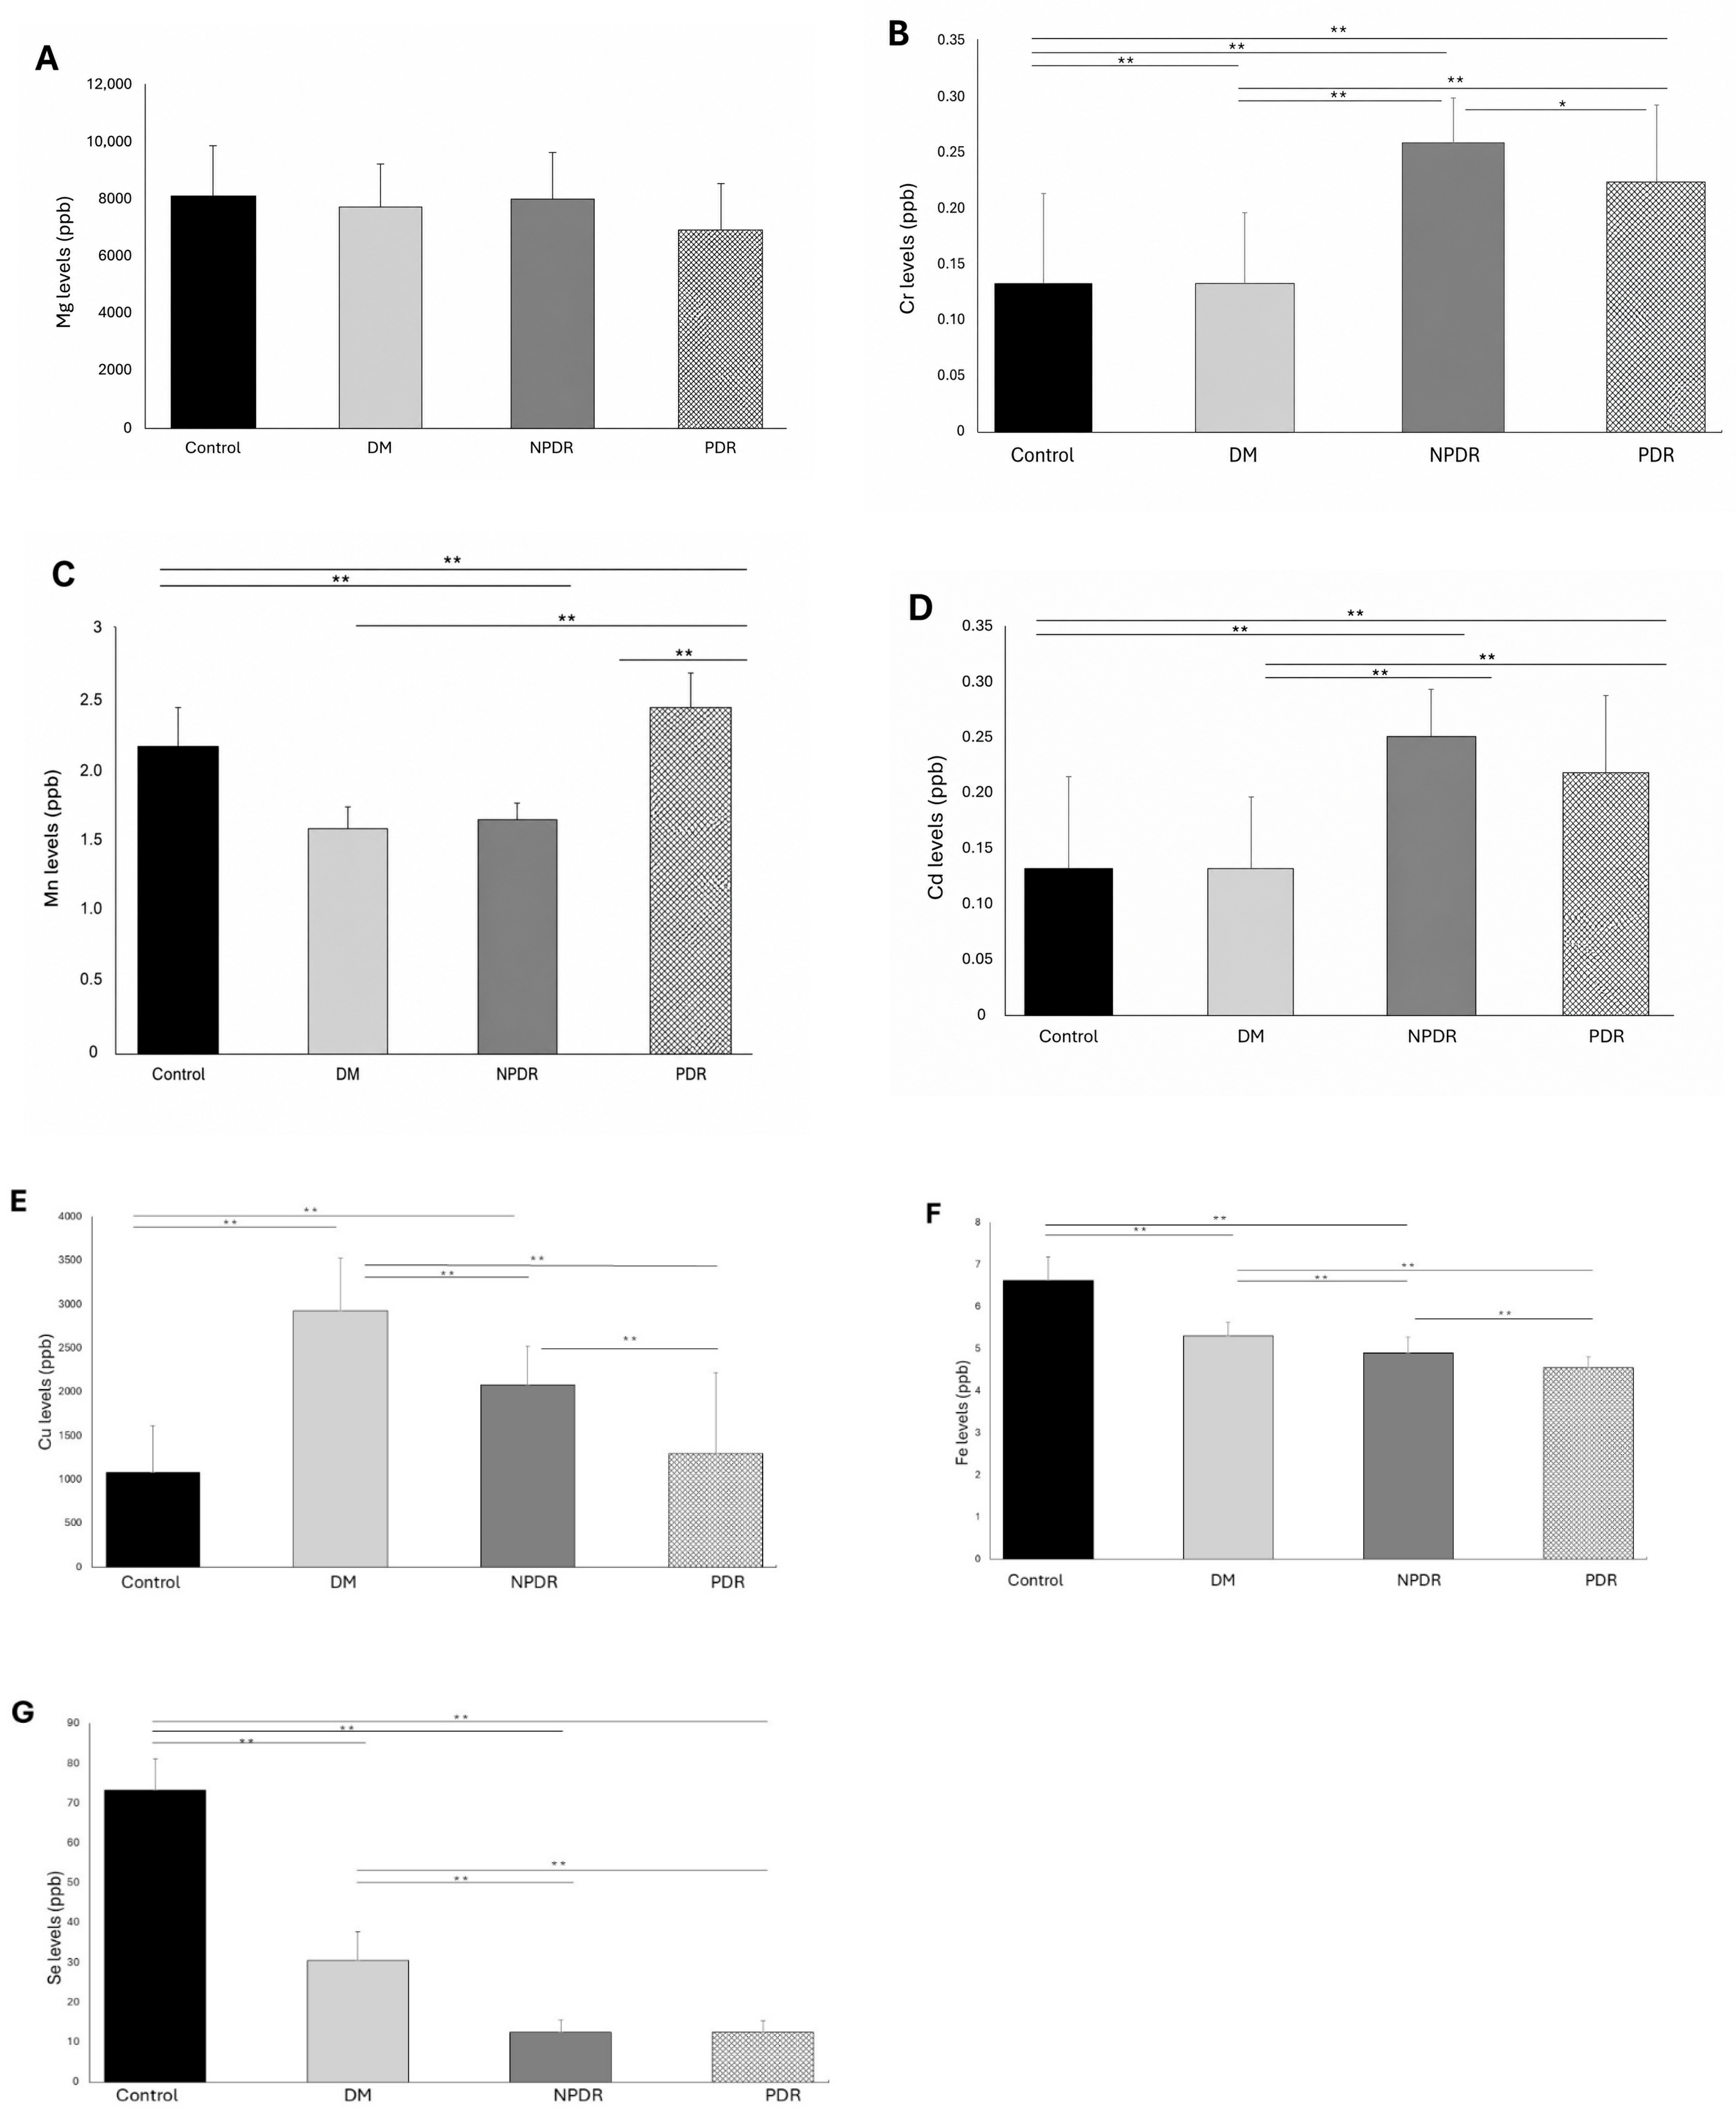
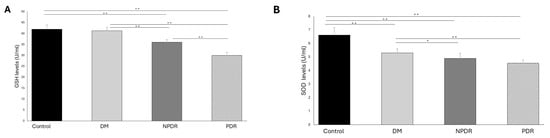
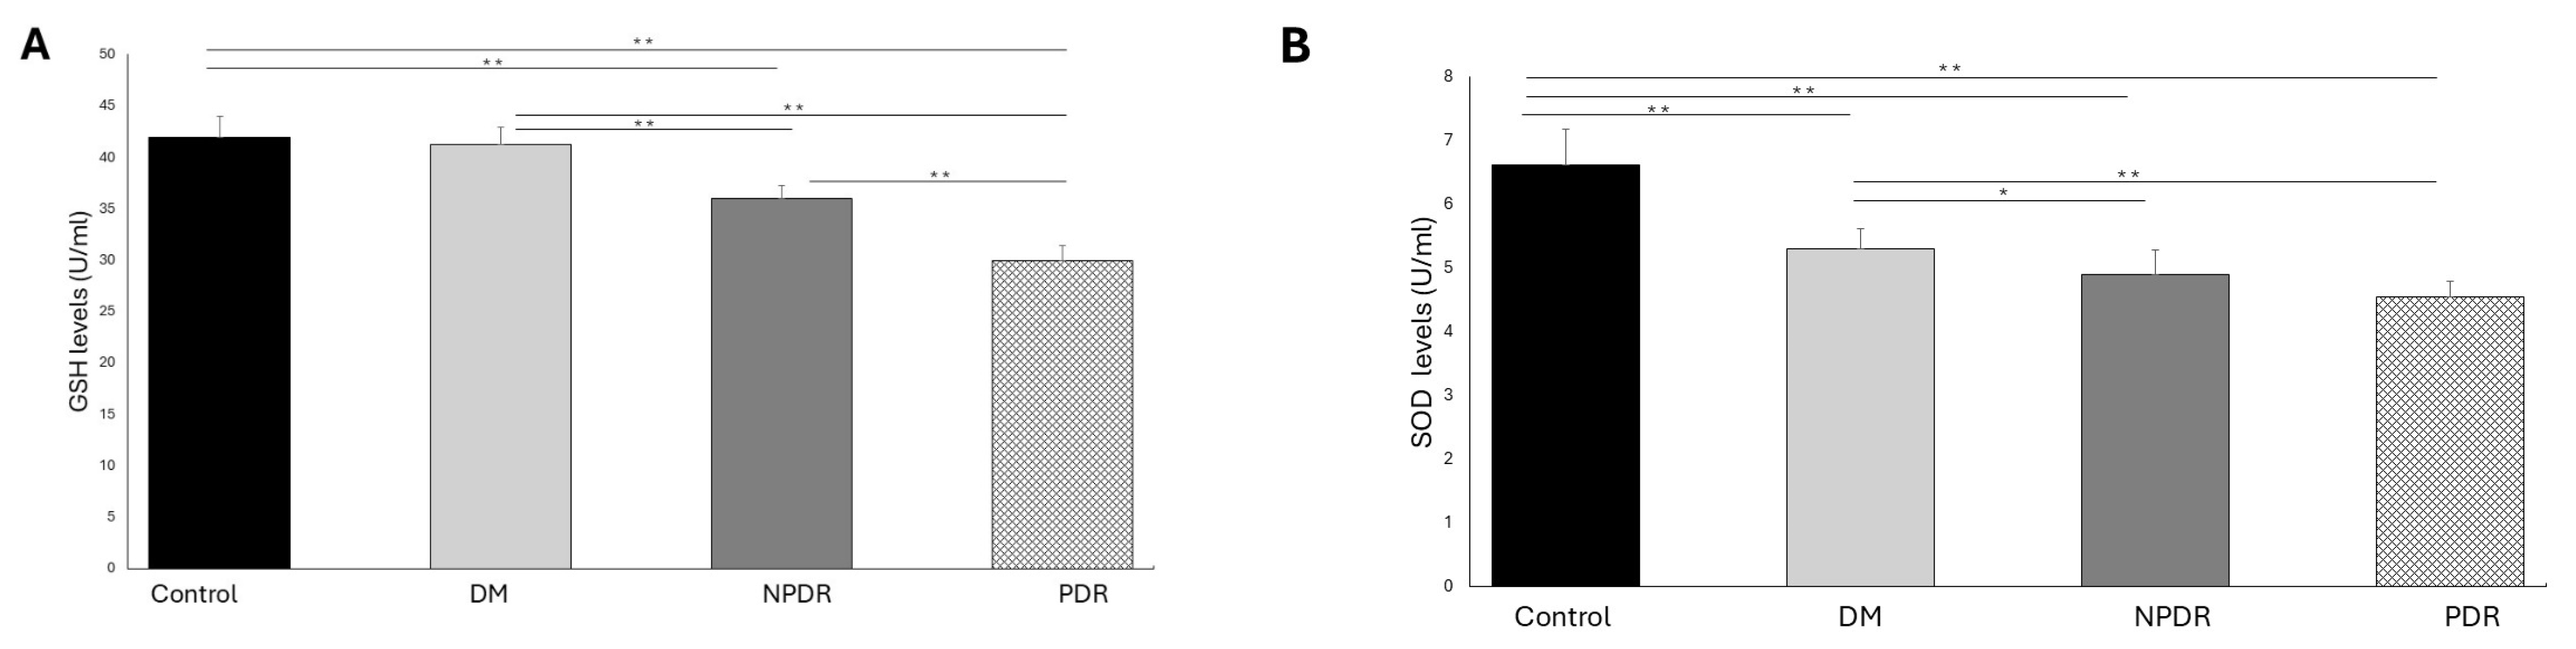
Eight trace elements concentrations, and enzyme activities were compared between the control, T2DM without DR, and DR subtypes (NPDR and PDR). Serum trace element concentrations and enzyme activity levels determined in the study groups are shown in Figure 1 and Figure 2. Non-normally distributed Zn concentration in the study groups are shown in Table 2.
Figure 1.
Bar graph indicating the serum (A), Magnesium [Mg] (B), Chromium [Cr] (C), Manganese [Mn] (D), Cadmium [Cd] (E), Copper [Cu] (F), Iron (Fe) (G), and Selenium [Se] element levels in study groups. Error bars show ‘mean’. DR, diabetic retinopathy; NPDR, nonproliferative DR; PDR, proliferative DR; DM (T2DM without DR), Non-DR type 2 diabetes mellitus. ** p < 0.001, * p < 0.05 for statistically significant.
Figure 2.
Bar graph indicating the serum (A) GSH and (B) SOD enzyme levels in study groups. Error bars show ‘mean’. GSH, Glutathione peroxidase; SOD, Superoxide dismutase; DR, diabetic retinopathy; NPDR, nonproliferative DR; PDR, proliferative DR; DM, (T2DM without DR), Non-DR type 2 diabetes mellitus. ** p < 0.001, * p < 0.05 for statistically significant.
Table 2.
Statistical comparison of serum Zn levels among study groups.
To evaluate the independent associations of biomarkers with the presence of DR after controlling for possible confounding factors (HbA1c, BMI, and diabetes duration), multivariate binary logistic regression analysis was performed separately for each biomarker, taking HbA1c, BMI, and diabetes duration as covariates (Table 3). Cr (OR = 0.012, 95% CI: 0.001–0.252, p = 0.005) and Cu (OR = 0.054, 95% CI: 0.010–0.286, p < 0.001) showed a negative association with the presence of DR, while Mn (OR = 7.574, 95% CI: 1.756–32.658, p = 0.007) and Cd (OR = 35.177, 95% CI: 3.760–329.064, p = 0.002) showed a positive association. Furthermore, SOD (OR = 0.136, 95% CI: 0.046–0.399, p < 0.001) was found to be significantly and negatively associated with the presence of DR. After correction for Mg and Fe, statistical significance was not reached (p > 0.05).
Table 3.
Multivariable logistic regression analysis for the presence of DR.
Comparing the control group to the T2DM without DR group, there were significant decreases in Cr, Mn, Fe, Se, Zn concentrations, and SOD activity (p < 0.001). However, Cu concentration was found to be elevated (p < 0.001). Cd concentration and GSH-Px activity were similar in both groups. When the NPDR group was compared with the T2DM without DR group, Cr, Fe, Cu, and Se concentrations, and GSH-Px activity were significantly lower in the NPDR group compared to the T2DM without DR group (p < 0.001). The decrease in SOD activity was also statistically significant (p < 0.05). Mn, Cd, and Zn concentrations were higher in the NPDR group compared to the T2DM without DR group. The increase in Cd and Zn concentrations was significant (p < 0.001), while the decrease in Mn concentration was not significant (p = 0.710). In addition, the NPDR group data were compared with the PDR group. Cr, Cu concentrations, and GSH-Px activity were found to be significantly lower in the PDR group compared to the NPDR group (p < 0.05), while the decrease in Cd concentration, and SOD activity was not significant. Mn, Fe, and Zn concentrations were significantly higher in the PDR group compared to the NPDR group (p < 0.001). When Se concentrations were compared in the NPDR and PDR groups, there was no difference between the two groups.
When comparing the T2DM without DR and PDR groups, Cr, Cu, Se concentrations, and GSH-Px and SOD activities were significantly lower in the PDR subgroup compared to the T2DM without DR group (p < 0.001). Mn, Fe, Cd, and Zn concentrations were significantly higher in the PDR group (p < 0.001).
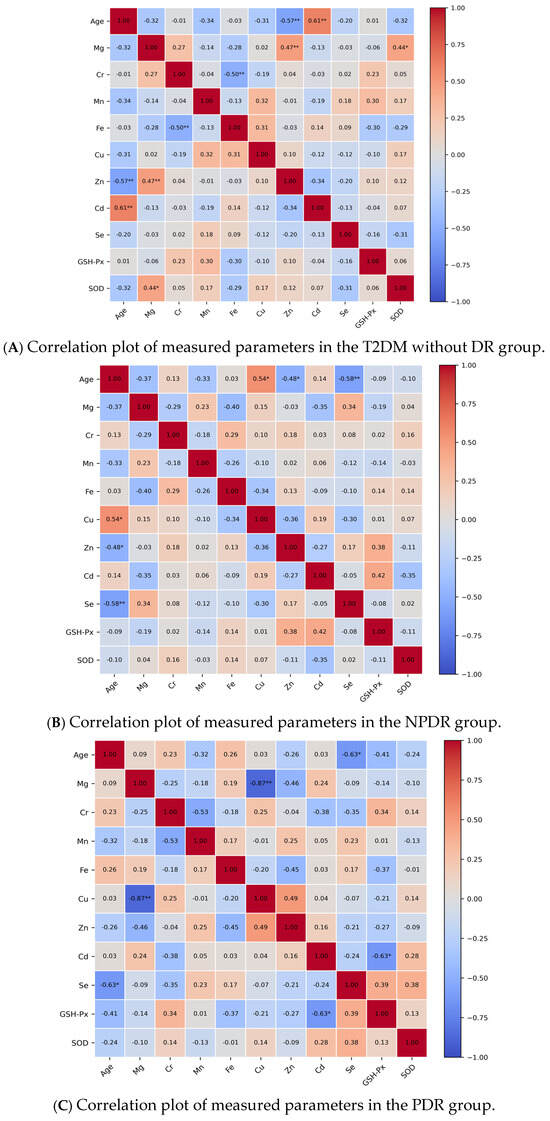
Correlation analyses were also performed for the investigated parameters in each group using the obtained data (Figure 3). In the T2DM without DR group, negative correlations were found between Cr and Fe levels (r = −0.49, p = 0.005) and between age and Zn levels (r = −0.57, p < 0.001). However, a significant positive correlation was found between age and Cd (r = 0.61, p < 0.001), Zn, and Mg (r = 0.47, p = 0.008), in the T2DM without DR group. A moderate positive correlation was seen between Mg and SOD (r = 0.44, p = 0.016) in the T2DM without DR group. In the NPDR group, correlation analysis showed that age levels were significantly positively correlated with Cu levels (r = 0.54, p = 0.017) and negatively correlated with Se levels (r = −0.58, p = 0.009), and Zn levels (r = −0.48, p = 0.037). Finally, correlation analysis revealed a negative correlation between age and Se (r = −0.63, p = 0.029) and between Cd and GSH-Px (r = −0.63, p = 0.028) in the PDR group. Furthermore, a significant negative correlation was also noted between Mg and Cu in the PDR group (r = −0.87, p < 0.001).
Figure 3.
Correlation plot of measured parameters. (A) T2DM without DR group; (B) NPDR group; (C) PDR group. GSH-Px; glutathione peroxidase, SOD; superoxide dismutase. r indicates spearman correlation coefficient and values of less than 0.05 were considered significant. ** p < 0.001, * p < 0.05.
4. Discussion
DR represents a prevalent complication associated with DM, affecting both type 1 and type 2 forms of the disease [20]. This condition arises primarily due to prolonged hyperglycemia and can lead to various metabolic stresses depending on the individual’s diabetic status.
The role of Cr in enhancing insulin action has been supported by various studies [21,22]. Cr has been reported to enhance glucose uptake by promoting the translocation of insulin-stimulated GLUT4 to the plasma membrane. This effect is thought to occur through both enhancement of the insulin signaling pathway and modulation of membrane cholesterol levels [21]. In the present analysis, it was found that Cr concentrations were diminished in individuals with T2DM without DR compared to those in the control cohort, and participants suffering from T2DM with DR also showed lower Cr levels than those in the T2DM without DR group (Figure 1B). This finding is significant, considering the elevated metabolic activity associated with retinal tissue. The observed decrease in Cr levels across the control, T2DM, and DR groups may reflect the loss of the potentially protective effects of chromium on glucose metabolism and insulin signaling. The analysis of participants within the T2DM without DR group revealed a noteworthy negative correlation between serum Cr and serum Fe levels. It has been documented that around 80% of Cr in the bloodstream is associated with transferrin, a protein that competes with Fe for binding sites [23]. This competition could potentially influence the physiological roles and absorption of these two essential trace elements.
Research indicates that insufficient Zn levels can lead to cellular and tissue damage, primarily due to the elevation of free radicals. Prolonged Zn deficiency has been associated with retinal and RPE damage, influencing various conditions through mechanisms such as heightened oxidative stress and the accumulation of lipofuscin in the EPR, ultimately resulting in the deterioration of photoreceptors [24]. In numerous investigations, it has been observed that serum Zn concentrations are markedly lower in individuals diagnosed with DR compared to those with T2DM who do not exhibit retinopathy, as well as in healthy control subjects [25]. In alignment with existing research, the current study found a significant reduction in Zn levels among participants in the T2DM without DR group when contrasted with those in the control group. The serum Zn levels individuals in the NPDR group were lower than those found in the control group, yet higher than those in the T2DM without DR group (Table 2). Moreover, a significant and periodic decrease in the activity of Zn dependent SOD, an important antioxidant enzyme, was noted across the control, T2DM without DR, NPDR, and PDR groups.
The deficiency of Mg has been linked to numerous health conditions, including issues with glucose tolerance, insulin resistance, and irregular lipid metabolism. Various studies have shown that abnormal Mg metabolism can play a role in the onset and progression of diabetes, as well as complications associated with diabetic microvascular and macroangiopathy [26]. In our study, regular glycemic monitoring of patient groups may have slowed the pronounced decline in Mg levels reported in diabetic complications (Figure 1A).
Numerous investigations into Cu levels in patients T2DM with DR have yielded inconsistent findings. One particular study indicated that serum Cu concentrations were elevated in individuals suffering from DR, suggesting that this increase may contribute to the progression of the condition by heightening oxidative stress levels [27]. Conversely, another research effort found that enhancing Cu intake could potentially mitigate the risk of developing DR [28]. Boyer et al. posited that the inhibition of amine oxidase, an enzyme that contains Cu, may alleviate vascular damage linked to vascular diseases and inflammation during the initial phases of DR, thereby improving out-comes related to hypoxia [29]. Investigations into diabetes have shown that both a lack of Cu and an increase in its levels can initiate several biological mechanisms. However, the discrepancies in the reported mechanisms across different studies highlight the complexity of copper’s involvement in diabetic pathology.
Research indicates that Zn intake can lead to a decrease in Cu absorption, and deficiencies in either mineral may impact the other our research, it was found that Cu levels were higher in participants with T2DM without DR compared to those who were healthy, while a reduction in Cu levels was noted in the T2DM with DR group (Figure 1E). These results may have been influenced by various mechanisms; in particular, Zn may have an indirect effect on Cu levels in the three participant groups (T2DM without DR, NPDR, and PDR) included in this study. Moreover, the elevated Cu levels observed in the T2DM without DR and NPDR groups may be associated with increased oxidative stress and inflammation.
Zhu et al. based on the positive effects of Mn on glucose metabolism, they stated that its deficiency may be responsible for the development of DR in T2DM patients [30]. In our study on evaluating Mn levels, we observed that Mn concentrations were decreased in individuals with T2DM without DR and NPDR compared to the control group, whereas they were increased in those with PDR (Figure 1C). Both Mn deficiency and excess are associated with adverse metabolic conditions. In cases of deficiency, reduced levels of the antioxidant enzyme manganese superoxide dismutase (MnSOD), impaired activation of key enzymes involved in lipid and particularly carbohydrate metabolism, and diminished insulin secretion may occur. Conversely, Mn excess may lead to mitochondrial dysfunction by increasing mitochondrial reactive oxygen species and altering membrane permeability. Therefore, due to the effects of disrupted metabolic pathways [31], Mn levels may vary throughout the pathogenesis of DR.
It is known that the frequency of anemia is increased in patients with diabetes and that this may contribute to the pathogenesis of diabetic complications [32]. Fe deficiency anemia in patients with DM may cause hypoxia and hypoxia can worsen retinopathy [33]. Chen et al. investigated serum iron levels in patients T2DM with DR and reported that they were significantly lower than controls [34]. Consistent with the results of this study, significantly lower serum Fe levels were observed in the T2DM without DR, NPDR, and PDR group compared to the control group in our study (Figure 1F). Excess Fe, which is known to be associated with more intense inflammation, may influence excessive production of reactive oxygen and nitrogen species [35]. The increase in free Fe resulting from hyperglycemia-induced heme breakdown [36] and inflammation-related alterations in hepcidin expression leading to Fe accumulation in ocular tissues [37] have been suggested to be associated with the progression of microvascular complications. Based on this information, we can say that Fe metabolism in the development and progression of DR is not linear due to many factors.
The adverse effects of heavy metals such as Hg, Pb, and Cd on both the environment and human health are largely due to their propensity to accumulate in various tissues, including bones, kidneys, and the brain, without being metabolized. This accumulation can lead to competition with vital trace elements, causing detrimental effects on various physiological functions and enzymatic activities. Moreover, these toxic metals have been associated with the development of DM. Studies have shown that levels of Cd increase as the duration of diabetes and hyperglycemia extends [38]. Additionally, research has indicated that exposure to heavy metals may heighten the risk of ocular diseases, such as DR, age-related macular degeneration, and cataracts [39]. A study pointed out that Cd is linked to glycemic impairment and vascular issues, revealing that exposure to Cd raises the likelihood of developing DM and prediabetes [9]. Also, it was proposed in another study that Cd exposure could expedite diabetes progression by impairing pancreatic beta cell function, resulting in increased pro-inflammatory activity [38]. Our research determined that Cd levels were significantly increased in the T2DM with DR subgroups compared to both the control and T2DM without DR groups (Figure 1D). Additionally, it was determined that there was a negative correlation between Cd and GSH-Px levels in the PDR group (Figure 3C). This suggests that Cd-related harmful effects, such as oxidative stress and inflammation, may influence the pathogenesis of DR.
Participants in the T2DM without DR and T2DM with DR subgroups in the current study had significantly lower Se levels than those in the control group (Figure 1G). Se levels were lower in T2DM patients without DR than in T2DM patients with DR, according to a study that looked into Se levels in patients with DR [40].
In our study, a significant decrease in GSH-Px activity and a reduced Se levels were observed in the T2DM with DR group compared to both the control group and T2DM without DR groups. Although no significant correlation was found between Se levels and GSH-Px activity, our findings suggest that alterations in selenium levels and GSH-Px activity may be associated with disease progression. Antioxidant enzymes have been shown to be important in preventing the growth of oxidative damage in a number of investigations on the onset of T2DM and its consequences. These antioxidant scavenging enzymes, such as SOD enzymes, have even been proposed as potential therapeutic targets for the therapy of DR [41]. In this research, the activities of SOD, an essential antioxidant enzyme linked to trace elements, were measured alongside GSH-Px. Bukhary et al. reported significant fluctuations in SOD and catalase enzyme activities in relation to the severity of DR [41]. Consistent with previous studies, our study found that SOD activity was reduced in T2DM with DR compared to T2DM without DR and further decreased in PDR, the most advanced stage of DR. However, the decrease in SOD activity in PDR compared to NPDR was not statistically significant (Figure 2B). The outcomes of this study suggest that the reductions in GSH-Px and SOD activities may be related to the clinical severity of DR.
To further evaluate whether the observed associations were independent of major metabolic factors, multivariable logistic regression analyses were performed after adjustment for HbA1c, BMI, and duration of diabetes. Among the investigations, Cr, Cu, Mn, Cd, and SOD remained significantly associated with DR. These findings suggest that alterations in trace element balance and oxidative stress markers may be independently associated with DR beyond conventional metabolic parameters. Although Fe and Mg levels differed in unadjusted group comparisons, these associations were not maintained after adjustment for metabolic variables.
Numerous studies in the existing literature examining trace elements in T2DM without DR and T2DM with DR have primarily concentrated on a limited number of elements. Nonetheless, the findings presented in these studies exhibit inconsistencies [30,40].
The outcomes of this study are noteworthy due to the inclusion of T2DM without DR and T2DM with DR subgroups (NPDR and PDR), as well as the observation of how trace elements and antioxidant enzyme activities fluctuate with the advancement and severity of DR. In addition, combining data from different analyses into a single study reduced the complexity of the variables and allowed for more efficient evaluation. However, it is important to acknowledge certain limitations. As this study is cross-sectional, it is not possible to establish causal relationships or determine whether the observed changes in biomarkers are a cause or a consequence of DR. Firstly, there was a lack of dietary management and follow-up for the study participants. One significant limitation is the lack of information regarding the levels of elements in urine. Additionally, the small sample sizes of the groups present another challenge. The inadequate sizes of the DR sub-groups make it challenging to assess the treatment processes at both early and late stages. Furthermore, the differences in patient characteristics between the T2DM without DR and T2DM with DR subgroups could be elucidated through long-term complication studies, which would involve following DM patients in before-and-after studies within the same sample.
5. Conclusions
In conclusion, the findings of this study suggest that alterations in trace elements, and antioxidant enzyme activities may be associated with DR. However, further large-scale and longitudinal studies are needed to clarify their potential clinical significance.
Author Contributions
All authors contributed to the study conception and design. Material preparation, data collection and analysis were performed by S.E., İ.S., K.R.Z., E.Ö., D.A. and İ.A. Statistical analysis and data interpretation were performed by A.T.Ç. The first draft of the manuscript was written by S.E. and all authors commented on previous versions of the manuscript. All authors have read and agreed to the published version of the manuscript.
Funding
This study was supported by Nigde Omer Halisdemir University Scientific Research Projects Coordination Unit within the scope of Project number SAT 2021/5-BAGEP.
Institutional Review Board Statement
This research was approved by the Nigde Omer Halisdemir University Non-Interventional Clinical Research Ethics Committee (No. 2020/55, approval date: 8 October 2020) and study was performed in line with the principles of the Declaration of Helsinki.
Informed Consent Statement
Informed consent was obtained from all subjects involved in the study.
Data Availability Statement
The original contributions presented in this study are included in the article. For more information, please contact the corresponding author.
Acknowledgments
The authors thank all study participants and study staff. We are grateful for the support of this research from the Nigde Omer Halisdemir University Scientific Research Projects Coordination Unit. Funding agencies do not play any role in study design, data collection, or manuscript preparation for publication.
Conflicts of Interest
The authors declare that have no know competing financial interests or personal relationships that could have appeared to influence the work reported in this paper.
Abbreviations
The following abbreviations are used in this manuscript:
| DR | Diabetic retinopathy |
| T2DM | Type 2 diabetes mellitus |
| NPDR | Non-proliferative diabetic retinopathy |
| PDR | Proliferative diabetic retinopathy |
| SOD | Superoxide dismutase |
| GSH-Px | Glutathione peroxidase |
| Cr | Chromium |
| Mg | Magnesium |
| Mn | Manganese |
| Se | Selenium |
| Zn | Zinc |
| Fe | Iron |
| Cd | Cadmium |
| Cu | Copper |
| Tb | Terbium |
References
- Antonetti, D.A.; Klein, R.; Gardner, T.W. Diabetic retinopathy. N. Engl. J. Med. 2012, 366, 1227–1239. [Google Scholar] [CrossRef] [Scilit]
- Duong, V.A.; Ahn, J.; Han, N.Y.; Park, J.M.; Mok, J.H.; Kim, T.W.; Lee, H. Proteomic analysis of the vitreous body in proliferative and non-proliferative diabetic retinopathy. Curr. Proteom. 2021, 18, 143–152. [Google Scholar] [CrossRef] [Scilit]
- Liu, Y.; Li, J.; Ma, J.; Tong, N. The threshold of the severity of diabetic retinopathy below which intensive glycemic control is beneficial in diabetic patients: Estimation using data from large randomized clinical trials. J. Diabetes Res. 2020, 2020, 8765139. [Google Scholar] [CrossRef] [Scilit]
- Mankad, R.N.; Marek, L.; Acosta, G.; Cabrera, A.P.; Monickaraj, F.; Qualls, C.; Das, A. Role of systemic factors in the progression to vision-threatening diabetic retinopathy in a New Mexican patient population with type 2 diabetes: Glycemic control is not enough. J. Diabetes Res. 2026, 2026, 7203748. [Google Scholar] [CrossRef] [Scilit] [PubMed]
- Kang, Q.; Yang, C. Oxidative stress and diabetic retinopathy: Molecular mechanisms, pathogenetic role and therapeutic implications. Redox Biol. 2020, 37, 101799. [Google Scholar] [CrossRef] [Scilit]
- Zhang, H.; Cai, L. Zinc homeostasis plays an important role in the prevention of obesity-induced cardiac inflammation, remodeling and dysfunction. J. Trace Elem. Med. Biol. 2020, 62, 126615. [Google Scholar] [CrossRef] [Scilit] [PubMed]
- Hansen, A.F.; Simić, A.; Åsvold, B.O.; Romundstad, P.R.; Midthjell, K.; Syversen, T.; Flaten, T.P. Trace elements in early phase type 2 diabetes mellitus—A population-based study: The HUNT study in Norway. J. Trace Elem. Med. Biol. 2017, 40, 46–53. [Google Scholar] [CrossRef] [Scilit]
- Kosmalski, M.; Frankowski, R.; Leszczyńska, J.; Różycka-Kosmalska, M.; Pietras, T.; Majak, I. The evaluation of selected trace elements in blood, serum and blood cells of type 2 diabetes patients with and without renal disorder. Nutrients 2024, 16, 2989. [Google Scholar] [CrossRef] [Scilit]
- Filippini, T.; Wise, L.A.; Vinceti, M. Cadmium exposure and risk of diabetes and prediabetes: A systematic review and dose-response meta-analysis. Environ. Int. 2022, 158, 106920. [Google Scholar] [CrossRef] [Scilit] [PubMed]
- Derakhshanian, H.; Javanbakht, M.H.; Zarei, M.; Djalali, E.; Djalali, M. Vitamin D increases IGF-I and insulin levels in experimental diabetic rats. Growth Horm. IGF Res. 2017, 36, 57–59. [Google Scholar] [CrossRef] [Scilit]
- Dubey, P.; Thakur, V.; Chattopadhyay, M. Role of minerals and trace elements in diabetes and insulin resistance. Nutrients 2020, 12, 1864. [Google Scholar] [CrossRef] [Scilit] [PubMed]
- Wälti, M.K.; Spinas, G.A.; Hurrell, R.F. Low plasma magnesium in type 2 diabetes. Swiss Med. Wkly. 2003, 133, 289–292. [Google Scholar] [CrossRef] [Scilit]
- Cecerska-Heryć, E.; Surowska, O.; Heryć, R.; Serwin, N.; Napiontek-Balińska, S.; Dołęgowska, B. Are antioxidant enzymes essential markers in the diagnosis and monitoring of cancer patients—A review. Clin. Biochem. 2021, 93, 1–8. [Google Scholar] [CrossRef] [Scilit]
- Álvarez-Barrios, A.; Álvarez, L.; García, M.; Artime, E.; Pereiro, R.; González-Iglesias, H. Antioxidant defenses in the human eye: A focus on metallothioneins. Antioxidants 2021, 10, 89. [Google Scholar] [CrossRef] [Scilit]
- Bjørklund, G.; Shanaida, M.; Lysiuk, R.; Antonyak, H.; Klishch, I.; Shanaida, V.; Peana, M. Selenium: An antioxidant with a critical role in anti-aging. Molecules 2022, 27, 6613. [Google Scholar] [CrossRef] [Scilit]
- Wróblewska, J.; Nuszkiewicz, J.; Wróblewski, M.; Wróblewska, W.; Woźniak, A. Selected trace elements and their impact on redox homeostasis in eye health. Biomolecules 2024, 14, 1356. [Google Scholar] [CrossRef] [Scilit]
- Mor, P.; Rathore, A.K.; Sonagra, V.; Sharma, N.; Sharma, A. A study of serum copper, zinc and magnesium in type 2 diabetes mellitus with complications and without complications. Biomed. Pharmacol. J. 2020, 13, 1927–1930. [Google Scholar] [CrossRef] [Scilit]
- Serban, D.; Papanas, N.; Dascalu, A.M.; Stana, D.; Nicolae, V.A.; Vancea, G.; Badiu, C.D.; Tanasescu, D.; Tudor, C.; Balasescu, S.A.; et al. Diabetic retinopathy in patients with diabetic foot ulcer: A systematic review. Int. J. Low. Extrem. Wounds 2021, 20, 98–103. [Google Scholar] [CrossRef] [Scilit] [PubMed]
- American Diabetes Association. 2. Classification and diagnosis of diabetes: Standards of medical care in diabetes—2021. Diabetes Care 2021, 44, S15–S33. [Google Scholar] [CrossRef] [Scilit]
- Morgan, N.G.; Richardson, S.J. Fifty years of pancreatic islet pathology in human type 1 diabetes: Insights gained and progress made. Diabetologia 2018, 61, 2499–2506. [Google Scholar] [CrossRef] [Scilit] [PubMed]
- Chen, G.; Liu, P.; Pattar, G.R.; Tackett, L.; Bhonagiri, P.; Strawbridge, A.B.; Elmendorf, J.S. Chromium activates GLUT4 trafficking and enhances insulin-stimulated glucose transport in adipocytes. Mol. Endocrinol. 2006, 20, 857–870. [Google Scholar] [CrossRef] [Scilit]
- Vincent, J.B. Recent advances in the biochemistry of chromium(III). J. Trace Elem. Exp. Med. 2003, 16, 227–236. [Google Scholar] [CrossRef] [Scilit]
- Feng, W.; Li, B.; Liu, J.; Chai, Z.; Zhang, P.; Gao, Y.; Zhao, J. Study of chromium-containing proteins in rat liver. Anal. Bioanal. Chem. 2003, 375, 363–368. [Google Scholar] [CrossRef] [Scilit]
- Miao, X.; Sun, W.; Miao, L.; Fu, Y.; Wang, Y.; Su, G.; Liu, Q. Zinc and diabetic retinopathy. J. Diabetes Res. 2013, 2013, 425854. [Google Scholar] [CrossRef] [Scilit] [PubMed]
- Devi, T.R.; Hijam, D.; Dubey, A.; Debnath, S.; Oinam, P.; Devi, N.T.; Singh, W.G. Study of serum zinc and copper levels in type 2 diabetes mellitus. Int. J. Contemp. Med. Res. 2016, 3, 1036–1040. [Google Scholar]
- Sales, C.H.; Pedrosa, L.F.C.; Lima, J.G.; Lemos, T.M.A.M.; Colli, C. Influence of magnesium status on blood glucose control in type 2 diabetes. Clin. Nutr. 2011, 30, 359–364. [Google Scholar] [CrossRef] [Scilit] [PubMed]
- Dascalu, A.M.; Anghelache, A.; Stana, D.; Costea, A.C.; Nicolae, V.A.; Tanasescu, D.; Costea, D.O.; Tribus, L.C.; Zgura, A.; Serban, D.; et al. Serum levels of copper and zinc in diabetic retinopathy. Exp. Ther. Med. 2022, 23, 324. [Google Scholar] [CrossRef] [Scilit]
- Xu, H.; Dong, X.; Wang, J.; Cheng, X.; Qu, S.; Jia, T.; Liu, J.; Li, Z.; Yao, Y. Association of calcium, magnesium, zinc and copper intakes with diabetic retinopathy. Curr. Eye Res. 2023, 48, 485–491. [Google Scholar] [CrossRef] [Scilit]
- Boyer, D.S.; Rippmann, J.F.; Ehrlich, M.S.; Bakker, R.A.; Chong, V.; Nguyen, Q.D. Amine oxidase copper-containing 3 inhibition: A novel target for diabetic retinopathy. Int. J. Retin. Vitr. 2021, 7, 30. [Google Scholar] [CrossRef] [Scilit]
- Zhu, X.; Hua, R. Serum essential trace elements and toxic metals in Chinese diabetic retinopathy patients. Medicine 2020, 99, e23141. [Google Scholar] [CrossRef] [Scilit]
- Li, L.; Yang, X. The essential element manganese, oxidative stress, and metabolic diseases. Oxid. Med. Cell. Longev. 2018, 2018, 7580707. [Google Scholar] [CrossRef] [Scilit]
- Thomas, M.C.; MacIsaac, R.J.; Tsalamandris, C.; Power, D.; Jerums, G. Unrecognized anemia in patients with diabetes: A cross-sectional survey. Diabetes Care 2003, 26, 1164–1169. [Google Scholar] [CrossRef] [Scilit]
- Lee, M.K.; Han, K.D.; Lee, J.H.; Sohn, S.Y.; Jeong, J.S.; Kim, M.K.; Baek, K.H.; Song, K.H.; Kwon, H.S. High hemoglobin levels are associated with decreased risk of diabetic retinopathy in Korean type 2 diabetes. Sci. Rep. 2018, 8, 5538. [Google Scholar] [CrossRef] [Scilit] [PubMed]
- Chen, Y.J.; Chen, J.T.; Tai, M.C.; Liang, C.M.; Chen, Y.Y.; Chen, L.W. Serum Iron and risk of diabetic retinopathy. Nutrients 2020, 12, 2297. [Google Scholar] [CrossRef] [Scilit] [PubMed]
- Halliwell, B.; Gutteridge, J.M. Oxygen toxicity, oxygen radicals, transition metals and disease. Biochem. J. 1984, 219, 1–14. [Google Scholar] [CrossRef] [Scilit]
- Cussimanio, B.L.; Booth, A.A.; Todd, P.; Hudson, B.G.; Khalifah, R.G. Susceptibility of heme proteins to damage by glucose during non-enzymatic glycation. Biophys. Chem. 2003, 105, 743–755. [Google Scholar] [CrossRef] [Scilit]
- Jiang, R.; Manson, J.E.; Meigs, J.B.; Ma, J.; Rifai, N.; Hu, F.B. Body iron stores in relation to risk of type 2 diabetes in women. JAMA 2004, 291, 711–717. [Google Scholar] [CrossRef] [Scilit] [PubMed]
- Kamińska, A.; Romano, G.L.; Rejdak, R.; Zweifel, S.; Fiedorowicz, M.; Rejdak, M.; Bajka, A.; Amato, R.; Bucolo, C.; Avitabile, T.; et al. Influence of trace elements on neurodegenerative diseases of the eye. Int. J. Mol. Sci. 2021, 22, 4323. [Google Scholar] [CrossRef] [Scilit]
- Bede-Ojimadu, O.; Orish, C.N.; Bocca, B.; Ruggieri, F.; Frazzoli, C.; Orisakwe, O.E. Trace element exposure and risk in age-related eye diseases. J. Environ. Sci. Health C 2021, 39, 293–339. [Google Scholar] [CrossRef] [Scilit]
- Kurt, H.P.Ö.; Özen, D.S.K.; Genç, İ.; Erdem, M.; Demirdağ, M.D. Comparison of selenium levels between diabetic patients with and without retinopathy. J. Surg. Med. 2023, 7, 58–62. [Google Scholar] [CrossRef] [Scilit]
- Bokhary, K.; Aljaser, F.; Abudawood, M.; Tabassum, H.; Bakhsh, A.; Alhammad, S.; Aleyadhi, R.; Almajed, F.; Alsubki, R. Role of oxidative stress and severity of diabetic retinopathy in type 1 and type 2 diabetes. Ophthalmic Res. 2021, 64, 613–621. [Google Scholar] [CrossRef] [Scilit]

Disclaimer/Publisher’s Note: The statements, opinions and data contained in all publications are solely those of the individual author(s) and contributor(s) and not of MDPI and/or the editor(s). MDPI and/or the editor(s) disclaim responsibility for any injury to people or property resulting from any ideas, methods, instructions or products referred to in the content. |
© 2026 by the authors. Licensee MDPI, Basel, Switzerland. This article is an open access article distributed under the terms and conditions of the Creative Commons Attribution (CC BY) license.