


Abstract
Background: We aimed to study the association between accelerometer-measured physical activity and metabolic markers of diabetes in a nationwide representative sample of U.S. adults. Methods: This cross-sectional analysis included 1259 adults aged ≥18 years from the 2003–2004 National Health and Nutrition Examination Survey (NHANES), the only cycle incorporating objective accelerometry. Physical activity was assessed using hip-worn accelerometers, with moderate-to-vigorous physical activity (MVPA) and sedentary time derived from validated count thresholds. Metabolic outcomes included fasting glucose, fasting insulin, glycated hemoglobin (HbA1c), and insulin resistance estimated by the Homeostatic Model Assessment (HOMA-IR). Survey-weighted linear regression models accounting for the complex sampling design were applied, with sequential adjustment for demographic, socioeconomic, anthropometric, and behavioral covariates. Sensitivity analyses tested alternative MVPA thresholds and wear-time criteria. Results: In unadjusted models, higher MVPA was inversely linked with fasting glucose and insulin concentrations; but, these associations were attenuated after full multivariable adjustment. In contrast, MVPA established a constant inverse association with insulin resistance. Higher MVPA was connected with lower HOMA-IR values, and this relationship remained statistically significant in fully adjusted models and across all sensitivity analyses (all p < 0.001). Associations between sedentary time and metabolic markers were non-sustainable after multivariable adjustment. No significant effect modification by sex was detected. Conclusions: Objectively measured moderate-to-vigorous physical activity is independently linked with lower insulin resistance in U.S. adults. These results emphasize the value of accelerometer-based assessments for identifying early metabolic risk and reinforce physical activity promotion as a key strategy for improving insulin sensitivity.
1. Introduction
Type 2 diabetes mellitus, prediabetes, and insulin resistance represent a growing global public health challenge [1]. According to the International Diabetes Federation, 537 million adults were living with diabetes in 2021, and this number is projected to increase to 643 million by 2030 and 783 million by 2045 [1]. Because insulin resistance is a fundamental pathophysiological abnormality that precedes overt hyperglycemia, the identification of early metabolic dysfunction is critical for prevention and risk stratification [2,3]. In this context, the homeostatic model assessment of insulin resistance (HOMA-IR), which integrates fasting glucose and fasting insulin, is particularly informative because it captures early impairment in insulin sensitivity before the development of frank diabetes [2,3].
Physical activity is one of the most important modifiable determinants of metabolic health. Robust evidence indicates that regular physical activity improves glucose handling, enhances insulin sensitivity, and attenuates inflammatory processes involved in metabolic dysfunction [4,5]. At the cellular level, exercise promotes glucose transporter type 4 translocation in skeletal muscle, thereby facilitating insulin-independent glucose uptake [6]. By contrast, sedentary behavior has been associated with adverse metabolic profiles and impaired insulin sensitivity, even among individuals who achieve recommended levels of physical activity [7]. These observations underscore the need to evaluate both moderate-to-vigorous physical activity (MVPA) and sedentary time when examining early metabolic risk.
A major limitation of the existing literature is that physical activity has often been assessed using self-report instruments, which are inherently vulnerable to recall bias and social desirability bias [8]. Such limitations can lead to overestimation of MVPA, underestimation of sedentary time, and substantial exposure misclassification, thereby obscuring true associations with glycemic outcomes [8,9]. This concern is particularly relevant in NHANES-based research, where questionnaire-derived activity measures have sometimes failed to detect associations with insulin resistance, likely because of non-differential measurement error [10]. As a result, studies relying on subjective exposure assessment may underestimate the metabolic relevance of habitual physical activity.
With this in mind, accelerometry offers a more objective and biologically informative approach by quantifying movement behavior across intensity domains with far less measurement error than self-reporting [11]. The 2003–2004 NHANES cycle provides a unique opportunity in this regard, as it includes accelerometer-derived physical activity data from a nationally representative sample of U.S. adults [12]. Importantly, this dataset also permits analyses that incorporate the complex multistage sampling structure of NHANES, which is essential for producing valid nationally representative estimates and appropriate variance inference.
Despite this methodological advantage, the literature remains inconclusive. Prior studies using accelerometer-derived activity metrics have reported inconsistent associations between MVPA, sedentary time, and glycemic markers, with some identifying inverse relationships with insulin resistance or fasting glucose and others reporting attenuated or null associations after multivariable adjustment [12,13]. Moreover, relatively few analyses have prioritized HOMA-IR as the principal outcome, despite its biological relevance as an early marker of metabolic dysfunction [10,11]. Equally important, not all prior studies have fully accounted for the NHANES design through the appropriate use of sample weights, strata, and primary sampling units, raising concerns about the validity and generalizability of reported estimates. Consequently, whether objectively measured MVPA is independently associated with insulin resistance in U.S. adults remains insufficiently resolved.
Accordingly, the primary objective of this study was to examine the association between accelerometer-measured MVPA and insulin resistance, as assessed by HOMA-IR, in a nationally representative sample of U.S. adults. We also evaluated associations with other metabolic markers and explored possible effect modification by sex, given established differences in adiposity, hormonal regulation, and insulin sensitivity between men and women [14]. We hypothesized that higher MVPA would be independently associated with lower insulin resistance, whereas greater sedentary time would be associated with a less favorable metabolic profile, even after adjustment for relevant confounders. Clarifying these relationships is important not only for strengthening the epidemiologic evidence base, but also for improving early identification of metabolic risk and informing prevention strategies grounded in objective physical activity assessment.
2. Materials and Methods
2.1. Study Design and Population
This study followed the STROBE guidelines for cross-sectional studies and was designed as a retrospective cross-sectional secondary analysis of data from the National Health and Nutrition Examination Survey (NHANES), conducted by the National Center for Health Statistics (NCHS) of the U.S. Centers for Disease Control and Prevention (CDC). Rather than collecting new data prospectively, we analyzed previously collected NHANES data from the 2003–2004 survey cycle. NHANES is a nationally representative program designed to assess the health and nutritional status of adults and children in the United States through household interviews, physical examinations, and laboratory assessments, using a complex, multistage probability sampling design that permits valid national estimates.
Data were drawn from the 2003–2004 cycles, the only cycles to include objective physical activity data via accelerometry; no other NHANES cycle provides these accelerometer data for this analysis. These cycles are part of the continuous NHANES program that started in 1999, with around 5000 participants per year from diverse geographic locations across the U.S. Only participants with complete data on exposures, outcomes, and covariates were included.
2.2. Sample Selection and Data Collection
Participants were nominated via a multistage, stratified sampling design, with intentional oversampling of key demographic groups (e.g., non-Hispanic Black, Mexican American, adolescents, older adults) to guarantee adequate statistical power for subgroup analysis. Data collection occurred in two stages:
- Home interviews, including demographics, health status, and medication use;
- Mobile Examination Center (MEC) visits, where trained technicians performed physical examinations, body measurements, laboratory specimen collection, and accelerometry distribution.
As this study was a secondary analysis of NHANES data, no a priori sample size calculation was performed by the investigators. Instead, the analytic sample was determined by the number of participants in the 2003–2004 NHANES cycle who met the predefined eligibility criteria and had complete data on the exposure, outcomes, covariates, and survey design variables required for weighted analyses. Because NHANES uses a complex, multistage probability sampling design, the adequacy of the analytic sample is not based solely on the unweighted number of participants, but also on the proper incorporation of sample weights, strata, and primary sampling units to obtain nationally representative estimates and valid variance estimation. Accordingly, all eligible participants from the only NHANES cycle with accelerometer data were considered for inclusion in the present analysis.
2.3. Accelerometry Subsample
A subset of eligible participants aged ≥18 years were told to wear an ActiGraph AM-7164 uniaxial accelerometer (ActiGraph, Pensacola, FL, USA) on the right hip for 7 consecutive days during waking hours. The protocol required at least 10 h of valid wear time per day for 4 or more days to be included in analytical datasets. Device initialization, placement, and return procedures followed strict protocols defined in the NHANES Physical Activity Monitor component manual.
2.4. Inclusion and Exclusion Criteria
A total of 10,122 participants from the 2003–2004 NHANES cycle were initially considered, including 4970 males and 5152 females. Adults were eligible for inclusion in the present analysis if they were aged 18 years or older, had valid accelerometer data with sufficient wear time, available laboratory data for HbA1c, fasting glucose, fasting insulin, and HOMA-IR, were non-pregnant, and had complete information on key covariates, including body mass index, sex, race/ethnicity, and smoking status. Participants were excluded if they had implausible accelerometry data or insufficient wear time. Participants were also excluded if survey weights, strata, or primary sampling unit variables were unavailable, because these design elements are required to account properly for the complex NHANES sampling structure, obtain nationally representative estimates, and ensure valid variance estimation. After applying these criteria, the final analytic sample comprised 1259 adults. Importantly, the age criterion of ≥18 years was used only to define eligibility and should not be interpreted as a description of the included population. Detailed sample characteristics, including age and sex distribution, are presented in Table 1; the weighted mean age of the included participants was 41.8 years (SE = 0.65).
Table 1.
Descriptive characteristics of the study population.
2.5. Ethical Considerations
All NHANES protocols were accepted by the NCHS Research Ethics Review Board (ERB). All participants provided written informed consent prior to participation. NHANES data are publicly available and de-identified, and so, secondary analyses using these data are considered exempt from institutional review board (IRB) review.
2.6. Accelerometry Data
Physical activity was objectively logged using the ActiGraph AM-7164, a uniaxial accelerometer. This device is small, the size of a mobile pager, lightweight, and worn on the right hip attached via an elastic belt. It records movement in one plane and stores data in memory for future processing.
Participants aged ≥18 years were told to wear the monitor during all waking hours for 7 consecutive days, removing it only for water-based activities such as bathing or swimming. They were advised on proper placement and provided with an informational flyer written in English or Spanish, and the home office followed up to remind them about usage and device return.
A valid wear day was typically defined based on published NHANES accelerometry studies; as a day with ≥10 h of monitor wear time. Non-wear periods were often operationalized as ≥60 min of consecutive zero counts, allowing for minimal interruptions (1–2 min of counts).
From the raw accelerometer data, the following metrics were derived:
- Total Activity Counts per day: Summed counts over valid wear time.
- Moderate-to-Vigorous Physical Activity (MVPA): Defined via the established count thresholds ≥ 2020 counts per minute.
- Sedentary Time: Defined as periods ≤ 100 counts per minute.
These thresholds were based on calibration studies in the NHANES cohort and correspond to validated activity intensity levels.
Data cleaning included:
- Excluding days with <10 h of valid wear time.
- Removing sequences of non-wear time defined as 60+ min of zero counts with up to 2 min of interruptions.
- Subjects with <4 valid days were excluded from final analysis, per NHANES analytic recommendations.
Monitors were initialized and downloaded using the Reader Interface Unit described in the procedure’s manual. Calibration and battery checks were conducted before deployment, and units were cleaned upon return [15].
2.7. Metabolic Markers
At this point, we studied metabolic biomarkers related to glucose metabolism and insulin resistance, recorded during the NHANES 2003–2004 cycles following standard procedures [15]. The selected biomarkers included fasting plasma glucose (FPG), fasting insulin and glycated hemoglobin (HbA1c) values when available. These laboratory variables are vital for the calculation of glycemic status and insulin sensitivity in epidemiological research.
Biological specimens were collected in the Mobile Examination Centers (MECs) according to standardized NHANES phlebotomy and biospecimen-handling protocols. For the fasting laboratory component, participants were scheduled for a morning examination and were instructed by NHANES to undergo an overnight fast of at least 8 h, typically 9 h, before blood collection. Under NHANES procedures, fasting referred primarily to abstinence from food and caloric beverages before venipuncture; blood samples were then obtained by trained phlebotomists using standardized vacutainer systems and collected in EDTA and gray-top tubes for plasma and serum separation. Samples were centrifuged and stored under controlled temperature conditions before laboratory analysis, as described in Chapter 8 of the NHANES Laboratory Procedures Manual. Although individual adherence cannot be verified beyond NHANES quality-control procedures, all fasting measures used in this study were derived from the NHANES fasting subsample [16].
Fasting plasma glucose was measured using the hexokinase enzymatic method, while fasting insulin was analyzed via radioimmunoassay (RIA). HbA1c levels were measured using high-performance liquid chromatography (HPLC) methods standardized to the DCCT protocol.
To assess insulin resistance, we considered the Homeostatic Model Assessment of Insulin Resistance (HOMA-IR) using the standard mathematical formula:
- HOMA-IR = Fasting Insulin (μU/mL) × Fasting Glucose (mg/dL)/405
This index has been extensively validated in population-based studies for estimating insulin resistance [17] and was calculated only for participants with complete fasting glucose and insulin data.
Glycemic status was classified using clinical end points defined by the American Diabetes Association [18] and Centers for Disease Control and Prevention (CDC):
Normal glucose regulation:
- Fasting glucose < 100 mg/dL.
- HbA1c < 5.7%.
Prediabetes:
- Fasting glucose 100–125 mg/dL.
- HbA1c 5.7–6.4%.
Diabetes:
- Fasting glucose ≥ 126 mg/dL.
- HbA1c ≥ 6.5%.
These thresholds allowed the identification of participants at different stages of glucose dysregulation, facilitating subgroup analyses based on metabolic risk.
All laboratory measurements experienced rigorous quality control and proficiency testing as mandated by NHANES protocols. Calibration, assay performance specifications, and inter-laboratory consistency checks were sustained throughout the Integrated Survey Information System (ISIS) and internal QA/QC programs as stated in Chapter 10 of the Laboratory Manual.
2.8. Covariates
Several covariates were involved in the analysis to account for potential confounding in the relationship between physical activity and metabolic markers. These variables were selected a priori based on previous research literature and their known relevance to glycemic outcomes.
The following demographic variables were self-reported during the household interview:
- Age (in years, continuous).
- Sex (male/female).
- Race/Ethnicity, categorized as: Non-Hispanic White, Non-Hispanic Black, Mexican American, Other Hispanic or Another race (including multiracial).
- Educational Attainment, characterized as: Less than high school, High school graduate/GED, Some college or associate degree or College graduate or above.
Demographic data were attained from the Demographics Questionnaire component of NHANES and were merged using the participant identifier (SEQN).
Body Mass Index (BMI) was calculated as mass in kilograms divided by height in meters squared (kg/m2) [19], using direct anthropometric measurements obtained in the MEC following standardized procedures.
Smoking Status was determined from self-reporting and categorized as: Current smoker, Former smoker or never smoked.
Pharmacotherapy usage was judged by using prescription medication data from the home interview. Use of antidiabetic medications (e.g., insulin, metformin) was coded to identify participants with treated diabetes and used in sensitivity analyses or model adjustments.
NHANES employs a complex, multistage probability sampling design that incorporates stratification and clustering. To acquire nationally representative estimates and valid statistical inferences, all analyses accounted for the complex survey design using the appropriate sampling weights, strata, and primary sampling units.
Explicitly, MEC examination weights (WTMEC2YR) were used for analyses not requiring fasting measurements. For analyses involving fasting glucose, fasting insulin, and HOMA-IR, fasting subsample weights were applied in accordance with NHANES analytic guidelines. Stratification (SDMVSTRA) and primary sampling units (SDMVPSU) were combined in all models.
No Winsorization was applied; influence diagnostics did not indicate excessive leverage.
All statistical analyses accounted for the complex survey design using Taylor series linearization or other survey-weighted estimation methods, as appropriate. Analyses were conducted in accordance with NHANES analytic guidelines to safeguard suitable variance estimation and population-level inference.
2.9. Bias
Given the cross-sectional design, residual confounding and reverse causation cannot be excluded. Even though models were adjusted for crucial demographic, anthropometric, and behavioral covariates, unmeasured or imperfectly measured factors may have prejudiced the observed associations.
2.10. Statistical Analysis
All analyses were conducted using data from the 2003–2004 NHANES cycle, which employs a complex, multistage probability sampling design to produce nationwide representative estimates. According to this survey design, sampling weights, strata, and primary sampling units (PSUs) were combined into all statistical models, in accordance with NHANES analytic guidelines.
Descriptive statistics were used to précis participant characteristics, accelerometer-derived physical activity variables, and metabolic biomarkers. Continuous variables were stated as survey-weighted means with 95% confidence intervals (CIs), while categorical variables were offered as weighted percentages.
Associations between accelerometer-measured physical activity, including total activity counts, MVPA, and sedentary time—and metabolic markers (fasting glucose, fasting insulin, HbA1c, and HOMA-IR) were studied using survey-weighted linear regression models. Survey-weighted logistic regression models were applied for categorical outcomes, including prediabetes and diabetes status defined along with ADA/CDC criteria.
Regression models were constructed incrementally to estimate the influence of potential confounders:
- Model 1: Unadjusted.
- Model 2: Adjusted for demographic variables (e.g., age, sex, and race/ethnicity).
- Model 3 (fully adjusted): Demographic variables plus education, BMI, smoking status, and antidiabetic medication use.
Stratified analyses were conducted to assess potential effect modification by sex (male vs. female). Interaction terms between physical activity variables and stratifying factors were included in fully adjusted models. Where interaction terms attained a significance threshold of p < 0.10, stratified results were presented.
HOMA-IR was prespecified as the primary outcome as it integrates fasting glucose and insulin concentrations, providing a robust and widely accepted marker of insulin resistance that is closely linked to physical activity behaviors [17]. Fasting glucose and fasting insulin were investigated as secondary outcomes.
Sensitivity analyses were conducted to evaluate the robustness of the primary findings.
These included:
- (i)
- Restriction to participants with at least five valid accelerometer wear days (defined as ≥10 h/day);
- (ii)
- Reanalysis via alternative thresholds for defining MVPA, including a lower cut-point (≥760 counts per minute).
For each participant, daily MVPA minutes were averaged across valid wear days.
All sensitivity analyses employ survey-weighted regression models accounting for stratification, clustering, and fasting subsample weights, as appropriate. Consistency in the direction and magnitude of associations across sensitivity analyses was interpreted as evidence of result robustness.
All statistical analyses were executed using the R software version 4.3.2, utilizing the survey and server packages for complex survey analysis. Data management and visualization were conducted using the tidy verse suite of packages and ggplot2. No Winsorization was enforced, and influence diagnostics did not indicate excessive leverage. A two-sided p < 0.05 was deemed statistically significant unless otherwise specified.
Analyses were conducted using complete-case data for all variables included in each model.
3. Results
3.1. Sample Characteristics
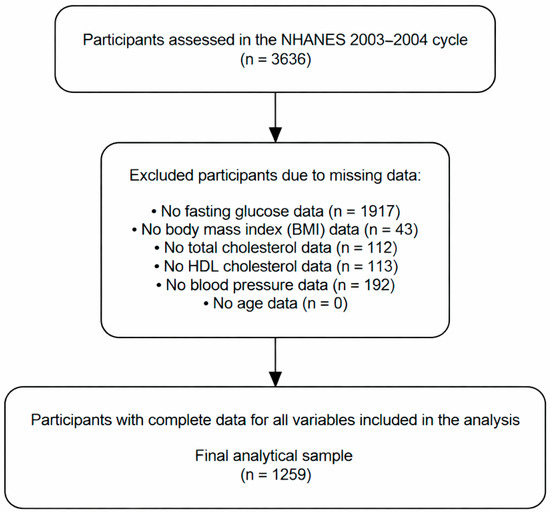
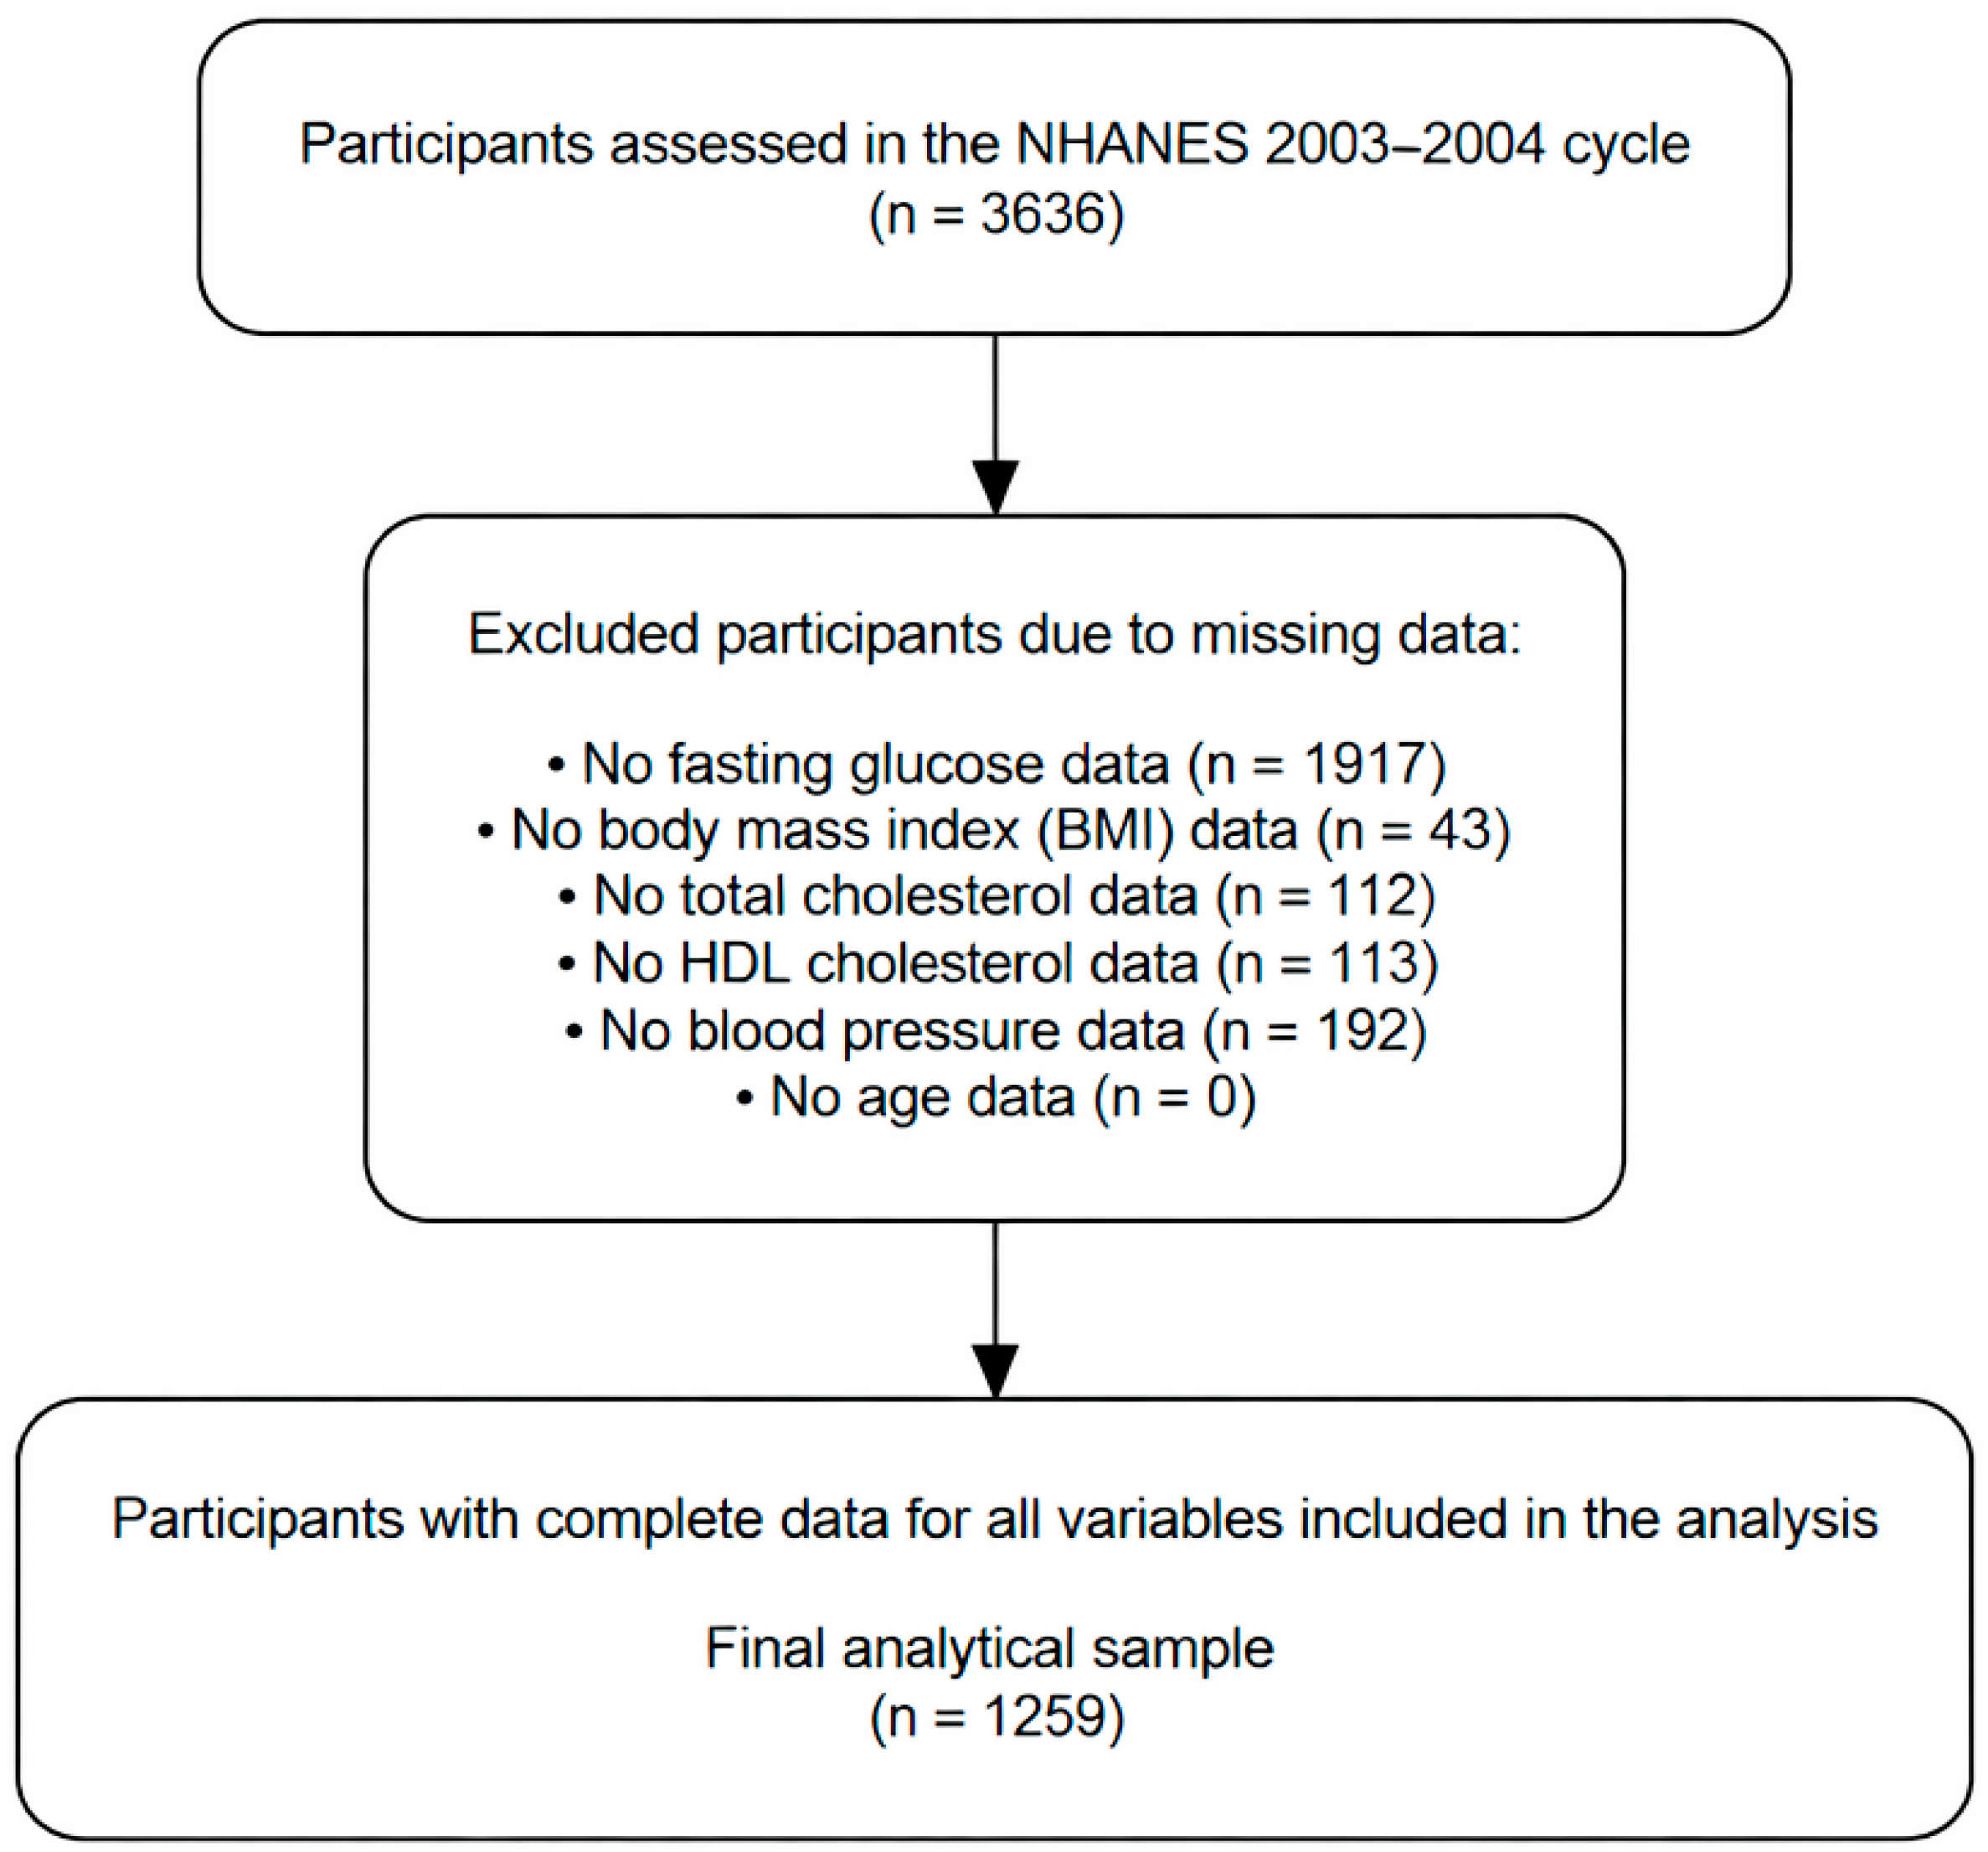
Figure 1 illustrates the participant selection process for the NHANES 2003–2004 cycle. A total of 3636 individuals were initially assessed. Participants were sequentially omitted as a result of missing data on important variables necessary for the analyses, including fasting glucose (n = 1917), body mass index (n = 43), total cholesterol (n = 112), HDL cholesterol (n = 113), blood pressure measurements (n = 192), and age (n = 0). These exclusions were applied using a complete-case approach to preserve a consistently defined analytic sample and ensure a fully characterized cardiometabolic profile across the descriptive and inferential analyses, thereby avoiding variation in sample denominators between Table 1 and the main regression models. After applying these exclusion criteria, the final analytical sample consisted of 1259 participants with complete data across all demographic variables, accelerometry-derived physical activity metrics, and metabolic biomarkers included in the study. This final sample was enforced for all subsequent descriptive and inferential analyses presented in the Sample Characteristics table.
Figure 1.
Flowchart of participant selection and derivation of the final analytical sample from the NHANES cycle.
Table 1 presents the weighted descriptive characteristics of the final analytical sample from the NHANES 2003–2004 cycle. The mean age of participants was 41.8 years (SE = 0.65), with mean systolic and diastolic blood pressure values of 120 mmHg (SE = 0.57) and 69.2 mmHg (SE = 0.40), respectively. Metabolic biomarkers indicated a mean fasting glucose of 99 mg/dL (SE = 0.77), insulin concentration of 64.8 pmol/L (SE = 2.9), and a mean HOMA-IR of 16.7 (SE = 0.77). Participants exhibited a mean body mass index of 27.7 kg/m2 (SE = 0.16). Lipid profile measures showed mean total cholesterol of 194 mg/dL (SE = 1.04), LDL cholesterol of 113 mg/dL (SE = 0.91), HDL cholesterol of 53.8 mg/dL (SE = 0.49), and triglycerides of 140 mg/dL (SE = 3.61). Accelerometry-derived physical activity data indicated a mean total activity count of 438,874 counts/day, a mean of 34.3 min/day of moderate-to-vigorous physical activity, and 503 min/day spent in sedentary behavior. All estimates account for the complex NHANES sampling design and are reported with matching standard errors and 95% confidence intervals.
3.2. Regression Results
Table 2 highlights the associations between accelerometry-derived MVPA, sedentary time, and metabolic markers in the NHANES 2003–2004 cycle. In unadjusted models, higher MVPA was inversely associated with fasting glucose (β = −0.003; 95% CI: −0.006 to −0.000; p = 0.048) and insulin concentrations (β = −0.002; 95% CI: −0.003 to −0.001; p = 0.003). These relationships were reduced after adjustment for age, sex, and race/ethnicity, and were no longer statistically significant after further adjustment for education and body mass index. In contrast, sedentary time was positively associated with fasting glucose and insulin levels in unadjusted models and in models adjusted for age, sex, and race/ethnicity. Yet, these associations were also attenuated and lost statistical significance in fully adjusted models. All regression analyses accounted for the complex NHANES sampling design, and results are presented as regression coefficients with corresponding 95% confidence intervals.
Table 2.
Associations between MVPA, sedentary time and metabolic markers (NHANES 2003–2004).
Table 3 illustrates the results of the survey-weighted regression model examining the interaction between MVPA and sex in relation to HbA1c levels in the NHANES 2003–2004 cycle. MVPA was inversely associated with HbA1c (β = −0.00005; SE = 0.00002), while female sex was associated with lower HbA1c levels compared with males (β = −0.117; SE = 0.022). The interaction term between MVPA and female sex was not statistically significant, indicating no evidence of effect modification by sex on the association between MVPA and HbA1c. Age and body mass index were positively associated with HbA1c levels. The model was adjusted for age, race/ethnicity, education, and body mass index, and all analyses accounted for the complex NHANES sampling design.
Table 3.
Interaction between MVPA and sex on HbA1c levels (NHANES 2003–2004).
3.3. Sensitivity Analyses
Table 4 presents the sensitivity analysis examining the association between MVPA and HbA1c levels stratified by sex in the NHANES 2003–2004 cycle. After stratification, MVPA was not significantly associated with HbA1c among either males (β = −0.00053; 95% CI: −0.00169 to 0.00006; p = 0.190) or females (β = −0.00015; 95% CI: −0.00139 to 0.00011; p = 0.645). Even though the direction of the association was inverse in both strata, confidence intervals included the null value, indicating a lack of statistical significance. These results are consistent with the primary interaction analysis and support the robustness of the main results. All models were adjusted for age, race/ethnicity, education, and body mass index, and accounted for the complex NHANES sampling design.
Table 4.
Association between MVPA and HbA1c stratified by sex (NHANES 2003–2004).
Table 5 displays the results of the sensitivity analyses evaluating the association between MVPA and insulin resistance, assessed by HOMA-IR, in the NHANES 2003–2004 cycle. In the main analysis, higher MVPA (≥2020 counts per minute) defined by at least four valid accelerometer days was inversely linked with HOMA-IR (β = −0.00174; 95% CI: −0.00239 to −0.00109; p < 0.001). This association remained statistically significant when a more stringent accelerometer wear-time criterion was applied (≥5 valid days; β = −0.00157; 95% CI: −0.00216 to −0.00098; p < 0.001). Similarly, when MVPA was defined via a lower intensity threshold (≥760 counts per minute) with at least four valid days, the inverse association persisted (β = −0.00203; 95% CI: −0.00302 to −0.00105; p < 0.001). Jointly, these sensitivity analyses signify that the observed association between MVPA and HOMA-IR was robust to alternative accelerometry thresholds and wear-time definitions. All models accounted for the complex NHANES sampling design.
Table 5.
Association Between MVPA and HOMA-IR: Main and Sensitivity Analyses.
4. Discussion
In this nationwide representative study of U.S. adults, higher levels of objectively measured MVPA were reliably connected with lower insulin resistance, as assessed by the HOMA-IR. In contrast, the inverse associations observed between MVPA and isolated glycemic markers, including fasting glucose and fasting insulin, were reduced after full adjustment for sociodemographic, anthropometric, and lifestyle factors. Notably, the inverse relationship between MVPA and HOMA-IR remained stable across multiple sensitivity analyses, including alternative accelerometer wear-time definitions and MVPA intensity thresholds. Together, these results suggest that insulin resistance represents a more sensitive metabolic correlation of habitual physical activity than individual fasting glycemic measures in population-based analyses.
The stronger and more consistent association observed between MVPA and HOMA-IR compared with fasting glucose or insulin alone is biologically plausible and along with prior mechanistic and epidemiological evidence. HOMA-IR integrates both fasting insulin and glucose concentrations and is widely regarded as a robust indicator of early impairments in insulin sensitivity that precede overt dysglycemia [3,17]. In metabolically heterogeneous populations, fasting glucose and HbA1c are often upheld within relatively narrow physiological ranges through compensatory hyperinsulinemia, thus limiting their sensitivity to behavioral exposures such as physical activity [18,19].
Regular engagement in MVPA improves insulin sensitivity primarily through adaptations in skeletal muscle, the principal site of insulin-mediated glucose disposal. Exercise improves insulin signaling via increased glucose transporter type 4 translocation, improved insulin receptor substrate activity, and activation of downstream pathways such as PI3K–Akt, resulting in greater glucose uptake independent of insulin concentrations [6,17]. In parallel, exercise-induced mitochondrial biogenesis and improved oxidative capacity reduce intramyocellular lipid accumulation and chronic low-grade inflammation, both of which are important contributors to insulin resistance [20,21].
From a clinical and public health perspective, these results are extremely relevant. Improvements in insulin sensitivity may occur even without substantial changes in fasting glucose or HbA1c, mainly in cross-sectional settings or early disease stages. Hence, insulin resistance may serve as a more responsive and clinically meaningful target for evaluating the metabolic benefits of physical activity in the general population [22].
The attenuation of the associations between MVPA and fasting glucose or insulin after adjustment for BMI and lifestyle covariates should not be interpreted as evidence of a lack of biological relevance. Rather, this pattern may reflect, at least in part, the role of adiposity in the pathway linking physical activity to insulin sensitivity. Physical activity may influence insulin resistance both directly, through molecular and cellular mechanisms, and indirectly, through changes in body fatness, particularly central adiposity, which is more closely related to glucose dysregulation and metabolic risk than body size alone [23].
However, BMI is an imperfect anthropometric marker in this context because it does not distinguish between fat mass and lean mass, nor does it capture fat distribution. Therefore, although BMI may operate as both a confounder and a partial mediator in physical activity–metabolic relationships [24,25], its use may incompletely represent the adiposity-related mechanisms underlying impaired glucose metabolism. Measures such as waist circumference or waist-to-height ratio may provide more informative indicators of central adiposity and cardiometabolic risk when examining outcomes related to insulin resistance and glycemic control. Adjustment for BMI may therefore yield conservative estimates of the total association between MVPA and metabolic outcomes, underscoring the need for cautious interpretation of fully adjusted models in observational studies [25,26].
In addition, the cross-sectional design of the current study precludes causal inference. Reverse causation cannot be excluded, as individuals with lower insulin resistance may be more likely to engage in higher levels of MVPA. Still, the consistency of the association between MVPA and HOMA-IR across sensitivity analyses, combined with strong biological plausibility and concordance with experimental and longitudinal evidence, supports the interpretation that habitual MVPA is meticulously linked to more favorable insulin sensitivity profiles at the population level.
In this study, associations between total sedentary time and metabolic markers were not sustained after complete multivariable adjustment. This attenuation possibly reflects the complex and context-dependent nature of sedentary behavior, over and above its strong correlation with adiposity, overall activity volume, and lifestyle factors. Once these interrelated variables are accounted for, total sedentary time alone may not independently capture the metabolic risk attributable to physical inactivity in a heterogeneous population sample.
Importantly, emerging evidence suggests that total sedentary time may be a less informative metric than the composition and patterning of daily movement behaviors. Compositional and isotemporal substitution analyses indicate that the metabolic impact of sedentary behavior depends on which activity intensity replaces sitting time, with substitution by MVPA conferring substantially greater metabolic benefit than replacement with light-intensity activity [11,27]. Thus, models focusing exclusively on sedentary duration may overlook the broader behavioral context in which sedentary time occurs.
Furthermore, experimental and observational studies indicate that the deleterious metabolic effects of sedentary behavior may be driven chiefly by prolonged, uninterrupted sitting bouts rather than total accumulated sedentary time [28]. Extended sitting has been shown to impair skeletal muscle glucose uptake and lipoprotein lipase activity, thereby promoting insulin resistance, mainly among individuals with an elevated cardiometabolic risk [14]. In relatively young or metabolically healthier populations, such as the present NHANES sample, these associations may be attenuated or masked after adjustment for adiposity and MVPA, contributing to the null findings observed in fully adjusted models.
We found no evidence of an important interaction between MVPA and sex in relation to insulin resistance or glycemic markers. This result suggests that the linkage between objectively measured MVPA and insulin sensitivity is generally similar in men and women at the population level. One plausible explanation is that the fundamental biological mechanisms through which physical activity improves insulin sensitivity, such as enhanced skeletal muscle glucose disposal, improved mitochondrial function, and reduced inflammation, are largely shared across sexes [23,29].
Alternatively, the nonappearance of sex-specific interaction may reflect limited statistical power to detect modest effect modification, mostly in cross-sectional analyses where between-group differences are subtle and confounded by variability in hormonal status, adiposity distribution, and behavioral patterns [30,31]. Additionally, accelerometry captures movement intensity and duration but does not fully represent sex-related differences in exercise modality, fitness level, or physiological response to a given absolute activity intensity [32].
Our results align with numerous NHANES-based and accelerometry studies reporting comparable associations between physical activity and metabolic outcomes in men and women [12,13]. Yet previous evidence on sex differences remains mixed, with some studies signifying stronger associations in men or women depending on outcome definition, age group, and analytic approach [14]. The lack of interaction observed in the present analysis therefore supports a cautious interpretation that, at the population level, MVPA confers metabolic benefits across sexes, while conceding that sex-specific association may be more apparent in longitudinal or intervention studies designed to explicitly test these differences.
The present outcomes are generally consistent with previous studies using accelerometer-derived physical activity data, predominantly those based on NHANES [12,33,34,35,36,37,38,39,40], while also helping to reconcile inconsistencies reported in earlier analyses.
While our findings are broadly agreeable with earlier accelerometer-based investigations, several important operational and conceptual differences between the present study and previous NHANES reports [12,33,34,35,36,37,38,39,40,41] help to contextualize both similarities and discrepancies. In particular, the comparator studies differed greatly from our analysis regarding study population, analytical framework, physical activity metrics, and primary metabolic outcomes, which likely influenced the observed associations.
Our results are broadly consistent with prior NHANES analyses using accelerometer-derived physical activity, particularly the work by Boyer et al. [12], who examined the association between objectively measured activity and insulin resistance. In this study, higher MVPA was inversely associated with HOMA-IR (β = −0.00174), and this relationship remained robust across sensitivity analyses using alternative MVPA thresholds and stricter accelerometer wear-time criteria. Also, Boyer et al. [12] reported lower insulin resistance with greater physical activity; yet, important methodological differences may explain variations in effect magnitude and model behavior. Notably, Boyer et al. [12] emphasized bouted MVPA (≥10 min bouts) and total activity counts per day, whereas the present analysis focused on total accumulated MVPA irrespective of bout duration, a distinction that has been shown to influence the strength and persistence of associations with metabolic outcomes [32]. Additionally, Boyer et al. [12] applied log-transformation to insulin resistance indices and modeled activity metrics jointly, which attenuated the independent contribution of MVPA when total activity volume was included. Differences in covariate specification may also contribute to discrepancies, as Boyer et al. [12] adjusted for an extensive set of demographic and behavioral factors, including diet-related variables, whereas our fully adjusted models prioritized cardiometabolic confounders commonly available across NHANES cycles. Despite these methodological contrasts, both studies converge on the conclusion that objectively measured physical activity is inversely related to insulin resistance at the population level, while emphasizing that analytic decisions about MVPA definition, scaling of outcomes, and covariate structure substantially influence the observed effect estimates.
Our analysis dependably incorporated MEC-specific weights, strata, and primary sampling units, minimizing bias and enhancing the validity of population-level estimates. This methodological rigor may partially explain why the association between MVPA and insulin resistance remained robust in our study, whereas associations with isolated glycemic markers or sedentary time were attenuated after full adjustment in both our work and prior reports.
Jointly, these differences underscore the novel contribution of the present study. By combining objective accelerometer-derived physical activity data with HOMA-IR as a primary outcome, applying survey-weighted modeling, and conducting extensive sensitivity analyses, our work clarifies inconsistencies in the scientific research literature and emphasizes insulin resistance as a particularly responsive metabolic correlation of habitual MVPA. These outcomes improve existing evidence by demonstrating that the metabolic benefits of physical activity may be more readily detected at the level of insulin sensitivity than through traditional fasting glycemic markers, especially in population-based analyses.
Among studies that employed accelerometry, mixed results have been stated regarding associations with glycemic markers. Some analyses observed significant inverse relationships between MVPA and insulin resistance or fasting glucose, whereas others reported null findings after multivariable adjustment [12,13]. Differences in accelerometer processing decisions, MVPA thresholds, covariate selection, and outcome prioritization are likely to contribute to this heterogeneity.
Notably, the methodological rigor of the current study, including the application of appropriate survey weights, explicit accounting for stratification and clustering, and multiple sensitivity analyses, may explain discrepancies with previous reports that did not fully adhere to NHANES analytic guidelines. Failure to include survey design variables has been revealed to yield biased variance estimates and, in some cases, misleading inferences [27].
A key novel contribution of this study is the prioritization of HOMA-IR as the primary outcome. By demonstrating a robust association between MVPA and HOMA-IR across multiple sensitivity analyses, the present findings extend the research literature by highlighting insulin resistance as a particularly responsive metabolic correlate of objectively measured physical activity.
At the same time, our findings should not be interpreted as implying that only MVPA is metabolically relevant. Emerging evidence suggests that lower-intensity movement may also confer meaningful cardiometabolic benefit. In a systematic review of objectively measured light-intensity physical activity (LPA), Amagasa et al. [42] reported favorable associations of LPA, independent of MVPA, with all-cause mortality and several cardiometabolic risk factors, including waist circumference, triglycerides, insulin, and metabolic syndrome. Similarly, Healy et al. [43] found, in overweight/obese adults with type 2 diabetes, that greater light-intensity activity was associated with lower fasting plasma glucose, waist circumference, and BMI, whereas MVPA was not significantly associated with the examined biomarkers. Taken together with the present findings, these observations suggest that MVPA may show the most consistent association with insulin resistance in population-based analyses, while lower-intensity activity and the broader accumulation of daily movement may also contribute meaningfully to metabolic health. Therefore, the promotion of MVPA remains important, but it should be framed within a broader behavioral context in which increasing overall movement and replacing sedentary time with feasible activity of any intensity may also provide benefit.
This study has several notable strengths. First, it is founded on a nationwide representative sample of U.S. adults, allowing for population-level inference and enhancing the generalizability of the findings. Second, physical activity was judged via objective accelerometer-based measures, minimizing recall bias and exposure misclassification commonly associated with self-reported questionnaires. Third, the analysis rigorously accounted for the complex NHANES design, including the use of appropriate sample weights, strata, and primary sampling units, thereby ensuring valid variance estimation and unbiased effect estimates. Fourth, multiple sensitivity analyses, varying accelerometer wear-time criteria and MVPA intensity thresholds, were performed, demonstrating the robustness and internal consistency of the association between MVPA and insulin resistance. Jointly, these methodological strengths enhance confidence in the validity and reproducibility of the findings.
Then again, numerous limitations should be acknowledged. The cross-sectional design precludes causal inference, and reverse causation cannot be ruled out, as individuals with better insulin sensitivity may be more likely to engage in higher levels of physical activity. Longitudinal and intervention studies are required to establish temporal and causal relationships. Physical activity was measured using a uniaxial accelerometer, which, although widely validated, has restricted ability to detect posture, upper-body movement, and certain non-ambulatory activities [32]. Consequently, some forms of physical activity may have been underestimated. Residual confounding is also possible, mainly from unmeasured or imperfectly measured factors such as dietary intake, cardiorespiratory fitness, sleep quality, and genetic predisposition. The use of the 2003–2004 NHANES cycle should also be acknowledged as a limitation, as these data are now more than two decades old and may not fully reflect current diabetes treatment patterns, patient education, or public awareness regarding the role of physical activity in glycemic control. However, this cycle was selected for a methodological reason: it was the only NHANES cycle that provided objective accelerometer-based physical activity data, making its use necessary for the present analysis. Moreover, NHANES employs a complex, multistage, stratified probability sampling design, and our analyses incorporated the appropriate sample weights, strata, and primary sampling units, ensuring valid nationally representative estimates for that survey period. Thus, although the findings should be interpreted within the historical context of 2003–2004, the dataset remains a unique and valuable resource for examining the association between objectively measured physical activity and insulin resistance in U.S. adults. Furthermore, accelerometry reflects physical activity behavior over a relatively short monitoring period and may not fully capture long-term habitual activity patterns [32], which are more relevant to chronic metabolic adaptations. In addition, pharmacotherapy use was identified from prescription medication data obtained during the home interview, which may be subject to reporting error, incomplete ascertainment, or misclassification. Although antidiabetic medication use was incorporated into sensitivity analyses and adjusted models, these data did not capture treatment adherence, dosage, duration, treatment changes over time, or the metabolic effects of different drug classes. Therefore, residual confounding related to pharmacologic management cannot be excluded, and medication use should be interpreted as a pragmatic covariate rather than a fully characterized therapeutic exposure.
The current results have significant implications for public health medicine and future research investigations. Our data support the promotion of MVPA as an important strategy for improving metabolic health beyond weight control alone. The robust association between MVPA and insulin resistance underscores the importance of targeting early metabolic dysfunction, even before overt hyperglycemia develops.
In addition to its metabolic implications, our findings may also be interpreted within a broader rehabilitation framework, particularly in programs designed to improve long-term cardiometabolic function through structured exercise and behavioral support. Contemporary cardiac rehabilitation models increasingly recognize that the benefits of exercise are shaped not only by training dose and intensity, but also by affect regulation, emotional engagement, and the patient’s capacity to sustain health-promoting behaviors over time [44]. In this context, interventions that improve the affective experience of exercise may have practical relevance, as more favorable emotional responses during rehabilitation could support adherence, autonomic recovery, and overall cardiovascular adaptation [44].
Related evidence suggests that auditory stimuli, particularly music, may represent a useful adjunctive strategy in rehabilitation settings. Experimental studies have shown that acute exposure to different musical styles, rhythms, and tempos can influence cardiac autonomic regulation and heart rate dynamics in adults [45,46]. Although these studies did not evaluate insulin resistance directly, they support the concept that music-based modulation of autonomic and emotional responses may complement exercise-based rehabilitation by improving physiological responsiveness and session tolerability [44,46]. Accordingly, integrating structured physical activity with adjunctive strategies that enhance affective regulation may strengthen the translational value of rehabilitation programs aimed at preventing or attenuating early metabolic dysfunction.
From a research perspective, these results highlight insulin resistance as a modifiable and clinically meaningful early marker that may be predominantly responsive to behavioral interventions. Future longitudinal studies and randomized controlled trials should prioritize objective measures of physical activity and incorporate insulin resistance outcomes to better explain causal pathways and dose–response relationships.
5. Conclusions
In conclusion, higher levels of objectively measured MVPA were reliably associated with lower insulin resistance among U.S. adults. While associations with isolated glycemic markers were attenuated after full adjustment, the strong relationship with HOMA-IR across multiple sensitivity analyses underscores the relevance of insulin resistance as a sensitive indicator of metabolic health. These findings reinforce the value of accelerometer-based assessments for early metabolic risk stratification and support physical activity promotion as a basis of preventive strategies aimed at reducing the burden of Type 2 Diabetes Mellitus.
Author Contributions
Conceptualization, S.C.B. and V.E.V.; methodology, R.D.R. and V.E.V.; software, A.A.P.; validation, S.C.B., R.D.R. and V.E.V.; formal analysis, A.A.P.; investigation, S.C.B. and L.P.O.; resources, V.E.V.; data curation, C.S.F. and E.A.N.; writing—original draft preparation, S.C.B.; writing—review and editing, R.D.R., D.M.G., S.M.B. and V.E.V.; visualization, A.A.P.; supervision, V.E.V.; project administration, V.E.V.; funding acquisition, V.E.V. All authors have read and agreed to the published version of the manuscript.
Funding
Dr. Vitor E. Valenti receives financial support from the National Council for Scientific and Technological Development, an entity linked to the Ministry of Science, Technology, Innovations and Communications from Brazil (Process number 302574/2021-2).
Institutional Review Board Statement
Not applicable.
Informed Consent Statement
Not applicable.
Data Availability Statement
The data from this study are available at: https://drive.google.com/drive/u/1/folders/17lsjpsp7DxcJ2FkvcNHkZr7ILYVXF_ef (accessed on 22 January 2026).
Acknowledgments
We gratefully acknowledge São Paulo State University (UNESP) for providing the logistical infrastructure and financial support essential for the development of this study. The university’s continued commitment to fostering high-quality research was fundamental to the completion of this work. We also thank the National Health and Nutrition Examination Survey (NHANES) for making the data used in this analysis publicly available. All scientific content, data handling, analyses, and interpretations were conducted and verified by the authors, who assume full responsibility for the accuracy and integrity of the manuscript.
Conflicts of Interest
The authors declare no conflicts of interest.
Abbreviations
The following abbreviations are used in this manuscript:
| ADA | American Diabetes Association |
| AM-7164 | ActiGraph model AM-7164 accelerometer |
| BMI | Body Mass Index |
| CDC | Centers for Disease Control and Prevention |
| CI | Confidence Interval |
| DCCT | Diabetes Control and Complications Trial |
| EDTA | Ethylenediaminetetraacetic Acid |
| ERB | Ethics Review Board |
| HbA1c | Glycated Hemoglobin |
| HDL | High-Density Lipoprotein |
| HOMA-IR | Homeostatic Model Assessment of Insulin Resistance |
| HPLC | High-Performance Liquid Chromatography |
| IDF | International Diabetes Federation |
| IR | Insulin Resistance |
| IRB | Institutional Review Board |
| ISIS | Integrated Survey Information System |
| LDL | Low-Density Lipoprotein |
| MEC | Mobile Examination Center |
| MVPA | Moderate-to-Vigorous Physical Activity |
| NCHS | National Center for Health Statistics |
| NHANES | National Health and Nutrition Examination Survey |
| PI3K | Phosphoinositide 3-Kinase |
| PSU | Primary Sampling Unit |
| QA/QC | Quality Assurance/Quality Control |
| RIA | Radioimmunoassay |
| SD | Standard Deviation |
| SDMVPSU | Masked Variance Pseudo-Primary Sampling Unit |
| SDMVSTRA | Masked Variance Pseudo-Stratum |
| SE | Standard Error |
| STROBE | Strengthening the Reporting of Observational Studies in Epidemiology |
| T2DM | Type 2 Diabetes Mellitus |
| UNESP | São Paulo State University (Universidade Estadual Paulista) |
| WHO | World Health Organization |
References
- International Diabetes Federation. IDF Diabetes Atlas, 10th ed.; International Diabetes Federation: Brussels, Belgium, 2021; Available online: https://diabetesatlas.org/ (accessed on 8 February 2026).
- Różańska-Walędziak, A.; Walędziak, M. Unraveling the Complexity of Metabolic Disorders Through Biomarkers: A Focus on Obesity and Type 2 Diabetes Mellitus. Biomedicines 2025, 13, 2443. [Google Scholar] [CrossRef] [Scilit]
- Accili, D.; Deng, Z.; Liu, Q. Insulin resistance in type 2 diabetes mellitus. Nat. Rev. Endocrinol. 2025, 21, 413–426. [Google Scholar] [CrossRef] [Scilit] [PubMed]
- Booth, F.W.; Roberts, C.K.; Laye, M.J. Lack of exercise is a major cause of chronic diseases. Compr. Physiol. 2012, 2, 1143–1211. [Google Scholar] [CrossRef] [Scilit]
- Małkowska, P. Positive Effects of Physical Activity on Insulin Signaling. Curr. Issues Mol. Biol. 2024, 46, 5467–5487. [Google Scholar] [CrossRef] [Scilit]
- Hawley, J.A.; Lessard, S.J. Exercise training-induced improvements in insulin action. Acta Physiol. 2008, 192, 127–135. [Google Scholar] [CrossRef] [Scilit]
- Ekelund, U.; Steene-Johannessen, J.; Brown, W.J.; Fagerland, M.W.; Owen, N.; Powell, K.E.; Bauman, A.; Lee, I.M. Lancet Physical Activity Series 2 Executive Committe; Lancet Sedentary Behaviour Working Group. Does physical activity attenuate, or even eliminate, the detrimental association of sitting time with mortality? A harmonised meta-analysis of data from more than 1 million men and women. Lancet 2016, 388, 1302–1310, Erratum in Lancet 2016, 388, e6. https://doi.org/10.1016/S0140-6736(16)31677-4. [Google Scholar] [CrossRef] [Scilit]
- Celis-Morales, C.A.; Perez-Bravo, F.; Ibañez, L.; Salas, C.; Bailey, M.E.; Gill, J.M. Objective vs. self-reported physical activity and sedentary time: Effects of measurement method on relationships with risk biomarkers. PLoS ONE 2012, 7, e36345. [Google Scholar] [CrossRef] [Scilit]
- Füzéki, E.; Engeroff, T.; Banzer, W. Health Benefits of Light-Intensity Physical Activity: A Systematic Review of Accelerometer Data of the National Health and Nutrition Examination Survey (NHANES). Sports Med. 2017, 47, 1769–1793. [Google Scholar] [CrossRef] [Scilit]
- Zhang, J.; Yang, Y.; Zheng, H.; Bai, B.; Yang, Q.; Zhang, L.; Zhao, Y.; Luo, J.; Yu, B. The associations of physical activity patterns and the triglyceride-glucose index in US adults: A secondary data analysis of NHANES (2007–2018). Sci. Rep. 2025, 15, 2375. [Google Scholar] [CrossRef] [Scilit] [PubMed]
- Cheng, J.; Huang, Y.; Ren, Z.; Xu, P.; Tan, J.; Huang, B.; Chen, Y.; Lin, Z.; Gao, Y. Compositional isotemporal substitution analysis of physical activity, sedentary behaviour and cardiometabolic biomarkers in US adults: A nationally representative study. Eur. J. Sport Sci. 2023, 23, 2119–2128. [Google Scholar] [CrossRef] [Scilit] [PubMed]
- Boyer, W.R.; Bassett, D.R.; Fitzhugh, E.C.; Milano, A.N.; Churilla, J.R.; Toth, L.P.; Richardson, M.R. Accelerometer-Measured Physical Activity and Cardiometabolic Risk Factors by Race-Ethnicity: 2003–2006 NHANES. J. Racial Ethn. Health Disparities 2022, 9, 1607–1615. [Google Scholar] [CrossRef] [Scilit]
- Koivula, T.; Lempiäinen, S.; Laine, S.; Sjöros, T.; Vähä-Ypyä, H.; Garthwaite, T.; Löyttyniemi, E.; Sievänen, H.; Vasankari, T.; Knuuti, J.; et al. Cross-Sectional Associations of Body Adiposity, Sedentary Behavior, and Physical Activity with Hemoglobin and White Blood Cell Count. Int. J. Environ. Res. Public Health 2022, 19, 14347. [Google Scholar] [CrossRef] [Scilit]
- Staiano, A.E.; Harrington, D.M.; Barreira, T.V.; Katzmarzyk, P.T. Sitting time and cardiometabolic risk in US adults: Associations by sex, race, socioeconomic status and activity level. Br. J. Sports Med. 2014, 48, 213–219. [Google Scholar] [CrossRef] [Scilit] [PubMed]
- Evenson, K.R.; Buchner, D.M.; Morland, K.B. Objective measurement of physical activity and sedentary behavior among US adults aged 60 years or older. Prev. Chronic Dis. 2012, 9, E26. [Google Scholar] [CrossRef] [Scilit] [PubMed]
- National Center for Health Statistics. National Health and Nutrition Examination Survey: Laboratory Procedures Manual; Chapter 8: Blood and HIV Urine Processing; National Center for Health Statistics: Hyattsville, MD, USA, 2004.
- Matthews, D.R.; Hosker, J.P.; Rudenski, A.S.; Naylor, B.A.; Treacher, D.F.; Turner, R.C. Homeostasis model assessment: Insulin resistance and beta-cell function from fasting plasma glucose and insulin concentrations in man. Diabetologia 1985, 28, 412–419. [Google Scholar] [CrossRef] [Scilit] [PubMed]
- American Diabetes Association Professional Practice Committee. 2. Classification and Diagnosis of Diabetes: Standards of Medical Care in Diabetes—2022. Diabetes Care 2022, 45, S17–S38. [Google Scholar] [CrossRef] [Scilit]
- World Health Organization. Physical Status: The Use and Interpretation of Anthropometry. Report of a WHO Expert Committee; World Health Organization Technical Report Series; World Health Organization: Geneva, Switzerland, 1995; Volume 854, pp. 1–452. [Google Scholar]
- Abrego-Guandique, D.M.; Aguilera Rojas, N.M.; Chiari, A.; Luciani, F.; Cione, E.; Cannataro, R. The impact of exercise on mitochondrial biogenesis in skeletal muscle: A systematic review and meta-analysis of randomized trials. Biomol. Concepts 2025, 16, 20250055. [Google Scholar] [CrossRef] [Scilit]
- Zhu, W.; Zhou, Z.; Sun, J.; Si, J. Effects of exercise training on skeletal muscle mitochondrial outcomes in type 2 diabetes: A systematic review and meta-analysis. Front. Physiol. 2025, 16, 1671926. [Google Scholar] [CrossRef] [Scilit]
- Kanaley, J.A.; Colberg, S.R.; Corcoran, M.H.; Malin, S.K.; Rodriguez, N.R.; Crespo, C.J.; Kirwan, J.P.; Zierath, J.R. Exercise/Physical Activity in Individuals with Type 2 Diabetes: A Consensus Statement from the American College of Sports Medicine. Med. Sci. Sports Exerc. 2022, 54, 353–368. [Google Scholar] [CrossRef] [Scilit]
- Whytock, K.L.; Goodpaster, B.H. Unraveling Skeletal Muscle Insulin Resistance: Molecular Mechanisms and the Restorative Role of Exercise. Circ. Res. 2025, 137, 184–204. [Google Scholar] [CrossRef] [Scilit]
- Schisterman, E.F.; Cole, S.R.; Platt, R.W. Overadjustment bias and unnecessary adjustment in epidemiologic studies. Epidemiology 2009, 20, 488–495. [Google Scholar] [CrossRef] [Scilit]
- Lindström, J.; Tuomilehto, J. The diabetes risk score: A practical tool to predict type 2 diabetes risk. Diabetes Care 2003, 26, 725–731. [Google Scholar] [CrossRef] [Scilit] [PubMed]
- Hernán, M.A.; Robins, J.M. Causal Inference: What If; Chapman & Hall/CRC: Boca Raton, FL, USA, 2020. [Google Scholar]
- de Victo, E.R.; Sales, D.; Christofaro, D.G.D.; Fisberg, M.; Kovalskys, I.; Del Val Martín, P.; Ferrari, G. Isotemporal substitution of sedentary time with different physical activity intensities and sleep in obesity parameters across eight latin American countries. Sci. Rep. 2025, 15, 4081. [Google Scholar] [CrossRef] [Scilit] [PubMed]
- Dunstan, D.W.; Kingwell, B.A.; Larsen, R.; Healy, G.N.; Cerin, E.; Hamilton, M.T.; Shaw, J.E.; Bertovic, D.A.; Zimmet, P.Z.; Salmon, J.; et al. Breaking up prolonged sitting reduces postprandial glucose and insulin responses. Diabetes Care 2012, 35, 976–983. [Google Scholar] [CrossRef] [Scilit] [PubMed]
- Lim, S.; Deaver, J.W.; Rosa-Caldwell, M.E.; Lee, D.E.; Morena da Silva, F.; Cabrera, A.R.; Schrems, E.R.; Saling, L.W.; Washington, T.A.; Fluckey, J.D.; et al. Muscle miR-16 deletion results in impaired insulin sensitivity and contractile function in a sex-dependent manner. Am. J. Physiol. Endocrinol. Metab. 2022, 322, E278–E292. [Google Scholar] [CrossRef] [Scilit]
- Aukan, M.I.; Coutinho, S.; Pedersen, S.A.; Simpson, M.R.; Martins, C. Differences in gastrointestinal hormones and appetite ratings between individuals with and without obesity-A systematic review and meta-analysis. Obes. Rev. 2023, 24, e13531. [Google Scholar] [CrossRef] [Scilit]
- Kim, C.; Dabelea, D.; Kalyani, R.R.; Christophi, C.A.; Bray, G.A.; Pi-Sunyer, X.; Darwin, C.H.; Yalamanchi, S.; Barrett-Connor, E.; Golden, S.H.; et al. Changes in Visceral Adiposity, Subcutaneous Adiposity, and Sex Hormones in the Diabetes Prevention Program. J. Clin. Endocrinol. Metab. 2017, 102, 3381–3389. [Google Scholar] [CrossRef] [Scilit]
- Bassett, D.R., Jr.; Rowlands, A.; Trost, S.G. Calibration and validation of wearable monitors. Med. Sci. Sports Exerc. 2012, 44, S32–S38. [Google Scholar] [CrossRef] [Scilit]
- Li, H.; Lynn, H.S.; Zipunnikov, V. Sex and age differences in association between physical activity and metabolic syndrome: Results from NHANES 2003–2006. Healthcare 2023, 11, 1059. [Google Scholar] [CrossRef] [Scilit]
- Bankoski, A.; Harris, T.B.; McClain, J.J.; Brychta, R.J.; Caserotti, P.; Chen, K.Y.; Berrigan, D.; Troiano, R.P.; Koster, A. Sedentary activity associated with metabolic syndrome independent of physical activity. Diabetes Care 2011, 34, 497–503. [Google Scholar] [CrossRef] [Scilit]
- Camhi, S.M.; Sisson, S.B.; Johnson, W.D.; Katzmarzyk, P.T.; Tudor-Locke, C. Accelerometer-determined moderate intensity lifestyle activity and cardiometabolic health. Prev. Med. 2011, 52, 358–360. [Google Scholar] [CrossRef] [Scilit]
- Tucker, J.M.; Welk, G.J.; Beyler, N.K.; Kim, Y. Associations between physical activity and metabolic syndrome: Comparison between self-report and accelerometry. Am. J. Health Promot. 2016, 30, 155–162. [Google Scholar] [CrossRef] [Scilit]
- Tudor-Locke, C.; Schuna, J.M., Jr.; Han, H.; Aguiar, E.J.; Green, M.A.; Busa, M.A.; Larrivee, S.; Johnson, W.D. Step-based physical activity metrics and cardiometabolic risk: NHANES 2005–2006. Med. Sci. Sports Exerc. 2017, 49, 283–291. [Google Scholar] [CrossRef] [Scilit] [PubMed]
- Rossen, J.; Von Rosen, P.; Johansson, U.B.; Brismar, K.; Hagströmer, M. Associations of physical activity and sedentary behavior with cardiometabolic biomarkers in prediabetes and type 2 diabetes: A compositional data analysis. Physician Sportsmed. 2020, 48, 222–228. [Google Scholar] [CrossRef] [Scilit] [PubMed]
- Carson, V.; Ridgers, N.D.; Howard, B.J.; Winkler, E.A.H.; Healy, G.N.; Owen, N.; Dunstan, D.W.; Salmon, J. Light-intensity physical activity and cardiometabolic biomarkers in US adolescents. PLoS ONE 2013, 8, e71417. [Google Scholar] [CrossRef] [Scilit] [PubMed]
- Loprinzi, P.D.; Sheffield, J.; Tyo, B.M.; Fittipaldi-Wert, J. Accelerometer-determined physical activity, mobility disability, and health. Disabil. Health J. 2014, 7, 419–425. [Google Scholar] [CrossRef] [Scilit]
- Jefferis, B.J.; Parsons, T.J.; Sartini, C.; Ash, S.; Lennon, L.T.; Wannamethee, S.G.; Lee, I.M.; Whincup, P.H. Does duration of physical activity bouts matter for adiposity and metabolic syndrome? A cross-sectional study of older British men. Int. J. Behav. Nutr. Phys. Act. 2016, 13, 36. [Google Scholar] [CrossRef] [Scilit]
- Healy, G.N.; Winkler, E.A.H.; Brakenridge, C.L.; Reeves, M.M.; Eakin, E.G. Accelerometer-derived sedentary and physical activity time in overweight/obese adults with type 2 diabetes: Cross-sectional associations with cardiometabolic biomarkers. PLoS ONE 2015, 10, e0119140. [Google Scholar] [CrossRef] [Scilit]
- Amagasa, S.; Machida, M.; Fukushima, N.; Kikuchi, H.; Takamiya, T.; Odagiri, Y.; Inoue, S. Is objectively measured light-intensity physical activity associated with health outcomes after adjustment for moderate-to-vigorous physical activity in adults? A systematic review. Int. J. Behav. Nutr. Phys. Act. 2018, 15, 65. [Google Scholar] [CrossRef] [Scilit]
- da Silva, S.A.; Guida, H.L.; Dos Santos Antonio, A.M.; de Abreu, L.C.; Monteiro, C.B.; Ferreira, C.; Ribeiro, V.F.; Barnabe, V.; Silva, S.B.; Fonseca, F.L.; et al. Acute auditory stimulation with different styles of music influences cardiac autonomic regulation in men. Int. Cardiovasc. Res. J. 2014, 8, 105–110. [Google Scholar]
- da Silva, A.G.; Guida, H.L.; Antônio, A.M.; Marcomini, R.S.; Fontes, A.M.; de Abreu, L.C.; Roque, A.L.; Silva, S.B.; Raimundo, R.D.; Ferreira, C.; et al. An exploration of heart rate response to differing music rhythm and tempos. Complement. Ther. Clin. Pract. 2014, 20, 130–134. [Google Scholar] [CrossRef] [Scilit]
- Maukel, L.M.; Tulloch, H.; Trudel-Fitzgerald, C. Affect regulation and cardiac rehabilitation: Common strategies, their impact on cardiovascular health, and opportunities for intervention. Cardiol. Clin. 2026, 44, 221–232. [Google Scholar] [CrossRef] [Scilit] [PubMed]

Disclaimer/Publisher’s Note: The statements, opinions and data contained in all publications are solely those of the individual author(s) and contributor(s) and not of MDPI and/or the editor(s). MDPI and/or the editor(s) disclaim responsibility for any injury to people or property resulting from any ideas, methods, instructions or products referred to in the content. |
© 2026 by the authors. Licensee MDPI, Basel, Switzerland. This article is an open access article distributed under the terms and conditions of the Creative Commons Attribution (CC BY) license.