


Abstract
Background: The interplay between vitamin D deficiency, obesity, and depressive symptoms in type 2 diabetes remains poorly understood. Potential sex-specific differences in these associations have not been fully explored. Methods: We conducted a cross-sectional analysis of patients with type 2 diabetes (N = 917) from the NHANES 2017–2018 cycle. Restricted cubic spline models were used to assess potential non-linear associations between serum 25-hydroxyvitamin D3 and PHQ-9 depression scores. Regression-based mediation analysis was performed to estimate total, direct, and indirect associations, with body mass index (BMI) considered as a potential mediator. Models were adjusted for relevant demographic and cardiometabolic covariates. Results: In the overall diabetic cohort, higher vitamin D levels were modestly associated with lower depressive symptom scores. Mediation analysis suggested that this association was statistically accounted for by BMI. In sex-stratified analyses, significant total and indirect associations were observed among men, with a remaining direct association after adjustment for BMI, whereas no statistically significant associations were detected among women. Formal interaction testing supported differential association patterns by sex. Conclusions: Among adults with type 2 diabetes, serum vitamin D levels were inversely associated with depressive symptoms, with evidence suggesting sex-specific association patterns. These findings warrant further investigation in prospective studies to clarify potential underlying mechanisms and clinical implications.
1. Introduction
Diabetes mellitus (DM) is one of the most prevalent chronic diseases worldwide and represents a major and growing public health challenge. In 2024, an estimated 589 million adults were living with diabetes, and projections suggest that this figure will increase by approximately 45 percent to reach nearly 853 million individuals by 2050, highlighting the urgent need to better understand its determinants and complications [1]. Beyond its clinical burden, DM exerts a profound economic impact, with global healthcare expenditures amounting to hundreds of billions of US dollars annually [1,2]. This burden is particularly pronounced among older adults, in whom diabetes accounts for a substantial proportion of all-cause mortality.
DM is a multifactorial disease driven by the interplay of genetic, environmental, and behavioral influences. Whereas some risk factors such as age or family history cannot be modified, others including excess adiposity, insufficient physical activity, elevated blood pressure, tobacco and alcohol use, dietary patterns, and dyslipidemia can be targeted to reduce disease incidence and mitigate adverse outcomes [3,4,5]. Among these modifiable factors, vitamin D has gained increasing attention due to accumulating evidence linking low vitamin D status not only with the risk of developing type 2 diabetes mellitus (T2DM) but also with its cardiometabolic and neuropsychiatric sequelae [6,7].
Vitamin D is a fat-soluble secosteroid available mainly as cholecalciferol (vitamin D3) and ergocalciferol (vitamin D2), with vitamin D3 being the predominant form in humans. Vitamin D3 is synthesized in the skin upon exposure to ultraviolet B radiation and subsequently activated via hepatic and renal hydroxylation to produce 1,25-dihydroxyvitamin D3, the biologically active hormone [8]. Although traditionally recognized for its key role in calcium homeostasis and bone metabolism, the widespread distribution of the vitamin D receptor (VDR) across multiple tissues indicates broader physiological actions, including modulation of immune function, regulation of insulin secretion and sensitivity, and influence on neurobiological pathways relevant to mood regulation [8,9].
Growing evidence suggests that vitamin D deficiency is associated with an increased risk of cardiovascular disease, cancer, and neuropsychiatric disorders such as depression [8,10,11]. Several observational studies have reported inverse associations between circulating vitamin D concentrations and depressive symptoms in both the general population and in large US cohorts [12,13]. Depression is substantially more prevalent among individuals with diabetes than in the general population and is associated with poorer treatment adherence, suboptimal glycemic control, and an increased risk of both microvascular and macrovascular complications [14,15]. Consequently, identifying modifiable biological factors such as vitamin D status that may contribute to the development or severity of depression in T2DM is of considerable clinical relevance.
Despite increasing research interest, most studies examining the relationship between vitamin D status, depressive symptoms, and diabetes have either focused on the effects of vitamin D supplementation on mood particularly in women [16,17,18] or have evaluated the associations of vitamin D deficiency with diabetes risk or depression independently [6,19]. A comprehensive assessment that considers the full context of this triad within a single analytical framework remains scarce. Furthermore, previous studies frequently rely on linear modeling approaches and have reported heterogeneous findings. Importantly, well documented sex differences in vitamin D metabolism and in the prevalence and clinical presentation of depression suggest that the association between serum vitamin D3 levels and depressive symptoms may differ between men and women with T2DM [20]. However, this dimension has rarely been investigated in depth, especially in large population-based cohorts such as NHANES, where such sex-specific patterns can be rigorously evaluated. Therefore, the present study aims to examine sex-specific and potentially nonlinear associations between serum vitamin D3 concentrations and depressive symptoms in adults with T2DM from the US National Health and Nutrition Examination Survey, while comprehensively adjusting for critical covariates.
2. Materials and Methods
2.1. Study Design and Data Source
This cross-sectional study is based on publicly available data from the 2017–2018 cycle of the US National Health and Nutrition Examination Survey (NHANES), the latest pre-COVID-19 cycle with complete information on serum 25-hydroxyvitamin D3 and depressive symptoms. NHANES uses a complex, multistage, stratified probability sampling design to obtain a sample representative of the non-institutionalized US civilian population. For the present analyses, data files in SAS transport format (.XPT) were downloaded from the NHANES website [21] and imported into IBM SPSS Statistics version 27 (IBM Corp., Armonk, NY, USA) software for processing. This study was conducted and reported in accordance with the Strengthening the Reporting of Observational Studies in Epidemiology (STROBE) guidelines for cross-sectional studies [22] (Checklist in Supplementary Material S1).
2.2. Study Population
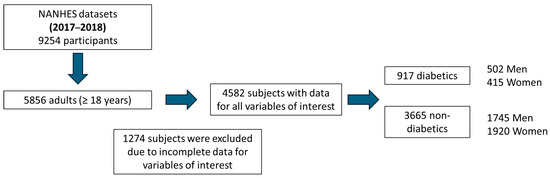
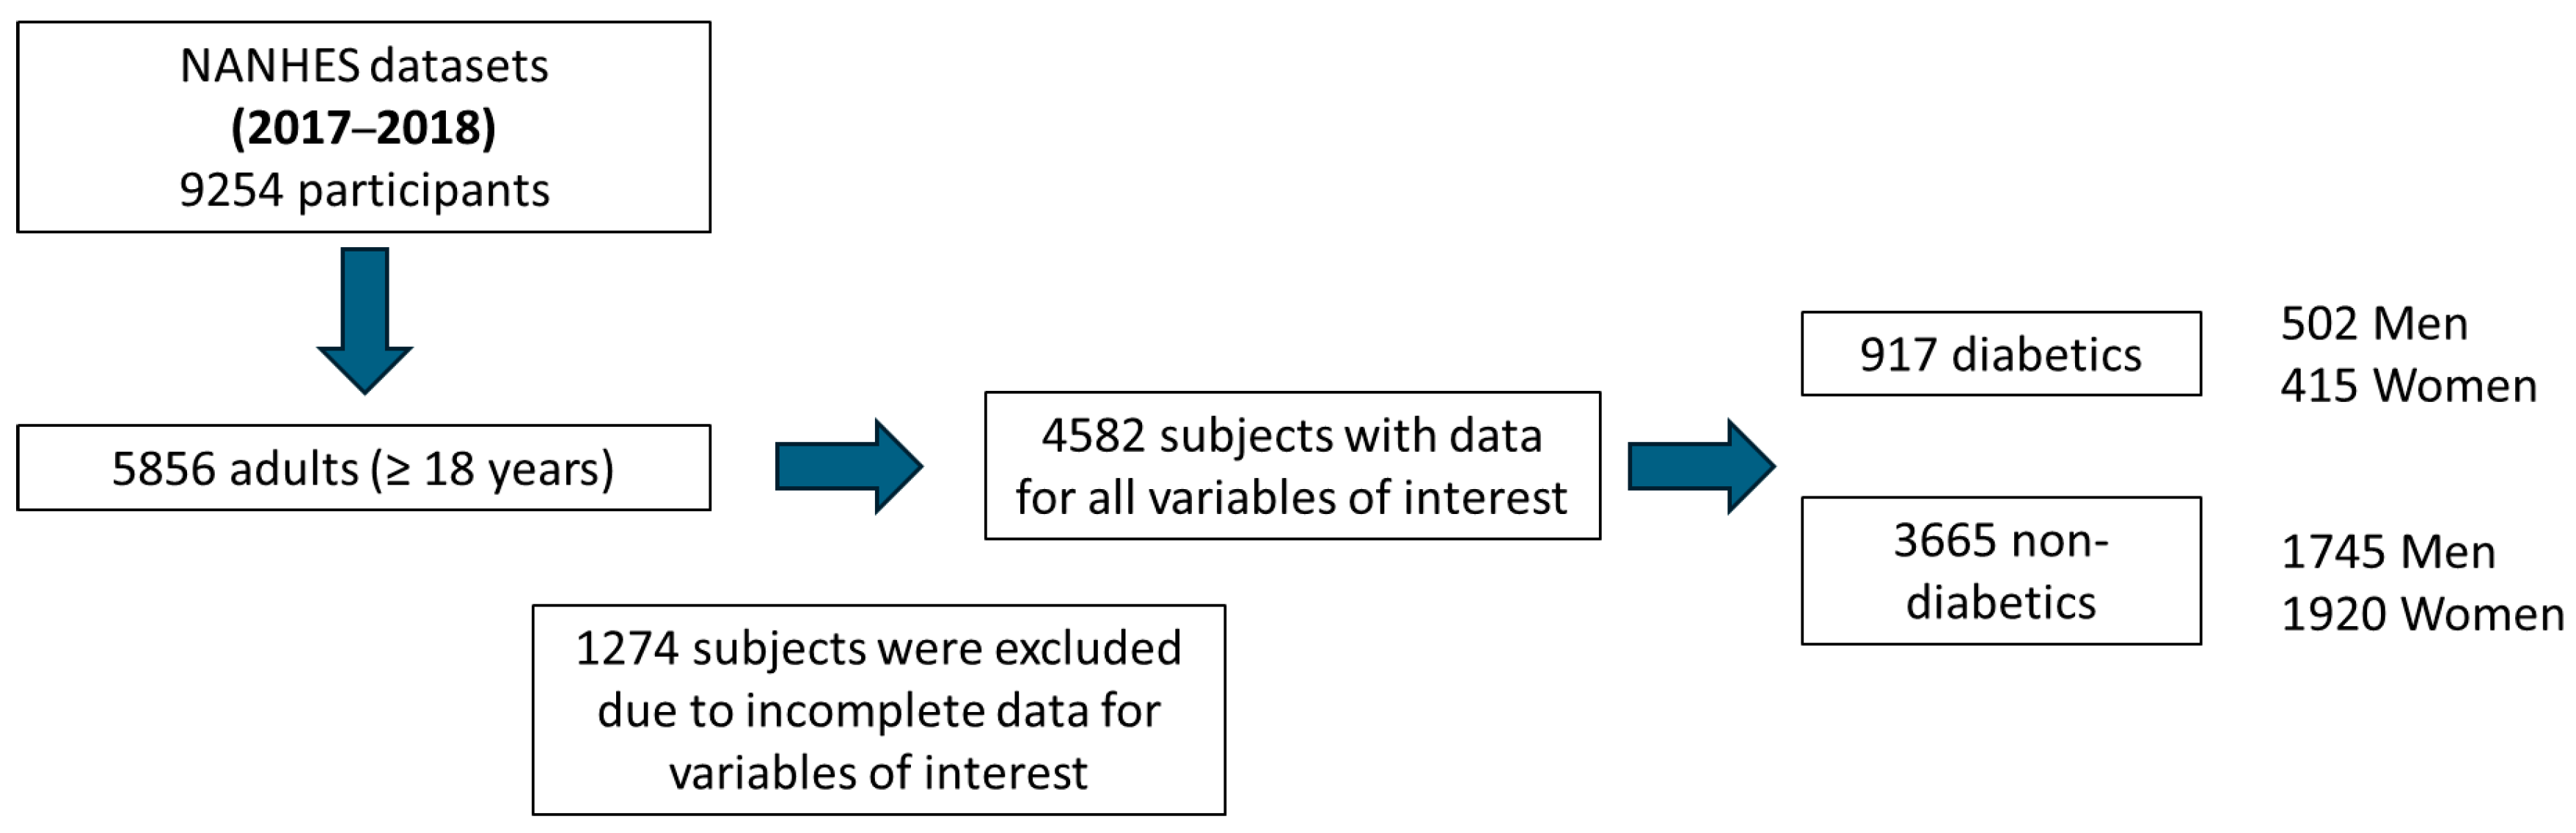
From the 9254 participants enrolled in NHANES 2017–2018, we initially restricted our sample to 5856 adults aged ≥18 years. Subsequently, participants were excluded if they had missing data on depressive symptoms (PHQ-9), serum 25-hydroxyvitamin D3, diabetes status, or any of the key covariates (age, sex, ethnicity, BMI, hypertension, dyslipidemia, or smoking status). After applying these criteria, a final analytical sample of 4582 participants remained. The exclusion of participants with supraphysiological vitamin D levels (>130 nmol/L) was not applied at this stage to establish the baseline cohort, but was strictly reserved for the subsequent mediation analyses to prevent confounding by high-dose supplementation. Within this final baseline cohort (n = 4582), there were 2335 women and 2247 men, and 917 participants met the criteria for type 2 diabetes mellitus (502 men and 415 women) (Figure 1).
Figure 1.
Study subject selection process diagram.
2.3. Definition of Key Variables
- Diabetes status: Participants were classified as having T2DM based on self-reported physician diagnosis (excluding gestational diabetes), current use of glucose-lowering medication, fasting plasma glucose ≥ 126 mg/dL, or glycated hemoglobin (HbA1c) ≥ 6.5%, consistent with established diagnostic criteria. Fasting plasma glucose measurements in NHANES are obtained from a fasting subsample. In the present study, diabetes classification incorporated available laboratory data without applying fasting subsample weights, and analyses were adjusted for relevant covariates within the final analytic sample.
- Vitamin D status was assessed via serum 25-hydroxyvitamin D3 (25(OH)D3) concentrations (expressed in nmol/L), obtained from the NHANES 2017–2018 laboratory module and measured using a standardized liquid chromatography–tandem mass spectrometry (LC–MS/MS) method at the Centers for Disease Control and Prevention (CDC), ensuring rigorous quality control [23].
- Depressive symptoms: Depressive symptoms were assessed with the Patient Health Questionnaire-9 (PHQ-9), administered as part of the NHANES mental health questionnaire. PHQ-9 total scores range from 0 to 27. Following previous NHANES-based studies, we categorized depressive symptom severity as follows: 0–4 = “none/minimal”, 5–9 = “mild”, and ≥10 = “moderate/severe” [24]. In addition, the PHQ-9 score was treated as a continuous outcome in linear regression models.
2.4. Covariates
We considered a set of covariates a priori identified as potential confounders based on previous literature and clinical relevance, given their associations with both vitamin D status and depressive symptoms in people with T2DM. These included age (years), sex (men/women), ethnicity, body mass index (BMI), dyslipidemia, hypertension, and smoking status. Age and BMI were included as continuous variables. BMI was calculated as weight in kilograms divided by height in meters squared (kg/m2) from the NHANES physical examination. Ethnicity was categorized as non-Hispanic White, non-Hispanic Black, Mexican American, other Hispanic, and other races including multiracial, according to NHANES definitions.
Dyslipidemia was defined as self-reported physician diagnosis of hypercholesterolemia, current use of lipid-lowering medication, or fasting total cholesterol ≥ 240 mg/dL. Hypertension was defined as self-reported physician diagnosis of hypertension, current use of antihypertensive medication, or mean systolic blood pressure ≥ 140 mmHg and/or diastolic blood pressure ≥ 90 mmHg measured during the examination. Smoking status was coded as ever smoker vs never smoker: participants who reported having smoked more than 100 cigarettes in their lifetime or who had serum cotinine levels > 10 ng/mL were classified as ever smokers; all others were considered never smokers [25].
2.5. Statistical Analysis
Descriptive analyses were used to characterize the study population overall and according to diabetes and depressive symptom status. Continuous variables are presented as mean (standard deviation) or median (interquartile range), as appropriate, and categorical variables as counts and percentages. Normality was assessed using the D’Agostino–Pearson, Shapiro–Wilk, and Kolmogorov–Smirnov tests. Given that most variables showed non-normal distributions, comparisons between two groups were conducted using the Mann–Whitney U test, and comparisons among three or more groups were performed using the Kruskal–Wallis test with appropriate post hoc contrasts.
Simple correlations between vitamin D3 concentrations and PHQ-9 scores, and between HbA1c and PHQ-9 scores, were evaluated using Spearman’s rank correlation coefficients, in line with the non-parametric distribution of the variables. To assess adjusted associations, multivariable linear regression models were fitted with PHQ-9 score as a continuous outcome, and multinomial logistic regression models were applied using the three PHQ-9 categories (none/minimal, mild, moderate/severe) with none/minimal as the reference. All models included age, sex, ethnicity, BMI, dyslipidemia, hypertension, and smoking status as covariates.
To explore potential non-linear relationships between vitamin D3 and depressive symptoms, natural cubic spline models (ns function) were fitted using the splines and rms packages in R (version 4.5.1). Multivariable spline models were adjusted for age, sex, ethnicity, and BMI, with additional adjustment for dyslipidemia, hypertension, and smoking status in sensitivity analyses. We specified 4 degrees of freedom (df = 4), which provides an optimal balance, offering sufficient flexibility to capture non-linear trajectories while minimizing the risk of overfitting. Formal non-linearity was assessed using likelihood ratio tests (ANOVA) comparing linear models against the spline models. Separate spline analyses were conducted for: (1) the overall adult population and the T2DM subgroup; and (2) men and women within the T2DM subgroup. Formal tests for interaction between vitamin D3 and sex were performed by including a multiplicative interaction term in the models.
Statistical analyses were performed using GraphPad Prism 7.0 (GraphPad Software Inc., San Diego, CA, USA) for basic descriptive and non-parametric tests, IBM SPSS Statistics version 27 (IBM Corp., Armonk, NY, USA) for regression models, and R version 4.5.1 (R Foundation for Statistical Computing, Vienna, Austria) for spline modeling. Analyses were conducted using multivariable regression adjustment for prespecified covariates; complex survey design weights were not applied. All tests were two-sided and a p-value < 0.05 was considered statistically significant. Mediation analyses were conducted using the jAMM (jamovi Advanced Mediation Models) module within the Jamovi statistical software 2.6.44 [26,27,28,29]. We employed a General Linear Model (GLM) mediation framework to estimate total, direct, and indirect associations within a regression-based mediation framework of serum vitamin D levels on depressive symptoms (PHQ-9), treating Body Mass Index (BMI) as the mediator. To ensure robust inference, 95% confidence intervals for indirect effects were estimated using percentile bootstrapping with 1000 resamples. Values exceeding 130 nmol/L are rarely achieved through solar exposure and diet alone and are indicative of high-dose supplementation. By excluding these participants, we aimed to reduce bias related to health-seeking behaviors or prescription supplementation that could confound the relationship between endogenous vitamin D status and depressive symptoms.
2.6. Ethical Considerations
NHANES protocols were approved by the National Center for Health Statistics Ethics Review Board and all participants provided informed consent. As this study involved secondary analysis of de-identified public data, additional ethics review was not required.
3. Results
3.1. Baseline Characteristics of the Study Population
The initial stage in the statistical analysis of subpopulations within the NHANES cohort involved conducting descriptive statistics. Table 1 summarizes the demographic and clinical characteristics of the study sample (N = 4582), stratified by diabetes status. The prevalence of diabetes in the cohort was 20.0% (n = 917). The diabetic group was significantly older compared to the non-diabetic controls (mean age: 60.04 vs. 42.96 years).
Table 1.
Descriptive examination of variables based on the subclassification of study subjects into diabetic/non-diabetic. Quantitative parameters are presented as mean (standard deviation) or geometric mean (95% confidence interval). Dichotomous variables are expressed as percentages.
Regarding anthropometric measures, participants with diabetes exhibited a notably higher BMI, with a mean value of 31.83 kg/m2, placing the average of this group within the obesity range, compared to the overweight range observed in non-diabetic subjects (28.31 kg/m2).
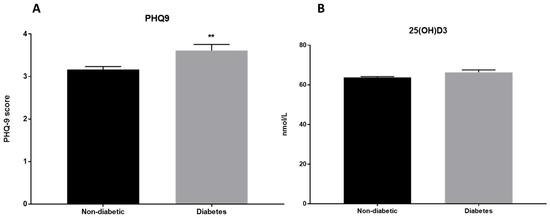
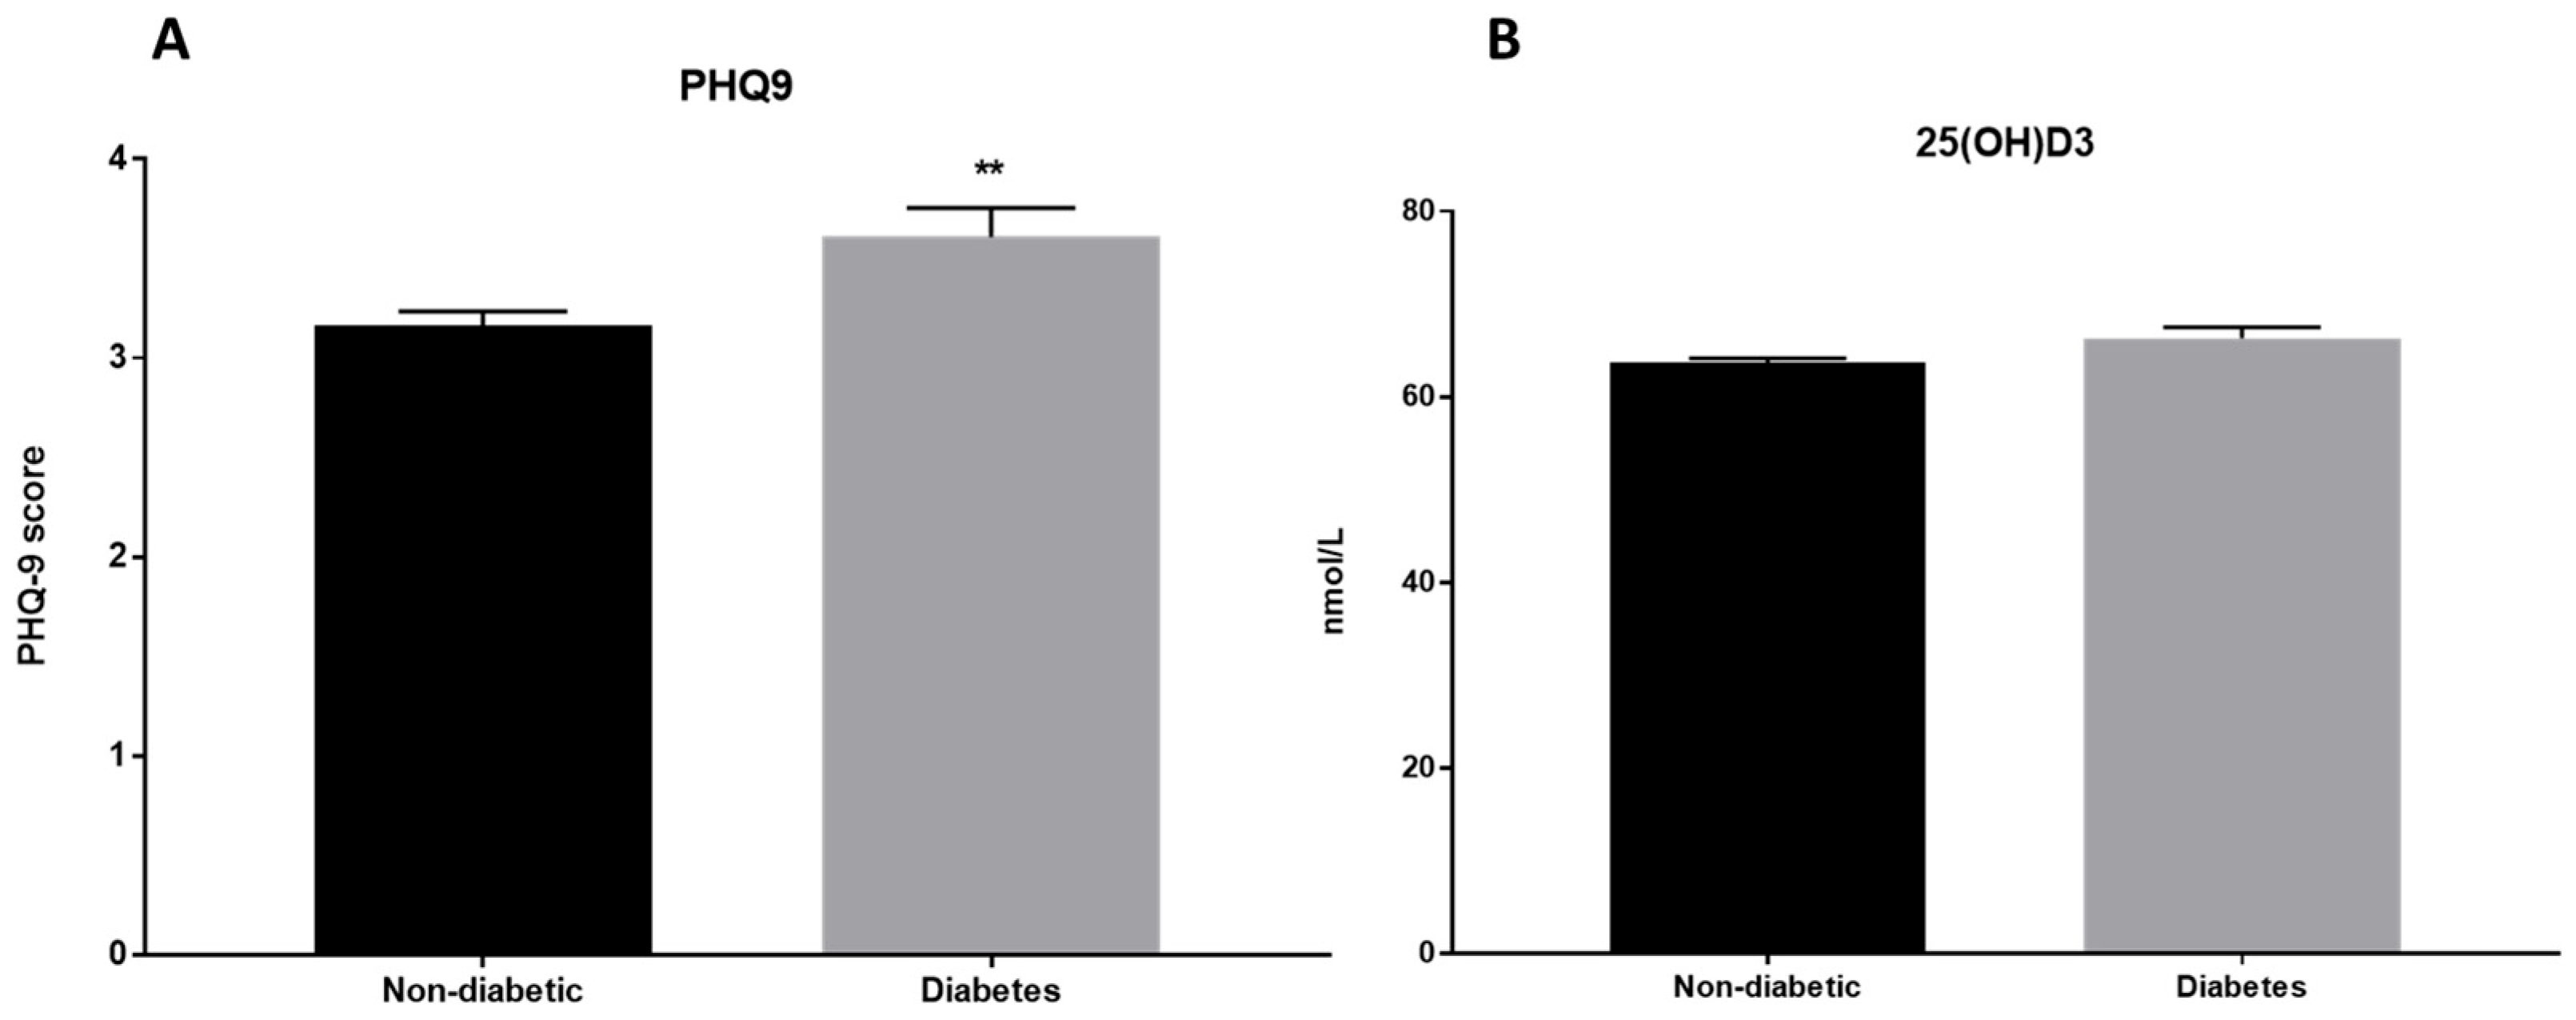
In terms of mental health outcomes, depressive symptomatology was elevated in the diabetic population. The mean PHQ-9 score was higher in the diabetic group (3.59) compared to non-diabetics (3.15). Furthermore, a distinct gender disparity was observed within the diabetic cohort: women reported substantially higher depression scores (4.23) compared to men (3.06), suggesting a greater burden of depressive symptoms among female patients with diabetes (Figure 2A).
Figure 2.
Graphical representation of the comparative study between diabetic and non-diabetic participants when comparing PHQ-9 depression questionnaire scores (A) and vitamin D3 levels (B). The Mann–Whitney U test was used for comparative statistical analysis, and data are presented as mean ± standard error of the mean (SEM) to facilitate visual comparison. ** indicates statistical significance at p < 0.01.
In addition to the metabolic burden, the diabetic cohort presented a significantly higher prevalence of comorbidities. Hypertension was strikingly more common among participants with diabetes (70.56%) compared to the non-diabetic control group (38.61%), underscoring the severe cardiovascular risk profile characteristic of this population. Regarding vitamin D status, descriptive analysis revealed no substantial disparity between the groups; mean serum 25(OH)D3 levels were comparable in diabetic (57.05 nmol/L) and non-diabetic subjects (56.53 nmol/L) (Figure 2B). Notably, mean concentrations in both groups fell within the range of vitamin D insufficiency (50–75 nmol/L), suggesting a generalized suboptimal status across the study sample regardless of diabetes diagnosis.
Table 2 outlines the clinical and sociodemographic profile of diabetic patients (n = 917) stratified by the severity of depressive symptoms (PHQ-9 categories). Significant metabolic and lifestyle disparities were observed across the groups. Regarding body composition, patients with mild (33.53 kg/m2) and moderate/severe depression (33.52 kg/m2) presented a significantly higher BMI compared to those with none or minimal symptoms (31.16 kg/m2), indicating a statistically significant link between obesity severity and depressive burden. A striking gradient was also evident in cardiovascular risk factors. The prevalence of hypertension increased linearly with depression severity (p < 0.001), rising from 66.98% in the minimal symptom group to 83.00% in the moderate/severe group. Similarly, smoking rates were significantly higher among patients with greater depressive symptomatology (p = 0.01), reaching 32.00% in the most severe category compared to 14.66% in the asymptomatic group. Regarding vitamin D3, a significant reduction was observed in the mild depression group (51.01 nmol/L) compared to the reference group (58.48 nmol/L), although this pattern did not show a linear decrease in the moderate/severe category. No significant differences were found regarding gender distribution or ethnicity across depression categories (p > 0.05).
Table 2.
Descriptive examination of variables based on the subclassification of depression according to the categories none/minimal, mild, or moderate/severe in diabetic patients (n = 917). Quantitative parameters are presented as mean (standard deviation) or geometric mean (95% confidence interval). Dichotomous variables are expressed as percentages, and p-values are reported for comparisons of dichotomous variables. Statistical analysis of quantitative variables was performed using the Kruskal–Wallis test, while Fisher’s exact test was applied to dichotomous variables. In Kruskal–Wallis multiple comparisons, an asterisk (*) indicates statistically significant differences (p < 0.05) compared with the 0–4 (“none/minimal”) group.
3.2. Relationship Between Vitamin D and Depression in the General Population
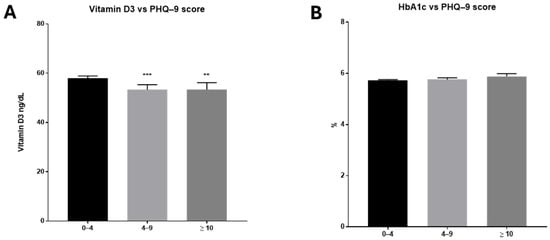
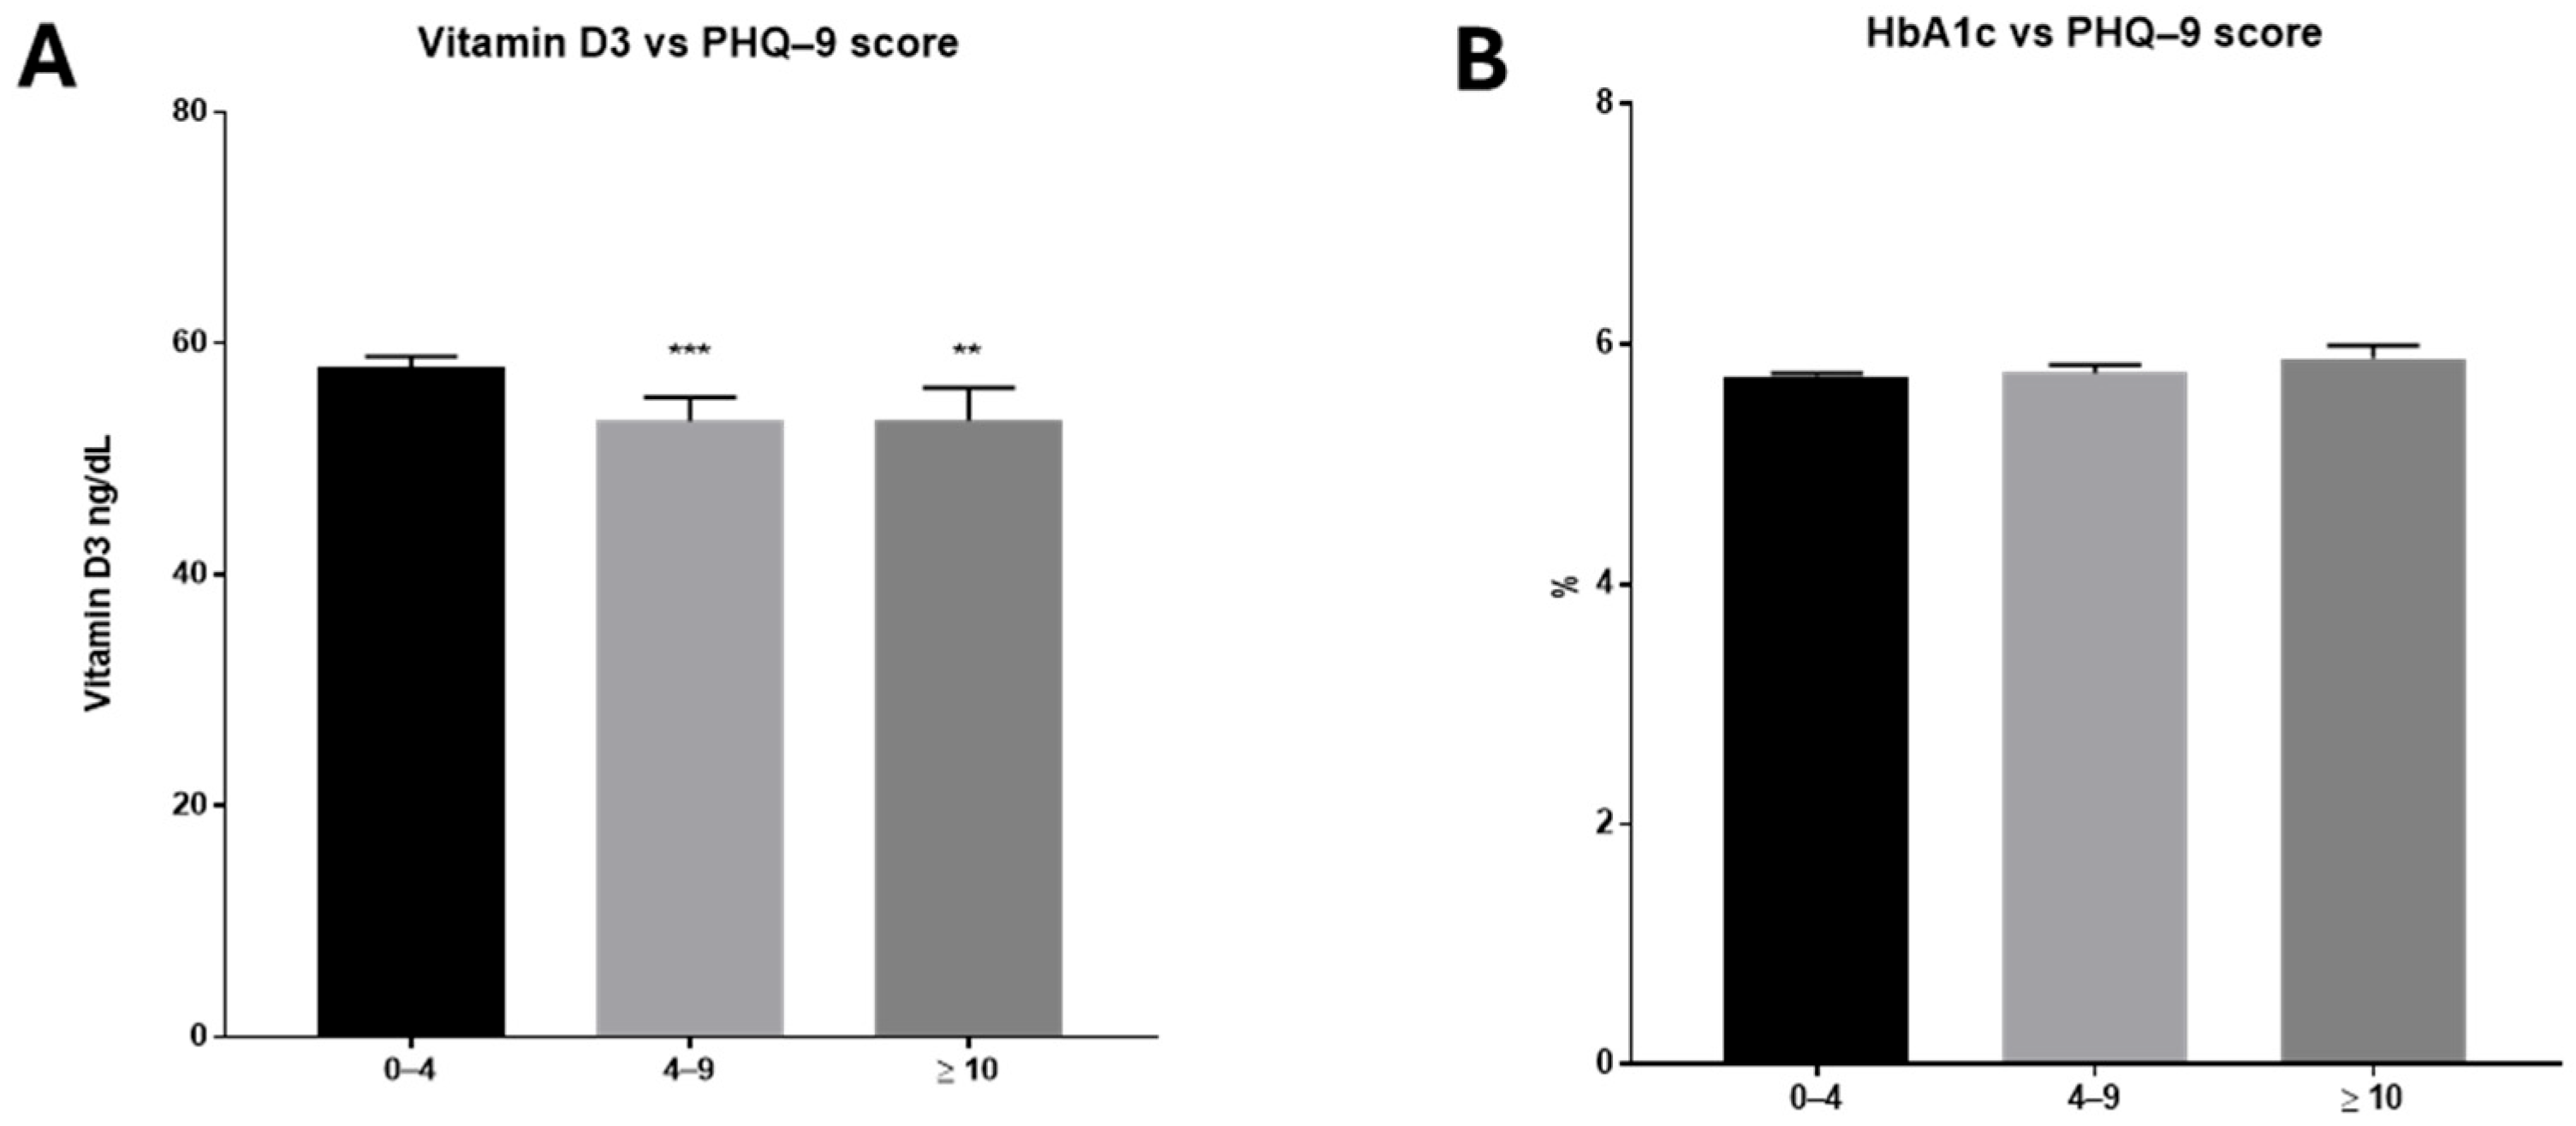
To elucidate the association between vitamin D status and mental health in the general cohort (N = 4582), we first analyzed serum 25(OH)D3 levels across depression severity categories defined by the PHQ-9 score. A significant inverse trend was observed: participants with mild depressive symptoms (PHQ-9 score 5–9) and those with moderate-to-severe symptoms (score ≥ 10) exhibited significantly lower vitamin D3 concentrations compared to the asymptomatic group (0–4) (Figure 3A). Regarding glycemic control, a positive trend was noted between HbA1c levels and depression scores, although this association did not reach statistical significance (Figure 3B).
Figure 3.
Comparison of serum Vitamin D3 and Glycated Hemoglobin (HbA1c) levels across depression severity categories in the general population. (A) Mean serum 25(OH)D3 concentrations (ng/mL) stratified by PHQ-9 score groups: none/minimal (0–4), mild (5–9), and moderate-to-severe (≥10). (B) Mean HbA1c percentage across the same depression categories. Data are presented as mean ± standard error of the mean (SEM). Significance levels: ** p < 0.01, *** p < 0.001$ vs. the 0–4 reference group.
Subsequent Spearman’s rank correlation analysis confirmed these observations, revealing significant negative correlations between PHQ-9 scores and vitamin D3 levels, as well as with age and blood pressure (Table 3). Conversely, a coherent positive and significant correlation was identified between depressive symptomatology, Body Mass Index (BMI), and serum cotinine levels, reinforcing the link between lifestyle factors and mood disorders.
Table 3.
Spearman’s Rank Correlation Matrix among Clinical, Metabolic, and Mental Health Variables. Values represent Spearman’s correlation coefficients. * p ≤ 0.05 (two-tailed).
To determine whether vitamin D deficiency constitutes an independent risk factor for depression, a multinomial logistic regression analysis was conducted, adjusting for potential confounders (Model 3: age, ethnicity, gender, BMI, hypertension, dyslipidemia, diabetes, and smoking). Using the asymptomatic group (0–4) as the reference, lower vitamin D3 levels were significantly associated with an increased likelihood of depression in both the mild (OR = 0.718; 95% CI: 0.607–0.849) and moderate-to-severe (OR = 0.763; 95% CI: 0.612–0.952) categories (Table 4). These results indicate that lower vitamin D3 levels were independently associated with higher odds of depressive symptom categories after multivariable adjustment. Furthermore, the regression highlighted a marked gender disparity: women exhibited a significantly higher risk of depression compared to men, with an Odds Ratio of 1.682 for mild and 1.896 for moderate-to-severe symptom.
Table 4.
Multinomial Logistic Regression Analysis of the Association between Vitamin D3, Gender, and Depressive Symptom Severity. The dependent variable is the PHQ-9 category, with “None/Minimal” (0–4) serving as the reference group. Vitamin D3 values were log-transformed to normalize distribution prior to analysis. Model 1: Unadjusted individual analysis. Model 2: Adjusted for Age, Ethnicity, Gender, and BMI. Model 3: Fully adjusted model (Model 2 + Hypertension, Dyslipidemia, Diabetes, and Smoking). * p < 0.05.
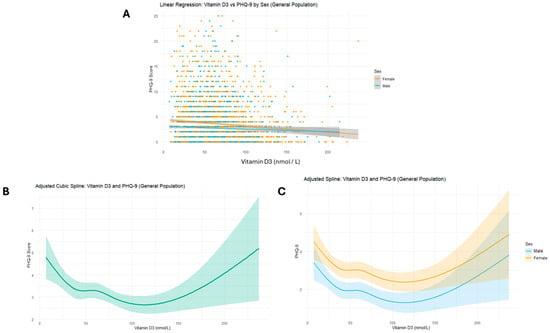
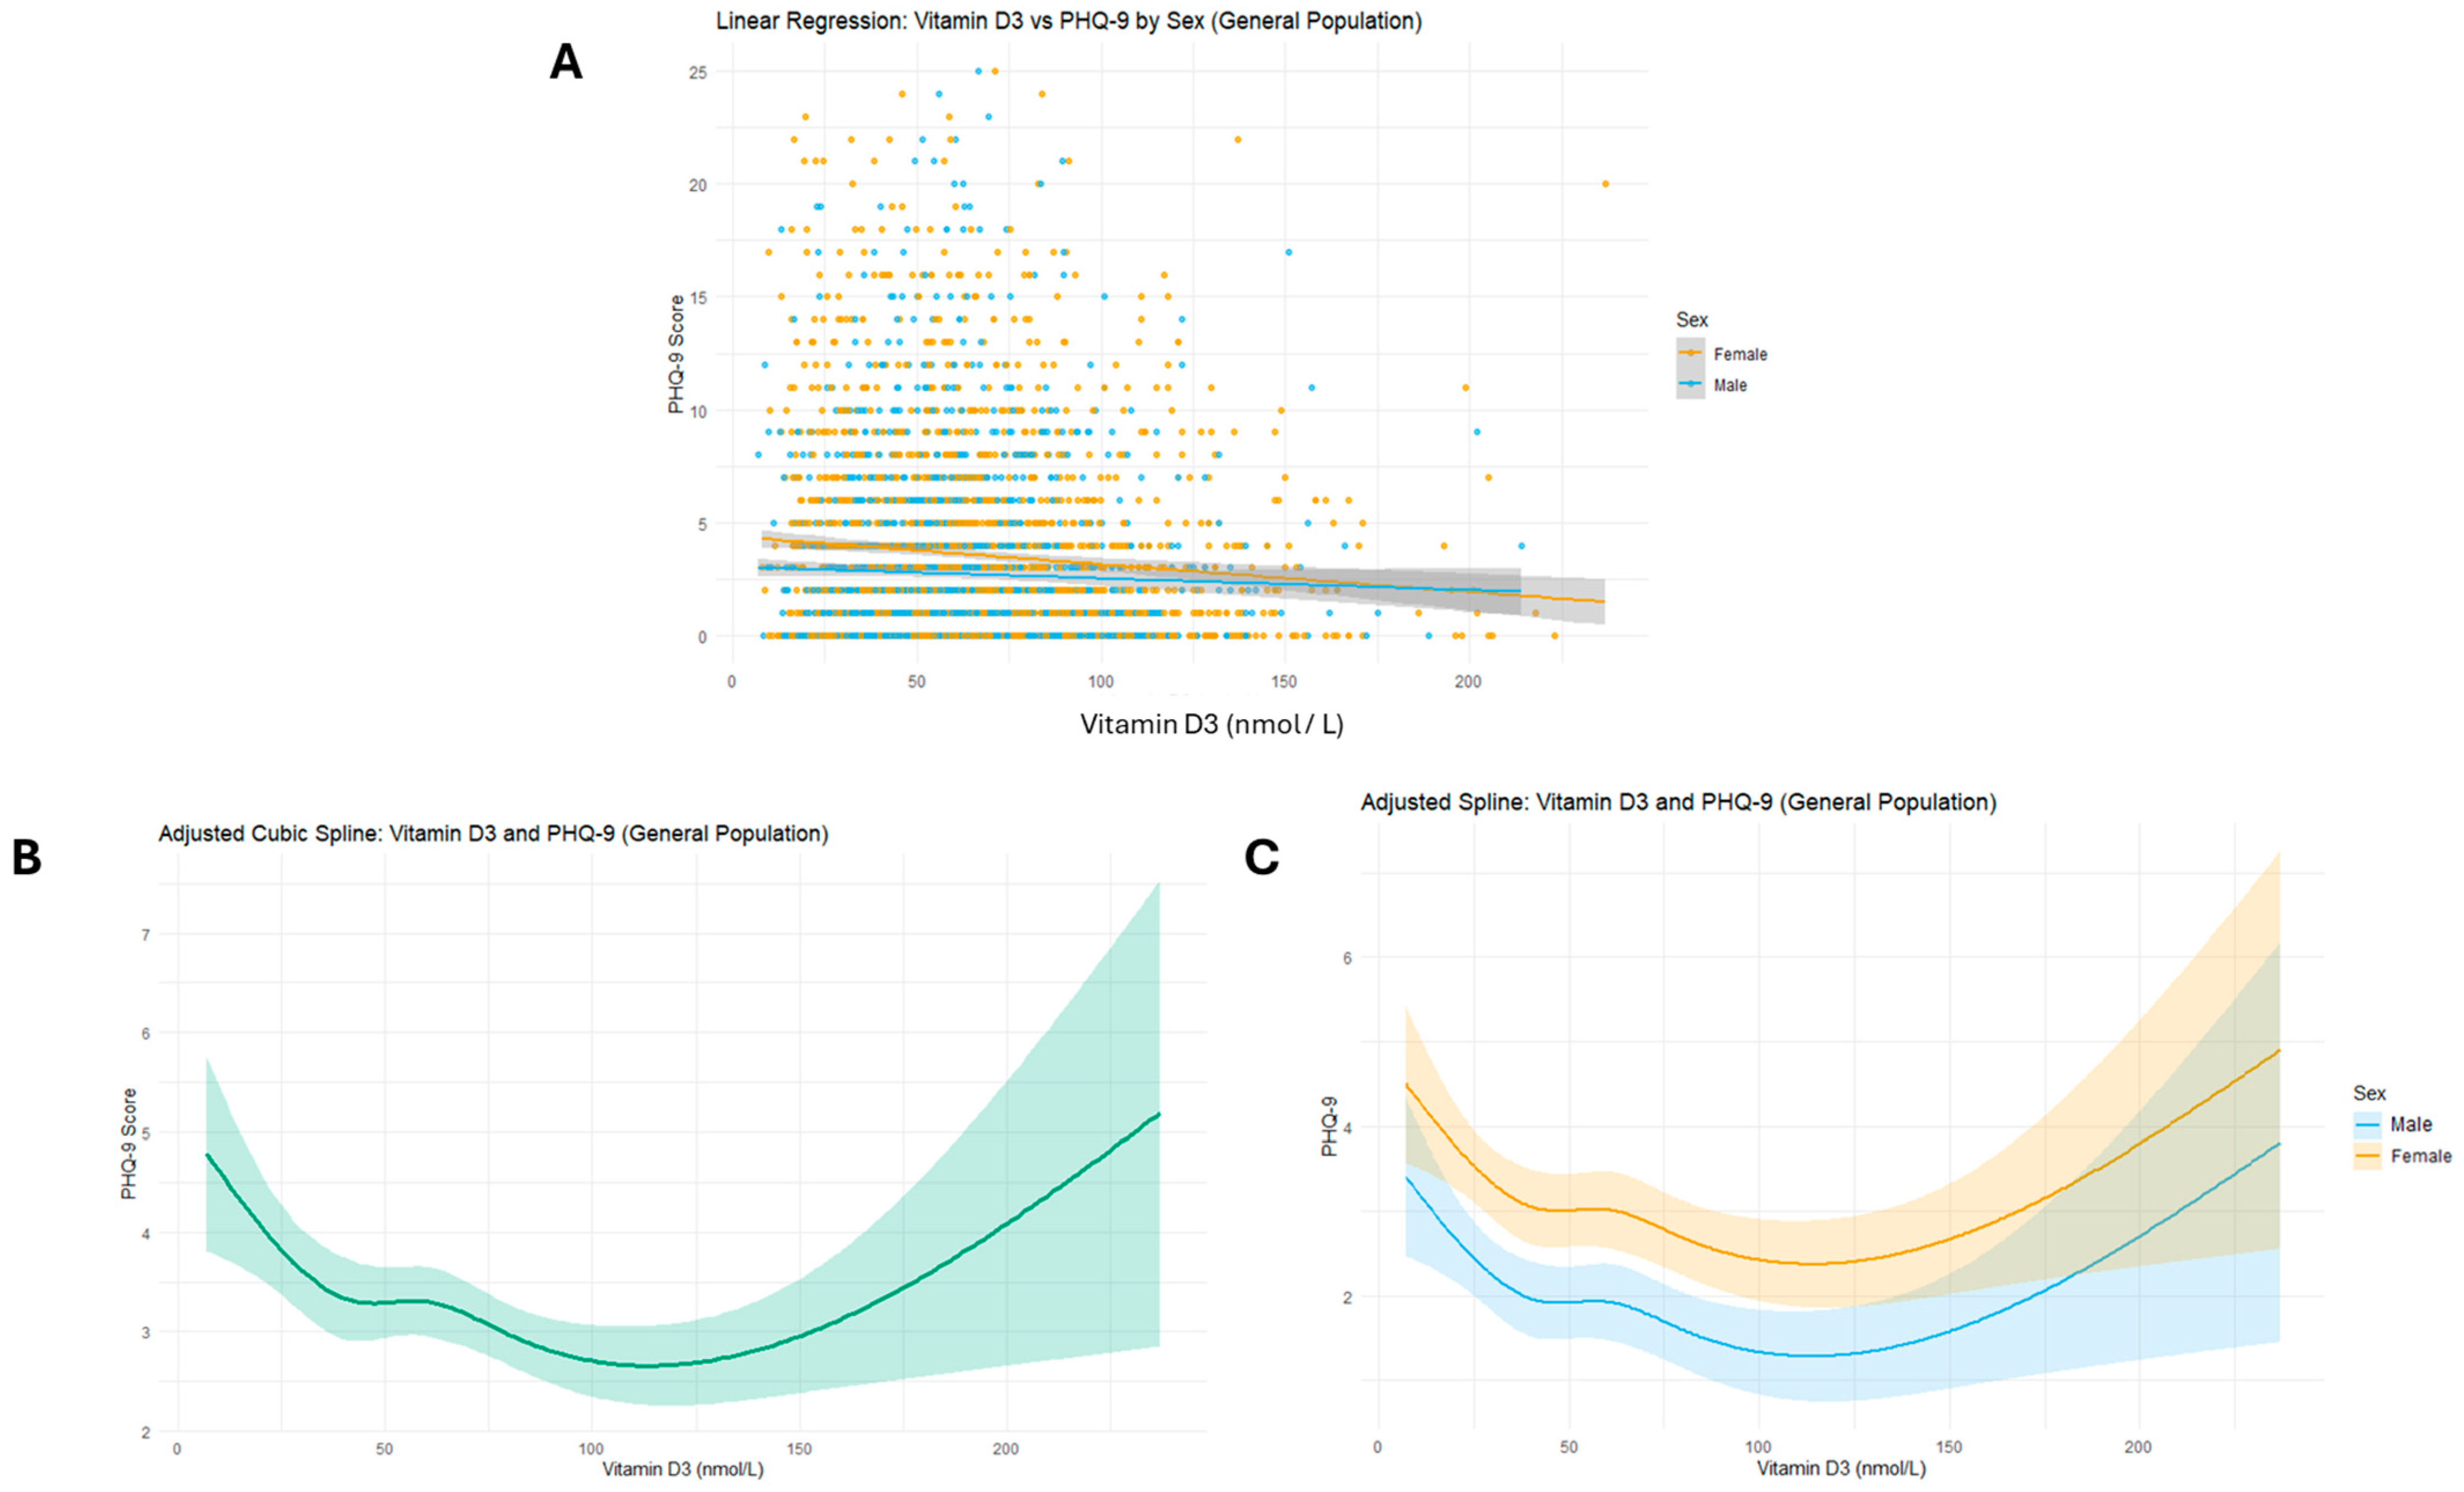
Finally, adjusted cubic spline modeling was employed to characterize the dose–response relationship. The analysis revealed a non-linear pattern: PHQ-9 scores progressively decreased as vitamin D levels approached the optimal physiological range. This adjusted cubic spline model confirmed a highly significant non-linear association between vitamin D3 and PHQ-9 scores in the overall cohort (p < 0.001) (Supplementary Material S2). Beyond this threshold, a plateau or trend reversal was observed, likely attributable to the scarcity of data in the supraphysiological range and the associated dispersion (Figure 4). Notably, unlike the findings in specific sub-populations, this pattern remained homogeneous across sexes in the general population, suggesting a similar functional relationship between vitamin D and depression for both men and women in the overall cohort (Figure 4C).
Figure 4.
Linear and Non-Linear Dose–Response Associations between Serum Vitamin D3 and PHQ-9 Scores. (A) Scatterplot with linear regression lines showing the inverse relationship between vitamin D3 levels (nmol/L) and depression scores, stratified by sex. (B) Adjusted restricted cubic spline analysis for the total cohort, illustrating the non-linear trajectory of PHQ-9 scores across the vitamin D spectrum. The green shaded area represents the 95% confidence interval. (C) Adjusted cubic splines stratified by sex (Blue: Men; Yellow: Women), demonstrating a homogeneous functional pattern in the general population. Models are adjusted for age, BMI, and ethnicity.
3.3. Relationship Between Vitamin D and Depression in Diabetic Patients: Emphasis on Potential Sexual Dimorphism
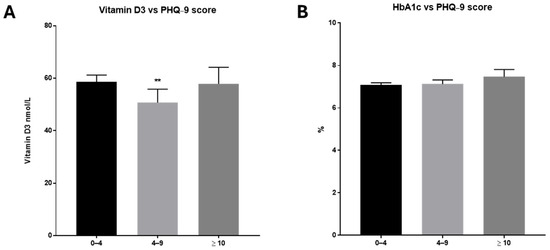
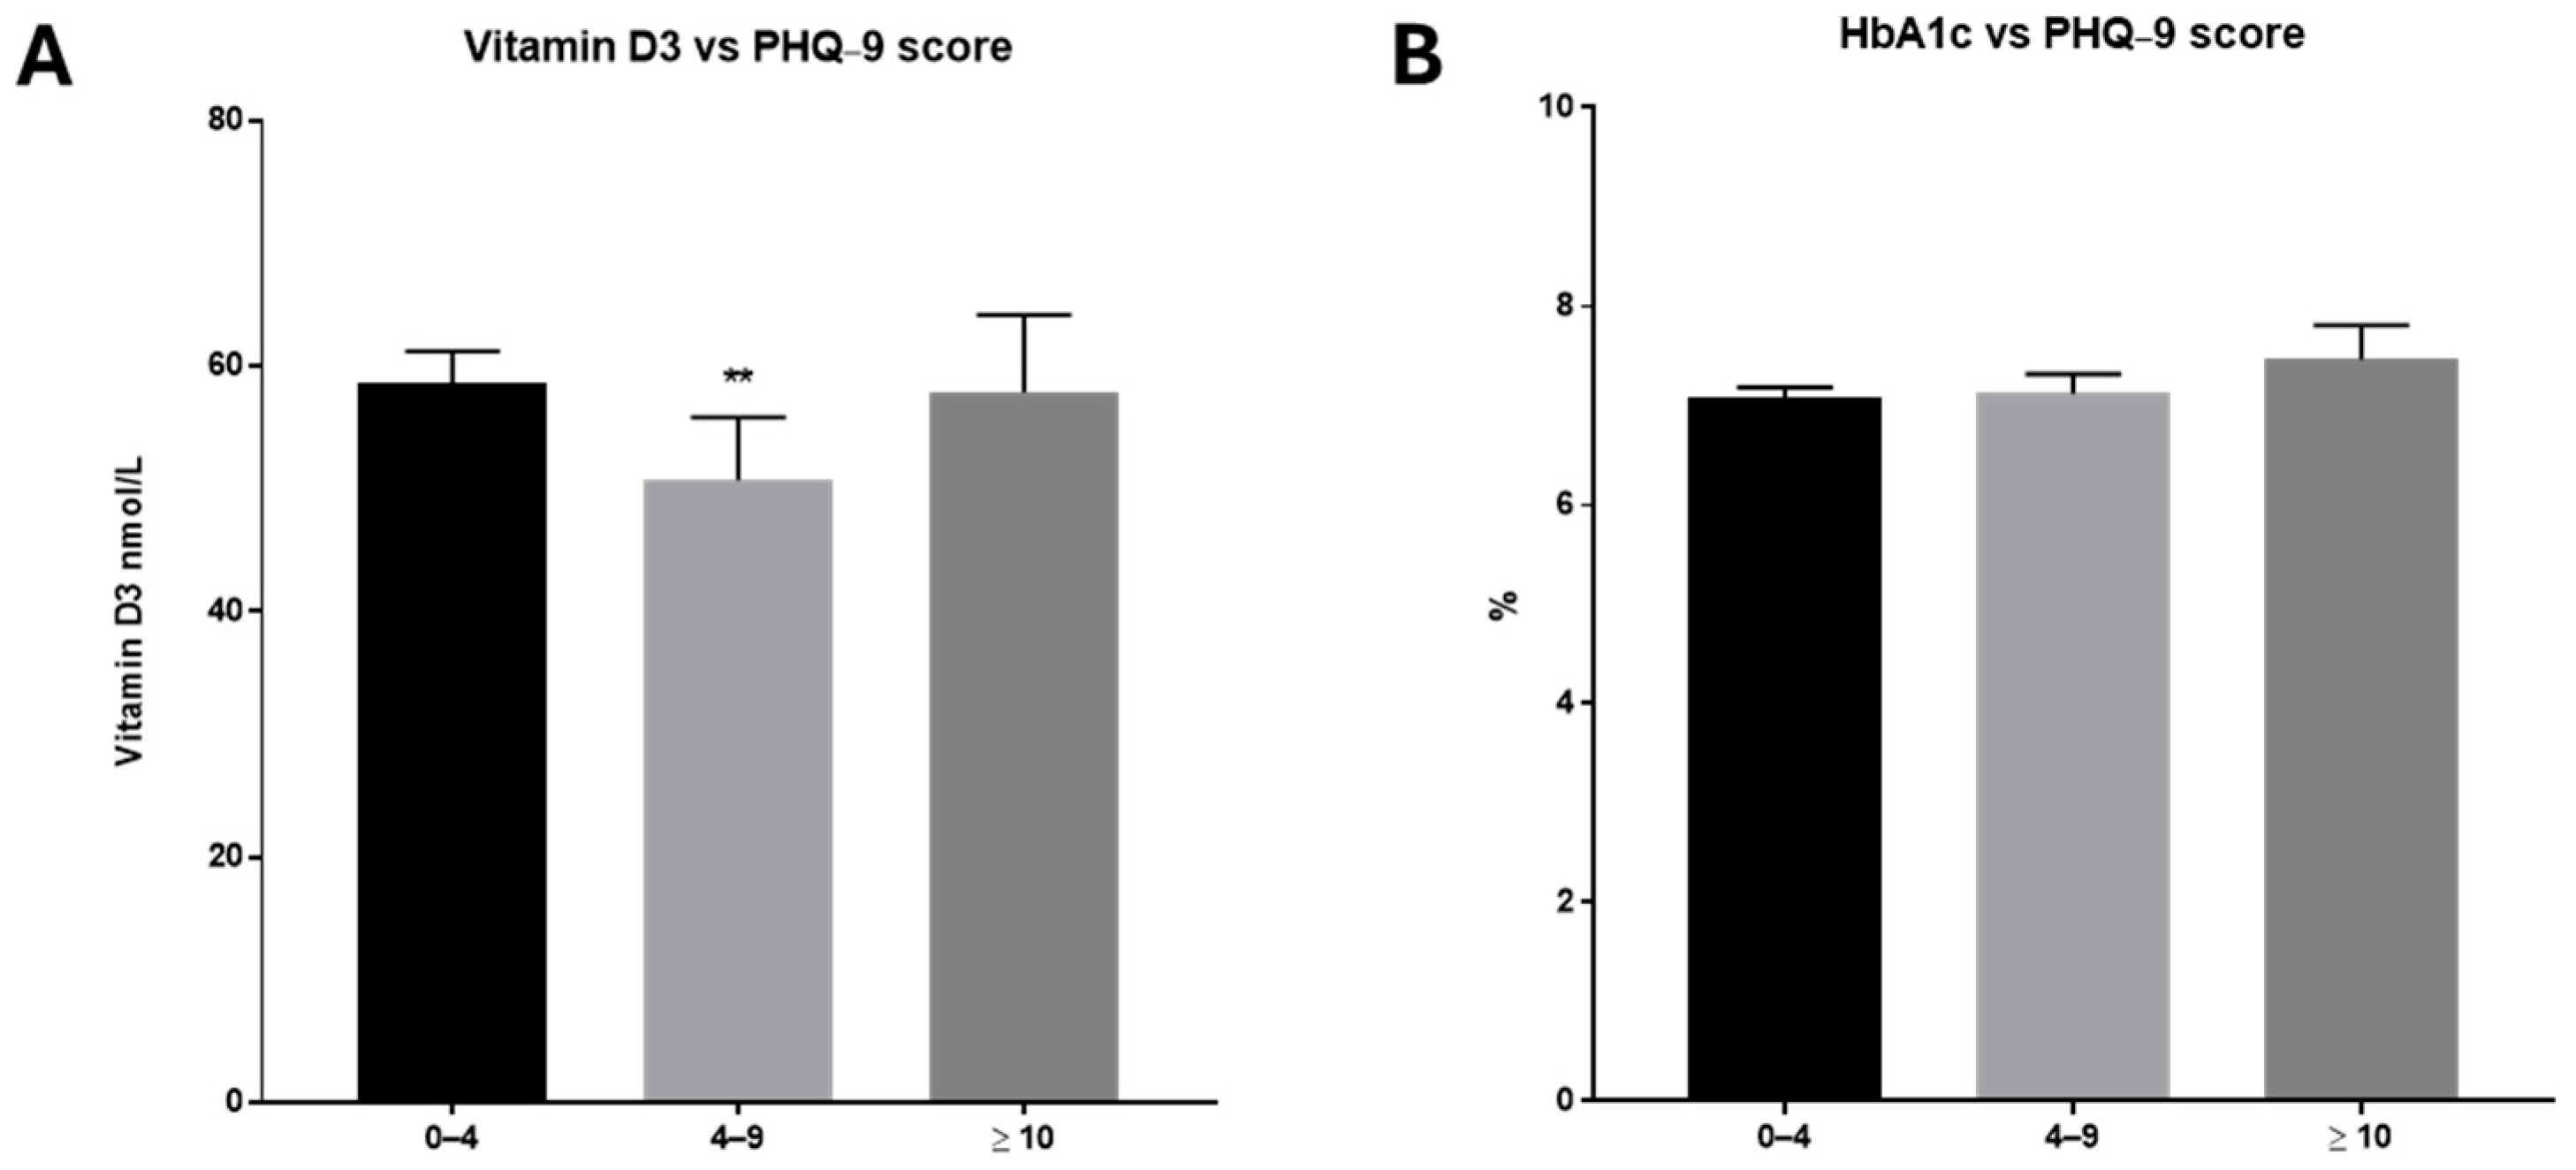
To characterize the link between vitamin D status and mental health specifically within the diabetic cohort (n = 917), we first examined differences across depression severity categories. As illustrated in Figure 5A, diabetic patients with mild depressive symptoms (PHQ-9 score 5–9) exhibited significantly lower serum vitamin D3 levels compared to the asymptomatic group (p < 0.01). However, unlike the pattern observed in the general population, this significant reduction was not evident in the moderate-to-severe group (≥10). Regarding metabolic control, HbA1c levels showed a slight upward trend with increasing depression scores, though differences did not reach statistical significance (Figure 5B).
Figure 5.
Vitamin D3 and Glycated Hemoglobin (HbA1c) Levels by Depression Severity in Diabetic Patients. (A) Mean serum 25(OH)D3 concentrations (nmol/L) stratified by PHQ-9 categories. Significant differences were observed only in the mild depression group (5–9) relative to the asymptomatic reference (0–4). (B) Mean HbA1c percentage across depression categories. Data are presented as mean ± SEM. ** p < 0.01 vs. reference group (0–4).
Correlational analysis (Table 5) corroborated these findings, showing a modest but significant inverse correlation between vitamin D3 and PHQ-9 scores (rho = −0.093, p < 0.05). Additionally, consistent positive correlations were found between depression scores and BMI (rho = 0.185) and serum cotinine (rho = 0.167), reinforcing the impact of lifestyle factors in this population.
Table 5.
Spearman’s Correlation Coefficients in the Diabetic Cohort. Correlations between clinical variables and PHQ-9 scores in patients with diabetes (n = 917). * p < 0.05.
To isolate the effect of vitamin D from these confounders, we performed a multinomial logistic regression (Table 6). The results mirrored the categorical analysis: vitamin D3 emerged as a significant protective factor against mild depression (Model 3: OR = 0.704; 95% CI: 0.513–0.966), but this association lost statistical significance for the moderate-to-severe category (p > 0.05). The regression model also identified a significant association between female sex and higher odds of depressive symptoms: women with diabetes had a more than two-fold increased risk of mild depression (OR = 2.453) compared to men, highlighting sex as a dominant determinant of mental health in this group.
Table 6.
Multinomial Logistic Regression of Vitamin D3 (VD3) and Depression Risk in Diabetes. The dependent variable is the PHQ-9 category, with “None/Minimal” (0–4) serving as the reference group. Vitamin D3 values were log-transformed to normalize distribution prior to analysis. Model 1: Unadjusted individual analysis. Model 2: Adjusted for Age, Ethnicity, Gender, and BMI. Model 3: Fully adjusted model (Model 2 + Hypertension, Dyslipidemia, Diabetes, and Smoking). * p < 0.05.
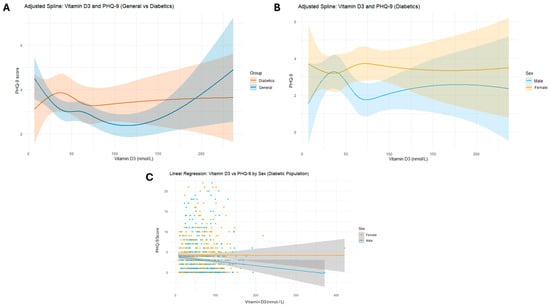
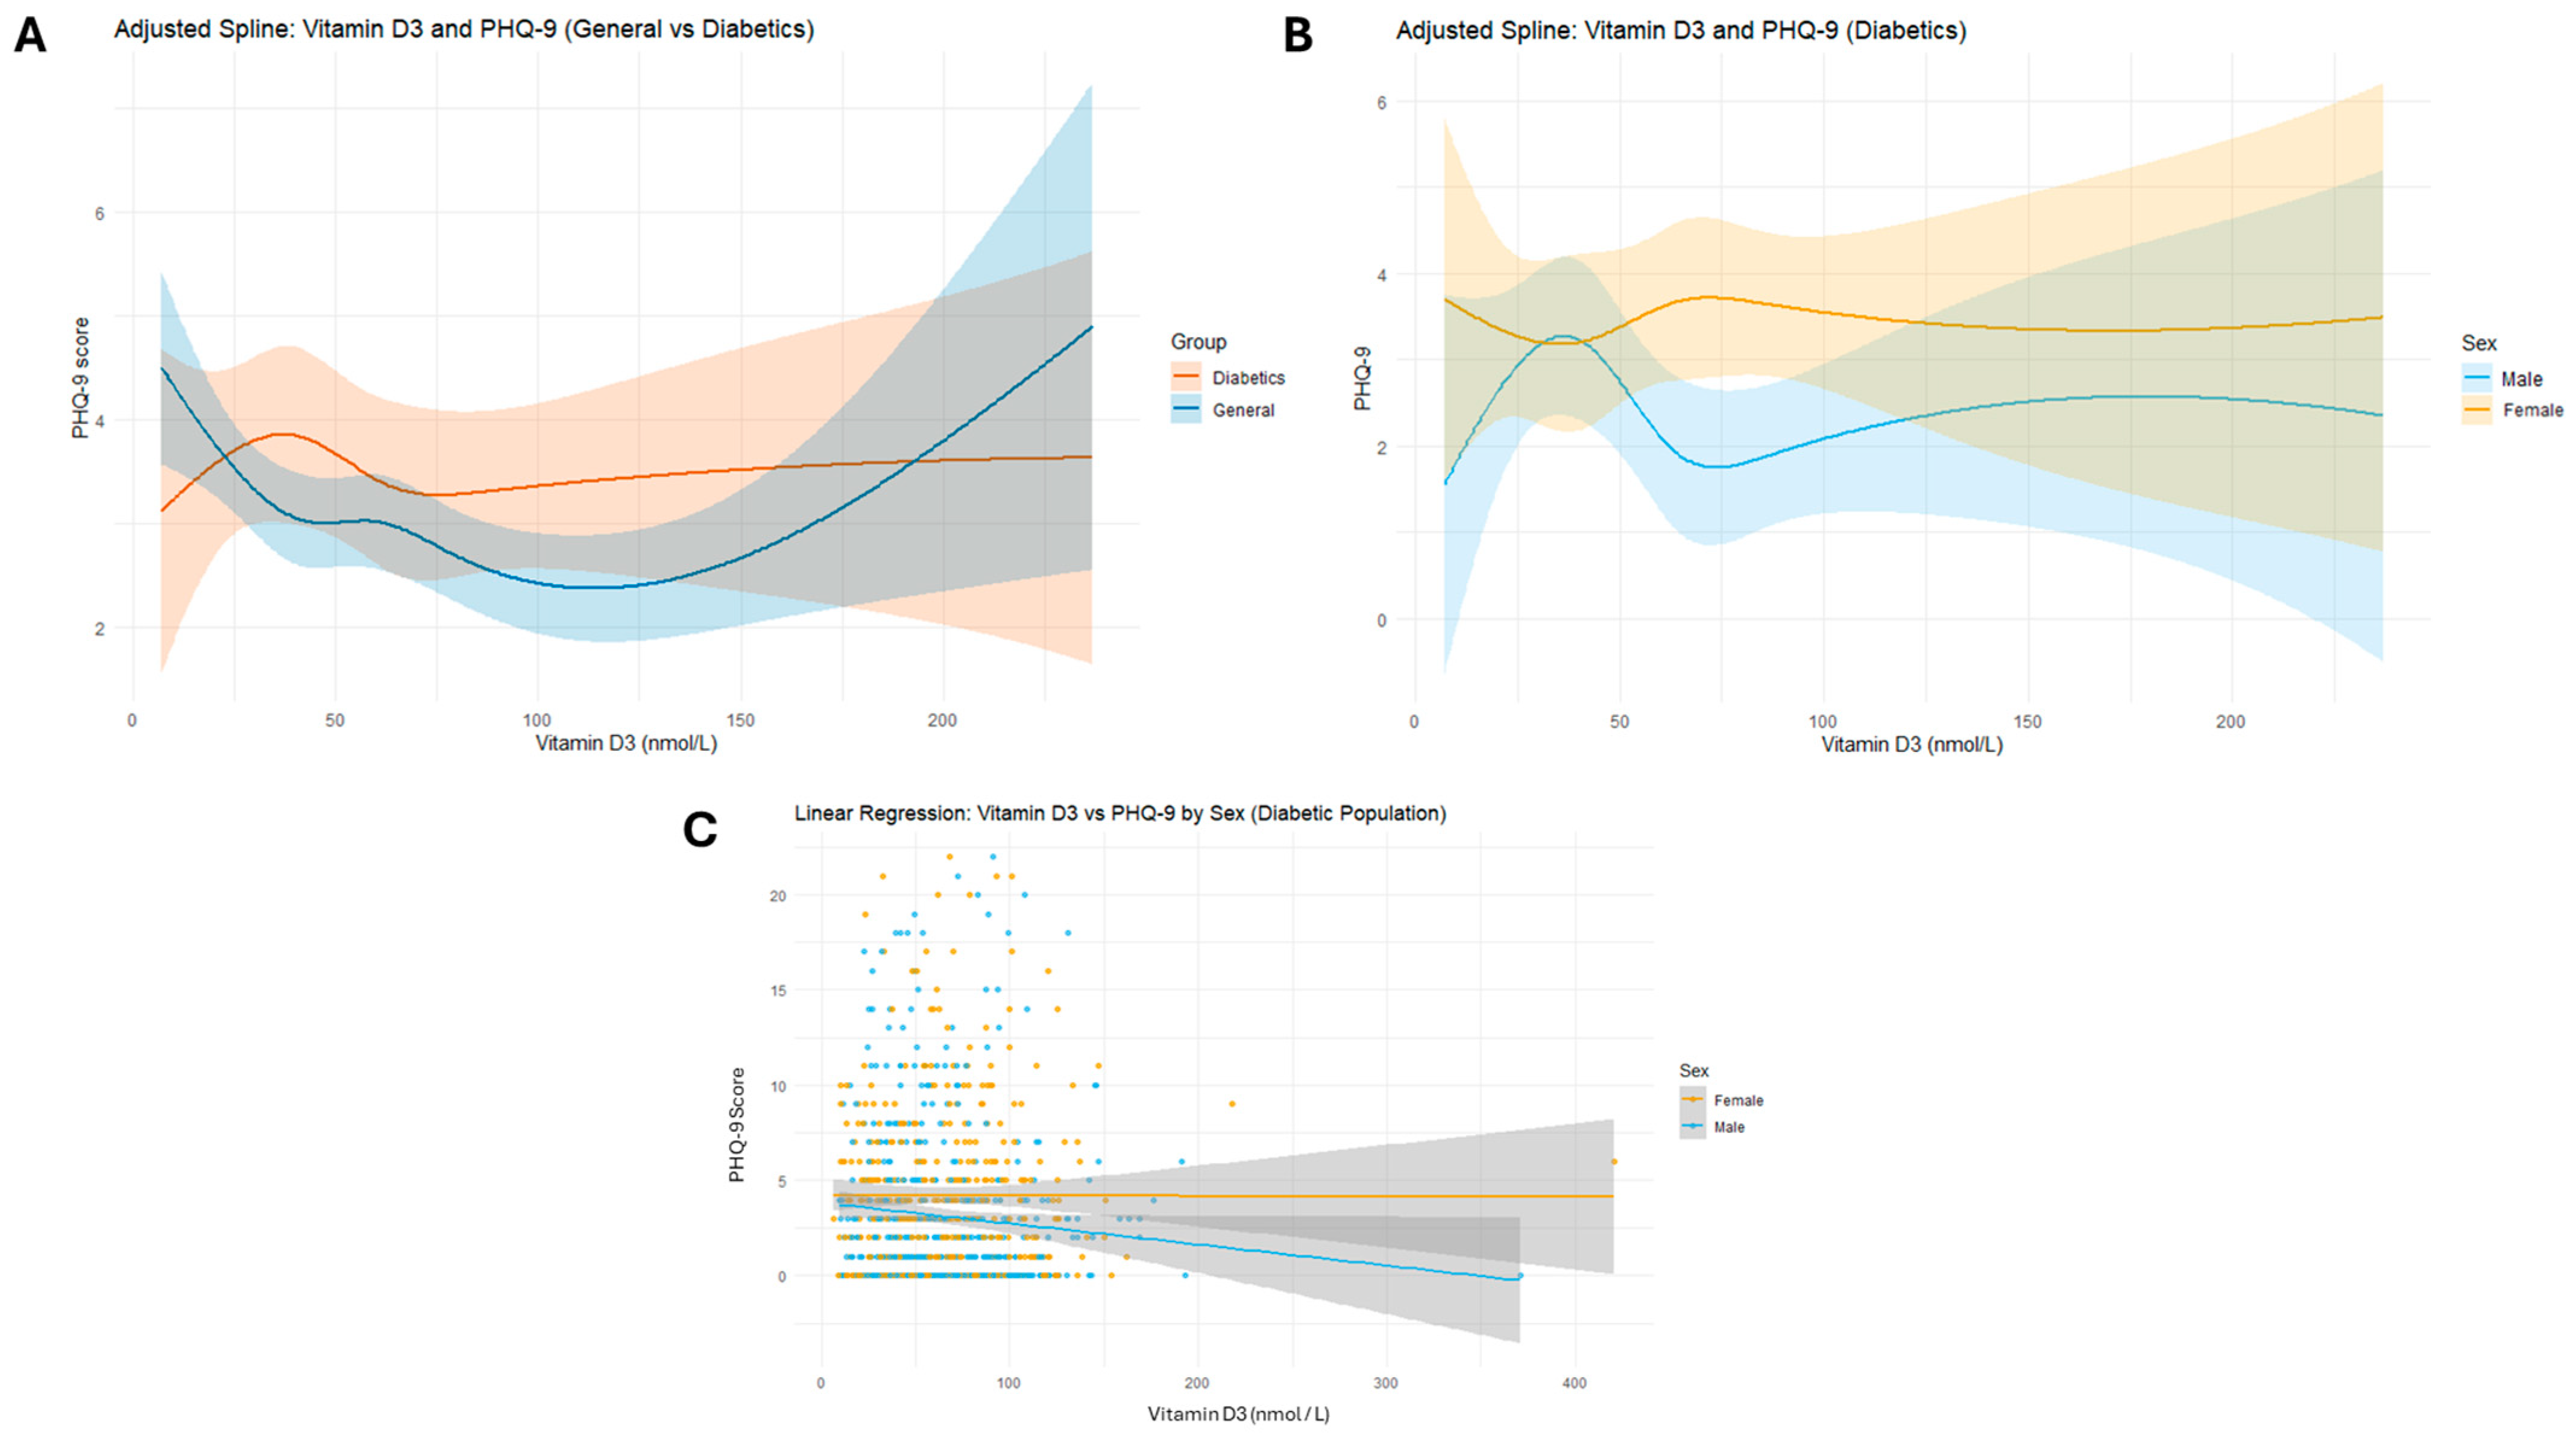
The underlying complexity of these associations was further elucidated using adjusted cubic splines. While the general population showed a relatively homogeneous dose–response curve, the diabetic cohort displayed a distinct pattern (Figure 6A). A formal global interaction test between the vitamin D natural spline and sex in the diabetic cohort yielded a non-significant p-value (p = 0.20) (Supplementary Material S3). As visually evident in the spline models, this attenuation of global significance is primarily due to the curves plateauing and their confidence intervals heavily overlapping at sufficient vitamin D levels (>100 nmol/L). Crucially, however, the trajectories diverge markedly in the hypovitaminosis/deficiency range, motivating a restricted causal mediation analysis to unmask these distinct mechanisms at physiological levels. Stratified spline analysis (Figure 6B) and linear regression (Figure 6C) suggested differential dose–response patterns by sex: the inverse association between vitamin D and depression appeared to be driven primarily by male subjects, particularly in the deficiency range (<100 nmol/L), whereas the curve for women remained largely flat.
Figure 6.
Comparative Dose–Response Analysis: Sexual Dimorphism in Diabetes. (A) Adjusted cubic splines comparing the PHQ-9 trajectory in the General Population (Blue) vs. Diabetic Population (Orange). (B) Sex-stratified adjusted splines within the diabetic cohort, highlighting the non-linear response in men (Blue) versus women (Yellow) below 100 nmol/L. (C) Linear regression scatterplot by sex, confirming the divergence in slopes. The shaded areas represent 95% confidence intervals.
Consequently, in light of these divergent patterns, we concluded that a unified analysis might obscure sex-specific mechanisms. Therefore, subsequent analyses compared results from the pooled cohort of individuals with diabetes with sex-stratified analyses. In addition, to reduce potential bias arising from supraphysiological values, likely attributable to high-dose supplementation, analyses were restricted to participants with serum vitamin D3 concentrations within the physiological range (≤130 nmol/L).
Mediation Analysis: Investigation of Potential Sexual Dimorphism
Building upon the evidence of sexual dimorphism observed in the logistic regression and spline analyses, we proceeded to investigate the underlying mechanisms linking vitamin D status to depressive symptomatology. A GLM mediation framework was employed to test whether BMI mediates the association between vitamin D and depression (PHQ-9). To ensure physiological relevance and minimize bias from high-dose supplementation, the analysis was strictly restricted to diabetic patients with serum vitamin D levels ≤ 130 nmol/L. The analysis was conducted in two stages: first, on the total diabetic population to assess general trends, and second, stratified by sex to disentangle the specific pathways driving the differences observed between men and women.
(A) Analysis of the Total Diabetic Population: Upon applying the mediation model to the entire diabetic cohort with physiological vitamin D levels (N = 886), a significant Total Effect was observed (p = 0.020), confirming a general protective association. However, the decomposition of this effect revealed an indirect association through BMI accounted for the total association in the overall cohort (Supplementary Material S4). Specifically, the Indirect Effect via BMI was statistically significant (Estimate = −0.003, p = 0.021). Vitamin D was negatively associated with BMI (β = −0.185, p < 0.001), which in turn was positively associated with PHQ-9 scores (β = 0.091, p = 0.011). Crucially, after accounting for this metabolic pathway, the Direct Effect of vitamin D on depression lost statistical significance (p = 0.158). Other covariates such as Hypertension (p = 0.003) and Smoking (p < 0.001) remained significant independent predictors of depression, validating the robustness of the model adjustments included in the supplementary analysis.
(B) Sex-Stratified Analysis: Unveiling Distinct Mechanisms
B1. Female Patients: The mediation analysis in the female diabetic cohort (N = 402) revealed a complete lack of association between vitamin D status and depressive symptomatology (Supplementary Material S5). The Total Effect was virtually null (p = 0.852), indicating that vitamin D levels do not predict depression scores in women.
Analysis of the specific pathways clarified why this association fails. Although vitamin D retained a significant inverse relationship with BMI (β = −0.14, p = 0.004), the subsequent link between BMI and depression was not significant (β = 0.05, p = 0.360). Consequently, the Indirect Effect via body weight was non-significant (p = 0.382). Similarly, no direct neurobiological pathway was observed (p = 0.953). These findings suggest that in diabetic women, neither vitamin D fluctuations nor BMI variations within this range are primary drivers of depressive symptoms.
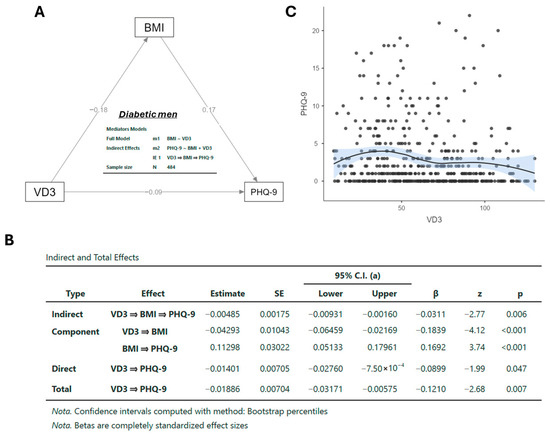
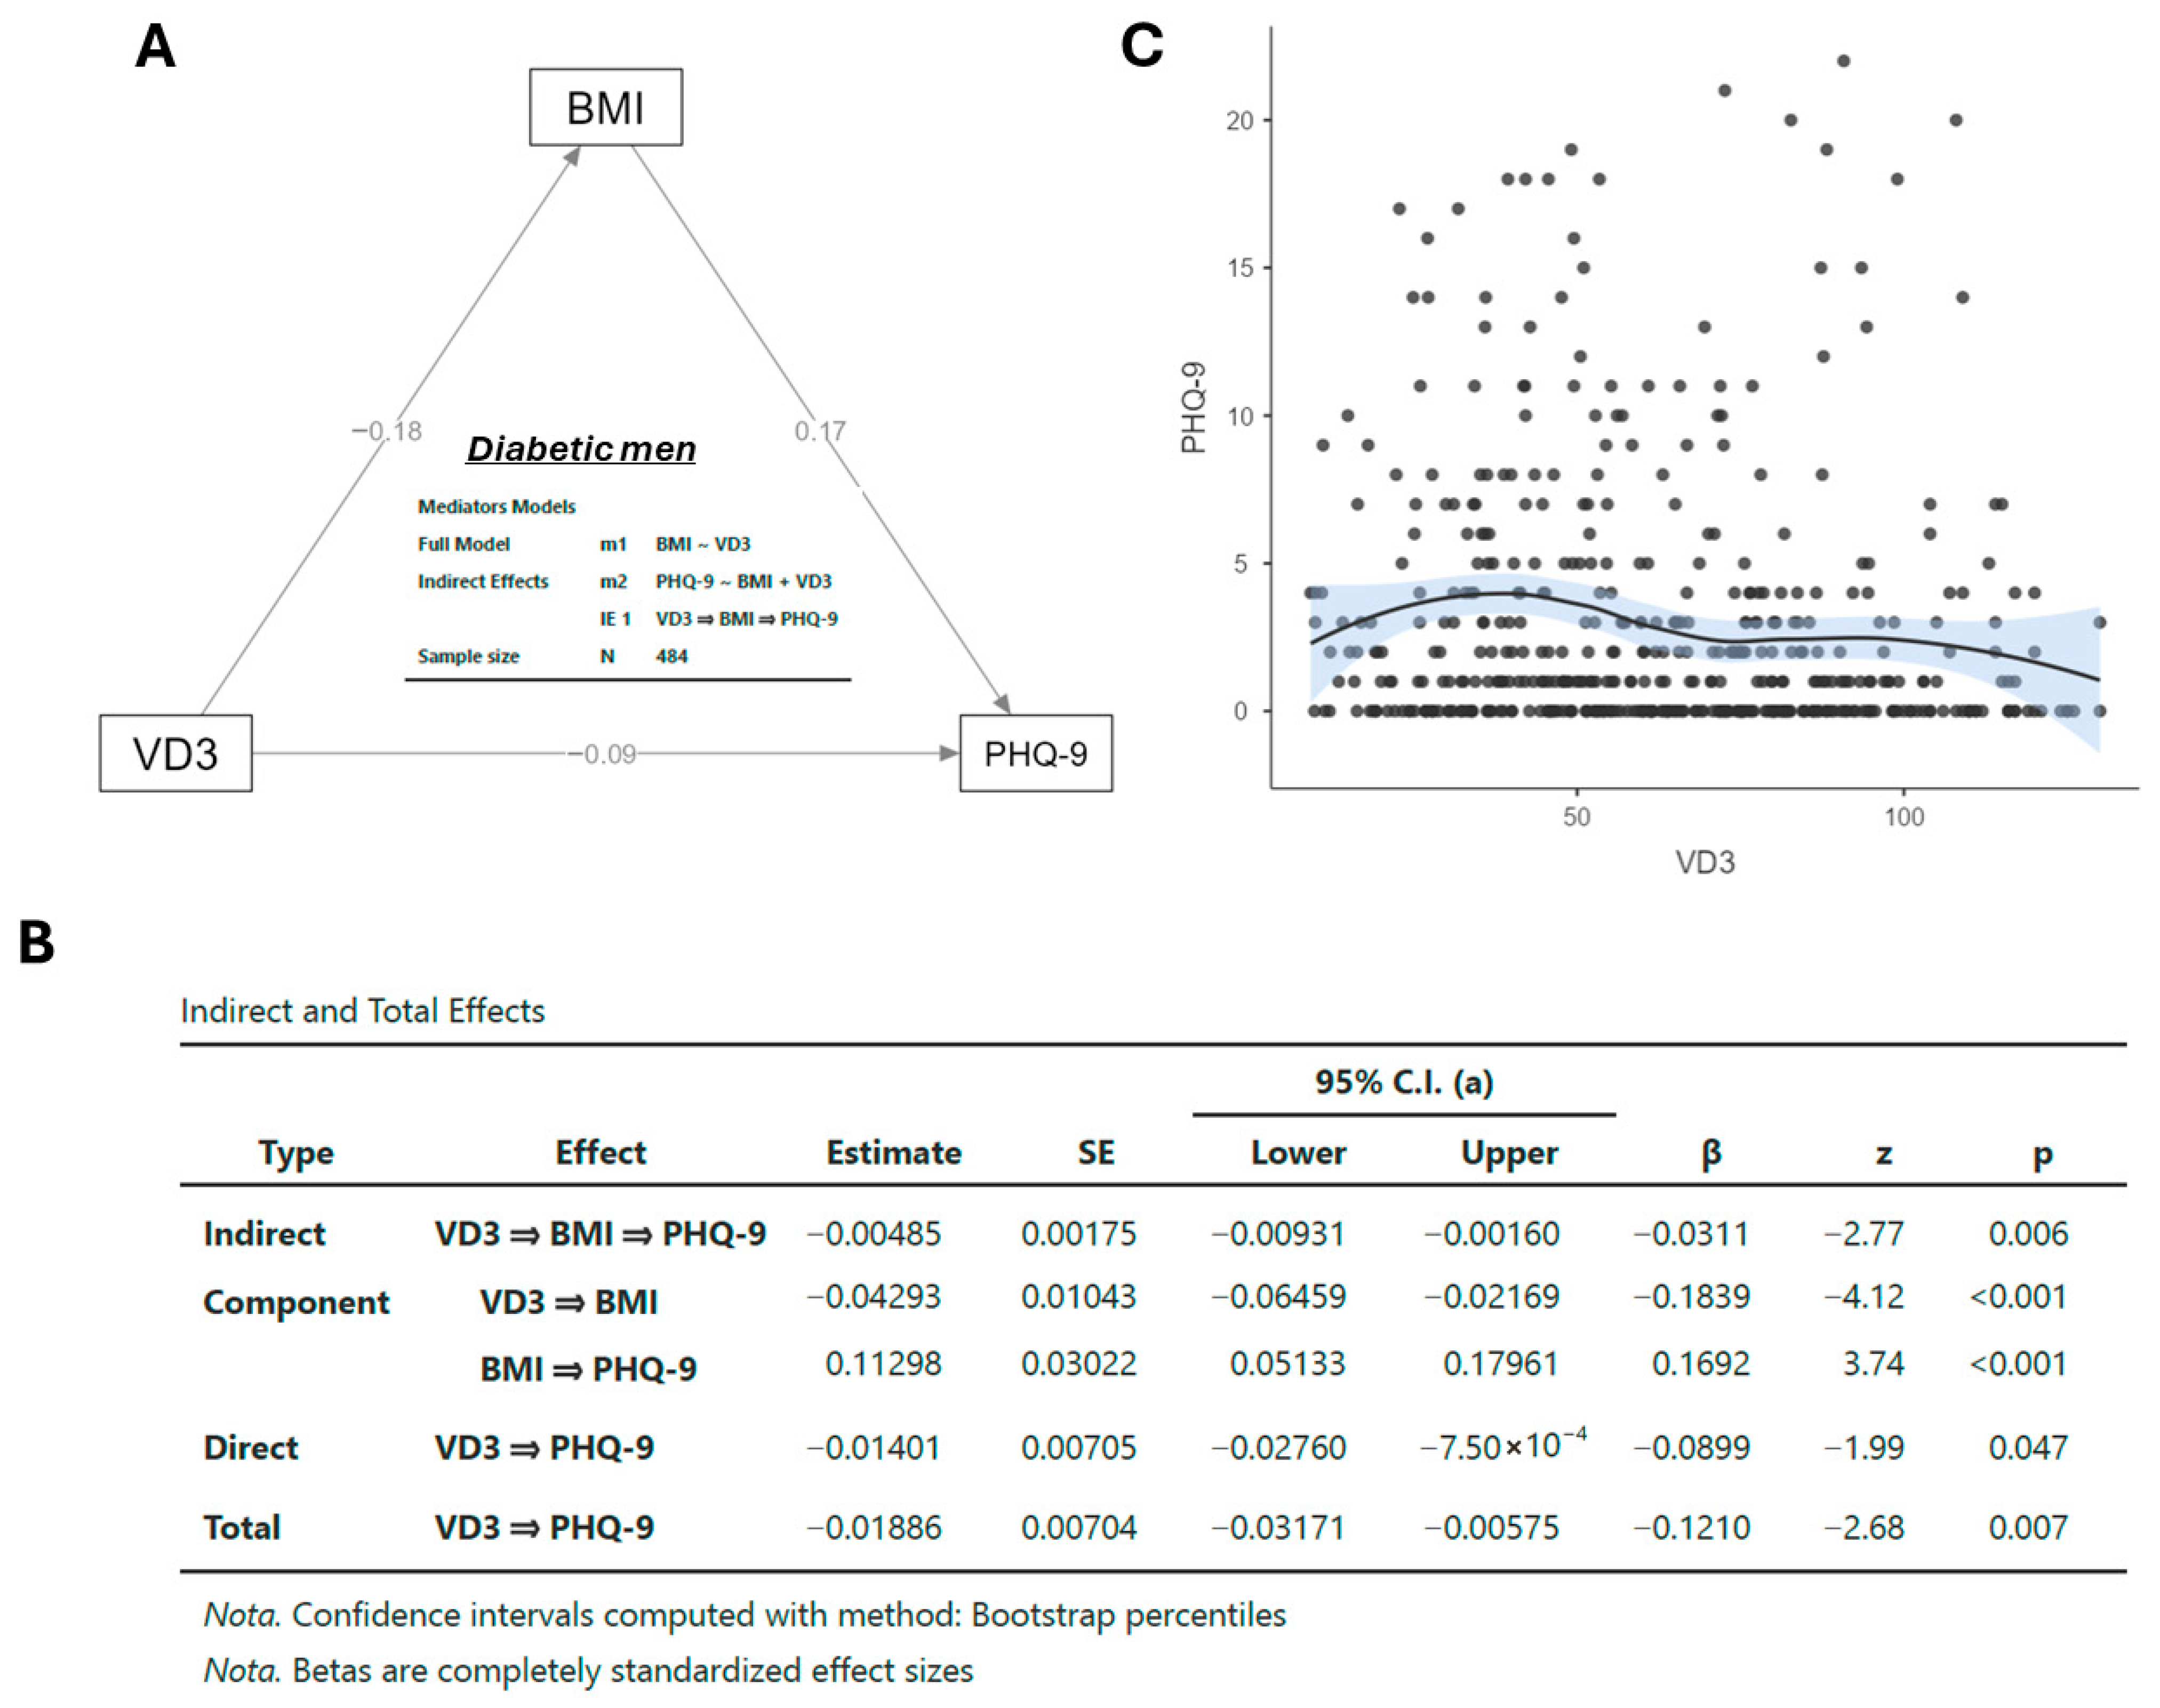
B2. Male Patients: In strict contrast to the female cohort, the analysis of male diabetic patients (N = 484) revealed a protective mechanism. The mediation model identified a significant Total Effect (β = −0.15, p = 0.002), indicating that higher vitamin D levels significantly predict lower depression scores in men (Supplementary Material S6). Among men, both indirect and direct associations were observed after adjustment for BMI:
- Indirect Pathway (Metabolic): Vitamin D exerted a significant negative effect on BMI (p < 0.001), which in turn was positively associated with PHQ-9 scores (p = 0.013). This specific indirect path was statistically significant (Estimate = −0.005, p = 0.024), confirming that a portion of the total effect is mediated by weight regulation.
- Direct Pathway: Most notably, even after accounting for the BMI mediator, the Direct Effect of vitamin D on depression remained statistically significant (Estimate = −0.016, p = 0.034).
To visually illustrate the fundamental architecture of these relationships, Figure 7 presents the conceptual path diagram derived from the unadjusted analysis. This simplified model highlights the intrinsic strength of the associations, confirming that the partial mediation structure, comprising both the indirect metabolic route (p = 0.006) and the direct association independent of BMI (p = 0.047) is a consistent pattern observed in male participants that persists even before covariate adjustment (Figure 7).
Figure 7.
Path Diagram of the Mediation Analysis in Male Diabetic Patients. Statistical diagram illustrating the partial mediation model in men (n = 484) with physiological vitamin D levels (≤130 nmol/L). (A) The model suggests two active pathways: an indirect metabolic path via Body Mass Index (BMI) and a direct path independent of weight. (B) Table of effects showing that both the Indirect Effect (p = 0.006) and the Direct Effect (p = 0.047) are statistically significant, confirming partial mediation. (C) Linear regression scatterplot with 95% confidence intervals visualizing the inverse relationship between Vitamin D3 and PHQ-9 scores. Values in the diagram represent standardized beta coefficients.
4. Discussion
To our knowledge, this study provides the first evidence of sexual dimorphism in the relationship between vitamin D and depressive symptoms in patients with type 2 diabetes. We further examined the non-linear associations among vitamin D status, BMI, and depression using restricted cubic spline models. This strategy goes beyond the predominantly linear approaches described in previous studies [30,31], revealing both a threshold effect and sex-specific mechanisms linking nutritional status to mental health.
In an initial analysis, the association between vitamin D status and depression revealed an inverse relationship between these two variables, in line with findings previously reported by other authors, including Ganji et al. and Chung et al. [30,31]. Nevertheless, most prior studies have examined this association using predominantly linear models and without accounting for potential confounding or interacting factors, which constrains insight into the underlying biological mechanisms. By contrast, the present study offers a more nuanced interpretation by applying a non-linear analytical framework based on cubic spline modeling, enabling the identification of a curvilinear pattern in the vitamin D–depression relationship. This methodological approach is consistent with observations by Chung et al. [30], who reported a threshold effect of vitamin D among Korean adults, whereby individuals with serum concentrations below 50 nmol/L exhibited a higher likelihood of depressive symptoms. In addition, female sex, hazardous alcohol consumption, smoking, and weight loss were also associated with an increased prevalence of depressive symptomatology.
In addition, the protective association between vitamin D3 and depressive symptoms appeared to be confined to individuals with mild symptomatology and was not observed in those with moderate-to-severe depression. This pattern deserves careful interpretation. From a clinical perspective, vitamin D deficiency may act as a vulnerability factor contributing to low mood, fatigue, and subclinical affective disturbances; however, once depressive symptomatology reaches moderate or severe intensity, it is likely driven by more complex psychiatric, genetic, and psychosocial determinants that outweigh the contribution of nutritional factors. Moreover, individuals with more severe depression are more likely to receive pharmacological treatment (e.g., selective serotonin reuptake inhibitors), which may mask or interact with the subtler neurobiological effects of endogenous vitamin D. We also acknowledge that the moderate-to-severe subgroup was smaller, potentially limiting statistical power.
A particularly innovative aspect of the present study is the assessment of BMI as a mediating factor, a dimension that has received limited attention in prior research on the vitamin D–mental health relationship. Although earlier studies have reported that BMI may affect vitamin D bioavailability [32,33] and that obesity is linked to increased rates of depression [34,35], these factors have rarely been examined simultaneously within a single analytical framework. Mediation analyses in this context remain especially scarce, and, to our knowledge, no previous investigations have specifically explored sex-stratified mediation pathways linking vitamin D status, BMI, and depressive symptoms in individuals with diabetes.
Our mediation analysis confirmed that BMI mediates the association between vitamin D and depression, a finding consistent with the ‘sequestration hypothesis’ of Wortsman et al. [32], which indicates that vitamin D, being fat-soluble, is preferentially stored in adipose tissue, thereby reducing circulating bioavailability in individuals with elevated BMI. In the context of type 2 diabetes, where obesity is highly prevalent, this mechanism is particularly relevant: vitamin D deficiency may exacerbate the pro-inflammatory state characteristic of adiposity, marked by elevated circulating IL-6 and TNF-α levels, a well-documented pathophysiological pathway implicated in depressive pathogenesis. Consequently, our model suggests that in the general diabetic population, correcting vitamin D deficiency may alleviate depressive symptoms modulating this metabolic-inflammatory axis.
However, the most interesting finding of this study emerged upon sex stratification, revealing a distinct biological dimorphism. In male patients, vitamin D exerted a protective effect through a dual mechanism: an indirect pathway via BMI and, notably, a significant direct pathway that remained significant even after adjusting for adiposity, ethnicity, and cardiovascular risk factors. This male-specific direct effect may be biologically plausible through the vitamin D-testosterone axis [36]. Hypogonadism is a common comorbidity in men with type 2 diabetes and is closely linked to mood disturbances, fatigue, and reduced libido. Since vitamin D is essential for testosterone synthesis in Leydig cells, and given that testosterone derivatives exert neuroprotective effects in diabetic neuropathy, we hypothesize that adequate vitamin D status in men may be linked to neuroprotection by supporting androgen levels, a mechanism that would explain the persistence of the direct effect even after adjusting for BMI and other confounders [37,38].
In sharp contrast, the association between vitamin D and depressive symptoms was attenuated in the female cohort, with no significant direct or indirect effects observed. This discrepancy suggests that the neuroprotective potential of vitamin D in women may be modulated by a more complex hormonal interplay, specifically, a dependence on estrogen-mediated cofactors rather than a true absence of protective mechanisms. Animal models have demonstrated that 17β-estradiol is required to synergize with vitamin D to exert antidepressant effects in the brain [39]. The underlying mechanism involves estrogen-dependent upregulation of renal 1α-hydroxylase, the enzyme responsible for converting circulating 25(OH)D into its active form, 1,25(OH)2D [40,41]. Given that the average age of women in our diabetic cohort (approx. 58 years) implies a high prevalence of post-menopausal status, the physiological decline in estradiol impairs this coordinated hormonal signaling [42].
The murine model developed by Zhang et al. [39] elucidates the mechanistic basis of this estrogen-vitamin D dependency. Vitamin D and 17β-estradiol work synergistically in the hippocampus to alleviate depressive symptoms through reciprocal upregulation of their respective nuclear receptors (VDR, ERα, ERβ), thereby amplifying the vitamin D signaling cascade. Both compounds converge on the AMPK/NF-κB axis, the central regulatory pathway governing neuroinflammation, reducing pro-inflammatory cytokines implicated in depression (IL-1β, IL-6, TNF-α) and associated neuroinflammatory mediators (iNOS, COX-2), while simultaneously suppressing neuronal apoptosis and restoring hippocampal synaptic integrity. Critically, this synergistic neuroprotection depends on simultaneous hormonal sufficiency; the absence of estradiol renders vitamin D signaling incomplete, explaining the epidemiological null findings of LeBlanc et al. [41] not as evidence against vitamin D neuroprotection, but rather as a demonstration that vitamin D’s antidepressant potential cannot be actualized without adequate estrogen.
Limitations
This study has several limitations that should be considered. Due to the cross-sectional design of the National Health and Nutrition Examination Survey, temporal relationships and causal inferences cannot be established, and the mediation analyses should be interpreted as statistical associations rather than evidence of directional mechanisms. The final analytic sample was derived using complete-case criteria, and the participant flow diagram has been clarified to explicitly detail the exclusion steps; although this approach ensures internal consistency, some degree of selection bias cannot be entirely excluded. Diabetes classification incorporated self-reported diagnosis, medication use, fasting plasma glucose, and HbA1c levels according to established criteria; because fasting glucose is obtained from a subsample in NHANES, regression models were adjusted for clinically relevant covariates without applying fasting subsample weights, and findings should therefore be interpreted as internally valid associations within the analytic sample rather than nationally weighted estimates. Although key demographic and cardiometabolic confounders were included, residual confounding from unmeasured factors—such as socioeconomic status, physical activity, seasonal variation in vitamin D levels, inflammatory markers, or antidepressant treatment—cannot be completely excluded. Furthermore, data on post-menopausal status and recent weight change were not incorporated into our models; future longitudinal research should evaluate these factors. Additionally, the magnitude of the inverse association between vitamin D and depressive symptoms was modest and was more evident in mild depression categories, and sex-stratified analyses, while supported by formal interaction testing, should be considered exploratory given reduced subgroup sample sizes. Overall, the results provide adjusted observational evidence of sex-specific association patterns, but prospective studies are warranted to confirm these findings.
5. Conclusions
In this cross-sectional analysis of adults with type 2 diabetes from the National Health and Nutrition Examination Survey 2017–2018 cycle, serum vitamin D levels were modestly and inversely associated with depressive symptom burden. Regression-based mediation analysis suggested that body mass index statistically accounted for this association in the overall diabetic cohort. In sex-stratified analyses, differential association patterns were observed, with significant total and indirect associations among men, whereas no statistically significant associations were detected among women.
These findings suggest that the relationship between vitamin D status and depressive symptoms in type 2 diabetes may vary by sex and may be partly related to adiposity. However, given the cross-sectional design and the modest magnitude of the observed associations, these results should be interpreted cautiously. Prospective studies are needed to clarify temporality, explore potential biological and behavioral mechanisms, and determine whether vitamin D status has clinically meaningful implications for depressive symptoms in this population.
Supplementary Materials
The following supporting information can be downloaded at: https://www.mdpi.com/article/10.3390/diabetology7040077/s1, Supplementary Material S1: STROBE Checklist for Cross-Sectional Studies. Supplementary Material S2: Multivariable Natural Cubic Spline Regression Model (df = 4) evaluating the association between serum Vitamin D3 and PHQ-9 depression scores in the General Population, adjusted for sociodemographic and clinical covariates. Supplementary Material S3: Multivariable Natural Cubic Spline Regression Model (df = 4) including a global interaction test (Vitamin D3 × Sex) to evaluate the association between serum Vitamin D3 and PHQ-9 depression scores in the Diabetic Cohort. Supplementary Material S4: Fully adjusted mediation analysis in the total diabetic cohort (N = 886) with physiological vitamin D levels (≤130 nmol/L). Path Diagram: Visual representation of relationships between Vitamin D3 (VD3), Body Mass Index (BMI), and Depression (PHQ9), adjusted for Age, Ethnicity, Hypertension (HT), Dyslipidemia (DIS), and Smoking (SMOKE). Indirect and Total Effects: Table confirming the significance of the indirect path via BMI and the non-significance of the direct effect. Supplementary Material S5: Fully adjusted mediation analysis stratified in diabetic women (N = 402) with physiological vitamin D levels (≤130 nmol/L). Path Diagram: Visual representation of relationships between Vitamin D3 (VD3), Body Mass Index (BMI), and Depression (PHQ9), adjusted for Age, Ethnicity, Hypertension (HT), Dyslipidemia (DIS), and Smoking (SMOKE). Indirect and Total Effects: Table confirming the significance of the indirect path via BMI and the non-significance of the direct effect. Supplementary Material S6: Fully adjusted mediation analysis stratified in diabetic men (N = 484) with physiological vitamin D levels (≤130 nmol/L). Path Diagram: Visual representation of relationships between Vitamin D3 (VD3), Body Mass Index (BMI), and Depression (PHQ9), adjusted for Age, Ethnicity, Hypertension (HT), Dyslipidemia (DIS), and Smoking (SMOKE). Indirect and Total Effects: Table confirming the significance of the indirect path via BMI and the non-significance of the direct effect.
Author Contributions
Conceptualization, R.M.-G.-T.; methodology, R.M.-G.-T.; software, R.M.-G.-T.; validation, R.M.-G.-T. and M.H.-L.; formal analysis, R.M.-G.-T. and M.H.-L.; investigation, R.M.-G.-T. and M.H.-L.; resources, R.M.-G.-T.; data curation, R.M.-G.-T.; writing—original draft preparation, R.M.-G.-T. and M.H.-L.; writing—review and editing, R.M.-G.-T., M.H.-L., R.R.-C., M.G.-A. and A.S.-M.; visualization, R.M.-G.-T.; supervision, R.M.-G.-T.; project administration, R.M.-G.-T. All authors have read and agreed to the published version of the manuscript.
Funding
This research received no external funding.
Institutional Review Board Statement
Ethical review and approval were waived for this study because it involved the analysis of publicly available, de-identified data from the NHANES cohort. The original data collection was conducted in accordance with the Declaration of Helsinki and approved by the National Center for Health Statistics (NCHS) Research Ethics Review Board.
Informed Consent Statement
Patient consent was waived for this secondary analysis as it utilized publicly available, de-identified data. Informed consent was obtained from all subjects involved in the original NHANES data collection.
Data Availability Statement
Publicly available datasets were analyzed in this study. This data can be found here: https://wwwn.cdc.gov/nchs/nhanes/continuousnhanes/default.aspx?BeginYear=2017 (accessed on 15 March 2025).
Acknowledgments
The authors wish to thank the National Center for Health Statistics (NCHS) of the Centers for Disease Control and Prevention (CDC) for the design, data collection, and public dissemination of the NHANES datasets. We extend our sincere gratitude to all the volunteers who participated in the NHANES cohort and to all the staff members involved in its execution and transparent publication; thanks to their dedication and commitment, science can continue to move in the right direction.
Conflicts of Interest
The authors declare no conflicts of interest.
Abbreviations
The following abbreviations are used in this manuscript:
| DM | Diabetes mellitus |
| T2DM | Type 2 diabetes mellitus |
| VDR | Vitamin D receptor |
| NHANES | National Health and Nutrition Examination Survey |
| HbA1c | Glycated hemoglobin |
| 25(OH)D3 | 25-hydroxyvitamin D3 |
| LC–MS/MS | Liquid chromatography–tandem mass spectrometry |
| CDC | Centers for Disease Control and Prevention |
| PHQ-9 | Patient Health Questionnaire-9 |
| BMI | Body mass index |
| RCS | Restricted cubic spline |
| GLM | General Linear Model |
| VD3 | Vitamin D3 |
References
- Duncan, B.B.; Magliano, D.J.; Boyko, E.J. IDF Diabetes Atlas 11th Edition 2025: Global Prevalence and Projections for 2050. Nephrol. Dial. Transpl. 2025, 41, 7–9. [Google Scholar] [CrossRef] [Scilit] [PubMed]
- Butt, M.D.; Ong, S.C.; Rafiq, A.; Kalam, M.N.; Sajjad, A.; Abdullah, M.; Malik, T.; Yaseen, F.; Babar, Z.U.D. A Systematic Review of the Economic Burden of Diabetes Mellitus: Contrasting Perspectives from High and Low Middle-Income Countries. J. Pharm. Policy Pract. 2024, 17, 2322107. [Google Scholar] [CrossRef] [Scilit] [PubMed]
- Ismail, L.; Materwala, H.; Al Kaabi, J. Association of Risk Factors with Type 2 Diabetes: A Systematic Review. Comput. Struct. Biotechnol. J. 2021, 19, 1759–1785. [Google Scholar] [CrossRef] [Scilit]
- Dendup, T.; Feng, X.; Clingan, S.; Astell-Burt, T. Environmental Risk Factors for Developing Type 2 Diabetes Mellitus: A Systematic Review. Int. J. Environ. Res. Public Health 2018, 15, 78. [Google Scholar] [CrossRef] [Scilit] [PubMed]
- Murea, M.; Ma, L.; Freedman, B.I. Genetic and Environmental Factors Associated with Type 2 Diabetes and Diabetic Vascular Complications. Rev. Diabet. Stud. 2012, 9, 6–22. [Google Scholar] [CrossRef] [Scilit]
- Zhang, J.; Wu, K.; Dong, X. Exploring the Association between Serum Vitamin D Levels and Type 2 Diabetes Risk in US Adults. Ann. Med. 2025, 57, 2522320. [Google Scholar] [CrossRef] [Scilit]
- Cuomo, A.; Giordano, N.; Goracci, A.; Fagiolini, A. Depression and Vitamin D Deficiency: Causality, Assessment, and Clinical Practice Implications. Neuropsychiatry 2017, 7, 606–614. [Google Scholar] [CrossRef]
- Kouba, B.R.; Camargo, A.; Gil-Mohapel, J.; Rodrigues, A.L.S. Molecular Basis Underlying the Therapeutic Potential of Vitamin D for the Treatment of Depression and Anxiety. Int. J. Mol. Sci. 2022, 23, 7077. [Google Scholar] [CrossRef] [Scilit]
- Jahan-Mihan, A.; Stevens, P.; Medero-Alfonso, S.; Brace, G.; Overby, L.K.; Berg, K.; Labyak, C. The Role of Water-Soluble Vitamins and Vitamin D in Prevention and Treatment of Depression and Seasonal Affective Disorder in Adults. Nutrients 2024, 16, 1902. [Google Scholar] [CrossRef] [Scilit]
- Liu, L.; Cui, S.; Volpe, S.L.; May, N.S.; Sukumar, D.; DiMaria-Ghalili, R.A.; Eisen, H.J. Vitamin d Deficiency and Metabolic Syndrome: The Joint Effect on Cardiovascular and All-Cause Mortality in the United States Adults. World J. Cardiol. 2022, 14, 411. [Google Scholar] [CrossRef] [Scilit]
- Arayici, M.E.; Basbinar, Y.; Ellidokuz, H. Vitamin D Intake, Serum 25-Hydroxyvitamin-D (25(OH)D) Levels, and Cancer Risk: A Comprehensive Meta-Meta-Analysis Including Meta-Analyses of Randomized Controlled Trials and Observational Epidemiological Studies. Nutrients 2023, 15, 2722. [Google Scholar] [CrossRef] [Scilit]
- Huang, C.; Xu, J.; Qiu, H.; Yue, Y. Association of Vitamin D with Depression Prevalence in U.S. Adults: A Cross-Sectional Analysis from NHANES 2021 to 2023. Front. Nutr. 2025, 12, 1545443. [Google Scholar] [CrossRef] [Scilit] [PubMed]
- khan, B.; Shafiq, H.; Abbas, S.; Jabeen, S.; Khan, S.A.; Afsar, T.; Almajwal, A.; Alruwaili, N.W.; al-disi, D.; Alenezi, S.; et al. Vitamin D Status and Its Correlation to Depression. Ann. Gen. Psychiatry 2022, 21, 32. [Google Scholar] [CrossRef] [Scilit]
- Messina, R.; Iommi, M.; Rucci, P.; Reno, C.; Fantini, M.P.; Lunghi, C.; Altini, M.; Bravi, F.; Rosa, S.; Nicolucci, A.; et al. Is It Time to Consider Depression as a Major Complication of Type 2 Diabetes? Evidence from a Large Population-Based Cohort Study. Acta Diabetol. 2021, 59, 95–104. [Google Scholar] [CrossRef] [Scilit]
- Kim, Y.C.; Han, K.; Kim, S.; Um, Y.H.; Kim, T.W.; Seo, H.J.; Hong, S.C.; Jeong, J.H. Associations between Diabetes, Diabetes Duration, and Psychiatric Difficulties: A Nationwide Cross-Sectional Study. Clin. Psychopharmacol. Neurosci. 2025, 23, 476–487. [Google Scholar] [CrossRef] [Scilit]
- Penckofer, S.; Byrn, M.; Adams, W.; Emanuele, M.A.; Mumby, P.; Kouba, J.; Wallis, D.E. Vitamin D Supplementation Improves Mood in Women with Type 2 Diabetes. J. Diabetes Res. 2017, 2017, 8232863. [Google Scholar] [CrossRef] [Scilit]
- Penckofer, S.; Ridosh, M.; Adams, W.; Grzesiak, M.; Woo, J.; Byrn, M.; Kouba, J.; Sheean, P.; Kordish, C.; Durazo-Arvizu, R.; et al. Vitamin D Supplementation for the Treatment of Depressive Symptoms in Women with Type 2 Diabetes: A Randomized Clinical Trial. J. Diabetes Res. 2022, 2022, 4090807. [Google Scholar] [CrossRef] [Scilit]
- Fazelian, S.; Amani, R.; Paknahad, Z.; Kheiri, S.; Khajehali, L. Effect of Vitamin D Supplement on Mood Status and Inflammation in Vitamin D Deficient Type 2 Diabetic Women with Anxiety: A Randomized Clinical Trial. Int. J. Prev. Med. 2019, 10, 17. [Google Scholar] [CrossRef] [Scilit]
- Ma, J.; Li, K. Negative Association between Serum Vitamin D Levels and Depression in a Young Adult US Population: A Cross-Sectional Study of NHANES 2007–2018. Nutrients 2023, 15, 2947. [Google Scholar] [CrossRef] [Scilit] [PubMed]
- Wierzbicka, A.; Oczkowicz, M. Sex Differences in Vitamin D Metabolism, Serum Levels and Action. Br. J. Nutr. 2022, 128, 2115–2130. [Google Scholar] [CrossRef] [Scilit] [PubMed]
- NHANES 2017–2018 Overview. Available online: https://wwwn.cdc.gov/nchs/nhanes/continuousnhanes/overview.aspx?BeginYear=2017 (accessed on 9 December 2025).
- von Elm, E.; Altman, D.G.; Egger, M.; Pocock, S.J.; Gøtzsche, P.C.; Vandenbroucke, J.P. The Strengthening the Reporting of Observational Studies in Epidemiology (STROBE) Statement: Guidelines for Reporting Observational Studies. Lancet 2007, 370, 1453–1457. [Google Scholar] [CrossRef] [Scilit]
- 2017–2018 Laboratory Data—Continuous NHANES. Available online: https://wwwn.cdc.gov/nchs/nhanes/search/datapage.aspx?Component=Laboratory&Cycle=2017-2018 (accessed on 9 December 2025).
- Deierlein, A.L.; Sun, Y.; Prado, G.; Stein, C.R. Socioeconomic Characteristics, Lifestyle Behaviors, and Health Conditions Among Males of Reproductive Age With and Without Disabilities, NHANES 2013–2018. Am. J. Mens Health 2023, 17, 15579883221138190. [Google Scholar] [CrossRef] [Scilit] [PubMed]
- Pirkle, J.L. Exposure of the US Population to Environmental Tobacco Smoke. JAMA 1996, 275, 1233–1240. [Google Scholar] [CrossRef] [Scilit] [PubMed]
- About—Jamovi. Available online: https://www.jamovi.org/about.html (accessed on 29 December 2025).
- JAMM: Jamovi Advanced Mediation Models. Available online: https://jamovi-amm.github.io/ (accessed on 29 December 2025).
- Soetaert, K. R-Package Diagram: Visualising Simple Graphs, Flowcharts, and Webs. Available online: https://cran.r-project.org/web/packages/diagram/vignettes/diagram.pdf (accessed on 10 November 2025).
- Rosseel, Y. Lavaan: An R Package for Structural Equation Modeling. J. Stat. Softw. 2012, 48, 1–36. [Google Scholar] [CrossRef] [Scilit]
- Ganji, V.; Milone, C.; Cody, M.M.; McCarty, F.; Wang, Y.T. Serum Vitamin D Concentrations Are Related to Depression in Young Adult US Population: The Third National Health and Nutrition Examination Survey. Int. Arch. Med. 2010, 3, 29. [Google Scholar] [CrossRef] [Scilit]
- Chung, H.K.; Cho, Y.; Choi, S.; Shin, M.J. The Association between Serum 25-Hydroxyvitamin D Concentrations and Depressive Symptoms in Korean Adults: Findings from the Fifth Korea National Health and Nutrition Examination Survey 2010. PLoS ONE 2014, 9, e99185. [Google Scholar] [CrossRef] [Scilit]
- Wortsman, J.; Matsuoka, L.Y.; Chen, T.C.; Lu, Z.; Holick, M.F. Decreased Bioavailability of Vitamin D in Obesity. Am. J. Clin. Nutr. 2000, 72, 690–693. [Google Scholar] [CrossRef] [Scilit]
- Hajhashemy, Z.; Foshati, S.; Saneei, P. Relationship between Abdominal Obesity (Based on Waist Circumference) and Serum Vitamin D Levels: A Systematic Review and Meta-Analysis of Epidemiologic Studies. Nutr. Rev. 2022, 80, 1105–1117. [Google Scholar] [CrossRef] [Scilit]
- Nur-Eke, R.; Eke, I. The Impact of Vitamin D Deficiency on Depression in Obese Adults. Clin. Lab. 2023, 69, 354–361. [Google Scholar] [CrossRef] [Scilit]
- Kamalzadeh, L.; Saghafi, M.; Mortazavi, S.S.; Jolfaei, A.G. Vitamin D Deficiency and Depression in Obese Adults: A Comparative Observational Study. BMC Psychiatry 2021, 21, 599. [Google Scholar] [CrossRef] [Scilit] [PubMed]
- Alathari, B.E.; Sabta, A.A.; Kalpana, C.A.; Vimaleswaran, K.S. Vitamin D Pathway-Related Gene Polymorphisms and Their Association with Metabolic Diseases: A Literature Review. J. Diabetes Metab. Disord. 2020, 19, 1701–1729. [Google Scholar] [CrossRef] [Scilit] [PubMed]
- Kabadi, S.M.; Liu, L.; Auchincloss, A.H.; Zakeri, I.F. Multivariate Path Analysis of Serum 25-Hydroxyvitamin D Concentration, Inflammation, and Risk of Type 2 Diabetes Mellitus. Dis. Markers 2013, 35, 187–193. [Google Scholar] [CrossRef] [Scilit]
- He, L.-P.; Li, C.-P.; Liu, C.-W.; Gu, W. The Regulatory Effect of Vitamin D on Pancreatic Beta Cell Secretion in Patients with Type 2 Diabetes. Curr. Med. Chem. 2024, 32, 6713–6722. [Google Scholar] [CrossRef] [Scilit]
- Zhang, W.; Guo, Y.; Wang, K.; Chen, L.; Jiang, P. Neuroprotective Effects of Vitamin D and 17ß-Estradiol against Ovariectomy-Induced Neuroinflammation and Depressive-like State: Role of the AMPK/NF-ΚB Pathway. Int. Immunopharmacol. 2020, 86, 106734. [Google Scholar] [CrossRef] [Scilit] [PubMed]
- Dupuis, M.L.; Pagano, M.T.; Pierdominici, M.; Ortona, E. The Role of Vitamin D in Autoimmune Diseases: Could Sex Make the Difference? Biol. Sex Differ. 2021, 12, 12. [Google Scholar] [CrossRef] [Scilit]
- LeBlanc, E.S.; Desai, M.; Perrin, N.; Wactawski-Wende, J.; Manson, J.A.E.; Cauley, J.A.; Michael, Y.L.; Tang, J.; Womack, C.; Song, Y.; et al. Vitamin D Levels and Menopause-Related Symptoms. Menopause 2014, 21, 1197–1203. [Google Scholar] [CrossRef] [Scilit]
- Zhang, G.Q.; Chen, J.L.; Luo, Y.; Mathur, M.B.; Anagnostis, P.; Nurmatov, U.; Talibov, M.; Zhang, J.; Hawrylowicz, C.M.; Lumsden, M.A.; et al. Menopausal Hormone Therapy and Women’s Health: An Umbrella Review. PLoS Med. 2021, 18, e1003731. [Google Scholar] [CrossRef] [Scilit] [PubMed]

Disclaimer/Publisher’s Note: The statements, opinions and data contained in all publications are solely those of the individual author(s) and contributor(s) and not of MDPI and/or the editor(s). MDPI and/or the editor(s) disclaim responsibility for any injury to people or property resulting from any ideas, methods, instructions or products referred to in the content. |
© 2026 by the authors. Licensee MDPI, Basel, Switzerland. This article is an open access article distributed under the terms and conditions of the Creative Commons Attribution (CC BY) license.