


Abstract
Background: The pancreatic beta-cell hormone insulin regulates the metabolism of carbohydrates, as well as fats and protein. While the insulin response to a carbohydrate challenge is well defined in normoglycaemic as well as dysglycaemic (prediabetes and type 2 diabetes (T2DM)) individuals, the response of co-secreted beta-cell products (C-peptide, proinsulin and proinsulin intermediates) is less well defined. This analysis aimed to establish the expected glycaemic and pancreatic beta-cell responses to a standardised mixed meal in individuals with impaired glucose tolerance (IGT) and T2DM alongside reference ranges established in normoglycaemic individuals (NGT). Methods: A total of 743 adults (104 NGT, 85 IGT and 554 T2DM) were included, none of whom were on any anti-diabetic medication at the time of initial testing. All attended following a 10 h fast, before consuming a 500 kcal solid mixed meal (calorie contribution: 58% carbohydrates, 22% fat and 20% protein). Blood samples were collected every 30 min for the 4.5 h duration of the test for the determination of plasma glucose, insulin, C-peptide and intact and total proinsulin. Median profiles with corresponding 2.5th and 97.5th percentile lines to display the expected range were calculated and plotted for the three participant groups. Results: Median profiles with ranges over a 4.5 h meal period have been created for glucose, insulin, C-peptide and intact and total proinsulin, along with respective fasting and post-meal intervals in the three participant groups with differing glycaemic status. Conclusions: The resulting profiles and ranges allow for comparison in responses to a carbohydrate challenge in individuals across the glycaemic spectrum.
1. Introduction
Globally, it is estimated that there are approximately 589 million adults currently living with diabetes mellitus (a number predicted to rise to 835 million by the year 2050), with over 90% of those having type 2 diabetes (T2DM). In addition, an estimated further 635 million are living with impaired glucose tolerance (IGT) [1]. Complications arising from T2DM include cardiovascular disease, neuropathy, nephropathy and eye disease [1].
In the development of IGT and T2DM, there is, by definition, an abnormal glucose response to a carbohydrate stimulus. However, depending on where in the natural history an individual sits, the beta-cell response will be varied; in the early stages, insulin displays an increased, compensatory response, while in later stages, a reduced insulin-deficient response is observed, originally described as ‘Starling’s curve of the pancreas’ [2]. While the insulin response and ranges observed may be well understood, the prohormone response (intact and total proinsulin) in different glycaemic groups is less defined, especially with the advent of more specific immunoassays.
The mixed meal tolerance test (MMTT) is a long-established carbohydrate challenge, commonly used as a research tool and considered a gold-standard test for assessing the pancreatic beta-cell secretion to a physiological challenge in both type 1 [3] and type 2 diabetes mellitus [4]. It is considered a more physiological test than the oral glucose tolerance test (OGTT) [5,6].
The MMTT can be performed using either a solid or a liquid test meal. Recently, many studies investigating the postprandial response have utilised a liquid test meal; however, this is not necessarily completely representative of the everyday diet. Previous studies have sometimes shown discrepant findings in terms of whether the responses to a solid and liquid meal are the same; in people without diabetes previously having undergone bariatric surgery, the C-peptide response was similar for both solid and liquid meals, but the response was greater following the liquid meal in people without diabetes [7]. Similarly, Brodowicz et al. observed a greater and more sustained insulin and C-peptide response in people without diabetes following a liquid meal; however, the response to liquid and solid meals was similar in individuals with type 2 diabetes [8]. There is, however, a paucity of data comparing potential differences in beta-cell responses to a liquid or solid test meal in populations with prediabetes.
With the MMTT being commonly used within clinical studies in both type 1 and type 2 diabetes mellitus [9,10], it is important to understand the expected ranges to allow for comparison between studies. The aim of this analysis, therefore, was to establish the expected glycaemic and beta-cell secretory responses and expected ranges to a standardised 500 kcal solid mixed meal, using sensitive and specific immunoassays in individuals with impaired glucose tolerance and type 2 diabetes, as well as to display the reference responses in normoglycaemic individuals.
2. Methods
2.1. Study
The original data collection for this descriptive analysis was carried out between 1981 and 2007 as part of a long-term prospective study carried out in Cardiff (Diabetes Research Unit, University Hospital of Wales and subsequently Llandough Hospital) and has been previously described [11]. Ethical approval was received from South Glamorgan/Bro Taf Research Ethics Committee, and all participants provided informed consent. Procedures were conducted in accordance with the principles of the Declaration of Helsinki and Good Clinical Practice.
2.2. Participants
A total of 743 participants were recruited, including normoglycaemic controls, individuals with impaired glucose tolerance and individuals newly diagnosed with type 2 diabetes. In addition, a sub-group of the individuals with T2DM underwent repeat testing 10 years post-diagnosis to present the expected ranges in both newly diagnosed and more established T2DM. All glucose-intolerant individuals were referred directly from primary care, confirmed GAD antibody negative and recruited within 2 weeks of diagnosis for their initial visit, prior to any anti-diabetic medication or diabetes lifestyle advice. All participants underwent a standardised MMTT.
2.3. Standardised Mixed Meal Tolerance Test (MTT) and Sample Collection
The meal tolerance tests all commenced at approximately 8 am, following a 10 h overnight fast. All participants consumed a standardised 500 kcal mixed solid meal (calorie contribution: 58% carbohydrate, 22% fat and 20% protein) over a period of 10 min. The meal consisted of a wheat breakfast cereal, a chicken sandwich and a glass of fruit juice.
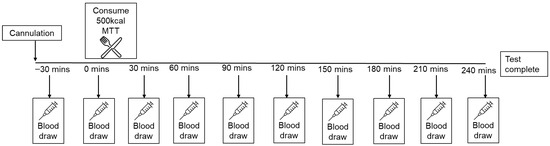
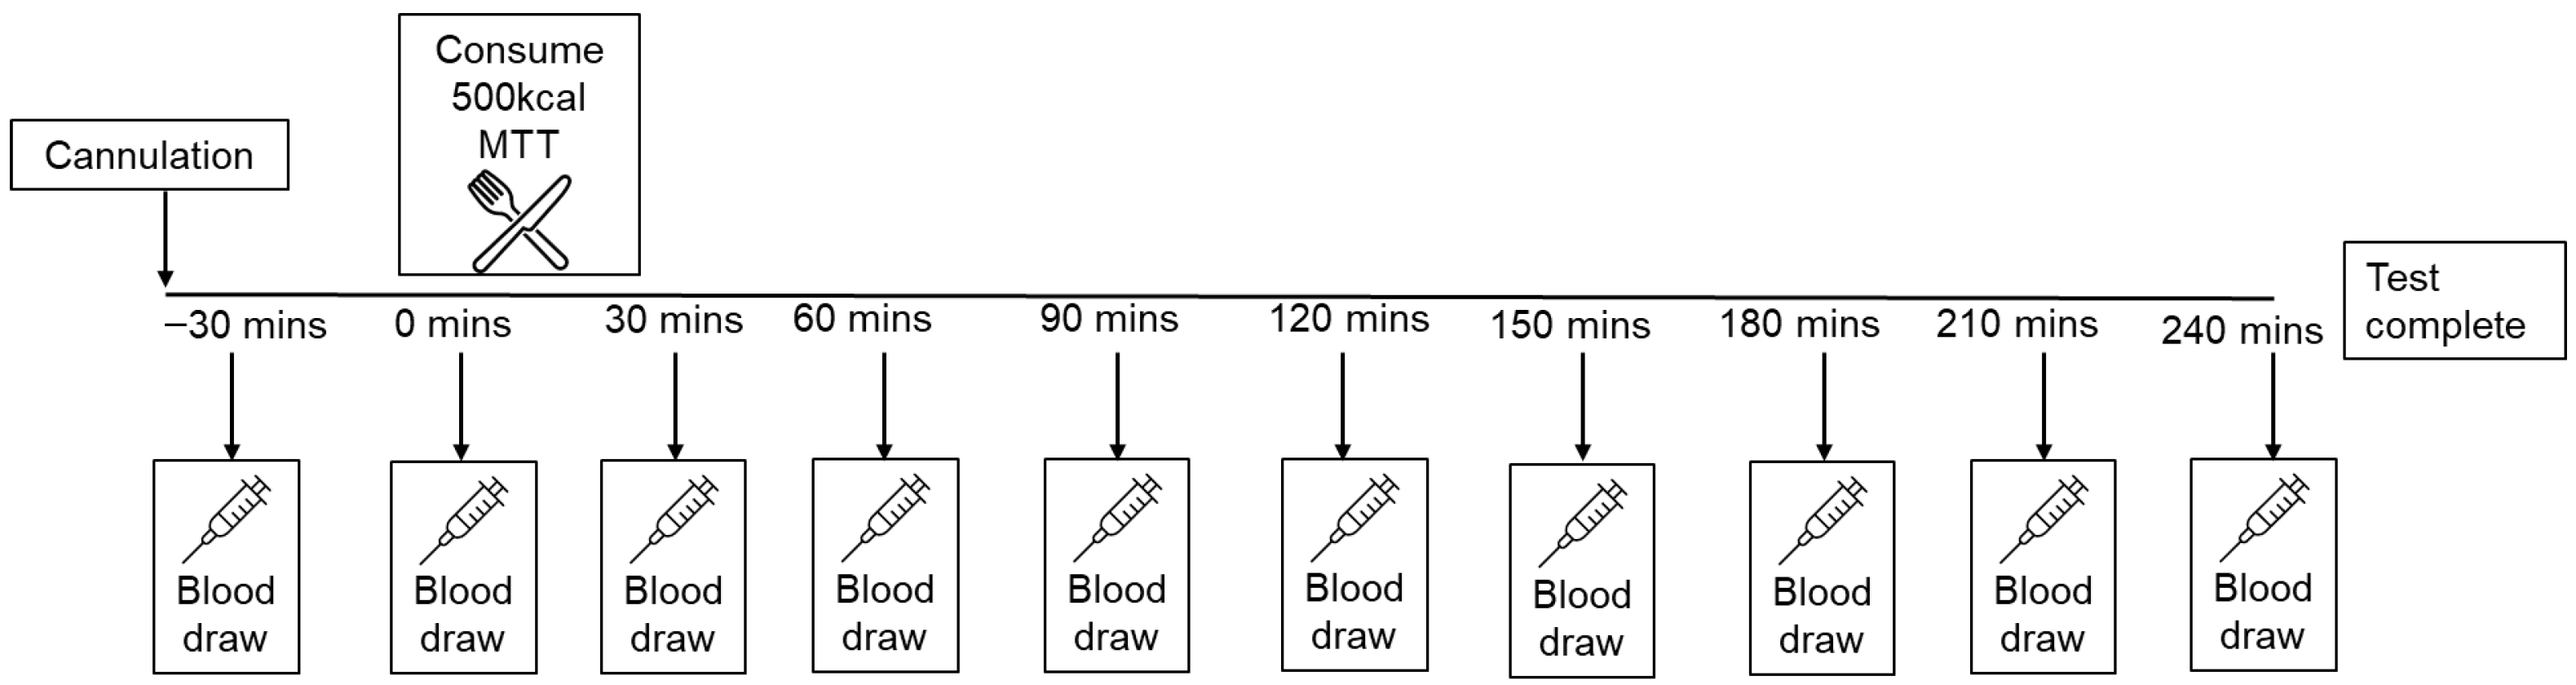
Fasting blood samples (−30 and 0 min) were collected from an intravenous cannula in a forearm vein with further samples collected at 30 min intervals over the 4 h post-meal period (Figure 1). Participants remained supine for the duration of the test. All blood samples were separated in a refrigerated centrifuge, and the plasma was decanted into labelled cryotubes and stored at −20 °C until assay within a few months.
Figure 1.
Timeline of sample collection over the MTT.
2.4. Assay Details
Plasma glucose was measured using a glucose oxidase method on the YSI 2300 Stat Plus (Yellow Springs Instruments, Fleet, UK). Plasma insulin, C-peptide and intact and total proinsulin were all measured using highly specific chemiluminescent immunoassays (IV2-001, IV2-004, IV2-002 and IV2-003; Invitron Ltd., Monmouth, UK). Each of the 4 chemiluminescent immunoassays displayed cross-reactivity of ≤2.2% with the corresponding beta-cell products. Assay sensitivity was 1.5 pmol/L, 5 pmol/L, 0.02 pmol/L and 0.25 pmol/L for insulin, C-peptide and intact and total proinsulin, respectively.
2.5. Determination of Reference Profiles and Intervals
The responses in the normoglycaemic group were classed as the reference profiles and intervals. The responses to both glucose-intolerant sub-groups were classed as expected profiles and intervals.
The range of concentrations, i.e., median with 2.5th and 97.5th percentiles, providing a reference interval encompassing 95% of all values for the normoglycaemic sub-group, was determined largely based on the method recommended by the International Federation of Clinical Chemistry and Laboratory Medicine (IFCC) [12,13]. The same method was applied to the glucose-intolerant sub-groups to establish the expected intervals.
Median profiles, plotting the interval for each individual pre- and post-meal timepoint, are presented across the 4.5 h duration of the MMTT, with corresponding 2.5th and 97.5th percentile profiles. Further to this, total fasting and total post-meal intervals were established by determining the 2.5th and 97.5th percentiles of all fasting (−30 and 0 min) and all post-meal (30, 60, 90, 120, 150, 180, 210 and 240 min) timepoints, respectively.
3. Results
3.1. Study Participant Characteristics
A total of 744 participants were included in the study: 14% were normoglycaemic; 11% had impaired glucose tolerance; and 75% had type 2 diabetes. A sub-group of the participants diagnosed with T2DM was also reassessed 10 years following diagnosis. None of the participants in the 10-year duration sub-group were on insulin therapy, and any who were receiving oral therapy omitted their therapy on the morning of the MMTT.
Participants in each sub-group were of a similar age; however, glucose-intolerant participants had a larger weight and BMI than those with NGT (all p < 0.001). Demographic data for the individual glycaemic sub-groups is presented in Table 1.
Table 1.
Study participant characteristics.
3.2. Reference Intervals
In the entire study population, measured glucose concentrations ranged from 3.2 to 30.8 mmol/L. Insulin, C-peptide and intact and total proinsulin minimum and maximum concentrations ranged from 1.4 to 2253.0 pmol/L, 10 to 7770 pmol/L, 0.7 to 210.0 pmol/L and 1.0 to 1532.0 pmol/L, respectively.
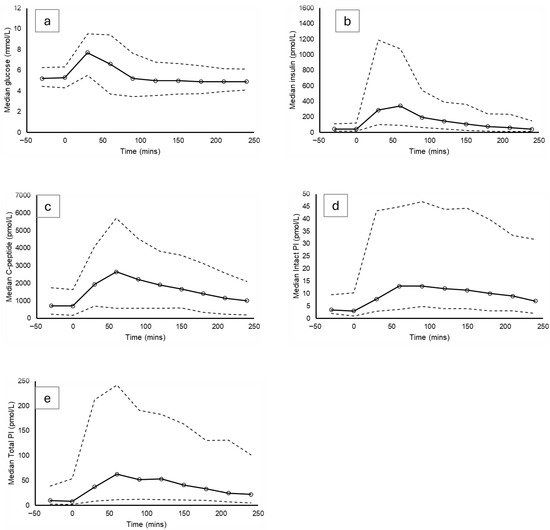
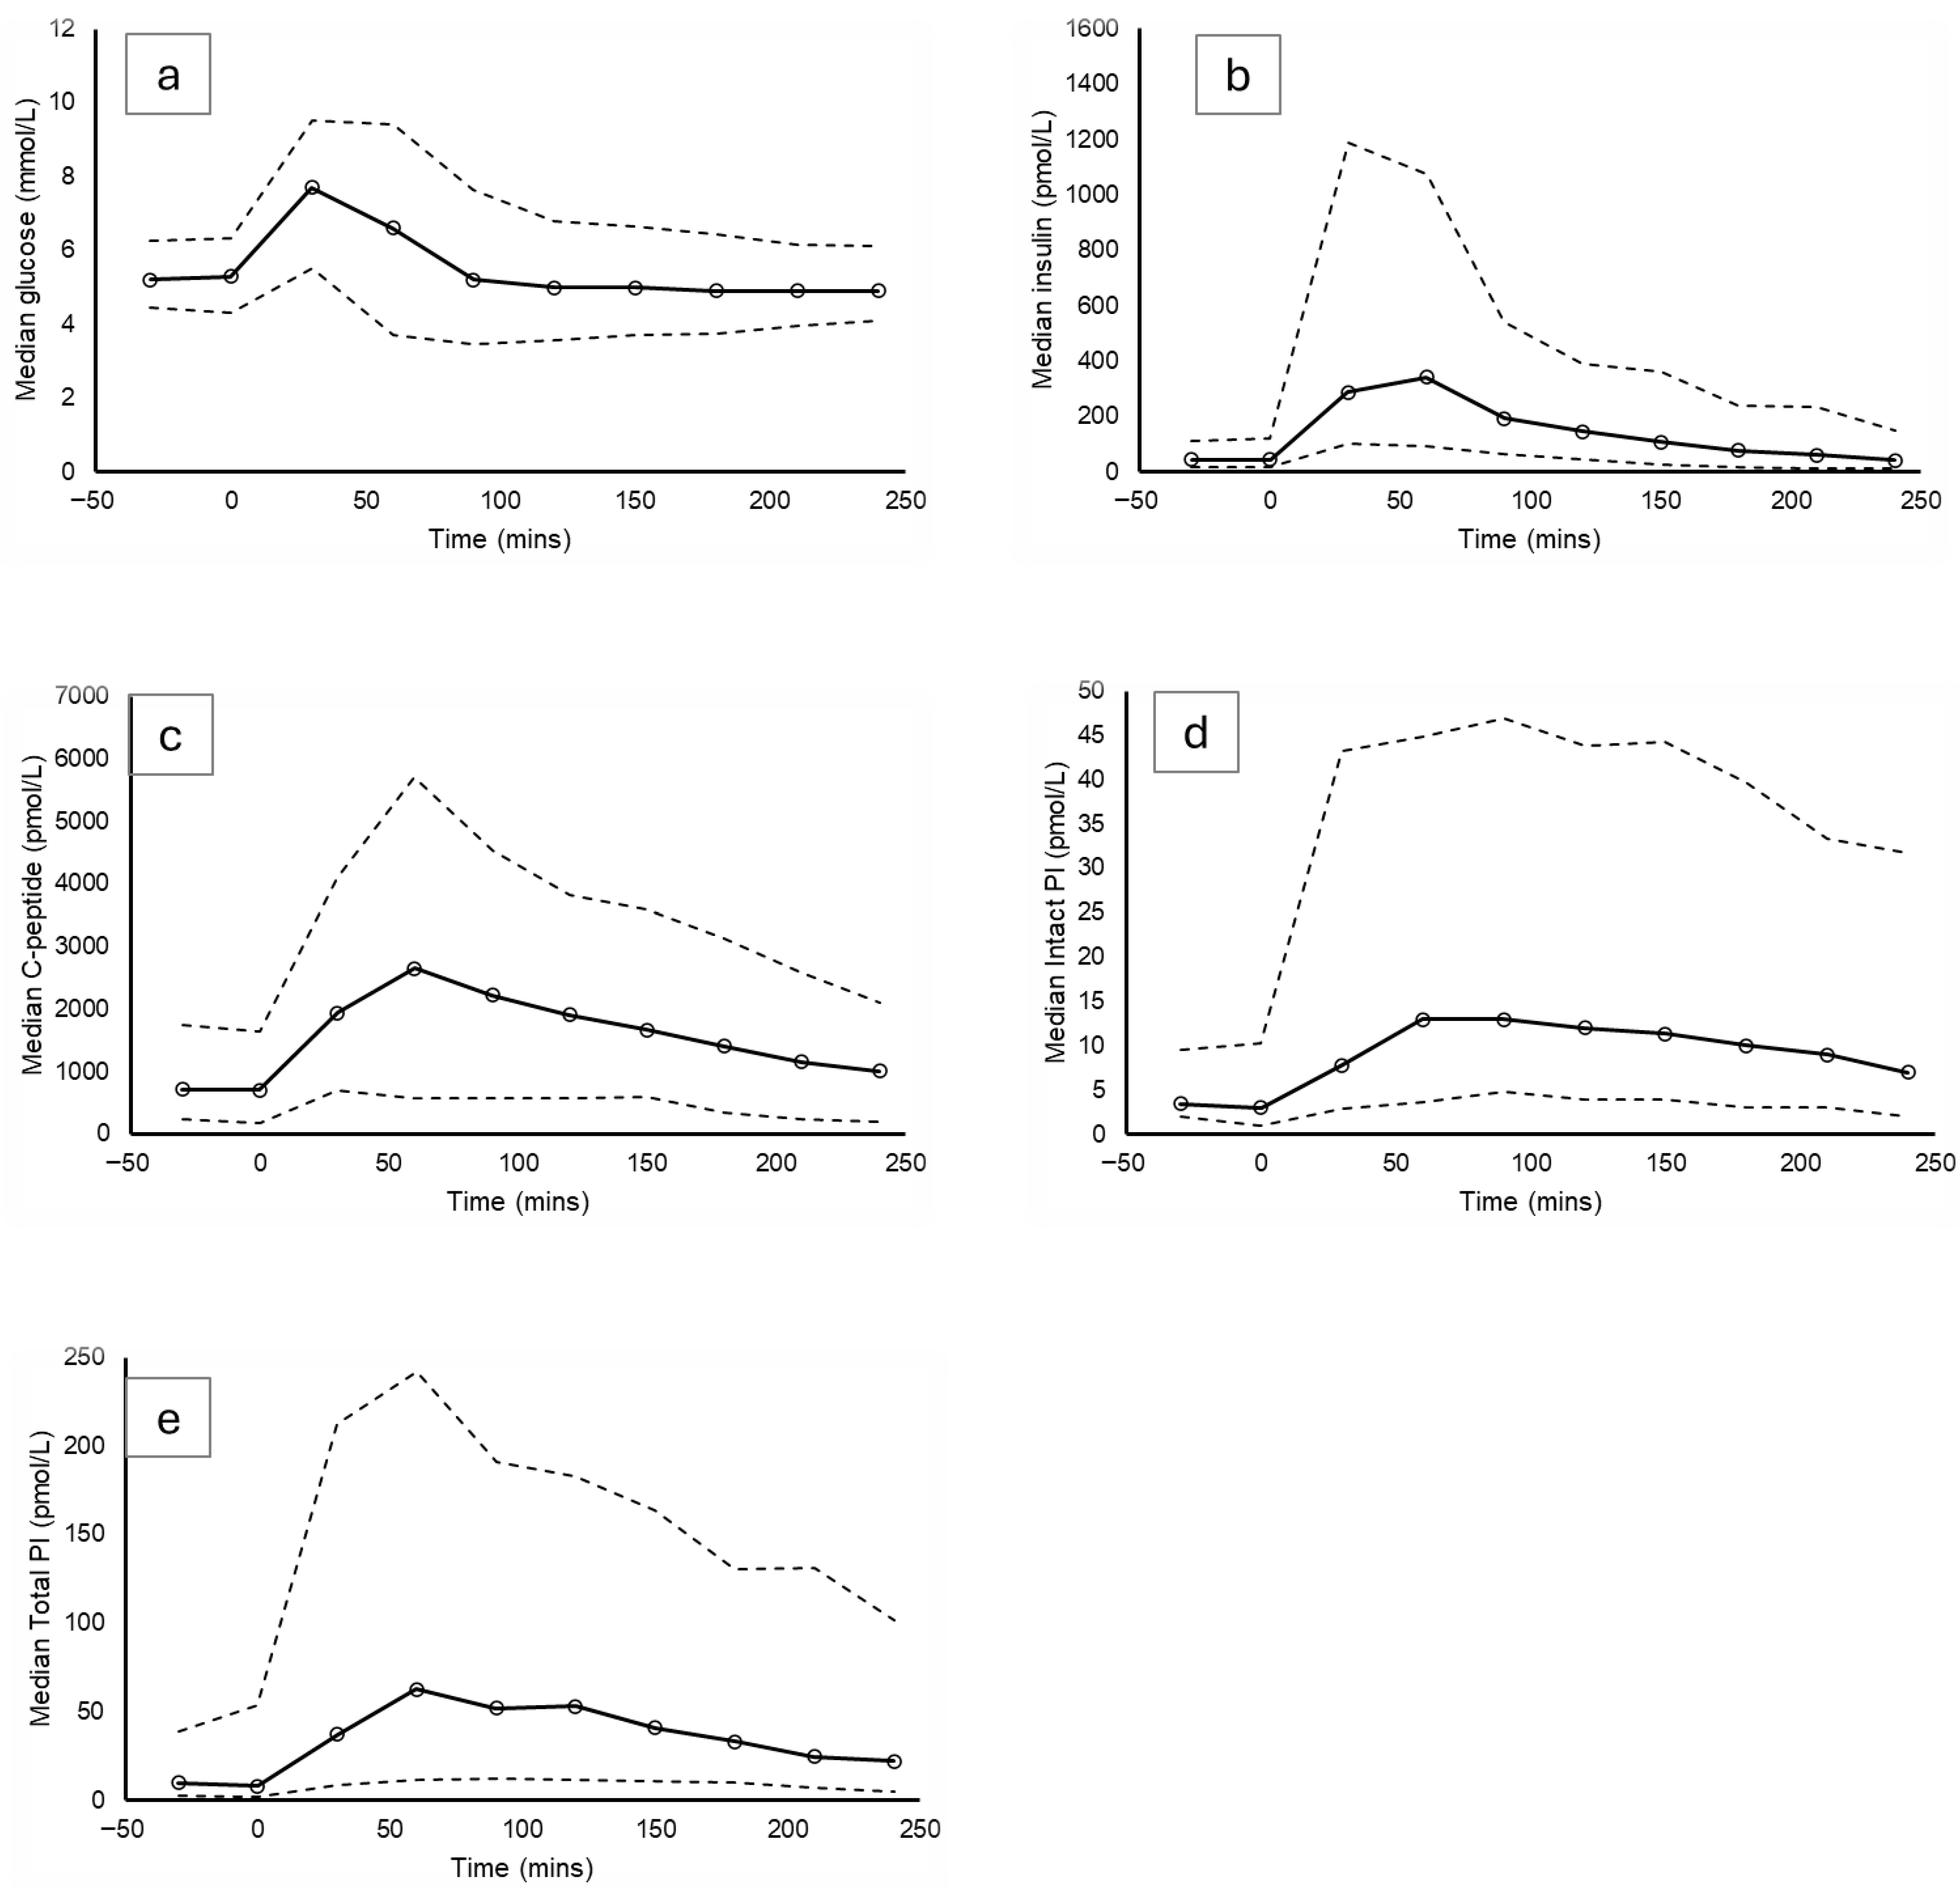
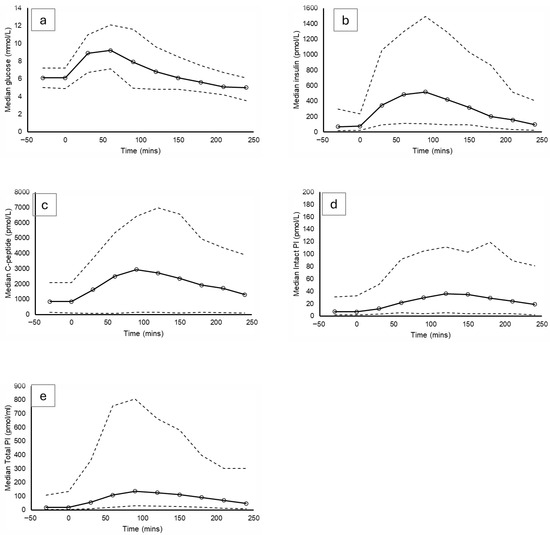
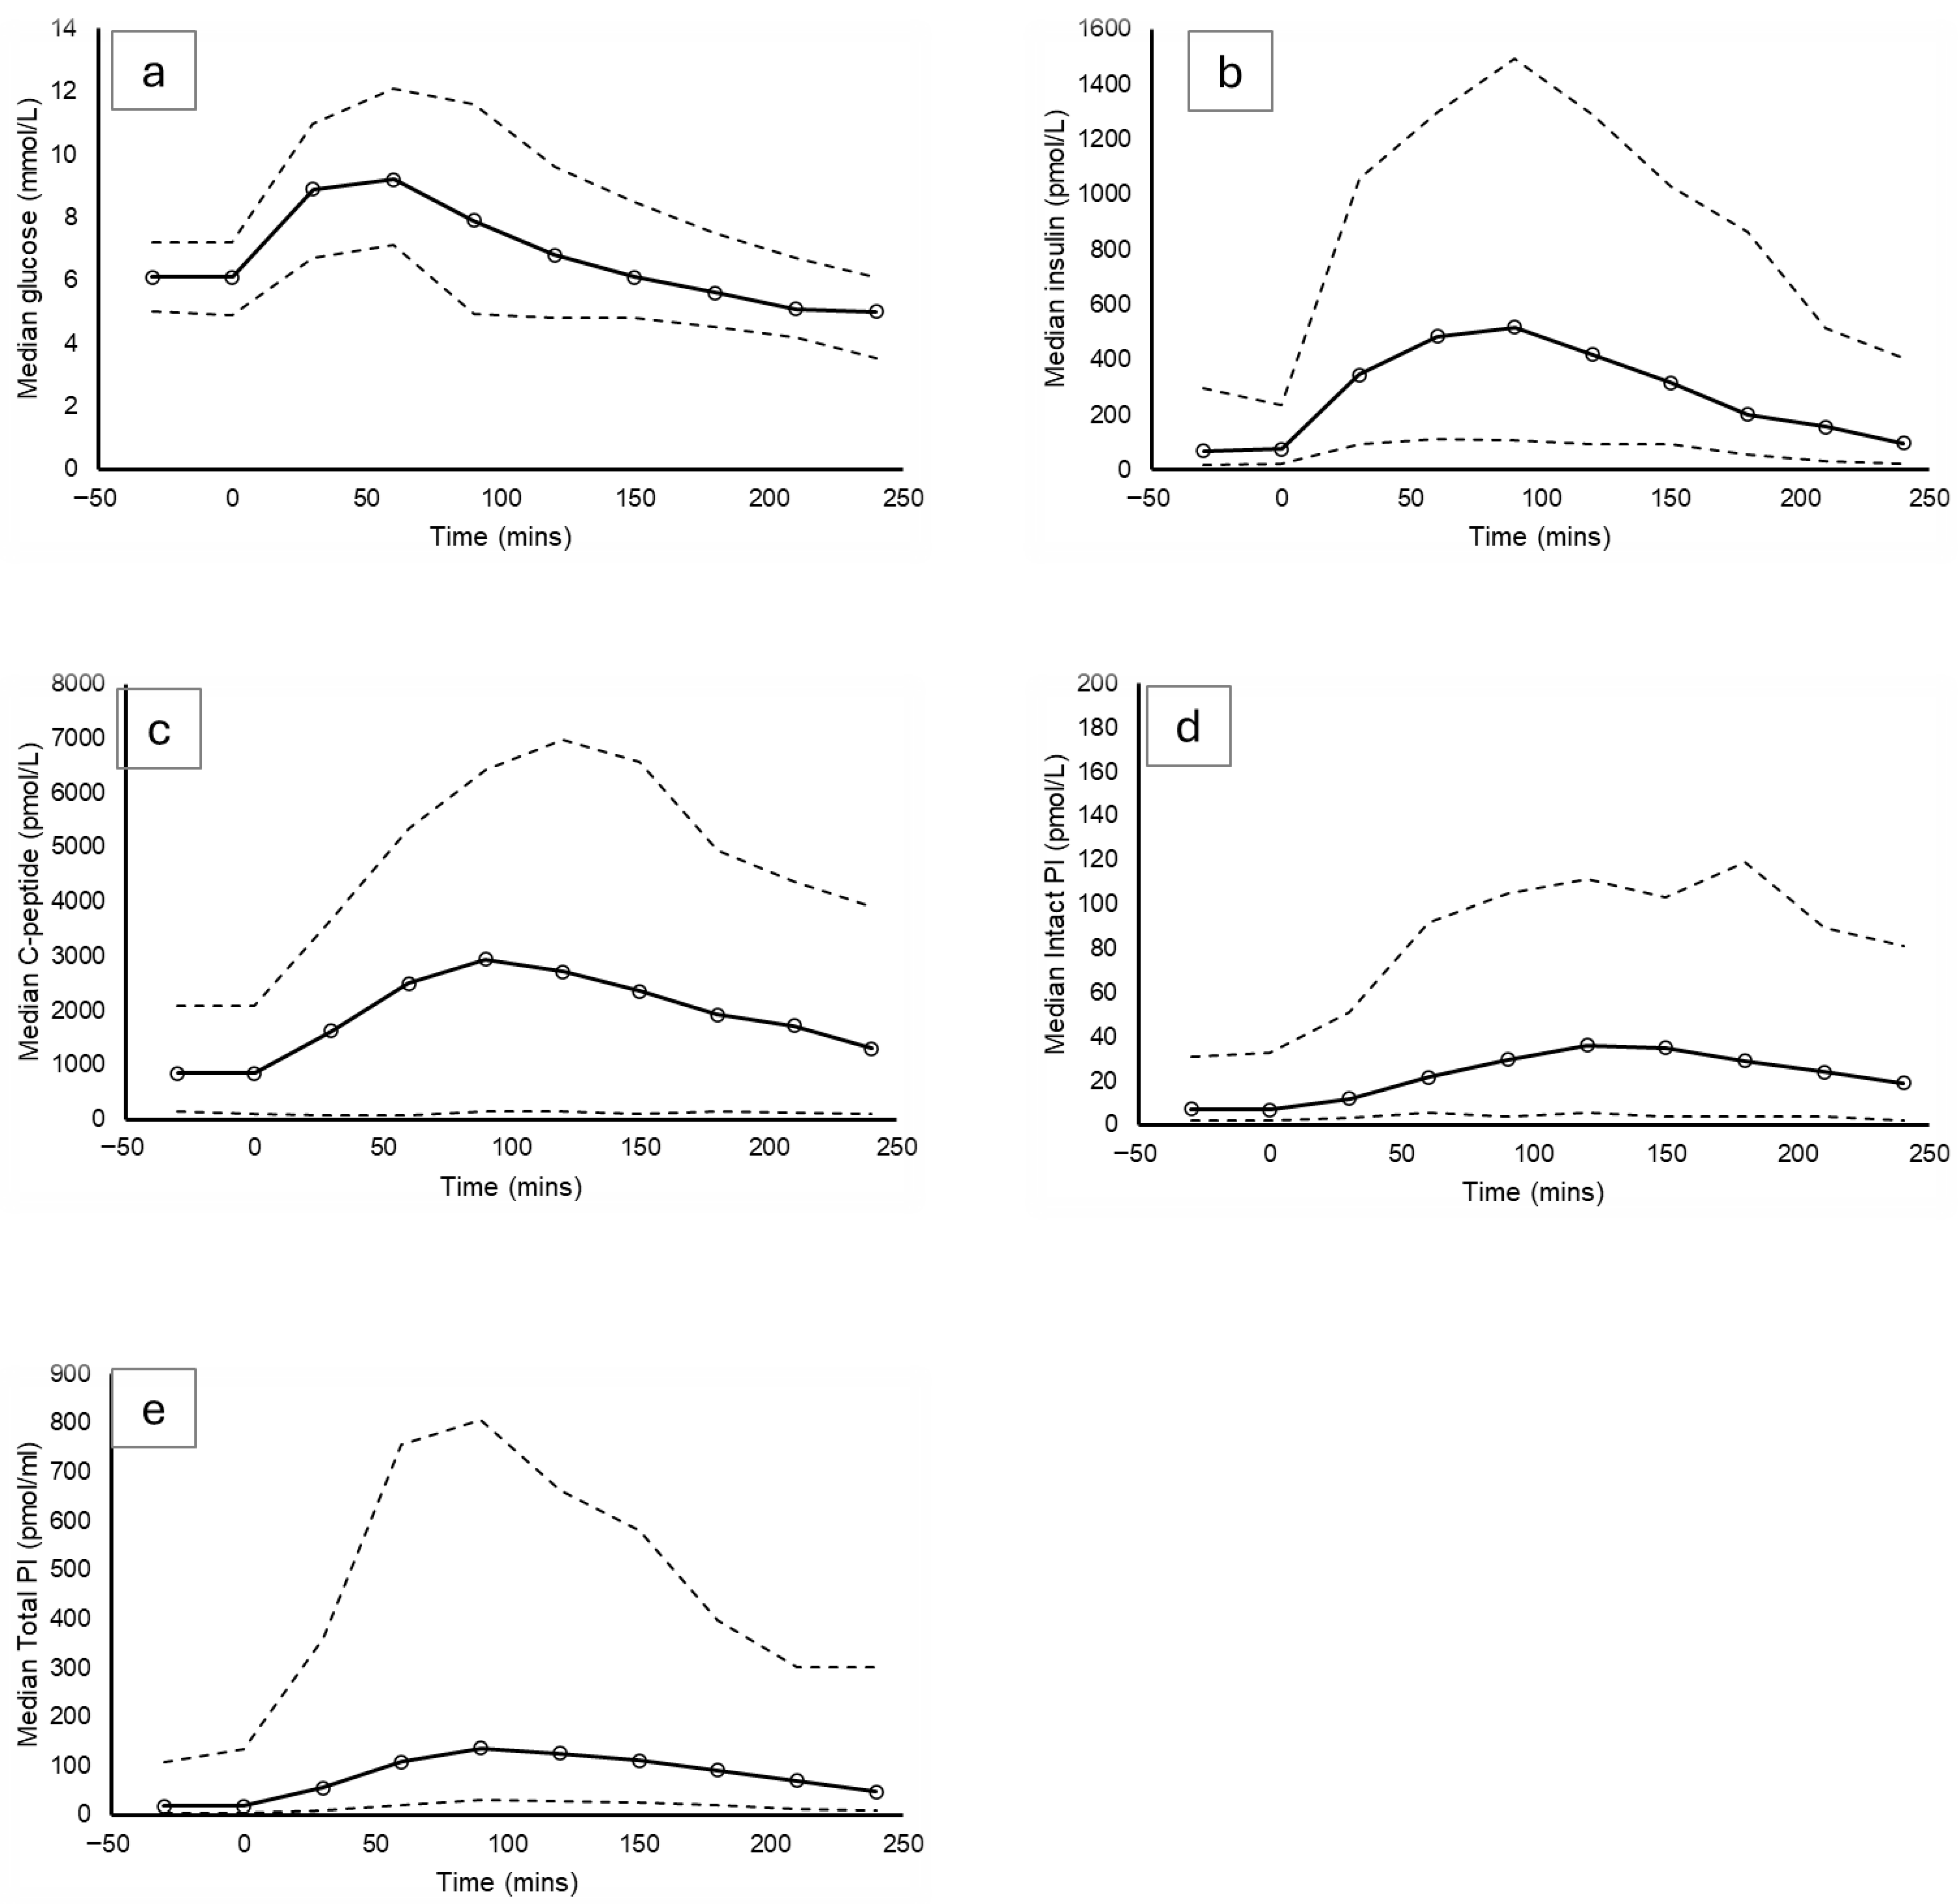
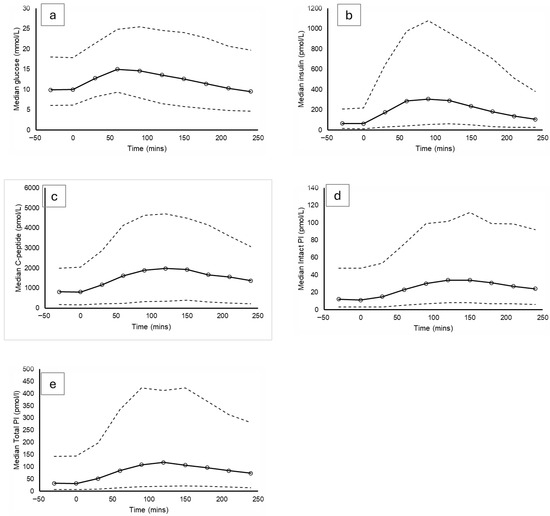
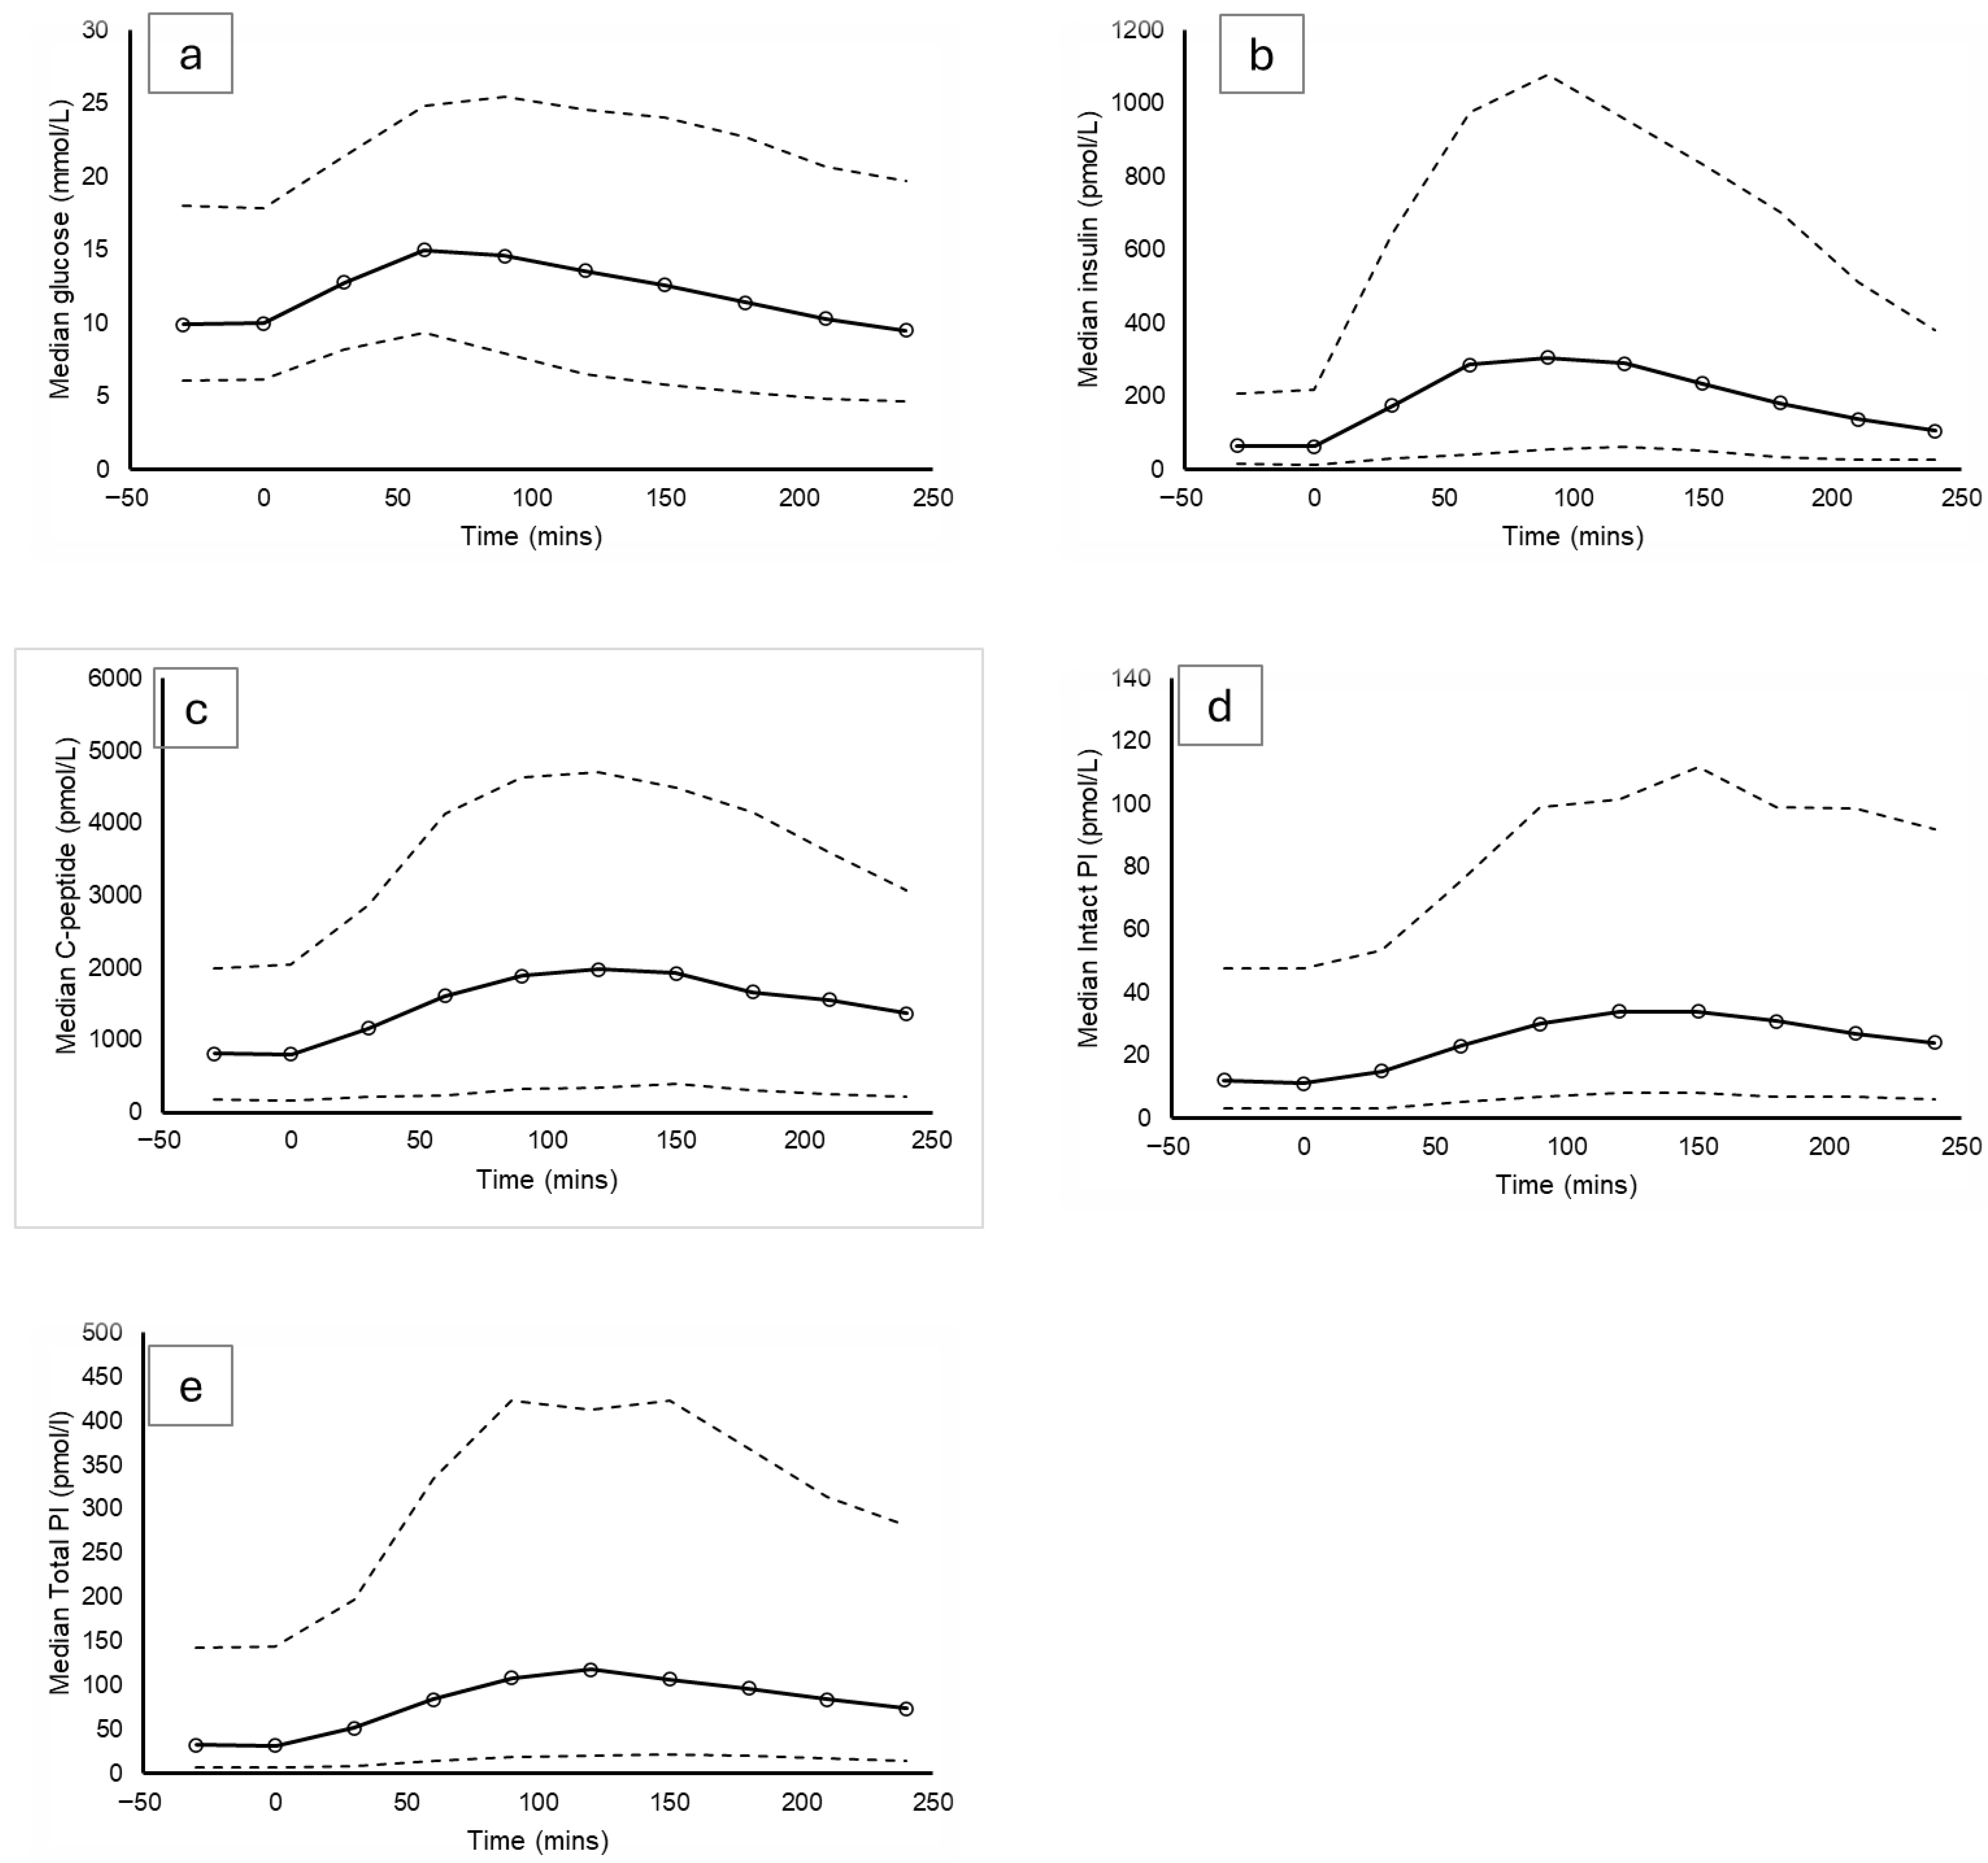
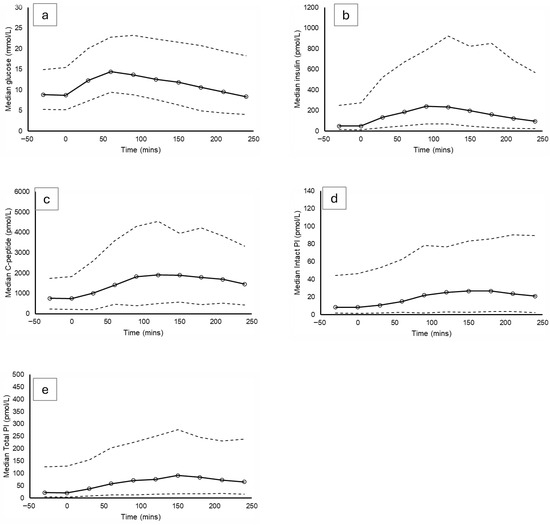
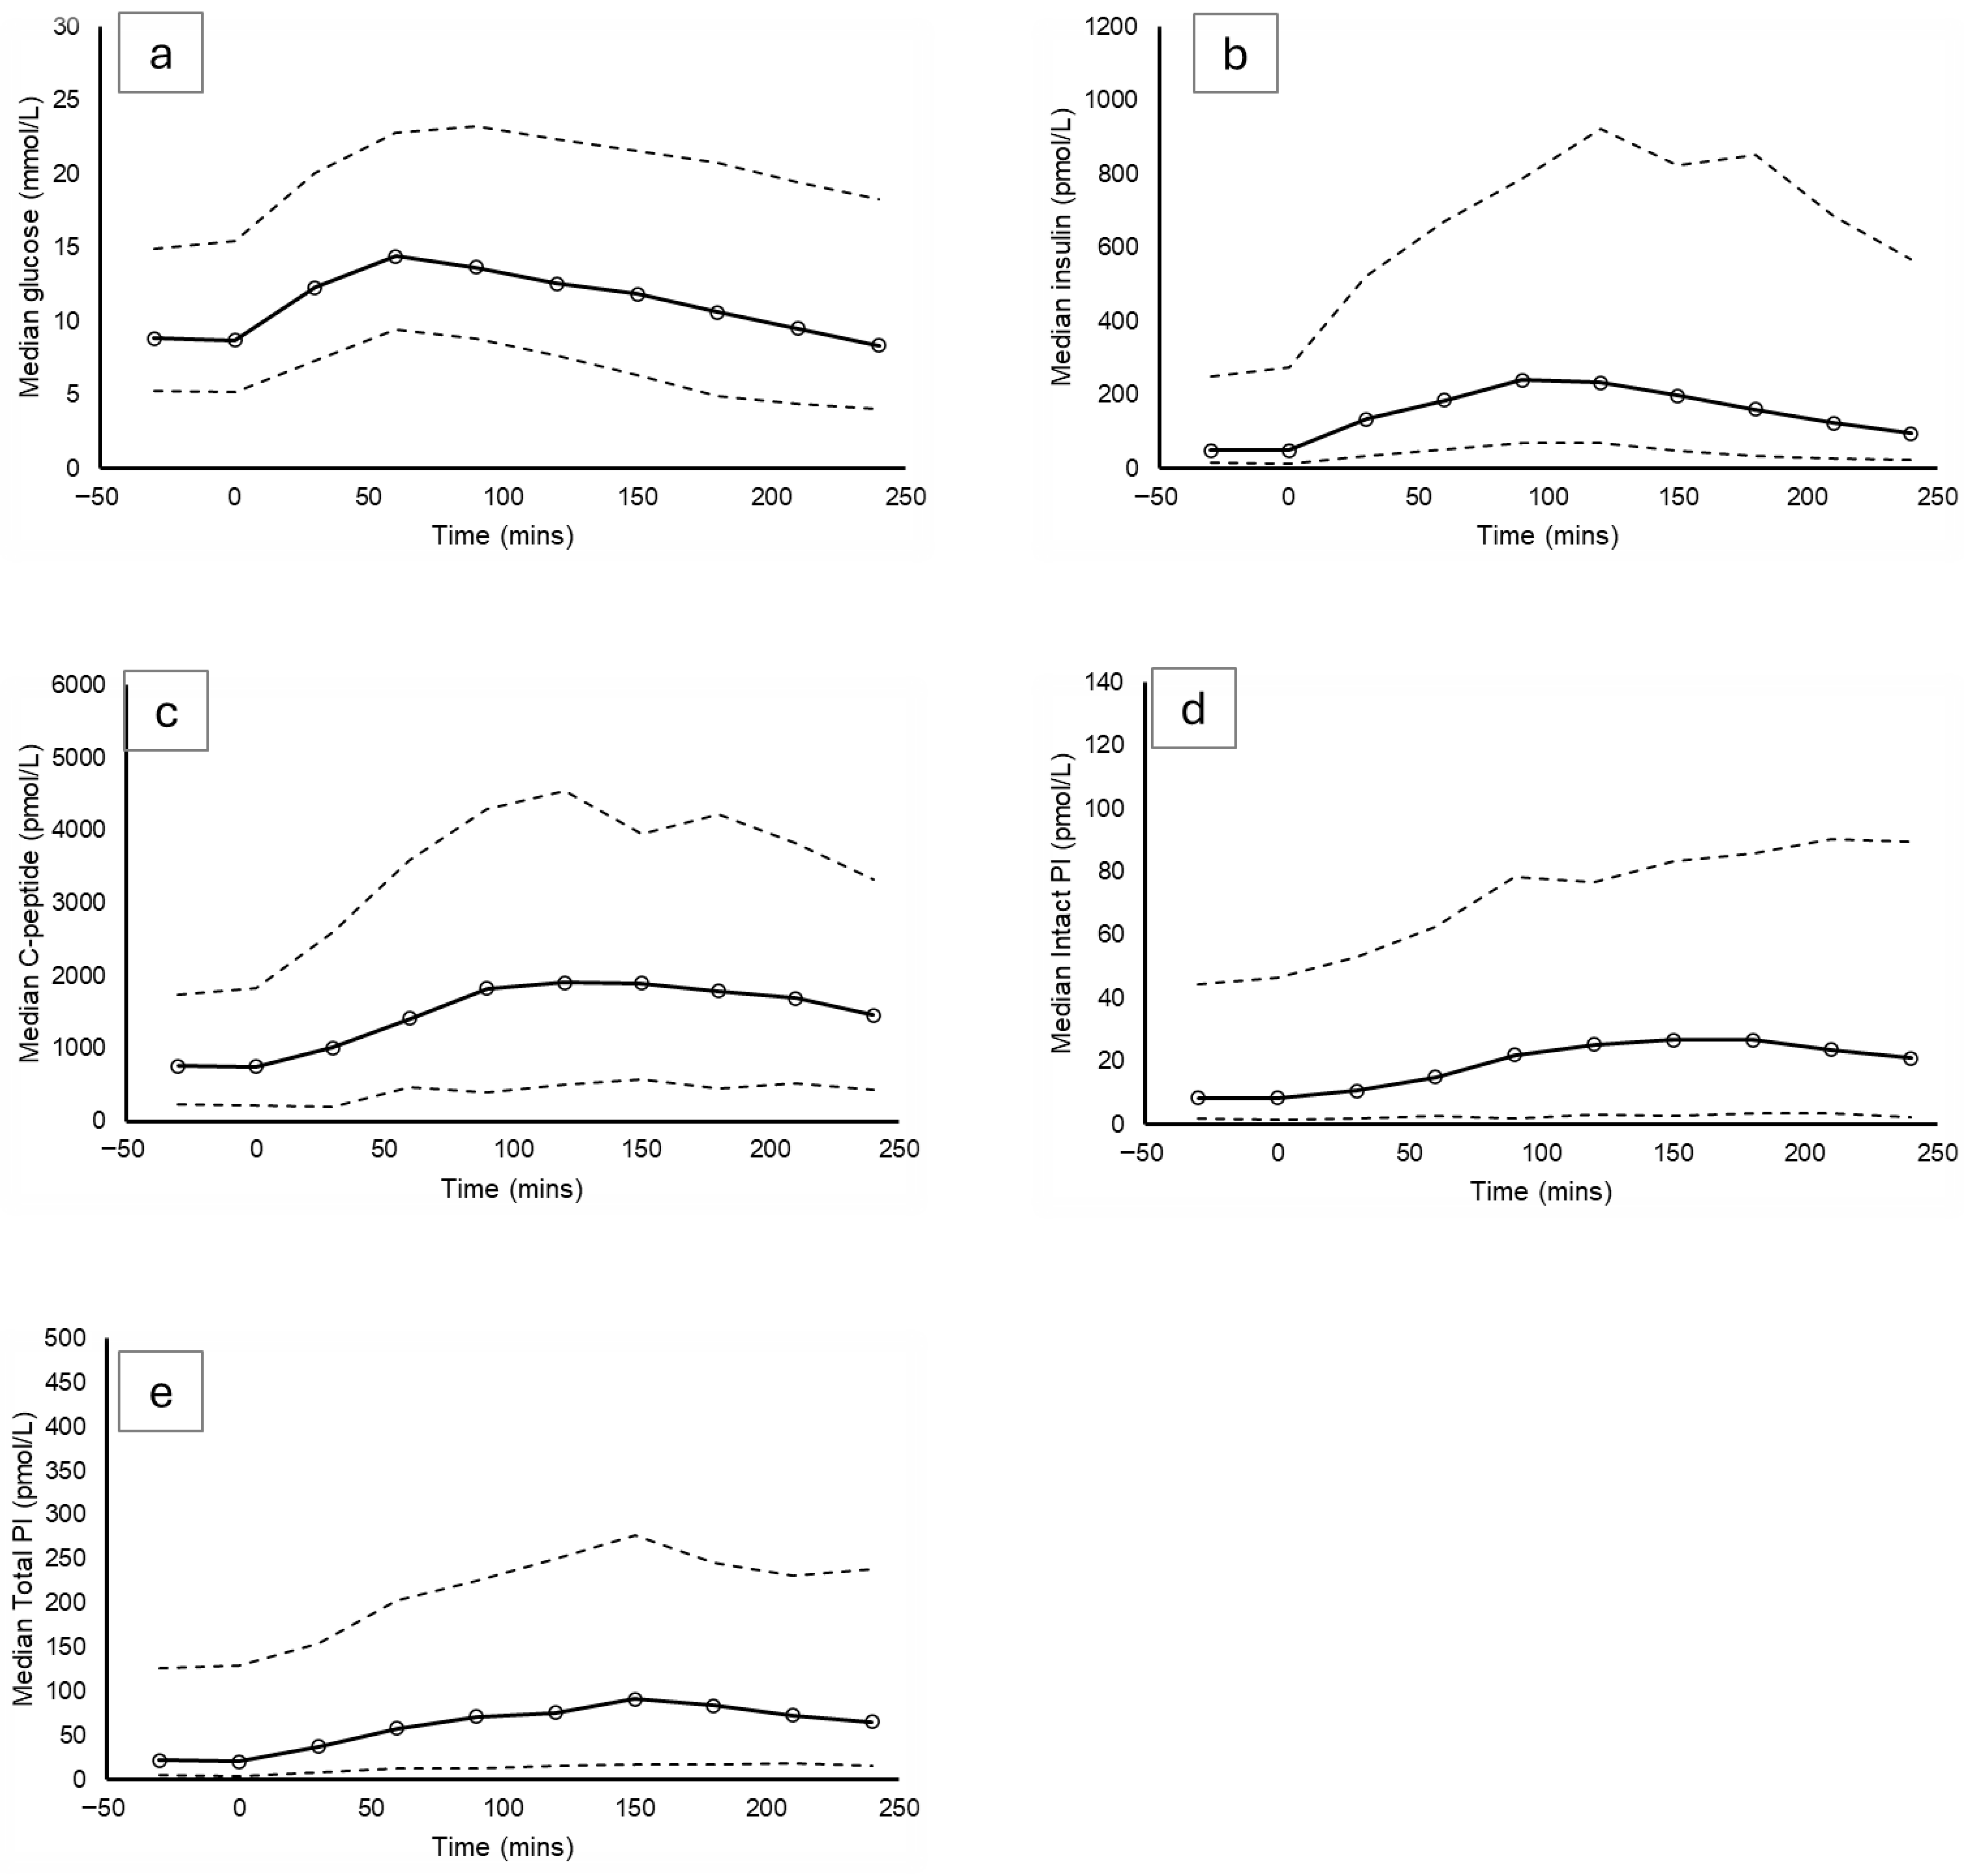
Fasting and post-meal median values and intervals for the individual glycaemic sub-groups are presented in Table 2, and median profiles with the intervals overlaid are presented in Figure 2, Figure 3, Figure 4 and Figure 5 for each glycaemic sub-group.
Table 2.
Fasting and post-meal median (2.5th to 97.5th percentiles).
Figure 2.
Reference intervals as represented by profiles following a standardised 500 kcal mixed meal tolerance test for individuals with NGT. Median = solid line; 2.5th and 97.5th percentiles = dashed line. (a) = glucose (n =104), (b) = insulin (n = 84), (c) = C-peptide (n = 102), (d) = intact proinsulin (n = 29), (e) = total proinsulin (n = 30).
Figure 3.
Expected intervals as represented by profiles following a standardised 500 kcal mixed meal tolerance test for individuals with newly diagnosed IGT. Median = solid line; 2.5th and 97.5th percentiles = dashed line. (a) = glucose (n = 85), (b) = insulin (n = 80), (c) = C-peptide (n = 82), (d) = intact proinsulin (n = 78), (e) = total proinsulin (n = 80).
Figure 4.
Expected intervals as represented by profiles following a standardised 500 kcal mixed meal tolerance test for individuals with newly diagnosed T2DM. Median = solid line; 2.5th and 97.5th percentiles = dashed line. (a) = glucose (n = 554), (b) = insulin (n = 410), (c) = C-peptide (n = 549), (d) = intact proinsulin (n = 367), (e) = total proinsulin (n = 412).
Figure 5.
Expected intervals as represented by profiles following a standardised 500 kcal mixed meal tolerance test for individuals with T2DM of 10-year duration. Median = solid line; 2.5th and 97.5th percentiles = dashed line. (a) = glucose (n = 142), (b) = insulin (n = 113), (c) = C-peptide (n = 137), (d) = intact proinsulin (n = 96), (e) = total proinsulin (n = 110).
4. Discussion
In this analysis, fasting and post-meal reference intervals for glucose, insulin, C-peptide and intact and total proinsulin have been determined in response to a 500 kcal solid mixed meal tolerance test in 104 normoglycaemic individuals, as well as the corresponding responses and observed ranges in treatment-naïve individuals, newly diagnosed with IGT (n = 85) and type 2 diabetes (n = 554), along with a sub-group of the participants with type 2 diabetes followed for 10 years, based on the method recommended by the IFCC [12,13]. Using this method of presenting the 2.5th to 97.5th percentiles to represent the reference interval, we have expanded on this by establishing the reference interval at each individual pre- and 4 h post-meal timepoint to present a reference profile, as well as presenting the overall fasting and post-meal reference intervals.
By investigating the response to a solid mixed meal, we are presenting a more physiological response than that to oral glucose, which includes the influence of the incretin effect. In addition, we have observed the postprandial response over 4 h, longer than the 2 h period commonly used. This is especially relevant for the dysglycaemic sub-groups, where the peak response is often observed to occur after 2 h, meaning that the peak is often missed or arbitrarily expressed as 2 h. Test conditions were kept consistent; i.e., participants completed the test whilst supine to allow for a direct comparison between groups, though this resting state should be considered when assessing differences in the responses.
Previous work has presented similar glucose and insulin profiles and expected ranges to a liquid meal in people without diabetes [14], with further profiles and ranges presented in response to an oral glucose tolerance test (glucose, insulin, C-peptide and proinsulin). Our data complement these findings whilst also adding greater participant numbers and additional dysglycaemic groups.
The immunoassays used in this study for the determination of the beta-cell products all had very high assay sensitivity, but perhaps more importantly, all displayed very low cross-reactivities with the co-secreted beta-cell products. Many historical pathophysiology studies have presented beta-cell product responses using data generated using non-specific immunoassays, including radioimmunoassays. More recent studies may have progressed to using enzyme-linked immunosorbent immunoassays (ELISAs) or chemiluminescent immunoassays using monoclonal antibodies; however, a number of these still display quite high degrees of cross-reactivity. In addition, many studies present ‘proinsulin’ data, without specifying whether these are intact, split or total proinsulin immunoassays. Our data present both intact and total proinsulin responses, well demonstrating the variation in the composition of total proinsulin in each of the glycaemic sub-groups, which may not be so clear when the data presented is described as ‘proinsulin’ alone.
By definition, the glucose-intolerant individuals displayed increased fasting and post-meal glucose levels, with wider ranges than observed in NGT. Generally, the insulin and C-peptide responses were greater in those with IGT and displayed a different profile shape in those with T2DM. Intact and total proinsulin responses in both glucose-intolerant groups were greater and exhibited a wider range than in NGT, with those with IGT being greater than those with T2DM. The expected ranges in the T2DM participants with 10 years of diabetes duration were observed to be similar to those who were newly diagnosed, possibly the consequence of long-term treatment with insulin secretagogues (sulphonylureas and prandial glucose regulators), maintaining the beta-cell response in this group. None of the participants in this group were on insulin therapy.
The reference intervals were determined in normoglycaemic adults at an age not significantly different to the glucose-intolerant individuals studied and were not excluded if exhibiting risk factors for developing glucose intolerance (e.g., increased BMI). The reference intervals included, therefore, represent a more age-appropriate comparison than would be obtained if using younger individuals. However, a younger reference population would be more appropriate if comparing to newer-onset type 1 diabetes.
This analysis investigated a homogeneous ethnic population (white European). Reference intervals may, therefore, need to be established for other populations, given that it is recognised that beta-cell function does vary between ethnic populations, having been demonstrated to be lower in black African men [15] and South and East Asian populations [16].
The strengths of this analysis include the large number of individuals included in each study sub-group, the standardised MMTT utilised, the fact that responses were not influenced by any anti-diabetic medication and the highly sensitive and specific immunoassays employed. Limitations include the homogeneous ethnicity of the participants (entirely white European) and the long study duration.
5. Conclusions
These profiles and expected concentration ranges in response to a standardised solid mixed meal stimulus provide reference intervals allowing for comparison between studies for individuals at different stages of glucose tolerance.
Author Contributions
G.J.D. performed laboratory work, analysed and interpreted the data and wrote the manuscript; D.R.O. designed the original study, analysed and interpreted the data and reviewed and edited the manuscript; and S.D.L. designed the original study, performed laboratory work, analysed and interpreted the data and reviewed and edited the manuscript. All authors have read and agreed to the published version of the manuscript.
Funding
This research was funded by an unrestricted grant from Novo Nordisk to support research into the pathophysiology of type 2 diabetes mellitus.
Institutional Review Board Statement
Ethical approval was received from South Glamorgan/Bro Taf Research Ethics Committee. The current reference interval work involves secondary analysis only of this existing dataset. No new data collection, interventions or participant contact has occurred. This secondary analysis complies with the principles of the Declaration of Helsinki. Based on Health Research Authority (HRA) guidance, secondary analysis of anonymised data does not require a new REC review. The outputs for publication are aggregate reference ranges only, with no individual-level data or identifiable information included. This approach aligns with UK governance requirements and ethical principles.
Informed Consent Statement
Not applicable.
Data Availability Statement
The raw data supporting the conclusions of this article will be made available by the authors on request.
Acknowledgments
We are grateful to all the participants who took part in the study and to the staff of the Diabetes Investigation Unit who were responsible for participant recruitment and sample collections.
Conflicts of Interest
The authors declare no conflicts of interest.
References
- International Diabetes Federation. IDF Diabetes Atlas, 11th ed.; International Diabetes Federation: Brussels, Belgium, 2025. [Google Scholar]
- DeFronzo, R.A. Lilly lecture 1987. The triumvirate: Beta-cell, muscle, liver. A collusion responsible for NIDDM. Diabetes 1988, 37, 667–687. [Google Scholar] [CrossRef] [Scilit] [PubMed]
- Ruan, Y.; Willemsen, R.H.; Wilinska, M.E.; Tauschmann, M.; Dunger, D.B.; Hovorka, R. Mixed-meal tolerance test to assess residual beta-cell secretion: Beyond the area-under-curve of plasma C-peptide concentration. Pediatr. Diabetes 2019, 20, 282–285. [Google Scholar] [CrossRef] [Scilit] [PubMed]
- Cersosimo, E.; Solis-Herrera, C.; Trautmann, M.E.; Malloy, J.; Triplitt, C.L. Assessment of pancreatic beta-cell function: Review of methods and clinical applications. Curr. Diabetes Rev. 2014, 10, 2–42. [Google Scholar] [CrossRef] [Scilit] [PubMed]
- Lefebvre, P.J.; Luyckx, A.S. The breakfast tolerance test: A return to physiology. Diabete Metab. 1976, 2, 15–19. [Google Scholar] [PubMed]
- Owens, D.R.; Wragg, K.G.; Briggs, P.I.; Luzio, S.; Kimber, G.; Davies, C. Comparison of the metabolic response to a glucose tolerance test and a standardized test meal and the response to serial test meals in normal healthy subjects. Diabetes Care 1979, 2, 409–413. [Google Scholar] [CrossRef] [Scilit] [PubMed]
- Hedbäck, N.; Hindsø, M.; Bojsen-Møller, K.N.; Linddal, A.K.; Jørgensen, N.B.; Dirksen, C.; Møller, A.; Kristiansen, V.B.; Hartmann, B.; Holst, J.J.; et al. Effect of Meal Texture on Postprandial Glucose Excursions and Gut Hormones After Roux-en-Y Gastric Bypass and Sleeve Gastrectomy. Front. Nutr. 2022, 9, 889710. [Google Scholar] [CrossRef] [Scilit] [PubMed]
- Brodovicz, K.G.; Girman, C.J.; Simonis-Bik, A.M.; Rijkelijkhuizen, J.M.; Zelis, M.; Bunck, M.C.; Mari, A.; Nijpels, G.; Eekhoff, E.M.W.; Dekker, J.M. Postprandial metabolic responses to mixed versus liquid meal tests in healthy men and men with type 2 diabetes. Diabetes Res. Clin. Pract. 2011, 94, 449–455. [Google Scholar] [CrossRef] [Scilit] [PubMed]
- Greenbaum, C.J.; Mandrup-Poulsen, T.; McGee, P.F.; Battelino, T.; Haastert, B.; Ludvigsson, J.; Pozzilli, P.; Lachin, J.M.; Kolb, H. Mixed-meal tolerance test versus glucagon stimulation test for the assessment of beta-cell function in therapeutic trials in type 1 diabetes. Diabetes Care 2008, 31, 1966–1971. [Google Scholar] [CrossRef] [Scilit] [PubMed]
- Shankar, S.S.; Vella, A.; Raymond, R.H.; Staten, M.A.; Calle, R.A.; Bergman, R.N.; Cao, C.; Chen, D.; Cobelli, C.; Dalla Man, C.; et al. Standardized Mixed-Meal Tolerance and Arginine Stimulation Tests Provide Reproducible and Complementary Measures of β-Cell Function: Results From the Foundation for the National Institutes of Health Biomarkers Consortium Investigative Series. Diabetes Care 2016, 39, 1602–1613. [Google Scholar] [CrossRef] [Scilit] [PubMed]
- Dunseath, G.J.; Luzio, S.D.; Peter, R.; Owens, D.R. The pathophysiology of glucose intolerance in newly diagnosed, untreated T2DM. Acta Diabetol. 2022, 59, 207–215. [Google Scholar] [CrossRef] [Scilit] [PubMed]
- Horowitz, L.G. Defining, Establishing, and Verifying Reference Intervals in the Clinical Laboratory: Approved Guidline, 3rd ed.; Clinical and Laboratory Standards Institute: Wayne, PA, USA, 2010; Volume 28. [Google Scholar]
- Horowitz, G.L.; Clinical, L.S. Institute, Defining, Establishing, and Verifying Reference Intervals in the Clinical Laboratory: Approved Guideline; Clinical and Laboratory Standards Institute: Wayne, PA, USA, 2008. [Google Scholar]
- Meek, C.; Lewis, H.B.; Burling, K.; Reimann, F.; Gribble, F. Expected values for gastrointestinal and pancreatic hormone concentrations in healthy volunteers in the fasting and postprandial state. Ann. Clin. Biochem. 2021, 58, 108–116. [Google Scholar] [CrossRef] [Scilit] [PubMed]
- Ladwa, M.; Bello, O.; Hakim, O.; Shojaee-Moradie, F.; Boselli, M.L.; Charles-Edwards, G.; Peacock, J.; Umpleby, A.M.; A Amiel, S.; Bonadonna, R.C.; et al. Ethnic differences in beta cell function occur independently of insulin sensitivity and pancreatic fat in black and white men. BMJ Open Diabetes Res. Care 2021, 9, e002034. [Google Scholar] [CrossRef] [Scilit] [PubMed]
- Hsu, W.C.; Boyko, E.J.; Fujimoto, W.Y.; Kanaya, A.; Karmally, W.; Karter, A.; King, G.L.; Look, M.; Maskarinec, G.; Misra, R.; et al. Pathophysiologic differences among Asians, native Hawaiians, and other Pacific Islanders and treatment implications. Diabetes Care 2012, 35, 1189–1198. [Google Scholar] [CrossRef] [Scilit] [PubMed]

Disclaimer/Publisher’s Note: The statements, opinions and data contained in all publications are solely those of the individual author(s) and contributor(s) and not of MDPI and/or the editor(s). MDPI and/or the editor(s) disclaim responsibility for any injury to people or property resulting from any ideas, methods, instructions or products referred to in the content. |
© 2026 by the authors. Licensee MDPI, Basel, Switzerland. This article is an open access article distributed under the terms and conditions of the Creative Commons Attribution (CC BY) license.