


Abstract
Background/Objectives: Postprandial hyperglycemia and sleep quality can influence arterial stiffness; however, the interaction between sleep quality and postprandial hyperglycemia-induced changes in arterial stiffness remains poorly elucidated. Therefore, the purpose of this study was to investigate whether sleep quality modifies postprandial changes in blood glucose levels and arterial stiffness following a 75 g oral glucose tolerance test in healthy middle-aged and older adults. Methods: In this study on 104 healthy middle-aged and older adults (50–83 years old), arterial stiffness was assessed using carotid–femoral pulse wave velocity (cfPWV) and brachial–ankle pulse wave velocity (baPWV) before and 60 min after a 75 g oral glucose tolerance test (OGTT). Poor sleep quality was defined as a Pittsburgh Sleep Quality Index score > 5.5. Results: In the 51 participants with poor sleep quality, baPWV increased significantly from baseline to 60 min after the 75 g OGTT (p < 0.01), whereas no such change was observed in the 53 subjects with good sleep quality. baPWV was significantly higher in the poor-sleep-quality group than in the good-sleep-quality group 60 min after the 75 g OGTT (p < 0.01). Moreover, baPWV and blood glucose levels 60 min after the 75 g OGTT had a positive correlation (p < 0.01, r = 0.64). Conclusions: These findings suggest that a poor sleep quality may enhance postprandial hyperglycemia-induced arterial stiffness, whereas a good sleep quality may help protect vascular function.
1. Introduction
Postprandial hyperglycemia is an independent risk factor for cardiovascular disease (CVD) [1]. Compared with fasting blood glucose levels, elevated postprandial glucose levels have been associated with a higher risk of CVD [2]. A proposed mechanism linking postprandial hyperglycemia to an increased CVD risk is arterial stiffness, including both central (aortic) and systemic peripheral components, which increase with postprandial hyperglycemia [3,4]. In middle-aged and older adults, research has demonstrated that brachial–ankle pulse wave velocity (baPWV), a marker of systemic arterial stiffness, increases following a 75 g oral glucose tolerance test (OGTT) [5]. Additionally, a 5-year longitudinal study involving 898 middle-aged and older adults found that postprandial glucose elevation was independently associated with an increase in carotid–femoral pulse wave velocity (cfPWV), a well-established measure of aortic stiffness [6]. Given that arterial stiffness and postprandial glucose levels increase with age [7], a significant association has been observed between these factors. Thus, increased arterial stiffness could represent a key mediator of the increased CVD risk associated with postprandial hyperglycemia. Consequently, mitigating postprandial hyperglycemia-associated arterial stiffness is of critical importance.
Sleep, which accounts for approximately one-third of a person’s lifetime, plays a crucial role in physiological, mental, and emotional health [8]. The prevalence of sleep disturbances is rising globally, with approximately 30% of the adult population, particularly middle-aged and older individuals, experiencing sleep disorders [9]. Reportedly, a poor sleep quality negatively affects glucose metabolism [10]. Specifically, an impaired sleep quality is associated with increased insulin resistance, subsequently exacerbating postprandial glucose excursions [11]. Hormones secreted during sleep, such as growth hormone and melatonin, play a role in glucose regulation, underscoring the importance of adequate sleep for glycemic stability [12]. Consequently, a poor sleep quality is considered closely related to postprandial hyperglycemia. Furthermore, emerging evidence suggests an association between sleep quality and arterial stiffness [13]. Recent studies have increasingly highlighted the importance of the sleep quality in cardiometabolic regulation [10,14,15]. A recent meta-analysis demonstrated that a shorter sleep duration and poorer sleep quality are associated with increased arterial stiffness, particularly in middle-aged and older adults [13]. Moreover, emerging evidence suggests that sleep-related autonomic imbalance and low-grade inflammation may amplify postprandial metabolic stress [16,17,18,19], thereby exacerbating transient vascular dysfunction after glucose loading. However, despite these advances, few studies have directly examined the combined effects of the sleep quality and postprandial hyperglycemia on arterial stiffness using both central and peripheral indices in healthy middle-aged and older individuals.
Therefore, the present study investigated the effects of sleep quality on postprandial glucose levels and arterial stiffness. We hypothesized that individuals with a poor sleep quality exhibit greater postprandial glucose excursions, thereby increasing arterial stiffness.
2. Materials and Methods
2.1. Participants
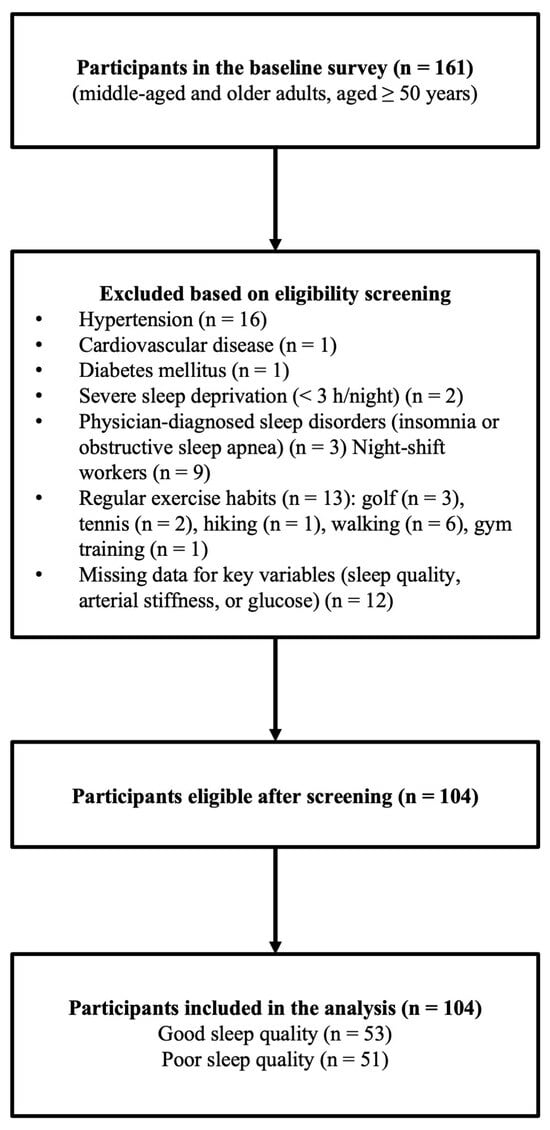
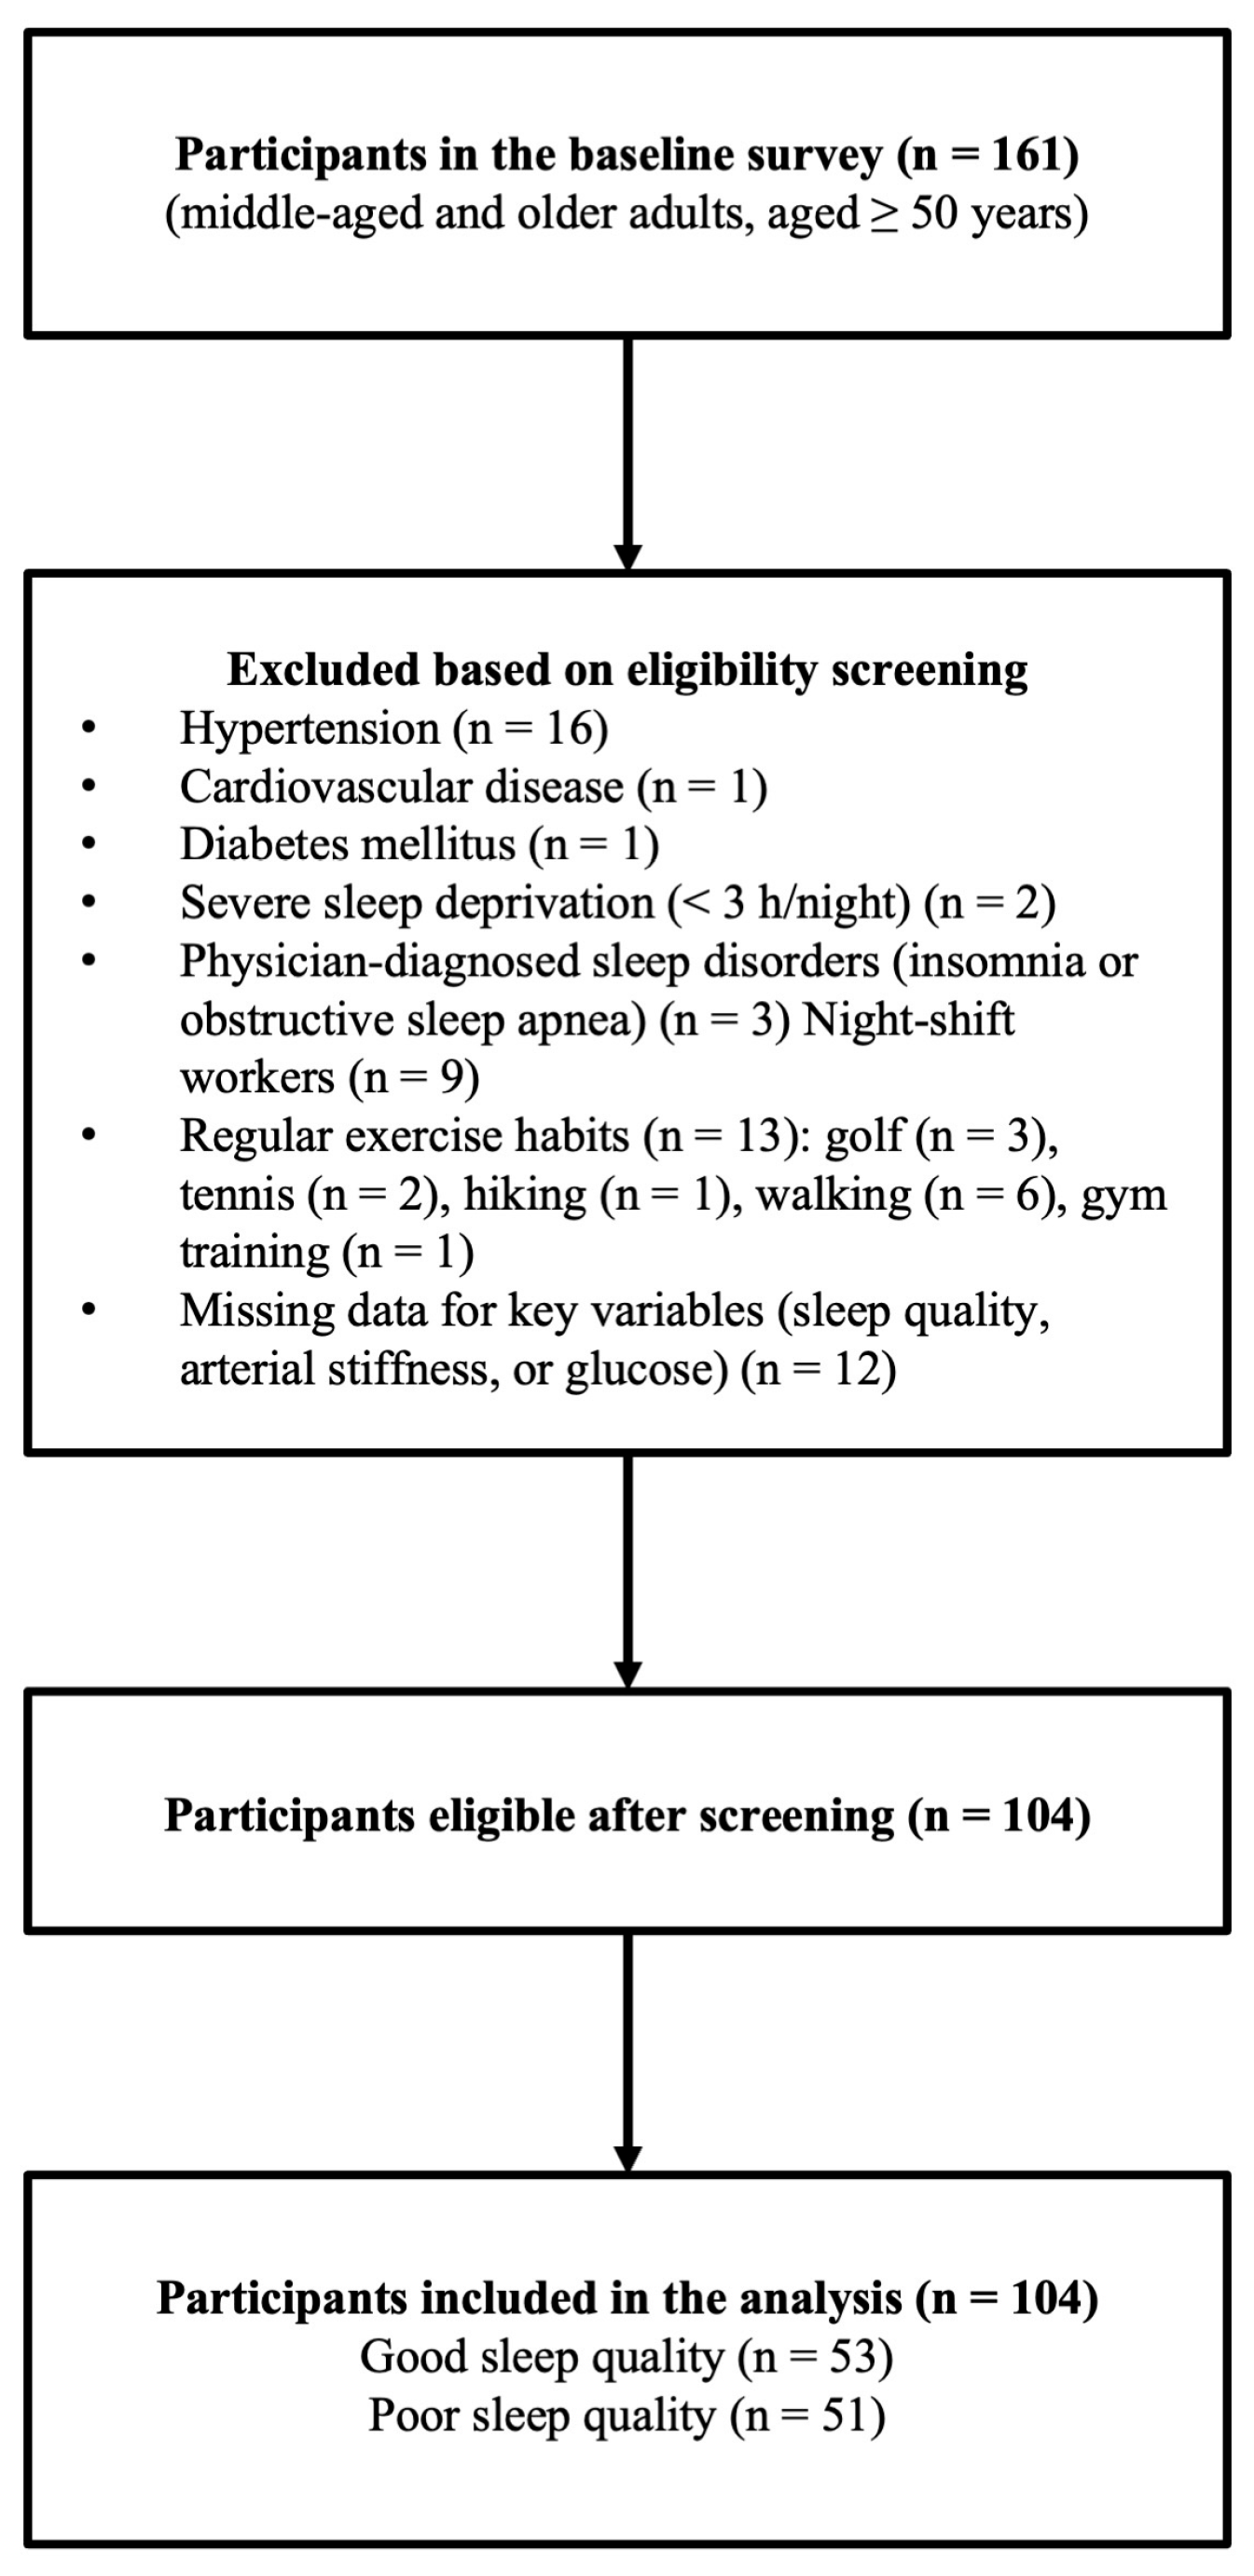
Participants were recruited through local advertisements, and 161 middle-aged and older adults (50–83 years old) underwent an initial eligibility screening. During this process, individuals with a history of hypertension (n = 16), cardiovascular disease (n = 1), diabetes mellitus (n = 1), severe sleep deprivation (sleep duration < 3 h per night, n = 2), missing data on key variables (sleep quality, arterial stiffness, or blood glucose; n = 12), night-shift work (n = 9), or physician-diagnosed sleep disorders such as insomnia or obstructive sleep apnea (n = 3) were deemed ineligible. Smoking was also an exclusion criterion; however, no smokers were identified during screening. In addition, regular exercise habits were an exclusion criterion. Thirteen individuals who reported engaging in habitual exercise—golf (n = 3), tennis (n = 2), mountain climbing (n = 1), walking (n = 6), and gym training (n = 1)—were excluded during screening. Because individuals with hypertension, diabetes, dyslipidemia, or sleep disorders were excluded based on the medical history, those taking glucose-lowering medications (including metformin), antihypertensive agents, lipid-lowering medications, or sleep medications were also excluded as part of these conditions. After applying all inclusion and exclusion criteria, 104 healthy middle-aged and older adults were included in the final analysis (Figure 1). Among these, 51 participants were classified into the good-sleep-quality group and 53 into the poor-sleep-quality group, based on their PSQI scores. All participants provided written informed consent. Written informed consent was obtained from all participants prior to their inclusion in this study. This study was approved by the Ethics Committee of Teikyo University of Science (approval number: 23A053) and conducted in accordance with the principles of the Declaration of Helsinki. This study has been clinically registered with the University Hospital Medical Information Network Center (study no.: UMIN000057655).
Figure 1.
Flow diagram of participant recruitment and eligibility screening.
2.2. Study Design
All clinical assessments were conducted in the morning, after an overnight fast. The participants were instructed to abstain from alcohol and caffeine for at least 12 h before the experiment and to avoid vigorous physical activity for at least 24 h before testing. Measurements were performed in a quiet, temperature-controlled room (24–26 °C) after a sufficient rest period. Following a minimum 15 min rest period in the supine position, arterial stiffness, blood pressure, and heart rate were measured before and 60 min after a 75 g OGTT, and blood samples were collected for biochemical analyses. Additionally, sleep quality, medication use, and other health-related information were assessed using a validated sleep questionnaire and self-reported questionnaires.
A total of 161 middle-aged and older adults were initially screened for eligibility. Participants with hypertension (n = 16), diagnosed cardiovascular disease (n = 1), diabetes mellitus (n = 1), severe sleep deprivation (<3 h/night; n = 2), physician-diagnosed sleep disorders (n = 3), night-shift work (n = 9), regular habitual exercise (n = 13), or missing data on key variables (sleep quality, arterial stiffness, or blood glucose; n = 12) were excluded. After applying all inclusion and exclusion criteria, 104 participants were included in the final analysis.
2.3. Body Composition
Height was measured to the nearest 0.1 cm using a stadiometer (Sanwa Corporation, Tokyo, Japan). Body weight and body fat percentage were assessed noninvasively utilizing a body composition analyzer (InnerScan Dual Black RD-E04BK, Tanita Corporation, Tokyo, Japan) based on bioelectrical impedance analysis. The body mass index (BMI) was calculated as the weight (kg) divided by height squared (m2).
2.4. Arterial Stiffness
Carotid–femoral PWV (cfPWV) was measured using the SphygmoCor XCEL system (TM-2805V, A&D Co., Ltd., Tokyo, Japan) [5]. Carotid and femoral arterial pressure waveforms were recorded three times using arterial applanation tonometry. Each recording consisted of approximately 10 s of continuous-pressure waveforms. The foot of each waveform was automatically detected using the system software’s intersecting-tangent algorithm. The transit distance for cfPWV was obtained by subtracting the suprasternal notch-to-carotid distance from the carotid-to-femoral distance, measured three times with a nonelastic tape. Brachial–ankle PWV (baPWV) and ankle–brachial blood pressure was measured using the automated pressure waveform analysis device Form PWV/ABI (Omron Colin Co., Ltd., Kyoto, Japan) [20]. Oscillometric cuffs were placed on both arms and ankles, and pressure waveforms from the brachial and posterior tibial arteries were recorded simultaneously for 10 s. The baPWV distance was automatically estimated using a height-based algorithm, as described previously [20]. The intra- and inter-rater coefficients of variation for the PWV measurements were 3% and 4%, respectively.
2.5. Blood Pressure and Heart Rate
Arterial blood pressure was measured using two different devices depending on the measurement site. Brachial and ankle systolic blood pressure (SBP), diastolic blood pressure (DBP), and mean arterial pressure (MAP) were measured with an oscillometric pulse-wave testing device (form PWV/ABI; Fukuda Colin, Inc., Tokyo, Japan) [20], which records pressure waveforms via sensors placed on both upper arms and ankles. This device was also used to obtain the heart rate (HR) by attaching electrocardiographic sensors to both wrists [20]. To assess carotid SBP, arterial pressure waveforms were acquired using a tonometric sensor positioned over the left carotid artery and analyzed with a dedicated pulse-wave testing device (SphygmoCor XCEL TM-2805V; A&D Corp., Tokyo, Japan) [5]. The intra- and inter-rater coefficients of variation for the SBP readings were 2% and 3%, respectively.
2.6. Blood Glucose Levels
Venous blood samples were collected from the left fingertip of each participant. Blood glucose levels were measured using the Glutest Neo Alpha blood glucose monitor (Sanwa Chemical Research Co., Ltd., Aichi, Japan) based on the flavin adenine dinucleotide–glucose dehydrogenase method [21]. The intralaboratory CV for blood glucose was 5% ± 3%.
2.7. 75 g OGTT
A 75 g OGTT was performed in the morning, after an overnight (10–12 h) fast, using Trelan®-G75 (Ajinomoto Pharma Co., Ltd., Tokyo, Japan). The glucose solution (225 mL) was consumed within 5 min, adhering to standard adult testing protocols [22].
2.8. Sleep Assessment
Sleep duration, sleep quality, and sleep disturbances were assessed using the Japanese version of the Pittsburgh Sleep Quality Index (PSQI-J). The PSQI-J, validated for the Japanese population, is a self-administered questionnaire that assesses sleep characteristics over the past month [23]. The test consists of 18 items covering seven components: subjective sleep quality, sleep duration, sleep latency, habitual sleep efficiency, sleep disturbances, use of sleeping medication, and daytime dysfunction. In addition to the PSQI-J components, the self-reported total sleep time was collected to assess the habitual sleep duration more precisely. The global PSQI score (range = 0–21) is calculated by summing the scores of the seven components, with higher scores indicating a poorer sleep quality. Participants were classified as “Good Sleepers” (PSQI < 5.5) or “Poor Sleepers” (PSQI ≥ 5.5) based on the global PSQI. Sleep disturbance was defined as PSQI ≥ 5.5 [23].
2.9. Physical Activity Assessment
Step counts were measured using a triaxial accelerometer (HJA-750C, Active Style Pro, Omron, Kyoto, Japan). Except for sleep and bathing, all participants wore the triaxial accelerometer on their waist for 14 consecutive days, and the data from 7 consecutive days were used for the assessment of physical activity (daily step count (steps/day)) [24].
2.10. Statistical Analysis
The required sample size was estimated using G*Power (version 3.1.9.7, Heinrich-Heine-University Düsseldorf, Germany [25]) assuming a 2 (group: good vs. poor sleepers) × 2 (time: before and 60 min after 75 g OGTT) mixed-design repeated-measures ANOVA. Based on previous studies reporting changes in baPWV after glucose loading and associations with sleep quality, a medium effect size (f = 0.25) was assumed for the group × time interaction. With α = 0.05, power (1–β) = 0.80, and correlation among repeated measures set to 0.50, the required total sample size was estimated at 28 participants (14 per group). In our study, we enrolled 104 participants, providing sufficient statistical power to detect even more minor effects and ensuring robustness against dropout or measurement error. The normality of all variables was tested using the Shapiro–Wilk test. Continuous variables were expressed as the mean ± standard deviation (SD). Group and time effects on cfPWV, baPWV, blood pressure, heart rate, and blood glucose were examined using two-way repeated-measures ANOVA. When significant interactions or main effects were found, Bonferroni-adjusted post hoc analyses were performed. Pearson’s correlation coefficients were used to evaluate the association between changes in arterial stiffness and changes in blood glucose levels. Because baPWV—but not cfPWV—showed a significant postprandial increase, the primary analysis assessed the relationship between ΔbaPWV and Δblood glucose. However, for completeness, correlations between ΔcfPWV and Δblood glucose were also calculated, as cfPWV is the gold-standard measure of aortic stiffness. Correlation analyses were performed using change values (Δ = 60 min − baseline), which more accurately reflect physiological coupling during the postprandial period. All statistical analyses were performed using SPSS version 31 (IBM, Armonk, NY, USA), with significance set at p < 0.05.
3. Results
3.1. Baseline Characteristics of the Study Participants
As summarized in Table 1, there were no significant differences in height, weight, body fat percentage, BMI, or step counts between the poor- and good-sleep-quality groups; however, PSQI scores were significantly higher in the poor-sleep-quality group than in the good-sleep-quality group (p < 0.01). In addition, total sleep time was significantly longer in the good-sleep-quality group than in the poor-sleep-quality group (p < 0.01).
Table 1.
Summary of the characteristics of both groups.
3.2. Changes in Arterial Stiffness Before and After the 75 g OGTT in Both Groups
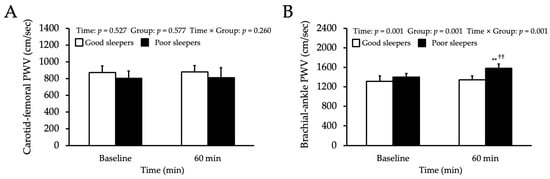
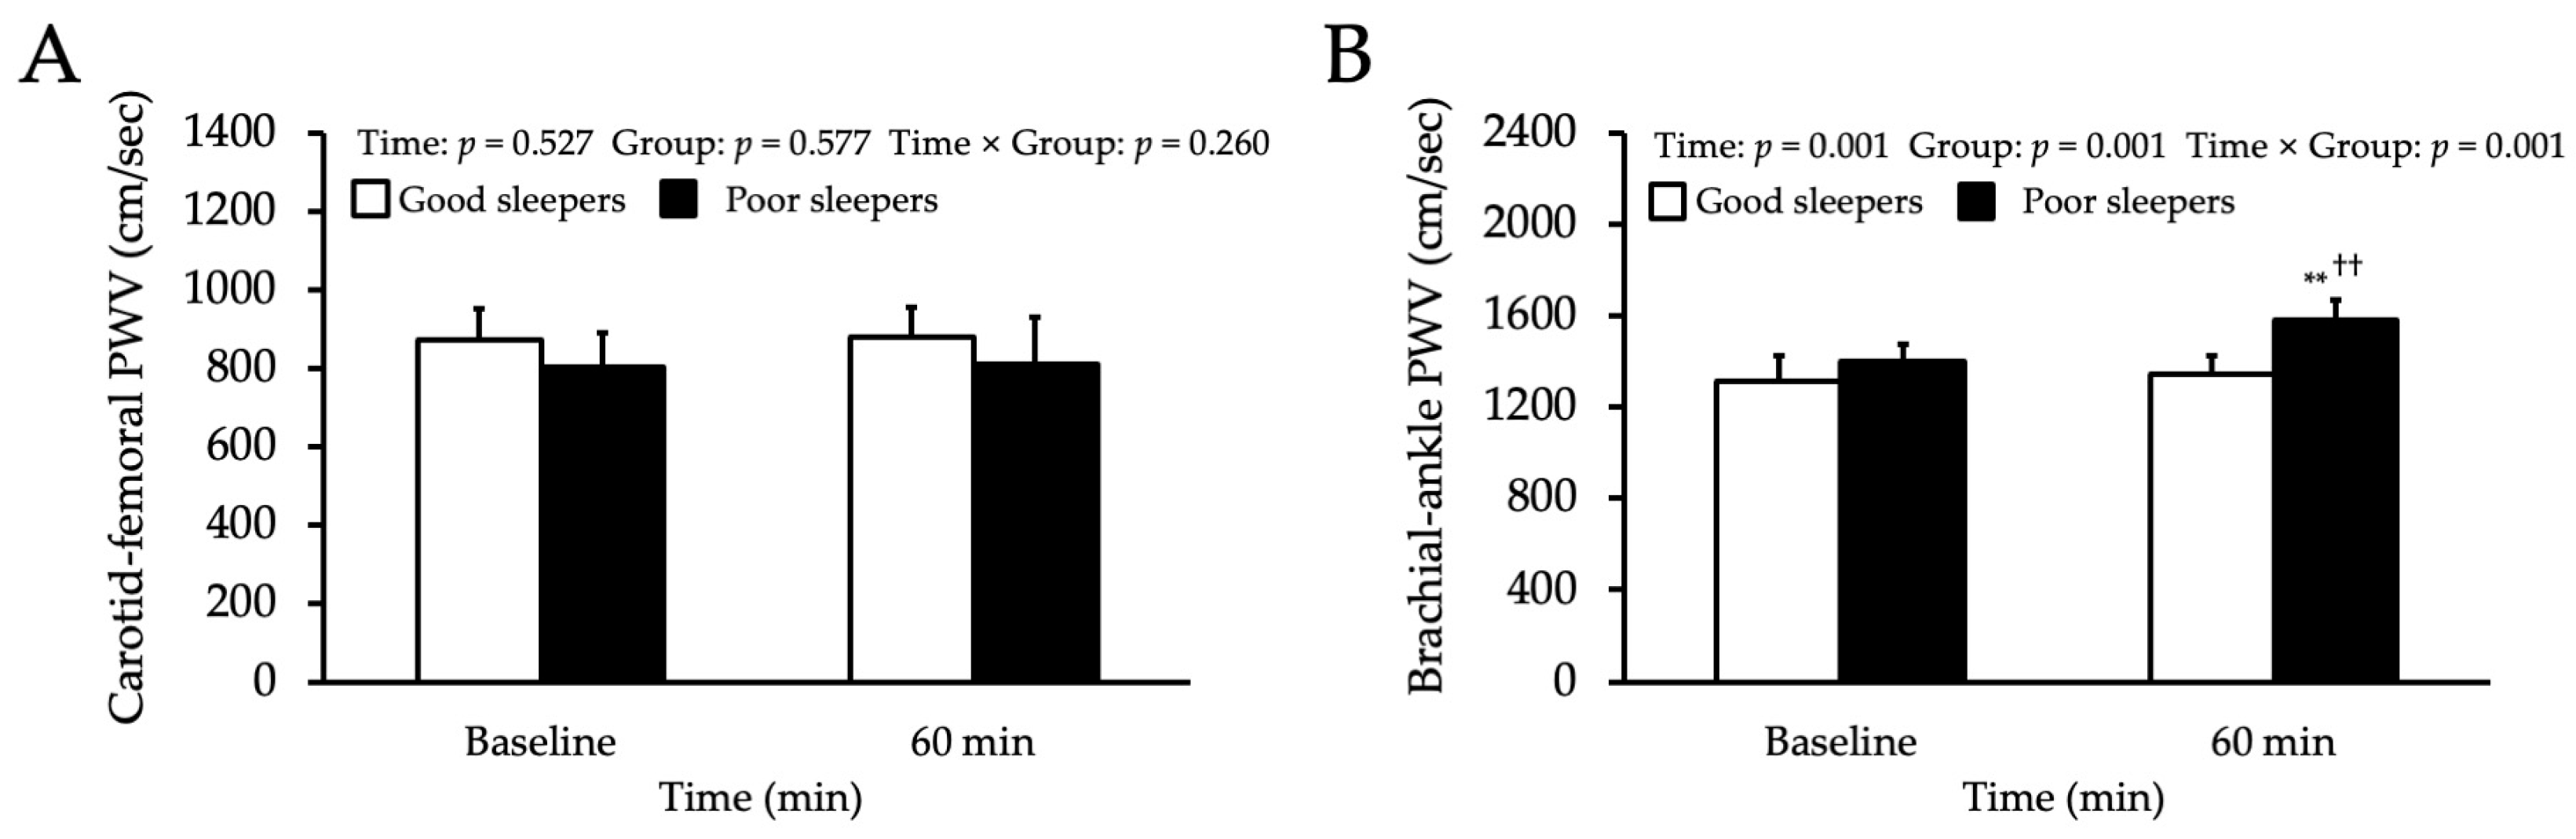
Figure 2A presents the change in cfPWV after the 75 g OGTT in both groups. No significant differences in cfPWV were observed between the groups either before or 60 min after the 75 g OGTT. In addition, cfPWV did not change significantly from baseline to 60 min in either group. Figure 2B presents the change in baPWV after the 75 g OGTT in both groups. baPWV did not differ significantly between groups before the 75 g OGTT. In the poor-sleep-quality group, baPWV increased significantly from baseline to 60 min after the 75 g OGTT (p < 0.01), whereas no such increase was observed in the good-sleep-quality group. Furthermore, baPWV at 60 min after the 75 g OGTT was significantly higher in the poor-sleep-quality group than in the good-sleep-quality group (p < 0.01).
Figure 2.
Changes in arterial stiffness before and after the 75 g OGTT in both groups. Changes in aortic and systemic pulse wave velocity (PWV) before and after the 75 g OGTT in good- and poor-sleep quality groups. (A) Carotid–femoral PWV (cfPWV; aortic stiffness) before and 60 min after the 75 g OGTT in good and poor sleepers. No significant time- or group-related changes were observed. (B) Brachial–ankle PWV (baPWV; systemic arterial stiffness) before and 60 min after the 75 g OGTT in both groups. baPWV increased significantly after the 75 g OGTT in the poor-sleep-quality group, whereas no such change was observed in the good-sleep-quality group. Values are presented as mean ± SD. ** p < 0.01 vs. baseline. †† p < 0.01 vs. good-sleep-quality group.
3.3. Carotid and Brachial Blood Pressure and Heart Rate Responses to 75 g OGTT
Table 2 presents the changes in carotid and brachial blood pressure and heart rate after the 75 g OGTT in both groups. No significant differences were observed between the groups in carotid SBP, brachial SBP, DBP, MAP, and HR either before or 60 min after the 75 g OGTT. Moreover, none of these variables changed significantly from baseline to 60 min in either group.
Table 2.
Changes in carotid and brachial blood pressure and HR before and after the 75 g OGTT.
3.4. Ankle Blood Pressure Responses to the 75 g OGTT
Table 3 presents the changes in ankle blood pressure after the 75 g OGTT in both groups. In the poor-sleep-quality group, ankle SBP, DBP, and MAP increased significantly from baseline to 60 min after the 75 g OGTT (both p < 0.01), whereas no such increases were observed in the good-sleep-quality group. Additionally, at 60 min after the 75 g OGTT, ankle SBP remained significantly higher in the poor-sleep-quality group than in the good-sleep-quality group (p < 0.01); however, no between-group differences were observed in ankle DBP and ankle MAP.
Table 3.
Changes in ankle blood pressure before and after the 75 g OGTT.
3.5. Blood Glucose Responses to the 75 g OGTT
Table 4 presents the changes in blood glucose levels after the 75 g OGTT in both groups. No significant differences in blood glucose levels were observed between the groups before the 75 g OGTT. In both groups, blood glucose levels increased significantly from baseline to 60 min after the 75 g OGTT (both p < 0.01). Furthermore, blood glucose levels at 60 min after the 75 g OGTT were significantly higher in the poor-sleep-quality group than in the good-sleep-quality group (p < 0.01).
Table 4.
Changes in blood glucose before and after the 75 g OGTT.
3.6. Relationship Between Changes in PWV and Blood Glucose
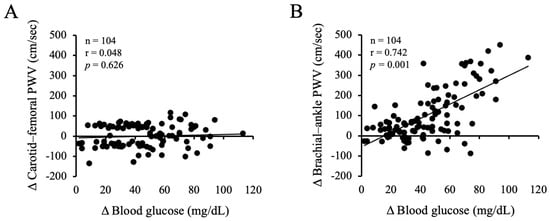
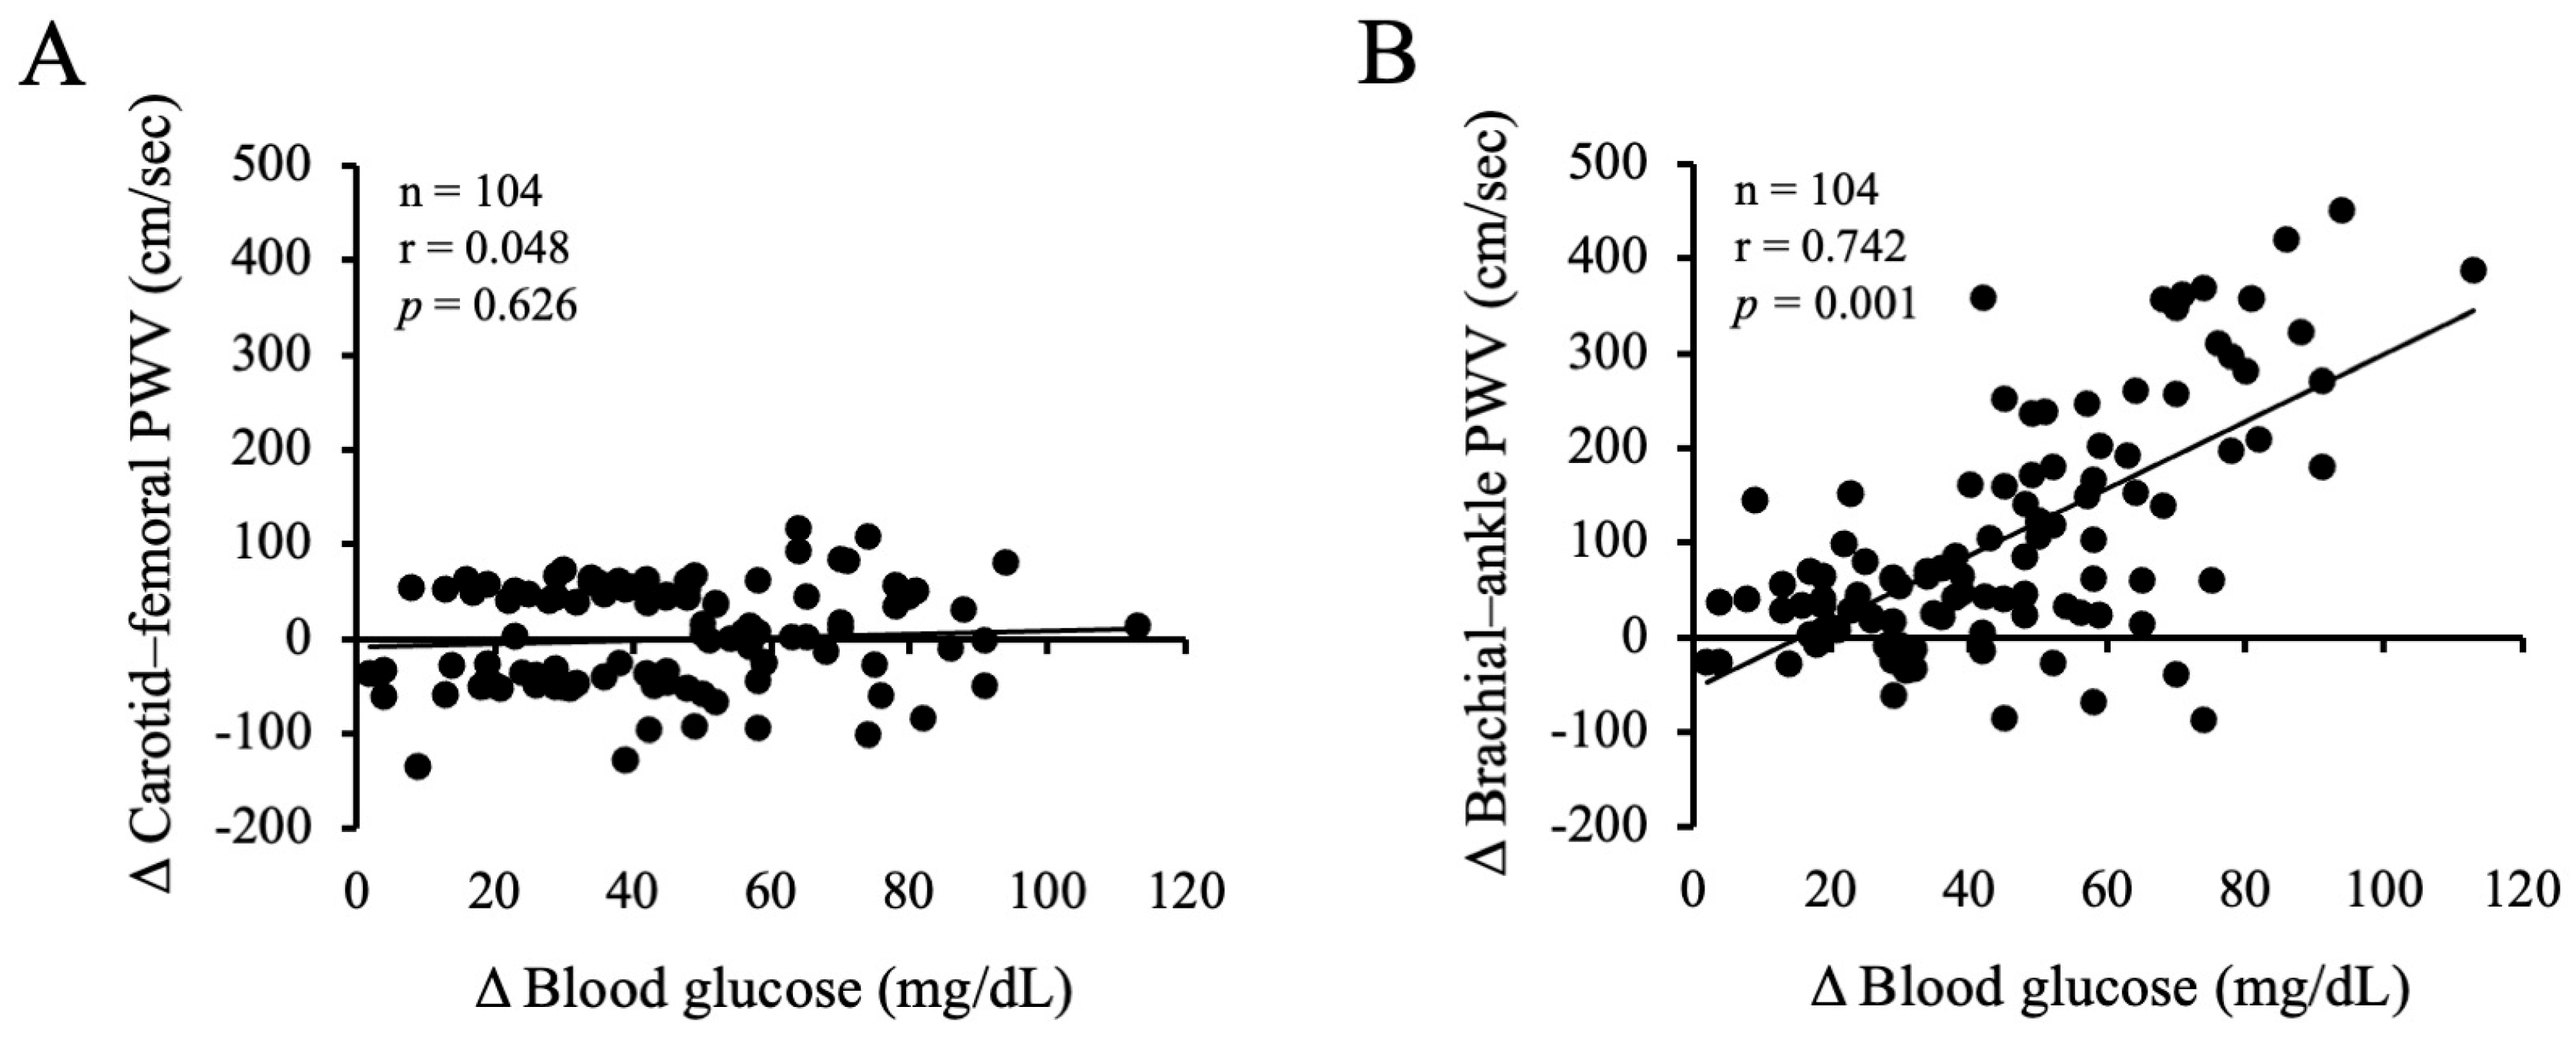
Figure 3 presents the relationships between changes in PWV and changes in blood glucose levels after the 75 g OGTT. No significant correlation was found between the change in cfPWV and the change in blood glucose levels (r = 0.048, p = 0.626). In contrast, a significant positive correlation was observed between changes in baPWV and blood glucose levels (r = 0.742, p < 0.001).
Figure 3.
Relationship between changes in PWV and blood glucose. (A) Relationship between changes in carotid–femoral pulse wave velocity (ΔcfPWV) and changes in blood glucose levels (Δblood glucose) 60 min after the 75-g OGTT in all participants (n = 104). No significant correlation was observed (r = 0.048, p = 0.626). (B) Relationship between changes in brachial–ankle pulse wave velocity (ΔbaPWV) and changes in blood glucose levels (Δblood glucose) 60 min after the 75-g OGTT in all participants (n = 104). A significant positive correlation was observed (r = 0.742, p = 0.001), indicating that greater postprandial increases in blood glucose were associated with greater increases in systemic arterial stiffness.
4. Discussion
This study examined the effects of sleep quality on postprandial blood glucose levels and arterial stiffness. The findings revealed that poor sleep quality was linked to greater increases in postprandial blood glucose levels and arterial stiffness, suggesting that an impaired sleep quality can exacerbate postprandial hyperglycemia-associated arterial stiffness.
Studies have reported that chronic sleep deprivation and a poor sleep quality contribute to reduced insulin sensitivity and β-cell dysfunction, adversely affecting glucose regulation [14,15]. A poor sleep quality is associated with heightened sympathetic nervous system activity and increased cortisol secretion, which can further affect glucose metabolism [26]. In other words, a poor sleep quality weakens insulin’s ability to control postprandial increases in blood glucose, heightening the risk of postprandial hyperglycemia, as observed 60 min after the 75 g OGTT in this study. Poor sleep efficiency and late bedtimes are associated with a more pronounced postprandial glycemic response to breakfast the next morning [27]. Sleep fragmentation in normal subjects has been reported to worsen glucose metabolism [28]. Thus, poor sleep quality might contribute to elevated postprandial blood glucose levels, and the findings of the present study similarly suggest that individuals with poor sleep quality exhibit greater postprandial glycemic excursions.
A worse sleep quality has been associated with increased arterial stiffness, as demonstrated in several studies using both subjective and objective sleep assessments [29,30]. In addition to the effects of sleep quality on arterial stiffness, previous work has shown that the combination of a poor sleep quality and low physical activity is associated with higher arterial stiffness [31]. Although physical activity levels did not differ between groups in the present study, the prior findings suggest that sleep-related vascular vulnerability may be further exacerbated when physical inactivity coexists. Poor sleep quality increases sympathetic nervous system activity [17], and it is associated with increased inflammatory cytokine secretion, which contributes to chronic endothelial dysfunction [18]. In this context, previous studies by the Vgontzas group have demonstrated that poor sleep quality, sleep deprivation, and insomnia are associated with sustained activation of the hypothalamic–pituitary–adrenal axis and the sympathetic nervous system, accompanied by elevations in circulating catecholamines and pro-inflammatory cytokines, including interleukin-6 (IL-6), on the following day [17,18,26]. These neuroendocrine and inflammatory responses have been shown to persist beyond the sleep period and are associated with adverse metabolic and vascular consequences [18,26]. Such mechanisms may partially explain the exaggerated postprandial glucose response and the greater increase in systemic arterial stiffness observed in individuals with poor sleep quality in the present study. Increased arterial stiffness results from decreased vascular elasticity and progressive stiffening of the arterial wall [32]. In other words, chronic poor sleep quality might increase arterial stiffness. Interestingly, aortic stiffness was not changed after the 75 g OGTT in either group in this study. In previous research, aortic stiffness did not change in the glucose clamp test in healthy subjects [33]. In our previous study, cfPWV did not change after a 75 g OGTT in healthy middle-aged and elderly subjects, whereas an increase in baPWV was recorded [5]. Studies in obese subjects reported an increase in aortic stiffness after eating [34]. In other words, metabolic abnormalities might be involved in the changes in aortic stiffness associated with postprandial hyperglycemia. Thus, aortic stiffness might not change in response to postprandial hyperglycemia in healthy subjects. In the future, it will be necessary to compare the changes in aortic stiffness associated with postprandial hyperglycemia in healthy middle-aged and elderly participants and those with obesity.
The results of this study suggest that poor sleep quality can increase the risk of arterial stiffness attributable to postprandial hyperglycemia, whereas good sleep quality can inhibit this increase. Blood glucose levels are associated with postprandial hyperglycemia-induced arterial stiffness and poor sleep quality. Postprandial hyperglycemia induces oxidative stress (lipid peroxidation) and decreases vascular endothelial function by increasing asymmetric dimethylarginine levels [35]. A rapid postprandial increase in blood glucose can cause oxidative stress and decrease endothelial function [36]. In the present study, individuals with poor sleep quality had higher blood glucose levels and increased arterial stiffness after the 75 g OGTT.
Furthermore, a significant positive correlation was found between blood glucose levels and systemic arterial stiffness (baPWV) after the 75 g OGTT. Thus, poor sleep quality can increase arterial stiffness, particularly in association with a rapid postprandial rise in blood glucose levels. Comparing these results with those of previous systematic reviews and related studies, the findings align with specific existing research while also presenting some discrepancies. For example, Yang et al. reported an association between poor sleep quality and blood glucose variability, consistent with the present study [37]. However, some studies did not observe a significant relationship between sleep quality and blood glucose levels [38]. These discrepancies may arise from differences in participant ages, habitual behaviors, or methodological variations in glucose assessment, suggesting that the metabolic consequences of poor sleep quality may not manifest uniformly across populations. Further investigation is warranted to clarify these inconsistencies.
Notably, a study in healthy young adults using the PSQI found no differences in peripheral blood pressure between poor- and good-quality sleep groups, and no association between sleep quality and blood glucose levels [39]. These findings contrast with our results. Such discrepancies may reflect age-related differences in vascular and metabolic vulnerability: younger adults may possess greater physiological resilience to the hemodynamic and glycemic effects of poor sleep, whereas the cumulative impact of vascular aging may amplify these effects in middle-aged and older adults. This suggests that the influence of sleep quality on postprandial glucose responses and arterial stiffness becomes more pronounced with advancing age.
Blood pressure may contribute to the increased arterial stiffness associated with postprandial hyperglycemia, attributable to poor sleep quality. Impaired sleep efficiency and fragmented sleep—key components of poor sleep quality—have been linked to reduced baroreflex sensitivity and heightened sympathetic activation, both of which can elevate blood pressure and arterial stiffness [16,19]. In this study, ankle SBP increased after the 75 g OGTT in the poor-sleep-quality group. In contrast, no change was observed in the good-sleep-quality group. Additionally, carotid SBP did not change in either group after the 75 g OGTT. Thus, carotid SBP may account for the lack of change in cfPWV. Poor sleep quality might increase peripheral vascular resistance and blood pressure, potentially contributing to the increased systemic arterial stiffness (possibly affecting peripheral arteries) associated with postprandial hyperglycemia. Thus, blood pressure may have been involved in the increase in arterial stiffness associated with postprandial hyperglycemia. Furthermore, elevated ankle blood pressure has been recognized as a predictor of cardiovascular disease. Previous studies have demonstrated that increased ankle systolic blood pressure is independently associated with future cardiovascular events and mortality, particularly in middle-aged and older adults [40]. This suggests that the postprandial increase in ankle SBP observed in the poor-sleep-quality group may reflect not only transient hemodynamic changes but also a heightened long-term cardiovascular risk. The presence of elevated peripheral blood pressure, especially at the ankle, could serve as a surrogate marker of vascular stiffness and systemic vascular resistance. Thus, sleep quality-mediated changes in ankle blood pressure following a glucose load may be clinically relevant for early cardiovascular risk stratification.
Future studies should examine the effects of sleep improvement interventions on postprandial glucose levels and arterial stiffness. Additionally, further research should assess whether similar associations exist across different age groups and populations with specific health conditions to enhance the generalizability of these findings.
Despite these findings, several limitations of this study must be highlighted. First, due to the cross-sectional nature of this study, causal relationships between sleep quality, postprandial glucose responses, and arterial stiffness cannot be established. It is also possible that subclinical vascular dysfunction may contribute to impaired sleep quality, raising the possibility of reverse causality. Therefore, the observed associations should be interpreted as correlational rather than causal. Second, although age and sex distributions did not differ significantly between the good- and poor-sleep-quality groups, stratified analyses according to metabolic syndrome status, age category, or sex were not performed. Further subdivision of participants would have resulted in small subgroup sizes and reduced statistical power, potentially leading to unstable estimates. Therefore, such subgroup analyses were not conducted in the present study.
5. Conclusions
In the present study, systemic arterial stiffness (baPWV) increased after the 75 g OGTT only in individuals with poor sleep quality, and this postprandial increase was positively associated with the rise in blood glucose levels. No changes were observed in aortic stiffness (cfPWV). These findings suggest that poor sleep quality is associated with greater postprandial increases in blood glucose levels and systemic arterial stiffness, whereas good sleep quality may help protect vascular function.
Author Contributions
R.K. and H.N. designed the research; R.K. and H.N. conducted the research; R.K. and H.N. analyzed the data; and R.K. wrote the paper. R.K. had the primary responsibility for the final content. All authors have read and agreed to the published version of the manuscript.
Funding
This work was supported by the Japan Society for the Promotion of Science (JSPS) KAKENHI, Grant Number JP23K10645 (Grant-in-Aid for Scientific Research (C)). The funder had no role in the study design; data collection, analysis, or interpretation; or in the writing of the manuscript.
Institutional Review Board Statement
This study was conducted in accordance with the Declaration of Helsinki and approved by the Ethics Committee of Teikyo University of Science (approval number: 23A053, date 4 April 2024). This study has been clinically registered with the University Hospital Medical Information Network Center (study no.: UMIN000057655).
Informed Consent Statement
Before this study began, all participants received a complete explanation of this study’s purpose and methods before providing their written informed consent.
Data Availability Statement
The data presented in this study are available from the corresponding author upon request.
Conflicts of Interest
The authors declare no conflicts of interest.
Abbreviations
The following abbreviations are used in this manuscript:
| CVD | Cardiovascular disease |
| OGTT | Oral glucose tolerance test |
| cfPWV | Carotid–femoral pulse wave velocity |
| baPWV | Brachial–ankle pulse wave velocity |
| PSQI | Pittsburgh Sleep Quality Index |
| BMI | Body mass index |
| SBP | Systolic blood pressure |
| DBP | Diastolic blood pressure |
| MAP | Mean arterial pressure |
References
- O’Keefe, J.H.; Bell, D.S.H. Postprandial Hyperglycemia/Hyperlipidemia (Postprandial Dysmetabolism) Is a Cardiovascular Risk Factor. Am. J. Cardiol. 2007, 100, 899–904. [Google Scholar] [CrossRef] [Scilit]
- DECODE Study Group; The European Diabetes Epidemiology Group. Glucose Tolerance and Cardiovascular Mortality: Comparison of Fasting and 2-Hour Diagnostic Criteria. Arch. Intern. Med. 2001, 161, 397–405. [Google Scholar] [CrossRef] [Scilit]
- Gordin, D.; Saraheimo, M.; Tuomikangas, J.; Soro-Paavonen, A.; Forsblom, C.; Paavonen, K.; Steckel-Hamann, B.; Vandenhende, F.; Nicolaou, L.; Pavo, I.; et al. Influence of Postprandial Hyperglycemic Conditions on Arterial Stiffness in Patients with Type 2 Diabetes. J. Clin. Endocrinol. Metab. 2016, 101, 1134–1143. [Google Scholar] [CrossRef] [Scilit] [PubMed]
- Tsuboi, A.; Ito, C.; Fujikawa, R.; Yamamoto, H.; Kihara, Y. Association between the Postprandial Glucose Levels and Arterial Stiffness Measured According to the Cardio-Ankle Vascular Index in Non-Diabetic Subjects. Intern. Med. 2015, 54, 1961–1969. [Google Scholar] [CrossRef] [Scilit] [PubMed]
- Kobayashi, R.; Sakazaki, M.; Nagai, Y.; Okamoto, T.; Hashimoto, Y.; Sato, K.; Seki, S.; Hata, U.; Esaki, K.; Tanigawa, R.; et al. Habitual Isomaltulose Intake Reduces Arterial Stiffness Associated with Postprandial Hyperglycemia in Middle-Aged and Elderly People: A Randomized Controlled Trial. Heart Vessels 2024, 39, 123–134. [Google Scholar] [CrossRef] [Scilit]
- Fu, S.; Chen, W.; Luo, L.; Ye, P. Roles of Fasting and Postprandial Blood Glucose in the Effect of Type 2 Diabetes on Central Arterial Stiffness: A 5-Year Prospective Community-Based Analysis. Diabetol. Metab. Syndr. 2017, 9, 33. [Google Scholar] [CrossRef] [Scilit]
- Lee, H.-Y.; Oh, B.-H. Aging and Arterial Stiffness. Circ. J. 2010, 74, 2257–2262. [Google Scholar] [CrossRef] [Scilit] [PubMed]
- Institute of Medicine (US) Committee on Sleep Medicine and Research. Sleep Disorders and Sleep Deprivation: An Unmet Public Health Problem; Colten, H.R., Altevogt, B.M., Eds.; The National Academies Collection: Reports Funded by National Institutes of Health; National Academies Press: Washington, DC, USA, 2006; ISBN 978-0-309-10111-0. [Google Scholar]
- Hirshkowitz, M.; Whiton, K.; Albert, S.M.; Alessi, C.; Bruni, O.; DonCarlos, L.; Hazen, N.; Herman, J.; Katz, E.S.; Kheirandish-Gozal, L.; et al. National Sleep Foundation’s Sleep Time Duration Recommendations: Methodology and Results Summary. Sleep Health 2015, 1, 40–43. [Google Scholar] [CrossRef] [Scilit]
- Spiegel, K.; Tasali, E.; Leproult, R.; Van Cauter, E. Effects of Poor and Short Sleep on Glucose Metabolism and Obesity Risk. Nat. Rev. Endocrinol. 2009, 5, 253–261. [Google Scholar] [CrossRef] [Scilit]
- Mesarwi, O.; Polak, J.; Jun, J.; Polotsky, V.Y. Sleep Disorders and the Development of Insulin Resistance and Obesity. Endocrinol. Metab. Clin. N. Am. 2013, 42, 617–634. [Google Scholar] [CrossRef] [Scilit]
- Kim, T.W.; Jeong, J.-H.; Hong, S.-C. The Impact of Sleep and Circadian Disturbance on Hormones and Metabolism. Int. J. Endocrinol. 2015, 2015, 591729. [Google Scholar] [CrossRef] [Scilit]
- Pomeroy, A.; Pagan Lassalle, P.; Kline, C.E.; Heffernan, K.S.; Meyer, M.L.; Stoner, L. The Relationship between Sleep Duration and Arterial Stiffness: A Meta-Analysis. Sleep Med. Rev. 2023, 70, 101794. [Google Scholar] [CrossRef] [Scilit]
- Spiegel, K.; Leproult, R.; Van Cauter, E. Impact of Sleep Debt on Metabolic and Endocrine Function. Lancet 1999, 354, 1435–1439. [Google Scholar] [CrossRef] [Scilit]
- Buxton, O.M.; Pavlova, M.; Reid, E.W.; Wang, W.; Simonson, D.C.; Adler, G.K. Sleep Restriction for 1 Week Reduces Insulin Sensitivity in Healthy Men. Diabetes 2010, 59, 2126–2133. [Google Scholar] [CrossRef] [Scilit] [PubMed]
- Kato, M.; Phillips, B.G.; Sigurdsson, G.; Narkiewicz, K.; Pesek, C.A.; Somers, V.K. Effects of Sleep Deprivation on Neural Circulatory Control. Hypertension 2000, 35, 1173–1175. [Google Scholar] [CrossRef] [Scilit] [PubMed]
- Greenlund, I.M.; Carter, J.R. Sympathetic Neural Responses to Sleep Disorders and Insufficiencies. Am. J. Physiol. Heart Circ. Physiol. 2022, 322, H337–H349. [Google Scholar] [CrossRef] [Scilit]
- Irwin, M.R.; Wang, M.; Campomayor, C.O.; Collado-Hidalgo, A.; Cole, S. Sleep Deprivation and Activation of Morning Levels of Cellular and Genomic Markers of Inflammation. Arch. Intern. Med. 2006, 166, 1756–1762. [Google Scholar] [CrossRef] [Scilit] [PubMed]
- Liu, L.-F.; Wang, Y.-W.; Sun, J.-C.; Wang, Y.-K.; Tan, X.; Wang, W.-Z. Sleep Deprivation Reduces the Baroreflex Sensitivity through Elevated Angiotensin (Ang) II Subtype 1 Receptor Expression in the Nucleus Tractus Solitarii. Front. Neurosci. 2024, 18, 1401530. [Google Scholar] [CrossRef] [Scilit]
- Sugawara, J.; Hayashi, K.; Yokoi, T.; Cortez-Cooper, M.Y.; DeVan, A.E.; Anton, M.A.; Tanaka, H. Brachial-Ankle Pulse Wave Velocity: An Index of Central Arterial Stiffness? J. Hum. Hypertens. 2005, 19, 401–406. [Google Scholar] [CrossRef] [Scilit]
- Kobayashi, R.; Sato, K.; Takahashi, T.; Asaki, K.; Iwanuma, S.; Ohashi, N.; Hashiguchi, T. Effects of a Short-Term Increase in Physical Activity on Arterial Stiffness during Hyperglycemia. J. Clin. Biochem. Nutr. 2020, 66, 238–244. [Google Scholar] [CrossRef] [Scilit]
- Committee of the Japan Diabetes Society on the Diagnostic Criteria of Diabetes Mellitus; Seino, Y.; Nanjo, K.; Tajima, N.; Kadowaki, T.; Kashiwagi, A.; Araki, E.; Ito, C.; Inagaki, N.; Iwamoto, Y.; et al. Report of the Committee on the Classification and Diagnostic Criteria of Diabetes Mellitus. J. Diabetes Investig. 2010, 1, 212–228. [Google Scholar] [CrossRef] [Scilit] [PubMed]
- Doi, Y.; Minowa, M.; Uchiyama, M.; Okawa, M.; Kim, K.; Shibui, K.; Kamei, Y. Psychometric Assessment of Subjective Sleep Quality Using the Japanese Version of the Pittsburgh Sleep Quality Index (PSQI-J) in Psychiatric Disordered and Control Subjects. Psychiatry Res. 2000, 97, 165–172. [Google Scholar] [CrossRef] [Scilit]
- Gando, Y.; Yamamoto, K.; Murakami, H.; Ohmori, Y.; Kawakami, R.; Sanada, K.; Higuchi, M.; Tabata, I.; Miyachi, M. Longer Time Spent in Light Physical Activity Is Associated with Reduced Arterial Stiffness in Older Adults. Hypertension 2010, 56, 540–546. [Google Scholar] [CrossRef] [Scilit]
- Kang, H. Sample Size Determination and Power Analysis Using the G*Power Software. J. Educ. Eval. Health Prof. 2021, 18, 17. [Google Scholar] [CrossRef] [Scilit] [PubMed]
- Hirotsu, C.; Tufik, S.; Andersen, M.L. Interactions between Sleep, Stress, and Metabolism: From Physiological to Pathological Conditions. Sleep Sci. 2015, 8, 143–152. [Google Scholar] [CrossRef] [Scilit]
- Tsereteli, N.; Vallat, R.; Fernandez-Tajes, J.; Delahanty, L.M.; Ordovas, J.M.; Drew, D.A.; Valdes, A.M.; Segata, N.; Chan, A.T.; Wolf, J.; et al. Impact of Insufficient Sleep on Dysregulated Blood Glucose Control under Standardised Meal Conditions. Diabetologia 2022, 65, 356–365. [Google Scholar] [CrossRef] [Scilit]
- Stamatakis, K.A.; Punjabi, N.M. Effects of Sleep Fragmentation on Glucose Metabolism in Normal Subjects. Chest 2010, 137, 95–101. [Google Scholar] [CrossRef] [Scilit]
- Choi, Y.; Akazawa, N.; Zempo-Miyaki, A.; Ra, S.-G.; Maeda, S. Sleep Quality Is Associated with Central Arterial Stiffness in Postmenopausal Women: A Cross-Sectional Pilot Study. Artery Res. 2021, 27, 14–19. [Google Scholar] [CrossRef] [Scilit]
- Osonoi, Y.; Mita, T.; Osonoi, T.; Saito, M.; Tamasawa, A.; Nakayama, S.; Someya, Y.; Ishida, H.; Kanazawa, A.; Gosho, M.; et al. Poor Sleep Quality Is Associated with Increased Arterial Stiffness in Japanese Patients with Type 2 Diabetes Mellitus. BMC Endocr. Disord. 2015, 15, 29. [Google Scholar] [CrossRef] [Scilit] [PubMed]
- Choi, Y.; Kosaki, K.; Akazawa, N.; Tanahashi, K.; Maeda, S. Combined Effects of Sleep and Objectively-Measured Daily Physical Activity on Arterial Stiffness in Middle-Aged and Older Adults. Exp. Gerontol. 2024, 188, 112397. [Google Scholar] [CrossRef] [Scilit]
- Cecelja, M.; Chowienczyk, P. Role of Arterial Stiffness in Cardiovascular Disease. JRSM Cardiovasc. Dis. 2012, 1, cvd.2012.012016. [Google Scholar] [CrossRef] [Scilit]
- Puzantian, H.; Teff, K.; Townsend, R.R. Investigating the Effect of Glucose on Aortic Pulse Wave Velocity Using Pancreatic Clamping Methodology. Biol. Res. Nurs. 2015, 17, 270–275. [Google Scholar] [CrossRef] [Scilit]
- Baynard, T.; Carhart, R.L.; Weinstock, R.S.; Ploutz-Snyder, L.L.; Kanaley, J.A. Short-Term Exercise Training Improves Aerobic Capacity with No Change in Arterial Function in Obesity. Eur. J. Appl. Physiol. 2009, 107, 299–308. [Google Scholar] [CrossRef] [Scilit]
- Mah, E.; Noh, S.K.; Ballard, K.D.; Matos, M.E.; Volek, J.S.; Bruno, R.S. Postprandial Hyperglycemia Impairs Vascular Endothelial Function in Healthy Men by Inducing Lipid Peroxidation and Increasing Asymmetric Dimethylarginine:Arginine. J. Nutr. 2011, 141, 1961–1968. [Google Scholar] [CrossRef] [Scilit] [PubMed]
- Ceriello, A.; Taboga, C.; Tonutti, L.; Quagliaro, L.; Piconi, L.; Bais, B.; Da Ros, R.; Motz, E. Evidence for an Independent and Cumulative Effect of Postprandial Hypertriglyceridemia and Hyperglycemia on Endothelial Dysfunction and Oxidative Stress Generation: Effects of Short- and Long-Term Simvastatin Treatment. Circulation 2002, 106, 1211–1218. [Google Scholar] [CrossRef] [Scilit] [PubMed]
- Yang, Y.; Zhao, L.-H.; Li, D.-D.; Xu, F.; Wang, X.-H.; Lu, C.-F.; Wang, C.-H.; Yu, C.; Zhang, X.-L.; Ning, L.-Y.; et al. Association of Sleep Quality with Glycemic Variability Assessed by Flash Glucose Monitoring in Patients with Type 2 Diabetes. Diabetol. Metab. Syndr. 2021, 13, 102. [Google Scholar] [CrossRef] [Scilit]
- Zhu, B.; Hershberger, P.E.; Kapella, M.C.; Fritschi, C. The Relationship between Sleep Disturbance and Glycaemic Control in Adults with Type 2 Diabetes: An Integrative Review. J. Clin. Nurs. 2017, 26, 4053–4064. [Google Scholar] [CrossRef] [Scilit] [PubMed]
- Culver, M.N.; Langan, S.P.; Carreker, J.; Flatt, A.A.; Ratchford, S.M.; Grosicki, G.J. Self-Reported Sleep Quality Is Associated with Central Hemodynamics in Healthy Individuals. Sleep Breath. 2020, 24, 1083–1088. [Google Scholar] [CrossRef] [Scilit]
- Hendriks, E.J.E.; Westerink, J.; de Jong, P.A.; de Borst, G.J.; Nathoe, H.M.; Mali, W.P.T.M.; van der Graaf, Y.; van der Schouw, Y.T.; Beulens, J.W. SMART Study Group Association of High Ankle Brachial Index with Incident Cardiovascular Disease and Mortality in a High-Risk Population. Arterioscler. Thromb. Vasc. Biol. 2016, 36, 412–417. [Google Scholar] [CrossRef] [Scilit]

Disclaimer/Publisher’s Note: The statements, opinions and data contained in all publications are solely those of the individual author(s) and contributor(s) and not of MDPI and/or the editor(s). MDPI and/or the editor(s) disclaim responsibility for any injury to people or property resulting from any ideas, methods, instructions or products referred to in the content. |
© 2026 by the authors. Licensee MDPI, Basel, Switzerland. This article is an open access article distributed under the terms and conditions of the Creative Commons Attribution (CC BY) license.