


Abstract
Aflatoxin B1 (AFB1), a potent carcinogenic compound produced by Aspergillus flavus and Aspergillus parasiticus, poses a serious threat to food safety and public health. Existing AFB1 detection methods are highly sensitive but often require sophisticated equipment and trained personnel. In this study, we developed a simple colorimetric aptasensor for AFB1 detection and evaluated the performance of thiol- and non-thiol aptamers. We optimized the sensing system by testing different combinations of gold nanoparticle (AuNP) size and H2O2 concentration, followed by pH, temperature, and reaction time. The highest catalytic response was obtained using 5 nm AuNPs and 1 M H2O2 at pH 5, 25 °C, with a 5-min reaction time. The thiol-aptamer-based sensor exhibited a linear response over the concentration range of 15–50 ppb, with a limit of detection of 0.7 ppb and a correlation coefficient (R2) of 0.9943. In comparison, the non-thiol aptamer-based sensor showed a limit of detection of 1.05 ppb and an R2 of 0.9825. The thiol aptamer consistently outperformed the non-thiol aptamer. Specificity studies showed that sensors with both aptamers responded selectively to AFB1, whereas responses to AFB2, FB1, and OTA were significantly lower. The developed aptasensor demonstrated promising performance for rapid and selective detection of AFB1.
1. Introduction
Aflatoxins are mycotoxins naturally produced by Aspergillus flavus and A. parasiticus, which thrive in warm, humid conditions and can contaminate food crops, such as peanuts, maize, and rice, during growth, harvest, and storage [1]. The four major types are AFB1, AFB2, AFG1, and AFG2, with other M forms produced by hydroxylation of AFB1 and AFB2 [2]. Among these, AFB1 is the most potent and is classified as a Group 1 human carcinogen by the International Agency for Research on Cancer (IARC) [3]. Exposure to AFB1 can cause hepatocellular carcinoma (HCC), immunosuppression, embryonic toxicity, and acute aflatoxicosis [4]. Research has shown that AFB1 exposure accounts for 75–85% of liver cancer cases worldwide, while aflatoxin ingestion is linked to 4.6–28.2% of HCC cases [5]. Approximately 4.5 billion people and 25% of the world’s food crops are at risk of aflatoxin contamination [6]. Existing detection methods, such as enzyme-linked immunosorbent assay (ELISA) and high-performance liquid chromatography (HPLC), offer high sensitivity but are costly, require complex sample preparation, have long analysis times, and rely on specialized laboratory equipment and skilled personnel, limiting their on-site applicability [7]. While some analytical methods may not be suitable for fast on-site analysis due to their complexity and the lack of corresponding laboratory facilities, new detection methods are sought that provide sufficient sensitivity while remaining simple, low-cost, and fast. For the monitoring of food contaminants, sensing methods based on nanotechnology are currently receiving a lot of attention.
Nanotechnology uses nanomaterials and particles with dimensions of approximately 1–100 nm and offers transformative potential for addressing food safety challenges, such as identifying harmful toxins [8]. Among nanoparticles, gold nanoparticles (AuNPs) are widely used for their unique properties, including high mechanical strength, high surface-to-volume ratio, ease of modification, biocompatibility, and catalytic activity [9]. Integrating AuNPs with aptamers creates highly sensitive and portable detection systems. Moreover, AuNPs possess intrinsic peroxidase-mimicking properties, enabling them to catalyze the oxidation of chromogenic substrates such as 3,3′,5,5′-tetramethylbenzidine (TMB) in the presence of hydrogen peroxide (H2O2), resulting in a visible color change. This property enables naked-eye detection of AFB1 contamination without complex instrumentation [10]. In addition, AuNPs have numerous applications, such as biomedical applications, active food packaging, agriculture, water treatment, and even in the textile industry. AuNPs are positively charged, allowing them to interact with both Gram-positive and Gram-negative bacteria. For instance, Faujasite-supported AuNPs of 5 nm in diameter exhibited antimicrobial activity against E. coli and Salmonella Typhi, with reductions of 90–95% in bacterial colonies [11]. In addition to their antimicrobial activity, AuNPs possess great antioxidant activity. In particular, carboxymethylated frankincense resin displayed dose-dependent free radical scavenging activity, whereas AuNPs, synthesized at −1 V, were found to scavenge 36.80% of free radicals [12]. Given their unique optical properties and ease of surface modification, AuNPs have been extensively explored for bioimaging, cancer therapy including photothermal therapy, and drug delivery applications. However, their biotoxicity and biodistribution need to be investigated in more detail [13]. In the food industry, AuNPs can be used for active food packaging to improve the shelf life of food and to ensure food safety. AuNPs can also be used to detect plant pathogens and pesticides, and to purify water [14]. In addition, AuNP-based porous films were found to be catalytically active for the degradation of nitrophenol, with a degradation efficiency of 90% after 7 cycles [15]. Their incorporation into textile fibers could impart the materials with antimicrobial activity, UV protection, electrical conductivity, filtration, and sensing capabilities [16]. These properties make AuNPs good candidates for the development of colorimetric sensors for the detection of food contaminants, including aflatoxin.
Aptamers are single-stranded DNA or RNA molecules typically 20 to 80 nucleotides long that exhibit high specificity and affinity for diverse targets, including toxins. The term “aptamer,” derived from the Latin word aptus, meaning “fitting,” was coined to reflect their precise binding capability. The development of aptamers was first reported in 1990, when Tuerk and Gold introduced the Systematic Evolution of Ligands by Exponential Enrichment (SELEX) method, which enables selection of aptamers with desired properties. Their ability to fold into unique three-dimensional structures, such as hairpins and stem-loops, enhances binding interactions and enables target recognition. Single-stranded DNA (ssDNA) aptamers are widely used for their cost-effectiveness, modifiability, and stability [17,18]. They have proven highly effective in detecting small molecules and toxic compounds. Moreover, aptamers are increasingly integrated into biosensor platforms, known as aptasensors, thereby enhancing the effective monitoring of biotoxins in food and environmental samples, making them valuable tools for real-time detection in various settings [19].
Nevertheless, the performance of the AuNP-based aptasensor also depends on the catalytic activity of AuNPs and the surface binding mode of the recognition moiety, i.e., the aptamer. Thiolated aptamers form strong Au–S bonds with AuNPs, whereas non-thiol aptamers rely on non-covalent interactions with the AuNP surface [20,21]. These alternative binding modes may affect aptamer orientation, surface organization, target binding, and consequently, the sensing ability of the system. Thus, comparing thiol- and non-thiol aptamer configurations is worthwhile for understanding their influence on sensor performance. Furthermore, AuNP size, H2O2 concentration, pH, temperature, and reaction time are additional factors that can influence TMB oxidation and aptamer–AuNP interactions [22]. Comprehensive optimization of these parameters is therefore necessary to obtain a sensitive and reproducible response. Although colorimetric approaches have been investigated, only a few studies have systematically optimized reaction conditions for AFB1 detection in peanuts using AuNPs, TMB, and H2O2. Also, limited studies have compared the responses of thiol- and non-thiol aptamer functionalization on the same AuNP-based sensing platform. In this study, we developed a colorimetric aptasensor for the rapid detection of AFB1 by integrating the peroxidase-like activity of AuNPs with aptamer-based recognition. The key reaction conditions were optimized to achieve a consistent and suitable colorimetric response. Both thiol and non-thiol aptamer configurations were tested for AFB1 detection, and their analytical performance was compared to provide insights into the effect of aptamer attachment to AuNPs on the aptasensor for detecting food contaminants in peanuts. Additionally, the selectivity of the developed aptasensors was evaluated against potential interfering mycotoxins.
2. Materials and Methods
2.1. Reagents
Hydrogen peroxide (H2O2), 3,3′,5,5′-Tetramethylbenzidine (TMB) liquid substrate system (ELISA grade), gold nanoparticles (5, 10, 20, and 30 nm), acetate buffer (pH 5.0), Tris hydrochloride solution (1 M), tris (2-carboxyethyl) phosphine (TCEP), and methanol were purchased from Fisher Scientific (Pittsburgh, PA, USA). The AFB1-specific thiol aptamer (5′-GTT GGG CAC GTG TTG TCT CTC TGT GTC TCG TGC CCT TCG CTA GGC CCA CA-(CH2)6-SH-3′) and AFB1 non-thiol aptamer (5′-GTT GGG CAC GTG TTG TCT CTC TGT GTC TCG TGC CCT TCG CTA GGC CCA CA-3′) were obtained from Creative Biolabs Inc. (Shirley, NY, USA). Aflatoxin B1 (AFB1) standard was purchased from Sigma-Aldrich (St. Louis, MO, USA).
2.2. Instrumentation
An Evolution Pro UV–Vis spectrophotometer (Fisher Scientific, Pittsburgh, PA, USA) was used to characterize the AuNPs and measure the absorbance of reaction mixtures during the optimization experiments. The absorbance of oxidized TMB (oxTMB) was monitored at 650 nm to evaluate AuNP-mediated peroxidase-like activity. An Epoch 2 microplate reader (BioTek Instruments, Winooski, VT, USA) was used to measure absorbance at 650 nm during optimization of the thiol and non-thiol aptamer concentrations based on their inhibition of AuNP-mediated TMB oxidation. An Orion A111 pH meter (Thermo Fisher Scientific, Pittsburgh, PA, USA) was used to measure and adjust the pH of the acetate buffer. A Dual Poly Pro water bath (Revolutionary Science, Lindstrom, MN, USA) was used to incubate reaction mixtures at the temperatures investigated during optimization. An Eppendorf 5424 centrifuge was used to spin down the desalting columns during aptamer preparation, and AFLA-V AQUA IKA Peanut Kit (VICAM, a Waters Corporation business, Milford, MA, USA) was used to analyze spiked peanuts.
2.3. Optimization of Gold Nanoparticle Size and Hydrogen Peroxide Concentration
Three final H2O2 reaction concentrations (0.25, 0.5, and 1.0 M) were tested with a fixed concentration of AuNPs of four sizes (5, 10, 20, and 30 nm). In each reaction, 200 µL of AuNPs (5.47 × 10¹² particles/mL), 200 µL of TMB, acetate buffer (10 mM, pH 4), and 100 µL of each H2O2 concentration were mixed and incubated at 25 °C for 15 min. Absorbance was recorded at 650 nm using a UV–Vis spectrophotometer (Fisher Scientific, Pittsburgh, PA, USA). The AuNP size and H2O2 concentration that produced the best colorimetric results were used in further experiments.
2.4. Optimization of pH, Temperature, and Reaction Time
After determining the optimal AuNP size and H2O2 concentration in the system, the effects of pH (3.0, 4.0, and 5.0), temperature (20, 25, and 30 °C), and incubation time (5, 10, and 15 min) were investigated in combination. Acetate buffers at the respective pH values were used. AuNPs (200 µL, 5.47 × 10¹² particles/mL), TMB (200 µL), acetate buffer (10 mM, 200 µL), and H2O2 (100 µL) were combined to prepare the reaction mixtures. The reaction mixtures were then incubated at the specified temperature for the indicated time, and absorbance was measured at 650 nm using a UV–Vis spectrophotometer. The condition yielding the strongest and most stable colorimetric response was selected for subsequent studies.
2.5. Optimization of Aptamer Functionalization with Gold Nanoparticles
2.5.1. Thiol Aptamer
AuNPs selected from the initial optimization step were functionalized with aptamers at concentrations of 0.1, 0.3, 0.5, 1, 3, and 5 µM. The aptamer was reconstituted to 100 µM, reduced with 10 mM Tris (2-carboxyethyl) phosphine (TCEP) by incubation at room temperature for 2 h, and then diluted to the desired concentrations. The solutions were incubated at 95 °C for 5 min; then left at room temperature for 15 min. Next, 50 µL of each aptamer solution was mixed with 50 µL of AuNPs (5.47 × 10¹² particles/mL) and incubated for 30 min. Then, acetate buffer (10 mM, 50 µL), TMB (50 µL), and H2O2 (20 µL) were added to all solutions, and the mixtures were incubated under optimized conditions. Color development was monitored, and absorbance was measured at 650 nm using a UV-Vis spectrophotometer. The optimal aptamer concentration was selected based on the maximum inhibition of AuNPs catalytic activity.
2.5.2. Non-Thiol Aptamer
AuNPs selected from the initial optimization were functionalized with aptamers at different concentrations. Initially, concentrations of 0, 0.1, 0.3, 0.5, 1, 3, and 5 µM were evaluated, and after the preliminary tests, the range was extended to 10–100 µM. The aptamer was first reconstituted, and the desired concentrations were prepared. Each aptamer concentration was folded by incubation at 95 °C for 5 min; afterwards, it was left at room temperature for 15 min. 50 µL of each aptamer was mixed with 50 µL of AuNPs (5.47 × 10¹² particles/mL) and incubated for 30 min. Subsequently, the AuNPs-aptamer conjugates were aged in 50 mM NaCl for 24 h. Finally, 50 µL of acetate buffer (10 mM) at the optimized pH, 50 µL of TMB, and 20 µL of optimized H2O2 concentration were added, and the mixture was incubated at the same optimal time and temperature. After incubation, the absorbance was recorded at 650 nm using a UV-Vis spectrophotometer.
2.6. Detection of AFB1 Standards with Aptasensor
A series of known AFB1 concentrations (0, 15, 20, 25, 30, 40, and 50 ppb) were prepared by diluting the AFB1 standard solution in methanol. The prepared AFB1 solutions were incubated with AuNP-aptamer conjugates under optimized thiol and non-thiol aptamer conditions for 30 min. After incubation, 50 µL of acetate buffer (10 mM) at the optimal pH, 50 µL of TMB, and 50 µL of optimal H2O2 concentration were added to each reaction mixture. The reactions were further incubated under optimized temperature and time conditions, and absorbance was measured at 650 nm using an Epoch microplate reader. A calibration graph was plotted as absorbance against AFB1 concentration and the limit of detection (LOD) was calculated from this data.
TEM Characterization of AuNPs Under Different Reaction Conditions
The morphology of AuNPs in six different samples was examined by transmission electron microscopy (TEM). The samples included AuNPs, AuNPs with non-thiol AFB1 aptamer, AuNPs with thiol AFB1 aptamer, AuNPs with TMB and H2O2, AuNPs with non-thiol AFB1 aptamer and in the presence of AFB1, TMB, and H2O2, and AuNPs with thiol AFB1 aptamer and in the presence of AFB1, TMB, and H2O2. The samples were prepared separately according to the corresponding experimental procedures optimized in this study and deposited onto carbon-coated copper grids. Excess solution was removed, and the grids were air-dried before taking the TEM images to examine the morphology and distribution of the AuNPs in the different situations. The obtained TEM images were compared to each other in order to reveal differences in the morphology of the AuNPs as a function of aptamer conjugation, AFB1 binding, and the presence of colorimetric reaction components.
2.7. Specificity of Colorimetric Sensor
To assess the specificity of the aptamer-based colorimetric sensor, AFB1 and three non-target mycotoxins, Aflatoxin B2 (AFB2), Fumonisin B1 (FB1), and Ochratoxin (OTA), were tested at 50 ppb using the same sensor under optimized conditions with both thiolated and non-thiolated aptamers. After incubating 50 µL of each toxin with the AuNP conjugate, the colorimetric reaction was initiated by adding TMB and H2O2, and the reaction was carried out at the optimized temperature and time. The absorbance responses for AFB1 were compared with those of the other mycotoxins.
2.8. Real-Sample Analysis
Peanuts with skins were spiked with AFB1 at four concentrations (15 ppb, 20 ppb, 25 ppb, and 30 ppb). Approximately 10 ± 0.5 g of each of the spiked samples were left under a fume hood for 24 h to allow the methanol to evaporate. The samples were quantified using Afla-V strips. Five grams of each ground peanut sample was mixed with 10 mL of 80:20 (v/v) methanol–water and vortexed for 5 min. The mixture was then centrifuged at 2000 rpm for 10 min. The supernatant was then filtered through a 0.45 µm Whatman filter, and the filtrate was diluted 100-fold in 2 mM phosphate buffer at pH 7.0. 50 µL of the diluted sample was then analyzed using the aptasensor under the optimized assay conditions, and the recovery rates were calculated using Equation (2).
2.9. Data Analysis
Data were analyzed using R statistical software (Version 4.6.1; R Foundation for Statistical Computing, Vienna, Austria). Results are presented as mean ± standard error (SE) (n = 3). Calibration curves were generated by linear regression. Differences among experimental groups were evaluated using analysis of variance (ANOVA) with Tukey’s Honestly Significant Difference (HSD) post hoc test where appropriate. Statistical significance was set at p < 0.05.
LOD was calculated using the signal-to-noise ratio method (S/N = 3), based on the standard deviation of the blank (S) and the slope (m) of the calibration curve (Equation (1)).
3. Results and Discussion
3.1. Optimization of Gold Nanoparticle Size and Hydrogen Peroxide Concentration
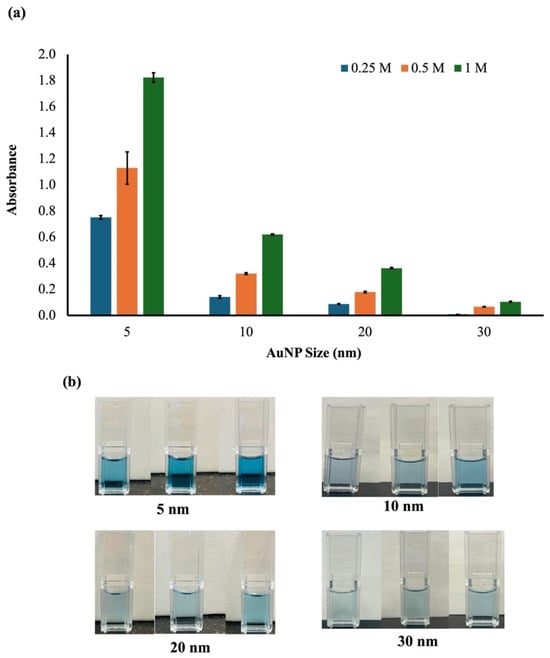
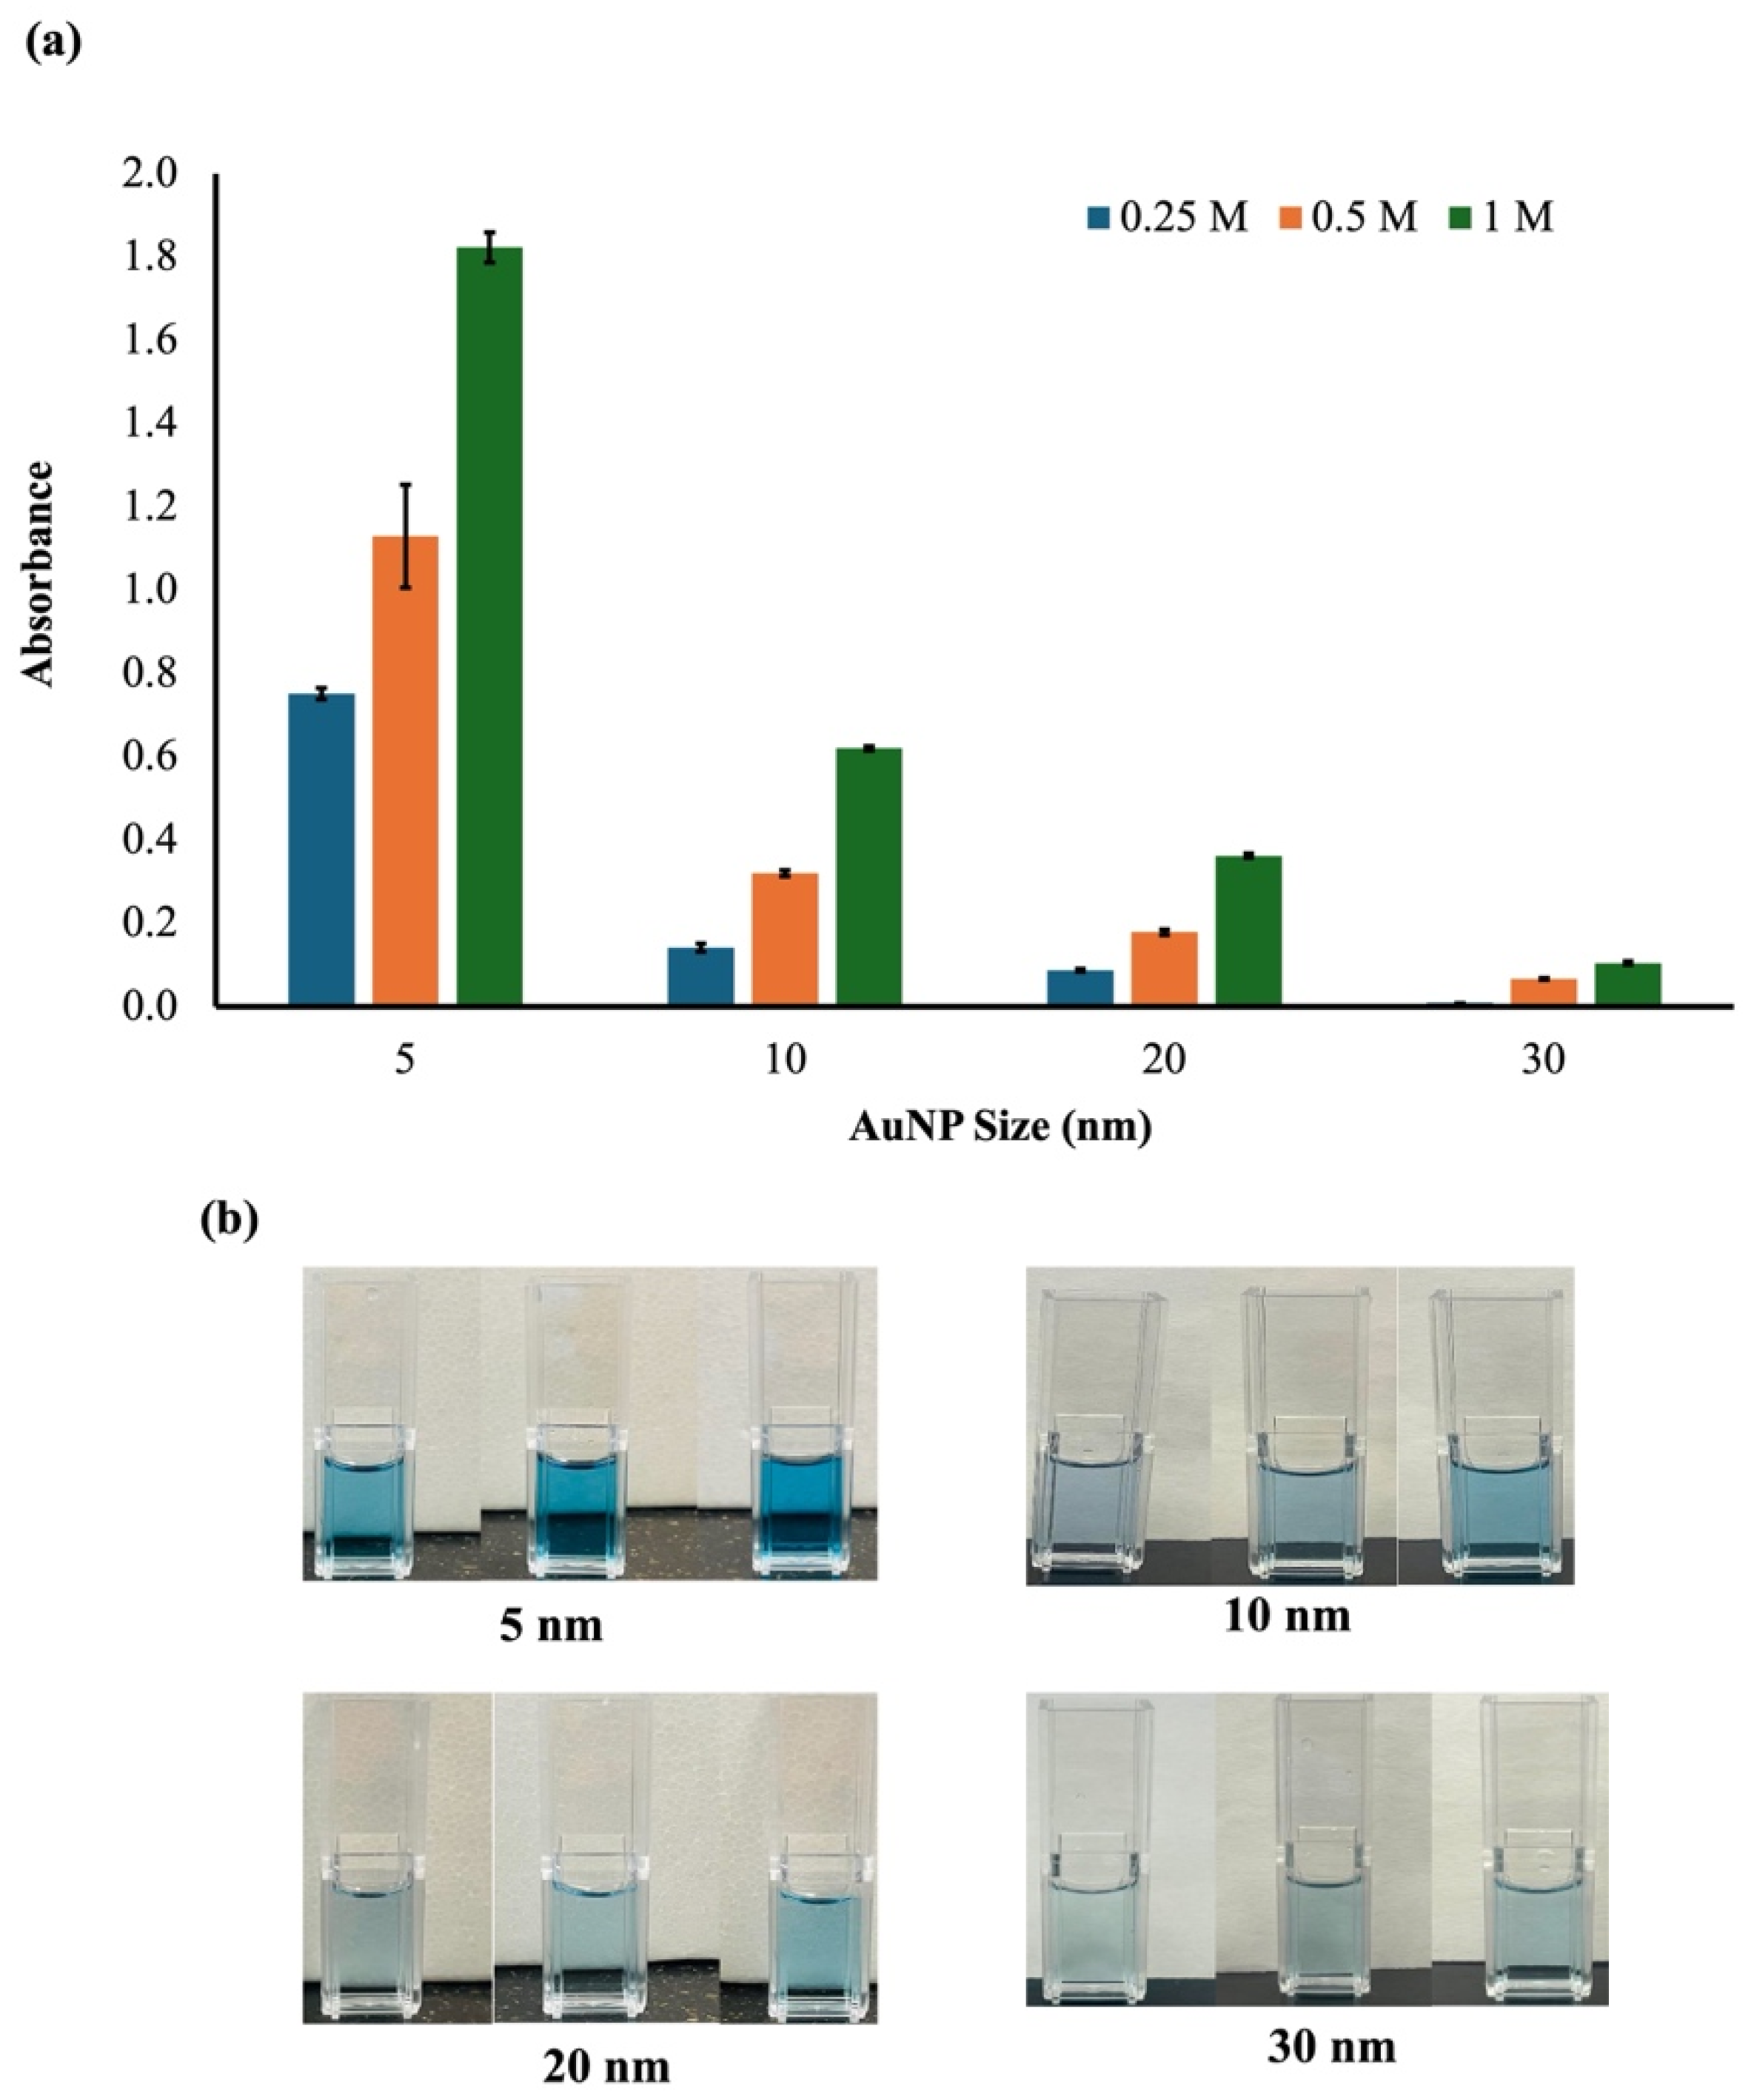
Several reaction factors, including hydrogen peroxide concentration and nanoparticle size, influence the catalytic activity of AuNPs in oxidizing 3,3′,5,5′-tetramethylbenzidine. To determine the optimal conditions for the colorimetric detection system, AuNP sizes (5, 10, 20, and 30 nm) and hydrogen peroxide concentrations (0.25, 0.5, and 1.0 M) were evaluated. The intensity of the blue coloration and absorbance at 650 nm served as the basis for optimization (Figure 1a,b). As shown in Figure 1b, the colorimetric response varied with both AuNP size and H2O2 concentration, and the maximum absorbance and blue color intensity were observed with 5 nm AuNPs and 1 M H2O2. Based on these results, 5 nm AuNPs and a final H2O2 concentration of 1 M in the reaction mixture were selected for further experiments.
Figure 1.
Effect of AuNP size and H2O2 concentration on the TMB colorimetric response. (a) Absorbance of the TMB oxidation reaction in the presence of AuNPs of different sizes (5, 10, 20, and 30) at varying H2O2 concentrations (0.25, 0.5, and 1.0 M). (b) Visual colorimetric response showing TMB oxidation under different AuNP sizes and H2O2 concentrations. Bars represent the mean ± SE (n = 3).
The high catalytic response observed for 5 nm AuNPs can be attributed to their larger surface area available for the catalytic reaction compared with that of larger AuNPs. As nanozymes with a higher surface-area-to-volume ratio, 5 nm AuNPs have more catalytic sites available to oxidize TMB molecules than larger AuNPs, as previously reported [23]. In addition, catalytic TMB oxidation increases as the H2O2 concentration rises to saturation (1 M). This linear or saturating relationship suggests that at 1 M, more efficient use of the surface-active sites on the nanoparticle can lead to a stronger colorimetric response of TMB for the oxTMB product. The catalytic reaction mechanism involves the adsorption of hydrogen peroxide molecules on the surface of the AuNP, which can cause its decomposition and the production of highly reactive hydroxyl radicals (OH). A high concentration of hydrogen peroxide increases the formation of large amounts of highly reactive hydroxyl radicals; consequently, the AuNP surface promotes electron transfer and O-O bond cleavage, enabling the fast oxidation of TMB to the blue-oxidized product (oxTMB) [24,25].
3.2. Optimization of pH, Temperature, and Reaction Time
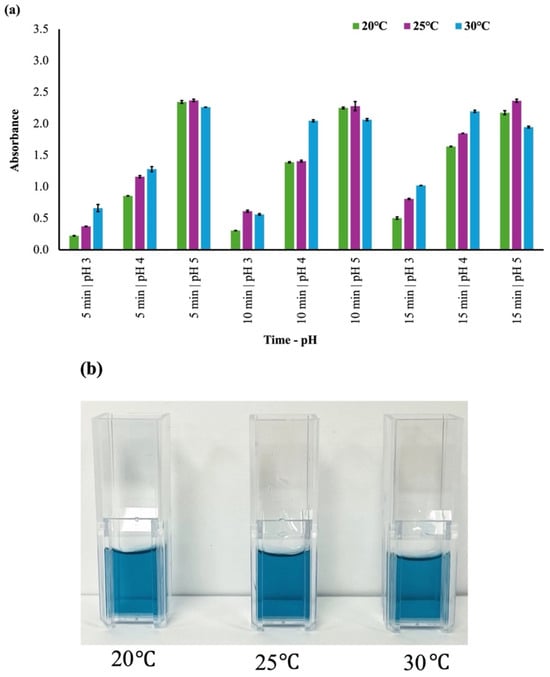
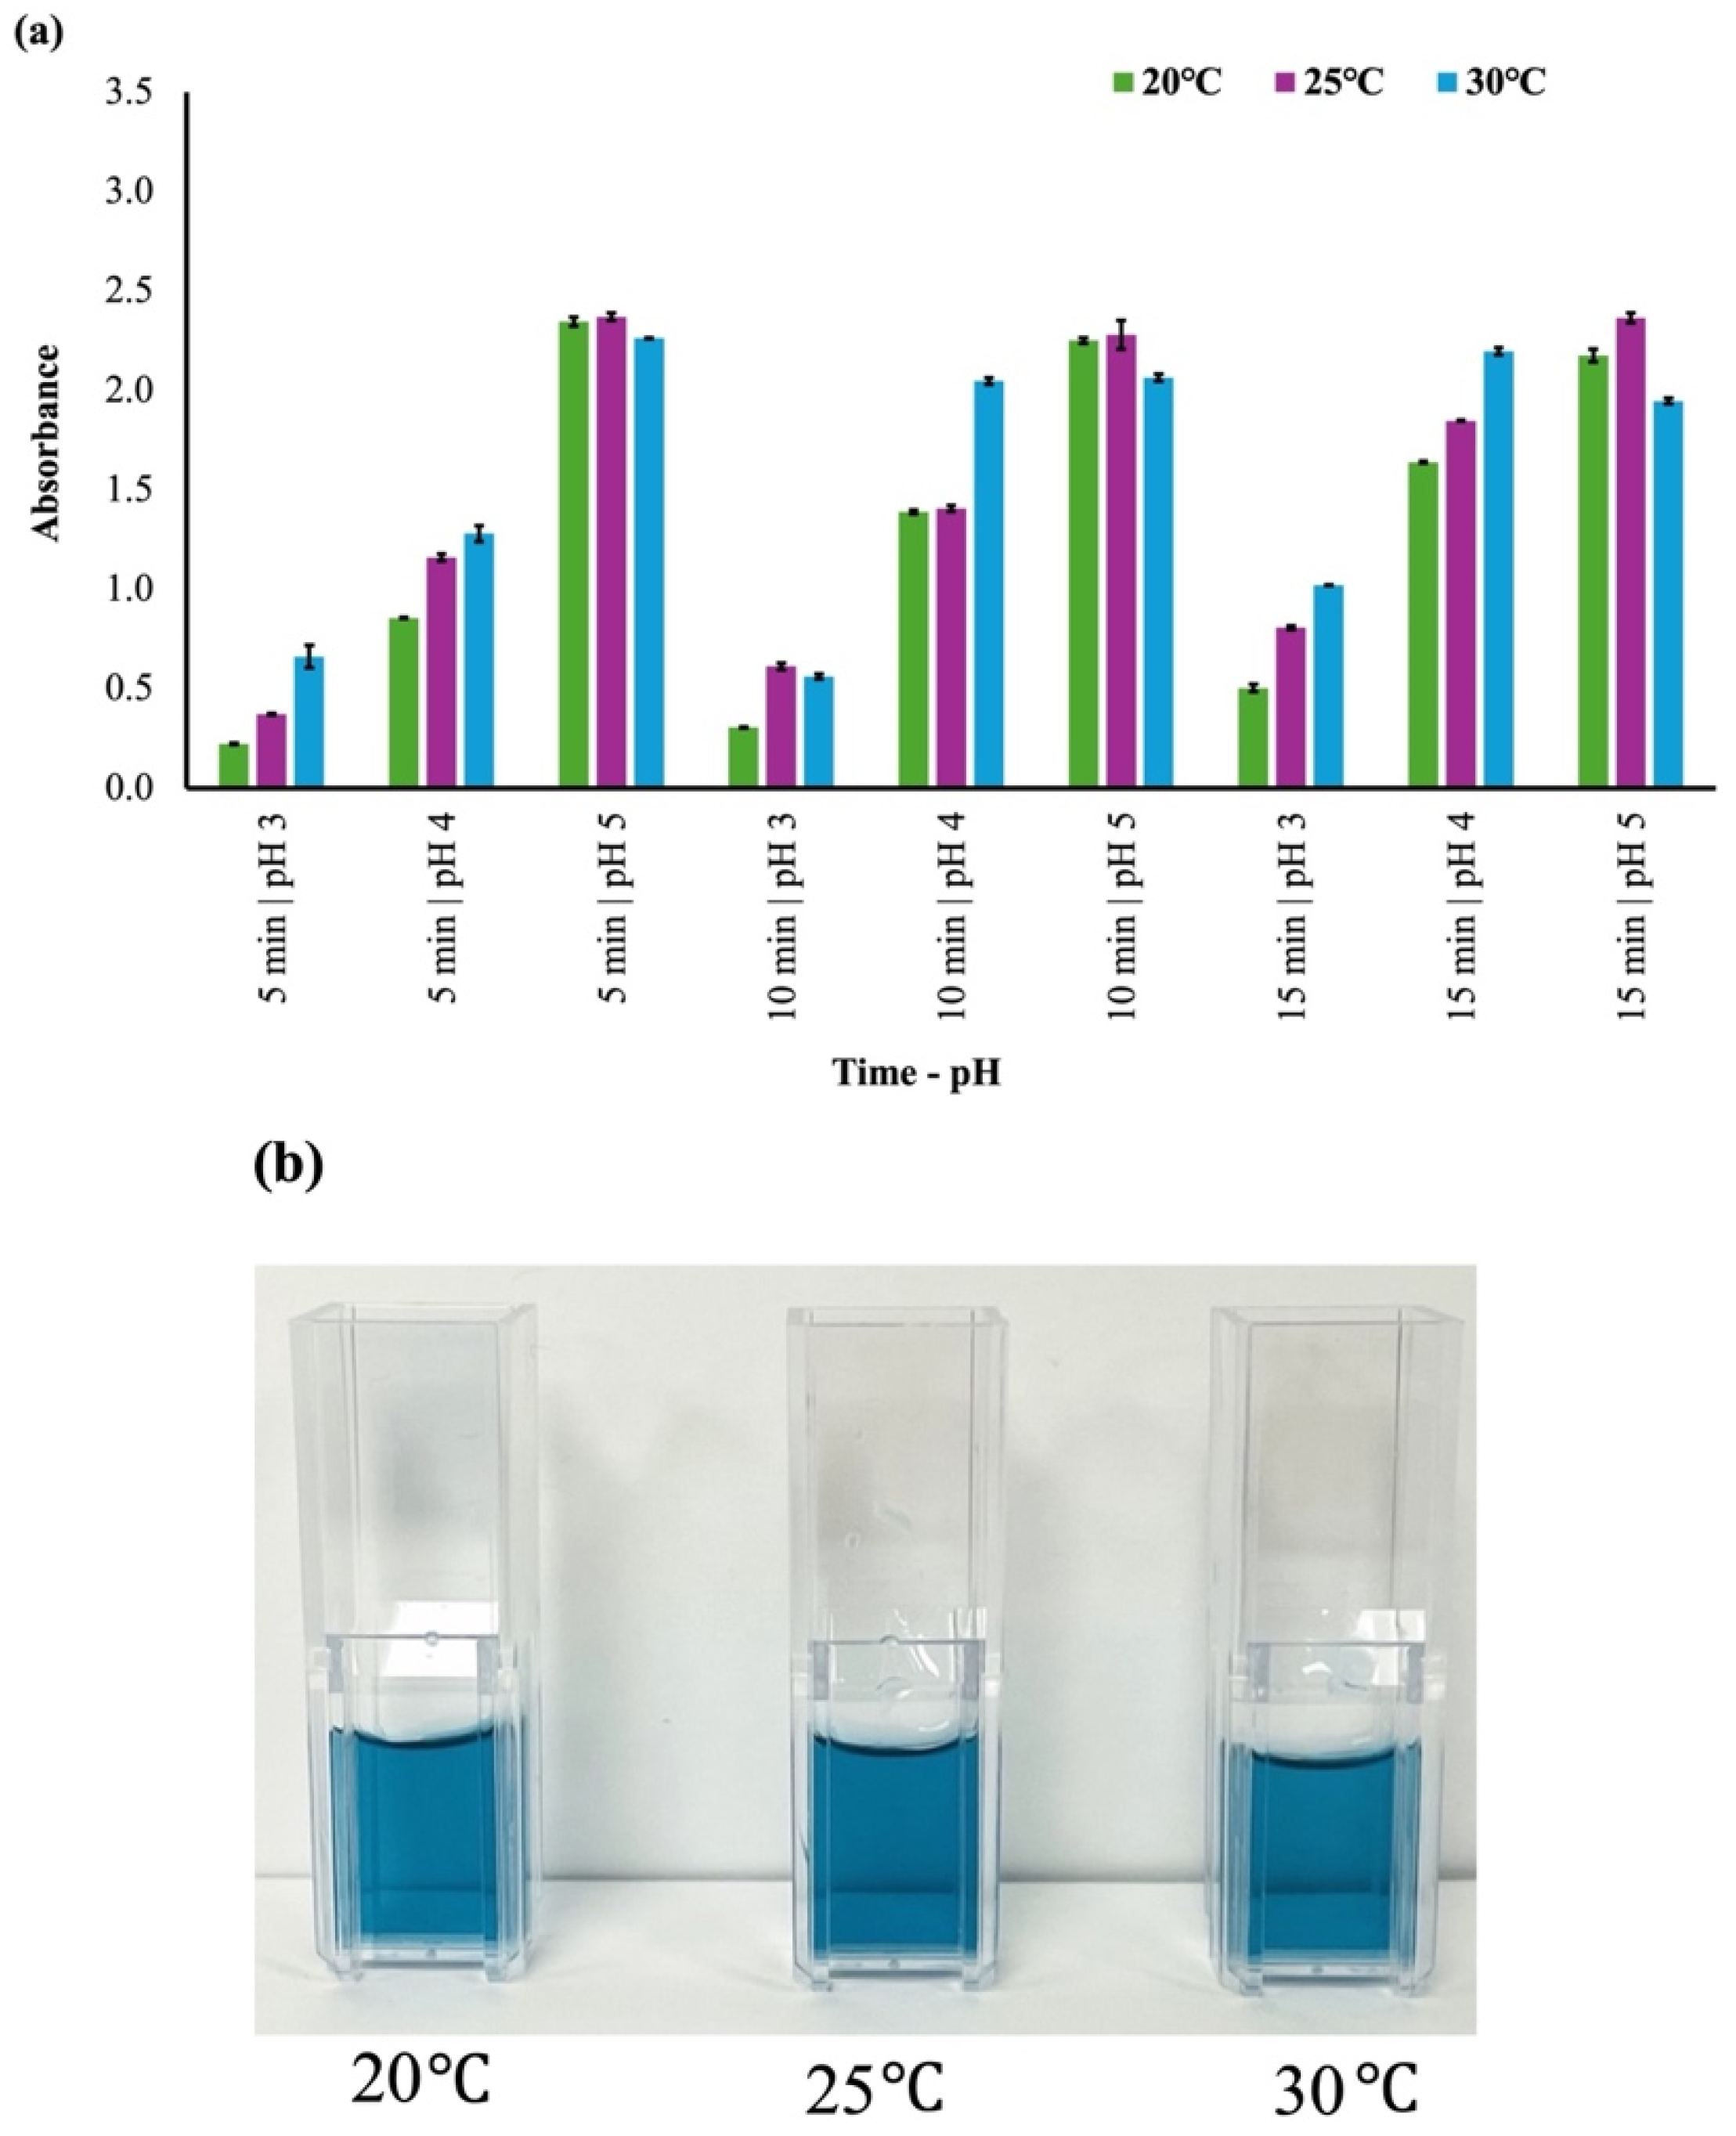
The effects of pH, temperature, and reaction time were evaluated to identify the optimal conditions for oxidizing TMB in the presence of hydrogen peroxide and AuNPs, as these factors influence the catalytic activity of AuNPs, the stability of TMB, and the rate of color development. Colorimetric responses were measured across the combinations of pH, temperature, and reaction time tested. The highest absorbance was observed at pH 5, 25 °C, and 5 min, with an average absorbance of 2.372, with responses at 10 and 15 min under the same pH and temperature conditions closely comparable (Figure 2), with average absorbance of 2.282 and 2.366. The conditions of pH 5, 25 °C, and 5 min were selected, indicating that this combination enhanced the peroxidase-like activity of AuNPs and created the optimal environment for rapid and stable color development.
Figure 2.
Combined effects of pH, incubation time, and temperature on the TMB colorimetric response. (a) Absorbance values showing how pH, incubation time, and temperature influence TMB oxidation in the presence of gold nanoparticles and H2O2. (b) Corresponding visual color changes observed under different experimental conditions (5 min, pH, 20 °C, 25 °C, and 30 °C). Bars represent the mean ± SE (n = 3).
Furthermore, the high absorbance observed at pH 5 indicates that protonation of TMB’s amino groups was favored at this pH, thereby enhancing binding affinity for the AuNP surface and promoting electron transfer and oxidation. In addition, the acidic medium was found to be an ideal environment for the peroxidase-like behavior of AuNPs and for H2O2 breakdown, converting it into highly reactive hydroxyl radicals (OH), as previously reported for enhanced AuNP nanozyme activity near pH 3.5–5.5 [26,27,28].
In addition, the optimal response at 25 °C indicates that ambient temperature provides a favorable balance between reaction kinetics and nanoparticle stability, as temperature directly affects the rate of catalytic reactions and the structural integrity of the stabilizing layers around AuNPs. At moderate temperatures, reactants readily migrate to the nanoparticle surface, enabling effective electron-transfer interactions among AuNPs, H2O2, and TMB, as reported previously [29]. Thus, the results support the hypothesis that pH, temperature, and time influence the oxidation of TMB. Overall, the optimized conditions of pH 5, 25 °C, and 5 min were selected for subsequent aptamer optimization and AFB1 detection.
3.3. Optimization of Thiol Aptamer Functionalization with Gold Nanoparticles
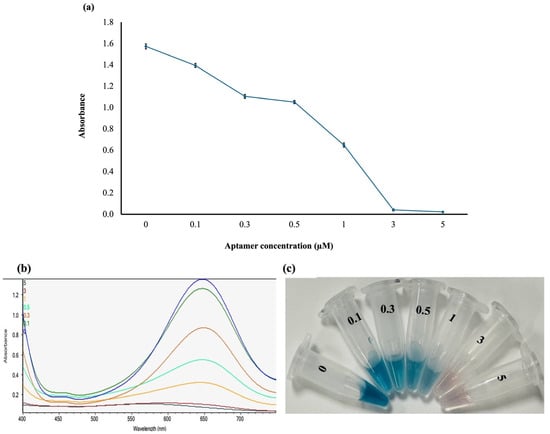
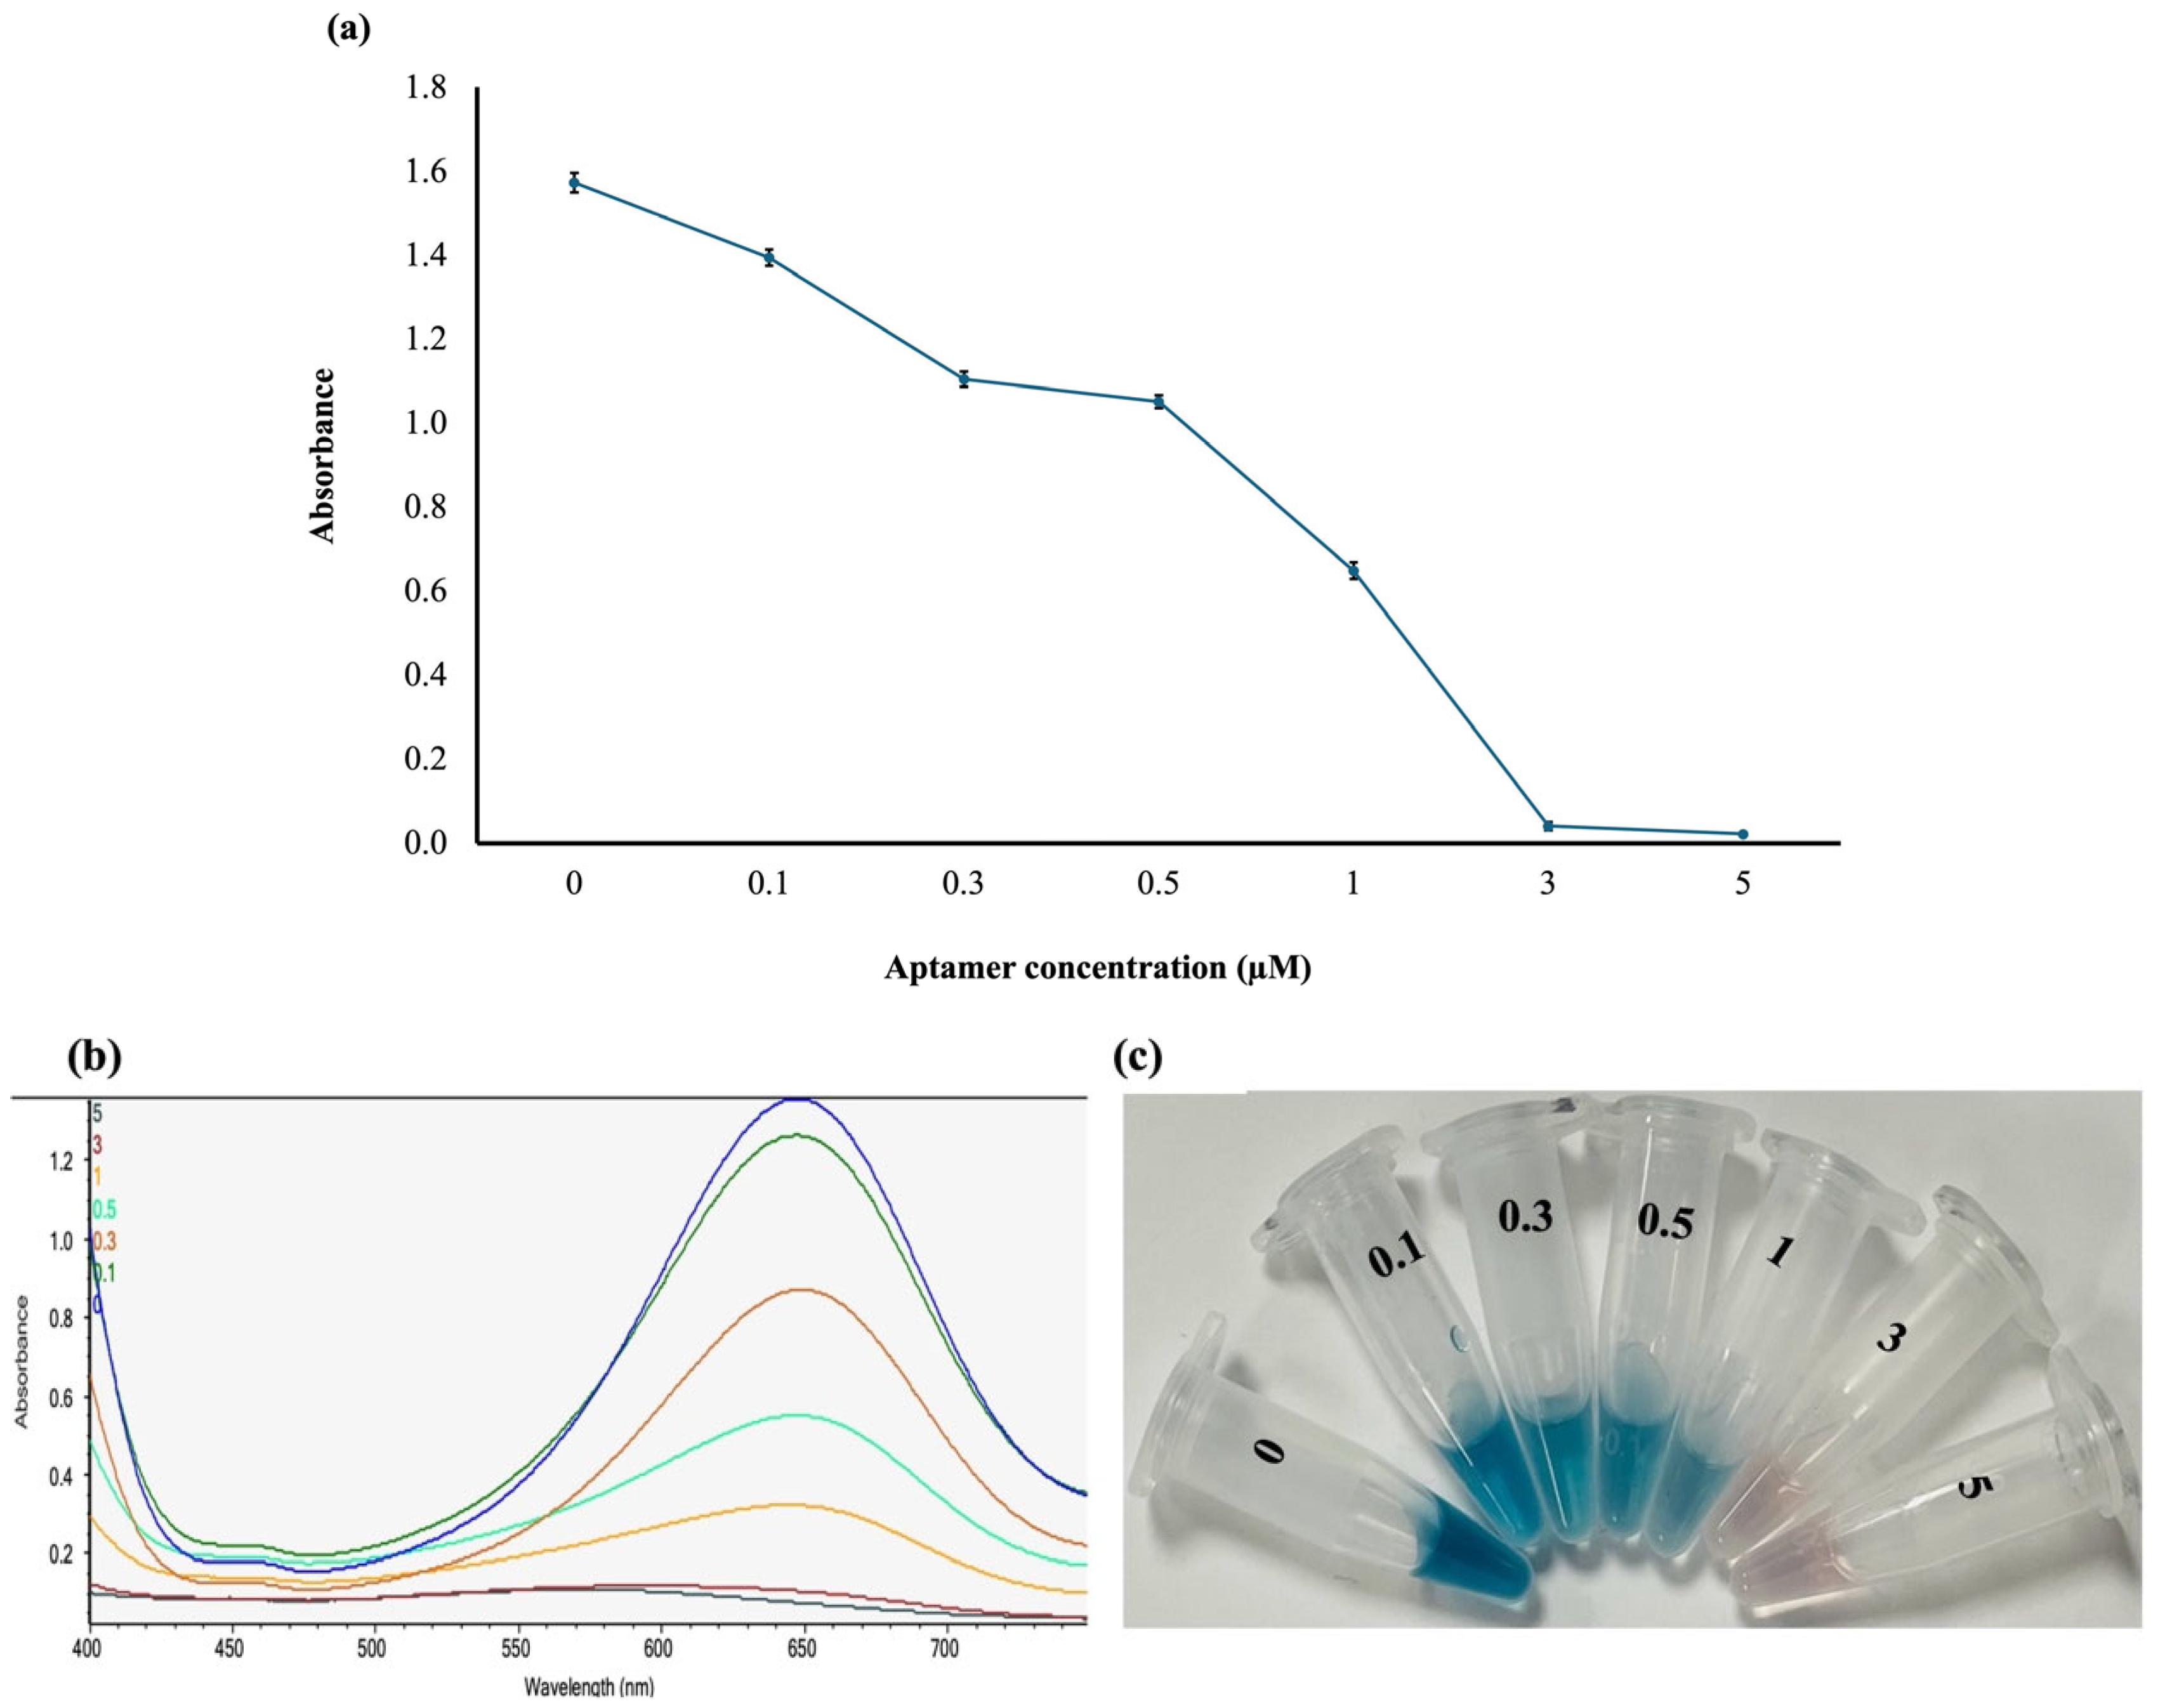
The concentration of the thiol aptamer was also optimized to determine the concentration that best blocks AuNPs in the absence of AFB1. In this analysis, different concentrations were tested, and the optimal thiol aptamer concentration to inhibit the catalytic activity of AuNPs was 5 µM, as shown in Figure 3a, with the corresponding spectrophotometric absorbance (Figure 3b) and colorimetric response (Figure 3c). The absorbance decreased as thiol aptamer concentration increased until the optimal concentration of 5 µM was reached. Other concentrations of the thiol aptamers did not completely block the AuNP surface, resulting in a slight blue color. The 3 µM aptamer concentration yielded a comparatively low absorbance, indicating good surface coverage, but was less efficient than the 5 µM concentration, which showed the lowest absorbance and the best surface blocking. The optimum concentration of 5 µM was attributed to saturation of the AuNP surface with thiol aptamers, thereby reducing the AuNP surface’s accessibility to TMB. Thiol aptamers have a high affinity for gold nanoparticles through covalent Au–S interactions, enabling rapid immobilization and stable surface functionalization [30]. With increasing thiol aptamer concentration, more aptamer molecules were anchored to the surface of AuNPs, gradually altering the catalytic interface for TMB oxidation. Similar behavior was observed by Zhang et al., in which aptamer adsorption on the AuNP surface increased gradually with increasing aptamer concentration, reaching saturation at 5 µM [31].
Figure 3.
Effect of different thiol aptamer concentrations on AuNP catalytic activity in the absence of AFB1. (a) Graph showing the effect of aptamer concentration on the catalytic activity of the gold nanoparticles. (b) Spectrophotometric absorbance values measured at 650 nm. (c) Colorimetric response at different aptamer concentrations. Data are presented as mean ± SE (n = 3).
3.4. Optimization of Non-Thiol Aptamer Functionalization with Gold Nanoparticles
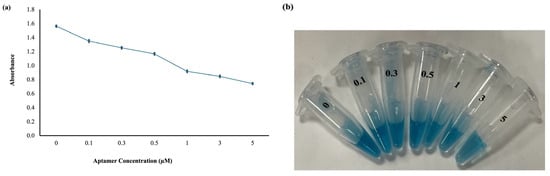
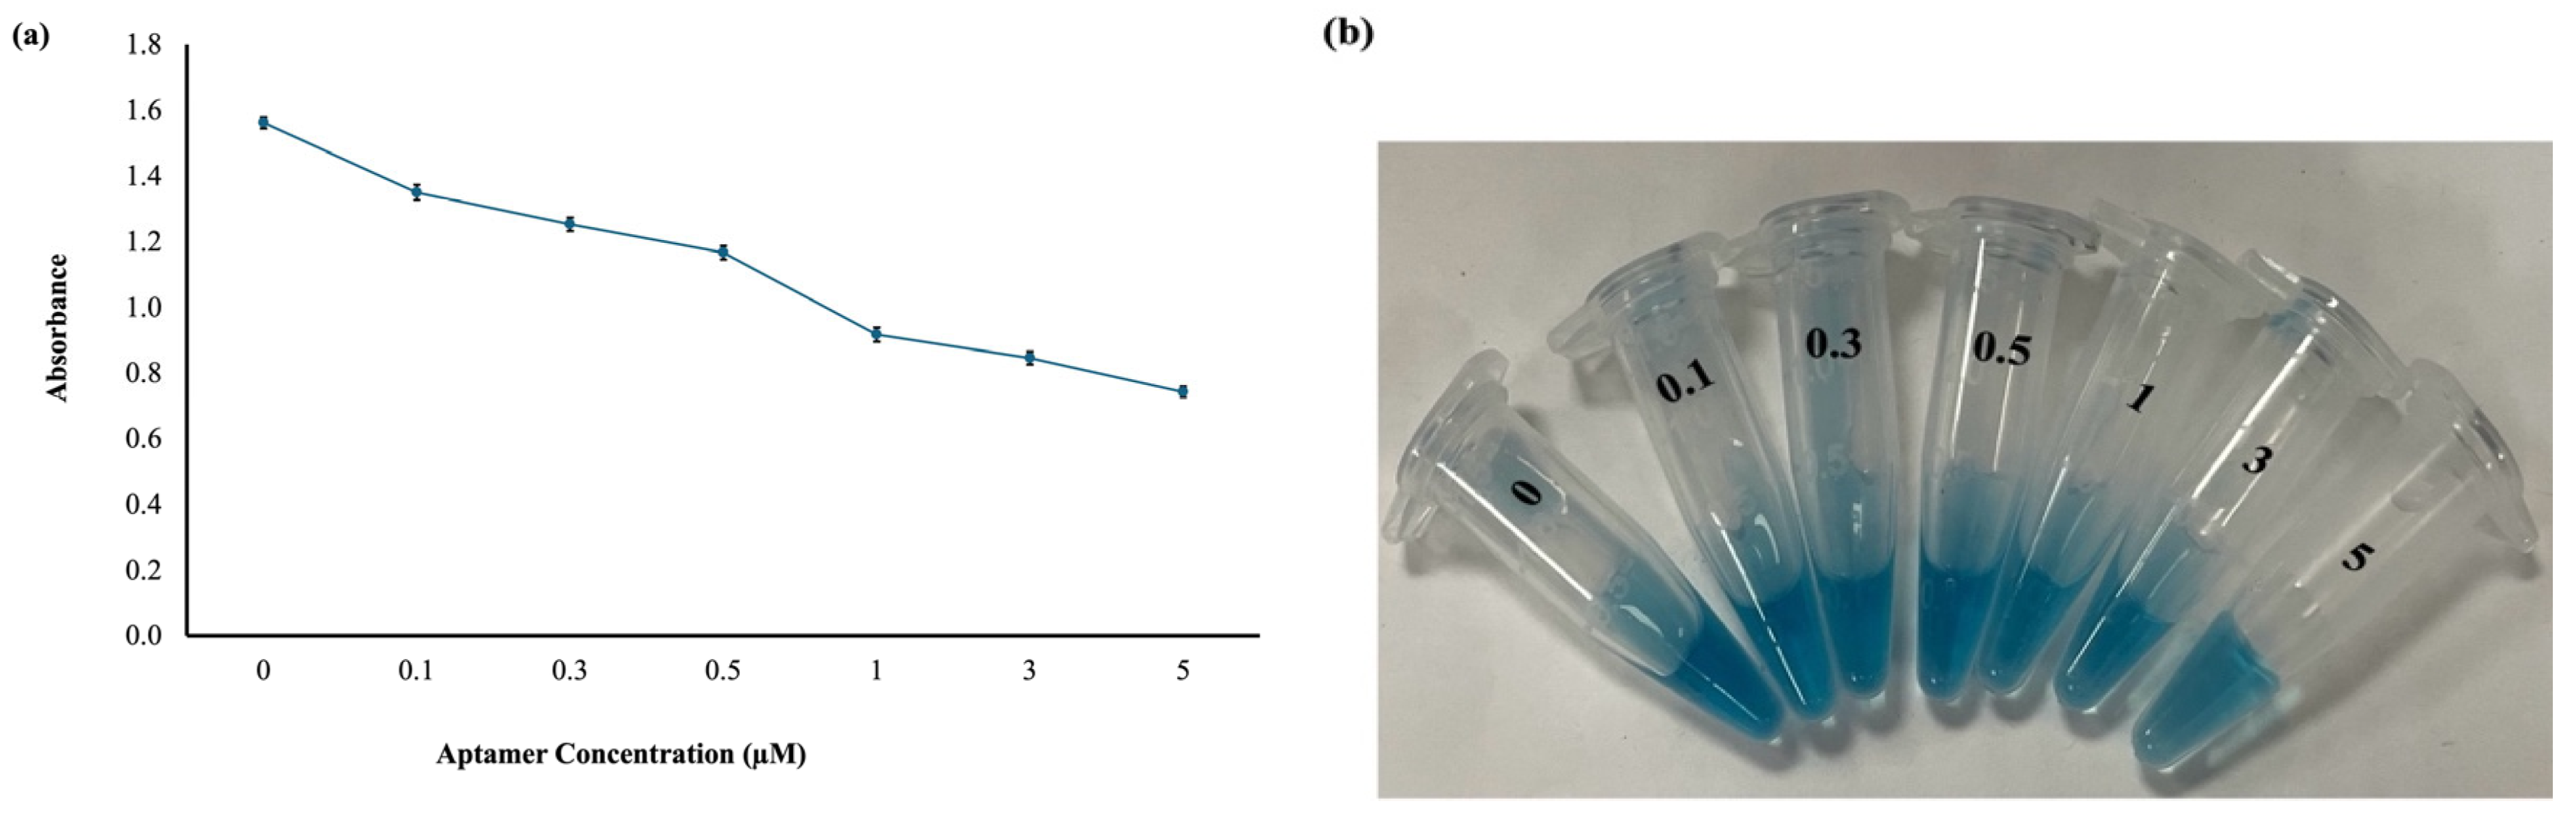
The effect of non-thiol aptamer concentration on the catalytic activity of AuNPs was also evaluated across a range of concentrations to determine the optimum concentration required to block AuNPs. The initial non-thiol aptamer experiment was conducted using the same concentration range as in thiol aptamer optimization; however, these concentrations did not produce a sufficient colorimetric response (Figure 4a,b); therefore, a higher aptamer concentration was further evaluated.
Figure 4.
Effect of different non-thiol aptamer concentrations on AuNP catalytic activity in the absence of AFB1 (a) Graph showing the effect of aptamer concentration on the catalytic activity of the gold nanoparticles (b) Colorimetric response at different aptamer concentrations. Data are presented as mean ± SE (n = 3).
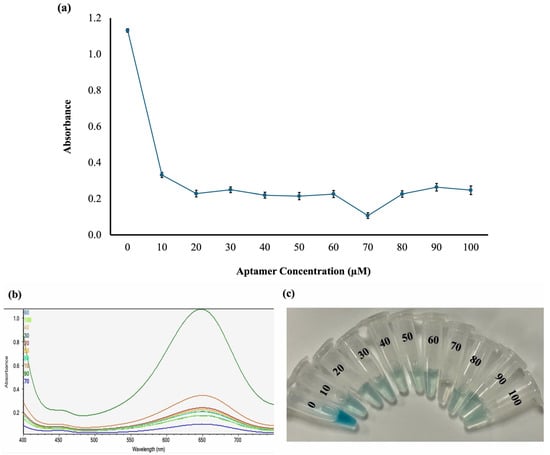
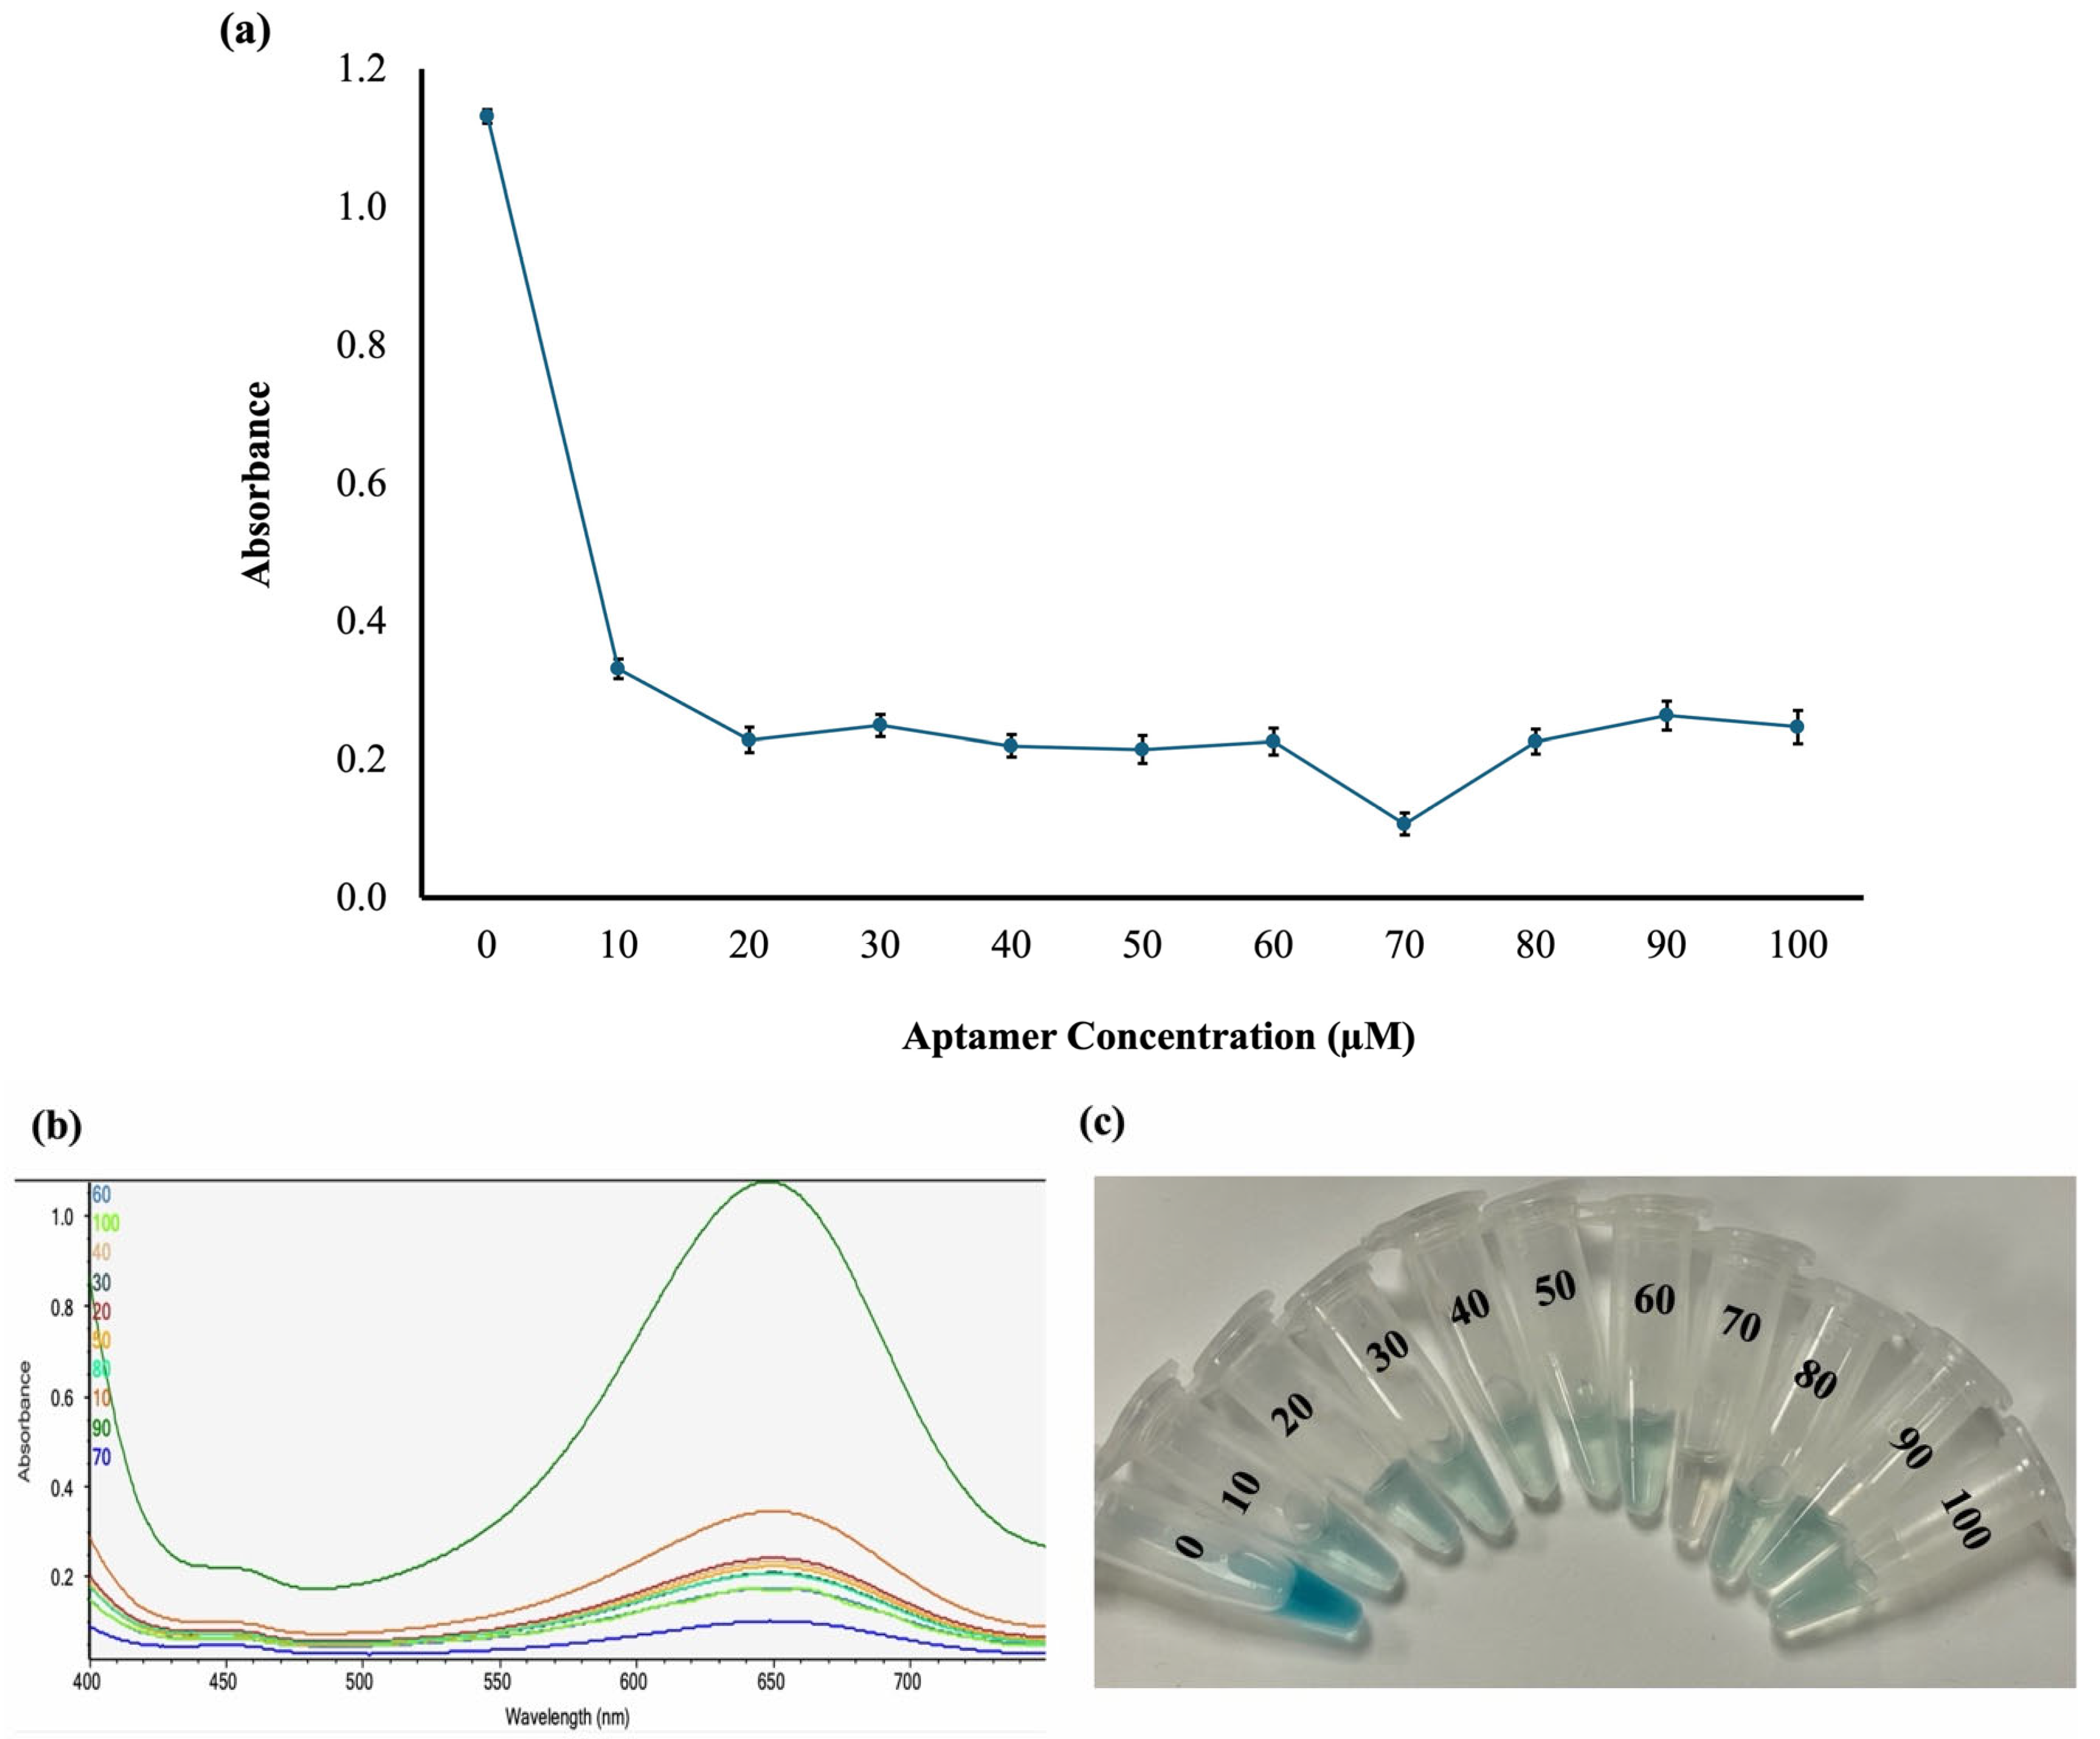
The second concentration range tested was 10–100 μM. As shown in Figure 5a,b, absorbance decreased after functionalizing the AuNPs with the aptamer, indicating inhibition of AuNP-catalyzed oxidation of TMB. A corresponding decrease in color intensity was observed across all aptamer concentrations, with 70 µM showing almost no visible color development (Figure 5c), suggesting that the aptamer effectively blocked the AuNP surface. The lowest absorbance was recorded at 70 µM, indicating that AuNP catalytic activity was most reduced at this concentration; hence, it was chosen as the optimal concentration for further studies. The higher requirement for non-thiol aptamers than for thiol aptamers could be due to differences in their interactions with the surface of AuNPs. Unlike thiol aptamers that form strong covalent Au–S interactions, non-thiol aptamers interact with AuNPs mainly through weaker electrostatic adsorption [30].
Figure 5.
Effect of different non-thiol aptamer concentrations on AuNP catalytic activity in the absence of AFB1 (a) Graph showing the effect of aptamer concentration on the catalytic activity of the gold nanoparticles (b) Spectrophotometric absorbance measured at 650 nm (c) Colorimetric response at different aptamer concentrations. Data are presented as mean ± SE (n = 3).
Additionally, the increased concentration requirement could be due to the smaller size of the AuNPs used in this work, which have a larger surface area than larger AuNPs, thereby requiring a higher aptamer concentration to achieve surface coverage that blocks active sites and prevents TMB oxidation. These findings are comparable to those of Kasoju et al. and Hosseini et al., who found that lower aptamer concentrations were optimal owing to the larger particle sizes (19 nm and 13 nm) used in their work. Therefore, these results align with the hypothesis that aptamer functionalization influences the catalytic activity of AuNPs and biosensing systems [32,33].
3.5. Detection of AFB1 Using Thiol Aptamer
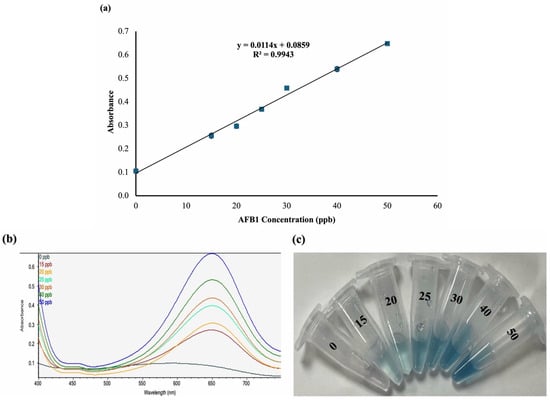
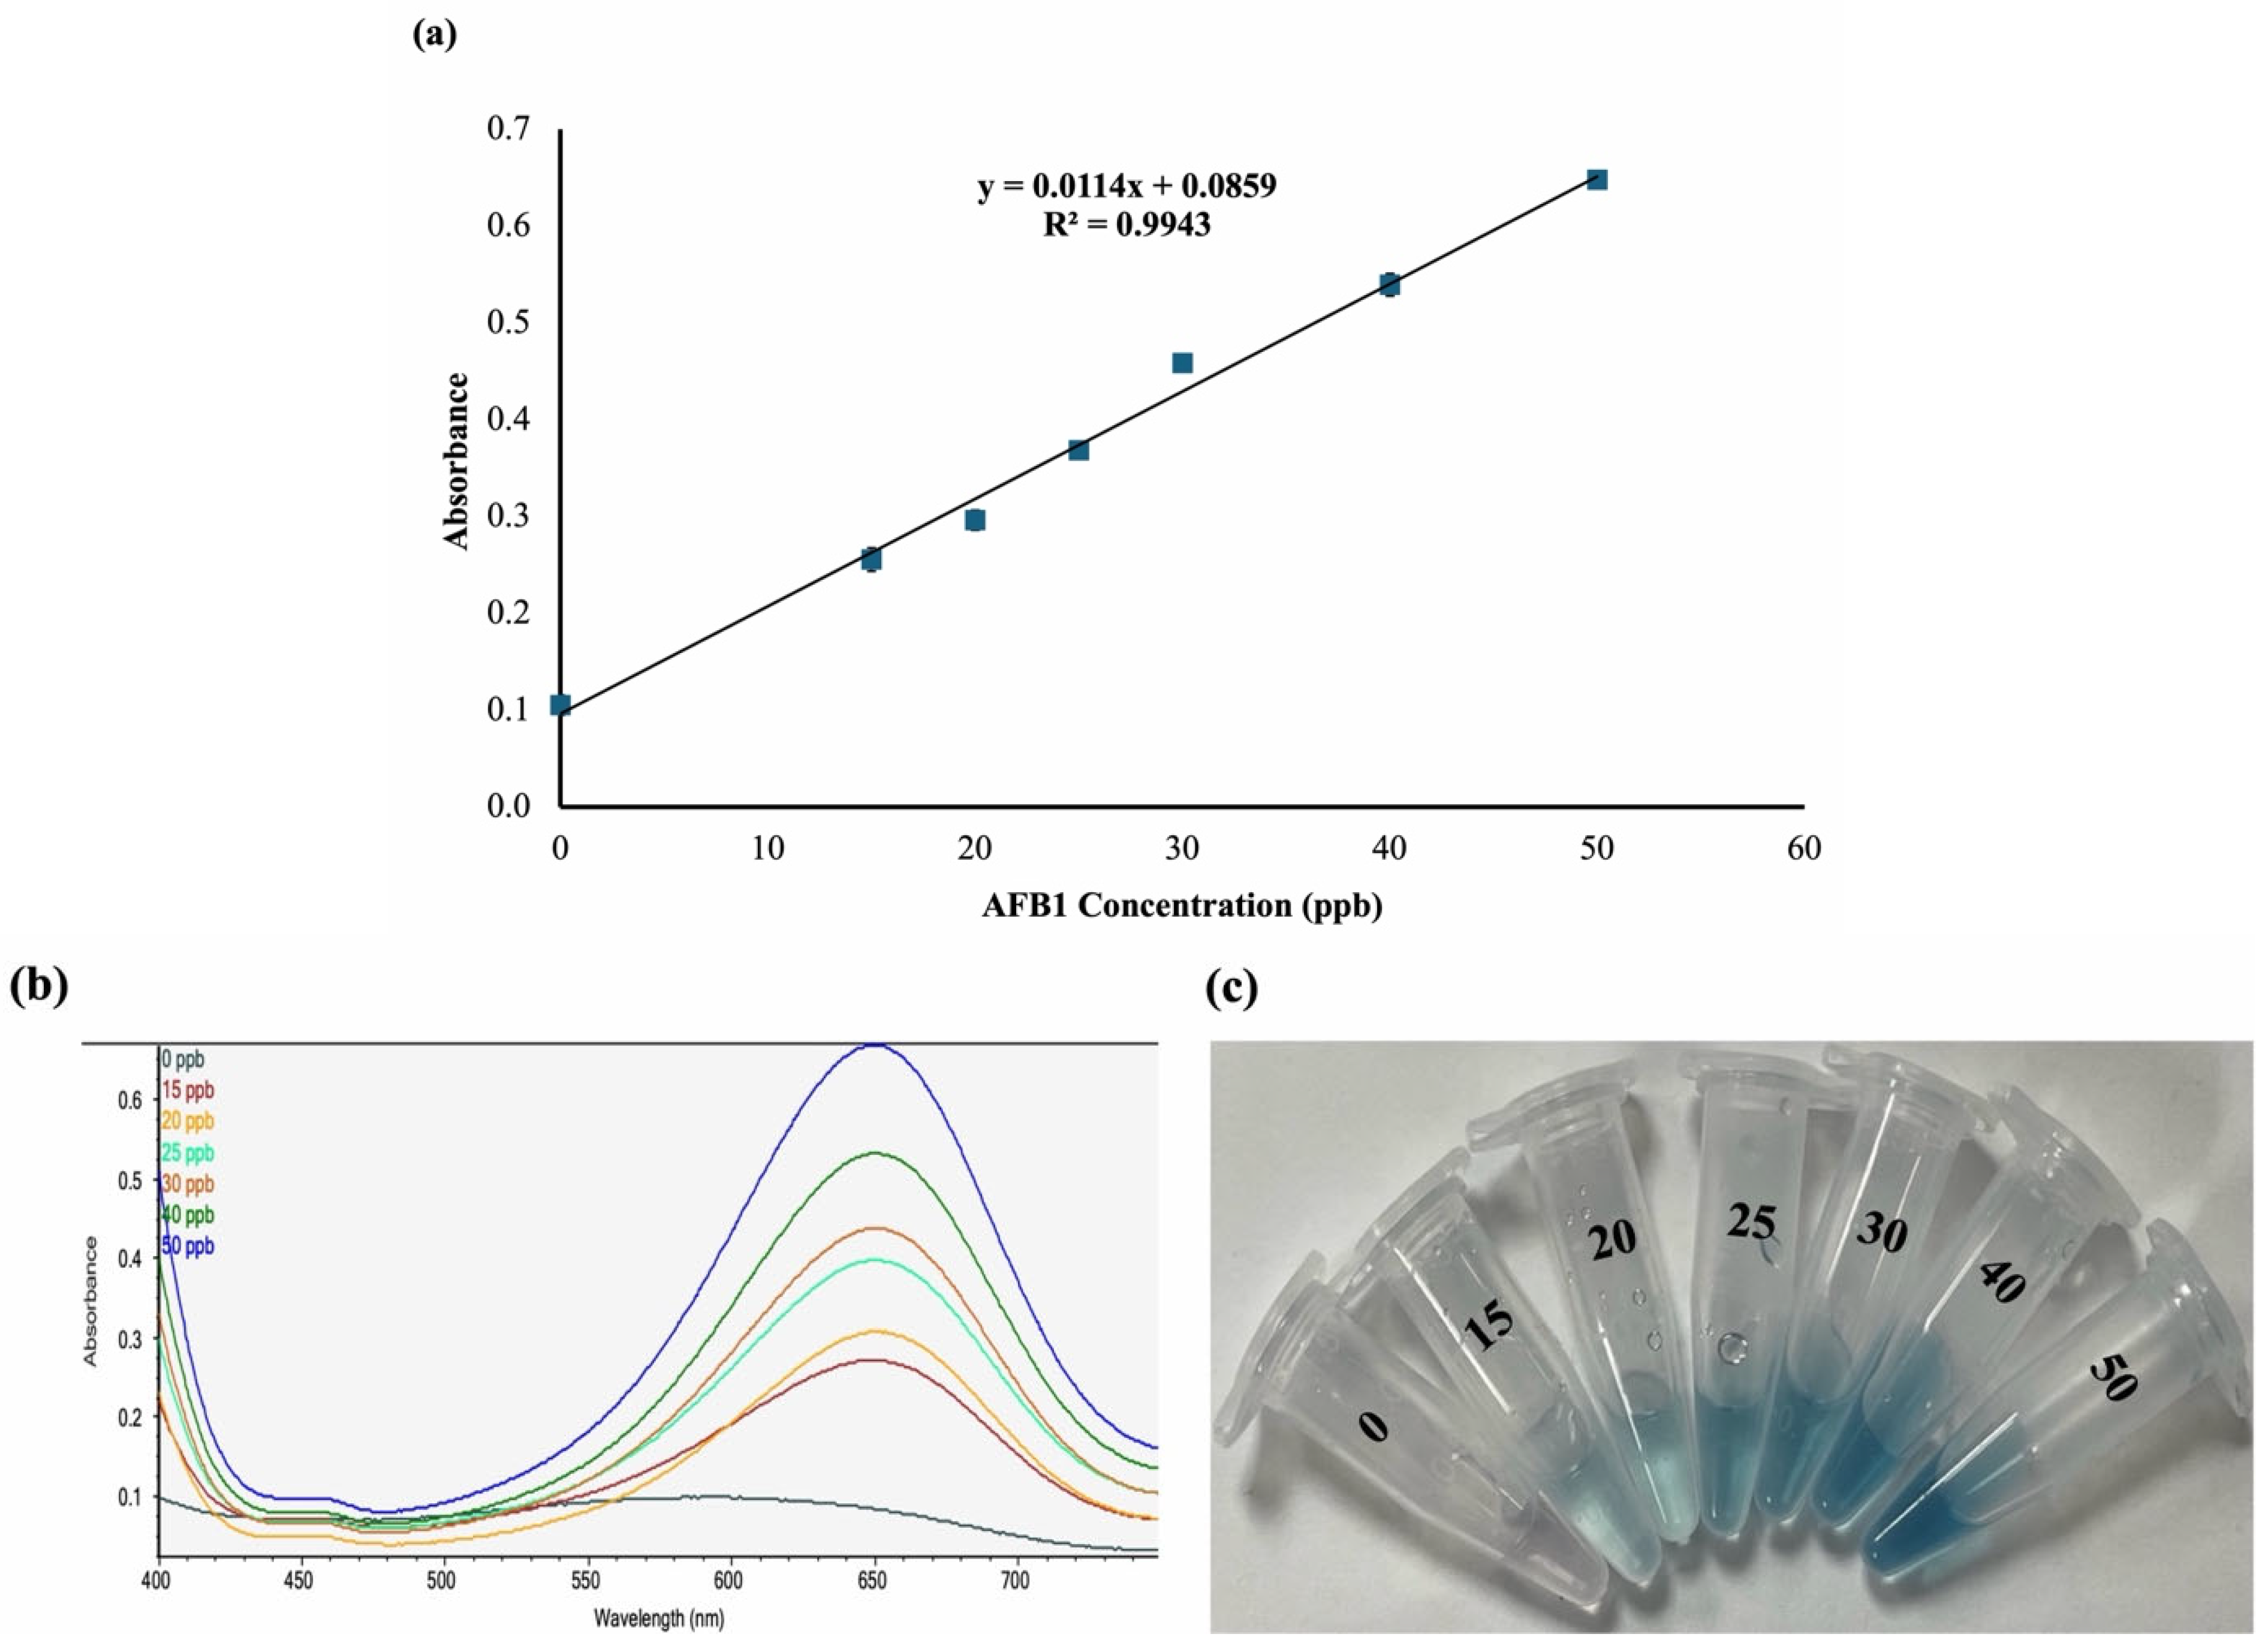
The analytical performance of the colorimetric sensor functionalized with a thiol aptamer was evaluated using AFB1 standards at concentrations of 15, 20, 25, 30, 40, and 50 ppb. The samples were incubated under optimized reaction conditions, and absorbance was recorded at 650 nm. The absorbance response increased proportionally with AFB1 concentration (Figure 6a), with 50 ppb yielding the highest absorbance peak (Figure 6b), indicating that the sensor could detect AFB1 within the examined concentration range. The relationship between AFB1 concentration and absorbance was described by the linear regression equation y = 0.0114x + 0.0859, where y is the absorbance and x is the AFB1 concentration (ppb). The calibration curve was highly linear, with a coefficient of determination (R2) of 0.9943, indicating that approximately 99.43% of the variation in absorbance is attributable to changes in AFB1 concentration. In addition, the limit of detection (LOD) was 0.7 ppb, indicating that the sensor could detect concentrations below 1 ppb. The sensor’s good analytical performance and low LOD may be due to the strong Au–S bonds formed by the thiol aptamer with AuNPs, which increase the aptamer’s accessibility to the target, enhance recognition, and reduce aptamer desorption during analysis. This is consistent with previously reported studies demonstrating the potential of aptasensors for AFB1 detection [21,34].
Figure 6.
Detection of AFB1 standards using a colorimetric sensor with a thiol aptamer. (a) Calibration curve for AFB1 detection; (b) Spectrophotometric absorbance readings at 650 nm for different AFB1 concentrations; (c) Colorimetric responses of the sensor to different AFB1 concentrations. Data are presented as mean ± SE (n = 3).
3.6. Detection of AFB1 Using Non-Thiol Aptamer
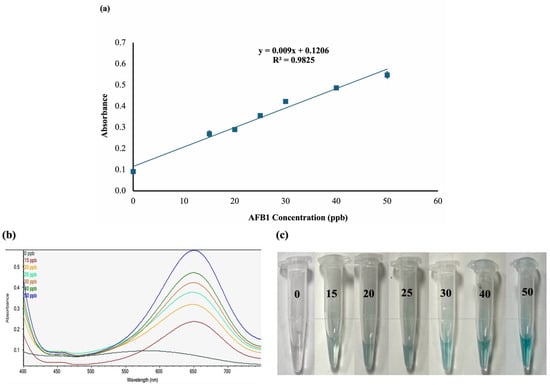
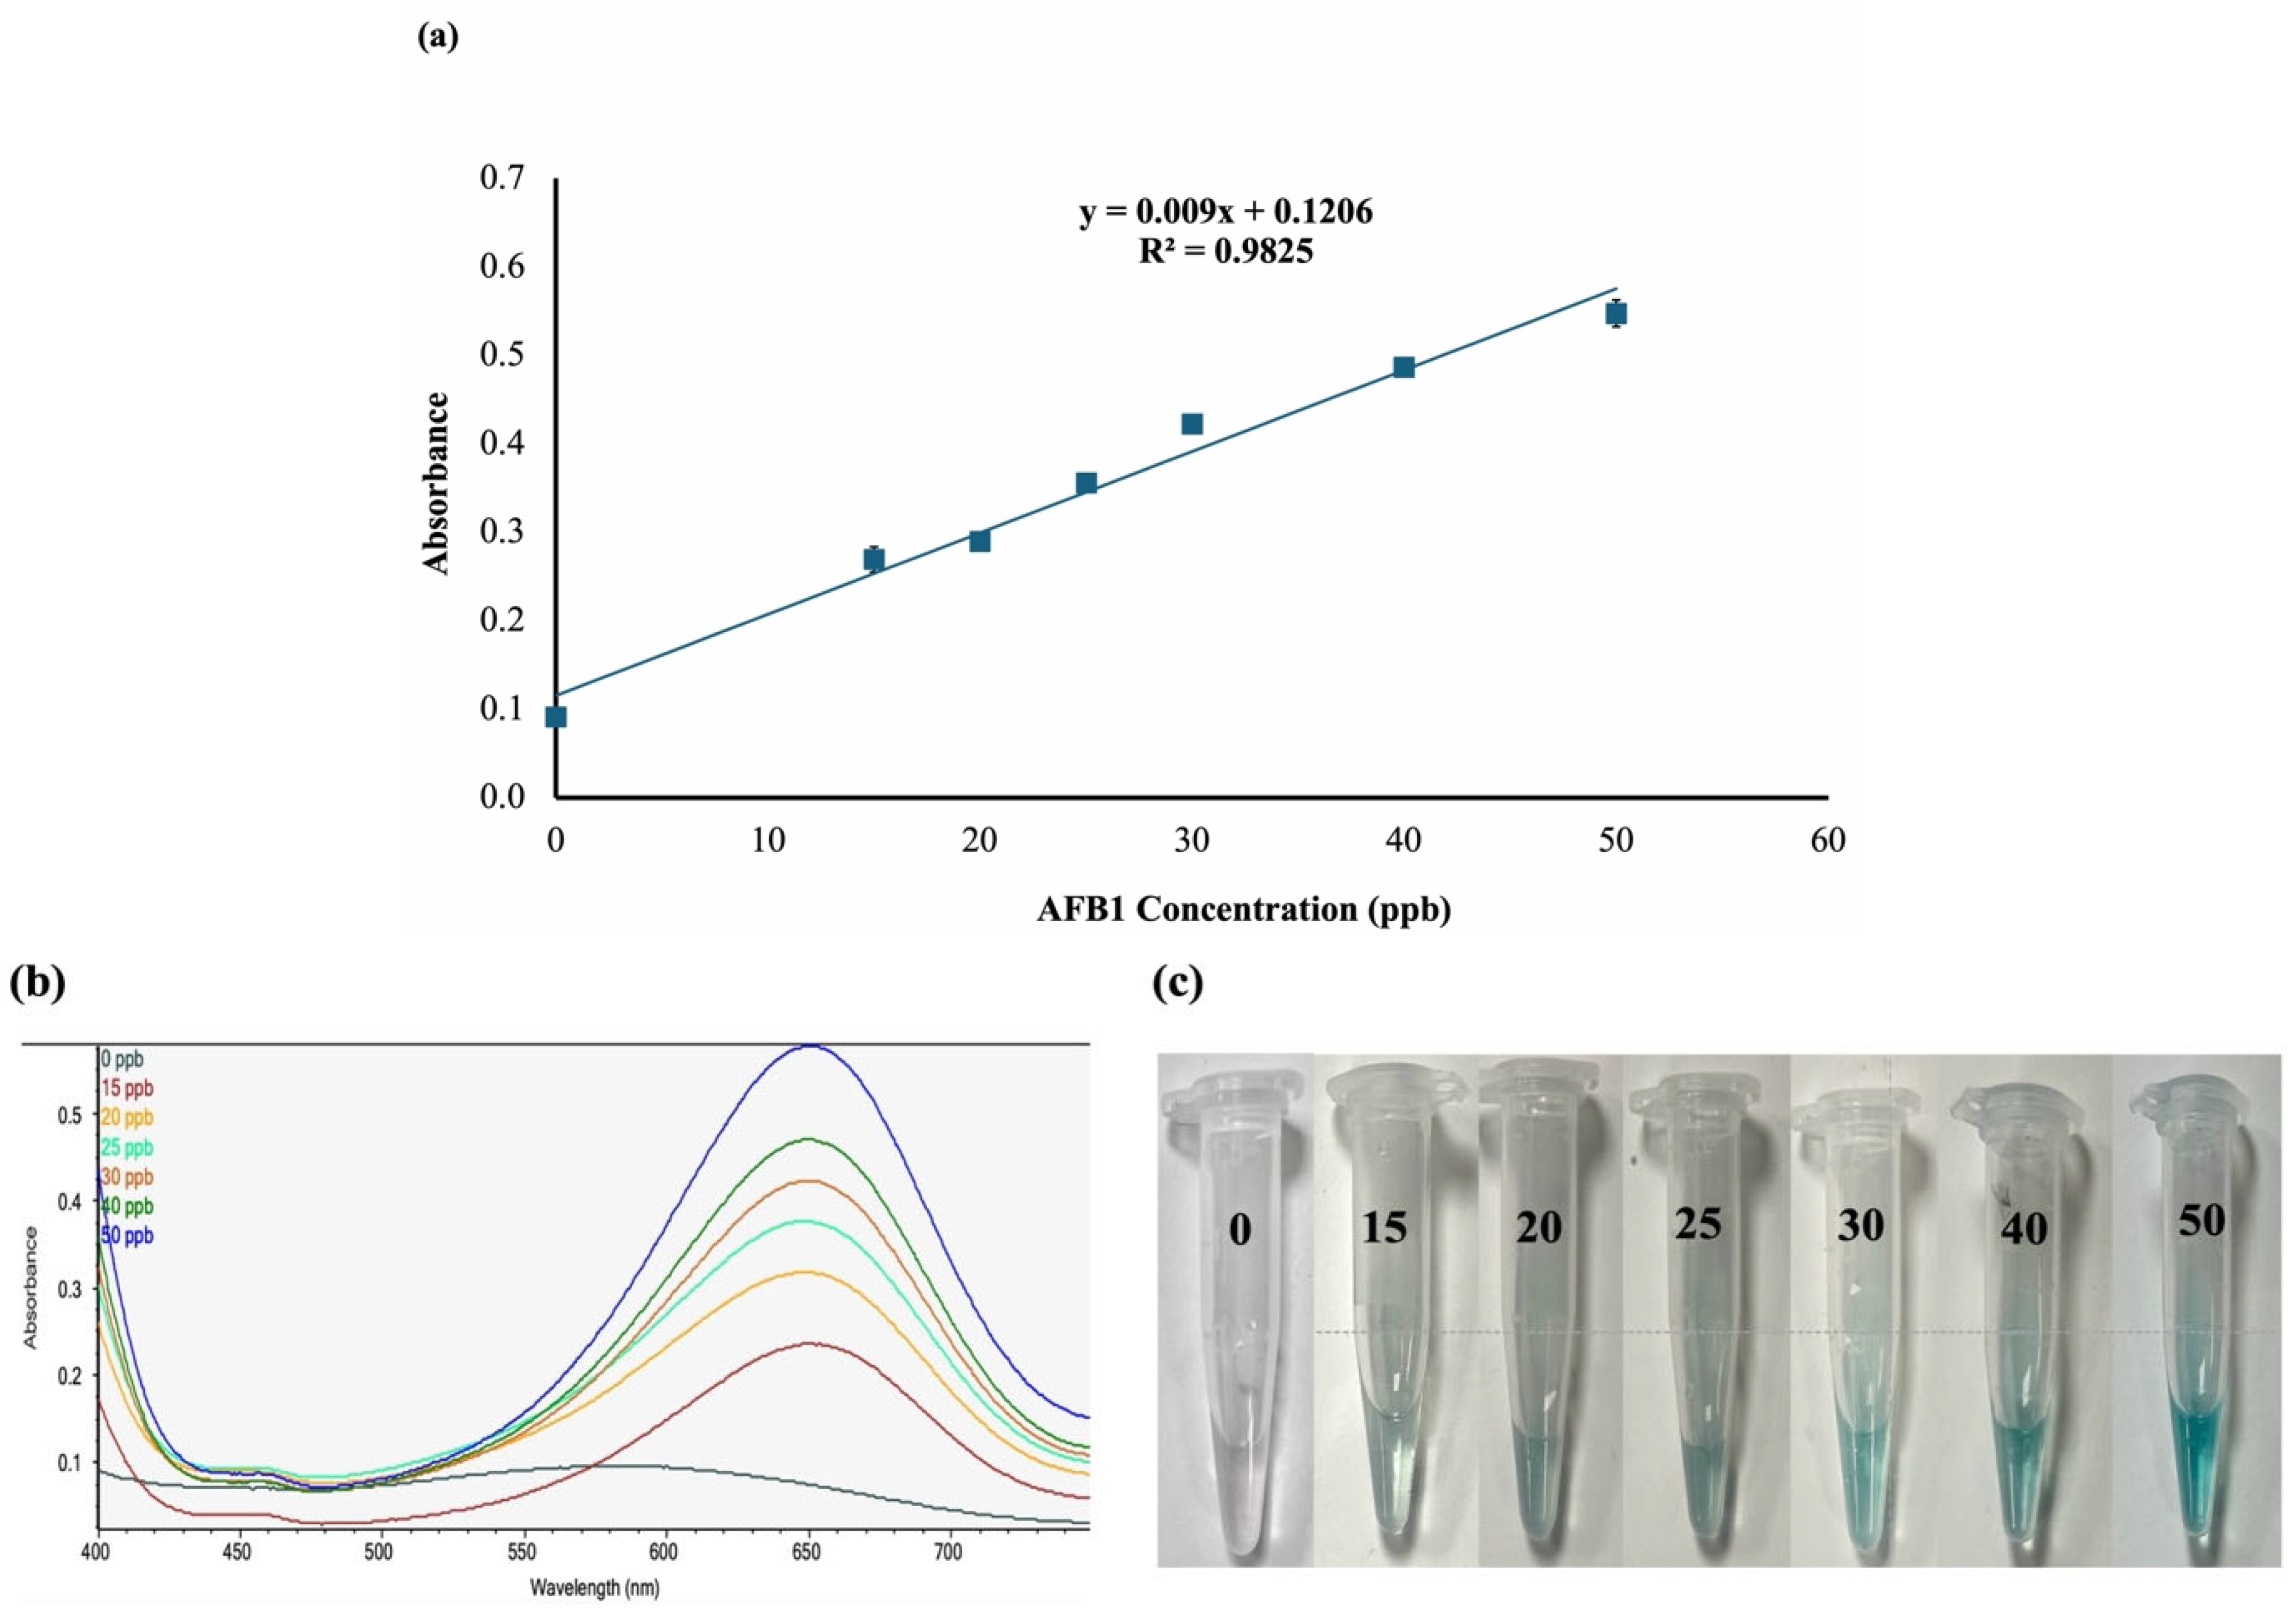
The efficacy of the optimized AuNP–aptamer colorimetric system for AFB1 detection using a non-thiol aptamer was also evaluated at AFB1 concentrations of 15, 20, 25, 30, 40, and 50 ppb. Samples were incubated under optimized reaction conditions, and absorbance was recorded at 650 nm. As shown in Figure 7, absorbance increased with AFB1 concentration, with the highest AFB1 concentration (50 ppb) yielding the highest absorbance. However, absorbance values with the non-thiol aptamer were slightly lower than those with the thiol aptamer. These results suggest that the sensor with the non-thiol aptamer also responded effectively to changes in analyte concentration. The relationship between AFB1 concentration and absorbance was described by the linear regression equation y = 0.0090x + 0.1206. The calibration curve was highly linear, with a coefficient of determination (R2) of 0.9825, indicating that approximately 98.25% of the variation in absorbance is attributable to changes in AFB1 concentration. The LOD was 1.05, slightly higher than that of the thiol aptamer, likely due to weaker electrostatic adsorption to the AuNP surface, which affects target binding and recognition. This difference may influence their respective sensing responses and analytical performance [20,21].
Figure 7.
Detection of AFB1 standards using a colorimetric sensor with a non-thiol aptamer. (a) Calibration curve for AFB1 detection; (b) Spectrophotometric absorbance at 650 nm for different AFB1 concentrations; (c) Colorimetric responses of the sensor to different AFB1 concentrations. Data are presented as mean ± SE (n = 3).
3.7. Morphology Characterization of AuNPs Under Different Reaction Conditions
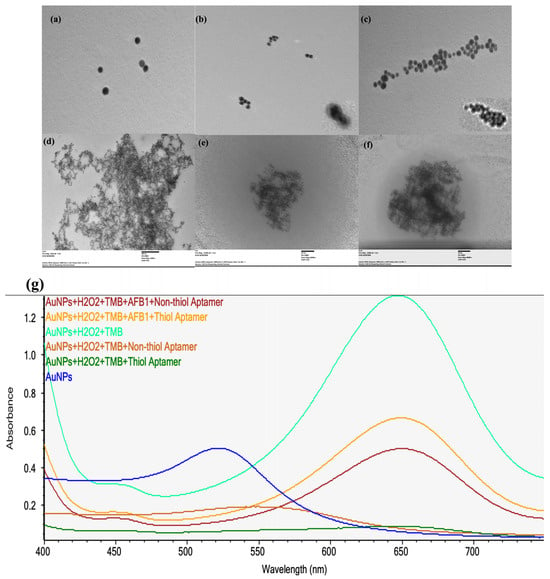
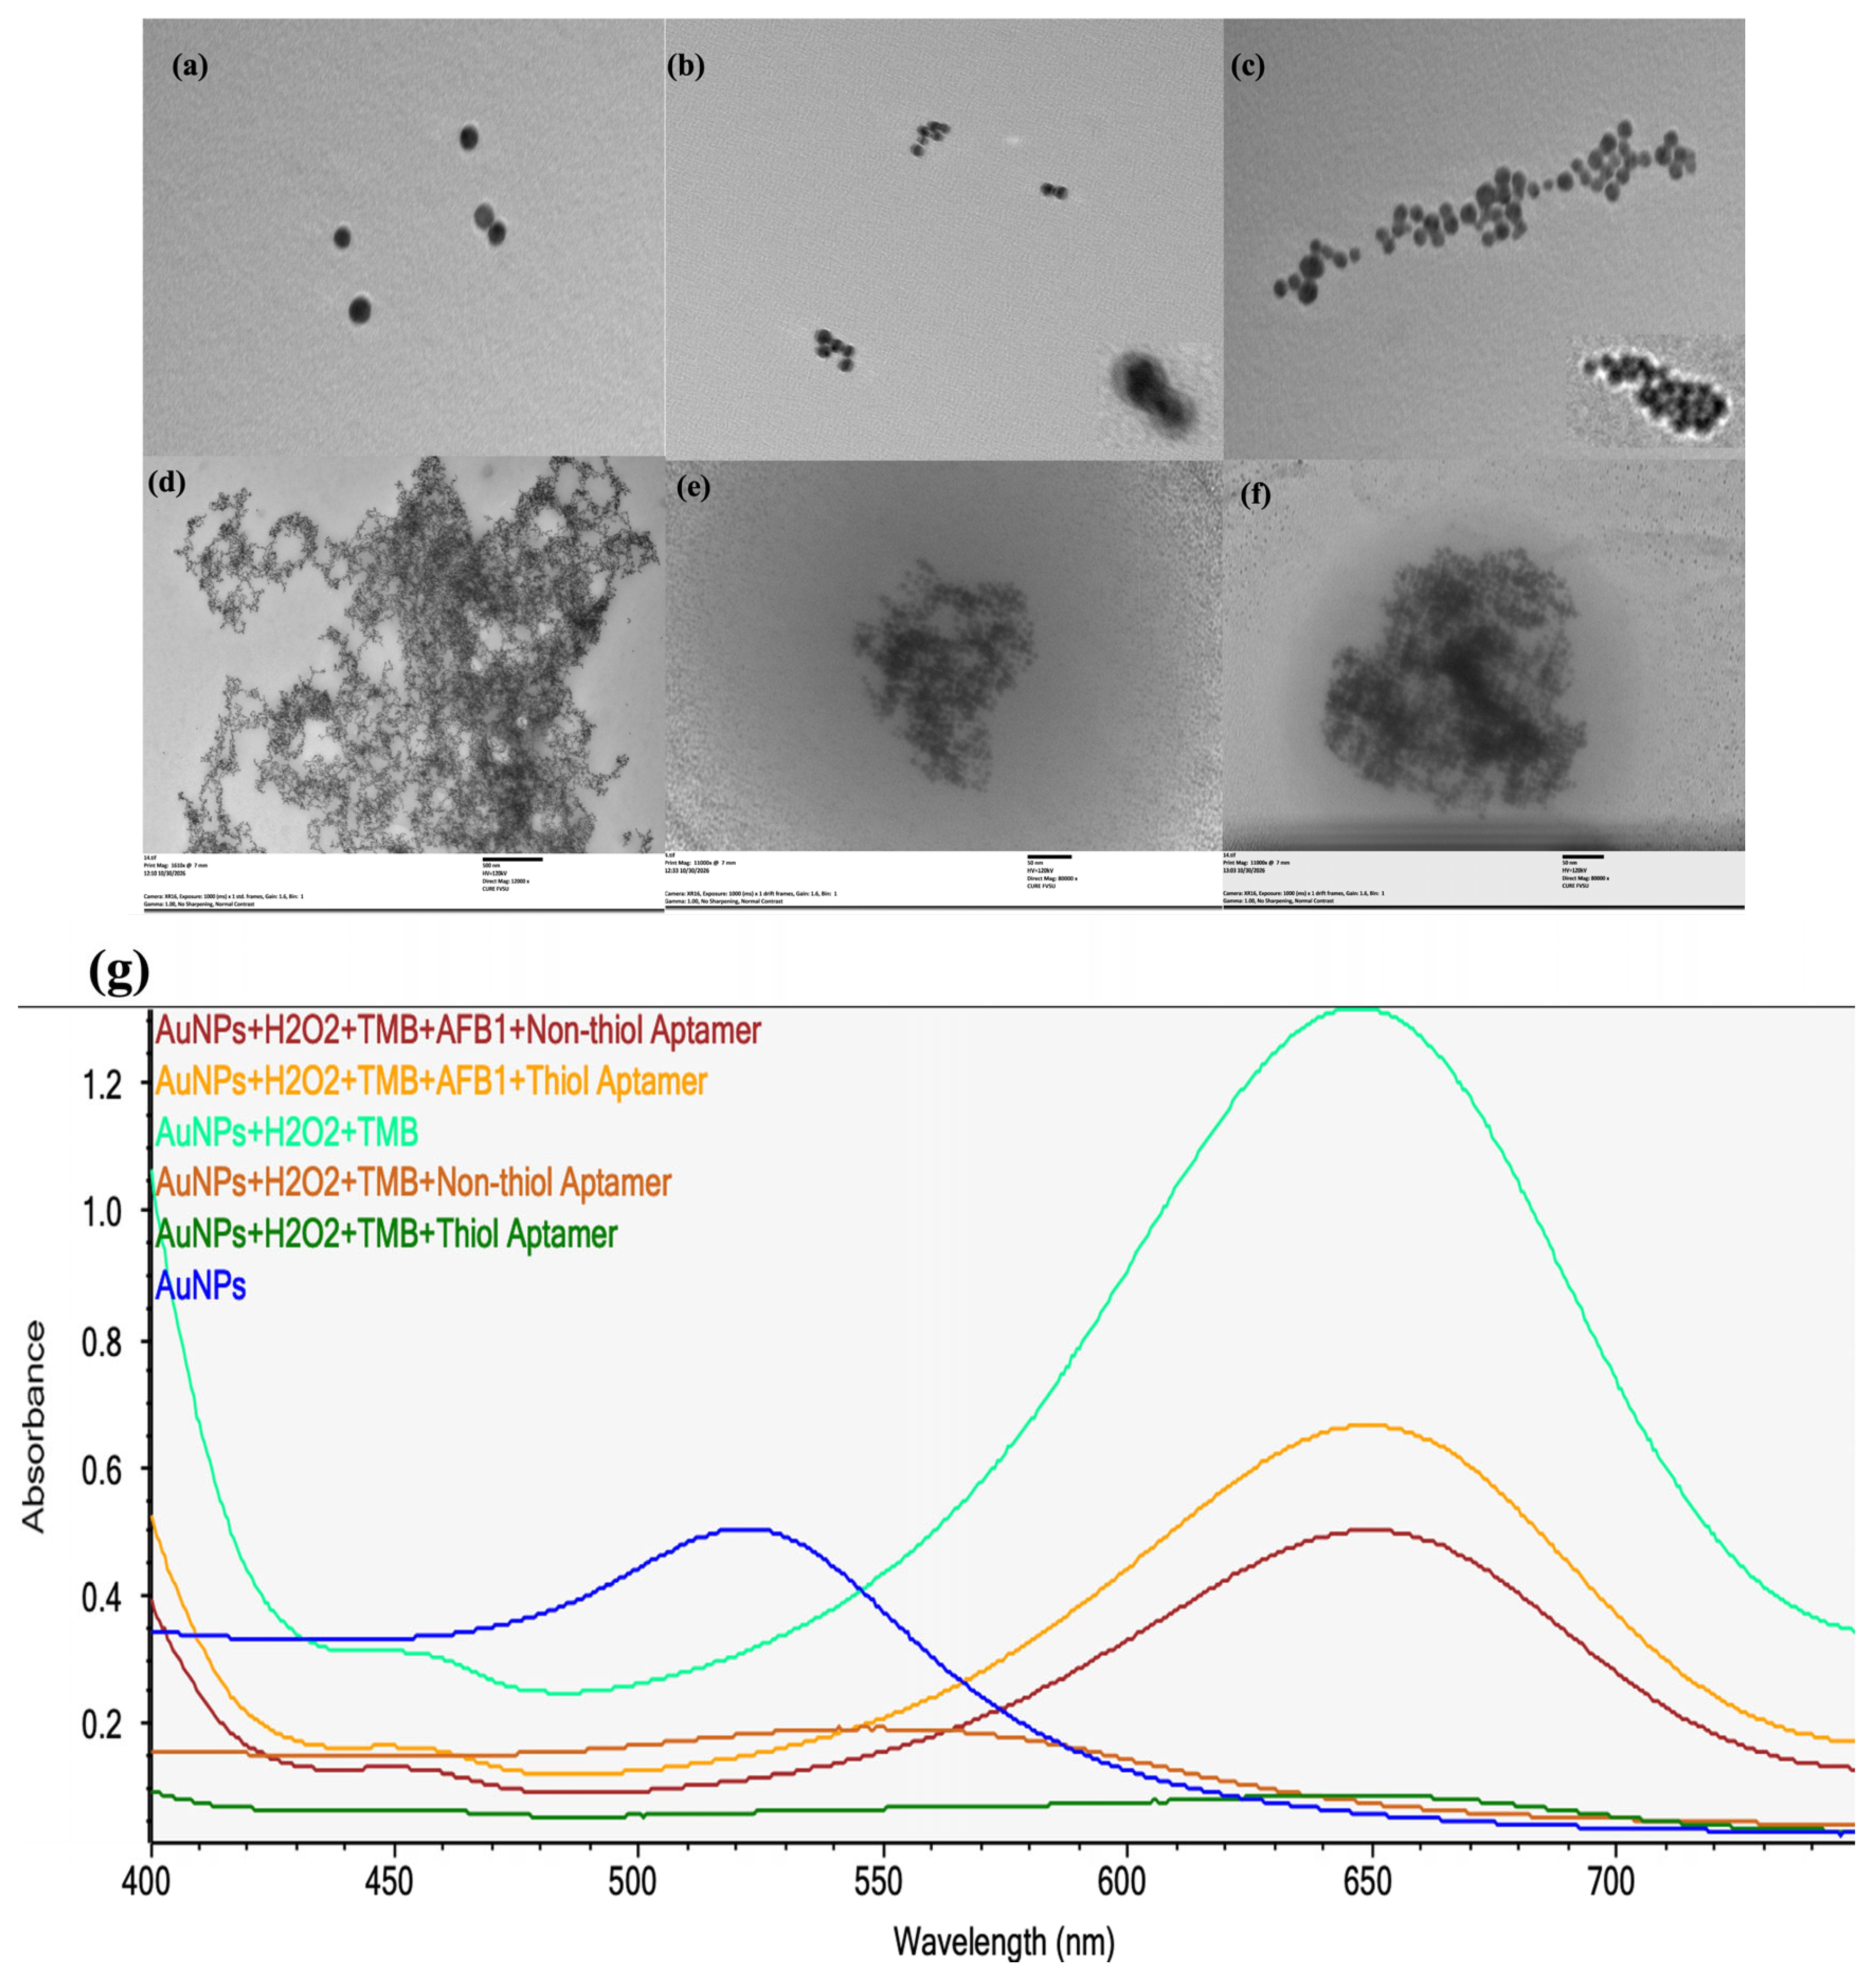
In order to determine the morphological changes in AuNPs under different reaction conditions, the transmission electron microscopy (TEM) images of AuNPs were taken as shown in Figure 8. The bare AuNPs shown in Figure 8a were found to be well dispersed, with individual nanoparticles distributed across with minimal particle association. After the aptamer (non-thiol and thiol) conjugation with AuNPs, shown in Figure 8b and Figure 8c, respectively, the AuNPs appear to have a different distribution of particles when conjugated with non-thiol compared to thiol. Non-thiol aptamer conjugated with AuNPs appeared in relatively small groups in distinct regions of the images, whereas AuNPs conjugated with the thiol AFB1 aptamer (Figure 8c) formed more extensive AuNP associations, with numerous AuNPs closely packed together in the images instead of existing in separate, localized groups. These results suggest that the two different aptamer modifications studied here could have led to the distinctly different distributions of AuNPs in solution. The thiol aptamers attach to the AuNP surface through an Au–S bond, whereas the non-thiol aptamers attach to the AuNP surface through non-covalent interaction [30]. The effect of TMB and H2O2 on AuNPs was also examined and the images are shown in Figure 8d. The addition of TMB and H2O2 to the AuNPs formed many AuNP clusters into a very compact structure, which was quite different from that of only AuNPs. The AuNPs studied here are peroxidase-like catalysts due to the presence of active surface sites. These surface sites facilitate the reaction of TMB with H2O2 and subsequent electron transfer reactions, which result in the production of the colored form of oxidized TMB.
Figure 8.
Morphology of AuNPs in different reactions: (a) AuNPs, (b) AuNP conjugated with AFB1 nonthiol aptamer, (c) AuNP conjugated with AFB1 thiol aptamer, (d) AuNPs with TMB and H2O2, (e) AuNP with AFB1-nonthiol aptamer, H2O2, and TMB. (f) AuNPs with AFB1-thiol aptamer, H2O2, and TMB. (g) Spectrophotometer reading of different reactions.
The complete reaction mixtures containing AFB1, TMB, and H2O2 showed extensive association of AuNPs with both types of aptamers (Figure 8e,f). The nanoparticles in the non-thiol aptamer system (Figure 8e) formed a compact, irregular cluster. By contrast, in the thiol aptamer system (Figure 8f), the AuNPs were found in a larger and more densely packed interconnected network. Clearly, the two different sensing systems gave different distributions of AuNPs after contact with AFB1 and the colorimetric reaction components. The binding of AFB1 to the aptamer induces a conformational change in the aptamer and as a result changes in the spatial arrangement of the aptamers on the surface of the AuNPs. This conformational change could influence the DNA layer adsorbed to the surface of AuNPs and thus change the access to the active gold surface by TMB and H2O2 [35,36]. The TEM images show the different nanoparticle morphologies of both systems, and these morphologies might give additional information to the colorimetric signals of the two sensing systems. The spectrophotometer readings in Figure 8g also show the response of AuNPs in all reactions and how it affects the absorbance.
3.8. Specificity of the Sensor with Thiol Aptamer
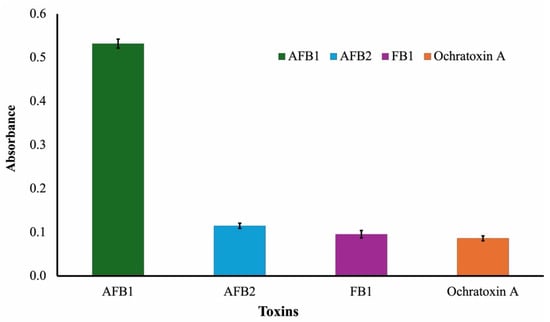
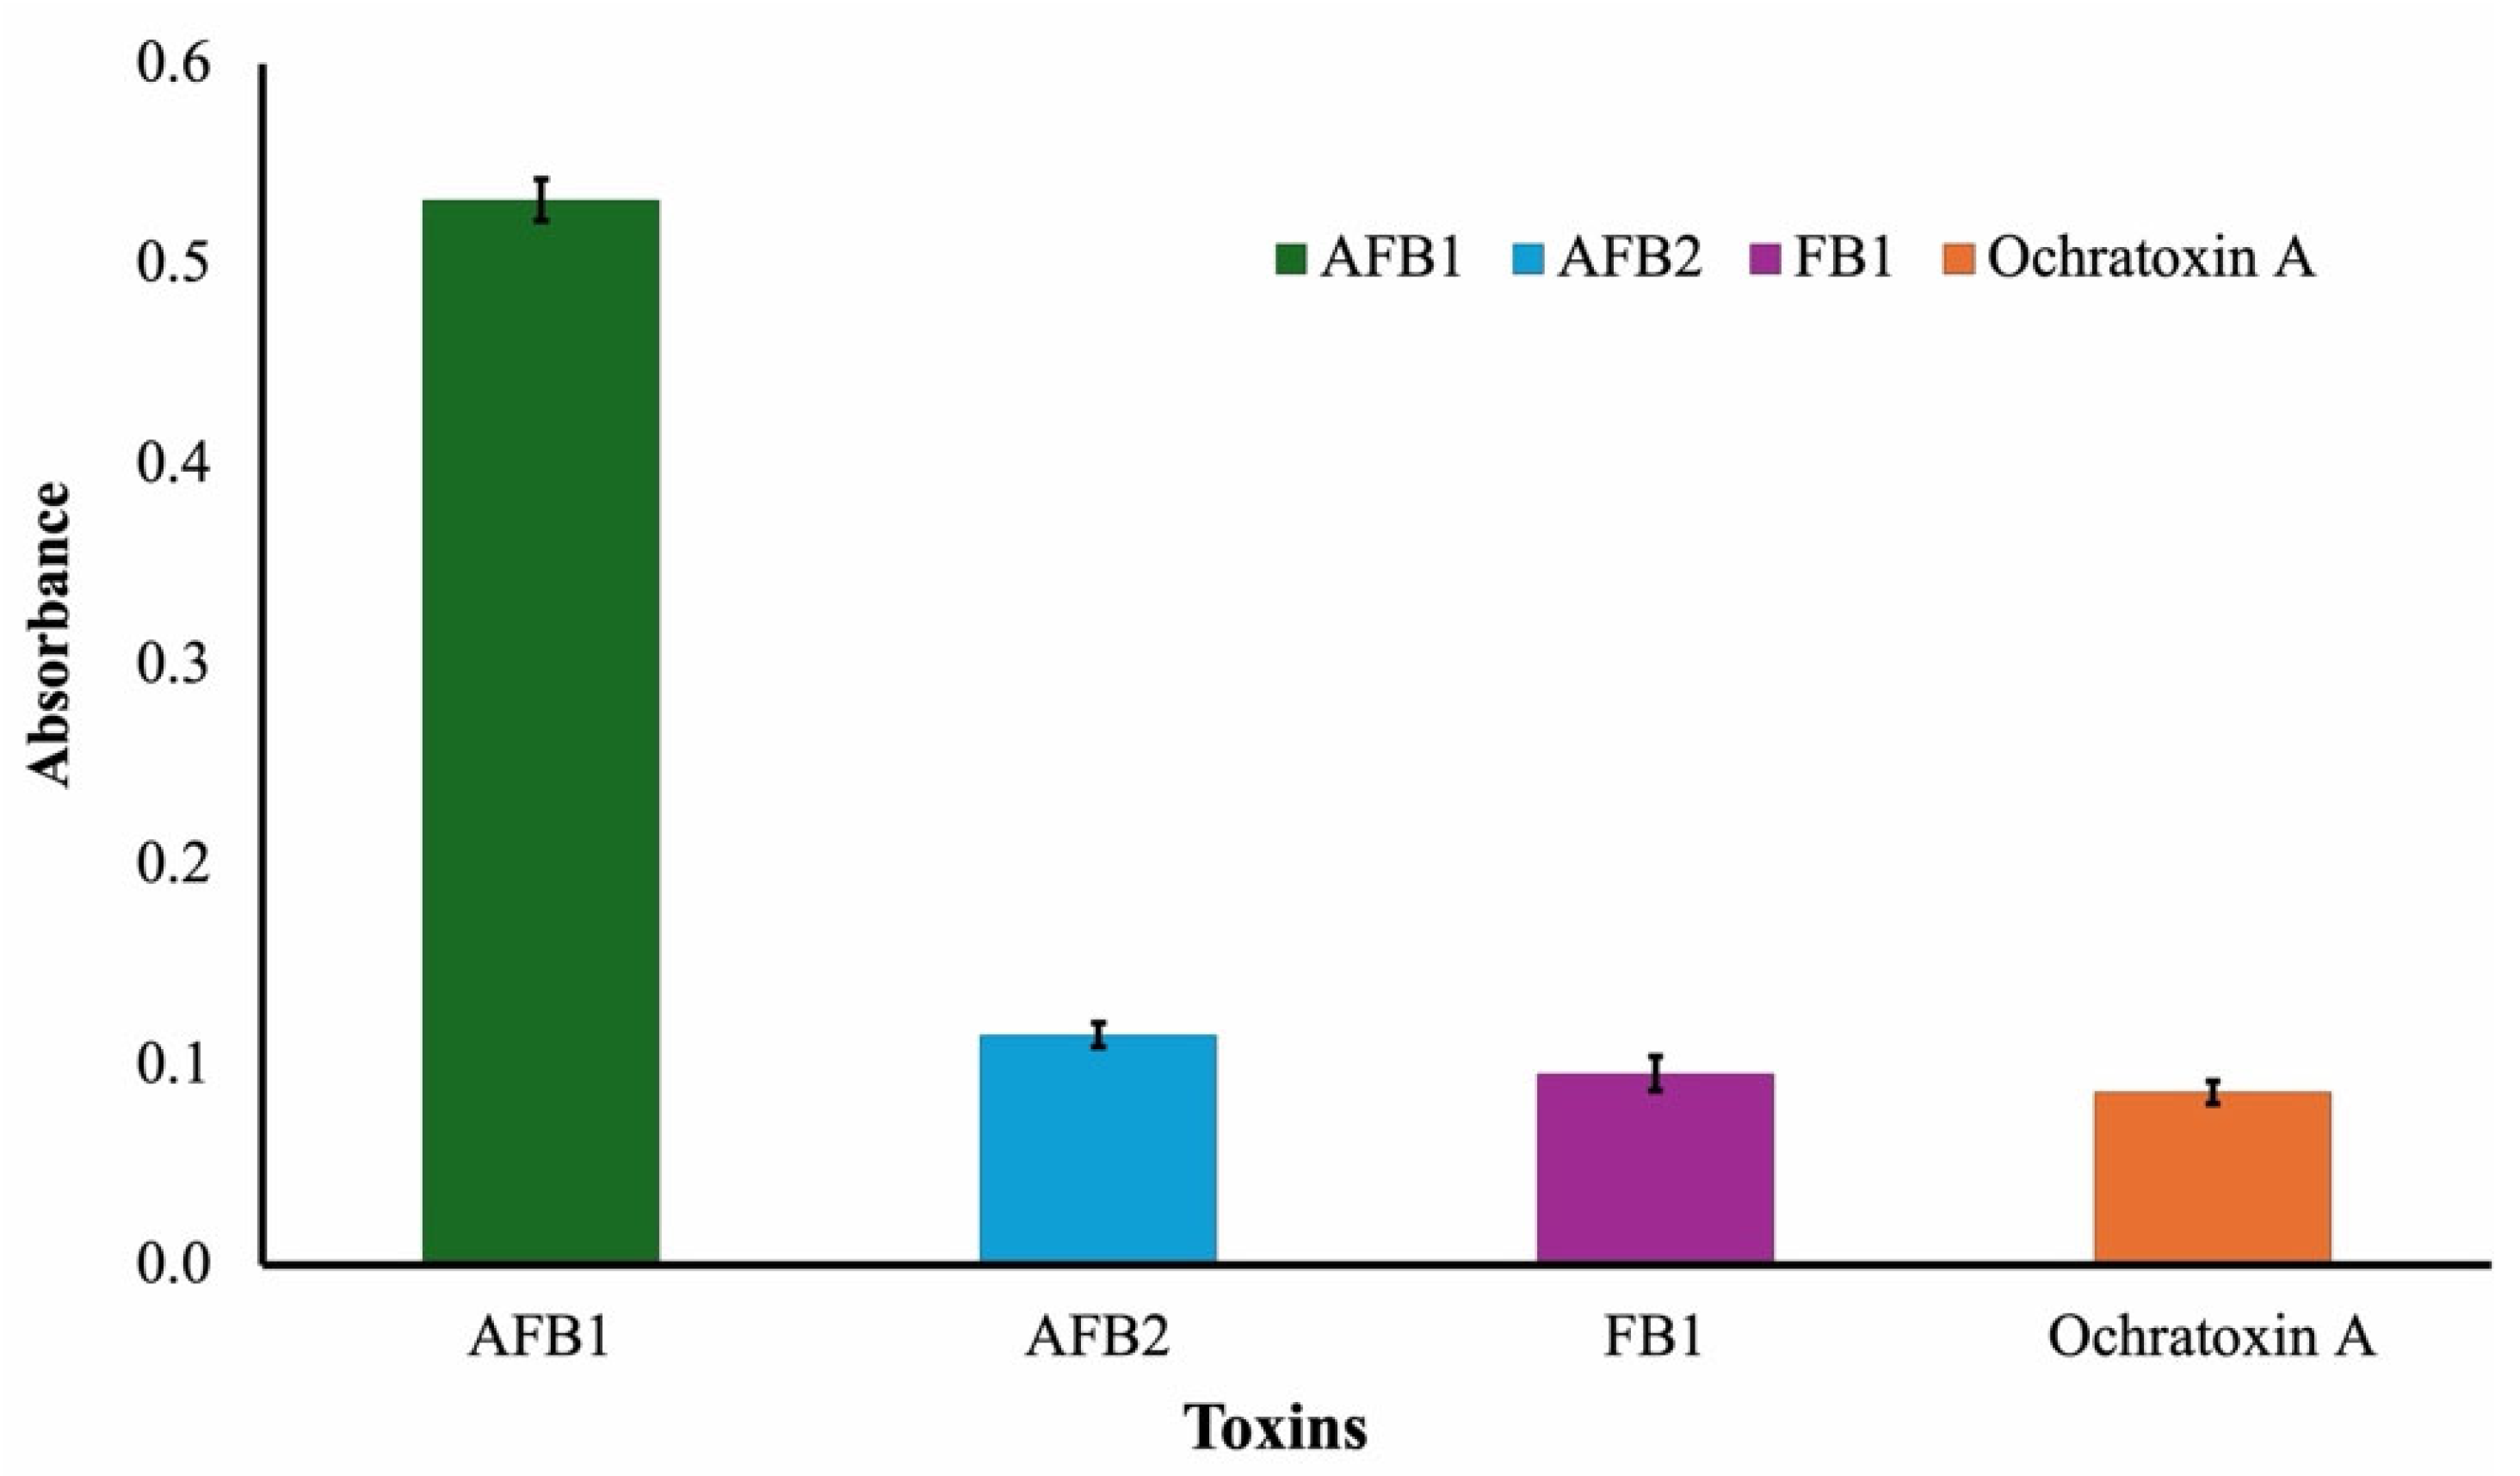
The sensor response to AFB1, AFB2, FB1, and OTA using the thiol aptamer was compared to assess specificity. AFB1 yielded the highest absorbance response, whereas AFB2, FB1, and OTA produced noticeably lower absorbance values, as shown in Figure 9. These results indicate that the sensor recognizes AFB1 more effectively than the other mycotoxins. The aptamer’s strong binding affinity for its target is responsible for the larger response toward AFB1. In contrast, the lower responses to the other mycotoxins indicate minimal non-specific interactions and may be due to residual effects.
Figure 9.
Specificity of the thiol aptamer for AFB1 and selected mycotoxins. Bars indicate mean ± SE (n = 3).
Despite sharing structural similarities with AFB1, AFB2 differs slightly in molecular structure, which lowers its aptamer-binding affinity. Ochratoxin A and FB1 also showed noticeably reduced responses, which further supports the sensor’s strong selectivity. Overall, these findings show that the thiol aptamer-based sensor has good specificity for detecting AFB1, with little interference from other prevalent mycotoxins.
3.9. Specificity of the Sensor with Non-Thiol Aptamer
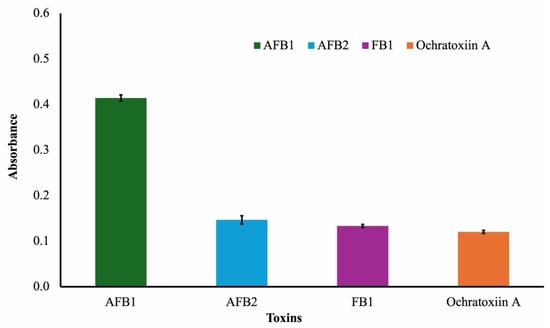
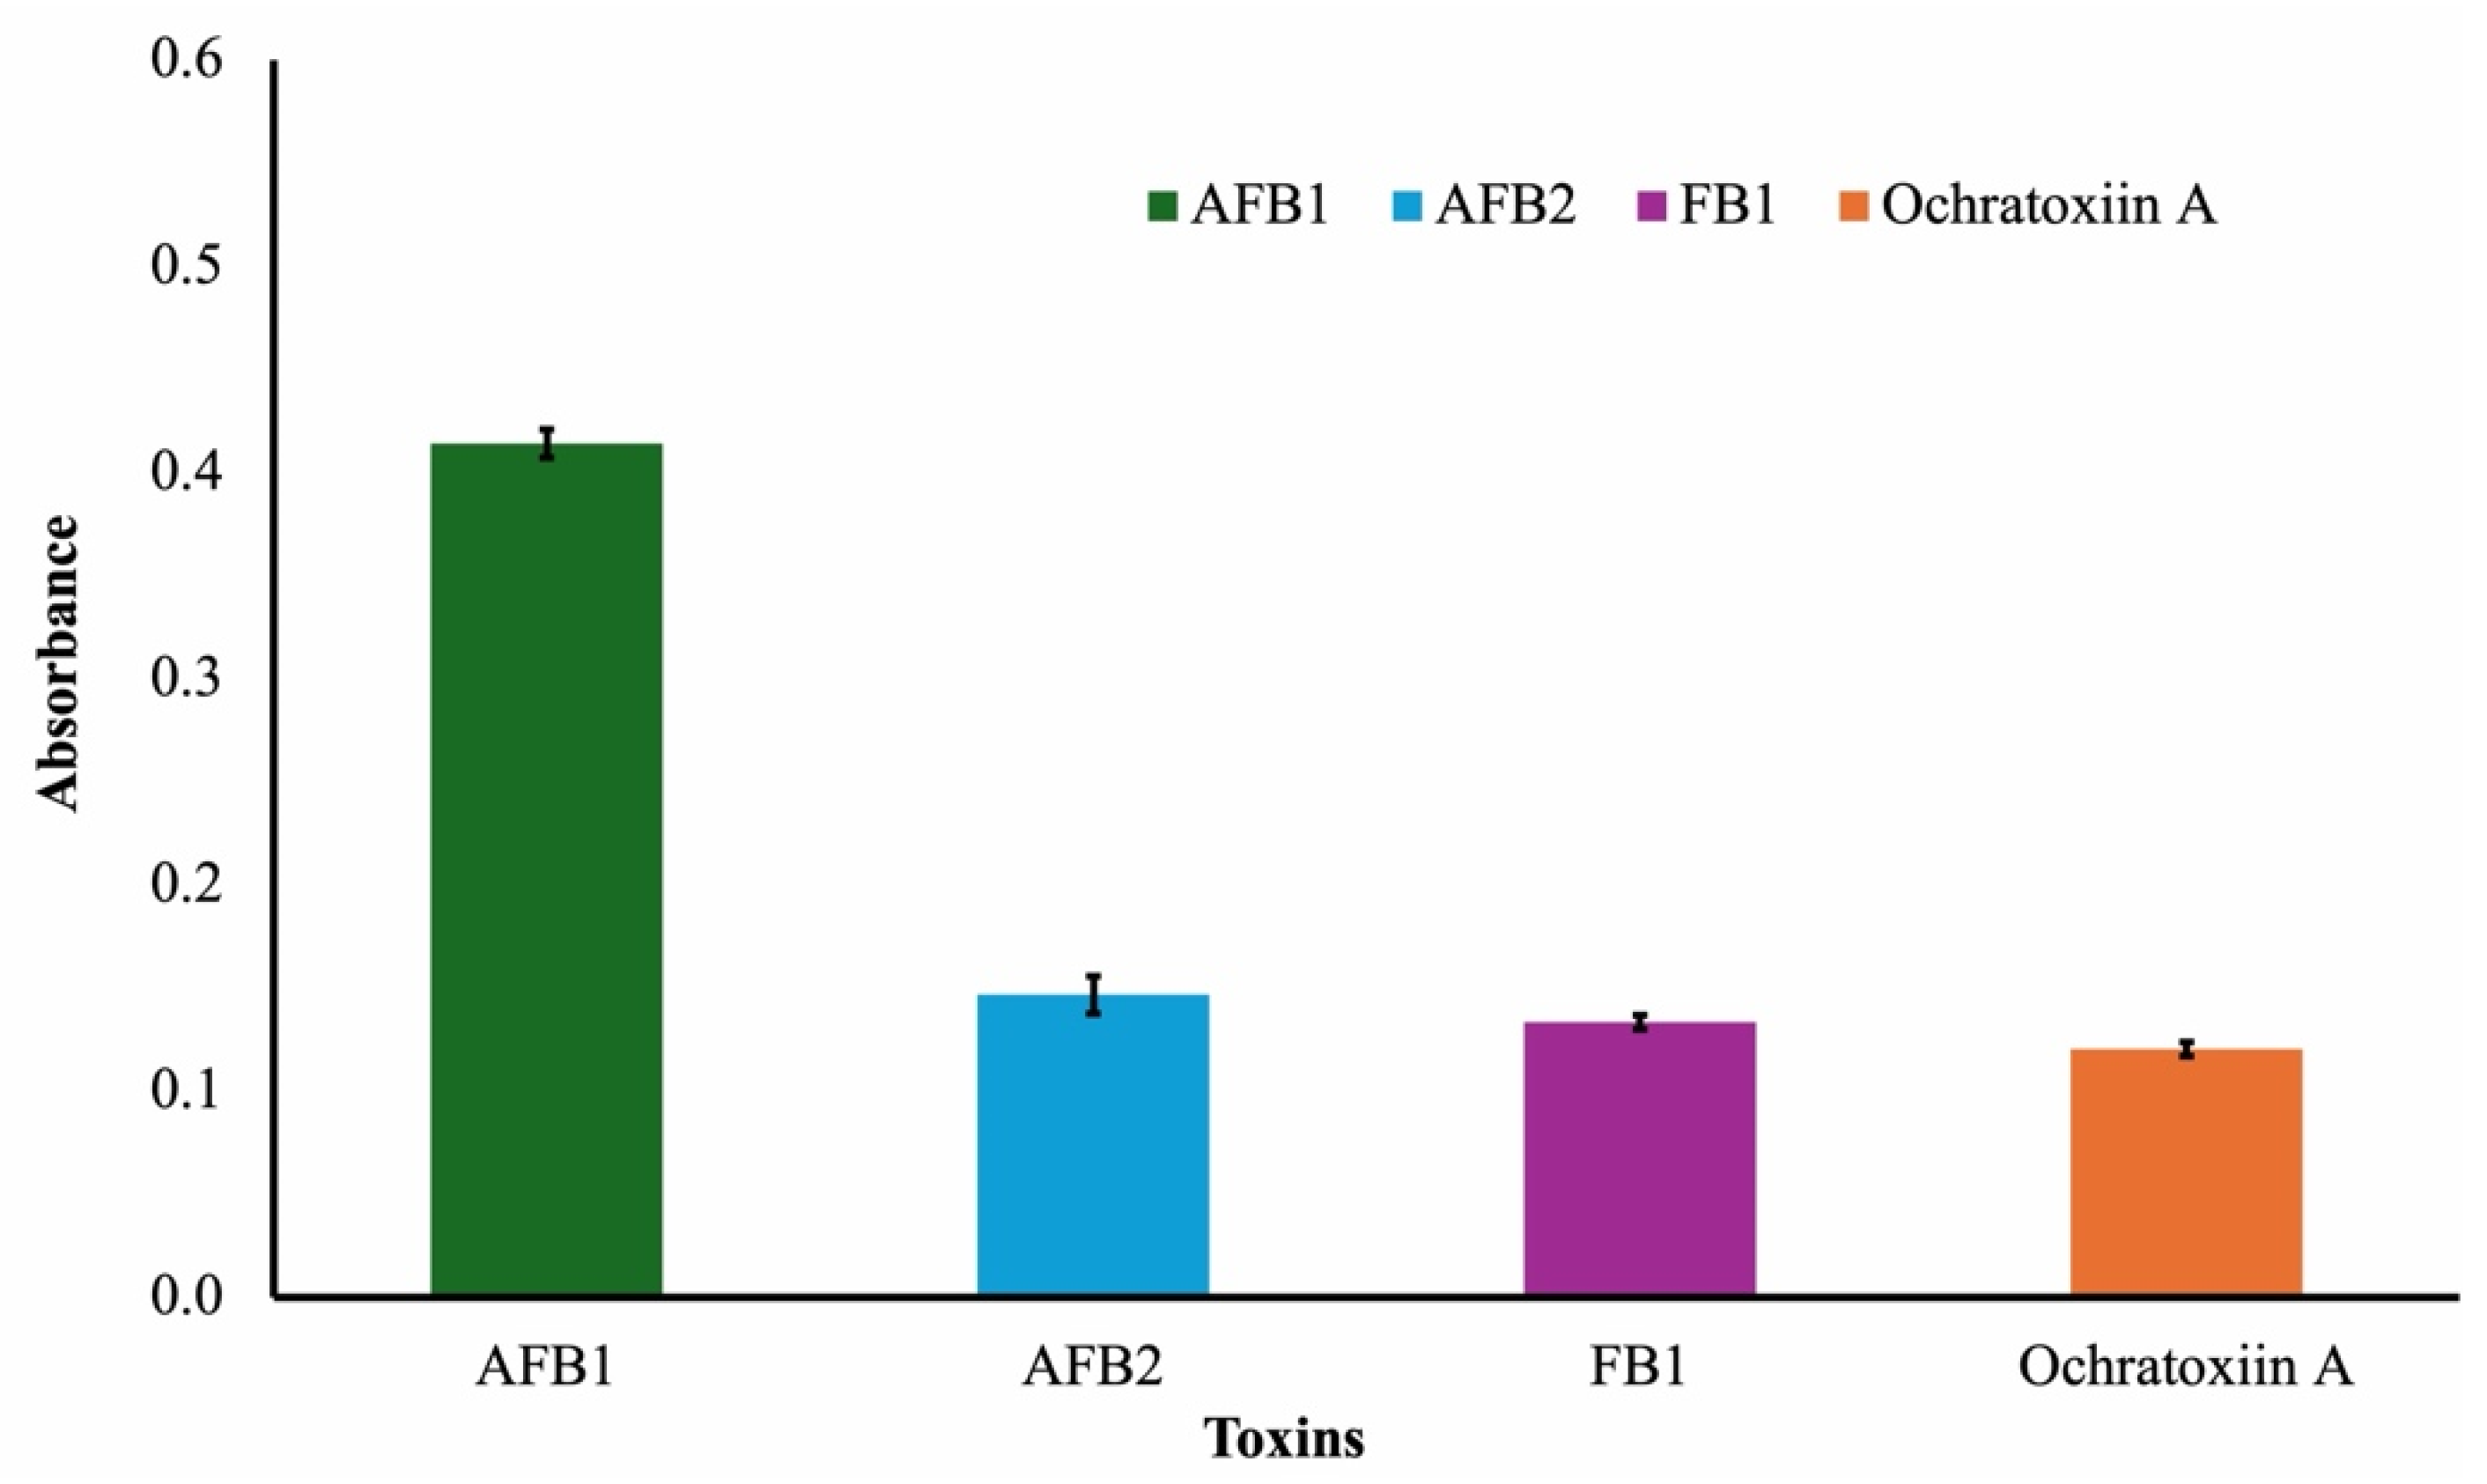
AFB1, AFB2, FB1, and OTA were used to evaluate the selectivity of the non-thiol aptamer-based sensor. AFB1 generated the greatest absorbance response, similar to that of the thiol aptamer, whereas the other mycotoxins produced far lower absorbance values (Figure 10). This indicates that the non-thiol aptamer can selectively recognize AFB1. Nevertheless, compared with the thiol aptamer, the total absorbance response toward AFB1 was lower. This discrepancy is likely due to the non-thiol aptamer’s lower adsorption on the gold nanoparticle surface compared with the thiol aptamer’s stable Au–S bond [21]. However, the slight responses to OTA, AFB1 and AFB2 indicate that the sensor has strong selectivity for AFB1, with little cross-reactivity.
Figure 10.
Specificity of the non-thiol aptamer for AFB1 and selected mycotoxins. Bars represent mean ± SE (n = 3).
4. Real-Sample Analysis
Peanut samples, spiked with different concentrations of AFB1, were evaluated using the aptasensors to assess the applicability in real sample matrices. For extraction of AFB1 from the peanut samples, a mortar and pestle were used to grind the samples to increase the surface area. The resulting powdery samples were extracted using methanol and analyzed using the thiolated and non-thiolated aptasensors. The analysis was performed under the optimized reaction conditions.
As summarized in Table 1, the recovery of the thiol aptasensor tested on spiked peanut samples ranged from 90% to 97%, with an average of 94.2%, whereas for the non-thiol aptasensor tested under the same conditions, the recovery ranged from 82% to 90%, with an average of 87.98%. The highest recovery for the thiol aptasensor was obtained at 40 ppb AFB1, whereas the lowest was obtained at 20 ppb AFB1. For the non-thiol aptasensor, the highest recovery was observed at 15 ppb AFB1, whereas the lowest was at 20 ppb AFB1. Both aptasensors demonstrated the ability to detect AFB1 in extracts of peanut samples at different concentrations. The thiolated aptasensor, however, demonstrated higher average recovery across all concentrations tested. This higher recovery of the thiolated aptamer-based AuNP colorimetric aptasensor could be due to stronger attachment of thiolated aptamers to the AuNP surface via Au–S bonds. Thiolated aptamers can form strong attachments to the Au surface via thiol groups and create very strong, organized sensing interfaces [30]. This organized sensing interface can prevent aptamer desorption, and therefore the target binding sites of the aptamers can be available throughout the assay and result in higher colorimetric response, as seen in Figure 8f. In this regard, the recovery values for thiolated aptamers found in this study were higher than those of non-thiolated aptamers as reported by Saraf et al. [37]. Thus, both aptasensors were successfully applied for the detection of AFB1 in peanut samples, and the thiolated aptasensor showed a higher average recovery in this study.
Table 1.
Recovery of AFB1 from Peanut samples using thiol and non-thiol AuNP-based aptasensors.
Comparison of Developed Sensor with Previously Reported AFB1 Aptasensors
The analytical performance of the thiol- and non-thiol-based aptasensors was evaluated against previously published AFB1 detection techniques in terms of detection time and limit of detection (LOD) (Table 2). Both aptasensor types yielded a fast signal within 5 min, while the thiol aptamer exhibited a lower LOD (0.70 ppb) than the non-thiolated aptamer (1.05 ppb).
Table 2.
Comparison of the present work with reported colorimetric aptasensors.
Compared with earlier approaches, the proposed sensors provide a straightforward, rapid colorimetric strategy for AFB1 determination. The thiol aptamer achieved a detection limit of 0.70 ppb within 5 min, comparable to the AuNP–chimeric aptamer at 0.61 ppb and the AFB1–BSA-functionalized MNPs at 0.90 ppb. However, the non-thiol aptamer was slightly less sensitive, with a limit of 1.0 ppb. A different approach, a label-free aptamer sensor as noted in [33], achieved a lower detection limit of 0.50 ppb but required a longer detection period of 10 min. By contrast, the AuNP–exonuclease III method had a higher detection limit of 10 ppb and took 15 min to complete. In addition to the time and detection limit, the material requirement, experimental conditions, and how easy it is to use are necessary for sensor development. Within the framework of the AuNP-based colorimetric sensor setup, two different strategies for aptamer functionalization were tested, and two different sensing principles were realized. This study shows the flexibility of the aptamer-based sensor design and the influence of the aptamer modification on the required material and the analytical performance of the sensor. In summary, the developed sensor offers a good balance between sensitivity and speed, with the thiol aptamer delivering performance comparable to other methods while requiring less time for detection.
5. Conclusions
In this study, a gold nanoparticle (AuNP)-based colorimetric aptasensor for the rapid detection of AFB1 was developed and evaluated. The sensor exploited the peroxidase-like activity of AuNPs to catalyze the oxidation of TMB by hydrogen peroxide, yielding a detectable colorimetric response for AFB1 detection. The optimized conditions produced stable, reproducible colorimetric results. Two different aptamer functionalization strategies were also investigated for the recognition of AFB1 and their influence on the sensing performance. Both strategies showed potential for the detection of AFB1, but the thiol aptamer provided better sensing performance, including a lower detection limit and a stronger analytical response than the non-thiol aptamer. In addition, the developed aptasensor exhibited excellent selectivity for the target analyte, with minimal interference from AFB2, FB1, and OTA. Furthermore, the aptasensor was also evaluated for its applicability for the detection of AFB1 in complex sample matrices, and the results from this study could be very useful for the design of AuNP-based colorimetric sensing platforms for food safety applications. Overall, the results show that combining AuNP nanozyme activity with aptamer recognition provides a rapid and accurate method for colorimetric AFB1 detection and underscores the potential of thiol-based aptamer functionalization to enhance sensor performance. The results obtained in this study could also serve as a basis for choosing the right aptamer functionalization strategy for AuNP-based colorimetric sensors.
Author Contributions
M.D.: Conceptualization, Methodology, Investigation, Visualization, Writing—original draft. H.P.S.: Funding acquisition, Supervision, Review and editing. All authors have read and agreed to the published version of the manuscript.
Funding
This study was supported by the United States Department of Agriculture, Research, Education, and Economics agreement number 58-6044-1-003 (# 335149), “Reducing Aflatoxin Contamination in United States Peanuts”.
Data Availability Statement
The original contributions presented in this study are included in the article. Further inquiries can be directed to the corresponding author.
Acknowledgments
The authors acknowledge the Center for Ultrastructural Research (CURE) at Fort Valley State University (FVSU) for providing access to the TEM facility and supporting the transmission electron microscopy analysis.
Conflicts of Interest
The authors declare no conflicts of interest.
References
- Frisvad, J.C.; Hubka, V.; Ezekiel, C.N.; Hong, S.B.; Nováková, A.; Chen, A.J.; Arzanlou, M.; Larsen, T.O.; Sklenář, F.; Mahakarnchanakul, W.; et al. Taxonomy of Aspergillus Section Flavi and Their Production of Aflatoxins, Ochratoxins and Other Mycotoxins. Stud. Mycol. 2019, 93, 1–63. [Google Scholar] [CrossRef] [Scilit] [PubMed]
- Liu, A.; Zheng, Y.; Liu, L.; Chen, S.; He, L.; Ao, X.; Yang, Y.; Liu, S. Decontamination of Aflatoxins by Lactic Acid Bacteria. Curr. Microbiol. 2020, 77, 3821–3830. [Google Scholar] [CrossRef] [Scilit] [PubMed]
- Taghdisi, S.M.; Danesh, N.M.; Ramezani, M.; Abnous, K. A New Amplified Fluorescent Aptasensor Based on Hairpin Structure of G-Quadruplex Oligonucleotide-Aptamer Chimera and Silica Nanoparticles for Sensitive Detection of Aflatoxin B1 in the Grape Juice. Food Chem. 2018, 268, 342–346. [Google Scholar] [CrossRef] [Scilit] [PubMed]
- Benkerroum, N. Aflatoxins: Producing-molds, Structure, Health Issues and Incidence in Southeast Asian and Sub-saharan African Countries. Int. J. Environ. Res. Public Health 2020, 17, 1215. [Google Scholar] [CrossRef] [Scilit] [PubMed]
- Ajmal, M.; Bedale, W.; Akram, A.; Yu, J.H. Comprehensive Review of Aflatoxin Contamination, Impact on Health and Food Security, and Management Strategies in Pakistan. Toxins 2022, 14, 845. [Google Scholar] [CrossRef] [Scilit] [PubMed]
- Shabeer, S.; Asad, S.; Jamal, A.; Ali, A. Aflatoxin Contamination, Its Impact and Management Strategies: An Updated Review. Toxins 2022, 14, 307. [Google Scholar] [CrossRef] [Scilit] [PubMed]
- Yan, C.; Wang, Q.; Yang, Q.; Wu, W. Recent Advances in Aflatoxins Detection Based on Nanomaterials. Nanomaterials 2020, 10, 1626. [Google Scholar] [CrossRef] [Scilit] [PubMed]
- Geleta, G.S. A Colorimetric Aptasensor Based on Gold Nanoparticles for Detection of Microbial Toxins: An Alternative Approach to Conventional Methods. Anal. Bioanal. Chem. 2022, 414, 7103–7122. [Google Scholar] [CrossRef] [Scilit] [PubMed]
- Aldewachi, H.; Chalati, T.; Woodroofe, M.N.; Bricklebank, N.; Sharrack, B.; Gardiner, P. Gold Nanoparticle-Based Colorimetric Biosensors. Nanoscale 2018, 10, 18–33. [Google Scholar] [CrossRef] [Scilit] [PubMed]
- Qian, J.; Ren, C.; Wang, C.; An, K.; Cui, H.; Hao, N.; Wang, K. Gold Nanoparticles Mediated Designing of Versatile Aptasensor for Colorimetric/Electrochemical Dual-Channel Detection of Aflatoxin B1. Biosens. Bioelectron. 2020, 166, 112443. [Google Scholar] [CrossRef] [Scilit] [PubMed]
- Lima, E.; Guerra, R.; Lara, V.; Guzmán, A. Gold Nanoparticles as Efficient Antimicrobial Agents for Escherichia Coli and Salmonella Typhi. Chem. Cent. J. 2013, 7, 11. [Google Scholar] [CrossRef] [Scilit] [PubMed]
- Suliasih, B.A.; Sakinah, A.; Angelina, M. The Effect of Electrodeposition Voltage on the Antioxidant Activity of Gold Nanoparticles. Chem. Mater. 2024, 3, 27–33. [Google Scholar] [CrossRef] [Scilit]
- Wang, Q.; Yang, Q.; Wu, W. Progress on Structured Biosensors for Monitoring Aflatoxin B1 From Biofilms: A Review. Front. Microbiol. 2020, 11, 408. [Google Scholar] [CrossRef] [Scilit] [PubMed]
- Sani, A.; Cao, C.; Cui, D. Toxicity of Gold Nanoparticles (AuNPs): A Review. Biochem. Biophys. Rep. 2021, 26, 100991. [Google Scholar] [CrossRef] [Scilit] [PubMed]
- Minqiand, X.; Jiahang, Z.; Lingui, H.; Yunbo, L. Highly Stable and Efficient Gold Nanoparticles Films Facilitated by Thiourea for Catalytic Reduction of Nitrophenol in Water. J. Environ. Chem. Eng. 2024, 12, 113004. [Google Scholar] [CrossRef] [Scilit]
- Mehravani, B.; Ribeiro, A.; Zille, A. Gold Nanoparticles Synthesis and Antimicrobial Effect on Fibrous Materials. Nanomaterials 2021, 11, 1067. [Google Scholar] [CrossRef] [Scilit] [PubMed]
- Li, C.; Zhu, Z.; Yao, J.; Chen, Z.; Huang, Y. Perspectives in Aptasensor-Based Portable Detection for Biotoxins. Molecules 2024, 29, 4891. [Google Scholar] [CrossRef] [Scilit] [PubMed]
- Tuerk, C.; Gold, L. Systematic Evolution of Ligands by Exponential Enrichment: RNA Ligands to Bacteriophage T4 DNA Polymerase. Science 1990, 249, 505–510. [Google Scholar] [CrossRef] [Scilit] [PubMed]
- Yadav, N.; Yadav, S.S.; Chhilar, A.K.; Rana, J.S. An Overview of Nanomaterial Based Biosensors for Detection of Aflatoxin B1 Toxicity in Foods. Food Chem. Toxicol. 2021, 152, 112201. [Google Scholar] [CrossRef] [Scilit] [PubMed]
- Oberhaus, F.V.; Frense, D.; Beckmann, D. Immobilization Techniques for Aptamers on Gold Electrodes for the Electrochemical Detection of Proteins: A Review. Biosensors 2020, 10, 45. [Google Scholar] [CrossRef] [Scilit] [PubMed]
- Wang, X.; Stangherlin, S.; Cheng, N.; Liu, J. Non-Thiolated Spherical Nucleic Acids for Biosensors and Assembly of Nanomaterials. Adv. Sens. Energy Mater. 2025, 4, 100132. [Google Scholar] [CrossRef] [Scilit]
- Losada-Garcia, N.; Rodriguez-Otero, A.; Ortega-Nieto, C.; Azarmi, A.; Palomo, J.M. Catalase Like-Activity of Metal NPs–Enzyme Biohybrids. Appl. Nano 2022, 3, 149–159. [Google Scholar] [CrossRef] [Scilit]
- He, Y.; Liu, J.C.; Luo, L.; Wang, Y.G.; Zhu, J.; Du, Y.; Li, J.; Mao, S.X.; Wang, C. Size-Dependent Dynamic Structures of Supported Gold Nanoparticles in CO Oxidation Reaction Condition. Proc. Natl. Acad. Sci. USA 2018, 115, 7700–7705. [Google Scholar] [CrossRef] [Scilit] [PubMed]
- Jv, Y.; Li, B.; Cao, R. Positively-Charged Gold Nanoparticles as Peroxidiase Mimic and Their Application in Hydrogen Peroxide and Glucose Detection. Chem. Commun. 2010, 46, 8017–8019. [Google Scholar] [CrossRef] [Scilit] [PubMed]
- Li, X.; Wang, L.; Du, D.; Ni, L.; Pan, J.; Niu, X. Emerging Applications of Nanozymes in Environmental Analysis: Opportunities and Trends. TrAC Trends Anal. Chem. 2019, 120, 115653. [Google Scholar] [CrossRef] [Scilit]
- Jangi, M.R.H.; Jangi, A.R.H. Thermal and pH Stability of Peroxidase-like Graphene Oxide/Gold Nanoparticles. Authorea 2024, 1–7. [Google Scholar] [CrossRef] [Scilit] [PubMed]
- Reza, S.; Jangi, H. Article Effect of Incubation Time on Nanozyme-Catalyzed Oxidation of 3,3’,5,5’-Tetramethylbenzidine over Silver Nanoparticles. SSRN 2023, 1–10. [Google Scholar] [CrossRef] [Scilit]
- Yang, Y.; Yin, Y.; Li, X.; Wang, S.; Dong, Y. Development of a Chimeric Aptamer and an AuNPs Aptasensor for Highly Sensitive and Specific Identification of Aflatoxin B1. Sens. Actuators B Chem. 2020, 319, 128250. [Google Scholar] [CrossRef] [Scilit]
- Khramtsov, P.; Valeev, R.G.; Eryomina, M.A.; Rayev, M. Improving Nanozyme-Based Colorimetric Assays through Medium Composition Optimization in Nanozyme-Substrate Reaction. Anal. Chem. 2025, 97, 5781–5788. [Google Scholar] [CrossRef] [Scilit] [PubMed]
- Urmi, R.; Banerjee, P.; Singh, M.; Singh, R.; Chhillar, S.; Sharma, N.; Chandra, A.; Singh, N.; Qamar, I. Revolutionizing Biomedicine: Aptamer-Based Nanomaterials and Nanodevices for Therapeutic Applications. Biotechnol. Rep. 2024, 42, e00843. [Google Scholar] [CrossRef] [Scilit] [PubMed]
- Zhang, B.; Wang, X.; Hu, W.; Liao, Y.; He, Y.; Dong, B.; Zhao, M.; Ma, Y. SPR-Enhanced Au@Fe3O4 Nanozyme for the Detection of Hydroquinone. Chemosensors 2023, 11, 392. [Google Scholar] [CrossRef] [Scilit]
- Kasoju, A.; Shrikrishna, N.S.; Shahdeo, D.; Khan, A.A.; Alanazi, A.M.; Gandhi, S. Microfluidic Paper Device for Rapid Detection of Aflatoxin B1 Using an Aptamer Based Colorimetric Assay. RSC Adv. 2020, 10, 11843–11850. [Google Scholar] [CrossRef] [Scilit] [PubMed]
- Hosseini, M. Aptamer-Based Colorimetric and Chemiluminescence Detection of Aflatoxin B1 in Foods Samples. Acta Chim. Slov. 2015, 62, 721–728. [Google Scholar] [CrossRef] [Scilit] [PubMed]
- Yang, L.F.; Ling, M.; Kacherovsky, N.; Pun, S.H. Aptamers 101: Aptamer Discovery and in Vitro Applications in Biosensors and Separations. Chem. Sci. 2023, 14, 4961–4978. [Google Scholar] [CrossRef] [Scilit] [PubMed]
- Li, D.; Liu, L.; Huang, Q.; Tong, T.; Zhou, Y.; Li, Z.; Bai, Q.; Liang, H.; Chen, L. Recent Advances on Aptamer-Based Biosensors for Detection of Pathogenic Bacteria. World J. Microbiol. Biotechnol. 2021, 37, 45. [Google Scholar] [CrossRef] [Scilit] [PubMed]
- Sun, S.; Zhao, R.; Feng, S.; Xie, Y. Colorimetric Zearalenone Assay Based on the Use of an Aptamer and of Gold Nanoparticles with Peroxidase-like Activity. Microchim. Acta 2018, 185, 535. [Google Scholar] [CrossRef] [Scilit] [PubMed]
- Saraf, N.; Bosak, A.; Willenberg, A.; Das, S.; Willenberg, B.J.; Seal, S. Colorimetric Detection of Epinephrine Using an Optimized Paper-Based Aptasensor. RSC Adv. 2017, 7, 49133–49143. [Google Scholar] [CrossRef] [Scilit]
- Tang, X.; Su, R.; Luo, H.; Zhao, Y.; Feng, L.; Chen, J. Colorimetric Detection of Aflatoxin B1 by Using Smartphone-Assisted Microfluidic Paper-Based Analytical Devices. Food Control 2022, 132, 108497. [Google Scholar] [CrossRef] [Scilit]
- Taghdisi, S.M.; Danesh, N.M.; Ramezani, M.; Emrani, A.S.; Abnous, K. Novel Colorimetric Aptasensor for Zearalenone Detection Based on Nontarget-Induced Aptamer Walker, Gold Nanoparticles, and Exonuclease-Assisted Recycling Amplification. ACS Appl. Mater. Interfaces 2018, 10, 12504–12509. [Google Scholar] [CrossRef] [Scilit] [PubMed]
- Vijitvarasan, P.; Cheunkar, S.; Oaew, S. A Point-of-Use Lateral Flow Aptasensor for Naked-Eye Detection of Aflatoxin B1. Food Control 2022, 134, 108767. [Google Scholar] [CrossRef] [Scilit]
- Setlem, K.; Mondal, B.; Shylaja, R.; Parida, M. Dual Aptamer-DNAzyme Based Colorimetric Assay for the Detection of AFB1 from Food and Environmental Samples. Anal. Biochem. 2020, 608, 113874. [Google Scholar] [CrossRef] [Scilit] [PubMed]
- Xiong, J.; He, S.; Zhang, S.; Qin, L.; Yang, L.; Wang, Z.; Zhang, L.; Shan, W.; Jiang, H. A Label-Free Aptasensor for Dual-Mode Detection of Aflatoxin B1 Based on Inner Filter Effect Using Silver Nanoparticles and Arginine-Modified Gold Nanoclusters. Food Control 2023, 144, 109397. [Google Scholar] [CrossRef] [Scilit]
- Lu, L.; Yu, R.; Zhang, L. AFB1 Colorimetric Aptamer Sensor for the Detection of AFB1 in Ten Different Kinds of Miscellaneous Beans Based on Gold Nanoparticles and Smartphone Imaging. Food Chem. 2023, 421, 136205. [Google Scholar] [CrossRef] [Scilit] [PubMed]

Disclaimer/Publisher’s Note: The statements, opinions and data contained in all publications are solely those of the individual author(s) and contributor(s) and not of MDPI and/or the editor(s). MDPI and/or the editor(s) disclaim responsibility for any injury to people or property resulting from any ideas, methods, instructions or products referred to in the content. |
© 2026 by the authors. Licensee MDPI, Basel, Switzerland. This article is an open access article distributed under the terms and conditions of the Creative Commons Attribution (CC BY) license.