


Abstract
Flaxseed cyclic peptides (CPs) are bioactive compounds with anti-inflammatory, antioxidant, antitumor, and other properties. Their conventional extraction involves toxic solvents, which restricts their application in the food industry. This study aimed to develop an aqueous-ethanol extraction method for CPs, to select the most efficient stationary phase for their separation and identification, and to purify them from accompanying components. Liquid–liquid extraction at a 1:8 (v/v) ratio of 70% ethanol to flaxseed oil ensured sufficient recovery of CPs. A technique for the removal of carotenoids from CP extracts using activated carbon was developed. Qualitative separation and identification of 11 individual CPs in ethanol extracts were performed using HPLC with three columns featuring different stationary phases (octadecyl (C18), cyano (CN), and phenyl-hexyl), UV detection, and tandem mass spectrometry to select the most efficient column. Reference standards of eight different CPs (designated CLC, CLE, CLB, CLA, CLP, CLL, CLM, and CLO) of 81–97% purity were obtained using semi-preparative HPLC with a CN stationary phase column. A quantitative HPLC-DAD method was proposed for the separation of CPs on a phenyl-hexyl stationary phase column, allowing the determination of individual CP contents. Depending on the peptide, the content ranged from 8.8 to 208.2 mg/L of oil, with a total of 659.0 mg/L. The purified CP extracts can be used for further studies of their toxicity and biological activity without interference from accompanying substances.
1. Introduction
Flaxseed cyclic peptides (cyclolinopeptides, orbitides, linusorbs, CPs) are a unique class of compounds distinguished by a broad range of biological activities, including hypocholesterolemic, anti-osteoporotic, anti-inflammatory, antioxidant, antimicrobial, antitumor, and other properties, which indicates the feasibility of studying them as a novel phytonutrient [1,2,3,4,5,6]. CPs are compounds representing cyclooligopeptides (eight, nine, and less frequently ten amino acid residues) with a low molecular weight (~1 kDa) [7]. Flaxseed CPs are homomonocyclic peptides of type VI according to the classification of Tan & Zhou [8]. CPs are homodetic in nature, as the ring consists solely of amino acid residues with N- and C-terminals linked through a peptide bond [9]. Some CPs share the same amino acid sequence but differ in the oxidation state of the methionine residue, such as peptides CLB, CLC, and CLK [10].
In recent years, there has been growing interest in the development of environmentally safe and cost-effective methods for CP extraction. Extraction is a key step in phytochemical studies and largely determines their final outcome [11]. A common source of CPs is flaxseed oil [12,13]. When oil is used as the object of study, liquid–liquid extraction (organic solvent:oil) is the most suitable approach because of the hydrophobicity of CPs [14,15]. This approach allows CPs to be extracted from the starting material with high yields. Modern trends in extraction technology involve the use of intensification methods, such as ultrasonic [16] or microwave treatment [17], which can increase the yield of the target product. This is particularly important when extracting CPs from heterogeneous systems (seed, cake). In the present work, extraction was carried out directly from the oil, i.e., from a homogeneous system; therefore, additional treatment steps, associated in particular with the risk of oxidation of the target product, were not applied. Typically, highly toxic solvents such as methanol, acetonitrile, and others are used for CP extraction from flaxseeds and their processing products [14]. Ethanol, an extractant approved for use in the food industry, can be used as an alternative solvent [18].
A number of studies [19,20] focused on CPs isolated from flax have shown that they exhibited a yellow tint, the presence of which may be explained by incomplete purification from accompanying components present in the seed. These components may include tocopherols, carotenoids, and other compounds [13]. The presence of impurities complicates standardization and may distort the interpretation of biological activity attributed directly to CPs. For this reason, it is expedient to develop an approach aimed at purifying the CPs extract.
In this regard, the aim of this study was to develop a method for the extraction of CPs using an aqueous-ethanol mixture, to select the most efficient stationary phase for their separation and identification, and to develop a procedure for their purification from accompanying oil components.
2. Materials and Methods
2.1. Plant Material
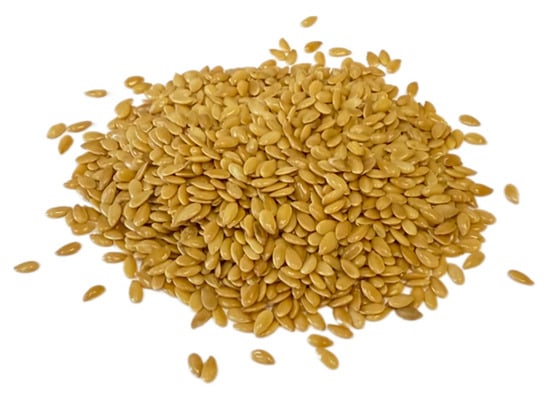
The starting material for CP isolation was oil pressed from yellow seeds of the oilseed flax cultivar ‘Y-117’ (Linum usitatissimum L.). The seeds were grown in 2024 at the V.M. Pustovoit All-Russian Research Institute of Oil Crops (Krasnodar, Russia) (Figure 1).
Figure 1.
Flaxseeds of the “Y-117” variety.
Prior to pressing, the seed samples were stored in 50 kg bags in a dark place at room temperature (20–23 °C) and a relative humidity of 40%. The average moisture content of the seeds prior to pressing was 7.3%.
2.2. Reagents
Ethanol (95%, pharmaceutical grade) was purchased from Konstanta-Farm M (Moscow, Russia). Hexane (HPLC grade), ethyl acetate (analytical grade), acetonitrile (HPLC grade), methanol (HPLC grade), and formic acid (LC-MS grade) were purchased from Fisher Scientific (Waltham, MA, USA). Folin–Ciocalteu reagent and gallic acid (purity ≥ 98%) were purchased from Sigma-Aldrich (St. Louis, MO, USA). Potassium hydroxide and sodium carbonate were of analytical grade and obtained from Himmed (Moscow, Russia). Ultrapure water was purified using a Milli-Q system (Millipore, Bedford, MA, USA). Granulated birch activated carbon (BAU-LV, particle size 1–3 mm, Uralhimsorb, Perm, Russia) was used for extract purification.
2.3. Preparation of Cold-Pressed Flaxseed Oil
In the first stage, oil was extracted from flaxseeds using the “cold-pressing” method, as described in the study by Sarkisyan et al. [19]. In brief, an AP-10 “Shchelkun” screw oil press (Agro-Engineering, Novosibirsk, Russia) was used. The temperature of the oil at the outlet did not exceed 60 °C, which was monitored using a UniversalTemp infrared pyrometer (Bosch, Gerlingen-Schillerhöhe, Germany). The oil obtained was centrifuged in a J-HC floor-standing centrifuge (Beckman Coulter, Brea, CA, USA) in 700 mL centrifuge tubes at 4000 rpm for 30 min, after which the supernatant (oil) was collected for further analysis. The obtained oil was subsequently stored at 4 °C for future use.
2.4. Solvent Concentration and Ratio for CPs Extraction
According to studies by Cai et al. [20] and Sarkisyan et al. [19], ethanol can be used for the extraction of CPs. To evaluate the efficiency of the ethanol–water ratios and the ethanol–flaxseed oil mixtures, a combined approach was proposed: gravimetry and direct measurement of CPs content in the extract using high-performance liquid chromatography with a diode array detector (HPLC-DAD). To this end, ethanol solutions were first prepared at volume ratios of 50, 60, 70, 80, and 90%. For the preliminary experiment, the following ethanol solution-to-flaxseed oil ratios (v/v) were used: 1:8, 1:4, 1:1, and 4:1. It was preliminarily found that the use of a 50% solution for extraction was impossible due to the higher density of this solution (0.934 g/cm3) compared to that of flaxseed oil (0.928–0.932 g/cm3).
For gravimetric analysis, 1, 2, and 4 mL of 60–90% ethanol solutions were added to specified volumes of flaxseed oil (8, 4, 2, and 1 mL) in 15 mL polypropylene centrifuge tubes, and the mixtures were vortexed using a V-1 Plus vortex mixer (Biosan, Riga, Latvia) for 5 min. The resulting emulsions were then centrifuged using a 3–18 K high-speed centrifuge (Sigma, Osterode, Germany) at 5500 rpm (5242× g) for 5 min. Aliquots of the extracts (1 mL) were placed into conical glass tubes and evaporated to dryness using a concentrator under a stream of nitrogen at 60 °C. The masses of the dry residues were determined gravimetrically using a GR 202 analytical balance (A&D Company, Tokyo, Japan) with an accuracy of 0.1 mg. Qualitative and semi-quantitative composition was analyzed according to Sarkisyan et al. [19].
2.5. Centrifugation Conditions
For phase separation, a J-HC floor-standing centrifuge (Beckman Coulter, Brea, CA, USA) was used. To optimize the centrifugation parameters at room temperature (rotational speed, duration), 32 mL of flaxseed oil and 4 mL of a 70% ethanol solution were added to 50 mL centrifuge tubes. Separation efficiency was assessed by measuring the height of the liquid column above the oil. The following conditions were preliminarily tested: (1) 500 rpm (71× g) for 10 min; (2) 1000 rpm (284× g) for 10 min; (3) 2000 rpm (1138× g) for 10 min; (4) 4000 rpm (4552× g) for 10 min. After selecting the most suitable rotational speed, durations of 20 and 30 min were additionally evaluated.
2.6. Determination of Total Carotenoid and Polyphenol Content
The total carotenoid content (TCC) in the extract was determined spectrophotometrically [19,21]. The optical density of the solution was measured at 470 nm using a Spectro Quest 2800 spectrophotometer (UNICO, Suite E, Dayton, NJ, USA). Values are reported as mean ± SD (N = 3).
The pigment content was calculated using Equation (1):
where TCC is the carotenoid content, μg/g; A470 is the absorbance at 470 nm; d is the optical path length (1 cm), 2000 is the specific extinction coefficient of carotenoids at 470 nm; 100 is the conversion factor.
Total polyphenolic content was determined using the Folin–Ciocalteu spectrophotometric method with a spectrophotometer, with experimental parameters adapted from the methodology described elsewhere [22]. The optical density of the samples was measured at 765 nm. Gallic acid was used as a standard.
2.7. Extract Purification Technology
The purification of the target extraction product—CPs from accompanying substances was carried out using activated carbon as the sorbent, which was ground in a mortar to a homogeneous state. For this purpose, 50 mL of the ethanol extract solution was placed into a 250 mL glass beaker, 2.5 g of the sorbent was added, and the mixture was stirred using an Intelli-Stirrer MSH-300i magnetic stirrer (Biosan, Riga, Latvia) at 500 rpm for 30 min. The sample was then transferred to a 50 mL screw-cap tube and centrifuged using a J-HC floor-standing centrifuge (Beckman Coulter, Brea, CA, USA) at 4000 rpm (4552× g) for 30 min. The resulting supernatant was collected and filtered through a syringe filter (Chromafil® Xtra PA-45/25, Macherey-Nagel, Germany) with a pore size of 0.45 µm. The solvent was evaporated using a Hei-Vap rotary evaporator (Heidolph, Schwabach, Germany) at 60 °C. The remaining aqueous solution in the round-bottom flask was kept for 24 h at room temperature (23 ± 1 °C), resulting in the sedimentation of white CP particles. The obtained CPs were then collected from the flask, dried (to constant mass) to remove residual moisture at 60 °C in an evaporation dish, and subsequently ground in a mortar. The dry CPs extract was placed into plastic tubes, capped, and stored in a refrigerator at (4 ± 1 °C) for further analysis.
2.8. Color Determination of the Extract
The color of the extracts was measured according to Frolova et al. [23] and Milovanovic et al. [24] using a portable colorimeter BS 7016 (3NH, Shenzhen, China), with the instrument pre-calibrated using white and black standards. The CIE L*a*b* color scale is a standard scale for evaluating the lightness index (L*), which ranges from black (0) to white (100). The parameter (a*) ranges from green (negative values) to red (positive values), whilst the parameter (b*) ranges from blue (negative values) to yellow (positive values). Based on the obtained values (L*, a*, b*), the whiteness index (WI), yellowness index (YI) and total color difference (ΔE) were calculated. WI was calculated using Equation (2):
YI was calculated using Equation (3):
ΔE was calculated using Equation (4):
2.9. Selection of a Chromatographic Column
Analysis was performed using an Agilent 1260 Infinity II chromatographic system (Agilent Technologies, Santa Clara, CA, USA) equipped with a quaternary pump, a column thermostat, an autosampler, and a G7115A WR diode array detector. Three columns with different stationary phases were evaluated: octadecyl (C18) (Zorbax Eclipse XDB-C18, 4.6 × 250 mm, 5 μm, Agilent Technologies, USA), cyano (CN) (Zorbax SB-CN, 4.6 × 250 mm, 5 μm, Agilent Technologies, USA), and phenyl-hexyl (InfinityLab Poroshell 120, 4.6 × 250 mm, 4 μm, Agilent Technologies, USA). Elution was performed at a column temperature of 30 °C. The sample injection volume was set to 20 μL. The mobile phase consisted of acetonitrile and water, both acidified with 0.1% formic acid. The separation was carried out at a constant flow rate of 1.0 mL/min under linear gradient conditions specified as follows: 0–35 min, 5–100% acetonitrile; 35–40 min, 100% acetonitrile; followed by a 5 min post-run re-equilibration step at 5% acetonitrile. Chromatographic detection was carried out via UV spectrophotometry at two wavelengths: 214 and 280 nm. Comprehensive mass spectrometric data and fragmentation parameters for the identification of the target cyclic peptides are described in detail in our previous study [19].
The value k*, the gradient retention factor, provides a convenient basis for understanding and controlling resolution in gradient elution. Similarly to isocratic elution, it is advantageous to maintain k* within certain limits (1 ≤ k* ≤ 10) [25]. The values of k* are given by the following Equation (5):
where tG—gradient time (min), F—flow rate (mL/min), Vm—column volume (mL), ∆ϕ—gradient range, S—constant.
The main factor determining the value of S is the molecular weight of the compound: S~0.25·M1/2, where M—molecular weight. The molecular weights of CPs range from 961 Da to 1074 Da; therefore, the calculated value of S~8.
Determination of the initial isocratic separation conditions, ϕiso (% organic phase), based on the results of the scouting gradient, can be performed using Equation (6):
where [tR]avg—average retention time of the components (min), t0—void time (min), tD—gradient dwell time (min).
2.10. Method for the Preparation of CP Standards (Semi-Preparative HPLC) and Quantitative Determination of Their Concentration in the Extract
Isolation of individual CP standards was carried out by HPLC on a semi-preparative Dionex Ultimate 3000 chromatographic system (Thermo Scientific, USA) equipped with a binary pump, an autosampler, a column thermostat, a diode array detector, and a fraction collector. Separation of CPs was performed on an Ultra Cyano (10 × 250 mm, 5 μm, RESTEK, Bellefonte, PA, USA) chromatographic column. The column temperature was maintained at 30 °C. The flow rate was 4.7 mL/min. Detection was carried out at a wavelength of 214 nm. The injection volume was 300 μL. Fractions were collected into 50 mL polypropylene tubes. After approximately 3–4 separations, the contents of each tube were transferred into 100 mL round-bottom flasks and evaporated to dryness on a rotary evaporator at 60 °C. The dry residues were dissolved in a small amount of methanol (~5 mL) and transferred into 10 mL amber glass screw-cap tubes. The contents of the tubes were evaporated to dryness under a stream of nitrogen at 40 °C and weighed on an analytical balance with a precision of 0.00001 g. The obtained mass values were corrected for the purity of the standards. Stock solutions of individual standards were prepared by adding methanol to the dry standards. Calibration standards were prepared by serial twofold dilution of a multicomponent standard containing eight CPs, obtained by mixing the stock solutions of the individual standards.
The purity of CPs in the collected fractions was assessed by HPLC-DAD using an Agilent 1260 Infinity II chromatographic system (Agilent Technologies, USA) equipped with a quaternary pump, a column thermostat, an autosampler, and a diode array detector. Separation of CPs was performed on an Agilent InfinityLab Poroshell 120 Phenyl-Hexyl chromatographic column (4.6 × 250 mm, 4 μm, Agilent Technologies, USA) under isocratic conditions. The mobile phase consisted of acetonitrile and water, both acidified with 0.1% formic acid (60:40, v/v). The flow rate was maintained constantly at 1.0 mL/min, and the column temperature was controlled at 30 °C. The sample injection volume was set to 20 μL. Chromatographic detection was carried out via UV spectrophotometry at a wavelength of 214 nm.
2.11. Method Validation
2.11.1. Efficiency of CP Extraction
To evaluate method recovery without interference from high endogenous backgrounds, a blank surrogate matrix was prepared. A portion of the flaxseed oil was pre-purified by passing it through a silica gel column to remove native compounds. The resulting effluent contained only trace amounts of cyclic peptides below the Limit of Detection (LOD) and was subsequently used for the fortification experiments. To evaluate the effectiveness of the CP isolation using ethanol extraction, CP standards in minimal amount of methanol were added to 8 g flaxseed oil to achieve the following concentrations: 28.1, 7.0, and 1.8 μg/g of CLC; 27.5, 6.9, and 1.7 μg/g of CLE; 25.3, 6.3, and 1.6 μg/g of CLB; 26.9, 6.7, and 1.7 μg/g of CLA; 29.0, 7.2, and 1.8 μg/g of CLP; 29.7, 7.4, and 1.9 μg/g of CLL; 30.3, 7.6, and 1.9 μg/g of CLM; and 29.4, 7.4, and 1.8 μg/g of CLO. After mixing, the solvent was evaporated under a stream of nitrogen. The added compounds were extracted with 70% ethanol at an ethanol solution-to-oil ratio of 1:8, and their content was analyzed by HPLC-DAD. The recovery experiments were performed in triplicate, and the recovery was expressed as a percentage of the amount added to the sample.
2.11.2. Limit of Quantification (LOQ) and Detection (LOD)
Standard solutions of CPs: CLC, CLE, CLB, CLA, CLP, CLL, CLM and CLO were diluted in methanol and analyzed by HPLC until the peak was observed at a signal-to-noise ratio of 10:1. The Limit of Detection (LOD) was established based on an analytical signal-to-noise ratio of 3:1. The linearity of calibration was assessed by using the standard solutions at five different concentration levels. A calibration curve was generated for each CP to confirm the linearity of the signal. The slope, intercept and correlation coefficient (r) were calculated.
2.11.3. Stability Assay
The stability of the CPs under normal analytical conditions was evaluated by storing the CP extracts in the HPLC autosampler for 24 and 72 h at 4 °C.
2.11.4. Robustness
The robustness of the developed HPLC-DAD method was evaluated to verify its reliability against minor, deliberate variations in critical chromatographic parameters. The tested parameters included column temperature (30 ± 2 °C) and mobile phase flow rate (1.0 ± 0.1 mL/min). Robustness was assessed by analyzing the target compounds under these varied conditions in triplicate (N = 3). The evaluation criteria were based on the stability of peak resolution and the relative standard deviations (RSD) of the analyte retention times, with an acceptance threshold set at RSD < 1.5%.
2.12. Determination of Carotenoid Content
Saponification of carotenoid esters was performed to obtain free xanthophylls. The carotenoid fraction from flaxseed oil was isolated using solid-phase extraction on silica gel. Adsorption onto silica gel was carried out in hexane, while carotenoids were eluted with 50% ethyl acetate in hexane. Excess organic solvent was evaporated under a stream of nitrogen using a concentrator, and the residue was treated with a 0.5 M KOH solution in methanol at 50 °C for 30 min. After saponification, the sample was diluted with water, and the free xanthophylls were extracted with hexane. Prior to evaporation, the hexane extract was thoroughly washed with water to remove residual KOH. After evaporation, the extract was redissolved in methanol and subjected to mass spectrometric analysis.
Analysis of carotenoids was performed via direct infusion mass spectrometry using a Thermo LTQ Velos Pro mass spectrometer (Thermo Scientific, San Jose, CA, USA) equipped with a linear ion trap and an atmospheric pressure chemical ionization (APCI) source operating in positive ion mode. The sample solution was delivered directly into the APCI source using a built-in syringe pump at a constant flow rate of 10 μL/min, bypassing any liquid chromatographic separation. The APCI source parameters were established as follows: discharge current 5.0 μA; vaporizer temperature 400 °C; ion transfer tube temperature 250 °C; sheath gas (N2) flow rate 45 arb; auxiliary gas (N2) flow rate 15 arb; and sweep gas flow rate 2 arb. Data acquisition was performed in the full-scan MS mode within a mass range of 100–700 Da.
Absorption spectra of the ethanol extracts were recorded using a Shimadzu UV-1900i UV-Vis spectrophotometer (Shimadzu Corporation, Kyoto, Japan). Samples were measured in quartz cuvettes over the range of 200 to 900 nm.
2.13. Statistical Analysis
Graphs were produced using OriginPro 2018 software. The experiments were done in triplicate. Statistical analysis of the results was performed using the non-parametric Kruskal–Wallis test to identify significant groups. Dunn’s post hoc test was then applied for subsequent pairwise multiple comparisons between groups. The significance level was set at p < 0.05 with a 95% confidence level.
3. Results and Discussion
3.1. Gravimetric Analysis and Identification of CPs
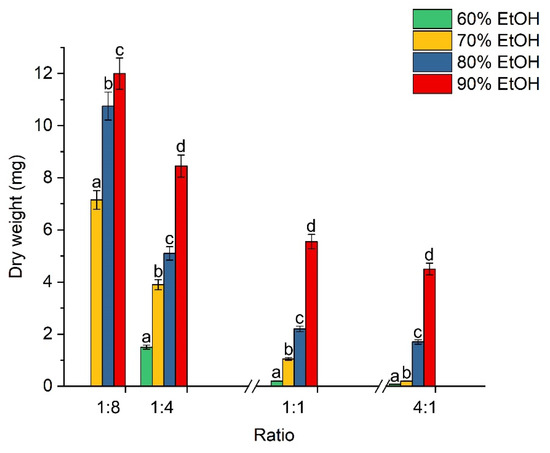
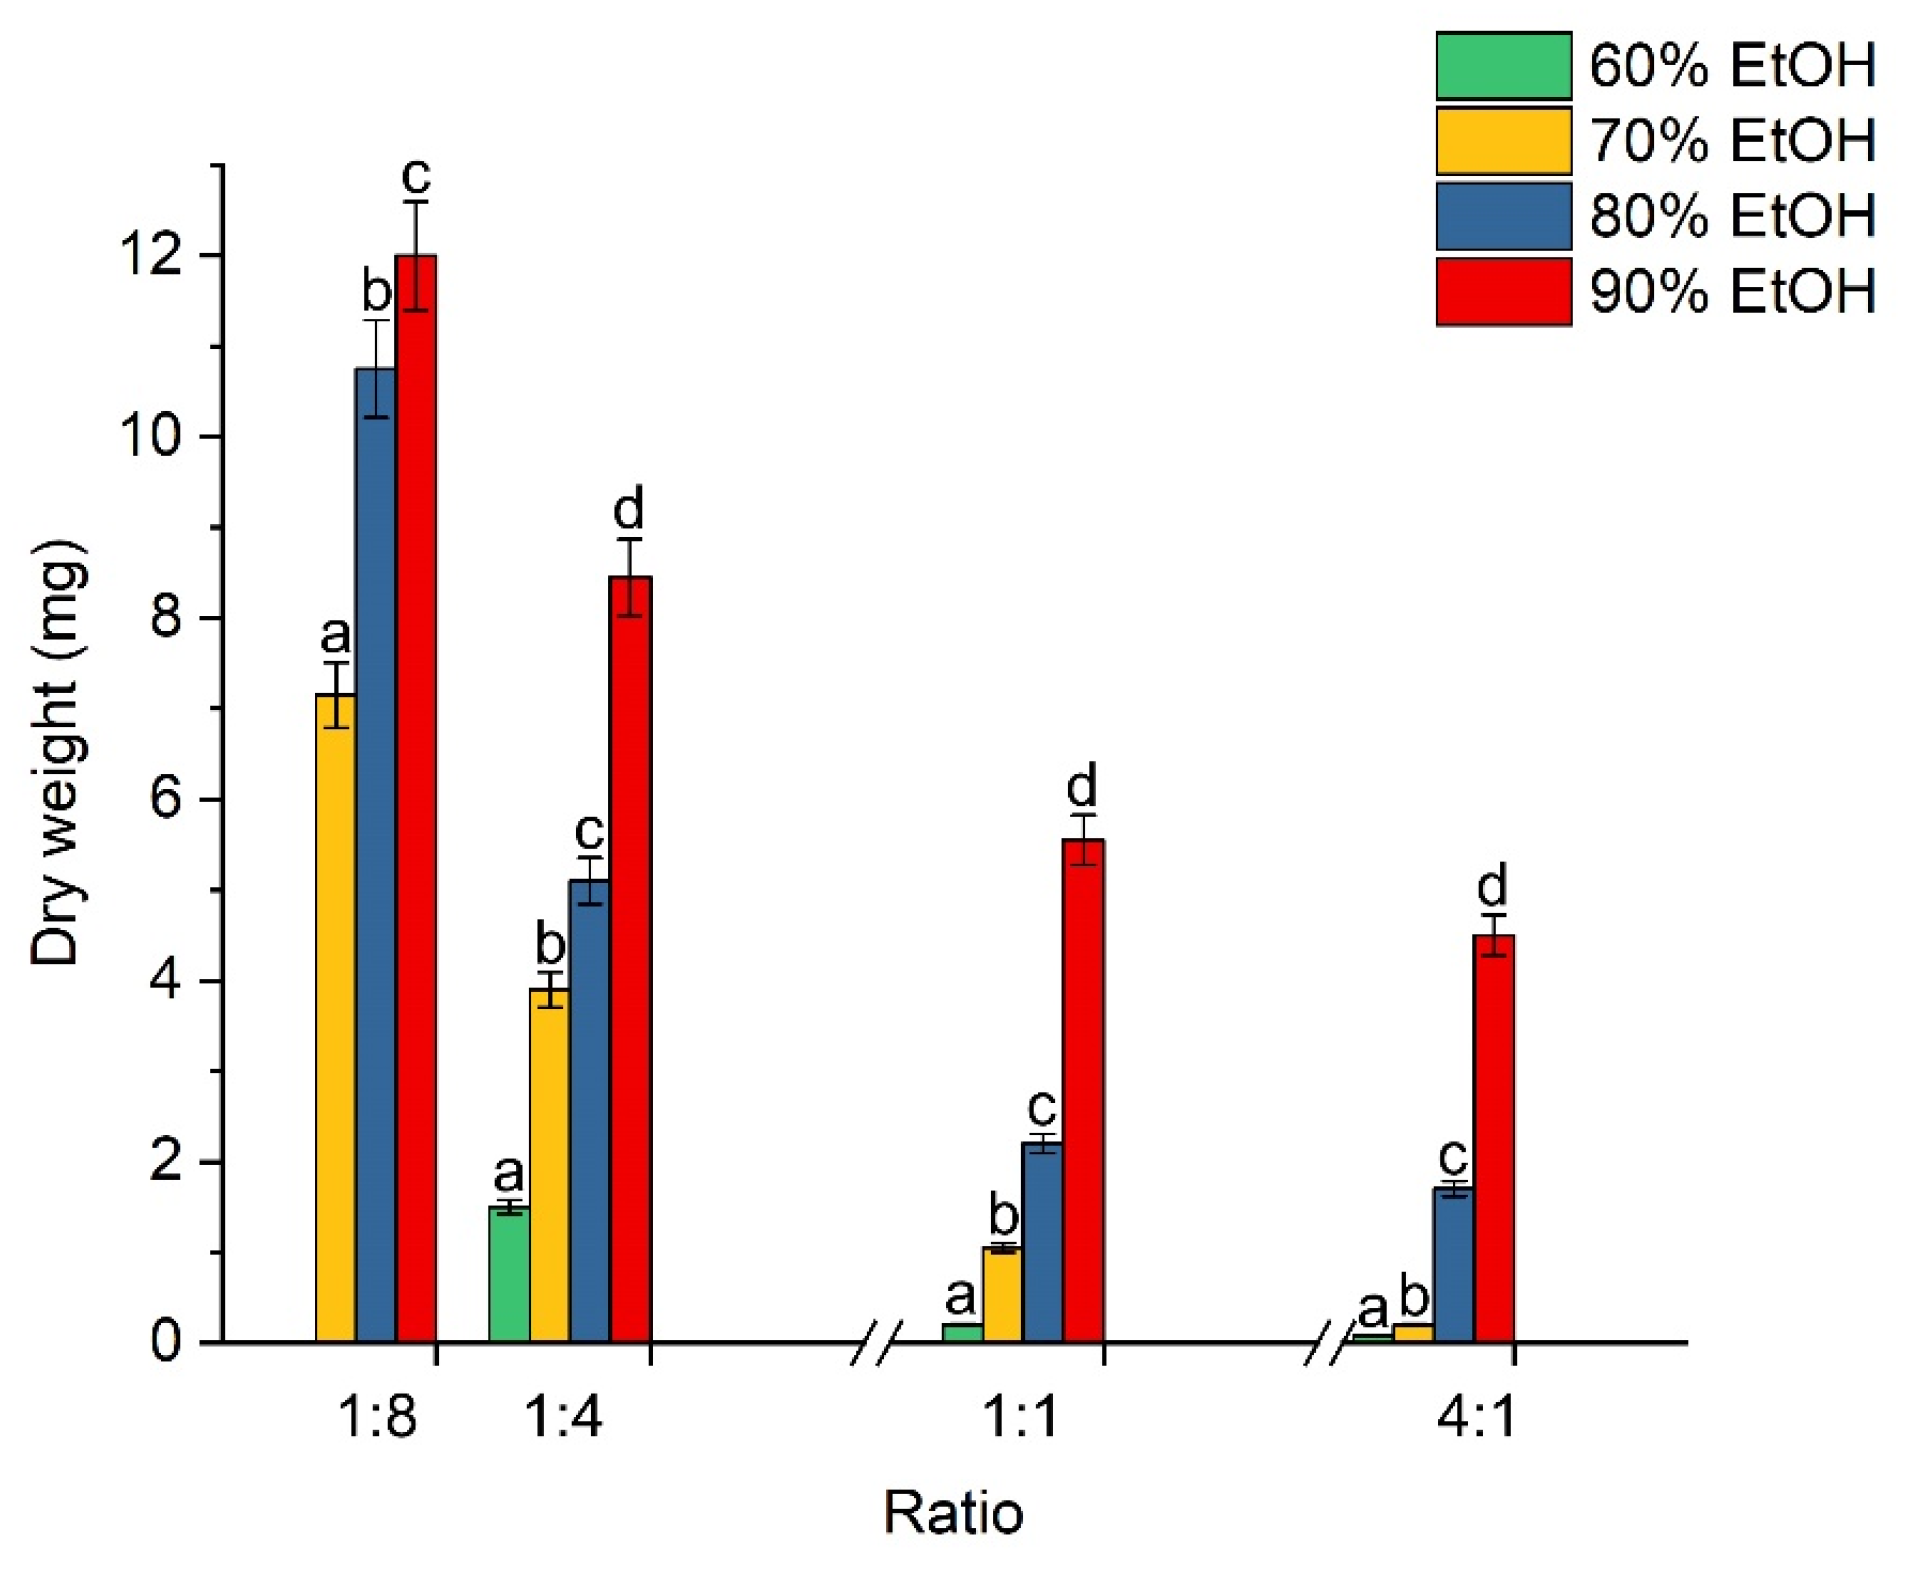
The results of the gravimetric analysis are shown in Figure 2.
Figure 2.
Dependence of dry residue mass on compositions and ratios of solutions to oil. Different letters indicate differences between samples within a group (N = 3, p < 0.05).
As can be observed from Figure 2, clear trends of decreasing dry residue mass with increasing extractant volume from 1:8 to 4:1 are evident in each series. The zero mass value in the case of the 1:8 ratio with the 60% solution is due to the impossibility of phase separation. It was found that with an increase in the percentage of ethanol in the solution from 70 to 90%, the mass of dry matter significantly increased (p < 0.05) from 7.2 to 12.0 mg for the 1:8 ratio. This trend was also maintained for the other ratios. An increase in the volume fraction of ethanol in the extractant led to an increase in the dry residue mass, which is consistent with the study of Waszkowiak & Gliszczyńska-Świgło [26] and is explained by enhanced extraction of phenolic acid esters, as well as hydrophobic compounds, such as free fatty acids, phospholipids, and pigments (carotenoids, lutein). Notably, with an increase in alcohol concentration from 70% to 90% at a ratio of 1:8 (extractant:oil, v/v), the resulting alcohol extract acquired a more yellow tint (Figure S1 of the Supplementary Materials).
Since the gravimetric approach lacks selectivity, it is not entirely clear whether the observed trends also apply specifically to CPs. To clarify this, a semi-quantitative evaluation of CP content was performed via HPLC-DAD, monitoring changes in the relative peak area of cyclolinopeptide A (CLA) as a representative predominant peptide. CLA was chosen as the optimal screening marker because it is one of the predominant peptides [27]. Furthermore, it lacks a readily oxidizable methionine residue, thereby eliminating systematic errors associated with alterations in the qualitative composition of the peptides. Although the gravimetric data indicated an increase in residue mass with rising ethanol content from 60 to 90%, the HPLC-DAD screening showed no significant difference (p > 0.05) in CLA peak areas at ethanol contents above 70%. Specifically, increasing the ethanol content from 60% to 70% at a 1:8 ratio (extractant:oil v/v) led to a sharp increase (p < 0.05) in the peptide chromatographic response, followed by a plateau in the 70–90% range. It was found that the extraction behavior of CLA using a 70% ethanol solution correlated well with the general trend observed in the gravimetric approach. Regarding the solvent volume, a downward trend in the relative peptide response per unit volume was observed as the ratio increased from 1:8 to 4:1 (extractant:oil, v/v) due to the dilution effect. Therefore, the 1:8 ratio (extractant:oil, v/v) is sufficient for successful peptide extraction from the oil while minimizing extractant consumption, which is economically viable.
3.2. Selection of Centrifugation Conditions
Since mixing ethanol solution with flaxseed oil results in the formation of an emulsion, selecting optimal conditions for phase separation is an important task. In this regard, an experiment was conducted to determine the appropriate centrifugation conditions for the oil-to-extractant mixture. The appearance of the samples is shown in Figure S2 of the Supplementary Materials. The addition of 4 mL of ethanol corresponded to 8 mm of the tube height. It was determined that the height of the separated ethanol layer was 4.1 mm at 500 rpm, increased to 5.4 mm at 1000 rpm, and reached 5.8 mm at 2000 rpm; however, each of these samples exhibited turbidity at the phase interface, making it more difficult to collect the separated supernatant. The maximum value was achieved at 4000 rpm, reaching 6.0 mm. Nevertheless, even at this speed, the proportion of ethanol that transferred into the oil was approximately 25%. Therefore, the effect of centrifugation time at 4000 rpm was further investigated (three time intervals: 10, 20, and 30 min). It was found that the appearance of the samples after centrifugation did not differ. The proportion of separated ethanol was identical across all samples. This indicates that increasing the centrifugation time from 10 to 30 min does not improve separation efficiency, and a portion of the ethanol still partitions into the oil, reflecting the solubility of ethanol in oil. Accordingly, for further work, it is recommended to use a speed of 4000 rpm and a centrifugation time of 10 min.
3.3. Selection of Chromatographic Conditions
In the absence of information on the retention of the mixture components, a scouting gradient of 5–100% organic phase is typically used as the initial conditions.
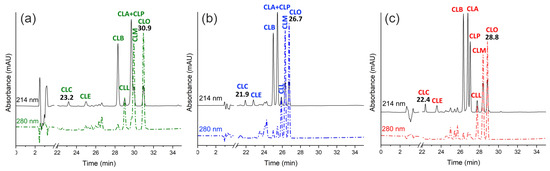
Substituting the variable values into the equation for k* yields values of ~1.5 for the C18 and CN systems and ~2 for the phenyl-hexyl system. The obtained k* values are not optimal; however, they allow for an assessment of the selectivity of each stationary phase toward CPs. Figure 3a–c shows chromatograms of the separation of the 70% ethanol extract of CPs on each system under the conditions calculated above.
Figure 3.
Chromatographic separation of a 70% ethanol extract of CPs using different stationary phases with the mobile phase H2O/MeCN/0.1% FA (v/v): (a) C18 phase; (b) CN phase; (c) phenyl-hexyl phase. MeCN—acetonitrile; FA—formic acid; CLC-CLO—cyclolinopeptides.
According to the obtained results, both similarities and differences in the selectivity of the presented chromatographic systems can be noted. Common to all systems is the poor retention of the oxidized forms of CPs and their elution order: first CLC, followed by CLE. In contrast, the retention of the non-oxidized forms is stronger and varies depending on the stationary phase. For the CN and phenyl-hexyl phases, stronger retention is characteristic of CPs containing tryptophan in their amino acid sequence (Figure S3 of the Supplementary Materials). The elution order of CPs for these systems is as follows: CLB, CLA + CLP, CLL, CLM, and CLO. The cyclic peptides CLL, CLM, and CLO, which contain tryptophan in their amino acid sequence, exhibit greater affinity for the stationary phase, which explains their later elution from the chromatographic column. The C18 stationary phase exhibits selectivity distinct from that of the CN and phenyl-hexyl phases. The elution order of CPs on this phase is as follows: CLB, CLL, CLA + CLP, CLM, and CLO. A certain relationship exists between structure and retention times (tR). Thus, tR increases with increasing hydrophobic influence of the side chain, for example, in the order Gly < Ala < Val < Leu < Ile. For example, the weaker retention of peptide CLL compared to CLM can be explained by the difference in the amino acid sequence of a single amino acid, Val and Ile, respectively [28].
In accordance with the classification described in the study by Shim et al. [2], the analyzed CPs were assigned the following designations: CLC ([1–9-NαC],[1-(Rs,Ss)MetO]-linusorb B2), CLE ([1–8-NαC],[1-(Rs,Ss)MetO]-linusorb B1), CLB ([1–9-NαC]-linusorb B2), CLA ([1–9-NαC]-linusorb B3), CLP ([1–8-NαC]-linusorb B1), CLL ([1–8-NαC]-linusorb A3), CLM ([1–8-NαC]-linusorb A1), CLO ([1–8-NαC]-linusorb A2). Additional information regarding the eight identified peptides within the scope of the current study is presented in Table S1 of the Supplementary Materials.
The main difference among the presented chromatographic systems is their ability to separate the peptides CLA + CLP. According to the obtained results, this becomes possible only with the use of the phenyl-hexyl stationary phase. The CN stationary phase exhibits similar selectivity for all CPs except CLA + CLP. Poor resolution of the cyclic peptides CLA + CLP, and CLM is a consequence of insufficient affinity for the C18 stationary phase.
The retention times of the first and last CPs allow for the determination of whether isocratic separation is feasible. If the ratio of the difference in retention times between the first and last component to the total gradient time, ∆tR/tG ≤ 0.25, meaning that all target compounds occupy no more than 25% of the total analysis time, isocratic separation is possible. If the ratio is ≥0.40, i.e., 40%, gradient separation is recommended. Typically, for large molecules (≥1000 Da), gradient separation is recommended; however, the obtained results suggest otherwise. For the phenyl-hexyl stationary phase, this ratio was ∆tR/tG~0.18, enabling isocratic separation of the target components.
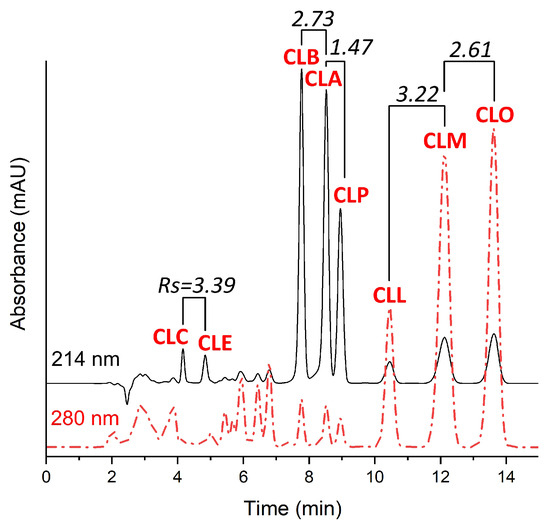
The experimentally determined volume of the Agilent 1260 Infinity II chromatographic system was 1 mL. Thus, at a flow rate of 1 mL/min, tD was 1 min. Substituting all variables into the equation yields ϕiso~0.58, or 58%. Figure 4 shows the chromatogram of the separation of the 70% ethanol extract of CPs under isocratic conditions.
Figure 4.
Chromatogram of separation of 70% ethanol extract of CPs under isocratic conditions in a phenyl-hexyl system—39.9% H2O: 60% MeCN: 0.1% FA. MeCN—acetonitrile; FA—formic acid; CLC-CLO—cyclolinopeptides.
The evaluation of the proposed separation mode and conditions was performed by calculating the retention factors (k*) and resolution of critical pairs of target components (Rs). For the analyzed CPs, the k* values were as follows: CLC—0.50; CLE—0.76; CLB—1.84; CLA—2.11; CLP—2.27; CLL—2.82; CLM—3.42; CLO—3.97.
The analyzed components in the chromatogram can be conditionally divided into three groups: (1) oxidized cyclic peptides CLC and CLE, (2) non-oxidized peptides lacking tryptophan in their amino acid sequence—CLB, CLA, and CLP, and finally (3) tryptophan-containing peptides—CLL, CLM, and CLO. Since these groups are sufficiently separated in time on the chromatogram, the critical pairs are considered to be the components within each group. According to the results, the Rs values for all critical pairs were ≥1.5, which is sufficient not only for qualitative but also for quantitative analysis under the specified conditions. The retention of non-oxidized peptides ranged from 1 ≤ k* ≤ 4, which is adequate for a reliable chromatographic method. Although the oxidized forms exhibited poor retention (k* ≤ 1), they were sufficiently separated from the unretained components of the mixture. Increasing k would proportionally increase the analysis time, which would significantly reduce performance.
In this section, the separation conditions for flax CPs were optimized using HPLC. It was shown that separation quality directly depends not only on the system components (stationary and mobile phases) but also on the elution mode. Since the amino acid sequence of CPs is predominantly represented by a similar set of amino acids, the development of a quantitative analytical method is only possible using a highly selective stationary phase. The phenyl-hexyl phase serves as such a phase. The effectiveness of using the phenyl-hexyl phase for the separation of CPs has also been reported in the study by Lao et al. [27]. The use of this phase in isocratic elution mode enabled the development of a rapid (15 min) analytical method with high resolution of the target components (Rs ≥ 1.5).
3.4. Method for the Preparation of CP Standards (Semi-Preparative HPLC)
Based on the results of chromatographic separation of CPs, it was established that the phenyl-hexyl stationary phase exhibits high selectivity and allows the target compounds to be resolved with high resolution under isocratic conditions. The use of isocratic elution is preferable in preparative chromatography due to the absence of a re-equilibration step to initial conditions, which consequently reduces analysis time and organic solvent consumption. A stationary phase with similar selectivity was the cyano (CN) phase. An additional argument in favor of selecting the CN stationary phase was the smallest difference in retention time between the first and last CPs—4.8 min, which would require a smaller volume of organic phase when developing an isocratic separation method.
The selection of initial separation conditions was performed on an analytical chromatographic column, Agilent Zorbax SB-CN (4.6 × 250 mm, 5 μm, Agilent Technologies, USA), according to the previously described scheme using a scouting gradient. The ∆tR/tG ratio for the stationary CN phase was ~0.14 (∆tR/tG ≤ 0.25), allowing isocratic separation to be performed. Based on the results of the scouting gradient, the initial conditions for isocratic separation, ϕiso (% organic phase), were calculated to be ~0.52 or 52%.
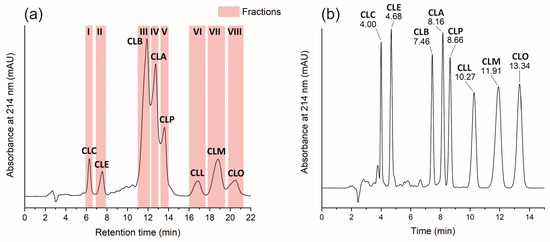
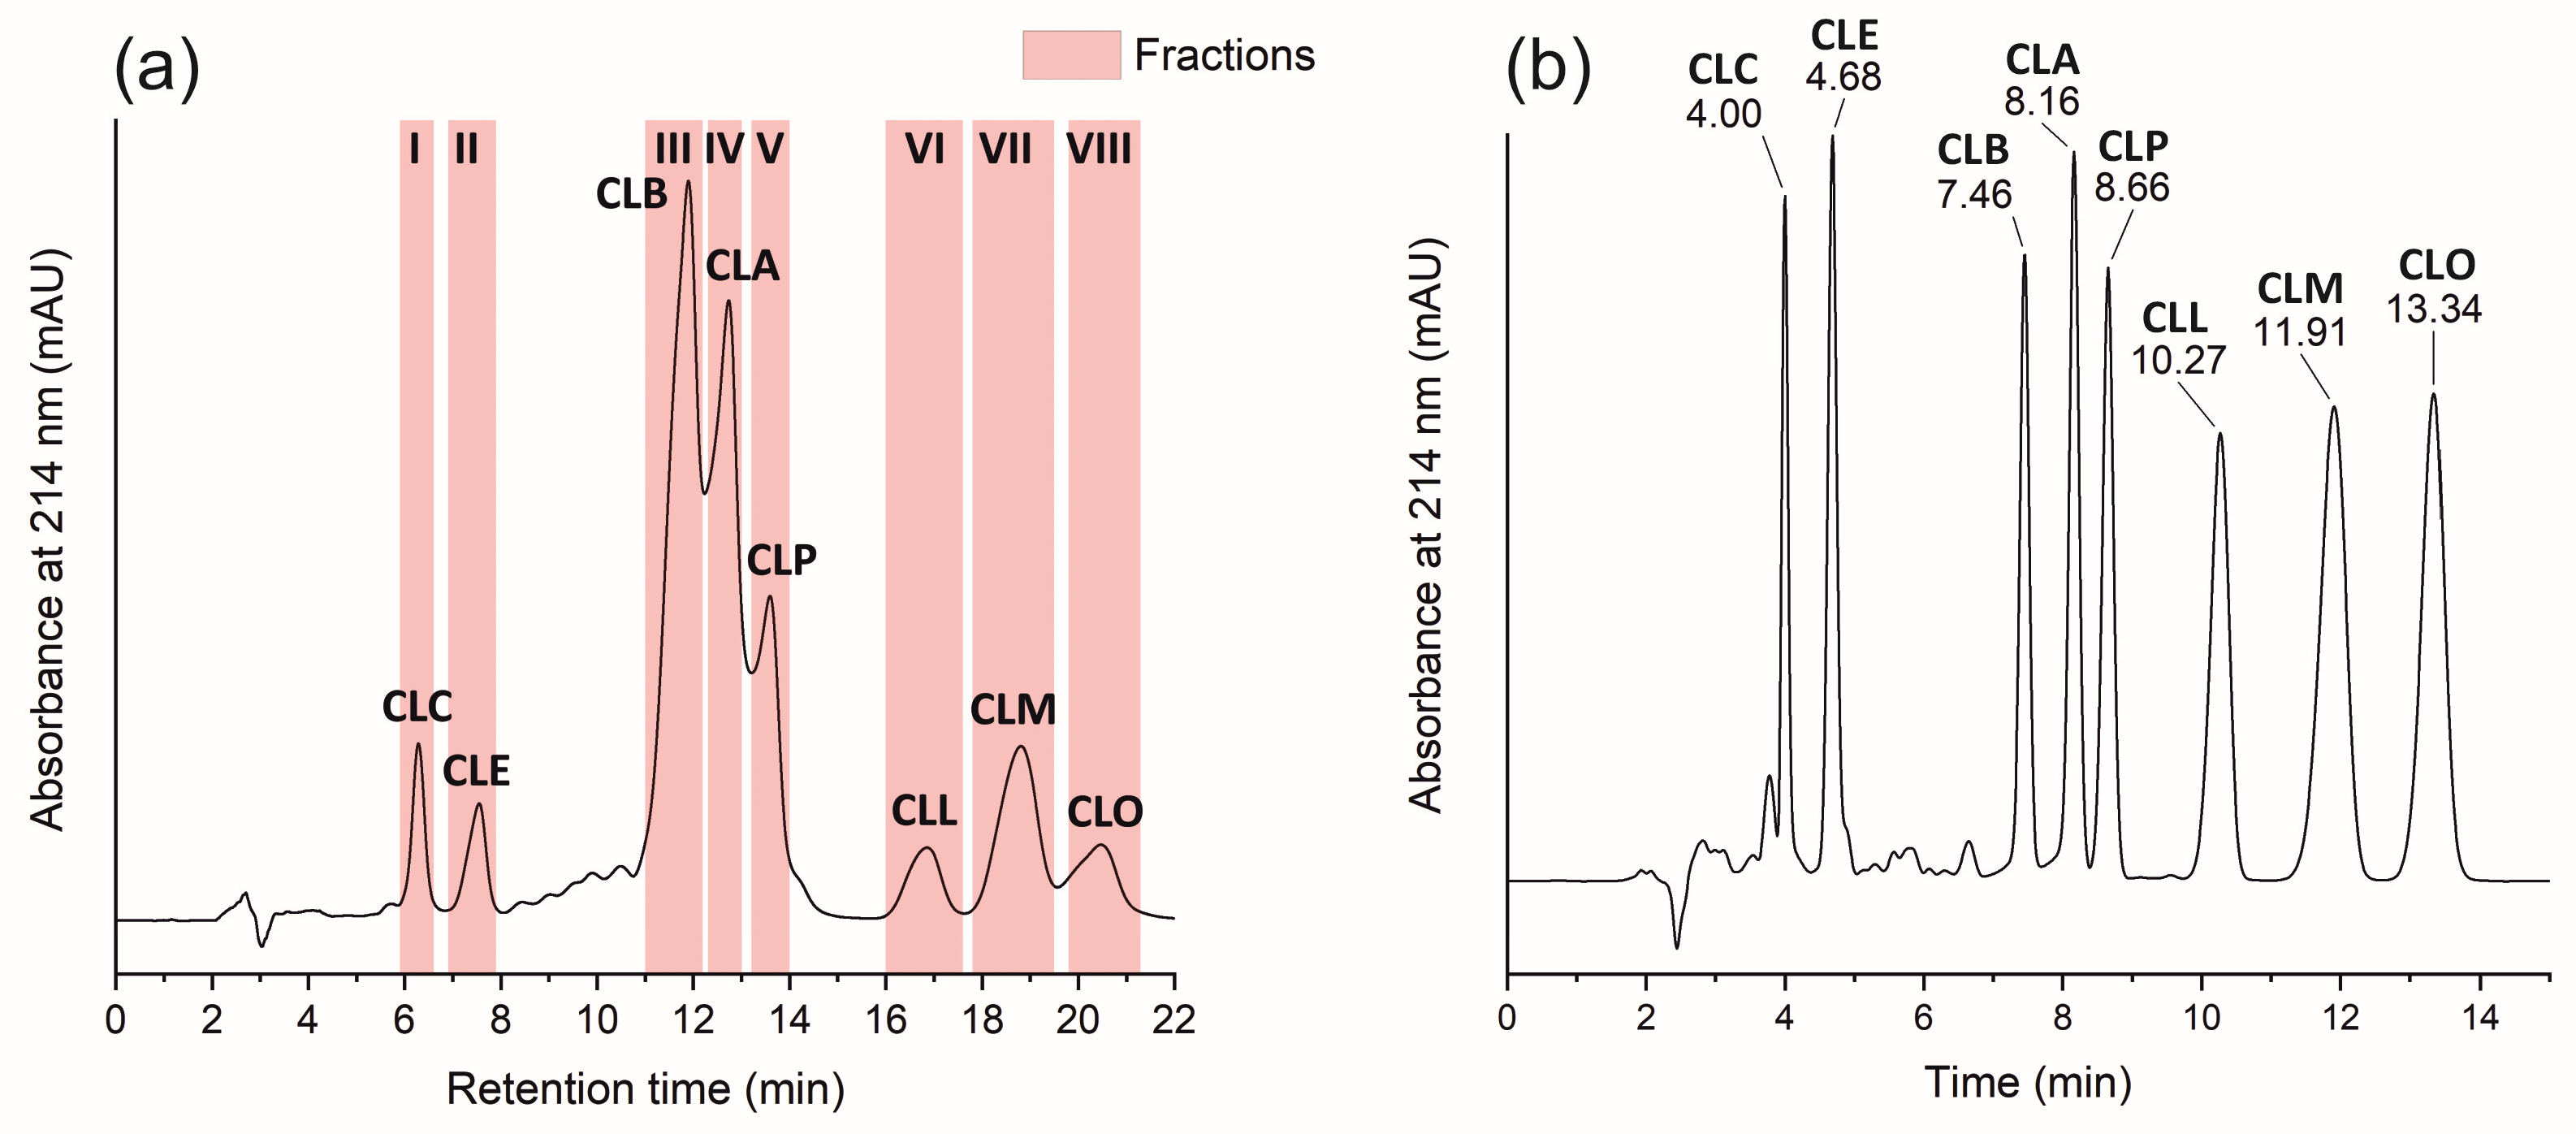
Figure 5 shows a chromatogram of the separation of a 70% ethanol extract of CPs under isocratic conditions on an Ultra Cyano column (10 × 250 mm, 5 µm, Restek, USA).
Figure 5.
Chromatogram of the preparative separation of fractions of individual CP standards (a). Fraction designations: I—CLC, II—CLE, III—CLB, IV—CLA, V—CLP, VI—CLL, VII—CLM, VIII—CLO; chromatogram of a multicomponent CP standard (b).
The resulting chromatogram (Figure 5a) clearly shows eight peaks, each corresponding to a specific CP.
It was found that the use of similar CN stationary phases from different manufacturers, Agilent and Restek, leads to differing results. The CN stationary phase from Restek (Figure 5a) exhibits selectivity similar to that of the phenyl-hexyl phase from Agilent (Figure 5b). This is reflected in the separation of the cyclic peptides CLA and CLP using a lower percentage of organic phase (a reduction from 60% to 50%).
The time program for the fraction collector is shown in Table 1.
Table 1.
Fraction collector schedule and purity standards for CPs.
The purity of CPs in the collected fractions was assessed by HPLC-DAD at a wavelength of 214 nm using a phenyl-hexyl stationary phase and was expressed as a percentage as the ratio of the peak area of the target component to the sum of all peak areas in the chromatogram. The purity of the CP standards obtained by semi-preparative HPLC ranged from 81% to 97%. Figure 5b shows the chromatogram of the multicomponent calibration standard of CPs.
The ϕiso values calculated using Equation (6) were used to determine the initial organic phase percentage. The final conditions (60% MeCN for the phenyl-hexyl phase, 50% for the CN phase) were established empirically by slightly adjusting the calculated values to achieve optimal retention time and peak resolution.
3.5. Method Validation and Sample Stability
To evaluate the analytical suitability of the developed HPLC-DAD method for the quantitative determination of the target CPs (designated CLC, CLE, CLB, CLA, CLP, CLL, CLM, and CLO), a comprehensive validation framework was conducted. The extraction reproducibility and accuracy were assessed via the recovery study across three distinct concentration levels (low, medium, and high). The extraction recovery values for all analytes consistently ranged from 90% to 102% (Table 2), confirming the high efficiency and reproducibility of the ethanol extraction procedure. Notably, a minor concentration-dependent trend in method precision was observed. At the lowest concentration tier (12.7–15.2 μg/mL of standard solution/extract or 1.6–1.9 μg/g of oil), which was rigorously established as the Limit of Quantitation (LOQ) based on a signal-to-noise ratio (S/N > 10), the intra-day precision (repeatability) exhibited slightly higher standard deviations (RSD up to 5.5%). This expected phenomenon is inherently associated with the increased analytical background noise near the quantitation threshold. Conversely, at the highest concentration tier, the relative standard deviation decreased significantly (RSD < 1.5%), demonstrating good instrumental repeatability. The Limit of Detection (LOD) for all components was determined to be within the range of 3.5–4.5 μg/ml of standard solution/extract or 0.4–0.6 μg/g of oil (S/N = 3). Sample stability in the autosampler was extensively monitored over a 72 h period to simulate routine sequential injection sequences. The stability data (Table 2) revealed a gradual, progressive decrease in the absolute peak areas for all CPs between the 24 h and 72 h checkpoints, accompanied by a minor expansion of the standard deviation between replicates. This expanding variance reflects the actual analytical scatter arising from independent sample handling under prolonged storage rather than simple instrumental drift. Nevertheless, the total recovery remained within acceptable parameters, validating the sample integrity throughout the typical analytical batch timeframe. Furthermore, robustness testing verified that minor deliberate variations in the critical chromatographic parameters (flow rate ± 0.1 mL/min; column temperature ± 2 °C) induced no significant shifts in peak resolution or retention times (RSD < 1.5%), ensuring the high reliability of the proposed method. The relative standard deviation for peak areas and retention times was consistently below 1%, demonstrating excellent system suitability and detector stability. (Table S2).
Table 2.
CP extraction, recovery, and post-extraction stability.
Calibration curves for CPs constructed using five calibration standards are shown in Figure S4 of the Supplementary Materials. The determination ranges of CPs, calibration curve equations, and correlation coefficients are presented in Table 3.
Table 3.
Equations for calibration curves, correlation coefficients and ranges of determination for CPs.
3.6. Quantitative Determination of CP Content in Oil
The content of CPs in the extract from flax variety Y-117 was determined using calibration curve equations. First, a chromatogram was recorded at a wavelength of 214 nm for a 70% ethanol extract of flaxseed oil. To calculate the quantity of CPs, the area under each relevant peak was used, referencing the calibration curves. To obtain the final CPs content in the flaxseed oil, the values were adjusted for the extraction ratio (1:8). According to the results (Table 4), the total content of peptides CLC, CLE, CLB, CLA, CLP, CLL, CLM, and CLO in the oil was 659.0 mg/L (708.6 mg/kg when recalculated using an oil density of 0.93 kg/L). At the same time, in other studies, the CP content in flaxseed oil varied on average from 229.3 to 631.4 mg/kg [29,30,31], depending on various conditions (e.g., variety and oil pressing method).
Table 4.
Quantity of CPs in the extract.
The highest content was observed for the non-oxidized peptide CLB—208.2 mg/L of oil. Previously, in the work of Lao et al. [25], it was found that among unmodified CPs, the peptides CLB and CLA are predominant. In the present study, this pattern was confirmed.
Since in the present work gentle temperature conditions were used for oil extraction (not exceeding 60 °C), and the analysis was performed on a freshly extracted sample, the content of oxidized forms of CPs (CLC and CLE) turned out to be small. The obtained result is consistent with the data reported by Stefanowicz [32].
Thus, the developed method allowed the quantitative determination of CPs in the ethanol extract of flax of the variety “Y-117”.
3.7. Extract Purification and Determination of CP Content
The color of oils is determined by the nature of the pigments they contain; for example, the yellow of varying intensity is due to the presence of carotene and xanthophyll, while the green of various shades depends on the presence of chlorophyll [33]. During the selection of the optimal ethanol concentration, all extracts were characterized by a yellow color. The color intensity of the 90% ethanol extract was close to that of the initial oil and diminished with a decreasing ethanol percentage (Figure S1 of the Supplementary Materials). These observations are consistent with the gravimetry results. According to the analysis of total polyphenol content (52.1 µg/mL in the initial oil [19] and 0.0081 µg/mL in the analyzed 70% extract), they were practically not transferred into the extract, and the yellow color of the extract is likely due to carotenoids content. Hence there was a need to develop an approach to purify the CP extract from accompanying components transferred from the oil.
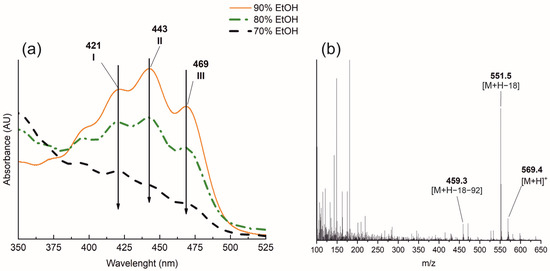
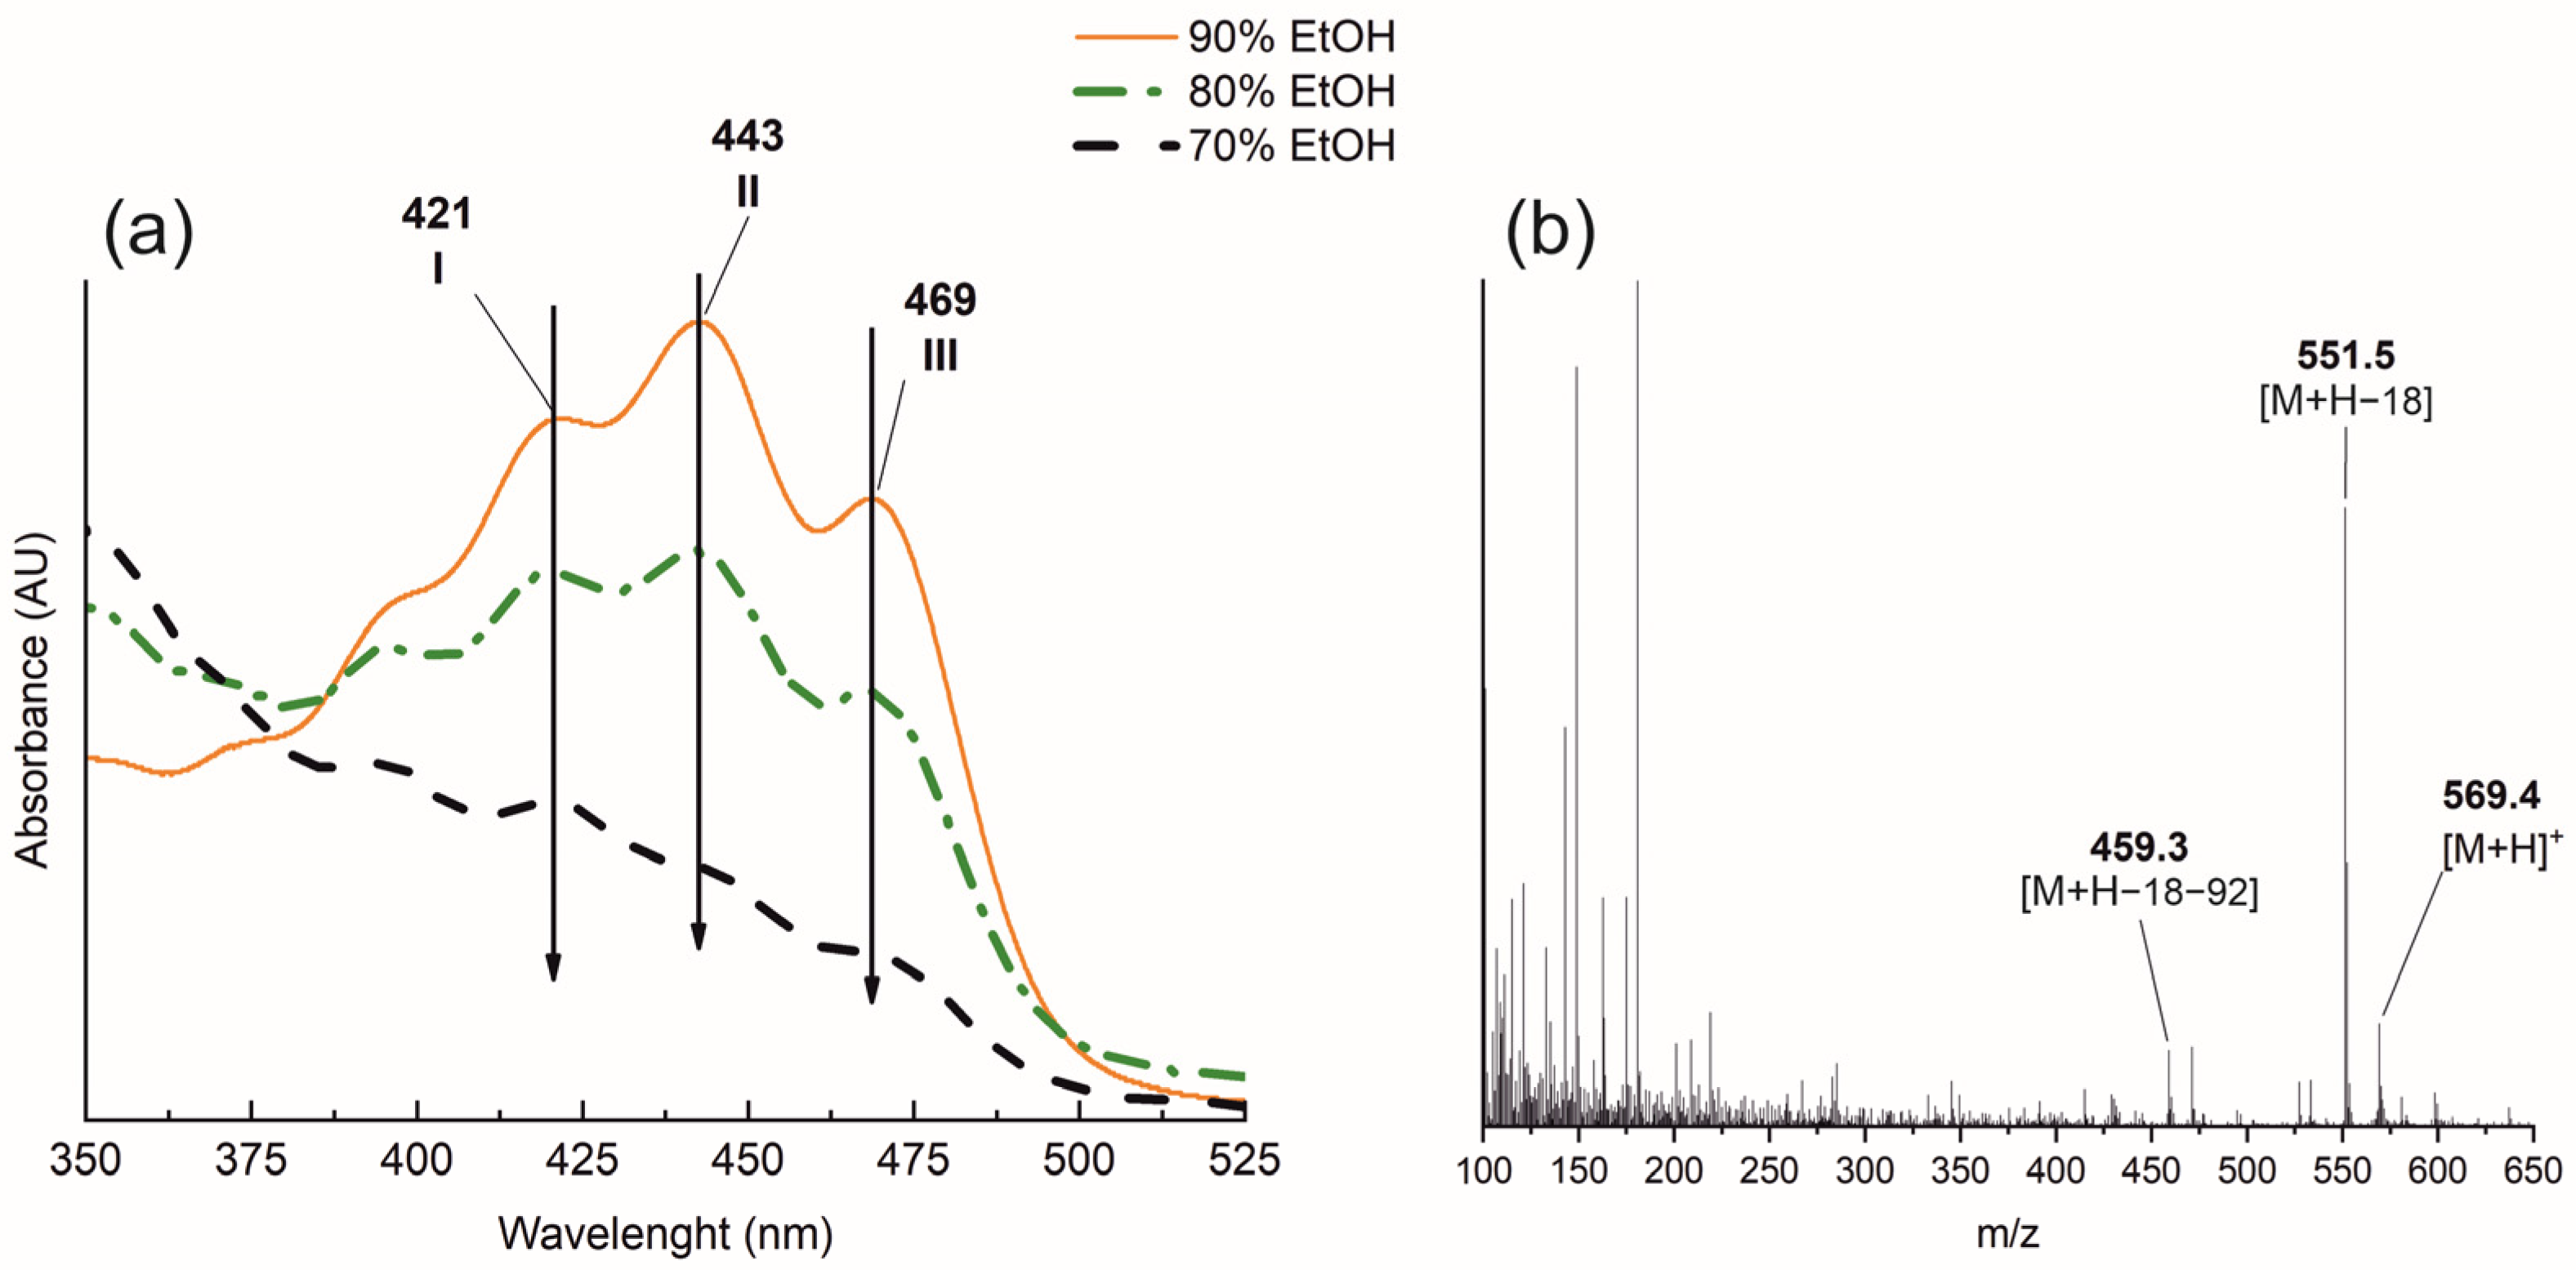
Carotenoids absorb light in the ultraviolet and visible regions, spectral analysis helps to qualitatively assess their content. The absorption spectra of the analyzed extracts are shown in Figure 6.
Figure 6.
Spectral characteristics of ethanol (EtOH) extracts of CPs (a), mass spectrum of carotenoids from flaxseed oil after saponification (b).
The spectra of the ethanol extracts exhibited intense absorption bands of CPs in the 200–300 nm region and a group of bands in the 400–500 nm range. Notably, no absorption was observed in the extracts above 600 nm. It is well established that the positions of the main λmax characteristic of carotenoid chromophores depend primarily on the number of conjugated C=C double bonds and increase with their number in the structure of the compound [34]. Conjugated β-rings also affect the chromophore. Carotenoids in which the conjugation extends to the β-ring exhibit λmax at shorter wavelengths compared to an unconjugated carotenoid with the same number of double bonds. Unconjugated β-rings do not contribute to the chromophore. Thus, from the positions of the absorption maxima, it is possible not only to determine the nature of the pigment but also to perform qualitative identification.
The absorption spectrum of the 90% ethanol extract in the 400–500 nm range exhibited three maxima at 421 (I), 443 (II), and 469 (III) nm. In the studies of Takaichi [35,36], the authors identified several carotenoids with unconjugated and mono- or di-conjugated β-rings based on their absorption spectra. According to the results presented in these studies, the peak positions of lutein and zeaxanthin (xanthophylls) are the closest to those obtained in our work.
Furthermore, the intensity of the carotenoid absorption bands in the ethanol extracts diminishes with a reduction in ethanol concentration to 70%, which can be explained by their decreased solubility. Although carotenoids are lipophilic compounds, the presence of polar hydroxyl groups in the structure of xanthophylls enables them to dissolve in polar solvents such as ethanol.
The application of mass spectrometry for carotenoid analysis has represented a significant advancement compared to classical methods based on spectrophotometric techniques. Several ionization methods are used for mass spectrometric analysis of carotenoids, including electron ionization (EI), matrix-assisted laser desorption/ionization (MALDI), electrospray ionization (ESI), and atmospheric pressure chemical ionization (APCI) [37,38,39,40]. In turn, atmospheric pressure chemical ionization has become the most widely used method due to its high sensitivity. For instance, Hao et al. [40] demonstrated that the detection sensitivity for β-carotene, β-cryptoxanthin, lutein, and zeaxanthin in plant samples is 100 times higher compared to other ionization sources, such as electrospray Rivera et al. [37] compiled and systematized the results of mass spectrometric studies of carotenoids using various ionization methods in positive ion mode. According to the data presented in that study, molecular ions with masses of 569, 551, and 459 Da correspond to lutein and zeaxanthin. Thus, in our study, using spectral and mass spectrometric methods, it was shown that during the extraction of CPs with ethanol solutions, carotenoids—specifically xanthophylls (lutein and zeaxanthin)—are co-extracted alongside the target compounds.
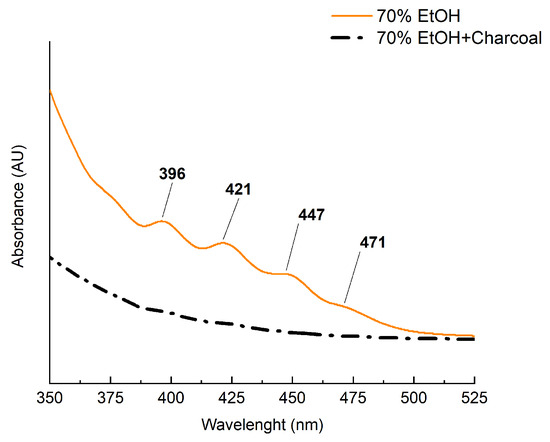
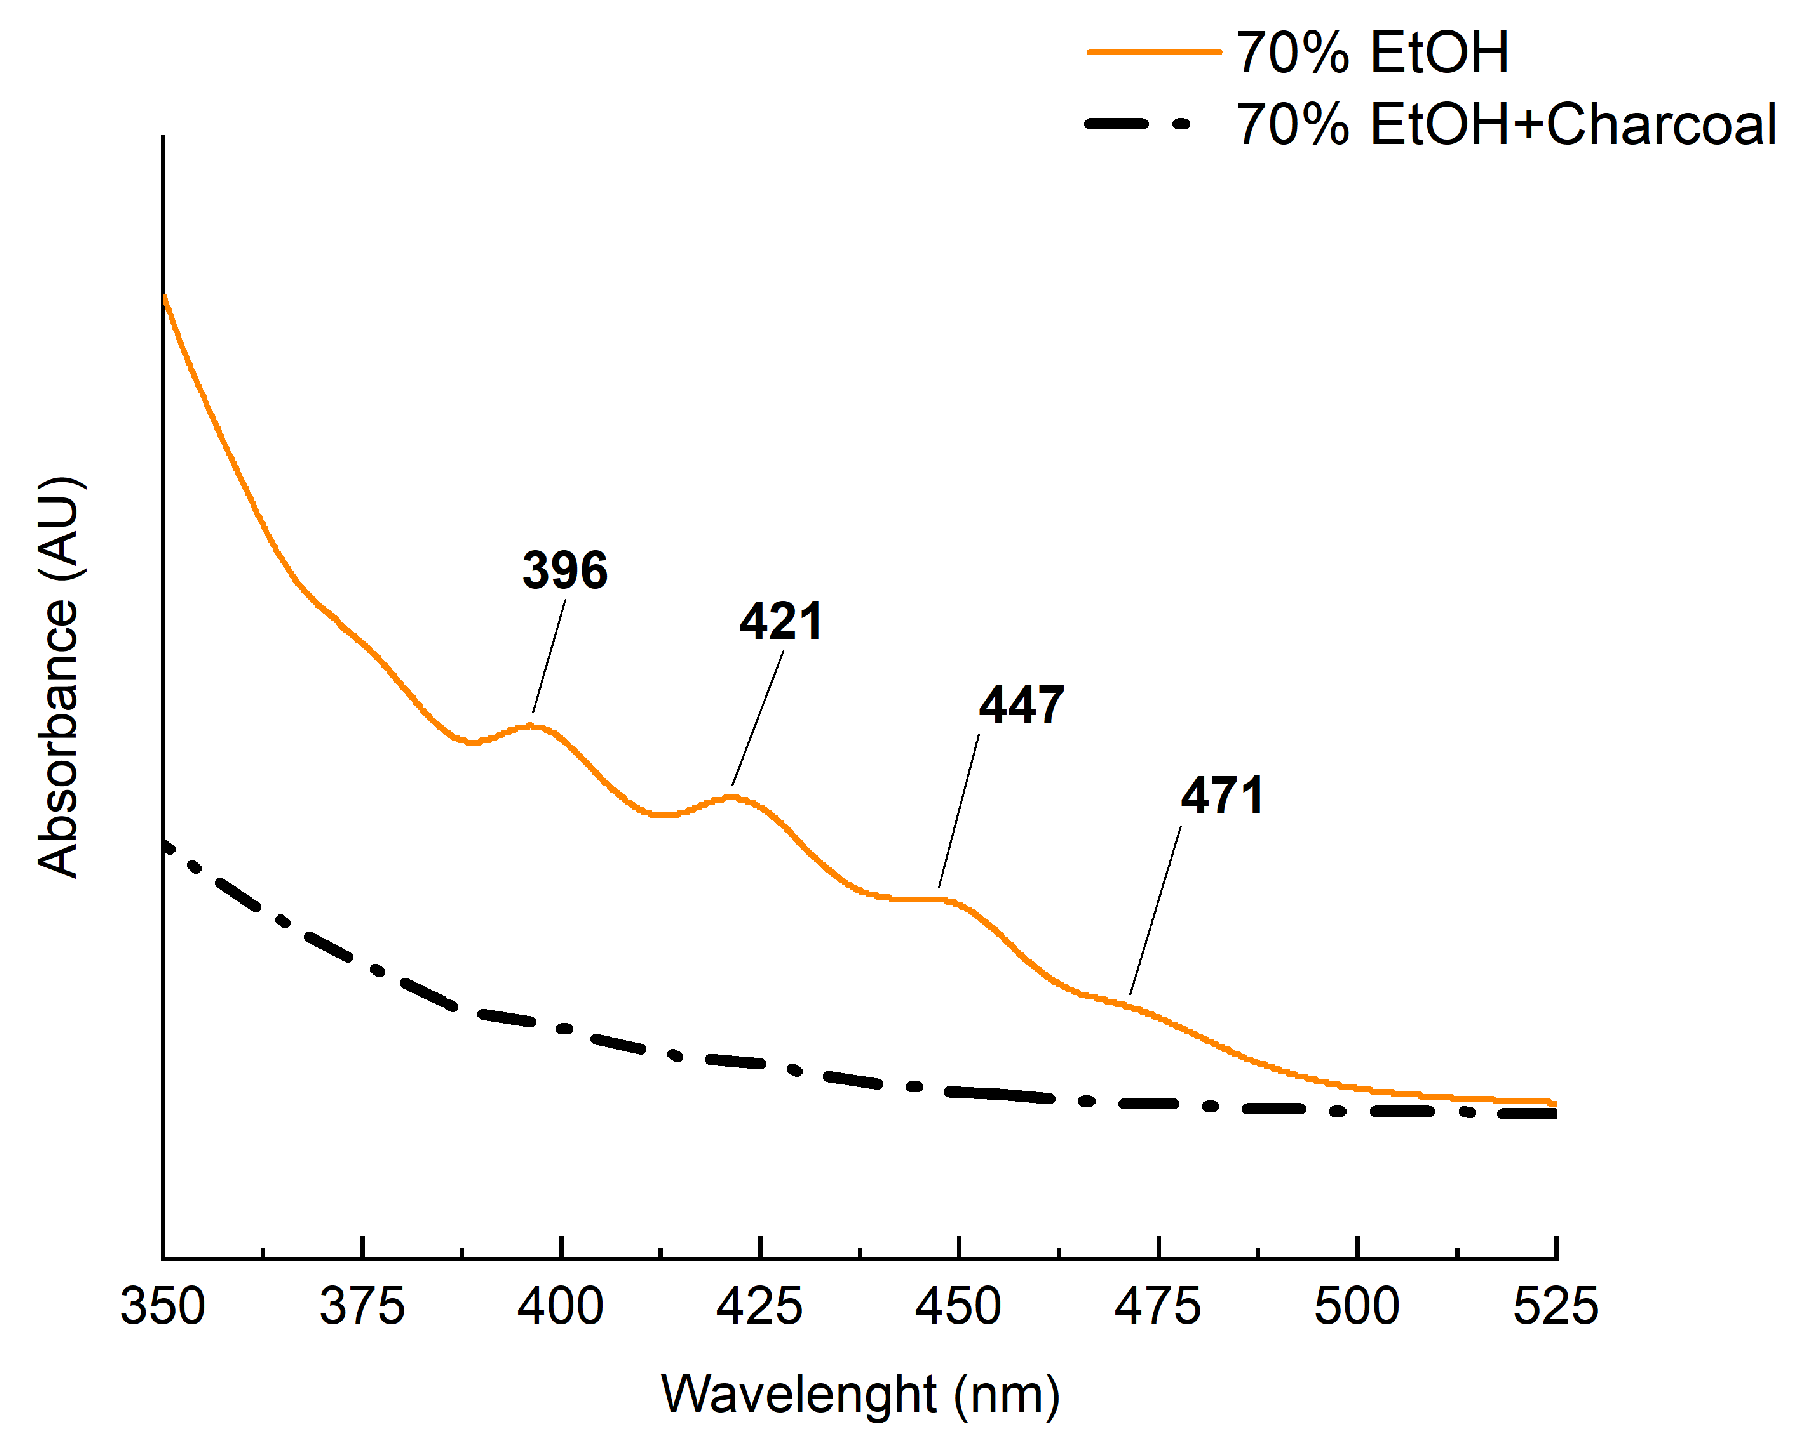
Activated carbon is used to purify alcohol-containing products from impurities [41]. Due to its porous structure, carbon effectively retains many low molecular weight compounds. Since the final product of the extraction is a 70% ethanol solution, additional purification of CPs was proposed prior to evaporation in order to remove accompanying extractive components—carotenoids. For this purpose, birch activated carbon (BAC) was used. Figure 7 shows the UV and visible spectra of the 70% ethanol extracts of CPs before and after treatment with BAC.
Figure 7.
Spectral characteristics of the 70% ethanol extract of CPs before and after purification with BAC.
According to the obtained results, after purification of the 70% ethanol extract with BAC, the characteristic carotenoid maxima in the spectrum disappear. This demonstrates the effectiveness of BAC as a sorbent for removing carotenoids from ethanol extracts, which is confirmed by a substantial reduction in carotenoid content from 0.47 µg/g in the crude extract to 0.09 µg/g in the purified extract, amounting to less than 2% of the carotenoids present in the oil. Thus, the CP:carotenoid ratio is approximately 14:1 in the crude extract and 73:1 in the purified extract. Studies of the biologically active properties of CPs in in vivo models are typically conducted at doses of 10–40 mg/kg body weight for rats [42]. Consequently, using the crude CP extract to achieve such peptide levels would result in the additional introduction of up to 3 mg/kg body weight of carotenoids (calculated as lutein) into the animal diet. Notably, a pronounced biological effect in in vivo experiments for lutein is already observed at a dose of 2 mg/kg body weight [43]. In contrast, using the purified extract allows for the introduction of up to 140 mg of CPs per kg of body weight into the animal diet without reaching significant levels of additional carotenoids in the diet.
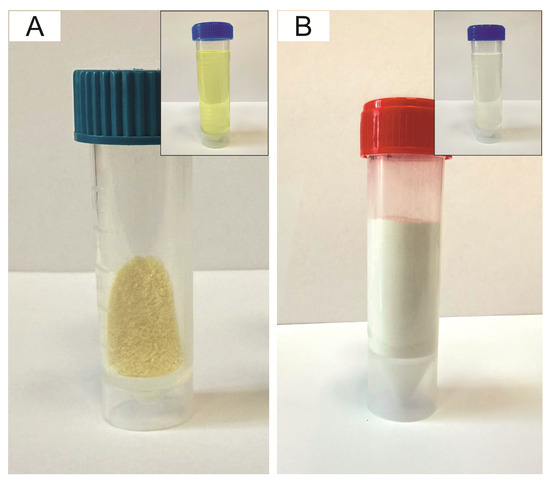
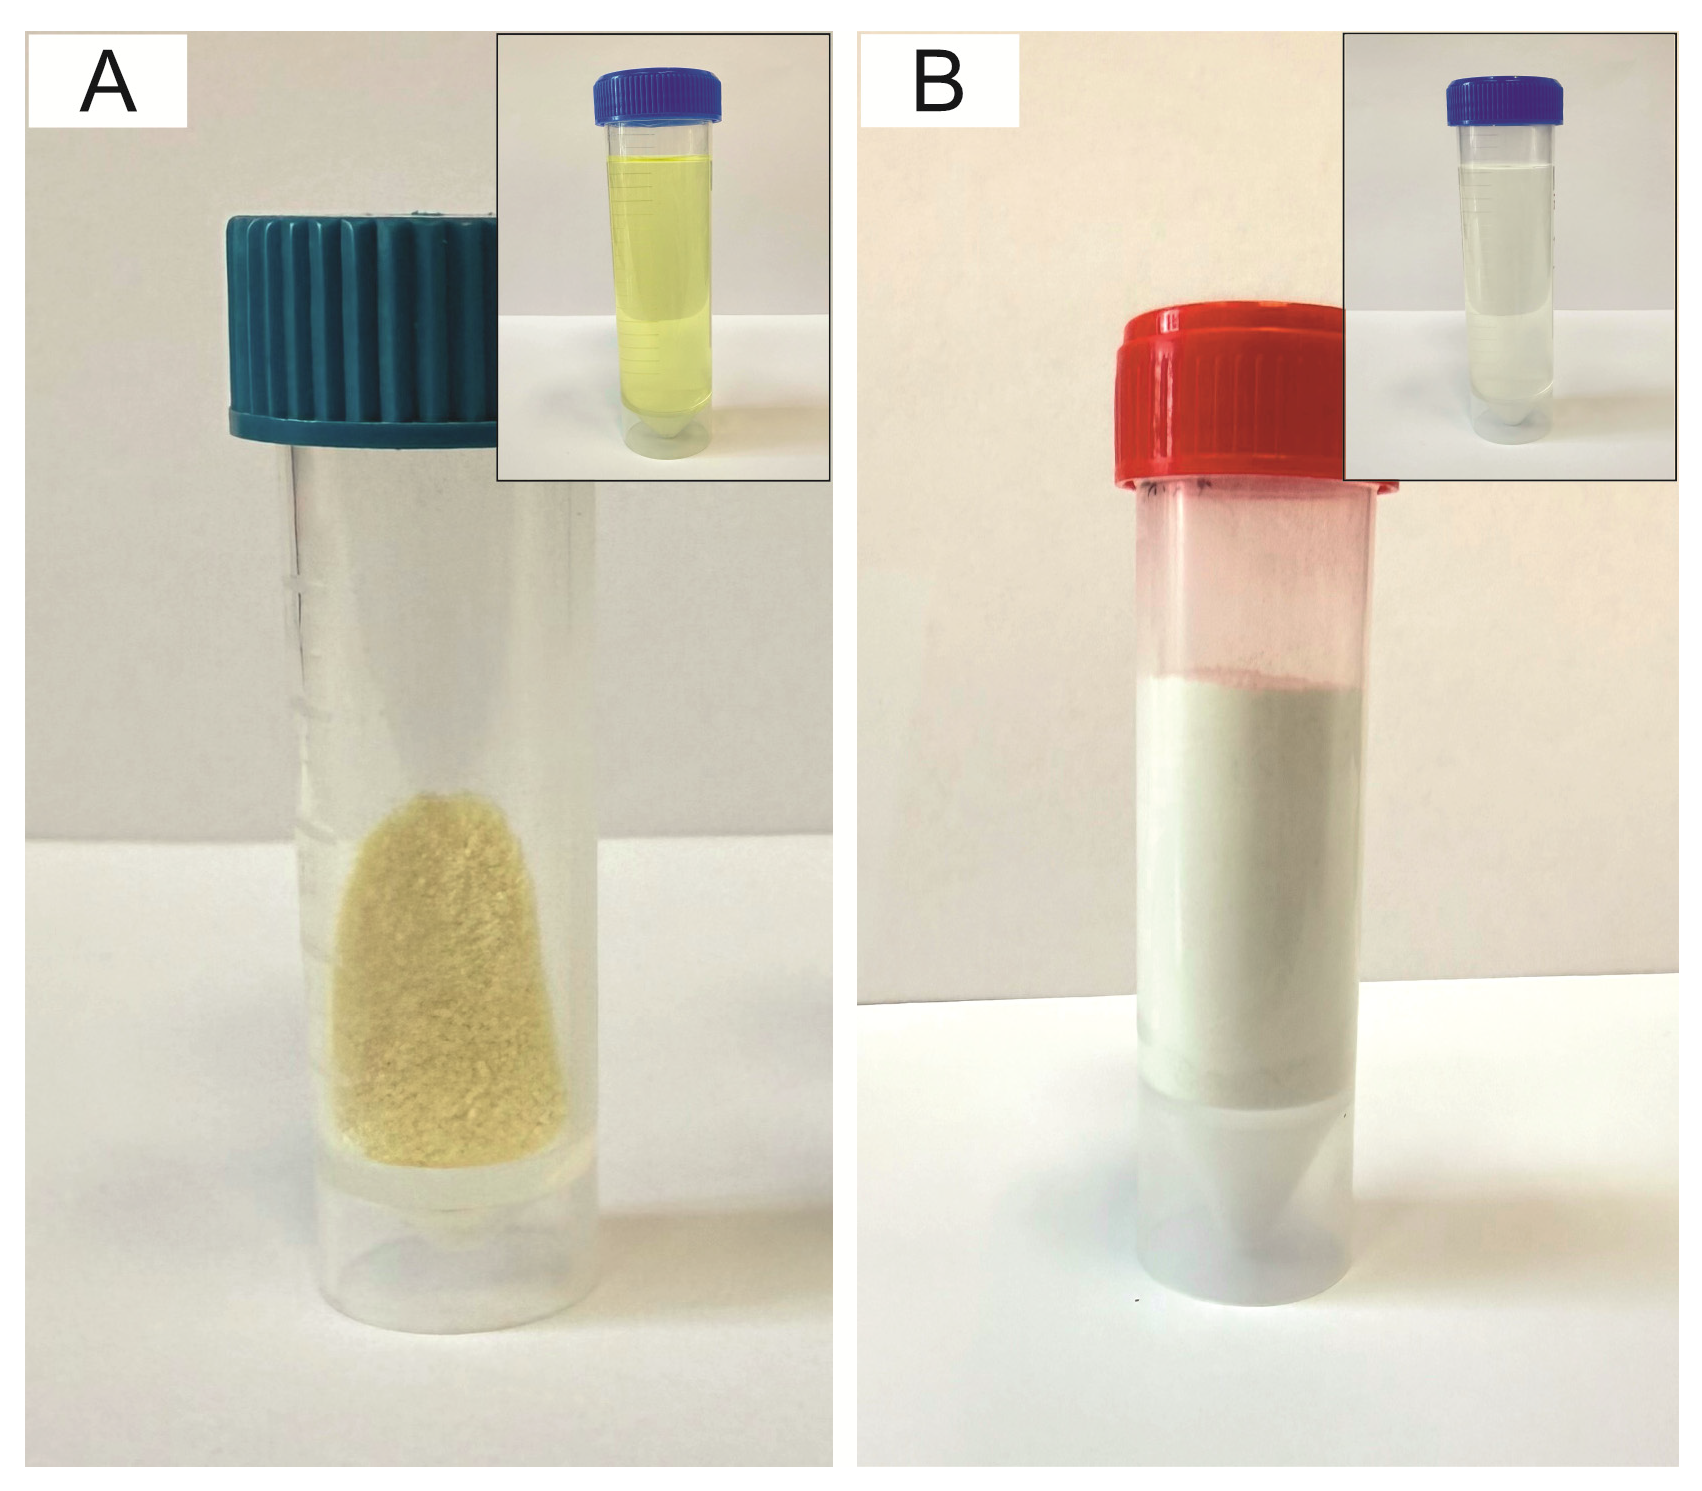
At the final stage, the resulting liquid ethanol extract of CPs was dried (Figure 8).
Figure 8.
Extract sample containing a mixture of CPs without purification (A), after purification with BAC (B). The small pictures in the corner show the same samples prior to evaporation.
The color of the dry extract without purification (Figure 8A), analyzed using a BS7016 spectrophotocolorimeter (3NH, China), was characterized by a yellowish tint (whiteness index (WI)—66.1; yellowness index (YI)—50.9). Several studies investigating CPs from flaxseed have also reported that they exhibit a yellow hue [19,20]. The extract purified using BAC is shown in Figure 8B. Color determination revealed that the WI increased to 79.3; in turn, the YI decreased markedly to 23.8; the total color difference (ΔE) was 15.9, indirectly indicating a significant removal of accompanying components.
To rigorously evaluate potential analyte losses during the clean-up stage, a quantitative comparison of individual CP concentrations in the ethanol extract was performed immediately before and after activated-carbon treatment. The results demonstrated that the purification step caused minimal adsorption of the target compounds. For CPs lacking aromatic amino acid residues (CLC, CLE, CLB, CLA, CLP), the concentration decrease was negligible, not exceeding 5% (recoveries ≥ 95%). In contrast, tryptophan-containing peptides (CLL, CLM, CLO) exhibited a slightly higher concentration drop of up to 10% (recoveries ≥ 90%), which is likely attributed to π − π stacking and hydrophobic interactions between the electron-rich indole ring of tryptophan and the activated-carbon surface. Despite this minor retention, the overall high recoveries (90–95%) combined with the effective removal of interfering matrix lipids fully justify the integration of this purification step into the analytical workflow.
4. Conclusions
The use of 70% aqueous ethanol at a 1:8 (v/v) ratio to flaxseed oil allowed efficient extraction of CPs with minimal amounts of accompanying components. Optimal centrifugation conditions for the resulting mixture were determined (4000 rpm, 10 min). For the separation of CPs, the phenyl-hexyl stationary phase and isocratic elution mode were found to be optimal. Semi-preparative HPLC with a CN stationary phase column was used to obtain eight CP standards (designated CLC, CLE, CLB, CLA, CLP, CLL, CLM, and CLO). The CN column exhibited selectivity similar to that of the phenyl-hexyl column but provided shorter retention times for the first and last peptides. A quantitative HPLC-DAD method for CP determination using a phenyl-hexyl stationary phase column in isocratic elution mode was developed. Activated carbon purification effectively removed accompanying components from CP extracts. This approach enables the selective study of CPs bioactivity with minimal interference from co-extracted flaxseed oil components. These results provide a basis for further study of CPs as promising candidates for practical use in the food and pharmaceutical industries.
Supplementary Materials
The following supporting information can be downloaded at: https://www.mdpi.com/article/10.3390/analytica7040102/s1, Figure S1. Appearance of CP extracts obtained with different ethanol concentrations (70, 80, and 90%), Figure S2. Appearance of samples after different centrifugation conditions, Figure S3. Structures of eight cyclic peptides found in flaxseed oil from the variety Y-117, Figure S4. Calibration curves for the quantitative determination of CPs, Table S1. Spectral Characteristics of Cyclic Peptides, Table S2. Relative standard deviations (RSD) of retention times and peak areas for the target cyclic peptides (n = 6).
Author Contributions
Conceptualization, methodology, investigation, visualization, writing—original draft preparation: I.S.; Conceptualization, investigation, data curation, visualization, writing—original draft preparation: R.S.; Conceptualization, formal analysis, data curation, writing—review and editing: V.S.; Methodology, investigation: A.M.; Methodology, investigation: Y.F.; Methodology, investigation: I.V.; Writing—review and editing, supervision, project administration, funding acquisition: A.K. All authors have read and agreed to the published version of the manuscript.
Funding
This work was supported by a grant from the Russian Science Foundation (Project No. 24-16-00171 “Cyclic Peptides of Linum usitatissimum. Extraction Features, Biological Activity, and Prospects for Food Applications”).
Data Availability Statement
The raw data supporting the conclusions of this article will be made available by the authors on request.
Conflicts of Interest
The authors declare no conflicts of interest.
Abbreviations
| CPs | cyclic peptides |
| HPLC | high-performance liquid chromatography |
| WI | whiteness index |
| YI | yellowness index |
| ΔE | total color differences |
| HPLC–DAD | high-performance liquid chromatography with diode array detector |
| FA | formic acid |
| MeCN | methyl cyanide (acetonitrile) |
| CV | coefficient of variation |
| EI | electron ionization |
| MALDI | matrix-Assisted Laser Desorption/Ionization |
| ESI | electrospray ionization |
| APCI | atmospheric Pressure Chemical Ionization |
| BAC | birch activated carbon |
| CN | cyano stationary phase |
| C18 | octadecyl stationary phase |
| LOQ | Limit of Quantitation |
| LOD | Limit of Detection |
References
- Sarkisyan, V.A.; Sidorova, Y.S.; Petrov, N.A.; Biryulina, N.A.; Kochetkova, A.A. Biological Activity and Prospects for Food Application of Cyclic Peptides of Flax (Linum usitatissimum). Vopr. Pitan. 2024, 93, 37–48. [Google Scholar] [CrossRef] [Scilit] [PubMed]
- Shim, Y.Y.; Kim, J.H.; Cho, J.Y.; Reaney, M.J.T. Health Benefits of Flaxseed and Its Peptides (Linusorbs). Crit. Rev. Food Sci. Nutr. 2024, 64, 1845–1864. [Google Scholar] [CrossRef] [Scilit] [PubMed]
- Xiao, Y.; Wang, R.; Long, Y.; Dai, W.; Nie, H. Exploring the Diverse Biological and Pharmacological Properties of Cyclolinopeptides From Flax: A Comprehensive Study. ChemistrySelect 2025, 10, e01324. [Google Scholar] [CrossRef] [Scilit]
- Deng, S.; Li, J.; Luo, T.; Deng, Z. Flaxseed Cyclic Peptide [1-9-NαC]-Linusorb B3 (CLA) Improves Oxidative Stability of Flaxseed Oil by Chelating Metal Ions and Intermediate Oxidative Products. J. Agric. Food Chem. 2022, 70, 15776–15786. [Google Scholar] [CrossRef] [Scilit] [PubMed]
- Mueed, A.; Madjirebaye, P.; Shibli, S.; Deng, Z. Flaxseed Peptides and Cyclolinopeptides: A Critical Review on Proteomic Approaches, Biological Activity, and Future Perspectives. J. Agric. Food Chem. 2022, 70, 14600–14612. [Google Scholar] [CrossRef] [Scilit] [PubMed]
- Fojnica, A.; Gromilic, Z.; Vranic, S.; Murkovic, M. Anticancer Potential of the Cyclolinopeptides. Cancers 2023, 15, 3874. [Google Scholar] [CrossRef] [Scilit] [PubMed]
- Shim, Y.Y.; Song, Z.; Jadhav, P.D.; Reaney, M.J.T. Orbitides from Flaxseed (Linum usitatissimum L.): A Comprehensive Review. Trends Food Sci. Technol. 2019, 93, 197–211. [Google Scholar] [CrossRef] [Scilit]
- Tan, N.H.; Zhou, J. Plant Cyclopeptides. Chem. Rev. 2006, 106, 840–895. [Google Scholar] [CrossRef] [Scilit] [PubMed]
- Shim, Y.Y.; Gui, B.; Arnison, P.G.; Wang, Y.; Reaney, M.J.T. Flaxseed (Linum usitatissimum L.) Bioactive Compounds and Peptide Nomenclature: Areview. Trends Food Sci. Technol. 2014, 38, 5–20. [Google Scholar] [CrossRef] [Scilit]
- Kaneda, T.; Yoshida, H.; Nakajima, Y.; Toishi, M.; Nugroho, A.E.; Morita, H. Cyclolinopeptides, Cyclic Peptides from Flaxseed with Osteoclast Differentiation Inhibitory Activity. Bioorganic Med. Chem. Lett. 2016, 26, 1760–1761. [Google Scholar] [CrossRef] [Scilit] [PubMed]
- Ferdosh, S. The Extraction of Bioactive Agents from Calophyllum inophyllum L., and Their Pharmacological Properties. Sci. Pharm. 2024, 92, 6. [Google Scholar] [CrossRef] [Scilit]
- Gui, B.; Shim, Y.Y.; Reaney, M.J.T. Distribution of Cyclolinopeptides in Flaxseed Fractions and Products. J. Agric. Food Chem. 2012, 60, 8580–8589. [Google Scholar] [CrossRef] [Scilit] [PubMed]
- Frolova, Y.; Sobolev, R.; Kochetkova, A. Antioxidant Activity and Oxidative Stability of Flaxseed and Its Processed Products: A Review. Sci 2025, 7, 155. [Google Scholar] [CrossRef] [Scilit]
- Sobolev, R.V.; Sokolov, I.E.; Petrov, N.A.; Sarkisyan, V.A.; Kochetkova, A.A. Methods of Extraction, Separation and Identification of Cyclic Peptides from Flaxseed (Linum usitatissimum L.): A Review. Food Syst. 2024, 7, 535–542. [Google Scholar] [CrossRef] [Scilit]
- Almohasin, J.A.; Balag, J.; Miral, V.G.; Moreno, R.V.; Tongco, L.J.; Lopez, E.C.R. Green Solvents for Liquid–Liquid Extraction: Recent Advances and Future Trends. Eng. Proc. 2023, 56, 174. [Google Scholar] [CrossRef] [Scilit]
- Aladedunye, F.; Sosinska, E.; Przybylski, R. Flaxseed Cyclolinopeptides: Analysis and Storage Stability. JAOCS J. Am. Oil Chem. Soc. 2013, 90, 419–428. [Google Scholar] [CrossRef] [Scilit]
- Guo, T.; Xie, L.; Luo, Y.; Deng, Q.; Liu, R.; Wan, C. Effect of Production and Environment Factors on the Migration and Conversion of Cyclolinopeptides in Linseed (Linum usitatissimum L.) Oil. Food Chem. 2025, 491, 144928. [Google Scholar] [CrossRef] [Scilit] [PubMed]
- Joint FAO/WHO Expert Committee on Food Additives. Compendium of Food Additive Specifications; Food & Agriculture Organization: Rome, Italy, 2007; Volume 4. [Google Scholar]
- Sarkisyan, V.A.; Sobolev, R.V.; Sokolov, I.E.; Petrov, N.A.; Vorobiova, V.M.; Vorobiova, I.S.; Frolova, Y.V.; Kochetkova, A.A. Comprehensive Analysis of the Chemical Composition of Seeds from Five Russian Cultivars of Flax (Linum usitatissimum): Search for Correlations with Cyclic Peptide Content. Grain Oil Sci. Technol. 2026, 9, 97–106. [Google Scholar] [CrossRef] [Scilit]
- Cai, Z.; Xu, C.; Song, Z.; Li, J.; Zhang, N.; Zhao, J.; Lee, Y.Y.; Reaney, M.J.T.; Huang, F.; Wang, Y. A Two-Step Method of Cyclolinopeptide (Linusorb) Preparation from Flaxseed Cake via Dry-Screening. Food Chem. 2024, 449, 139243. [Google Scholar] [CrossRef] [Scilit] [PubMed]
- Herchi, W.; Sakouhi, F.; Boukhchina, S.; Kallel, H.; Pepe, C. Changes in Fatty Acids, Tocochromanols, Carotenoids and Chlorophylls Content during Flaxseed Development. JAOCS J. Am. Oil Chem. Soc. 2011, 88, 1011–1017. [Google Scholar] [CrossRef] [Scilit]
- Frolova, Y.; Vorobyeva, V.; Vorobyeva, I.; Sarkisyan, V.; Malinkin, A.; Isakov, V.; Kochetkova, A. Development of Fermented Kombucha Tea Beverage Enriched with Inulin and B Vitamins. Fermentation 2023, 9, 552. [Google Scholar] [CrossRef] [Scilit]
- Frolova, Y.; Sobolev, R.; Sarkisyan, V.; Kochetkova, A. Investigation of the Effect of Hydrocarbons and Monoesters in the Gelators’ Composition on the Properties of Edible Oleogel. Grain Oil Sci. Technol. 2024, 7, 96–104. [Google Scholar] [CrossRef] [Scilit]
- Milovanovic, B.; Djekic, I.; Miocinovic, J.; Djordjevic, V.; Lorenzo, J.M.; Barba, F.J.; Tomasevic, I. What Is the Color of Milk and Dairy Products and How Is It Measured? Foods 2020, 9, 1629. [Google Scholar] [CrossRef] [Scilit] [PubMed]
- Snyder, L.R.; Dolan, J.W. High-Performance Gradient Elution_ The Practical Application of the Linear-Solvent-Strength Model; Wiley: Hoboken, NJ, USA, 2007. [Google Scholar]
- Waszkowiak, K.; Gliszczyńska-Świgło, A. Binary Ethanol–water Solvents Affect Phenolic Profile and Antioxidant Capacity of Flaxseed Extracts. Eur. Food Res. Technol. 2016, 242, 777–786. [Google Scholar] [CrossRef] [Scilit]
- Lao, Y.W.; Mackenzie, K.; Vincent, W.; Krokhin, O.V. Characterization and Complete Separation of Major Cyclolinopeptides in Flaxseed Oil by Reversed-Phase Chromatography. J. Sep. Sci. 2014, 37, 1788–1796. [Google Scholar] [CrossRef] [Scilit] [PubMed]
- Mant, C.T.; Kovacs, J.M.; Kim, H.M.; Pollock, D.D.; Hodges, R.S. Intrinsic Amino Acid Side-Chain Hydrophilicity/Hydrophobicity Coefficients Determined by Reversed-Phase High-Performance Liquid Chromatography of Model Peptides: Comparison with Other Hydrophilicity/Hydrophobicity Scales. Biopolymers 2009, 92, 573–595. [Google Scholar] [CrossRef] [Scilit] [PubMed]
- Zeng, J.; Xiao, T.; Ni, X.; Wei, T.; Liu, X.; Deng, Z.Y.; Li, J. The Comparative Analysis of Different Oil Extraction Methods Based on the Quality of Flaxseed Oil. J. Food Compos. Anal. 2022, 107, 104373. [Google Scholar] [CrossRef] [Scilit]
- Zou, X.G.; Chen, X.L.; Hu, J.N.; Wang, Y.F.; Gong, D.M.; Zhu, X.M.; Deng, Z.Y. Comparisons of Proximate Compositions, Fatty Acids Profile and Micronutrients between Fiber and Oil Flaxseeds (Linum usitatissimum L.). J. Food Compos. Anal. 2017, 62, 168–176. [Google Scholar] [CrossRef] [Scilit]
- Gui, B.; Shim, Y.Y.; Datla, R.S.S.; Covello, P.S.; Stone, S.L.; Reaney, M.J.T. Identification and Quantification of Cyclolinopeptides in Five Flaxseed Cultivars. J. Agric. Food Chem. 2012, 60, 8571–8579. [Google Scholar] [CrossRef] [Scilit] [PubMed]
- Stefanowicz, P. Detection and Sequencing of New Cyclic Peptides from Linseed by Electrospray Ionization Mass Spectrometry. Acta Biochim. Pol. 2001, 48, 1125–1129. [Google Scholar] [CrossRef] [Scilit] [PubMed]
- Chen, X.; Sun, S. Color Reversion of Refined Vegetable Oils: A Review. Molecules 2023, 28, 5177. [Google Scholar] [CrossRef] [Scilit] [PubMed]
- Rodriguez-Amaya, D.B.; Kimura, M. HarvestPlus Handbook for Carotenoid Analysis, 2nd ed.; HarvestPlus: Washington, DC, USA, 2004. [Google Scholar]
- Takaichi, S.; Shimada, K. Characterization of Carotenoids in Photosynthetic Bacteria. Methods Enzymol. 1992, 213, 374–385. [Google Scholar] [CrossRef] [Scilit]
- Takaichi, S.; Moss, G.P. Characterization of Carotenes in a Combination of a C(18) HPLC Column with Isocratic Elution and Absorption Spectra with a Photodiode-Array Detector. Photosynth. Res. 2000, 65, 93–99. [Google Scholar] [CrossRef] [Scilit] [PubMed]
- Rivera, S.M.; Christou, P.; Canela-Garayoa, R. Identification of Carotenoids Using Massspectrometry. Mass Spectrom. Rev. 2014, 33, 353–372. [Google Scholar] [CrossRef] [Scilit] [PubMed]
- Wingerath, T.; Stahl, W.; Kirsch, D.; Kaufmann, R.; Sies, H. Fruit Juice Carotenol Fatty Acid Esters and Carotenoids As Identified by Matrix-Assisted Laser Desorption Ionization (MALDI) Mass Spectrometry. J. Agric. Food Chem. 1996, 44, 2006–2013. [Google Scholar] [CrossRef] [Scilit]
- Silva, J.V.M.; Amorim, I.S.; Amorim, D.S.; Camargo, C.A.; Mariutti, L. Carotenoid and Carotenoid Ester Identification and Quantification. In Carotenoid Analysis; Springer: Washington, DC, USA, 2025; pp. 25–43. [Google Scholar]
- Hao, Z.; Parker, B.; Knapp, M.; Yu, L. Simultaneous Quantification of α-Tocopherol and Four Major Carotenoids in Botanical Materials by Normal Phase Liquid Chromatography- Atmospheric Pressure Chemical Ionization-Tandem Mass Spectrometry. J. Chromatogr. A 2005, 1094, 83–90. [Google Scholar] [CrossRef] [Scilit] [PubMed]
- Thakur, A.; Kumar, A.; Zhang, R. Alcoholic Beverage Purification Applications of Activated Carbon. In Activated Carbon; The Royal Society of Chemistry: Cambridge, UK, 2023; pp. 152–178. [Google Scholar]
- Mueed, A.; Ma, H.; Basit, A.; Madjirebaye, P.; Ali, A.; Khan, S.; Li, J.; Deng, Z. Modulation of Lipid Profile by Flaxseed Cyclolinopeptides Ameliorates Lipid Accumulation in Obese Mice Liver and Pancreas. Food Biosci. 2025, 71, 107236. [Google Scholar] [CrossRef] [Scilit]
- Sung, J.H.; Jo, Y.S.; Kim, S.J.; Ryu, J.S.; Kim, M.C.; Ko, H.J.; Sim, S.S. Effect of Lutein on L-NAME-Induced Hypertensive Rats. Korean J. Physiol. Pharmacol. 2013, 17, 339–345. [Google Scholar] [CrossRef] [Scilit] [PubMed]

Disclaimer/Publisher’s Note: The statements, opinions and data contained in all publications are solely those of the individual author(s) and contributor(s) and not of MDPI and/or the editor(s). MDPI and/or the editor(s) disclaim responsibility for any injury to people or property resulting from any ideas, methods, instructions or products referred to in the content. |
© 2026 by the authors. Licensee MDPI, Basel, Switzerland. This article is an open access article distributed under the terms and conditions of the Creative Commons Attribution (CC BY) license.