


Abstract
Urinary LC-HRMS metabolomics non-invasively reflects cancer-associated biochemical alterations. However, candidate panels are rarely re-tested in new cohorts or checked against confounding factors, and comparative studies between cancers must differentiate shared from disease-specific changes. We applied a sample preparation and LC-HRMS workflow, previously optimized by design of experiments, to a new cohort of 94 participants (29 bladder cancer, BC; 20 prostate cancer, PC; 45 controls). Data processing combined QC-based filtering, grouping of ions into compounds, exclusion of exogenous signals, adjusted models, matched pairs and cross-validation with permutation testing. After quality filtering, 7403 of 14,693 features were retained (median QC RSD 8.6%). Adjusted for age, sex and exogenous signals, 188 compounds differed between BC and controls. Five were tentatively annotated (MSI levels 2–3): glucuronides of 11-oxoetiocholanolone and tetrahydrocortisone (two isomers), Lysophosphatidylcholine (LysoPC(16:0)) and biliverdin, where 11-oxoetiocholanolone glucuronide was the main candidate. Cross-validated classification of BC gave AUC 0.81 in all samples and 0.68 in matched pairs; these internal estimates require independent validation. An apparent BC-PC separation (AUC 0.86) was not significant after adjustment for exogenous signals, and no PC-specific compounds were found. Controlling for exogenous and demographic factors during data processing gives conservative estimates of urinary metabolomic differences and helps to prevent false-positive findings.
1. Introduction
Urine is a biofluid widely utilized for the non-invasive investigation of biochemical alterations associated with malignancies of the genitourinary tract [1,2]. Due to its direct contact with the urothelium and contributions from prostatic secretions, the urinary metabolome reflects localized pathological processes and systemic physiological states [3]. For bladder cancer (BC), clinical diagnosis and monitoring currently rely on cystoscopy and urine cytology—a combination with high cost, invasive nature, and limited sensitivity for low-grade and early-stage tumors [4,5]. For prostate cancer (PC), screening primarily depends on serum prostate-specific antigen (PSA), which exhibits low specificity and frequently leads to unnecessary biopsies and overdiagnosis [6,7]. Urine-based tests are already used in the diagnosis and surveillance of BC, but FDA-approved assays such as NMP22, BTA and UroVysion have limited sensitivity and have not replaced cystoscopy [8]. For PC, the approved urinary tests (PCA3, SelectMDx, ExoDx) are RNA-based and are usually performed after prostate massage [9]. Consequently, non-invasive molecular biomarkers, capable of improving diagnostic accuracy and risk stratification, continue to be one of the main priorities in clinical practice [3,6,10,11].
Since early applications of liquid chromatography-mass spectrometry (LC-MS) to urinary profiling in BC [12], untargeted LC-high-resolution mass spectrometry (LC-HRMS) and multi-platform metabolomics are, to date, widely used for biomarker discovery in both BC [13,14] and PC [6,15,16]. Despite numerous studies reporting high statistical classification performance, the reported diagnostic metabolite panels demonstrate limited overlap across the literature. A systematic review of 25 studies listed 1562 metabolites reported as altered in BC across urine, tissue, blood and cell lines [1]. This divergence is attributed in part to analytical and methodological heterogeneity, including variations in sample preparation protocols, mass spectrometry acquisition parameters, data-processing pipelines and compound annotation standards across laboratories [1,17,18]. Furthermore, few studies have compared urinary profiles across urological cancers in independent cohorts or assessed against other urological malignancies [19,20]. Comparative profiling of eight urological conditions by dansylation isotope-labeling LC-MS identified metabolites distinguishing cancer from non-cancer conditions and PC from benign prostatic hyperplasia [21]. Large studies with separate validation cohorts are available for PC, where urinary metabolite panels combined with clinical factors predicted clinically significant disease before biopsy [22]. Evaluating a candidate marker against healthy controls without assessing its behavior across distinct tumor types risks identifying general inflammatory or proliferative responses rather than disease-specific signatures.
Data processing and pre-analytical factors form additional sources of false findings [18,23]. Urine contains many exogenous compounds, including drugs and their metabolites, food constituents and background ions from solvents and materials, that vary between patients and clinical settings [23,24,25]. Exposure can also be indirect: drug residues ingested with food may be excreted in urine for 24 h or longer [26]. Such signals are also present in the pooled Quality Control (QC) sample, so they pass QC-based filters [18], and automatic annotation can assign them as probable endogenous identities [17]. Demographic imbalance, common in clinical case–control series, has the same effect: a covariate that differs between groups can produce an obviously discriminating profile. Assessment of compound origin and clear control of confounders should therefore be a part of the data-processing algorithm rather than being done afterward.
In our previous work, a two-stage Design of Experiments (DoE) framework was implemented to optimize urinary sample preparation and high-performance liquid chromatography-high-resolution mass-spectrometry (HPLC-HRMS) acquisition, applying the protocol to a BC discovery cohort [27]. Building upon that analytical foundation, the present study extends the framework to a broader clinical cohort comprising BC cases, PC cases and healthy controls. The aim of the present study was to evaluate the complete methodology—sample preparation, LC-HRMS analysis, and data-processing algorithm—in a new cohort of BC patients, PC patients, and controls. Specifically, we (i) assessed the analytical quality of the new dataset with pooled QC samples, (ii) applied a data-processing algorithm that includes the exclusion of exogenous signals and control of age, sex and pre-analytical factors, and (iii) evaluated BC- and PC-related differences with adjusted models, matched-pair analyses and cross-validated classification.
2. Materials and Methods
2.1. Study Cohort and Urine Collection
Urine samples were collected at the Medical Research and Educational Center of Lomonosov Moscow State University between December 2025 and May 2026. Patients with histologically confirmed bladder cancer (BC) or prostate cancer (PC) were sampled before any antitumor treatment, and controls were volunteers with no history of oncological or urological disease. Exclusion criteria were prior oncological therapies and other malignancies. First-morning mid-stream urine was collected into standard sterile urine containers, aliquoted into cryovials and immediately frozen and stored at low-temperature conditions (below −70 °C) to inhibit enzymatic activity. Each aliquot was thawed once. No additives or preservatives were used.
The study was approved by the Local Ethics Committee of the Medical Research and Educational Center of Lomonosov Moscow State University (protocol No. 06/25 of 20 October 2025), and all participants gave written informed consent. The dataset included 45 controls, 29 BC and 20 PC patients (n = 94; Table 1). Age and sex were available for all participants.
Table 1.
Demographic profile of the study cohort.
2.2. Sample Preparation and LC-HRMS Analysis
Urine samples were thawed at room temperature (20 ± 2 °C) and thoroughly homogenized via vortexing. Samples were prepared with the protocol previously optimized by a two-stage design of experiments [27]. A 200 µL aliquot of urine was transferred to a polypropylene microcentrifuge tube, methanol (HPLC grade, Panreac, Barcelona, Spain) was added at a 2:1 ratio (v/v), and the mixture was vortex-mixed for 10 min and centrifuged at 9600× g for 5 min. The supernatant was transferred to a clean microcentrifuge tube, concentrated under a gentle stream of nitrogen at room temperature (25 ± 2 °C). The residue was reconstituted in 200 µL of methanol-water mixture (50:50, v/v), vortex-mixed for 2 min and transferred into chromatographic vials for HPLC-HRMS analysis. Equal aliquots (100 µL) of all samples were pooled to obtain a QC sample.
Samples were injected in random order, with the pooled QC (n = 6) injected at the start of the sequence and periodically throughout the analytical run to ensure analytical stability, and methanol solvent blanks (n = 7) throughout the sequence, two of them before the first study sample.
Separation was performed on a Vanquish ultra-high-performance liquid chromatography (UHPLC) system (Thermo Fisher Scientific, Waltham, MA, USA) with an Acquity UPLC BEH C18 column (2.1 × 100 mm, 1.7 µm, 40 °C; Waters, Wexford, Ireland) using mobile phases consisting of 0.1% formic acid (Fluka, Milwaukee, WI, USA) in ultrapure water (18 MΩ·cm at 25 °C; Milli-Q system, Millipore, Bedford, MA, USA) (eluent A) and acetonitrile (HPLC grade, Panreac, Barcelona, Spain) (eluent B) at a 0.4 mL/min flow rate and a 23 min gradient elution program [27]; the injection volume was 1 µL. Spectra were obtained on an Orbitrap Exploris 240 (Thermo Fisher Scientific, Bremen, Germany) with electrospray ionization (ESI) in positive mode: full scan over m/z 150–1500 at a resolution of 30,000 (FWHM) and data acquisition and source parameters as in [27].
2.3. Feature Extraction and Pre-Processing
Raw files were processed in MS-DIAL 5.5 (minimum peak height 100,000; MS1/MS2 tolerances 0.01/0.025 Da; alignment tolerances 0.1 min and 0.015 Da). MS/MS spectra were searched against the NIST 23 HRMS database; matches with dot-product scores below 600 (0–1000), less than 25% matched spectrum, or fewer than 3 matched peaks were labeled “low score”. Features with a sample maximum below five times the solvent-blank average were removed.
A feature was retained if it was detected in at least 80% of QC injections and in at least half of the samples of one group, and if its relative standard deviation (RSD) in the pooled QC did not exceed 30%. Forty-one features detected in fewer than 50% of one group, but at least 80% of another, were compared separately with Fisher’s exact test (Table S4).
Intensities were normalized by probabilistic quotient normalization (PQN) [28] with the feature-wise median of the six pooled QC injections as the reference spectrum; the dilution factor of each sample was the median of its feature-wise quotients to this reference, calculated on raw peak areas of the 7403 filtered features before imputation. Missing values (11.8% overall) were then replaced with half of the feature minimum, and the data were log2-transformed. Mass Spectrometry Total Useful Signal (MSTUS) normalization was used as a sensitivity check. The pooled QC contained almost all compounds (median 0.3% of compounds imputed per injection), whereas individual samples lacked a median of 13% (up to 29%) and this difference displaces QC samples in multivariate space. The Pareto-scaled Principal Component Analysis (PCA) was therefore based on the 1366 compounds detected in all study samples. A leave-one-QC-out test showed that QC-based LOWESS drift correction reduced the median prediction error for QC only marginally (median |Δlog2| 0.074 vs. 0.081 without correction); therefore, no drift correction was applied.
2.4. Compound Grouping and Assessment of Signal Origin
Ions eluting within 0.02 min of each other and correlated across samples (Spearman ρ ≥ 0.8) were grouped into compounds. Each compound was represented by its curated molecular ion ([M + H]+, [M + Na]+, [M + NH4]+ or [M + K]+) when one was present in the group, and otherwise by its most intense ion. [M + NH4]+ ions, which were not among the adducts annotated by MS-DIAL, were assigned during manual curation (Table S3).
The origin of each compound was assessed before statistical analysis. Compounds were flagged as exogenous if a manually curated annotation (Table S3) classified them as drugs, drug metabolites or food constituents, or if their NIST HR-MS/MS library match met the identification criteria given in Section 2.3 and contained a term from a keyword list compiled before the statistical analysis (21 regular expressions covering drugs commonly prescribed to urological and elderly patients, dietary methylxanthines and other food constituents, and tobacco alkaloids; Table S8). Homologous series were also searched for as ions differing by C2H4 (28.0313), O (15.9949) or C2H4O (44.0262) within 5 ppm and with retention time increasing with chain length. One series of non-endogenous compounds was found (Figure S6, Table S7) and its presence in the blanks was checked on extracted-ion chromatograms of the raw data (Figure S5). Members of this series were also flagged as exogenous. Flagged compounds were not considered as marker candidates and compounds with low-scoring drug- or tobacco-related library matches were additionally excluded from the candidate pool of the classification models. The mean z-score of ten members of the series served as an exogenous-signal index and was included as a covariate. The index was used as an empirical covariate describing the intensity of this non-endogenous series in each sample. It may reflect analytical background, sample handling and exposure of the participants, which cannot be distinguished in the present data, and it is not interpreted as a measure of biological exposure.
2.5. Statistical Analysis and Classification
For each comparison, log2 intensity of each compound was modeled as a function of group, sex, age and the exogenous-signal index, and p-values were adjusted by the Benjamini–Hochberg procedure. Patients were also matched 1:1 to participants of the comparison group on age within sex (optimal matching, caliper ± 5 years, without replacement), giving 20 BC-control, 18 BC-PC and 11 PC-control pairs. A compound was considered a finding if it reached q < 0.05 in the adjusted model and p < 0.05 in the matched pairs with the same direction of change. In comparisons with controls, it also had to differ from controls with a below-median index (p < 0.05, same direction), and compounds that differed between controls with high and low index (p < 0.05) were removed. This last criterion screens out compounds with an evident dependence on the index but does not establish equivalence. The index effect was controlled primarily by its inclusion as a covariate. Matched pairs were compared with the two-sided Wilcoxon signed-rank test on within-pair differences (pairs with a zero difference, i.e., the same imputed value in both members, were omitted), and the direction of change was taken from the median paired difference. Comparisons with low-index controls and between high- and low-index controls used the two-sided Mann–Whitney U test.
Classification was evaluated by stratified five-fold cross-validation repeated 20 times. In each training fold, the five compounds with the lowest Mann–Whitney p-values were entered into a logistic regression model; partial least squares discriminant analysis (PLS-DA; two components, Pareto scaling within the fold) was evaluated in the same folds on all candidate compounds. Exogenous compounds and compounds correlated with the index (|ρ| ≥ 0.5) were excluded from the candidate pool. Models were built on all samples, on compound intensities adjusted for the index within each training fold and on matched pairs (if ≥10); a sex-only model served as a baseline. Because the panel is re-selected in every training fold, the number of the 100 training folds in which each compound was selected, together with the panel selected by the same rule on all samples, is reported in Table S2b. Significance was assessed with 1000 label permutations; area under the receiver operating characteristic curve (AUC) is reported as mean ± SD over repeats.
Spectra were annotated in MS-DIAL against the NIST HR-MS/MS library. Annotation confidence followed the Metabolomics Standards Initiative (MSI) [17]: level 2, precursor within 5 ppm of the curated formula and an MS/MS library match; level 3, formula-consistent annotation without unique MS/MS support; level 4, unidentified (Table S3). Pathway enrichment was tested with mummichog 2.7.0 (positive mode, 5 ppm). Analyses were performed in Python 3.13 (NumPy 2.5, pandas 3.0, SciPy 1.18, statsmodels 0.15, scikit-learn 1.9, Matplotlib 3.11, pyteomics 4.7).
3. Results
3.1. Data Quality and Feature Processing
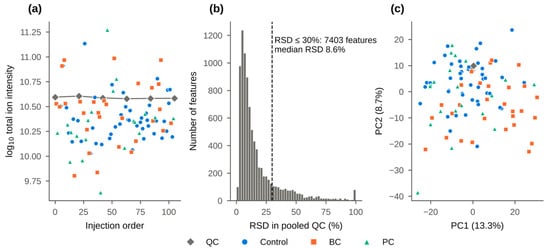
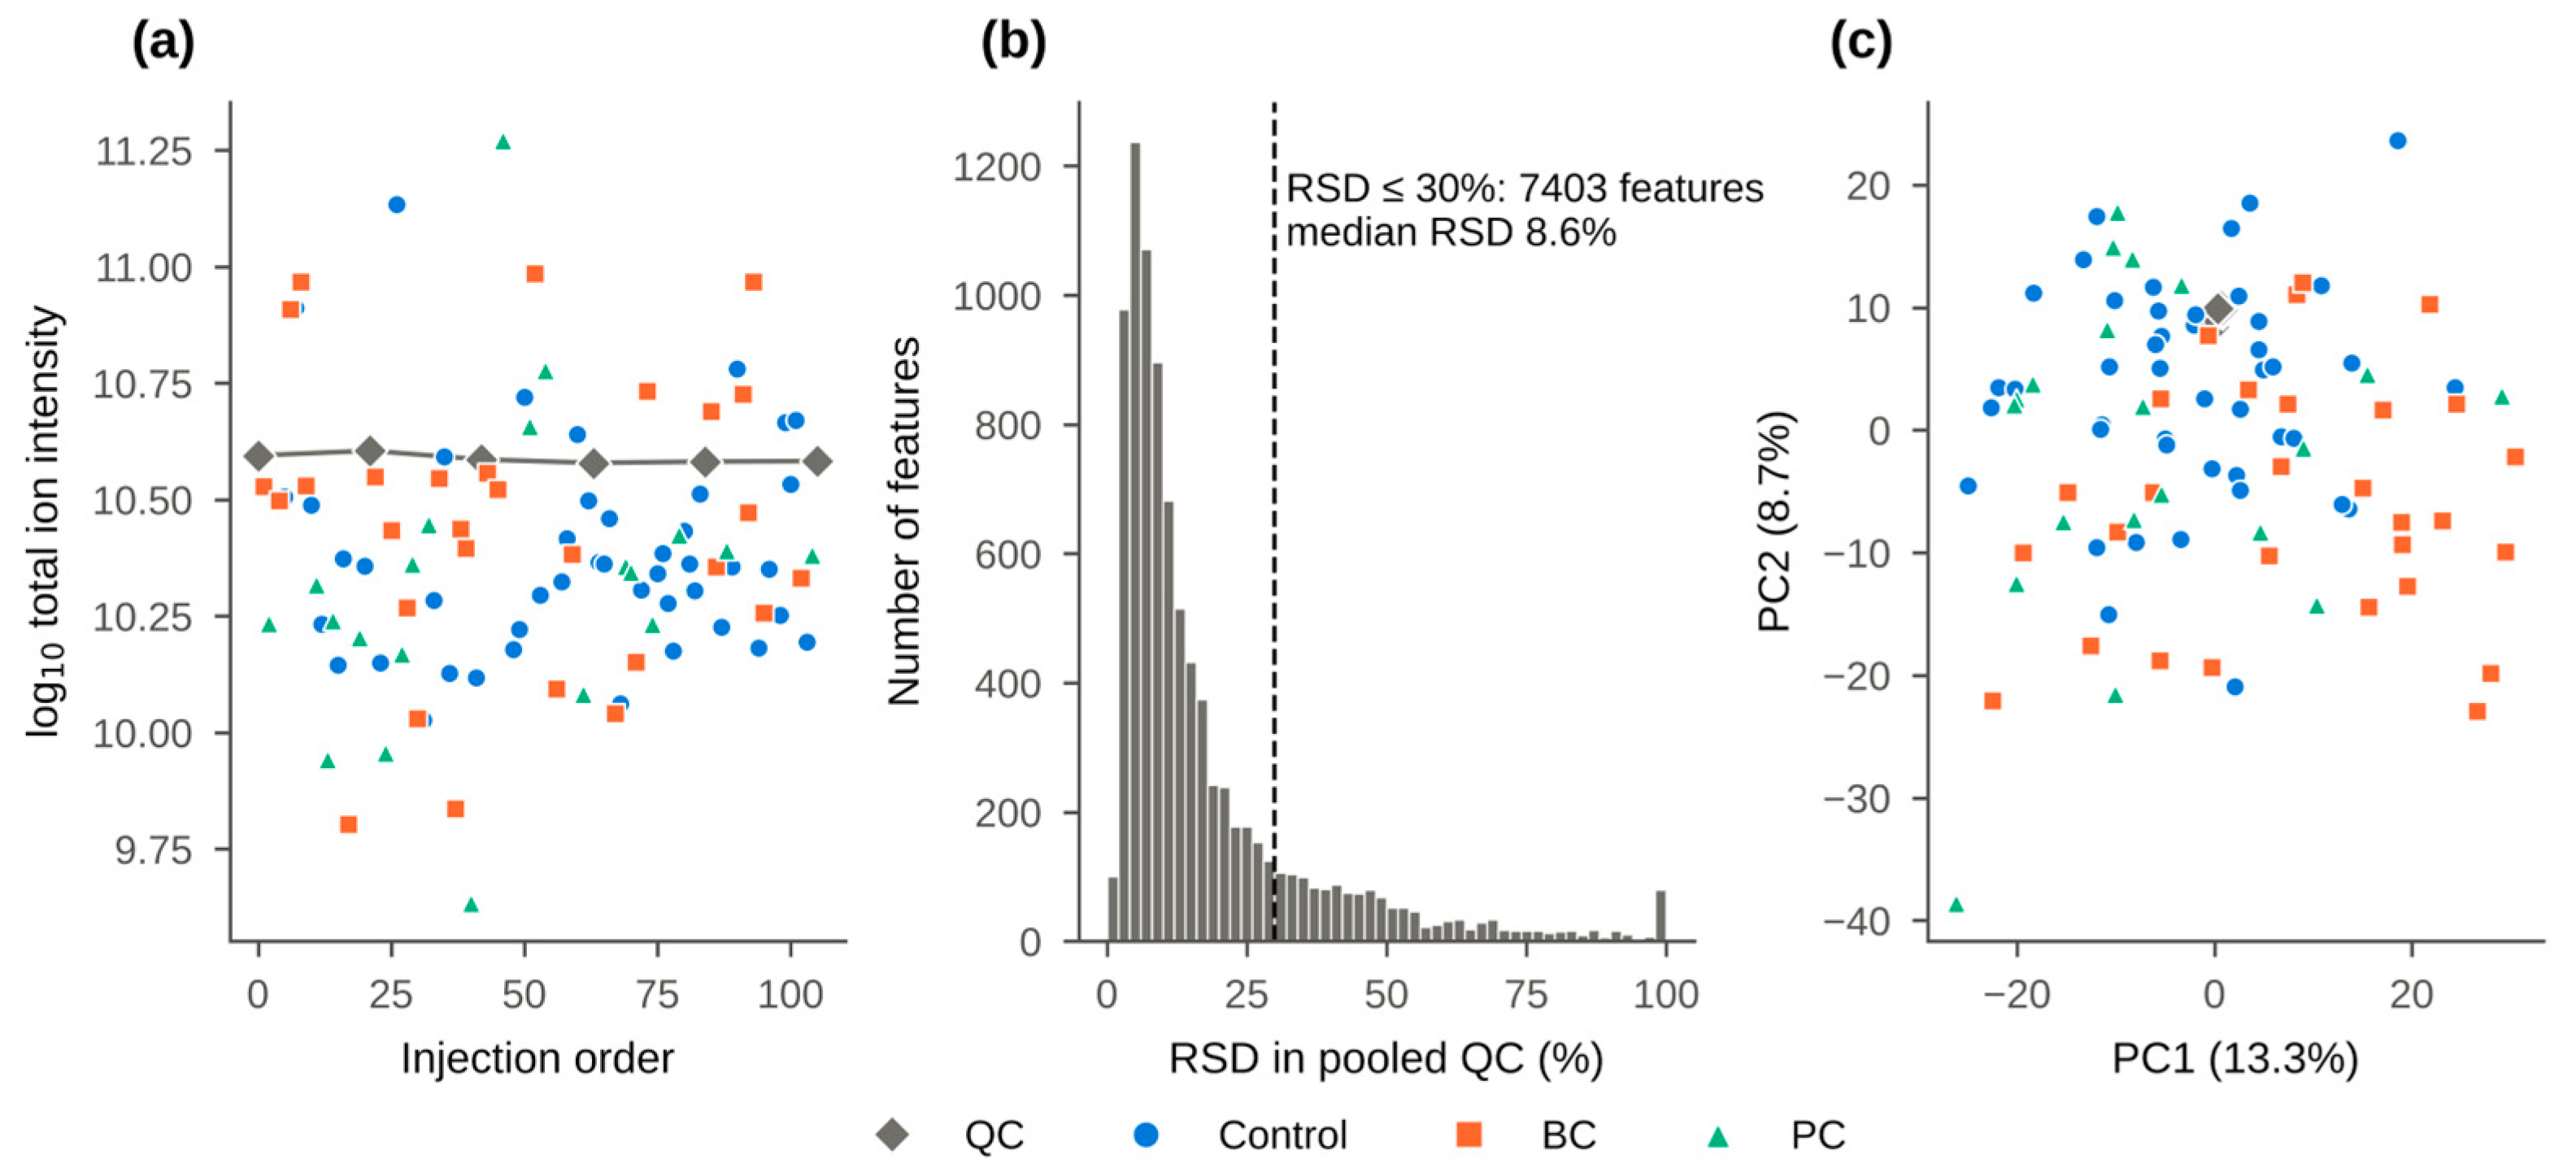
During data processing, 14,693 aligned features were obtained, 8867 passed the detection filter, and 7403 had a QC RSD of 30% or less, with a median of 8.6% (Figure 1b). The summed intensity of QC injections remained constant over the batch sequence, while study samples spanned about an order of magnitude (Figure 1a). QC injections clustered tightly in the center of the study samples in the PCA score plot (Figure 1c).
Figure 1.
Data quality: (a) Total ion intensity of pooled QC samples and study samples versus injection order; (b) Distribution of feature-wise RSD in pooled QC samples; dashed line, the 30% acceptance threshold; (c) PCA score plot of QC and study samples (log2, Pareto scaling; one representative feature per compound; the 1366 compounds detected in all study samples, i.e., without imputed values).
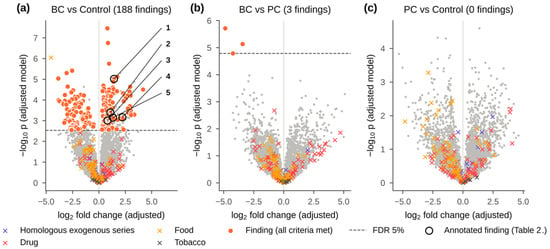
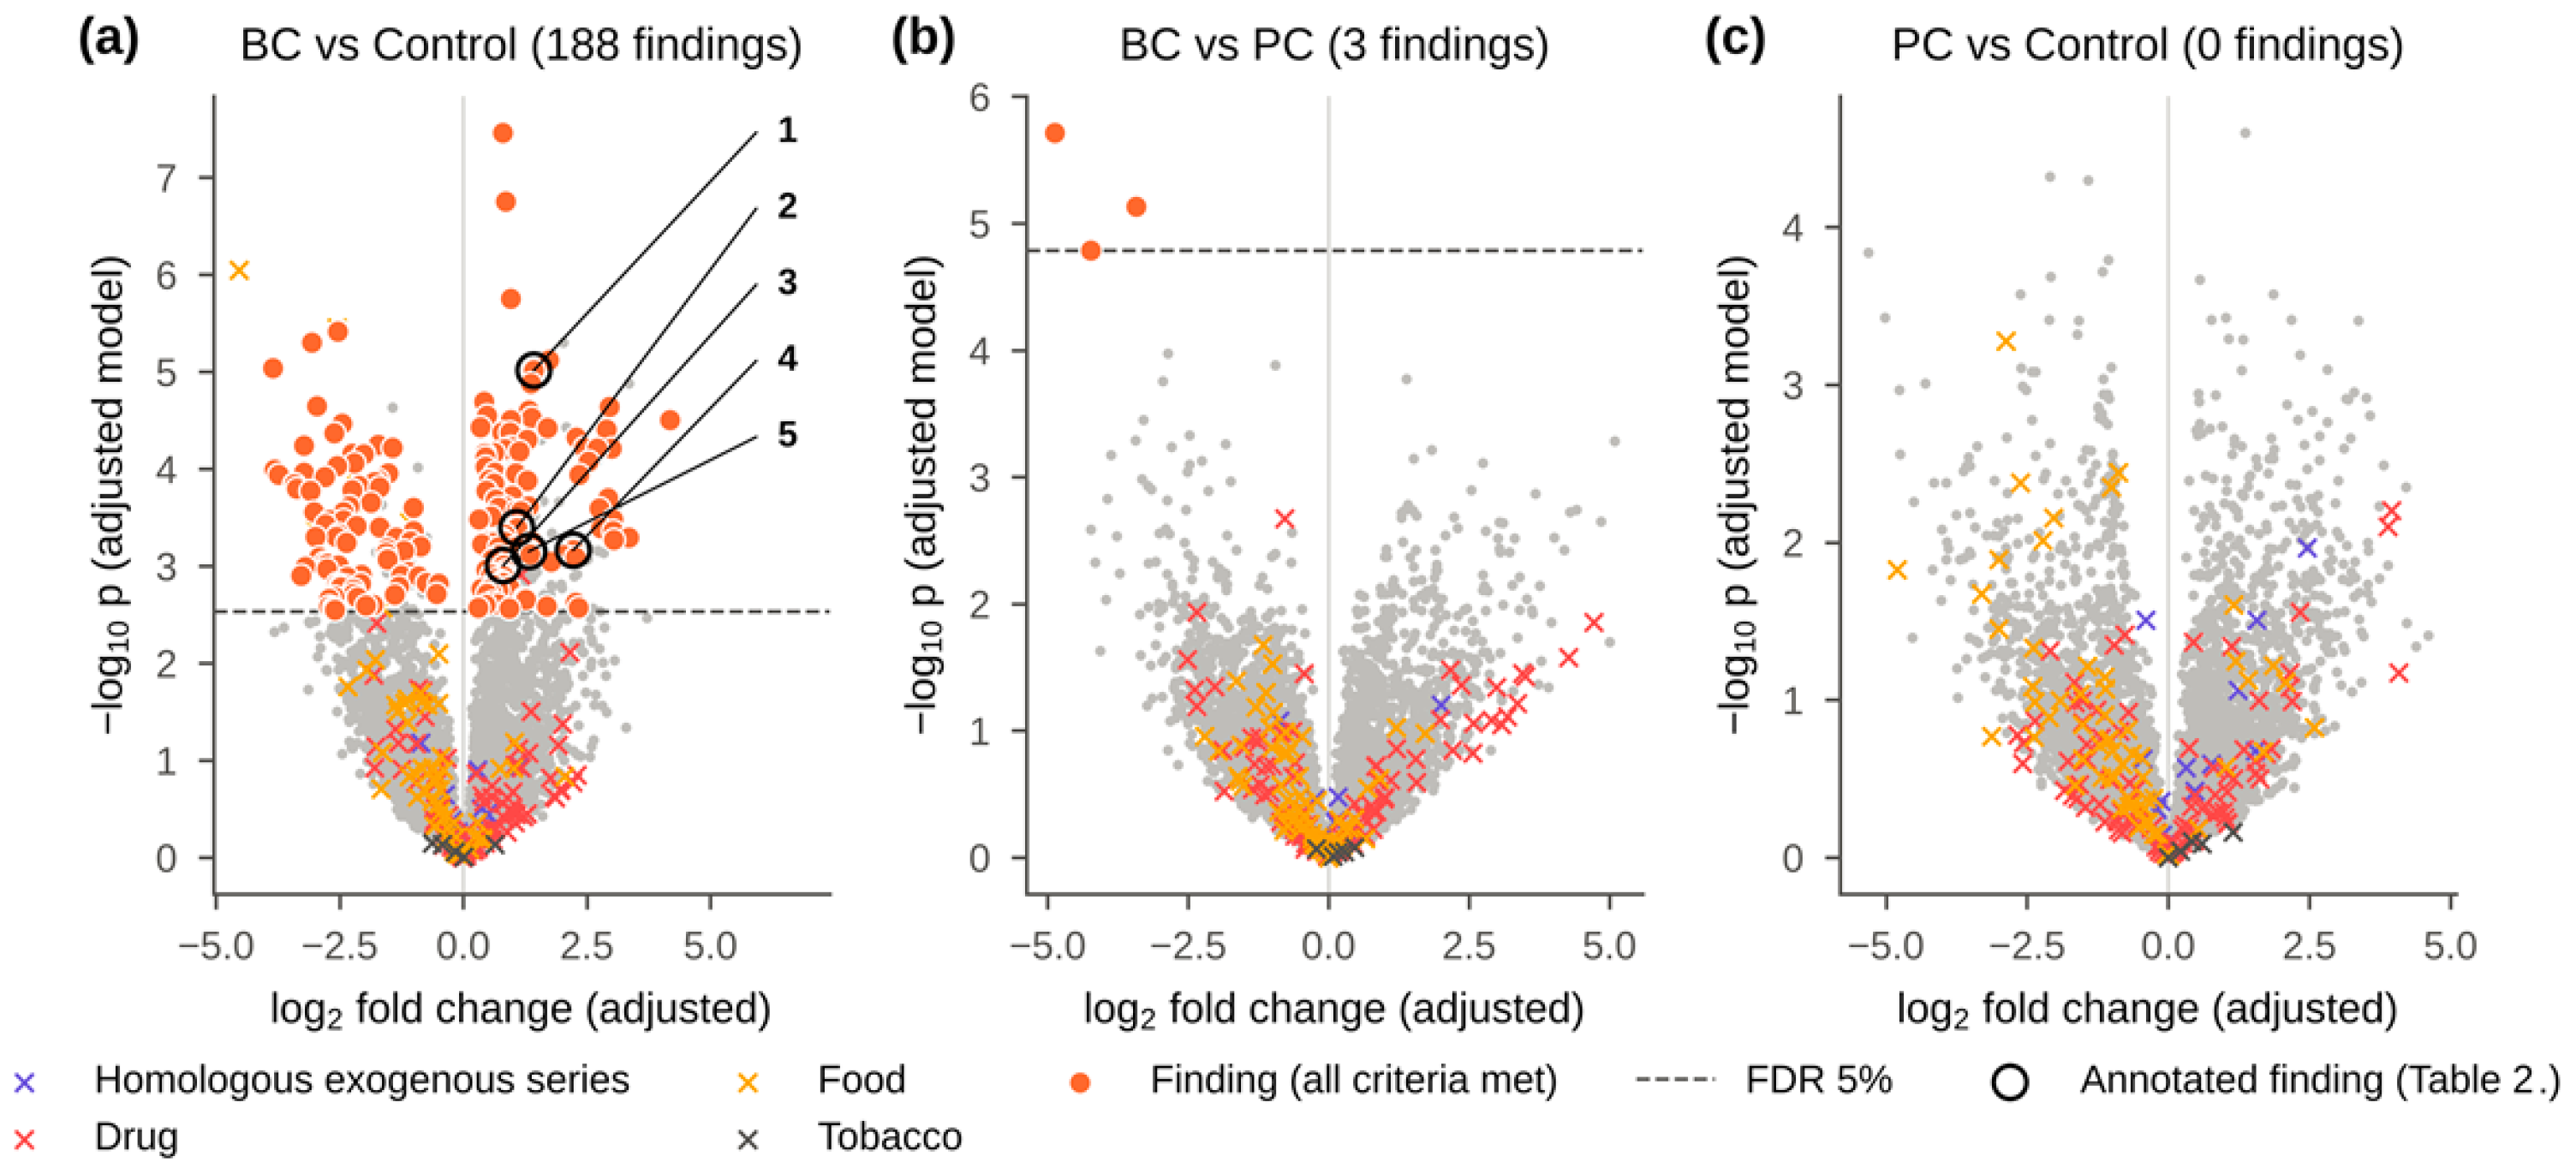
Drift correction would have reduced the leave-one-out prediction error of QC samples only from 0.081 to 0.074 log2 units and was not applied. Grouping combined the 7403 features into 5792 compounds, 718 of which were represented by two or more ions, mostly adducts, isotopes and in-source fragments. Exogenous compounds were spread over the whole range of fold changes (Figure 2, crosses).
Figure 2.
Volcano plots from the adjusted linear model (log2 intensity ~ group + sex + age + exogenous signal index): (a) BC vs. controls (188 findings); (b) BC vs. PC (3 findings); (c) PC vs. controls (no findings). Filled circles, findings (all criteria in Section 2.5 met); crosses, exogenous compounds excluded from marker selection (drugs, food- and tobacco-related compounds, the homologous exogenous series); dashed line, false discovery rate (FDR) 5%. In (a), circled numbers mark the annotated findings listed in Table 2.
3.2. Cohort Characteristics
The groups were not balanced by age or sex (Table 1, Figure S2a). Controls (53.3 ± 14.6 years) were younger than BC patients (62.9 ± 9.7 years, p = 0.007) and PC patients (70.7 ± 6.6 years, p < 0.001); men made up 42% of controls, 83% of BC patients and all PC patients. The exogenous-signal index also differed between groups (Figure S6b) and correlated with the probabilistic quotient normalization (PQN) dilution factor (ρ = −0.45).
3.3. BC vs. Controls
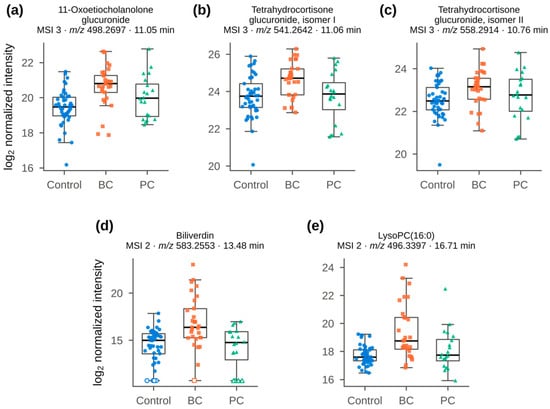
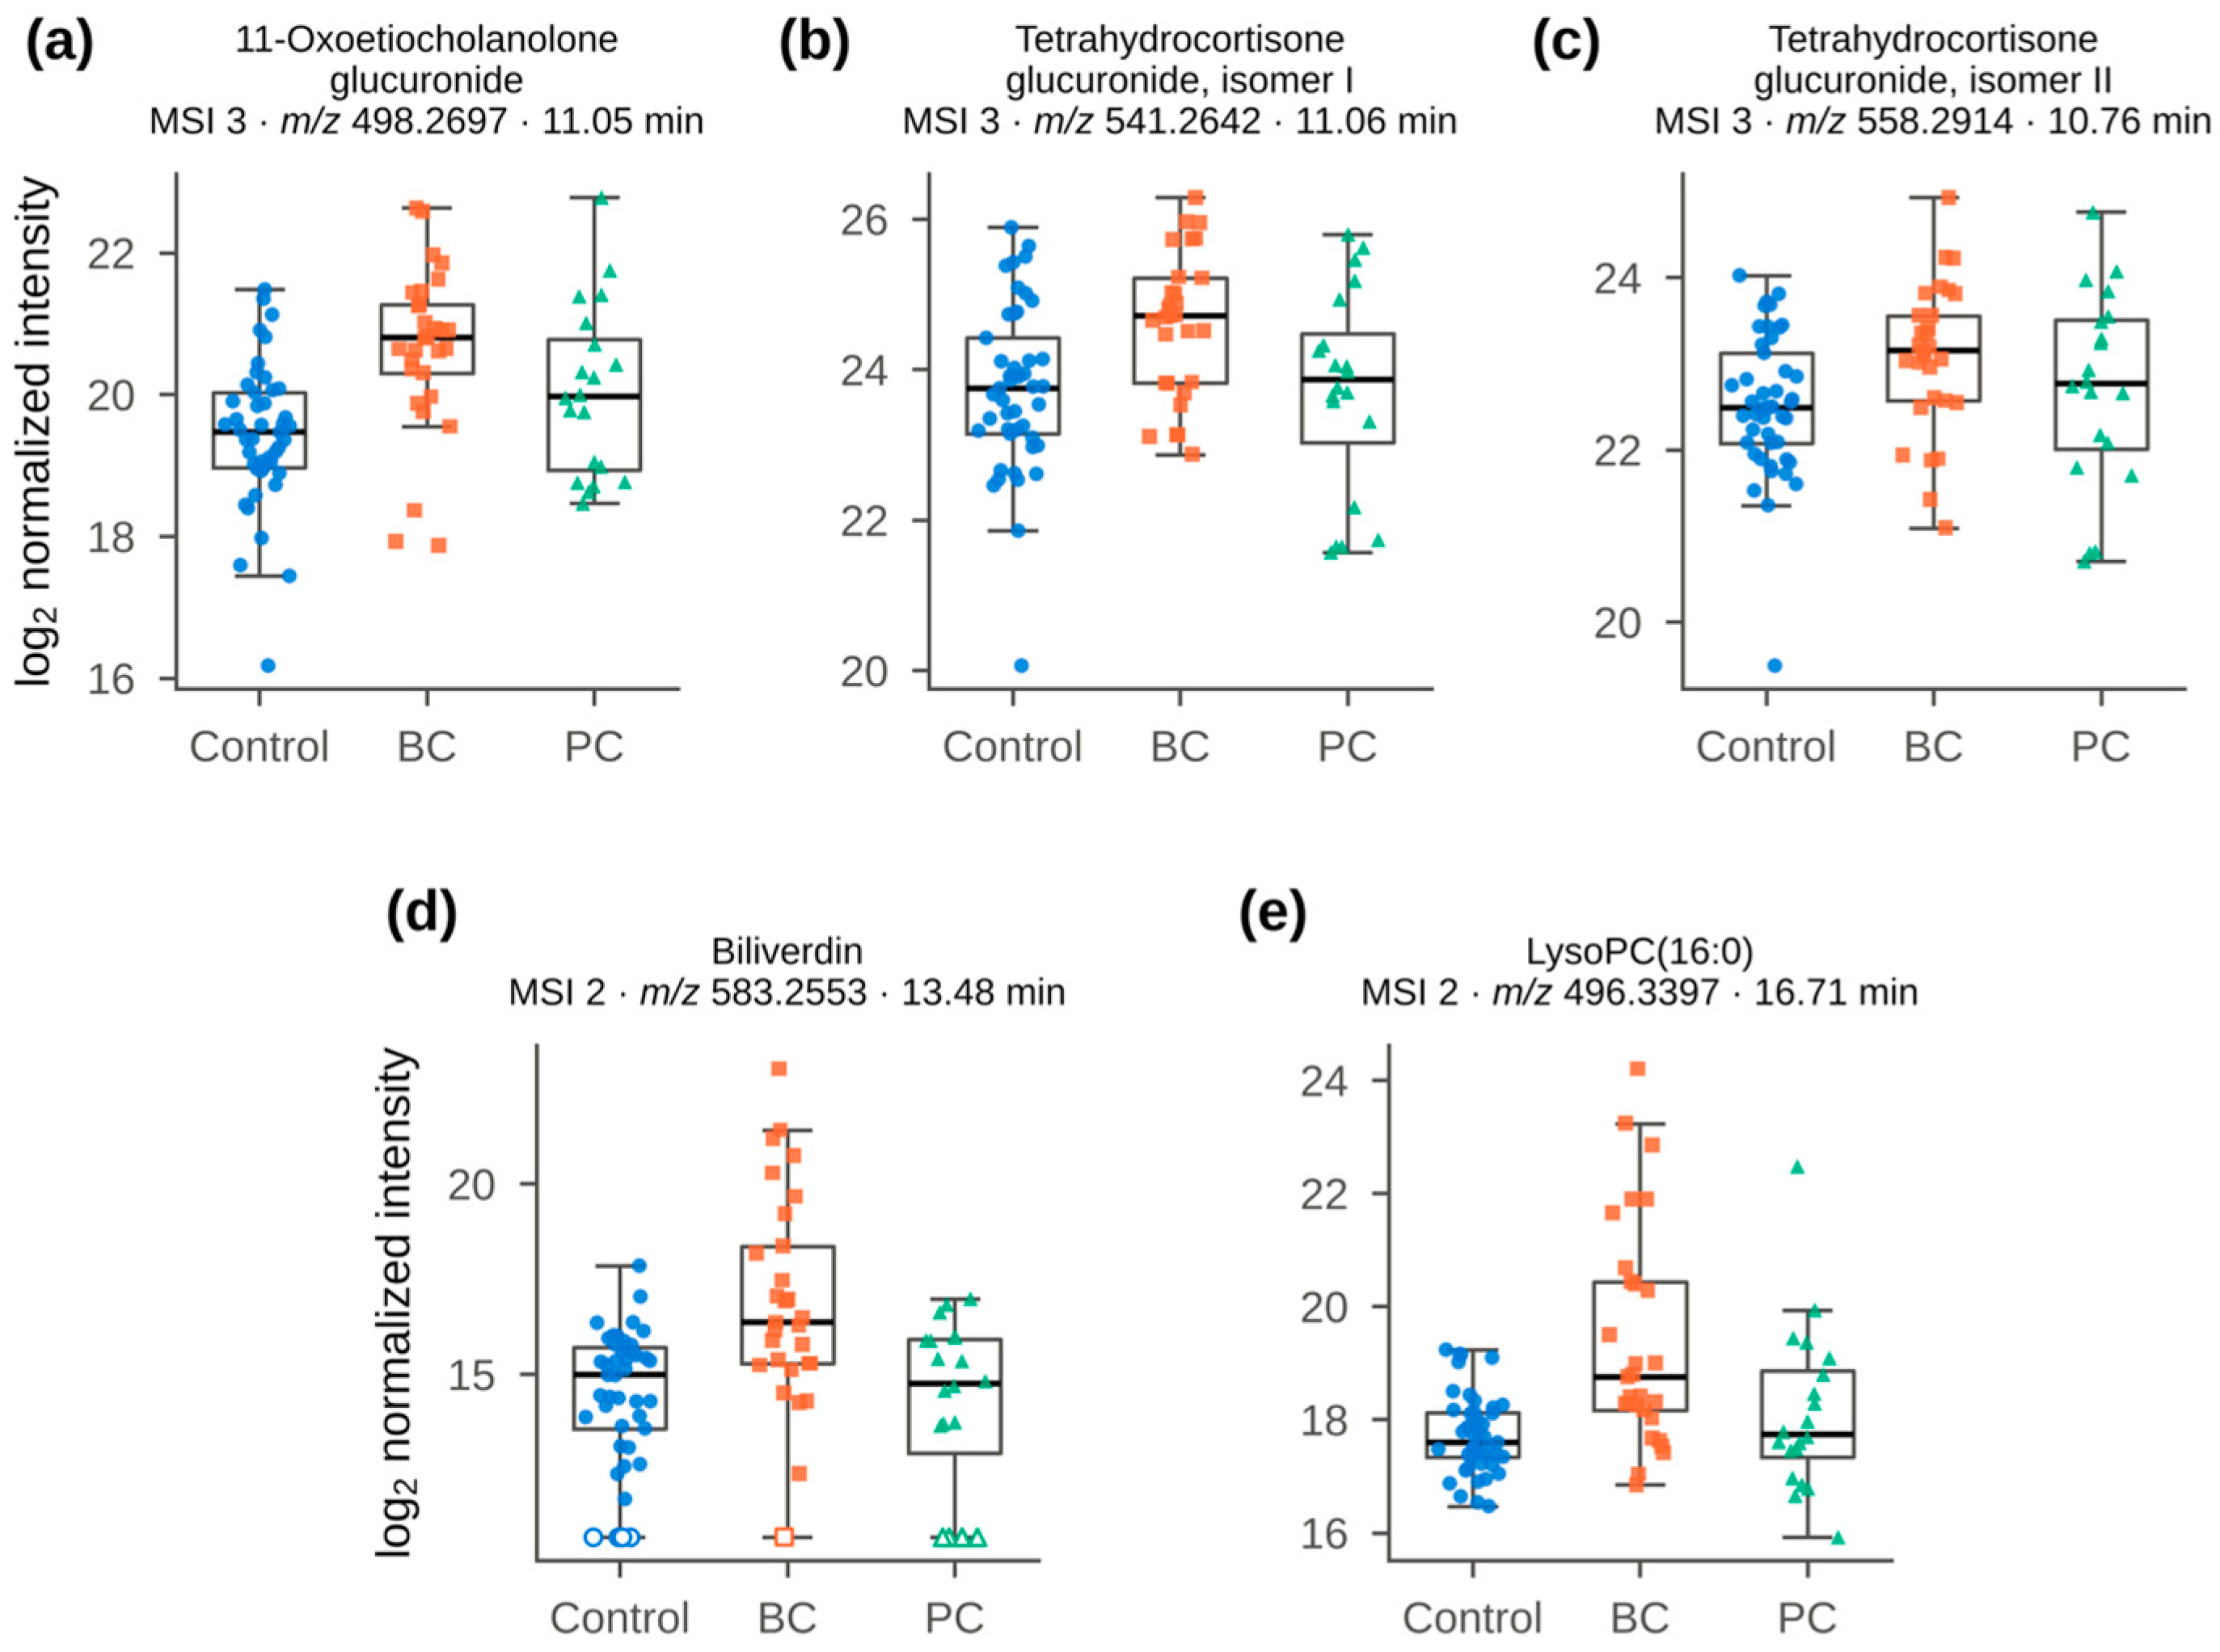
In the adjusted model, 340 of the 5792 compounds had q < 0.05 (Table S5) and 188 of them met all finding criteria, 104 being higher and 84 lower in BC (Figure 2a and Figure S1, Table S1). With MSTUS instead of PQN, the fold changes kept the same order (ρ =1.00), and 109 of the 122 MSTUS findings were also PQN findings (Figure S3, Table S6). Five findings were annotated at MSI levels 2 and 3; all were higher in BC, with AUC values of 0.69–0.81 (Table 2, Figure 3).
Table 2.
Annotated bladder-cancer findings (BC vs. controls; MSI levels 2–3). log2FC and q (Benjamini–Hochberg) are from the model adjusted for sex, age and the exogenous-signal index; AUC, all samples; p (matched), Wilcoxon signed-rank test in age- and sex-matched pairs. Finding criteria and MSI levels are defined in Section 2.5; full data are in Tables S1 and S3.
Figure 3.
Annotated BC findings (Table 2) across groups (log2 PQN-normalized intensities): (a) 11-oxoetiocholanolone glucuronide; (b) tetrahydrocortisone glucuronide isomer I; (c) tetrahydrocortisone glucuronide isomer II; (d) biliverdin; (e) LysoPC (16:0). Open symbols, values below the detection limit (imputed as half of the feature minimum).
Three are conjugated steroids. The strongest, a putative 11-oxoetiocholanolone glucuronide ([M + NH4]+ m/z 498.2697, C25H36O9, error < 0.1 ppm; log2FC 1.43, q = 0.005, AUC 0.81), was accompanied by in-source aglycone ions at m/z 287.2007 and 269; its 5α-isomer, 11-oxoandrosterone glucuronide, cannot be excluded. It co-eluted within 0.01 min with tetrahydrocortisone glucuronide isomer I (No. 2 in Table 2; [M + H]+ 541.2642), but after accounting for m/z 498.2697, the two signals were almost unrelated (partial ρ = 0.24) and were therefore treated as separate compounds. Isomer II (No. 3) eluted 0.30 min earlier, at 10.76 min, with its own set of adducts dominated by [M + NH4]+ (558.2914) and aglycone ions at m/z 365, 347 and 329. Both glucuronides (q = 0.018 and 0.030) were annotated through MS/MS matching of the aglycone, and all three steroid conjugates remained significant in matched pairs. The other two annotated findings were LysoPC(16:0) (q = 0.025) and biliverdin (q = 0.024).
Two further annotated compounds were higher in BC but did not meet all criteria: dodecanoylcarnitine (q = 0.010 in the adjusted model; p = 0.070 in 20 matched pairs) and the dipeptide Val-Leu (MSI 2; AUC 0.76; p = 0.007 in matched pairs; q = 0.078). Pathway analysis (mummichog) showed no pathway enrichment that remained significant after FDR correction (FDR < 0.05; Figure S4).
3.4. Classification of Bladder Cancer
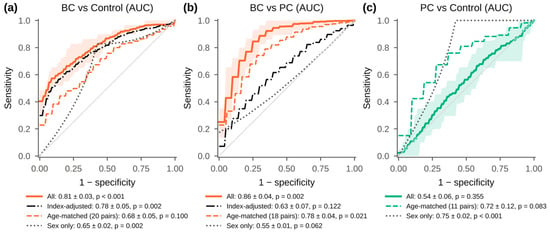
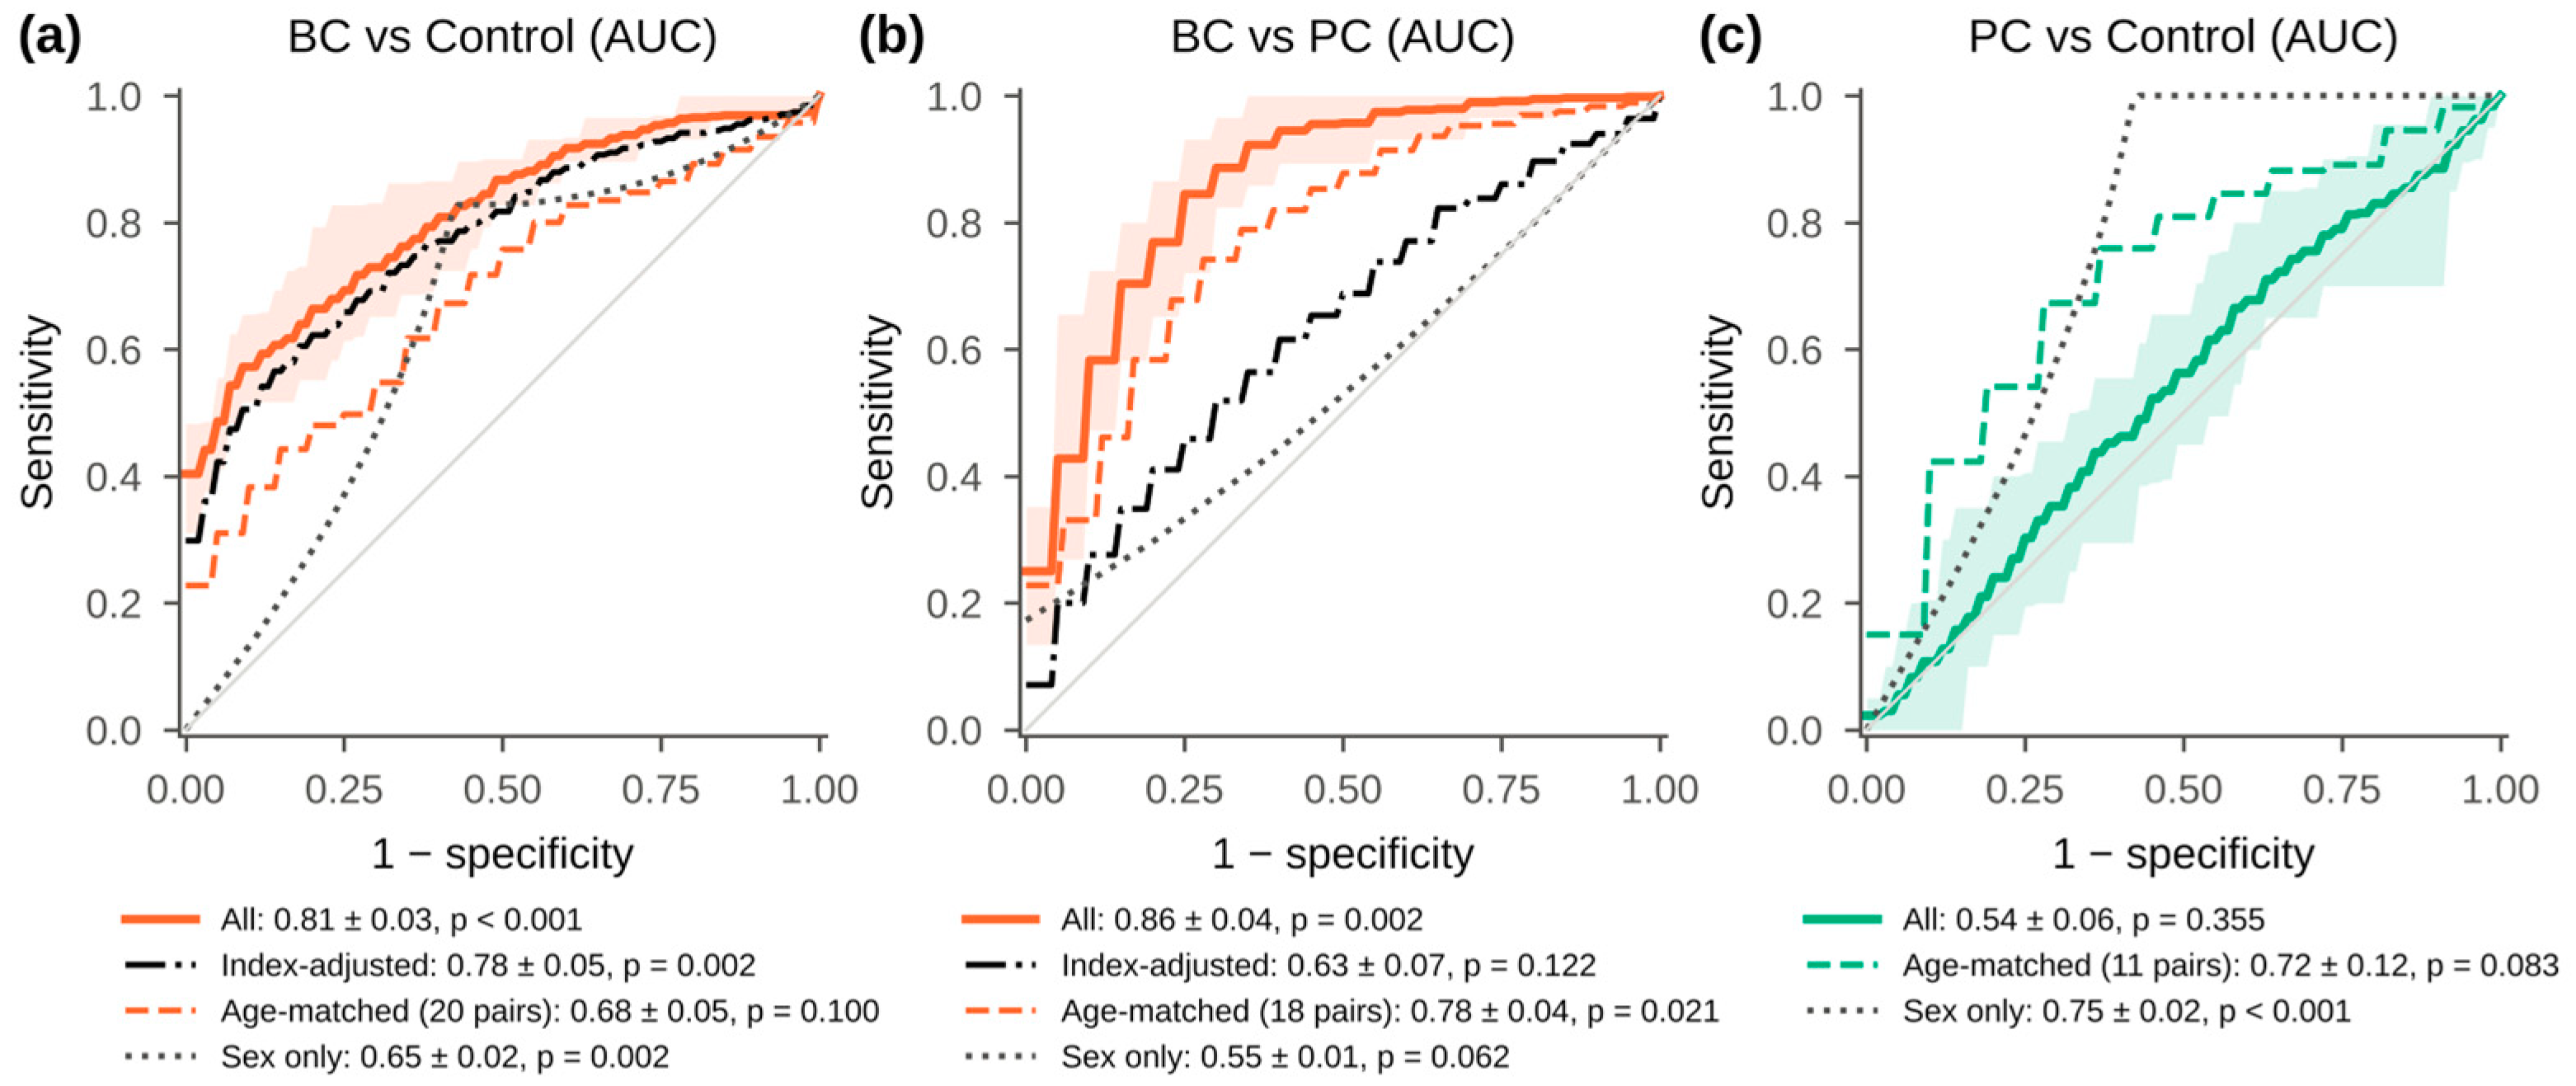
A five-compound panel distinguished BC from controls with a cross-validated AUC of 0.81 ± 0.03 (p < 0.001), and PLS-DA gave 0.83 ± 0.02 (Figure 4a, Table S2). After adjustment of compound intensities for the exogenous-signal index within each training fold, the AUC was 0.78 ± 0.05 (p = 0.002), higher than that of sex alone (0.65 ± 0.02). In 20 age- and sex-matched pairs, the panel reached 0.68 ± 0.05 (p = 0.10).
Figure 4.
Cross-validated ROC curves of the five-compound panel (Section 2.5): (a) BC vs. controls; (b) BC vs. PC; (c) PC vs. controls. Solid, all samples (shaded band, 10th–90th percentiles over 20 repeats of 5-fold cross-validation); dash-dot (a,b), intensities adjusted for the exogenous-signal index; dashed, age- and sex-matched pairs; dotted, sex-only baseline. AUC, mean ± SD over repeats; p, permutation test.
3.5. BC vs. PC, and PC vs. Controls
Three unannotated compounds, all lower in BC, met the finding criteria for BC versus PC (Figure 2b). Each was detected in 80–100% of PC samples but only in 10–69% of BC samples. The panel separated the two cancers with an AUC of 0.86 ± 0.04 (p = 0.002) and 0.78 ± 0.04 in 18 age-matched pairs (p = 0.021); after adjustment for the exogenous-signal index, the AUC was 0.63 ± 0.07 (p = 0.12; Figure 4b).
No compound met the criteria for PC versus controls (Figure 2c), and the panel did not separate these groups (AUC 0.54 ± 0.06, p = 0.35), whereas sex alone gave 0.75 (Figure 4c). In PC patients versus male controls, the AUC was 0.63–0.65 (Table S2), and in 11 age-matched pairs, 0.72 ± 0.12 (p = 0.083).
3.6. Sensitivity Analyses
To check that the results did not depend on individual processing choices, the analysis was repeated in four variants (Table S6). Excluding the seven most dilute samples (PQN factor < 0.2) changed little: 176 of the 188 findings remained, and the panel AUC was 0.80. Building the exogenous-signal index only from series members absent from the blanks gave 165 findings; 157 of them were shared with the main analysis, including all five annotated compounds (panel AUC 0.80). Restricting the analysis to the 1366 compounds detected in every sample, which requires no imputation, confirmed all 76 findings in this subset, among them the three steroid glucuronides and LysoPC(16:0). The variant most affected was the one in which imputed values were treated as missing: it gave 170 findings, 113 shared with the main analysis. The findings lost here were compounds often below the detection limit (median 23% of samples), and biliverdin, not detected in 12% of samples, no longer passed the matched-pair test (p = 0.058). Detection rates for each finding are given in Table S1.
4. Discussion
4.1. Analytical Performance and Data Processing
The precision of the pooled QC (median RSD 8.6%) and the lack of relevant drift meet the usual acceptance criteria for untargeted assays [18]. The sample preparation and LC-HRMS protocol optimized earlier by design of experiments [27] could therefore be applied to a new clinical cohort without modification.
Two data-processing steps directly shaped the results. First, grouping ions into compounds ensured that adducts, isotopes and in-source fragments of the same metabolite were not counted as separate findings; 718 compounds in this dataset were represented by more than one ion. Second, the origin check kept drugs, food constituents and the non-endogenous homologous series out of marker selection. Most of these compounds did not differ between groups, but a few reached q < 0.05 and would otherwise have been reported as findings. Finally, because the groups differed in age and sex, both of which affect the urinary metabolome [29], every comparison was adjusted for these factors and confirmed in matched pairs. Both PQN and MSTUS estimate dilution from the measured data, and no independent measure of urine concentration such as creatinine, osmolality, or specific gravity was available. The agreement between the two methods and the stability of the findings after exclusion of the most dilute samples reduce, but do not exclude, an influence of normalization on the results. The negative correlation between the exogenous-signal index and the PQN dilution factor (ρ = −0.45) is consistent with signals of roughly constant absolute amount that become relatively larger after normalization of dilute samples. For this reason, the index was included as a covariate after normalization.
4.2. BC-Associated Compounds
The most consistent BC-associated compounds were tentatively annotated (MSI level 3) as conjugated androgen and glucocorticoid metabolites. They remained significant after adjustment, in matched pairs and in the sensitivity analyses. Steroid metabolites have been reported in other urinary studies of BC. For example, the cortisol metabolite β-cortolone was part of a panel separating BC and renal cell carcinoma from controls [20], which agrees with the higher tetrahydrocortisone glucuronides found here. In study [10], in contrast, lower 11-hydroxyandrosterone in BC was found, together with higher pregnane derivatives, whereas the 11-oxygenated androgen conjugate was higher in our cohort. In that study, no deconjugation step was described, and the steroids were annotated by accurate mass (±15 ppm), retention time and comparison with public MS/MS libraries. The annotations refer to free steroids, whereas androgen metabolites are excreted in urine mainly as glucuronide and sulfate conjugates, so the measured form is uncertain. Such differences in annotation, platform and cohort may explain the opposite direction. Glucocorticoid excretion also increases with illness and stress, so whether these changes are specific to BC still needs to be tested. Of the five annotated compounds, 11-oxoetiocholanolone glucuronide is the most promising candidate for confirmation with a reference standard and a targeted assay, whereas the blood-derived LysoPC(16:0) and biliverdin require control for hematuria.
Dodecanoylcarnitine was higher in BC, in agreement with several reports of increased urinary acylcarnitines [29,30,31]. In an age- and sex-matched study, the closely related C12:1 acylcarnitine was part of a BC panel [29]. Acylcarnitine changes also persisted when controls with non-malignant hematuria were included [31] and decreased after tumor resection [32]. In our cohort, however, the difference was not significant in the 20 matched pairs (p = 0.070), and a larger matched cohort is needed to confirm it.
LysoPC(16:0) and biliverdin are abundant in plasma or formed by heme breakdown. Earlier studies built separate panels for patients with and without hematuria [11,20], which indicates that blood in urine can substantially alter the urinary metabolic profile. Microscopic hematuria and proteinuria were not measured in our cohort and may partly account for the increase in these two compounds. In addition, biliverdin was not retained when imputed values were treated as missing (Section 3.6).
Published urinary metabolite panels for BC report AUC values of about 0.8–0.98, often in small cohorts without adjustment for age and sex [11,20,33]. When these panels were validated, the AUC usually decreased, for example from 0.95 to 0.87 [20] and from 0.96 to 0.92 [29]. Our AUC of 0.81 on all samples is at the lower end of this range, and its decrease to 0.68 in matched pairs shows how much the apparent separation can depend on cohort composition. The all-sample value should therefore be regarded as an upper estimate. These values are internal cross-validated estimates and do not replace validation in an independent cohort. No metabolic pathway was significantly enriched, so the results are not interpreted at the pathway level.
4.3. Urological Cancers Comparison
Direct metabolomic comparisons between urological cancers are still rare and have used small groups: in the study [19], BC, PC and renal cell carcinoma were separated by urinary NMR profiles in 65 men with adjustment for age only and in [7] PC was distinguished from benign prostatic hyperplasia in 20 patients per group. A pooled-sample comparison of eight urological conditions by chemical isotope labeling LC-MS also found metabolites that differed between cancer and non-cancer conditions [21]. Unlike risk-prediction studies in large PC cohorts [22], the present study used a common analytical workflow for two urological cancers and controls and focused on separating disease-related differences from those caused by exogenous signals and demographic imbalance. Without these checks, a five-compound panel would have separated BC from PC with an AUC of 0.86. After adjustment for the exogenous-signal index, the AUC fell to 0.63 and was no longer significant, and the three compounds behind the separation differed mainly in whether they were detected at all (80–100% of PC vs. 10–69% of BC samples). The three compounds remained unannotated, so the apparent difference between the two cancers could not be distinguished from the effect of exogenous signals and should not be regarded as tumor-related. This illustrates how such control can prevent false-positive findings in multi-group urinary studies.
For PC versus controls, no compound met the finding criteria, although the groups could be separated by sex alone (AUC 0.75), because all PC patients were men. This outcome is informative: an unadjusted analysis could have produced an apparently discriminating panel, whereas the workflow correctly reported no PC-specific compounds once sex, age and exogenous signals were taken into account. It is also consistent with the sampling conditions. Prostatic secretions contribute little to voided urine without prior prostate massage, which is why urinary PC tests are usually performed after digital rectal examination, and the 20 PC patients and 19 male controls allowed only large effects to be detected. Detecting PC-related urinary changes is therefore likely to require larger, sex- and age-matched groups and attention to the sampling protocol.
The present study was designed to evaluate the analytical workflow in a clinical cohort, and its conclusions should be read within this scope. All samples were analyzed in a single batch, and the age and sex structure of the groups limited the matched comparisons to 20 pairs for BC and 11 for PC. Clinical variables such as microscopic hematuria, proteinuria, renal function, medication, smoking and diet, which may influence the urinary metabolome, were not available. Urine concentration was estimated only from the metabolomic data. Spectra were acquired in positive mode only, which gave the largest number of detected and annotated peaks in preliminary experiments. Acquisition in negative mode in a separate run could add compounds that ionize preferentially as anions and support the annotation of steroid glucuronides. The annotations at MSI levels 2–3 are putative and will require confirmation with reference standards. Applying the same workflow, with acquisition in both polarities, to a larger cohort balanced by age and sex and with these variables recorded is a natural extension of this work.
5. Conclusions
The sample preparation and LC-HRMS workflow, optimized by design of experiments, gave reliable data in a clinical cohort of 94 participants with a median QC RSD of 8.6%. The data-processing algorithm, which combined grouping of ions into compounds, a check of signal origin, control of age and sex and cross-validated classification, made it possible to recognize differences related to exogenous signals and demographic imbalance and to exclude them from the findings. Compounds tentatively annotated as conjugated androgen and glucocorticoid metabolites were higher in the urine of BC patients after adjustment for age, sex and the exogenous-signal index and in matched pairs, and LysoPC(16:0) and biliverdin were also increased. A five-compound panel distinguished BC from controls with a cross-validated AUC of 0.81 (0.68 in matched pairs), an internal estimate that requires validation in an independent cohort. The apparent BC-PC difference was not confirmed after adjustment for exogenous signals, and no PC-specific compounds were found. Hematuria, medication and other clinical factors were not controlled; with these variables recorded, larger cohorts can be used to validate the steroid conjugates as candidate urinary markers of BC.
Supplementary Materials
The following supporting information can be downloaded at https://www.mdpi.com/article/10.3390/analytica7040101/s1: Figure S1: Heatmap of the 50 bladder-cancer findings with the smallest q (z-scored log2 intensities); Figure S2: Age distribution and age- and sex-matched pairs; Figure S3: Comparison of PQN and MSTUS normalization; Figure S4: Pathway enrichment analysis (mummichog); Figure S5: Members of the homologous exogenous series in methanol solvent blanks, pooled QC and urine samples; Figure S6: Homologous exogenous series used for the exogenous-signal index; Table S1: All bladder-cancer findings (BC vs. controls); Table S2: Cross-validated classification for all comparisons and models, including single-covariate baselines; Table S2b: Selection frequency of compounds across training folds; Table S3: Curated candidate annotations; Table S4: Presence/absence features compared with Fisher’s exact tests; Table S5: Compound-level statistics for all comparisons; Table S6: Sensitivity analyses; Table S7: Solvent-blank check of the homologous exogenous series; Table S8: Keyword list used to flag drug-, food- and tobacco-related compounds.
Author Contributions
Conceptualization, A.F.; methodology, A.F., M.V. and Y.I.; software, Y.I.; formal analysis, M.V.; investigation, A.F. and Y.I.; writing—original draft preparation, A.F.; writing—review and editing, A.F. and A.S.; project administration, funding acquisition, I.R. All authors have read and agreed to the published version of the manuscript.
Funding
This research was funded by the Ministry of Science and Higher Education of the Russian Federation and Lomonosov Moscow State University (No. AAAA-A21-121011590089-1 “Development of highly informative and high-tech methods of chemical analysis for the protection of ecosystems, the creation of new materials and advanced production technologies, the transition to environmentally friendly and resource-saving energy, the development of nature-like technologies, high-tech healthcare and rational use of natural resources”).
Institutional Review Board Statement
The study was conducted in accordance with the Declaration of Helsinki and approved by the Local Ethics Committee of the Medical Research and Educational Center of Lomonosov Moscow State University (protocol No. 06/25, 20 October 2025).
Data Availability Statement
The data presented in this study are available on reasonable request from the corresponding author.
Acknowledgments
The authors thank clinical collaborators from the Medical Research and Educational Center of Lomonosov Moscow State University for help with sample collection.
Conflicts of Interest
The authors declare no conflicts of interest. The funders had no role in the design of the study; in the collection, analyses or interpretation of data; in the writing of the manuscript; or in the decision to publish the results.
Abbreviations
The following abbreviations are used in this manuscript:
| AUC | Area under the receiver operating characteristic curve |
| BC | Bladder cancer |
| FDR | False discovery rate |
| LC-HRMS | Liquid-chromatography-high-resolution mass-spectrometry |
| LysoPC | Lysophosphatidylcholine |
| MSI | Metabolomics Standards Initiative |
| MSTUS | Mass spectrometry total useful signal |
| PC | Prostate cancer |
| PCA | Principal component analysis |
| PLS-DA | Partial least squares discriminant analysis |
| PQN | Probabilistic quotient normalization |
| QC | Quality control |
| ROC | Receiver operating characteristic |
| RSD | Relative standard deviation |
References
- Pereira, F.; Domingues, M.R.; Vitorino, R.; Guerra, I.M.S.; Santos, L.L.; Ferreira, J.A.; Ferreira, R. Unmasking the Metabolite Signature of Bladder Cancer: A Systematic Review. IJMS 2024, 25, 3347. [Google Scholar] [CrossRef] [Scilit]
- Want, E.J.; Wilson, I.D.; Gika, H.; Theodoridis, G.; Plumb, R.S.; Shockcor, J.; Holmes, E.; Nicholson, J.K. Global Metabolic Profiling Procedures for Urine Using UPLC–MS. Nat. Protoc. 2010, 5, 1005–1018. [Google Scholar] [CrossRef] [Scilit]
- Kdadra, M.; Höckner, S.; Leung, H.; Kremer, W.; Schiffer, E. Metabolomics Biomarkers of Prostate Cancer: A Systematic Review. Diagnostics 2019, 9, 21. [Google Scholar] [CrossRef] [Scilit]
- Fan, J.; Liang, H.; Fan, J.; Li, L.; Zhang, G.; Pei, X.; Yang, T.; He, D.; Wu, K. Diagnostic Accuracy of Cystoscopic Biopsy for Tumour Grade in Outpatients with Urothelial Carcinoma of the Bladder and the Risk Factors of Upgrading. Asian J. Urol. 2023, 10, 19–26. [Google Scholar] [CrossRef] [Scilit]
- Oto, J.; Fernández-Pardo, Á.; Roca, M.; Plana, E.; Cana, F.; Herranz, R.; Pérez-Ardavín, J.; Vera-Donoso, C.D.; Martínez-Sarmiento, M.; Medina, P. LC–MS Metabolomics of Urine Reveals Distinct Profiles for Non-Muscle-Invasive and Muscle-Invasive Bladder Cancer. World J. Urol. 2022, 40, 2387–2398. [Google Scholar] [CrossRef] [Scilit]
- Fernández-Peralbo, M.A.; Gómez-Gómez, E.; Calderón-Santiago, M.; Carrasco-Valiente, J.; Ruiz-García, J.; Requena-Tapia, M.J.; Luque De Castro, M.D.; Priego-Capote, F. Prostate Cancer Patients–Negative Biopsy Controls Discrimination by Untargeted Metabolomics Analysis of Urine by LC-QTOF: Upstream Information on Other Omics. Sci. Rep. 2016, 6, 38243. [Google Scholar] [CrossRef] [Scilit]
- Amante, E.; Cerrato, A.; Alladio, E.; Capriotti, A.L.; Cavaliere, C.; Marini, F.; Montone, C.M.; Piovesana, S.; Laganà, A.; Vincenti, M. Comprehensive Biomarker Profiles and Chemometric Filtering of Urinary Metabolomics for Effective Discrimination of Prostate Carcinoma from Benign Hyperplasia. Sci. Rep. 2022, 12, 4361. [Google Scholar] [CrossRef] [Scilit]
- Yang, Z.; Song, F.; Zhong, J. Urinary Biomarkers in Bladder Cancer: FDA-Approved Tests and Emerging Tools for Diagnosis and Surveillance. Cancers 2025, 17, 3425. [Google Scholar] [CrossRef] [Scilit]
- Fujita, K.; Nonomura, N. Urinary Biomarkers of Prostate Cancer. Int. J. Urol. 2018, 25, 770–779. [Google Scholar] [CrossRef] [Scilit]
- Saygın, H.; Bolat, S.; Kablan, D.; Yavuz, H.; Yenihan, M.K.; Kır, A.; Öztürk, A.; Doğan, A.; Şenol, O.; Doğan, H.O.; et al. Metabolic Profiling Reveals Insights Into Bladder Cancer Pathogenesis and Recurrence. Adv. Urol. 2026, 2026, 6524384. [Google Scholar] [CrossRef] [Scilit]
- Yang, M.; Liu, X.; Tang, X.; Sun, W.; Ji, Z. LC-MS Based Urine Untargeted Metabolomic Analyses to Identify and Subdivide Urothelial Cancer. Front. Oncol. 2023, 13, 1160965. [Google Scholar] [CrossRef] [Scilit]
- Issaq, H.J.; Nativ, O.; Waybright, T.; Luke, B.; Veenstra, T.D.; Issaq, E.J.; Kravstov, A.; Mullerad, M. Detection of Bladder Cancer in Human Urine by Metabolomic Profiling Using High Performance Liquid Chromatography/Mass Spectrometry. J. Urol. 2008, 179, 2422–2426. [Google Scholar] [CrossRef] [Scilit]
- Jacyna, J.; Wawrzyniak, R.; Balayssac, S.; Gilard, V.; Malet-Martino, M.; Sawicka, A.; Kordalewska, M.; Nowicki, Ł.; Kurek, E.; Bulska, E.; et al. Urinary Metabolomic Signature of Muscle-Invasive Bladder Cancer: A Multiplatform Approach. Talanta 2019, 202, 572–579. [Google Scholar] [CrossRef] [Scilit]
- García-Perdomo, H.A.; Dávila-Raigoza, A.M.; Korkes, F. Metabolomics for the Diagnosis of Bladder Cancer: A Systematic Review. Asian J. Urol. 2024, 11, 221–241. [Google Scholar] [CrossRef] [Scilit]
- Chen, C.-L.; Chen, Y.-T.; Liao, W.-Y.; Chang, Y.-S.; Yu, J.-S.; Juo, B.-R. Urinary Metabolomic Analysis of Prostate Cancer by UPLC-FTMS and UPLC-Ion Trap MSn. Diagnostics 2023, 13, 2270. [Google Scholar] [CrossRef] [Scilit]
- Zhang, T.; Watson, D.G.; Wang, L.; Abbas, M.; Murdoch, L.; Bashford, L.; Ahmad, I.; Lam, N.-Y.; Ng, A.C.F.; Leung, H.Y. Application of Holistic Liquid Chromatography-High Resolution Mass Spectrometry Based Urinary Metabolomics for Prostate Cancer Detection and Biomarker Discovery. PLoS ONE 2013, 8, e65880. [Google Scholar] [CrossRef] [Scilit]
- Sumner, L.W.; Amberg, A.; Barrett, D.; Beale, M.H.; Beger, R.; Daykin, C.A.; Fan, T.W.-M.; Fiehn, O.; Goodacre, R.; Griffin, J.L.; et al. Proposed Minimum Reporting Standards for Chemical Analysis: Chemical Analysis Working Group (CAWG) Metabolomics Standards Initiative (MSI). Metabolomics 2007, 3, 211–221. [Google Scholar] [CrossRef] [Scilit]
- Broadhurst, D.; Goodacre, R.; Reinke, S.N.; Kuligowski, J.; Wilson, I.D.; Lewis, M.R.; Dunn, W.B. Guidelines and Considerations for the Use of System Suitability and Quality Control Samples in Mass Spectrometry Assays Applied in Untargeted Clinical Metabolomic Studies. Metabolomics 2018, 14, 72. [Google Scholar] [CrossRef] [Scilit]
- Lee, S.; Ku, J.Y.; Kang, B.J.; Kim, K.H.; Ha, H.K.; Kim, S. A Unique Urinary Metabolic Feature for the Determination of Bladder Cancer, Prostate Cancer, and Renal Cell Carcinoma. Metabolites 2021, 11, 591. [Google Scholar] [CrossRef] [Scilit]
- Wang, Z.; Liu, X.; Liu, X.; Sun, H.; Guo, Z.; Zheng, G.; Zhang, Y.; Sun, W. UPLC-MS Based Urine Untargeted Metabolomic Analyses to Differentiate Bladder Cancer from Renal Cell Carcinoma. BMC Cancer 2019, 19, 1195. [Google Scholar] [CrossRef] [Scilit]
- Wang, W.-H.; Hsieh, Y.-J.; Chen, C.-L.; Chang, Y.-H.; Tsai, Y.-H.; Chang, C.-H.; Li, L.; Tu, W.-J.; Yu, J.-S.; Chen, Y.-T. A Comparative Metabolomics Study of Multiple Urological Diseases by Highly Sensitive Dansylation Isotope Labeling LC-MS. IJMS 2025, 26, 11353. [Google Scholar] [CrossRef] [Scilit]
- Chen, C.-H.; Huang, H.-P.; Chang, K.-H.; Lee, M.-S.; Lee, C.-F.; Lin, C.-Y.; Lin, Y.C.; Huang, W.J.; Liao, C.-H.; Yu, C.-C.; et al. Predicting Clinically Significant Prostate Cancer Using Urine Metabolomics via Liquid Chromatography Mass Spectrometry. World J. Mens. Health 2025, 43, 376. [Google Scholar] [CrossRef] [Scilit]
- Jordaens, S.; Zwaenepoel, K.; Tjalma, W.; Deben, C.; Beyers, K.; Vankerckhoven, V.; Pauwels, P.; Vorsters, A. Urine Biomarkers in Cancer Detection: A Systematic Review of Preanalytical Parameters and Applied Methods. Int. J. Cancer 2023, 152, 2186–2205. [Google Scholar] [CrossRef] [Scilit]
- Stevens, V.L.; Hoover, E.; Wang, Y.; Zanetti, K.A. Pre-Analytical Factors That Affect Metabolite Stability in Human Urine, Plasma, and Serum: A Review. Metabolites 2019, 9, 156. [Google Scholar] [CrossRef] [Scilit]
- Keller, B.O.; Sui, J.; Young, A.B.; Whittal, R.M. Interferences and Contaminants Encountered in Modern Mass Spectrometry. Anal. Chim. Acta 2008, 627, 71–81. [Google Scholar] [CrossRef] [Scilit]
- Postnikov, P.V.; Polosin, A.V.; Mochalova, E.S.; Fedorina, L.I.; Efimova, Y.A. Quantitative Evaluation of Meldonium by HPLC–MS/MS in Meat of Animals Injected with Emidonol® and Urine Samples of Volunteers after Consumption of This Meat in Food. Fine Chem. Technol. 2026, 21, 448–458. [Google Scholar] [CrossRef] [Scilit]
- Frolova, A.; Vokuev, M.; Ikhalainen, Y.; Prosuntsova, D.; Rodin, I. A Systematic DoE Approach for Optimizing Urinary LC-HRMS Metabolomics: Enhancing Reliability in Bladder Cancer Profiling. Anal. Bioanal. Chem. 2026, 418, 6169–6184. [Google Scholar] [CrossRef] [Scilit]
- Dieterle, F.; Ross, A.; Schlotterbeck, G.; Senn, H. Probabilistic Quotient Normalization as Robust Method to Account for Dilution of Complex Biological Mixtures. Application in1 H NMR Metabonomics. Anal. Chem. 2006, 78, 4281–4290. [Google Scholar] [CrossRef] [Scilit]
- Liu, X.; Cheng, X.; Liu, X.; He, L.; Zhang, W.; Wang, Y.; Sun, W.; Ji, Z. Investigation of the Urinary Metabolic Variations and the Application in Bladder Cancer Biomarker Discovery. Int. J. Cancer 2018, 143, 408–418. [Google Scholar] [CrossRef] [Scilit]
- Kim, W.T.; Yun, S.J.; Yan, C.; Jeong, P.; Kim, Y.H.; Lee, I.-S.; Kang, H.-W.; Park, S.; Moon, S.-K.; Choi, Y.-H.; et al. Metabolic Pathway Signatures Associated with Urinary Metabolite Biomarkers Differentiate Bladder Cancer Patients from Healthy Controls. Yonsei Med. J. 2016, 57, 865. [Google Scholar] [CrossRef] [Scilit]
- Jin, X.; Yun, S.J.; Jeong, P.; Kim, I.Y.; Kim, W.-J.; Park, S. Diagnosis of Bladder Cancer and Prediction of Survival by Urinary Metabolomics. Oncotarget 2014, 5, 1635–1645. [Google Scholar] [CrossRef] [Scilit]
- Wu, C.; Wei, X.; Huang, Z.; Zheng, Z.; Zhang, W.; Chen, J.; Hong, H.; Li, W. Urinary Microbiome Dysbiosis Is Associated with an Inflammatory Environment and Perturbed Fatty Acids Metabolism in the Pathogenesis of Bladder Cancer. J. Transl. Med. 2024, 22, 628. [Google Scholar] [CrossRef] [Scilit]
- Wang, R.; Kang, H.; Zhang, X.; Nie, Q.; Wang, H.; Wang, C.; Zhou, S. Urinary Metabolomics for Discovering Metabolic Biomarkers of Bladder Cancer by UPLC-MS. BMC Cancer 2022, 22, 214. [Google Scholar] [CrossRef] [Scilit]

Disclaimer/Publisher’s Note: The statements, opinions and data contained in all publications are solely those of the individual author(s) and contributor(s) and not of MDPI and/or the editor(s). MDPI and/or the editor(s) disclaim responsibility for any injury to people or property resulting from any ideas, methods, instructions or products referred to in the content. |
© 2026 by the authors. Licensee MDPI, Basel, Switzerland. This article is an open access article distributed under the terms and conditions of the Creative Commons Attribution (CC BY) license.