


Abstract
Metabolomic aging clocks—quantitative models that estimate biological age based on small-molecule profiles in biological fluids—have become dynamic tools for assessing individual aging trajectories and predicting the risk of age-related diseases. Although NMR-based approaches have been previously reviewed, the analytical landscape of mass spectrometry (MS)-based metabolomic clocks has not been systematically assessed. This review examines the key components of the MS-based analytical workflow underlying the development of metabolomic aging clocks, including biological matrix selection, chromatographic separation strategies, MS instrumentation, data preprocessing, metabolite annotation, and machine learning-based modeling approaches. Twelve published studies on MS-based metabolomic clocks were identified and systematically compared. These clocks provide predictions of chronological age with mean absolute errors of 3.5–10 years and demonstrate robust associations between metabolomic age acceleration and cardiometabolic risk, frailty, and mortality. Recurrent age-related metabolite classes include tryptophan–kynurenine pathway metabolites, acylcarnitines, sphingolipids, modified nucleosides, and tricarboxylic acid (TCA) cycle intermediates. Currently, liquid chromatography with electrospray ionization (LC-ESI) coupled to high-resolution QTOF or Orbitrap instruments dominates current workflows, with elastic net regression being the most commonly applied modeling strategy. Significant heterogeneity in analytical conditions, incomplete methodological descriptions, and limited cross-study validation remain key obstacles to clinical application. Standardization of pre-analytical protocols, the use of certified reference materials, and harmonized validation frameworks are identified as critical priorities for advancing mass spectrometry-based metabolomic clocks toward clinical translation.
1. Introduction
Over the past two decades, approaches to assessing disease development and aging using so-called molecular clocks have been actively developing [1,2]. These clocks are created by analyzing various biological samples (e.g., blood, saliva, and tissues) representing molecular changes accumulated over time in people of different ages or at different stages of a pathological process [3,4]. Machine learning methods and various statistical approaches are applied to these data, enabling the development of a model for matching molecular patterns with chronological age (first-generation clocks) [3,4] or for predicting health-related outcomes (second-generation clocks) [5,6,7].
Analysis based on molecular clocks may not only indicate the individual rate of aging, which is unique to each person, but also help predict the potential slowing of aging, assesses the likelihood of age-related diseases (cardiovascular disease, diabetes, dementia, etc.) before the first symptoms appear, identify lifestyle factors that influence changes in the rate of aging, and support the selection of individual drug dosages and treatment regimens taking into account the cellular pace of aging [1,6,8,9].
Several types of molecular aging clocks have been described, including epigenetic [3,4,6], transcriptomic [10,11], proteomic [12,13], metabolomic [14,15,16], and others [17,18]. Metabolomic aging clocks are quantitative models that estimate biological age from profiles of small molecules measured in biological fluids (plasma, serum, whole blood, urine, saliva, etc.). Since the metabolome reflects current metabolism in the body, it is an integrated outcome of genome–environment interactions, with rapid responsiveness to lifestyle changes (diet, physical activity, stress, and environmental pollution) as well as to disease onset or drug effects. This distinguishes metabolomic clocks from, for example, DNA methylation based epigenetic clocks, which reflect more stable, but still changeable, epigenetic modifications [15]. At the same time, this dynamic nature may make metabolomic clocks more vulnerable to preanalytical variability (fasting status, circadian time, and sample processing), technical batch effects, and analytical heterogeneity across platforms and laboratories [19]. Moreover, the chemical diversity of metabolites can complicate the interpretation of results and hinder the implementation of metabolomic clocks as standardized clinical assays [20,21].
Metabolomic clocks are typically built on data obtained by NMR [14,16,22] or MS [23,24,25] methods. Considerable attention is also paid to the choice of algorithms used to build predictive models [15,26]. The advantages and disadvantages of NMR-based metabolomics, including its application to aging clocks, have already been discussed in a number of reviews [2,27]. This review focuses on mass spectrometry (MS)-based analytical workflows. MS-based approaches, especially when combined with chromatographic separation, enables the detection of hundreds to thousands of individual metabolites or metabolic features; however, these methods are highly dependent on analytical conditions. Therefore, this review focuses on the main components of the analytical workflow: sample type and preparation, chromatographic separation, MS instrumentation and data acquisition, data processing and clock modeling, the use of analytical standards and reference materials, as well as practical challenges and future directions.
2. Current Landscape of MS-Based Metabolomic Aging Clocks
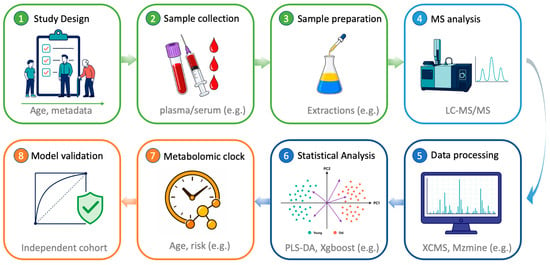
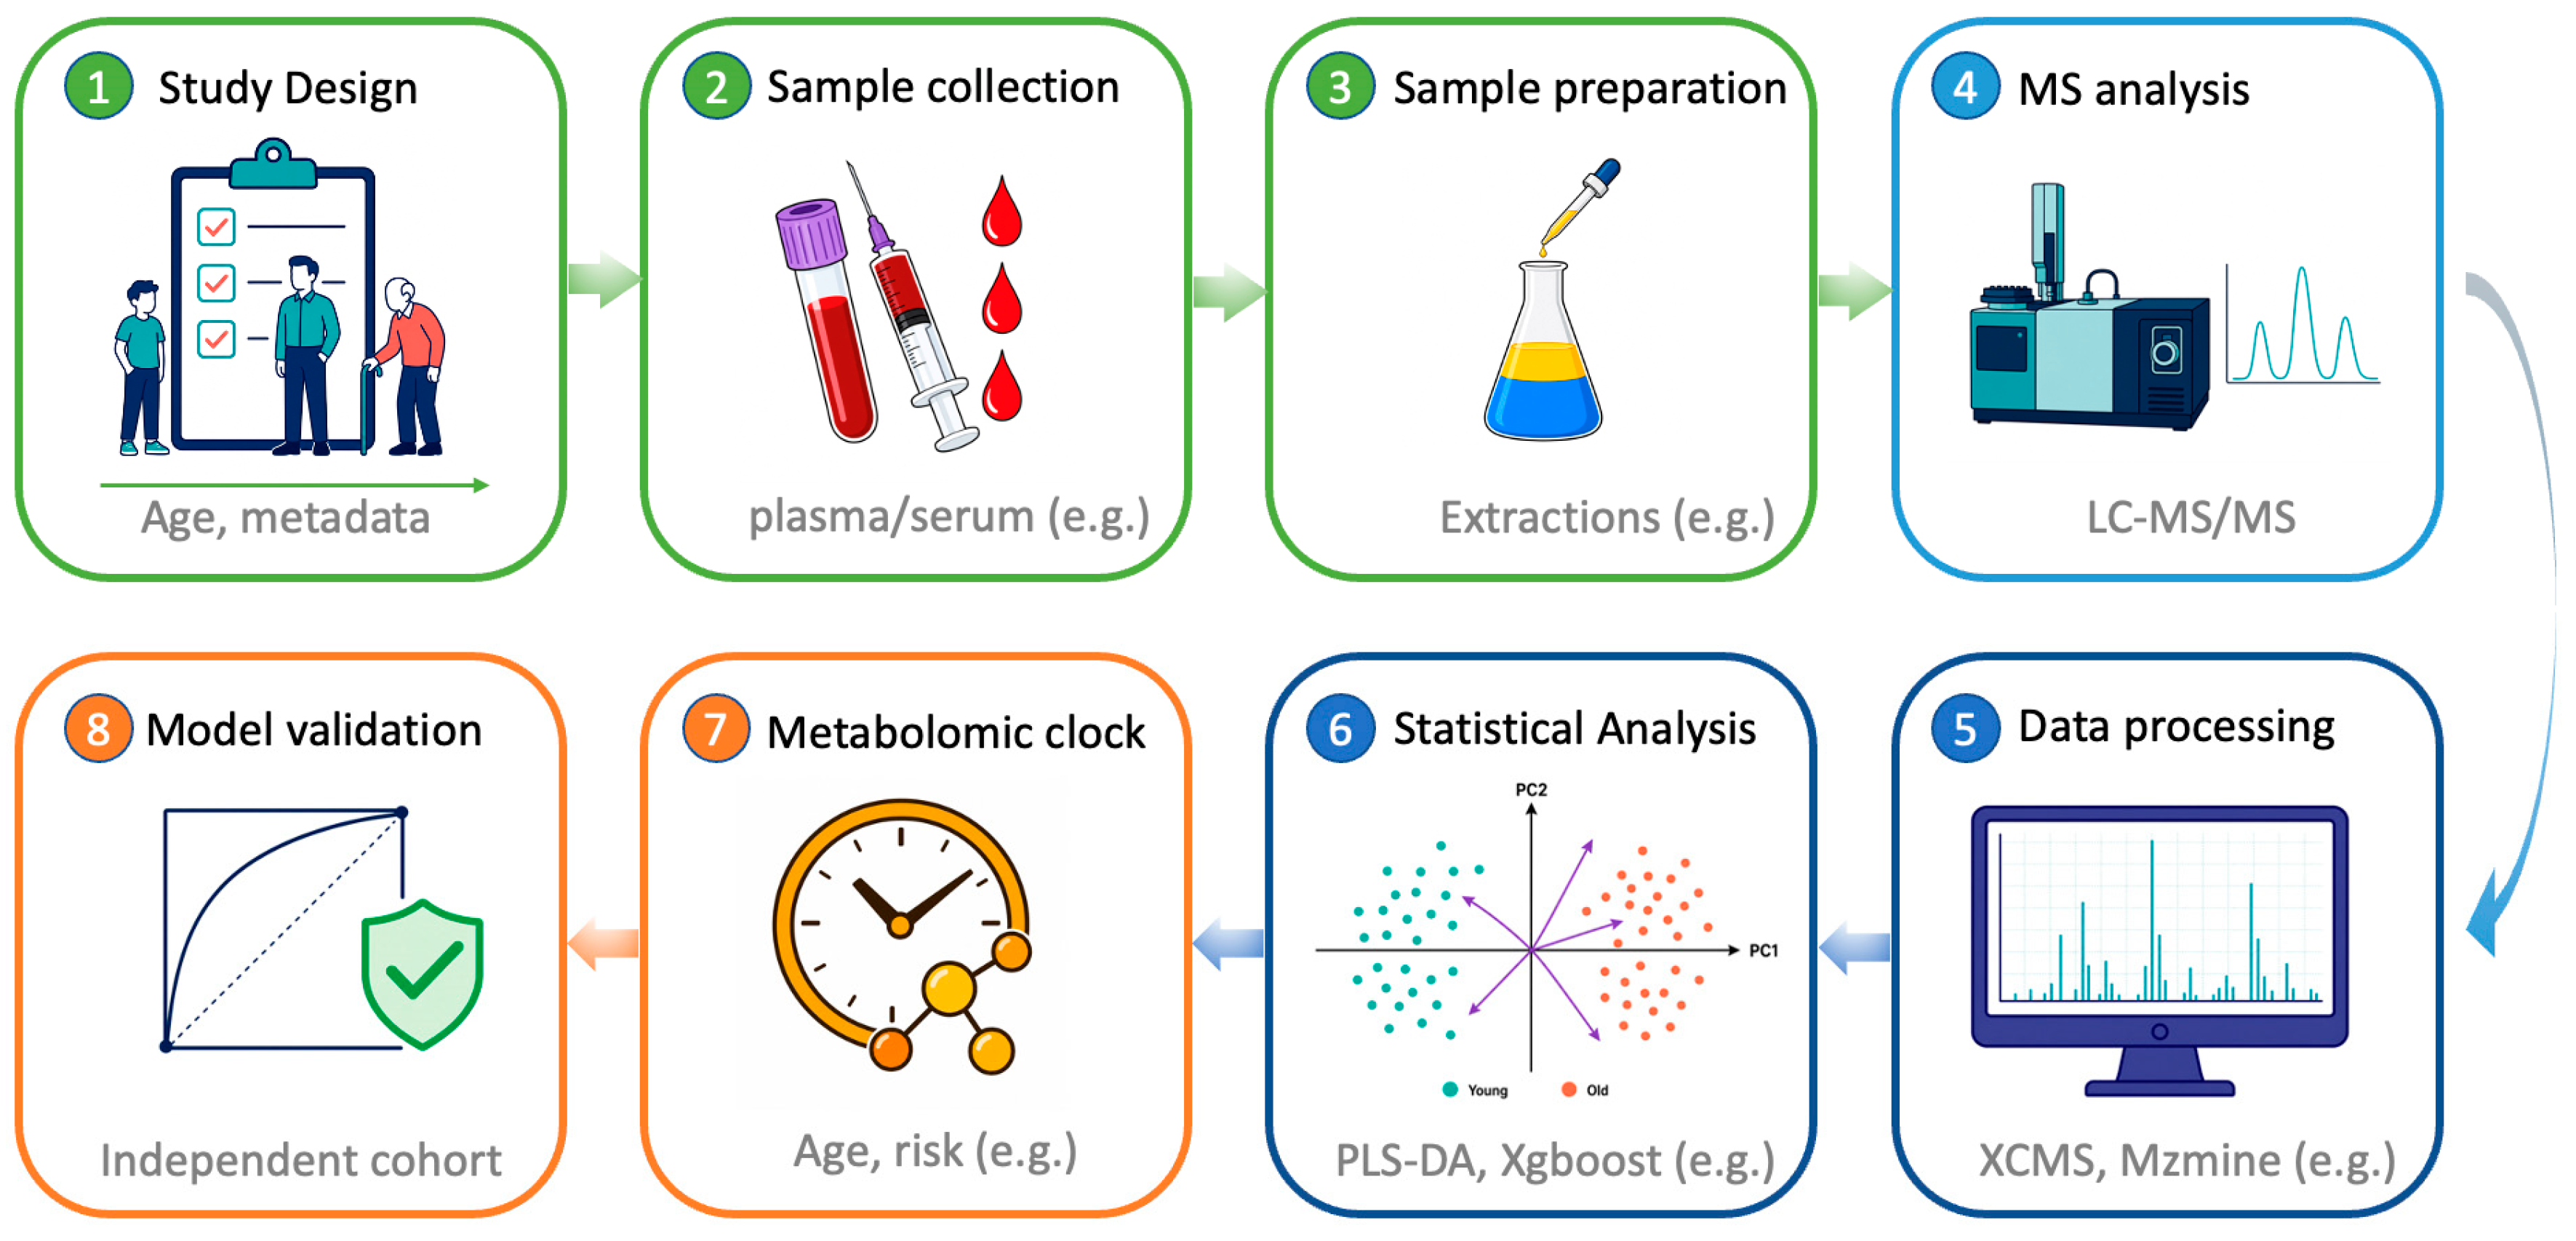
One of the first explicit implementations of a clock-like metabolomic model is considered to be the work by Hertel et al., in which a continuous “metabolic age score” was constructed from the urine metabolome as an estimate of biological age [14]. Although this early model was based on NMR data, subsequent metabolomic aging clocks have also been developed using MS-based workflows. MS-based metabolomic clocks have been reported to predict chronological age with median absolute errors ranging from 3.5 to 10 years, depending on the platform, biological fluid, and cohort [23,24,25,28,29]. Deviations between predicted and chronological age (metabolomic age acceleration) have also been associated with cardiometabolic risk factors, multimorbidity, frailty, and mortality, indicating that metabolomic clocks may be comparable with other indicators of aging rates [25,30]. In general, the development of MS-based metabolomic clocks comprises all the classic stages of a metabolomic study (Figure 1).
Figure 1.
Scheme of a metabolomic study for creating metabolomic clocks. Main phases—Pre-analytical (green), Analytical (light blue), Computational (blue) and Modeling (orange).
2.1. Selection of Studies for Analysis
A literature search was performed in PubMed using the keywords (metabolomic OR metabolomics) AND (aging OR ageing), “(metabolomic OR metabolomics) AND (“biological age” OR “aging clock” OR “age prediction”)”. In this work we focused on 13 publications that employ mass spectrometry approaches and are positioned as metabolomic clocks. Table 1 summarizes the key characteristics of these studies: cohort size, type of biological sample for analysis, analytical platform, data analysis algorithms, and main accuracy metrics. Although the study by Macdonald-Dunlop et al. [31] does not focus specifically on metabolomic clocks in the narrow sense, it presents a comprehensive catalog of omics aging clocks reported by 2022, including MS-based metabolomic and lipidomic clocks built and compared in the ORCADES cohort (n ~ 1000, Orkney Islands, Scotland; age 16–100 years, median follow-up ~12 years). The authors built 11 custom clocks (9 omics platforms) and included 4 published ones [31], enabling direct comparison on the same sample set.
Table 1.
Key characteristics of metabolomic clocks based on mass spectrometry.
2.2. Biological Matrix for Analysis and Cohorts
Sample sizes in the construction of metabolomic clocks range from hundreds [32] to near 10,000 individuals [24], and follow-up duration spans from single cross-sectional studies [24] to multi-year longitudinal projects [30]. Such variability strongly affects statistical power and the ability to link biological age deviation with endpoints such as morbidity and mortality [28].
Clocks based on plasma or serum are more common, primarily because blood samples are relatively easy to collect (Table 1). Most samples were collected in a fasting state using standardized sample preparation protocols, including protein precipitation with methanol or extraction with a solvent mixture.
Whole blood-based clocks were built using data from routine toxicological screening by UHPLC-QTOF on nearly 10,000 forensic samples [24]. In that study, chronological age prediction achieved a mean absolute error of approximately 5.88 years and a high correlation (r ≈ 0.79) between predicted and actual age, demonstrating robustness even for uncontrolled, non-fasting and batch-heterogeneous data. Samples were analyzed directly after simple dilution, bypassing traditional sample preparation, confirming the resilience of metabolomic clocks to minimal preanalytical processing and their applicability to routine clinical sample workflows [24]. Urine and serum analysis were used in the Airwave police cohort to extend coverage by applying complementary NMR and UHPLC-MS platforms [23]. Cerebrospinal fluid (CSF)-based clocks focus on the central nervous system (CNS), delineating metabolic pathways particularly relevant to neurodegeneration, albeit in smaller cohorts due to the invasiveness of sampling [32].
2.3. Strategies for Modeling Metabolomic Clocks
Three main modeling strategies can be distinguished:
- Age-trained clocks, where chronological age is the regression target variable. Examples include the Airwave metabolomic age model [23], the Danish forensic UHPLC-QTOF-based clock [24], the CSF-based clock [32], the LLFS age signature [28], the compact PhysiAge clock [37], plasma clocks on the Metabolon platform [29], and the Shanghai age model [36].
- Health- or frailty-trained clocks, which target an aging phenotype such as the Frailty Index rather than age, as in the case of SweetSpotClock, trained on variance-selected health-related metabolites in the CLSA cohort [25]. SweetSpotClock used a two-stage approach: first, metabolites most variable with the frailty index were selected, then a model predicting the index itself was built [25].
- Mortality-trained clocks, where the target variable is the risk of death rather than age. Examples include metabolomic risk scores trained on all-cause mortality in plasma studies on the Metabolon platform, or the MetaboAgeMort developed in the UK Biobank [29,30].
Age-trained clocks generally provide more accurate chronological age prediction, whereas frailty- or mortality-trained clocks often show stronger associations with morbidity and survival, at the cost of a lower raw correlation with age.
The fundamental question of whether different omics clocks reflect a single biological age or complementary components thereof was investigated in [31]. Analysis of the overlap in variance explained for chronological age showed that 94.9% of age variability is explained by two or more clocks simultaneously, and MS-metabolomic and MS-lipidomic omics clock age acceleration (OCAA) estimates cluster together—closer to lipidomic rather than epigenetic biology. This indicates that the training strategy (on age, frailty, or mortality) should be chosen depending on the target application, since different omics platforms capture different, albeit largely overlapping, aspects of aging [31].
3. Key Metabolite Classes and Metabolic Pathways in Metabolomic Clocks
This section examines the key metabolic pathways identified in MS-based metabolomic clocks.
3.1. Amino Acid and Tryptophan–Kynurenine Metabolism
Many clocks point to age-associated changes in aromatic amino acids, especially tryptophan and metabolites of its kynurenine pathway [23,24,30,32,33].
Studies related to longevity (including LLFS) report an age-related decline in tryptophan and an increase in kynurenine, with the kynurenine/tryptophan ratio associated with mortality and extreme longevity [28,30]. In LLFS, each year of age was associated with an ~0.4% increase in kynurenine and a 0.6% decrease in tryptophan, adjusted for sex and generation [28].
A large-scale blood study using UHPLC-QTOF identified that serotonin and microbial indole metabolites (indole-3-aldehyde, indole-3-methylacetate) showed consistent negative correlations with age, while kynurenine was positively correlated [24].
CSF-based clocks [32], the plasma LLFS study [28], and SweetSpotClock [25] all highlight tryptophan and tyrosine metabolism either in multivariate models or in pathway enrichment, underscoring the central role of this axis in systemic and CNS aging. In the CSF clocks, kynurenine and quinolinic acid were elevated, while serotonin and 5-hydroxyindoleacetic acid were decreased [32]. Furthermore, in longevity cohorts (LLFS, NECS) and in the ‘Sweet Spot’ clocks, metabolites linked to the tryptophan–kynurenine–NAD+ pathway were enriched in signatures of slowed aging and resilience. This connects the observed shifts to the age-related decline in NAD+ levels and mitochondrial dysfunction, as well as to the potential for correction through the use of NAD+ precursors [25,30].
Collectively, these data support a model in which chronic low-grade inflammation and immune activation increase flux through the kynurenine pathway with downstream effects on vascular health, neurodegeneration, and frailty [24,28,30,33].
3.2. Lipid Metabolism and Acylcarnitines
Lipidomic signatures recur across studies, often including acylcarnitines, sphingolipids, and polyunsaturated fatty acids [24,28,29,30,33]. The Danish UHPLC-QTOF study identifies medium-chain acylcarnitines (e.g., decanoylcarnitine, C10) among the strongest predictors: their levels increase consistently with age (positive Spearman correlations across the lifespan) and are linked to cardiometabolic diseases including type 2 diabetes and cardiovascular disease [24].
The LLFS and NECS analyses highlight essential fatty acids (linoleic, α-linolenic) and complex lipids (phosphatidylcholines, sphingomyelins) as central hubs connecting multiple age-associated pathways; moreover, long-lived individuals display distinctive profiles that may represent compensatory adaptations rather than simple deterioration [28,30]. In LLFS, linoleic acid increased by ~0.3% per year and a 1-SD increase from the mean was associated with an 8% reduced mortality risk; notably, no metabolite was significantly different in offspring of long-lived families compared to control spouses [28].
MS-based fatty acid clocks (shotgun lipidomics/LC-MS/MS, 44 fatty acids) and MS-based complex lipid clocks (Metabolon, 908 features) in the ORCADES cohort [31] show r = 0.45 and r = 0.70 with age, respectively. Both clock types cluster together with MS metabolomic clocks by the OCAA pattern, indicating a common lipid substrate of biological age. DEXA and UPLC IgG glycomic clocks were associated with the greatest number of risk factors (4 at FDR < 10%), whereas the MS lipidomic OCAA showed nominal associations with all considered risk factors, including BMI and cholesterol. Interestingly, the fatty acid-based OCAA (MS Fatty Acids Lipidomics) demonstrated a unique pattern: minimal overlap with MetaboAge (excess overlap <0)—the only negative pair, indicating the complementarity of these two approaches [31].
The INTERVAL/NEO clocks include several lipid-related biomarkers (lipoprotein particle sizes, cholesterol esters, triglyceride fractions) that improve mortality risk prediction over standard risk factors [34].
These lipid changes likely reflect both impaired mitochondrial beta-oxidation (acylcarnitines) and membrane remodeling under inflammatory and oxidative stress, with the LLFS data pointing to the potential of nutritional interventions (e.g., intake of essential fatty acids) [24,30,33].
3.3. Nucleosides, Energy Metabolism, and Redox Status
Several clocks highlight modified nucleosides, tricarboxylic acid (TCA) cycle intermediates, and redox-active compounds [23,28,30,33].
The LLFS study identifies N2,N2-dimethylguanosine and other modified nucleosides as strongly associated with age and mortality, possibly marking cumulative RNA damage and nucleotide turnover [28]. N2,N2-dimethylguanosine increased by ~1.0% per year and was an independent predictor of mortality [28].
Plasma citrate, malate, and other TCA cycle intermediates are associated with markers of slowed aging in PhysiAge and are included in a compact nine-metabolite clock (including citrate, malate, acetoacetate, glycine, creatinine, etc.) that achieves high age prediction accuracy (MAE ~5 years) [37]. A 1 SD increase in citrate corresponded to a 2–3 years deceleration in metabolomic age [37].
Protective antioxidants such as ergothioneine and taurine frequently show a negative association with age or age acceleration and are enriched in extreme longevity signatures [28,30]. In LLFS, ergothioneine decreased by ~1.5% per year and was among the strongest protective markers: each 1-SD decrease from the mean was associated with a 33% higher mortality risk [28].
These findings underscore those clocks do not merely measure ‘wear and tear’ but also reflect adaptive and compensatory responses, with some metabolites indicating resilience rather than damage.
3.4. Xenobiotics and Exposome-Related Metabolites
Untargeted MS platforms systematically detect drug metabolites (e.g., salicylate, ibuprofen) and environmental exposures (e.g., cotinine as a smoking marker), which can substantially contribute to age prediction and age acceleration metrics [34]. Faquih et al. report that including xenobiotics improves age prediction and strengthens associations with obesity and cardiovascular disease, reflecting the impact of medication use and lifestyle factors on metabolomic profiles [34]. This raises important questions about how to construct clocks for different use cases: forensic or general-risk clocks may benefit from including xenobiotics, while intervention-sensitive or mechanistically interpretable clocks may deliberately down-weight or exclude such markers to focus on endogenous metabolism.
4. Chromatographic Separation and Mass Spectrometric Equipment in LC-MS-Based Clocks
For several metabolomic aging-clock studies, the original publications did not provide complete chromatographic and mass spectrometric conditions. Relevant methodological details were sometimes provided indirectly through references to earlier publications, external protocols, or commercial metabolomics platforms, such as Metabolon. Despite careful examination of the available materials, including primary articles, supplementary files, and cited methodological sources, some experimental parameters remained unavailable. This incomplete reporting limited the assessment of analytical performance and reproducibility. In this review, details that could not be verified were therefore considered not reported and were not used for direct comparisons among workflows.
Across the reviewed MS-based metabolomic aging-clock studies, only electrospray ionization (ESI) and closely related variants were reported. Other ionization techniques applied in metabolomics, including atmospheric pressure chemical ionization (APCI), matrix-assisted laser desorption/ionization (MALDI), and electron ionization (EI), have not yet been used for the construction of MS-based metabolomic aging clocks. The prevalence of ESI is consistent with its suitability for introducing aqueous and organic extracts into a mass spectrometer, either directly, as in flow-injection analysis (FIA), or after LC separation [38]. ESI is one of the most versatile ionization techniques used in metabolomics, enabling the detection of a broad range of polar, moderately polar, and lipid-like metabolites [39,40]. At the same time, ionization efficiency strongly depends on analyte properties, matrix composition, coelution, and ion suppression; therefore, a single ESI method cannot provide comprehensive and uniform coverage of the metabolome.
The absence of MALDI- and EI-based aging clocks may partly reflect practical limitations of these methods, which become particularly relevant in large-scale untargeted metabolomics. MALDI is compatible with high-throughput workflows; however, small-molecule profiling remains challenging because of the poor reproducibility of signal intensities, heterogeneous matrix crystallization, the lack of separation before ionization, matrix-derived background signals, and ion suppression [41,42]. Nevertheless, MALDI remains an important tool in spatial metabolomics, enabling the label-free mapping of metabolites and lipids directly in tissue sections [43,44]. By contrast, EI provides highly reproducible fragmentation spectra that can be searched against extensive reference databases, making it one of the most reliable approaches for tentative compound identification in screening studies [45]. However, EI is most commonly implemented within gas chromatography—mass spectrometry (GC-MS) workflows, which generally require analytes to be volatile and thermally stable [46,47]. Many metabolites can be converted into GC-amenable derivatives, and this strategy is widely used for several classes of polar organic compounds, including amino acids, sugars, fatty acids, and steroids [48]. Nevertheless, derivatization introduces an additional sample-preparation step, increases the total analysis time, and may reduce analytical reproducibility.
Among the available ionization techniques, APCI represents a practical complementary approach to existing ESI-based aging-clock workflows. APCI can improve the ionization of relatively nonpolar compounds and may therefore expand the range of detectable metabolites [49]. Combining ESI and APCI could, in principle, increase metabolome coverage and reveal additional age-associated compounds that are poorly detected by ESI alone. However, this strategy would generally require separate acquisitions and would consequently increase method complexity, acquisition time, and overall cost. The practical value of combined ESI-APCI workflows for metabolomic aging-clock development remains to be systematically evaluated.
Although a relatively small number of studies have focused specifically on MS-based metabolomic aging clocks, the available reports already show considerable diversity in chromatographic conditions and separation strategies. This diversity likely reflects a fundamental compromise between metabolite identification confidence, biochemical coverage, quantitative reliability, and overall analytical throughput.
At one end of this spectrum are targeted LC-MS/MS methods, which can provide high confidence in metabolite identification and quantification, particularly when precursor/product ion transitions, retention times, calibration procedures, and matrix effects are carefully evaluated and validated. However, analyte coverage is limited to a predefined set of compounds, and method development depends on the availability of authentic standards and requires careful optimization. As a result, targeted LC-MS/MS is less suitable as a primary discovery strategy when the relevant aging-associated metabolites have not yet been defined. This may partly explain why targeted LC-MS/MS was underrepresented in the reviewed studies; it was applied in only two cases to quantify 203 metabolites in CSF [32] and 44 fatty acids in blood plasma [31]. In both studies, quantification was based on predefined precursor/product ion transitions acquired in multiple-reaction monitoring (MRM) mode. Although internal standards were used in both studies, the limited methodological descriptions did not specify whether isotopically labeled compounds were employed. Such standards are commonly used to compensate for extraction losses, matrix effects, and variations in instrumental response. In targeted LC-MS/MS workflows, analytical performance depends primarily on the selectivity of chromatographic separation and the specificity of the selected MRM transitions rather than on high mass resolving power or accurate-mass measurement. This allows the use of more widely available unit-resolution triple-quadrupole or QTRAP instruments. Thus, targeted LC-MS/MS provides high analytical specificity and quantitative confidence, but its coverage is restricted to compounds included in the original assay design.
At the opposite end of this spectrum are methods that minimize chromatographic separation to maximize sample throughput, for example by replacing LC separation with FIA [36]. In such workflows, broad mass spectral information can be acquired rapidly, but the absence of chromatographic separation reduces analytical selectivity. To partly compensate for this limitation, ultra-high-resolution mass spectrometry with a resolving power of approximately 140,000 was used in an FIA-MS-based approach [36]. Such resolving power improves the discrimination of ions with closely spaced m/z values. However, reliable assignment of elemental formulas requires not only high resolving power but also high mass accuracy, which depends on appropriate calibration. Nevertheless, even high resolving power and mass accuracy cannot fully overcome matrix effects, ion suppression or the inability to distinguish structural isomers and other compounds with identical elemental compositions. The absence of chromatographic separation therefore introduces additional ambiguity during feature extraction and annotation. These limitations can be partly mitigated by preserving LC separation while substantially shortening the analytical cycle, as demonstrated by rapid-LC-MS approaches [33]. However, sub-minute chromatographic runs inevitably reduce peak capacity compared with conventional LC separations and therefore increase the risk of coelution and ambiguous feature assignment. In the rapid-LC-MS study, ion mobility separation before MS detection provided an additional dimension and increased analytical selectivity under high-throughput conditions [33]. Ion mobility is particularly useful when chromatographic separation is deliberately shortened because coeluting isobaric ions may have different collision cross-section values. These examples illustrate alternative routes toward large-scale metabolomic profiling, but they remain exceptions rather than general tendencies in current MS-based metabolomic aging-clock studies.
Most MS-based metabolomic aging-clock studies fall between these two extremes and use untargeted LC-MS workflows with conventional chromatographic separation (Table 2). The human metabolome contains thousands of compounds that differ substantially in structure, polarity, abundance, and ionization behavior. Consequently, no single LC method can provide optimal retention, resolution, and detection conditions for all analytes. Untargeted LC-MS workflows therefore typically include complementary chromatographic separation, with conditions optimized for one of three broad groups of analytes: polar metabolites, semi-polar compounds, and nonpolar lipid species (Table 2). Offline sample fractionation was not reported in the reviewed studies; instead, broader metabolome coverage was sometimes achieved by analyzing separate sample aliquots using complementary chromatographic methods within the same study.
Table 2.
LC-MS and reduced-separation MS workflows used in MS-based aging-clock studies.
For polar and hydrophilic metabolites, HILIC was the dominant separation mode [23,25,28,29,30,31,32,34]. In most studies, separation was performed on amide-bonded ethylene-bridged hybrid (BEH) phases [25,29,30,31,32,34], whereas alternative materials, such as polymer-based zwitterionic phases [28], were used only occasionally. In all cases, the mobile-phase compositions followed the typical HILIC paradigm, with gradients beginning at a high proportion of organic solvent, usually approximately 90–95% acetonitrile or methanol, followed by a gradual decrease to 5–50% during elution. Volatile ammonium salts were commonly used to provide MS-compatible buffers, adjust pH, and support ionization while reducing the risk of ion-source contamination compared with nonvolatile salts [50]. Most HILIC methods were relatively fast, with reported cycle times of 15 min or less [23,25,29,30,31,34]. A notable outlier was the CSF-based aging-clock study [32], in which the relatively small cohort size of fewer than 200 individuals may have allowed the authors to prioritize chromatographic resolution over throughput, resulting in a long 70 min run.
Reversed-phase (RP) LC was the main approach for separating semi-polar metabolites [23,24,25,30,31,34,35]. All reported methods used gradient elution, typically starting under highly aqueous conditions and ending with acetonitrile- or methanol-rich mobile phases containing no more than a few percent of water. As in HILIC methods, volatile ammonium salts were used as MS-compatible additives. Separations were performed on C18 phases; BEH-based particles [24,25,30,31,34,35] were used more frequently than conventional silica-based materials [23]. All reported RP methods were fast, with chromatographic cycle times ranging from 11 to 15 min, consistent with the emphasis on analytical throughput in studies involving thousands of individuals. Such short gradients may reduce peak capacity and increase the risk of coelution; however, objective measures of separation quality were generally not reported and therefore could not be compared across workflows.
RP-LC methods designed for more hydrophobic metabolites and lipidomic applications also relied on C18 stationary phases [23,25,28,29,30,31,34]. Their main distinction from RP methods applied to semi-polar metabolites was the mobile-phase composition. In dedicated lipidomics workflows, highly hydrophobic lipids were eluted toward the end of the gradient, when the mobile phase was enriched with an isopropanol/acetonitrile mixture. These workflows were relatively slow, with reported chromatographic cycle times of approximately 20–30 min [23,28,29]. By contrast, the Metabolon platform, used in approximately one third of the reviewed studies [25,30,31,34], employed a method based on an equivolumetric methanol/acetonitrile organic phase. The proportion of this organic phase increased from 60% at the beginning of the gradient to nearly 100% at the end. This strategy enabled substantially faster acquisition, with a reported run time of only 3.5 min; however, this value does not include re-equilibration and is therefore not directly comparable with the dedicated lipidomics workflows described above.
The reported MS settings did not show a clear association with the chromatographic workflows discussed above, including HILIC, RP-LC, and lipid-focused methods. Across the reviewed studies, untargeted metabolomic aging clocks were generally based on high-resolution mass spectrometry, most commonly using quadrupole time-of-flight (QTOF) [23,24,28,32,34,35] or Orbitrap [25,29,30,31,34] instruments. This choice is consistent with the requirements of untargeted metabolomics, where accurate-mass measurement and reproducible feature extraction are central analytical requirements [51]. The Orbitrap mass spectrometers used within the Metabolon platform were operated at a resolving power of approximately 35,000, whereas studies employing QTOF instruments reported values of up to approximately 20,000. However, direct comparison is limited in part because resolving power varies differently with m/z for Orbitrap and QTOF mass analyzers. Overall, moderate resolving power appeared sufficient for conventional LC-MS workflows. Details of mass calibration were rarely reported, and the mass accuracy achieved under the actual analytical conditions was generally not specified. Although mass-error tolerances of approximately 5–10 ppm were commonly applied during feature annotation, these values represent data-processing criteria and should not be interpreted as direct measures of instrumental mass accuracy. In most untargeted studies, the data matrix used for model development was generated primarily from MS1 features, whereas tandem mass spectra, when acquired, were mainly used to support tentative metabolite annotation, spectral-library matching, or structural confirmation.
Ion polarity was also not systematically linked to chromatographic mode. Positive- and negative-ion acquisition were reported across HILIC, RP-LC, and lipid-focused workflows. Positive-ion mode was particularly common in lipidomic analyses, although negative-ion acquisition was also used in some studies to broaden chemical coverage. In non-lipid metabolomic workflows, positive- and negative-ion modes were used with comparable frequency, reflecting their complementary contributions to metabolome profiling [52]. The use of both ion polarities broadens metabolome coverage but usually requires two separate runs, thereby increasing costs, extending acquisition time, and adding methodological complexity.
Overall, the reviewed studies show that the selection of analytical methods for metabolomic aging-clock development presents a trade-off between analytical reliability and throughput. On the one hand, broad metabolite coverage, reproducible detection, and sufficient annotation confidence are required to acquire chemically informative data for model development. On the other hand, generalization and validation of aging clocks require very large cohorts, which imposes practical constraints on analysis time. At present, LC separation coupled with ESI-based high-resolution MS detection represents the dominant practical compromise. This approach offers broad metabolite coverage while preserving sufficient chromatographic selectivity for feature extraction and metabolite annotation. Importantly, the same LC-MS configuration can be adapted to different analyte classes by modifying the stationary phase and mobile-phase composition, allowing the analytical focus to be shifted toward polar metabolites, semi-polar compounds, or less polar lipid-like species.
5. Data Processing, Metabolite Annotation, and Clock Modeling
The construction of metabolomic clocks is not merely the application of a machine learning algorithm to a ready-made matrix of concentrations, but a multi-step analytical pipeline in which the result critically depends on the quality of the preceding steps. The complexity of metabolomic data—high noise levels, instrumental drift, a substantial proportion of unidentified signals, and multicollinearity of features—requires specialized solutions at each stage: from feature extraction and batch-to-batch alignment to bioinformatic compound annotation. The choice of identification strategy (targeted panel with reference standards, untargeted approach with library search, or hybrid AI pipelines) directly determines the interpretability of the clock and the possibility of its transfer between studies. In turn, the choice of model architecture (linear regularized regression, tree ensembles, or deep neural networks) and the method of validation affects the balance between prediction accuracy, robustness, and biological meaningfulness. These three components—preprocessing and quality control, metabolite identification, and modeling methods—form a unified methodological foundation that determines all subsequent results.
5.1. Preprocessing and Quality Control
High-quality clocks critically depend on reliable data preprocessing. In studies devoted to metabolomic clocks, standard workflows included the following steps: peak detection and deconvolution—XCMS [53] was used in untargeted academic cohort studies, in particular in the Danish study on forensic samples [24]; Airwave cohort [23] employed UPLC-MS platforms processed via in-house pipelines at the National Phenome Centre; vendor pipelines were employed in studies using commercial platforms: the Metabolon HD4 platform operates with a proprietary pipeline incorporating UPLC-MS/MS (RP + HILIC), which includes automated identification and normalization [25,28,29,30]; in targeted studies, instrument software (MassHunter or equivalent) was used [32,37]; next-generation proprietary AI pipelines: the Sapient rLC-MS system works with its own software for automated feature detection and annotation [33]; The Danish study, which lacked pooled QC samples, addressed batch-to-batch alignment by developing a custom neural network with a ratio layer that performs implicit normalization without explicit batch correction [24].
Alignment between runs and batches—correction of retention time drift (tolerance ± 0.1–0.3 min) and ensuring feature correspondence across samples were performed in untargeted MS studies using algorithms implemented in XCMS [23] or specialized drift correction tools in population studies [33]. In studies on the Metabolon HD4 platform (RP and HILIC), alignment is carried out within the internal vendor pipeline [25,28,30].
Normalization methods included unit variance scaling, probabilistic quotient normalization (PQN) [54], scaling based on internal standards (with 10–20 stable isotope-labeled (SIL) standards in targeted studies), and signal drift correction using pooled QC samples when available [23,33,37]. In the Metabolon pipeline, median normalization followed by log transformation is applied [25,28,30].
Quality control and filtering, in particular the exclusion of features with a high proportion of missing values (>20% in, >50% in all groups or poor reproducibility (CV > 25–30% in QC samples) [23,24,36], as well as removal of background signals, isotopic peaks, adducts, and in-source fragments. In targeted studies [32,37], filtering was performed according to analytical method validation criteria.
The Danish UHPLC-QTOF study is notable in that pooled QC samples were unavailable, necessitating careful evaluation of normalization methods and ultimately the application of subsequent modeling (a neural network with a ratio layer) to account for experimental variability [24].
5.2. Metabolite Identification and Annotation
Platforms such as Metabolon and targeted panels provide named metabolites with an annotation confidence level corresponding to Levels 1–2 of the Metabolomics Standards Initiative (MSI), facilitating biological interpretation and cross-study comparisons [25,28]. Untargeted LC-MS and rLC-MS studies often rely on accurate mass, retention time, MS/MS spectra, and matching against in-house or public libraries (METLIN, HMDB, MoNA) to annotate subsets of features, leaving many signals as unknowns [23,24,33]. Large-scale longevity studies harmonize metabolite names through RefMet and map them onto metabolic pathways, enabling network analysis and enrichment analysis across cohorts [28,30]. At the same time, the problem of “unknowns” remains a serious limitation: many age-predictive features lack confirmed identities, complicating mechanistic interpretation and the development of targeted assays. One potential approach to addressing this issue is the use of isotopic distribution data, which provides an additional, yet underutilized level of annotation confidence in mass spectrometry–based analysis [55]. Natural isotope distributions are most reliably evaluated in full-scan MS1 data, where they can provide an additional constraint for limiting the number of candidate elemental formulas. In MS/MS spectra, by contrast, precursor-ion isolation may bias or truncate the isotope envelope, limiting the direct interpretation of product-ion isotope intensities. None of the reviewed metabolomic clock studies explicitly reported the use of isotope pattern matching for annotation, representing a methodological opportunity for future workflows aimed at reducing the proportion of unidentified age-predicting features.
5.3. Machine Learning Approaches for Clock Construction
A variety of algorithms are used to build clocks or related risk scores. Elastic Net regression is the most common for age-trained clocks, combining feature selection and regularization in high-dimensional spaces [23,28,29]. Ridge regression is used when the goal is to retain many correlated predictors (e.g., INTERVAL/NEO metabolomic age models, where sex-specific ridge models showed better prediction) [34]. Tree-based ensembles (random forest, gradient boosting) and rule-based regressors (Cubist) are occasionally applied, albeit with limited interpretability and sometimes modest improvements. In Airwave, elastic net regression was used throughout, with a bootstrapped approach to ensure stable variable selection across 100 re-samplings [23]. Neural networks with custom architectures (e.g., neural networks with relational layers, autoencoders) have been successfully applied to large untargeted datasets and in some deep learning models for mortality/age, handling nonlinear relationships and complex interactions. In the Danish study, a neural network with a relational layer achieved RMSE of 5.88 years, compared to 6.15 years for the best conventional normalization method combined with elastic net—an improvement of 0.27 years [24]. The MileAge study [15], conducted using NMR spectroscopy, showed that nonlinear algorithms (neural networks, gradient boosting) outperform linear models in associations with health and lifespan, albeit with a small gain in age prediction accuracy. In study [31], Elastic Net regression (alpha = 0.5) was used as a single unified method to construct all 11 omics clocks in ORCADES, including MS-metabolomic and MS-lipidomic clocks. Comparison with LASSO and cross-validated Elastic Net revealed no differences in predictive performance, confirming the robustness of the conclusions to the choice of regularization method.
Rigorous validation strategies (bootstrapping, 10-fold cross-validation, lockbox test sets, replication in external cohorts) are essential to avoid overfitting and obtain realistic estimates of predictive performance. For example, the INTERVAL clock was validated in the independent NEO cohort [34].
6. Performance Metrics and Biological Associations
Predictive accuracy alone does not provide a complete picture of the capabilities of metabolomic clocks. Two interrelated aspects become crucial: the reproducibility of metrics on independent samples and, of fundamental importance, the model’s ability to capture clinically and biologically meaningful information. Without this, clocks, even those demonstrating high R2 values, remain a mathematical construct with unclear physiological interpretation. This section systematizes data covering both of these directions: from quantitative indicators of age prediction accuracy (R2, MAE, RMSE) to associations of metabolomic acceleration with specific diseases, mortality, geriatric syndromes, and extreme longevity. The collected results show that the deviation of predicted metabolomic age from chronological age (Δage) is not a statistical artifact but represents a robust signal reflecting the degree of physiological wear-and-tear and survival prognosis.
6.1. Age Prediction Accuracy
Reported performance metrics include correlation with chronological age, mean or median absolute error (MAE), root mean square error (RMSE), and explained variance (R2). The multi-platform Airwave clocks achieve r ≈ 0.86 and MAE ≈ 3.7 years (age range 22–65 years), comparable to epigenetic clocks in similar age ranges [23]. Plasma clocks based on Metabolon in the INTERVAL cohort show R2 ≈ 0.83–0.86 for age prediction (MAE ~4.4 years), with sex-specific models performing slightly better: R2 = 0.86 in women vs. 0.85 in men [34]. The Danish forensic UHPLC-QTOF clock, despite uncontrolled sample collection, achieves RMSE ≈ 5.9 years and R2 ≈ 0.63 (the group consisted mainly of people aged 21–42, 13 people were over 75 years old). The error was higher for individuals over 70 years [24]. CSF-based clocks are less accurate (MAE ≈ 10 years, R2~0.75), likely reflecting smaller cohorts and the specific, CNS-focused metabolome [32].
In the largest direct comparison of 15 omics clocks in a single cohort to date (ORCADES, n~1000), MS-metabolomic clocks (Metabolon HD4) achieved r = 0.81 with chronological age. This substantially exceeds the result of MetaboAge (r = 0.21 in ORCADES, despite r = 0.65–0.70 in other cohorts), demonstrating significant population dependence of metabolomic clock accuracy. MS-lipidomic clocks for fatty acids (r = 0.45) and complex lipids (r = 0.70) were less accurate in chronological prediction, yet key predictors were successfully reduced to small “core” sets of biomarkers without substantial loss of accuracy—a principle critically important for clinical translation [31].
These results show that metabolomic clocks based on well-designed MS workflows can match or approach the predictive performance of established omics clocks in comparable age ranges (e.g., Horvath DNAmAge clock: MAE ~3.6 years, r~0.96 in the training set) [3].
6.2. Age Acceleration and Health Outcomes
The key question is whether metabolomic age deviation (Δage) tracks health and disease status. Higher metabolomic age has been shown to be associated with deviations in various pathologies. In the Airwave cohort, metabolomic age acceleration correlates with overweight/obesity, diabetes, alcohol abuse, and depression [23]. In the INTERVAL and NEO cohorts, there is a relationship between Δage and BMI (β = 0.37 per kg/m2) and cardiovascular diseases (an increase in Δage by 12–13 years for cases of cardiovascular diseases in the Endo+Xeno model) [34]. In the rLC-MS Sapient cohort, Δage is elevated in obesity, diabetes, chronic kidney disease (CKD), and rare systemic diseases [33]. Importantly, “age” decreased by 3.5 years after kidney transplantation, indicating the possibility of tracking positive shifts upon correction of pathology using metabolomic clocks [33]. The SweetSpotClock metabolomic age deviation is strongly associated with all-cause mortality (HR 1.08 per 1 year increase in Δage, p < 0.001) and age-associated diseases even after adjustment for chronological age, sex, and lifestyle, while correlating only weakly with epigenetic age deviations (r = 0.35), again confirming the complementary nature of the information [25].
In the ORCADES cohort [31], MS-metabolomic age acceleration (OCAA) was nominally associated with all 7 considered risk factors (BMI, CRP, cholesterol, systolic blood pressure, FEV1, creatinine, cortisol). NMR-metabolomic OCAA showed the greatest predictive power among risk factors (IVW-average effect: β = 0.09 per 1 SD). MS-metabolomic clocks, in turn, clustered together with lipidomic clocks (MS Fatty Acids and Complex Lipidomics), indicating a common biological substrate. One year of OCAA averaged across all clocks corresponded to an effect of 0.09 years of chronological age on risk factors and 0.25 years on morbidity.
6.3. Links with Frailty, Multimorbidity, and Extreme Longevity
Beyond specific diseases, metabolomic clocks capture broader geriatric phenotypes. Frailty-oriented clocks trained on health show strong associations with clinically assessed frailty indices, multimorbidity scores, and disability, implicating metabolomic age acceleration as an integrated marker of overall physiological reserve [25]. The Danish UHPLC-QTOF-based clock, built on routine toxicological data without fasting standardization, also showed significant associations with cardiometabolic conditions [24].
In longevity cohorts, metabolomic signatures differentiate centenarians and their offspring from age-matched controls, with combinations of amino acid metabolites (tryptophan, kynurenine), lipids, and redox status predicting survival and extreme longevity [28,30]. In the study by Monti et al. on NECS cohorts (>200 centenarians), more than 298 metabolites were identified as differentially abundant between centenarians, their offspring, and controls, including pathways of NAD+ metabolism and fatty acids [30]. Sebastiani et al., in the LLFS cohort, identified 230 metabolites associated with extreme longevity and 152 with mortality risk, showing that essential fatty acid metabolites play a key role in linking lipid metabolism with other metabolic processes [28].
These findings underscore that metabolomic clocks not only reflect “accelerated aging” but can also capture components of biological age related to stress resistance and healthy longevity.
7. Challenges and Limitations of Current MS-Based Clocks
Despite encouraging results, several limitations constrain the translational impact of metabolomic clocks. Untargeted LC-MS detects far more features than can be confidently annotated; many of the predictive signals remain unidentified, hindering mechanistic understanding and translation into targeted assays. Works [23,24] note that some of the most important predictors remained unannotated because of low fragmentation coverage or a lack of database hits.
Large-scale projects span years, equipment upgrades, and protocol changes, requiring sophisticated normalization and validation strategies to avoid artifactual age trends. In rLC-MS, coefficient of variance (CV) for the internal standards was <20–25% [33].
Differences in fasting status, sample processing, extraction solvents, chromatographic methods, data processing, and protocol harmonization hinder the direct comparison of coefficients or metabolite weights across studies.
Most studies are observational; it remains unclear to what extent modifying metabolomic clock age through interventions (pharmacological or lifestyle) will causally influence healthspan and overall lifespan [25,30], although preliminary results from metabolomic clocks (e.g., in kidney transplantation [33]) are promising.
8. Future Directions and Technical Innovations
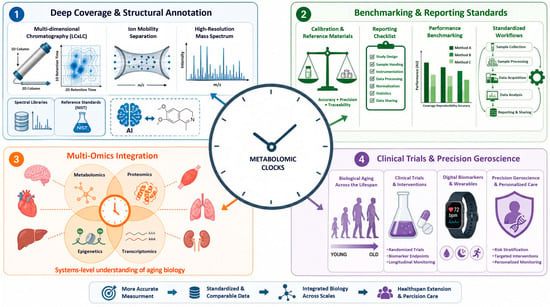
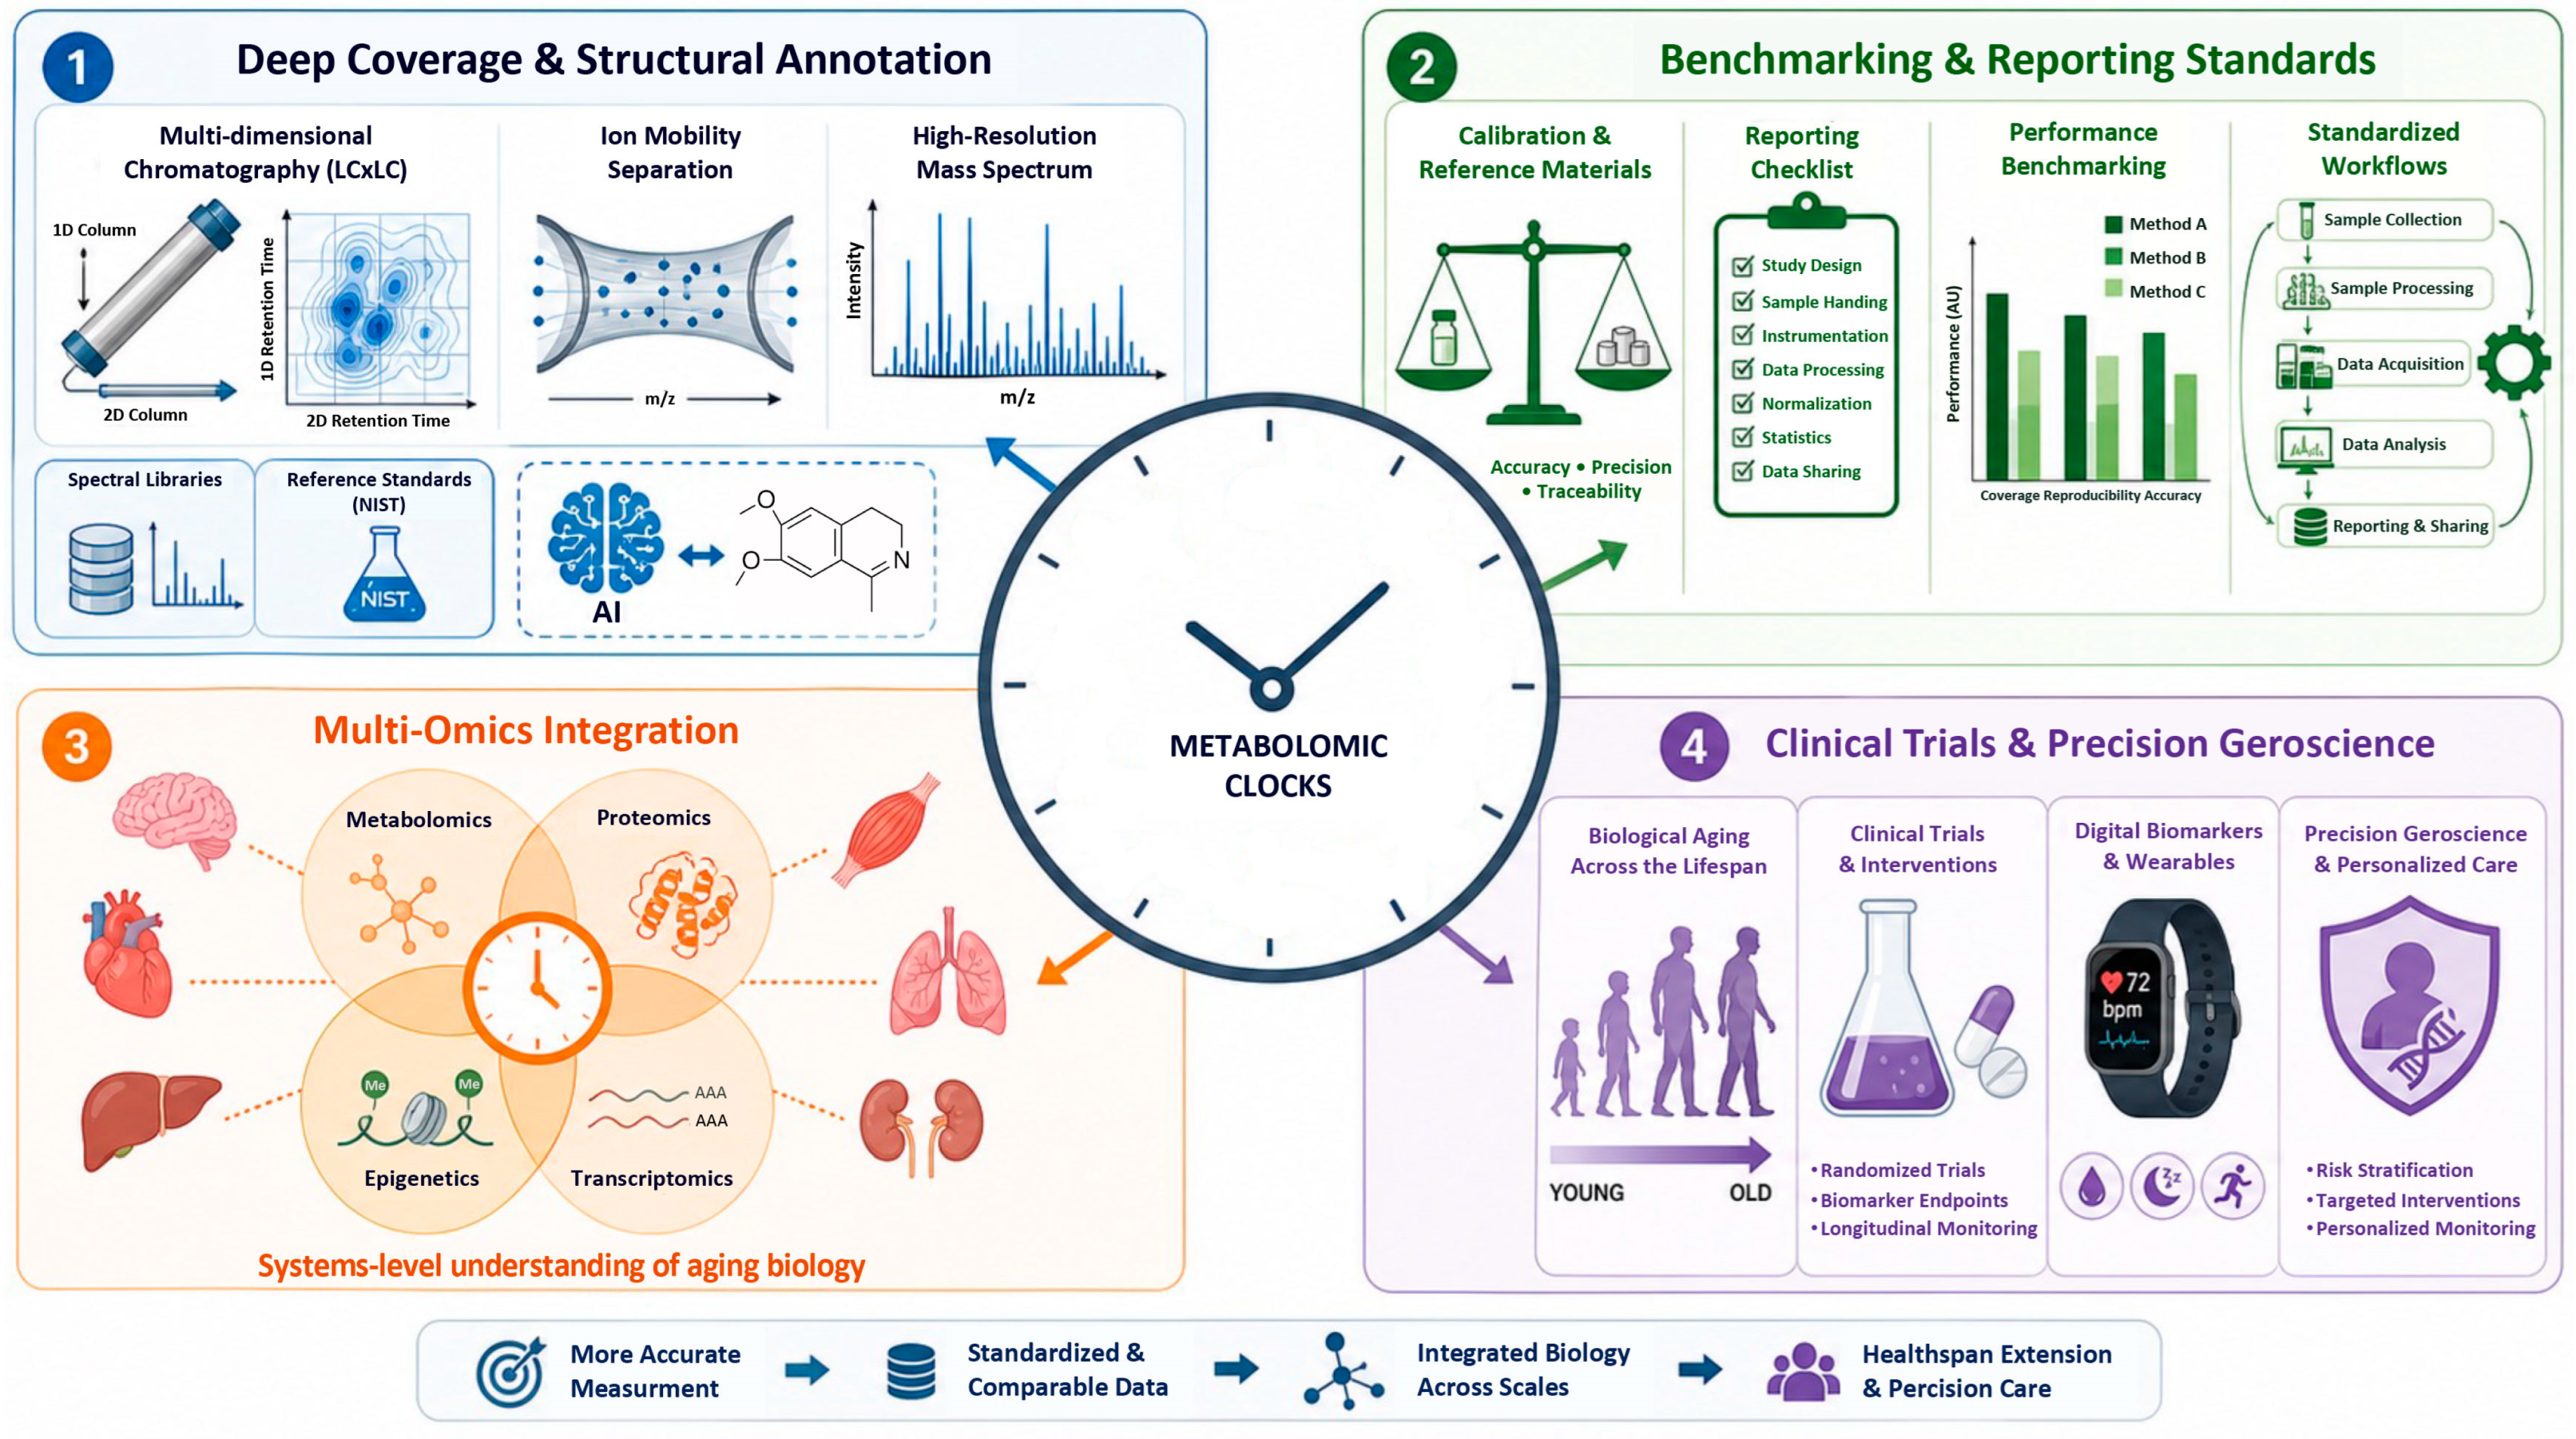
Based on the cumulative data, several technical priorities for the development of mass spectrometry-based metabolomic clocks can be identified (Figure 2).
Figure 2.
Directions for the development of research on mass spectrometry-based metabolomic clocks. Four key priorities are schematically presented: (1) deeper analytical coverage and structural elucidation using multidimensional separations, ion mobility, and AI-driven annotation; (2) standardization of methodologies and benchmarking of biological age prediction algorithms; (3) multi-omics integration of metabolomics with proteomics, epigenetics, and transcriptomics for organ-specific assessment of aging; (4) application in interventional clinical trials and precision geroscience.
8.1. Deeper Coverage and Structural Elucidation
Advances in multidimensional separations (LC × LC, GC × GC), ion mobility (IMS, TIMS, cyclic IMS), and ultrahigh-resolution mass spectrometry promise to increase coverage, improve isomer resolution, and reduce the fraction of unknown yet predictive features. Integration of computational MS/MS prediction, retention time modeling, and AI-driven annotation (e.g., machine learning based on fragmentation) can accelerate structural elucidation, especially when combined with community-curated spectral libraries. Expansion of libraries and reference standards, including community efforts to synthesize and distribute reference compounds for recurrent unknowns, as well as broader adoption of certified reference materials (NIST SRM 1950, SRM 1955), will also be critical.
Reported LC-MS run times ranged from 3.5 min (Metabolon RP LC method), excluding re-equilibration, to 70 min (CSF HILIC method); however, none of the reviewed studies reported the total time from sample receipt to the final annotated data matrix. Sample preparation before LC-MS analysis can be performed in parallel, so that prepared samples are available continuously once the analytical sequence begins. Automation of sample preparation (e.g., robotic protein precipitation, extraction in 96-well plates) and parallel mass spectrometry data acquisition (e.g., multi-column configurations) can substantially reduce hands-on time while improving reproducibility and instrument utilization. Nevertheless, chromatographic separation and MS acquisition remain largely sequential and therefore represent the principal throughput limitation. This optimization direction should be regarded as an explicit priority alongside analytical coverage and assay standardization.
8.2. Benchmarking of Methodologies and Reporting Standards
Recent benchmarking studies, such as MileAge [15], highlight how clock performance can vary substantially depending on algorithm classes and hyperparameter choices, motivating the development of standardized frameworks for benchmarking metabolomic clocks. Beyond algorithms, community-agreed reporting standards for sample processing, analytical methods, QC design, and statistical protocols would improve reproducibility and facilitate meta-analysis and model transfer across laboratories. Recommendations analogous to those existing for DNA methylation clocks (e.g., detailed reporting of normalization, probe filtering, and batch-effect correction choices) are beginning to emerge for metabolomic aging clocks but require broader acceptance and iteration as technologies evolve.
AI-driven annotation and quality control can accelerate identification. This includes machine learning for automated peak detection, compound identification (based on CCS predictions, retention time, and in silico fragmentation), and drift correction, as demonstrated by rLC-MS [33] and certain NMR platforms [56,57]. Deep neural networks that predict MS/MS spectra from structure (e.g., CFM-ID [58], SIRIUS [59]) are also promising.
8.3. Integration with Other Omics and Clinical Data
Given that different omics levels capture distinct aspects of aging biology, integrated multi-omics clocks—combining metabolomics with epigenetics, proteomics, transcriptomics, imaging, and clinical biomarkers—are expected to offer a more robust and comprehensive assessment of biological age than any single method. Early work shows that such integrative models can better capture the heterogeneity of aging trajectories and may help decompose biological age into organ- or system-specific components (e.g., cardiovascular, renal, immune clocks) [23,25]. For MS-metabolomics in particular, integration with quantitative proteomics and lipidomics (e.g., parallel measurements of the proteome and lipidome by LC-MS/MS) could clarify causal pathways linking metabolite signatures to upstream enzymes, transporters, and signaling pathways, and thus reveal actionable targets for interventions.
A notable example of multi-omics clock integration is the work by Macdonald-Dunlop et al. [31], in which 15 omics clocks—including MS-metabolomic (MS Metabolomics, Metabolon; r = 0.81 with chronological age) and MS-lipidomic (MS Fatty Acids Lipidomics: r = 0.45; MS Complex Lipidomics: r = 0.70) clocks—were simultaneously evaluated in the ORCADES cohort. Within the “Mega-omics” clock combining all omics data, MS-metabolites accounted for 20.6% of the selected predictors, underscoring their contribution to the comprehensive omics model (r = 0.97). Epigenetic and IgG-glycomic clocks demonstrated the most generalized aging pattern (predicting morbidity), whereas MS-based clocks better predicted specific risk factors (CRP, BMI, cholesterol), indicating their additional value for characterizing organ-specific components of biological age [31].
8.4. Application in Clinical Trials and Precision Geroscience
The next critical step is the systematic application of metabolomic clocks in interventional studies—dietary, pharmacological, exercise, and multimodal geroscience trials—to test whether changes in metabolomic age predict or mediate improvements in functional outcomes and disease incidence. High-frequency sampling in such trials would leverage the dynamic responsiveness of metabolomics, enabling identification of short-term signatures that anticipate long-term benefits or adverse effects.
In clinical practice, metabolomic clocks could ultimately support individualized risk stratification, monitoring of organ-specific aging (e.g., kidney or liver), and personalization of lifestyle or pharmacological interventions based on metabolite signatures of vulnerability and resilience. Realizing this vision will require robust analytical standardization, validated clinical assays, and evidence that clock-informed decisions improve patient outcomes compared to existing risk calculators.
9. Conclusions
Mass spectrometry-based metabolomic aging clocks have rapidly evolved from proof-of-concept demonstrations to tools with established associations with mortality, disease risk, frailty, and extreme longevity across diverse populations and biological fluids. Their success critically depends on robust analytical workflows encompassing sample preparation, chromatographic separation, MS instrumentation, data processing, and the careful use of analytical standards and reference materials.
While current clocks already demonstrate competitive performance compared to other omics clocks, their greatest potential lies in the ability to capture dynamic, integrative aspects of physiology that respond to environmental exposures and interventions. Addressing the challenges of metabolite identification, harmonization, and causal interpretation will be necessary to fully realize the translational potential of metabolomic clocks in both research and clinical practice.
Author Contributions
Conceptualization, D.C. and A.S.; methodology, M.S.; data curation, V.G., V.V., M.D., T.S. and A.M.; writing—original draft preparation, D.C. and A.S.; writing—review and editing, M.S. and D.C.; supervision, D.C.; and project administration, D.C. and L.K. All authors have read and agreed to the published version of the manuscript.
Funding
This research was funded by Supported by Komtek LLC (No. SNIR-2025).
Data Availability Statement
No new data were created or analyzed in this study. Data sharing is not applicable to this article.
Acknowledgments
During the preparation of this manuscript, the authors used Perplexity AI (https://www.perplexity.ai/, web-based version, accessed in 24 June 2026) to assist in the creation of figures. The authors have reviewed and edited the output and take full responsibility for the content of this publication.
Conflicts of Interest
The authors declare no conflicts of interest.
Abbreviations
The following abbreviations are used in this manuscript:
| MS | Mass spectrometry |
| LC-MS | Liquid chromatography–mass spectrometry |
| UHPLC | Ultra-high-performance liquid chromatography |
| ESI | Electrospray ionization |
| MAE | Mean absolute error |
| RMSE | Root mean square error |
| QC | Quality control |
| QTOF | Quadrupole time-of-flight |
References
- Horvath, S.; Raj, K. DNA Methylation-Based Biomarkers and the Epigenetic Clock Theory of Ageing. Nat. Rev. Genet. 2018, 19, 371–384. [Google Scholar] [CrossRef] [Scilit] [PubMed]
- Ibáñez de Opakua, A.; Conde, R.; de Diego, A.; Bizkarguenaga, M.; Embade, N.; Lu, S.C.; Mato, J.M.; Millet, O. Metabolomic-Based Aging Clocks. npj Metab. Health Dis. 2025, 3, 35. [Google Scholar] [CrossRef] [Scilit] [PubMed]
- Horvath, S. DNA Methylation Age of Human Tissues and Cell Types. Genome Biol. 2013, 14, 3156. [Google Scholar] [CrossRef] [Scilit] [PubMed]
- Hannum, G.; Guinney, J.; Zhao, L.; Zhang, L.; Hughes, G.; Sadda, S.V.; Klotzle, B.; Bibikova, M.; Fan, J.B.; Gao, Y.; et al. Genome-Wide Methylation Profiles Reveal Quantitative Views of Human Aging Rates. Mol. Cell 2013, 49, 359–367. [Google Scholar] [CrossRef] [Scilit] [PubMed]
- Lu, A.T.; Binder, A.M.; Zhang, J.; Yan, Q.; Reiner, A.P.; Cox, S.R.; Corley, J.; Harris, S.E.; Kuo, P.L.; Moore, A.Z.; et al. DNA Methylation GrimAge Version 2. Aging 2022, 14, 9484–9549. [Google Scholar] [CrossRef] [Scilit] [PubMed]
- Levine, M.E.; Lu, A.T.; Quach, A.; Chen, B.H.; Assimes, T.L.; Bandinelli, S.; Hou, L.; Baccarelli, A.A.; Stewart, J.D.; Li, Y.; et al. An Epigenetic Biomarker of Aging for Lifespan and Healthspan. Aging 2018, 10, 573–591. [Google Scholar] [CrossRef] [Scilit] [PubMed]
- Belsky, D.W.; Caspi, A.; Corcoran, D.L.; Sugden, K.; Poulton, R.; Arseneault, L.; Baccarelli, A.; Chamarti, K.; Gao, X.; Hannon, E.; et al. DunedinPACE, a DNA Methylation Biomarker of the Pace of Aging. eLife 2022, 11, e73420. [Google Scholar] [CrossRef] [Scilit] [PubMed]
- Lu, A.T.; Quach, A.; Wilson, J.G.; Reiner, A.P.; Aviv, A.; Raj, K.; Hou, L.; Baccarelli, A.A.; Li, Y.; Stewart, J.D.; et al. DNA Methylation GrimAge Strongly Predicts Lifespan and Healthspan. Aging 2019, 11, 303–327. [Google Scholar] [CrossRef] [Scilit] [PubMed]
- Zhang, S.; Wang, Z.; Wang, Y.; Zhu, Y.; Zhou, Q.; Jian, X.; Zhao, G.; Qiu, J.; Xia, K.; Tang, B.; et al. A Metabolomic Profile of Biological Aging in 250,341 Individuals from the UK Biobank. Nat. Commun. 2024, 15, 8081. [Google Scholar] [CrossRef] [Scilit] [PubMed]
- Meyer, D.H.; Schumacher, B. BiT Age: A Transcriptome-Based Aging Clock near the Theoretical Limit of Accuracy. Aging Cell 2021, 20, e13320. [Google Scholar] [CrossRef] [Scilit] [PubMed]
- Tyshkovskiy, A.; Kholdina, D.; Davitadze, M.; Molière, A.; Moldakozhayev, A.; Tongu, Y.; Kasahara, T.; Glubokov, D.; Eames, A.; Kats, L.M.; et al. Universal Transcriptomic Hallmarks of Mammalian Ageing and Mortality. Nature 2026, 654, 173–188. [Google Scholar] [CrossRef] [Scilit] [PubMed]
- Tanaka, T.; Basisty, N.; Fantoni, G.; Candia, J.; Moore, A.Z.; Biancotto, A.; Schilling, B.; Bandinelli, S.; Ferrucci, L. Plasma Proteomic Biomarker Signature of Age Predicts Health and Life Span. eLife 2020, 9, e61073. [Google Scholar] [CrossRef] [Scilit] [PubMed]
- Argentieri, M.A.; Xiao, S.; Bennett, D.; Winchester, L.; Nevado-Holgado, A.J.; Ghose, U.; Albukhari, A.; Yao, P.; Mazidi, M.; Lv, J.; et al. Proteomic Aging Clock Predicts Mortality and Risk of Common Age-Related Diseases in Diverse Populations. Nat. Med. 2024, 30, 2450–2460. [Google Scholar] [CrossRef] [Scilit] [PubMed]
- Hertel, J.; Friedrich, N.; Wittfeld, K.; Pietzner, M.; Budde, K.; Van Der Auwera, S.; Lohmann, T.; Teumer, A.; Völzke, H.; Nauck, M.; et al. Measuring Biological Age via Metabonomics: The Metabolic Age Score. J. Proteome Res. 2016, 15, 400–410. [Google Scholar] [CrossRef] [Scilit] [PubMed]
- Mutz, J.; Iniesta, R.; Lewis, C.M. Metabolomic Age (MileAge) Predicts Health and Life Span: A Comparison of Multiple Machine Learning Algorithms. Sci. Adv. 2024, 10, eadp3743. [Google Scholar] [CrossRef] [Scilit] [PubMed]
- Deelen, J.; Kettunen, J.; Fischer, K.; van der Spek, A.; Trompet, S.; Kastenmüller, G.; Boyd, A.; Zierer, J.; van den Akker, E.B.; Ala-Korpela, M.; et al. A Metabolic Profile of All-Cause Mortality Risk Identified in an Observational Study of 44,168 Individuals. Nat. Commun. 2019, 10, 3346. [Google Scholar] [CrossRef] [Scilit] [PubMed]
- Rutledge, J.; Oh, H.; Wyss-Coray, T. Measuring Biological Age Using Omics Data. Nat. Rev. Genet. 2022, 23, 715–727. [Google Scholar] [CrossRef] [Scilit] [PubMed]
- Moqri, M.; Herzog, C.; Poganik, J.R.; Justice, J.; Belsky, D.W.; Higgins-Chen, A.; Moskalev, A.; Fuellen, G.; Cohen, A.A.; Bautmans, I.; et al. Biomarkers of Aging for the Identification and Evaluation of Longevity Interventions. Cell 2023, 186, 3758–3775. [Google Scholar] [CrossRef] [Scilit] [PubMed]
- Yin, P.; Peter, A.; Franken, H.; Zhao, X.; Neukamm, S.S.; Rosenbaum, L.; Lucio, M.; Zell, A.; Häring, H.U.; Xu, G.; et al. Preanalytical Aspects and Sample Quality Assessment in Metabolomics Studies of Human Blood. Clin. Chem. 2013, 59, 833–845. [Google Scholar] [CrossRef] [Scilit] [PubMed]
- Panyard, D.J.; Yu, B.; Snyder, M.P. The Metabolomics of Human Aging: Advances, Challenges, and Opportunities. Sci. Adv. 2022, 8, eadd6155. [Google Scholar] [CrossRef] [Scilit] [PubMed]
- Huang, H.; Chen, Y.; Xu, W.; Cao, L.; Qian, K.; Bischof, E.; Kennedy, B.K.; Pu, J. Decoding Aging Clocks: New Insights from Metabolomics. Cell Metab. 2025, 37, 34–58. [Google Scholar] [CrossRef] [Scilit] [PubMed]
- You, G.; Wang, K.; Shen, R.; Chen, X.; Jiang, J.; Sun, Y.; Wu, D.; Xu, J.; Huang, K.; Yao, C. Metabolomic Aging Clock Predicts Risk of Different Cardiovascular Diseases in the UK Biobank. Metabolism 2026, 176, 156467. [Google Scholar] [CrossRef] [Scilit] [PubMed]
- Robinson, O.; Chadeau Hyam, M.; Karaman, I.; Climaco Pinto, R.; Ala-Korpela, M.; Handakas, E.; Fiorito, G.; Gao, H.; Heard, A.; Jarvelin, M.R.; et al. Determinants of Accelerated Metabolomic and Epigenetic Aging in a UK Cohort. Aging Cell 2020, 19, e13149. [Google Scholar] [CrossRef] [Scilit] [PubMed]
- Lassen, J.K.; Wang, T.; Nielsen, K.L.; Hasselstrøm, J.B.; Johannsen, M.; Villesen, P. Large-Scale Metabolomics: Predicting Biological Age Using 10,133 Routine Untargeted LC-MS Measurements. Aging Cell 2023, 22, e13813. [Google Scholar] [CrossRef] [Scilit] [PubMed]
- Vishnyakova, O.; Min, J.; Leach, S.; Song, X.; Rockwood, K.; Brooks-Wilson, A.; Elliott, L.T. Metabolomic Sweet Spot Clock Predicts Mortality and Age-Related Diseases in the Canadian Longitudinal Study on Aging. Commun. Med. 2026, 6, 110. [Google Scholar] [CrossRef] [Scilit] [PubMed]
- Galkin, F.; Mamoshina, P.; Aliper, A.; de Magalhães, J.P.; Gladyshev, V.N.; Zhavoronkov, A. Biohorology and Biomarkers of Aging: Current State-of-the-Art, Challenges and Opportunities. Ageing Res. Rev. 2020, 60, 101050. [Google Scholar] [CrossRef] [Scilit] [PubMed]
- Wishart, D.S. NMR Metabolomics: A Look Ahead. J. Magn. Reson. 2019, 306, 155–161. [Google Scholar] [CrossRef] [Scilit] [PubMed]
- Sebastiani, P.; Monti, S.; Lustgarten, M.S.; Song, Z.; Ellis, D.; Tian, Q.; Schwaiger-Haber, M.; Stancliffe, E.; Leshchyk, A.; Short, M.I.; et al. Metabolite Signatures of Chronological Age, Aging, Survival, and Longevity. Cell Rep. 2024, 43, 114913. [Google Scholar] [CrossRef] [Scilit] [PubMed]
- Liu, X.; Liang, T.; Zhao, R.; Zhu, M.; Huang, B.; Huang, X.; Ni, F. A Global Metabolomic and Lipidomic Landscape of Human Plasma Across the Lifespan. Aging Cell 2026, 25, e70316. [Google Scholar] [CrossRef] [Scilit] [PubMed]
- Monti, S.; Lustgarten, M.S.; Huang, Z.; Song, Z.; Li, M.; Ellis, D.; Tian, Q.; Ferrucci, L.; Rappaport, N.; Andersen, S.L.; et al. Metabolomic Signatures of Extreme Old Age: Findings from the New England Centenarian Study. Geroscience 2026. [Google Scholar] [CrossRef] [Scilit] [PubMed]
- Macdonald-Dunlop, E.; Taba, N.; Klarić, L.; Frkatović, A.; Walker, R.; Hayward, C.; Esko, T.; Haley, C.; Fischer, K.; Wilson, J.F.; et al. A Catalogue of Omics Biological Ageing Clocks Reveals Substantial Commonality and Associations with Disease Risk. Aging 2022, 14, 623–659. [Google Scholar] [CrossRef] [Scilit] [PubMed]
- Hwangbo, N.; Zhang, X.; Raftery, D.; Gu, H.; Hu, S.C.; Montine, T.J.; Quinn, J.F.; Chung, K.A.; Hiller, A.L.; Wang, D.; et al. A Metabolomic Aging Clock Using Human Cerebrospinal Fluid. J. Gerontol. A Biol. Sci. Med. Sci. 2022, 77, 744–754. [Google Scholar] [CrossRef] [Scilit] [PubMed]
- Watrous, J.; Tiwari, S.; Long, T.; Large, A.; Lagerborg, K.; Gallagher, K.; Dao, K.; Park, S.; Aguirre, D.; Lamoureux, C.; et al. Rapid Liquid Chromatography-Mass Spectrometry (RLC-MS) for Deep Metabolomics Analysis of Population Scale Studies. bioRxiv 2025. bioRxiv:2025.08.10.669154. [Google Scholar] [CrossRef] [Scilit]
- Faquih, T.O.; van Hylckama Vlieg, A.; Surendran, P.; Butterworth, A.S.; Li-Gao, R.; de Mutsert, R.; Rosendaal, F.R.; Noordam, R.; van Heemst, D.; van Dijk, K.W.; et al. Robust Metabolomic Age Prediction Based on a Wide Selection of Metabolites. J. Gerontol. A Biol. Sci. Med. Sci. 2025, 80, glae280. [Google Scholar] [CrossRef] [Scilit] [PubMed]
- Chailurkit, L.O.; Thongmung, N.; Vathesatogkit, P.; Sritara, P.; Ongphiphadhanakul, B. Biological Age as Estimated by Baseline Circulating Metabolites Is Associated with Incident Diabetes and Mortality. J. Nutr. Health Aging 2024, 28, 100032. [Google Scholar] [CrossRef] [Scilit] [PubMed]
- Zhang, L.; Mo, S.; Zhu, X.; Chou, C.J.; Jin, B.; Han, Z.; Schilling, J.; Liao, W.; Thyparambil, S.; Luo, R.Y.; et al. Global Metabolomics Revealed Deviations from the Metabolic Aging Clock in Colorectal Cancer Patients. Theranostics 2024, 14, 1602–1614. [Google Scholar] [CrossRef] [Scilit] [PubMed]
- Janssens, G.E.; Grevendonk, L.; Schomakers, B.V.; Perez, R.Z.; van Weeghel, M.; Schrauwen, P.; Hoeks, J.; Houtkooper, R.H. A Metabolomic Signature of Decelerated Physiological Aging in Human Plasma. Geroscience 2023, 45, 3147–3164. [Google Scholar] [CrossRef] [Scilit] [PubMed]
- Dettmer, K.; Aronov, P.A.; Hammock, B.D. Mass Spectrometry-Based Metabolomics. Mass Spectrom. Rev. 2007, 26, 51–78. [Google Scholar] [CrossRef] [Scilit] [PubMed]
- Zhou, B.; Xiao, J.F.; Tuli, L.; Ressom, H.W. LC-MS-Based Metabolomics. Mol. Biosyst. 2012, 8, 470–481. [Google Scholar] [CrossRef] [Scilit] [PubMed]
- Chetwynd, A.J.; David, A. A Review of Nanoscale LC-ESI for Metabolomics and Its Potential to Enhance the Metabolome Coverage. Talanta 2018, 182, 380–390. [Google Scholar] [CrossRef] [Scilit] [PubMed]
- Ren, J.L.; Zhang, A.H.; Kong, L.; Wang, X.J. Advances in Mass Spectrometry-Based Metabolomics for Investigation of Metabolites. RSC Adv. 2018, 8, 22335–22350. [Google Scholar] [CrossRef] [Scilit] [PubMed]
- Calvano, C.D.; Monopoli, A.; Cataldi, T.R.I.; Palmisano, F. MALDI Matrices for Low Molecular Weight Compounds: An Endless Story? Anal. Bioanal. Chem. 2018, 410, 4015–4038. [Google Scholar] [CrossRef] [Scilit] [PubMed]
- He, M.J.; Pu, W.; Wang, X.; Zhang, W.; Tang, D.; Dai, Y. Comparing DESI-MSI and MALDI-MSI Mediated Spatial Metabolomics and Their Applications in Cancer Studies. Front. Oncol. 2022, 12, 891018. [Google Scholar] [CrossRef] [Scilit] [PubMed]
- Ma, S.; Leng, Y.; Li, X.; Meng, Y.; Yin, Z.; Hang, W. High Spatial Resolution Mass Spectrometry Imaging for Spatial Metabolomics: Advances, Challenges, and Future Perspectives. TrAC Trends Anal. Chem. 2023, 159, 116902. [Google Scholar] [CrossRef] [Scilit]
- Halket, J.M.; Waterman, D.; Przyborowska, A.M.; Patel, R.K.P.; Fraser, P.D.; Bramley, P.M. Chemical Derivatization and Mass Spectral Libraries in Metabolic Profiling by GC/MS and LC/MS/MS. J. Exp. Bot. 2005, 56, 219–243. [Google Scholar] [CrossRef] [Scilit] [PubMed]
- Fiehn, O. Metabolomics by Gas Chromatography-Mass Spectrometry: Combined Targeted and Untargeted Profiling. Curr. Protoc. Mol. Biol. 2016, 114, 21.33.1–21.33.11. [Google Scholar] [CrossRef] [Scilit] [PubMed]
- Beale, D.J.; Pinu, F.R.; Kouremenos, K.A.; Poojary, M.M.; Narayana, V.K.; Boughton, B.A.; Kanojia, K.; Dayalan, S.; Jones, O.A.H.; Dias, D.A. Review of Recent Developments in GC-MS Approaches to Metabolomics-Based Research. Metabolomics 2018, 14, 152. [Google Scholar] [CrossRef] [Scilit] [PubMed]
- Moros, G.; Chatziioannou, A.C.; Gika, H.G.; Raikos, N.; Theodoridis, G. Investigation of the Derivatization Conditions for GC-MS Metabolomics of Biological Samples. Bioanalysis 2017, 9, 53–65. [Google Scholar] [CrossRef] [Scilit] [PubMed]
- Lei, Z.; Huhman, D.V.; Sumner, L.W. Mass Spectrometry Strategies in Metabolomics. J. Biol. Chem. 2011, 286, 25435–25442. [Google Scholar] [CrossRef] [Scilit] [PubMed]
- Pitt, J.J. Principles and Applications of Liquid Chromatography-Mass Spectrometry in Clinical Biochemistry. Clin. Biochem. Rev. 2009, 30, 19–34. [Google Scholar] [PubMed]
- Schrimpe-Rutledge, A.C.; Codreanu, S.G.; Sherrod, S.D.; McLean, J.A. Untargeted Metabolomics Strategies-Challenges and Emerging Directions. J. Am. Soc. Mass Spectrom. 2016, 27, 1897–1905. [Google Scholar] [CrossRef] [Scilit] [PubMed]
- Nordström, A.; Want, E.; Northen, T.; Lehtiö, J.; Siuzdak, G. Multiple Ionization Mass Spectrometry Strategy Used to Reveal the Complexity of Metabolomics. Anal. Chem. 2008, 80, 421–429. [Google Scholar] [CrossRef] [Scilit] [PubMed]
- Smith, C.A.; Want, E.J.; O’Maille, G.; Abagyan, R.; Siuzdak, G. XCMS: Processing Mass Spectrometry Data for Metabolite Profiling Using Nonlinear Peak Alignment, Matching, and Identification. Anal. Chem. 2006, 78, 779–787. [Google Scholar] [CrossRef] [Scilit] [PubMed]
- An, Y.; Liu, S.; Hao, F.; Wang, Y.; Tang, H. Development and Validation of an Improved Probabilistic Quotient Normalization Method for LC/MS- and NMR-Based Metabonomic Analysis. Chin. Chem. Lett. 2020, 31, 1827–1830. [Google Scholar] [CrossRef] [Scilit]
- Kind, T.; Fiehn, O. Metabolomic Database Annotations via Query of Elemental Compositions: Mass Accuracy Is Insufficient Even at Less than 1 Ppm. BMC Bioinform. 2006, 7, 234. [Google Scholar] [CrossRef] [Scilit] [PubMed]
- Jia, X.; Fan, J.; Wu, X.; Cao, X.; Ma, L.; Abdelrahman, Z.; Zhao, F.; Zhu, H.; Bizzarri, D.; van den Akker, E.B.; et al. A Novel Metabolomic Aging Clock Predicting Health Outcomes and Its Genetic and Modifiable Factors. Adv. Sci. 2024, 11, 2406670. [Google Scholar] [CrossRef] [Scilit] [PubMed]
- Lau, C.H.E.; Manou, M.; Markozannes, G.; Ala-Korpela, M.; Ben-Shlomo, Y.; Chaturvedi, N.; Engmann, J.; Gentry-Maharaj, A.; Herzig, K.H.; Hingorani, A.; et al. NMR Metabolomic Modeling of Age and Lifespan: A Multicohort Analysis. Aging Cell 2024, 23, e14164. [Google Scholar] [CrossRef] [Scilit] [PubMed]
- Wang, F.; Liigand, J.; Tian, S.; Arndt, D.; Greiner, R.; Wishart, D.S. CFM-ID 4.0: More Accurate ESI-MS/MS Spectral Prediction and Compound Identification. Anal. Chem. 2021, 93, 11692–11700. [Google Scholar] [CrossRef] [Scilit] [PubMed]
- Dührkop, K.; Fleischauer, M.; Ludwig, M.; Aksenov, A.A.; Melnik, A.V.; Meusel, M.; Dorrestein, P.C.; Rousu, J.; Böcker, S. SIRIUS 4: A Rapid Tool for Turning Tandem Mass Spectra into Metabolite Structure Information. Nat. Methods 2019, 16, 299–302. [Google Scholar] [CrossRef] [Scilit] [PubMed]

Disclaimer/Publisher’s Note: The statements, opinions and data contained in all publications are solely those of the individual author(s) and contributor(s) and not of MDPI and/or the editor(s). MDPI and/or the editor(s) disclaim responsibility for any injury to people or property resulting from any ideas, methods, instructions or products referred to in the content. |
© 2026 by the authors. Licensee MDPI, Basel, Switzerland. This article is an open access article distributed under the terms and conditions of the Creative Commons Attribution (CC BY) license.