Article

Cross-Validation of Low-Cost Potentiometric and Colorimetric Methods for Urinary Urea Quantification: Toward Accessible Monitoring of Protein Metabolism


1
Medical Devices and Methods Laboratory, Health Futures Center, Arizona State University, 6161 E. Mayo Blvd., Phoenix, AZ 85054, USA
2
Center for Bioelectronics and Biosensors, Biodesign Institute, Arizona State University, 1001 S McAllister Ave., Tempe, AZ 85281, USA
3
Department of Child Health, Phoenix Children’s Research Institute, College of Medicine—Phoenix, University of Arizona, 475 N. 5th St., Phoenix, AZ 85004, USA
4
School for Engineering of Matter, Transport and Energy, Arizona State University, Tempe, AZ 85287, USA
5
Department of Nephrology and Hypertension, Mayo Clinic Arizona, 5777 E Mayo Boulevard, Phoenix, AZ 85054, USA
6
Department of Laboratory Medicine and Pathology, Mayo Clinic Arizona, 5777 E Mayo Boulevard, Phoenix, AZ 85054, USA
*
Author to whom correspondence should be addressed.
These authors contributed equally to this work.
Analytica 2026, 7(3), 51; https://doi.org/10.3390/analytica7030051
Submission received: 27 June 2026 / Revised: 20 July 2026 / Accepted: 21 July 2026 / Published: 31 July 2026

Abstract

Urinary urea is a key biomarker for tracking protein oxidation and nitrogen balance. A persistent analytical limitation is that conventional total-nitrogen assays do not deconvolute urinary urea from urinary ammonia, and direct measurement still requires capital-intensive clinical analyzers. Here, we implement and independently validate two cost-effective methods that resolve urinary urea by pairing the presence and absence of urease: Method 1 is a urease-coupled potentiometric assay using an ammonium ion-selective electrode (ISE method); Method 2 is a microplate Berthelot–salicylate colorimetric assay employing a repurposed consumer-grade aquarium ammonia test kit (API®) (API method). Each method was validated against the Roche Cobas C311 clinical analyzer (ISE for urinary ammonia and API for urinary urea) in healthy adult volunteers (n = 10 each), and API–ISE were then compared head-to-head for urinary urea. ISE vs. Cobas yielded R2 = 0.967, slope 95% CI [0.867, 1.173], and Bland–Altman bias of −1.02 mM (95% LoA [−7.40, +5.36] mM). API vs. Cobas yielded R2 = 0.973, slope 95% CI [0.790, 1.039], and bias of −1.55 mM (95% LoA [−11.56, +8.46] mM). API–ISE urinary urea comparison confirmed mutual agreement (R2 = 0.9976, slope 95% CI [0.946, 1.024]; bias of +3.47 mM; 95% LoA [−14.60, +21.53] mM), with mean recoveries near 100% (API: 100.7 ± 2.9%; ISE: 100.6 ± 5.4%; 20–350 mM). Both methods agreed with the clinical analyzer, supporting their potential for decentralized, resource-limited testing; clinical and point-of-care validations are needed.

1. Introduction

Urea (CO(NH2)2) is the predominant nitrogenous end-product of whole-body protein and amino acid catabolism, accounting for approximately 80–90% of urinary nitrogen excreted by healthy adults on a regular diet [1,2,3]. Synthesized almost exclusively in the liver via the urea cycle and passively cleared by the kidneys, urinary urea is a direct, accessible biomarker for whole-body protein metabolism and protein oxidation rates [3]. Beyond its traditional diagnostic role in renal and hepatic assessment [4], it has established clinical utility for nitrogen balance evaluation in hospitalized patients [5,6], dialysis adequacy monitoring [7,8], and individualized dietary-protein management in metabolic and sports medicine [1,2,5]. This clinical relevance is currently amplified by the 2025–2030 Dietary Guidelines for Americans, which substantially increased the recommended daily protein ingestion [9]. Therefore, as precision and personalized medicine evolve, accurate quantification of urinary urea is becoming increasingly important for monitoring metabolic health and protein balance [4,5,10,11].
Human urine is a particularly suitable matrix for non-invasive quantification of urea. Under normal physiological conditions, daily urinary urea excretion in healthy adults is reported as 428–714 mmol/day (equivalent to 12–20 g urea nitrogen, or 26–43 g urea per 24 h) [1,12,13]. Depending on hydration status, this yields spot-urine concentrations one to two orders of magnitude above plasma urea (2.6–6.5 mM), thereby reducing the sensitivity requirements relative to blood-based assays and making simplified, low-cost sensor platforms analytically viable [2,14]. Furthermore, non-invasive collection minimizes patient discomfort, eliminates procedural risks inherent to venipuncture, and facilitates longitudinal metabolic tracking through serial sampling, making it ideal for decentralized testing and point-of-care applications [15,16,17]. However, the same matrix poses distinct analytical challenges that have historically hindered reliable quantification of urinary urea. First, the highly variable physiological pH (4.5–8.0) compromises the buffering capacity required for assays that use alkalizing steps or pH-sensitive enzymes (e.g., urease, optimal pH 7.0–7.5) [18,19,20,21]. Second, wide fluctuations in urinary ionic strength (osmolality ~50–1200 mOsm kg−1) driven by hydration status and dietary solute load (predominantly protein and sodium) complicate stable potentiometric measurements. Third, the intrinsic concentration disparity between urinary urea and urinary ammonia has historically led to approximations of urinary urea nitrogen [5], compromising the capacity to discriminate between them. As a result, conventional urinary nitrogen assays conflate two physiologically distinct pools, making it difficult to assess protein oxidation from urinary urea [6,22].
Urinary ammonia is secreted by the renal tubules via ammoniagenesis and is regulated by metabolic and physiological status, showing substantial inter-individual and diet-dependent variability [23]. Therefore, it cannot be treated as a constant background and must be quantified in every sample. A differential urease protocol accomplishes this in four steps: (i) ammonia is measured in an untreated aliquot, giving the endogenous ammonia concentration; (ii) a paired aliquot of the same sample is treated with urease, which hydrolyzes urea stoichiometrically to ammonium (CO(NH2)2 + 2H2O + H+ → 2NH4+ + HCO3); (iii) ammonia is measured in the treated aliquot, giving the sum of endogenous and urea-derived ammonia; and (iv) the difference between (iii) and (i) yields the urea concentration [24]. This paired with/without-urease design decouples the urinary urea signal from the endogenous urinary ammonia background, providing a direct, unconfounded measure of urinary urea as an index of protein oxidation [25].
Despite their clinical importance, routine measurement of urinary urea and urinary ammonia levels still depends on capital-intensive instrumentation, trained operators, and complex laboratory infrastructure, restricting its utility in decentralized, resource-limited, and point-of-care settings. The clinical gold standard for both analytes is enzymatic detection on automated analyzers, such as the Roche Cobas series, which quantifies urea via urease-coupled glutamate dehydrogenase (GLDH) and ammonia directly via GLDH at 340 nm [4,26]. The same GLDH-coupled plasma-ammonia assay can also be used to quantify urinary ammonia after appropriate sample dilution, as validated at major clinical-laboratory centers, including Mayo Clinic Laboratories [27,28]; the Cobas reference method applied in the present study therefore serves as a unified analytical reference for both plasma and urine matrices.
Among lower-cost alternatives, potentiometric detection using ammonium ion-selective electrodes (ISEs) has been used for urinary nitrogen for decades, providing a portable, direct, selective, and reliable method at modest reagent cost [29,30,31,32,33,34]. Potentiometric ammonia sensing relies on either direct ion-selective or gas-sensing principles, a distinction that becomes critical in complex matrices such as urine. The first configuration directly detects ammonium ions via an ionophore (typically nonactin-based polymeric membrane). Although nonactin is selective for ammonium, potassium ion interference becomes analytically significant when potassium exceeds ammonium, as it routinely does in urine [35]. In contrast, after adding a base to the sample, the second configuration ensures that only neutral ammonia passes through a hydrophobic, gas-permeable membrane, thereby excluding ionic interferents by design, making it useful for urine analysis [32,36]. In parallel, colorimetric methods based on the Berthelot reaction have long been used to quantify ammonia—and, following urease hydrolysis, urea. The traditional Berthelot reaction involves the formation of indophenol blue by reacting ammonia with phenol and hypochlorite in an alkaline medium [18,37]. Modern modifications using sodium salicylate offer improved sensitivity and reduced toxicity while maintaining compatibility with high-throughput microplate formats [38,39,40]. This approach closely aligns with the core principles of green analytical chemistry by prioritizing assay miniaturization and minimizing reagent consumption and hazardous waste [41]. Emerging platforms such as wearable electrochemical sensors, smartphone-integrated colorimetric devices, and microfluidic systems have attracted considerable interest [42,43], but they often lack rigorous clinical validation against certified clinical analyzers in human urine [2,15].
In this study, we present and validate two cost-effective, complementary methods for quantifying urinary urea and urinary ammonia using a paired with-urease/without-urease differential design. The underlying protocol relies on splitting a single urine sample into two aliquots. The first aliquot is treated with urease to convert urea to ammonium, yielding a measured signal corresponding to endogenous ammonia and urea. The second aliquot remains untreated and measures the signal corresponding to endogenous urinary ammonia alone. Subtracting the untreated signal from the total post-hydrolysis signal (urease-treated sample) yields a stoichiometric recovery of urinary urea via a well-established differential protocol [25,44]. Method 1 utilizes a urease-coupled ammonium ISE potentiometric assay that is optically independent, ensuring robust accuracy even when analyzing turbid, highly pigmented, or crystal-containing urine samples. Method 2 implements a low-cost colorimetric adaptation for clinical analysis, repurposing an inexpensive consumer-grade aquarium ammonia kit (API® NH3/NH4+, Mars Fishcare; retail cost < US$30 for 130 tests) as a reliable Berthelot–salicylate-based reagent system. To validate these platforms across a broad physiological range, we deployed them on midstream human urine samples collected from a metabolically diverse cohort spanning standard diets, ketogenic regimens, short-term fasting, and acute post-exercise states.
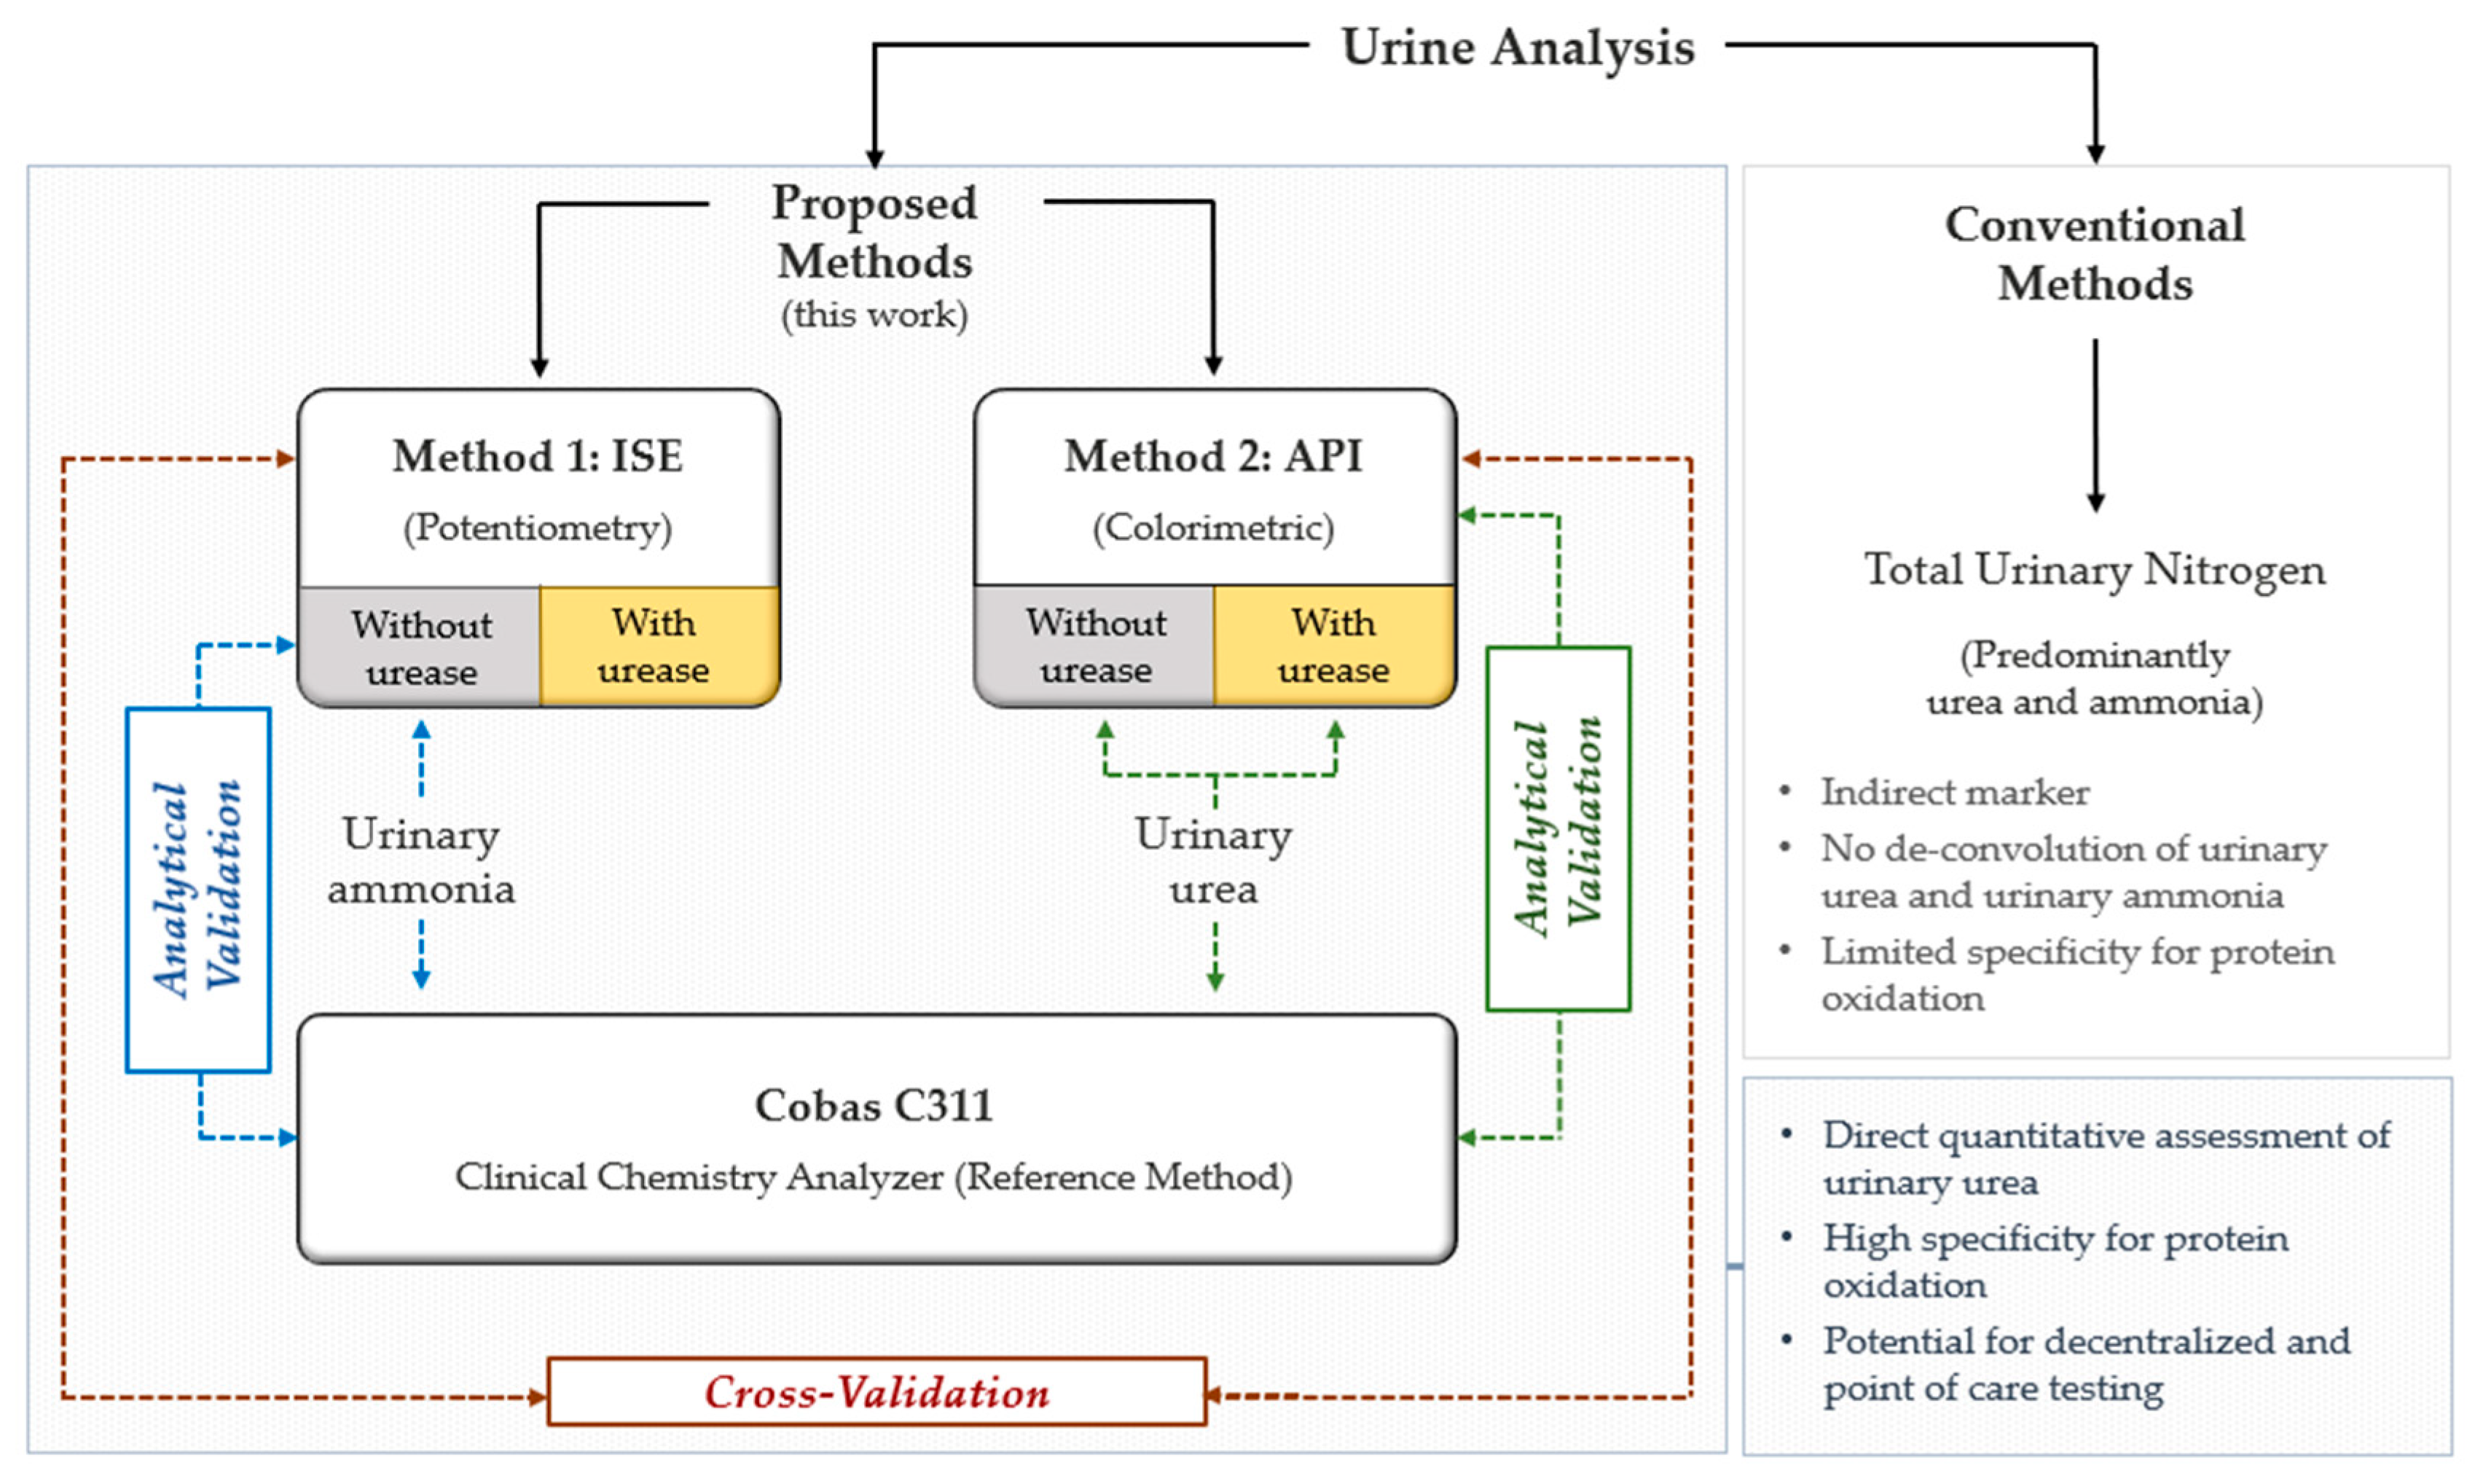
As shown in Scheme 1, Methods 1 and 2 are benchmarked directly against an automated Roche Cobas C311 clinical chemistry analyzer, which serves as the gold-standard reference platform. Specifically, Method 1 is validated against the Cobas C311 NH3L assay for urinary ammonia, while Method 2 is compared against the Cobas C311 assay for urinary urea. Subsequently, a cross-validation phase compares both ISE and API methods head-to-head across a wide physiological range of human urinary urea, using the established ISE as a secondary, internal reference method. This analytical framework enables direct quantitative assessment of urinary urea with high specificity for protein oxidation. To demonstrate this capability, we have rigorously assessed both methods for intra- and inter-day reproducibility, dynamic range, and analytical recovery at clinical concentrations. Ultimately, these findings underscore the potential of these platforms to provide a robust, accessible framework for decentralized testing, point-of-care diagnostics, and global-health applications.

2. Materials and Methods

2.1. Reagents and Materials

All chemicals were of analytical grade and used as received. Ammonium chloride (NH4Cl) was purchased from Spectrum Chemical (New Brunswick, NJ, USA), urea from Fisher Chemical (Pittsburgh, PA, USA), and 1× phosphate-buffered saline (PBS; P0200, pH 7.4 at 25 °C) from Teknova (Hollister, CA, USA). Urease (amidohydrolase, EC 3.5.1.5) from Canavalia ensiformis (Type III, 15,000–50,000 units g−1 solid, Sigma Aldrich, U1500-20KU, St. Louis, MO, USA) was prepared fresh daily at 0.08 g mL−1 in PBS at the start of each day and used within 8 h; residual aliquots were discarded.
For potentiometric measurements, the manufacturer’s ammonia pH-adjusting ionic-strength adjuster (ISA; Thermo Scientific Orion 951211, Waltham, MA, USA) was added to each sample or to a calibration standard in matched volume (reagent; 20 µL/mL reaction) immediately before electrode measurement. The ISA raises the sample pH above 11 to drive the NH4+/NH3 equilibrium toward dissolved ammonia (the species selectively detected by the gas-permeable membrane of the electrode), saturates the ionic strength of the analyte solution to ensure reproducible activity coefficients across varying sample compositions, and prevents ammonia complexation by trace metal ions [15]. Adding ISA to all calibration standards in matched volumes ensures an equivalent ionic background throughout (see Section S1: ISE Mechanism and Theory [32,34,36]).
Ammonia calibration standards were prepared from NH4Cl in deionized water at 0.3–100 mM (potentiometric method) and 0–1.0 mM (colorimetric method). Urea calibration standards were prepared in PBS, pH 7.4, at 0.01–100 mM (potentiometric method) and 0.05–1 mM (colorimetric working range; extended to 100 mM for Langmuir saturation characterization only, not for quantification). All standards were stored at 4 °C for no longer than 7 days.

2.2. Reference Clinical Analyzer (Roche Cobas C311)

Reference measurements were performed on a Roche Cobas C311 clinical analyzer (Roche Diagnostics, Indianapolis, IN, USA). Ammonia was quantified using the NH3L second-generation enzymatic assay (reagent cassette catalog number 07229593190, test ID 0-168), in which ammonia is quantified by the GLDH-catalyzed reductive amination of 2-oxoglutarate (NH4+ + 2-oxoglutarate + NADPH → L-glutamate + NADP+ + H2O), monitored as the decrease in NADPH absorbance at 340 nm against a 629 nm reference (Roche NH3L Method Sheet, V 9.0, 2014). Manufacturer-specified performance characteristics: measuring range 10–700 µmol L−1; lower detection limit 10 µmol L−1 (3 SDs above zero, n = 30); repeatability CV 2.2% and intermediate-precision CV 3.6% at 60 µmol L−1; repeatability CV 0.9% and intermediate-precision CV 1.8% at 231 µmol L−1. Calibration was performed using the Roche Ammonia/Ethanol/CO2 Calibrator (catalog no. 20751995 190) with linear regression, and quality control using the matched Normal and Abnormal controls (catalog no. 20752401 190 and 20753009 190) before sample analysis [45].
Urea was quantified using the Cobas enzymatic urease–GLDH method: urease hydrolyzes urea to ammonium, which is then quantified by the same GLDH-coupled NADPH-consumption assay described above. Although the NH3L assay is validated by the manufacturer for EDTA plasma, the same GLDH assay has previously been adapted in clinical reference laboratories for the quantification of urinary ammonium after appropriate sample dilution [28]. In the present study, urine samples were pre-diluted in deionized water using a sample-adaptive factor (typically 1:50–1:500 for urinary ammonia, 1:80 to 1:3000 for urinary urea) selected to bring the diluted-sample analyte concentration within the validated 10–700 µmol working range. All reported concentrations were back-calculated to undiluted urine by multiplying by the per-sample dilution factor (Section S6: Tables S4 and S5). The estimated per-sample reagent cost for Cobas and the two proposed methods is provided in Section S4 (Table S1).

2.3. API Berthelot–Salicylate Aquarium Reagent System

Among commercially available consumer aquarium ammonia test kits, we used the modified Berthelot–salicylate reaction (API®), in which ammonia reacts with sodium salicylate and hypochlorite in an alkaline medium, catalyzed by sodium nitroprusside, to form an indophenol-blue chromophore. The API® Ammonia NH3/NH4+ Test Kit (Mars Fishcare North America, Inc., Chalfont, PA, USA; Lot E45D1CHAM1) was selected because its underlying chemistry is mercury-free, homogeneous, microplate-compatible, and chemically equivalent to the Berthelot–salicylate reagents used in clinical urea/ammonia assays (see Section S2: Colorimetric (API) Principles) [38,39,40,46,47,48]. This kit provides 130 tests at a retail cost of <US$30 and contains two pre-formulated dropper liquid reagent bottles: Solution 1 and Solution 2. Solution 1: According to the manufacturer’s Safety Data Sheet [49], the chromogenic reagent consists of polyethylene glycol (CAS 25322-68-3, >60% w/w) as the carrier, sodium nitroprusside (CAS 14402-89-2, 1–10% w/w) as the catalyst, and sodium salicylate (CAS 54-21-7, 1–10% w/w) as the salicylate donor for the Berthelot–salicylate reaction; the manufacturer withholds exact concentrations within these declared weight ranges as trade secrets. Solution 2: It contains sodium hydroxide and sodium hypochlorite as the alkalizing and oxidizing reagents, respectively, per the manufacturer’s product documentation [50]; its precise composition is proprietary, similarly to solution 1, but the combined effect of Solution 2 addition is to raise the reaction pH to approximately 12, ensuring complete deprotonation of NH4+ to NH3 and rendering the chromophore yield independent of urinary pH. PBS pre-dilution (Section 2.6.1) further reduces ionic-strength variability across samples. Reproducibility of the proprietary formulation and the efficacy of the per-run calibration strategy for mitigating lot-to-lot variation are examined in the Discussion.

2.4. Urine Sample Collection and Handling

Ten healthy adult volunteers (5 males, 5 females; aged 21–65 years) were recruited following approval by the Arizona State University Institutional Review Board (IRB Protocol STUDY00016374). Written informed consent was obtained from all participants before enrollment. Participants were sampled across diverse physiological states, including normal diet, ketogenic diet, fasting, and post-exercise conditions, to span the breadth of urinary urea and urinary ammonia concentrations encountered in routine clinical and metabolic monitoring practice.
Midstream urine was collected in sterile polypropylene containers and processed within 2 h of collection: samples were centrifuged at 3500 rpm for 15 min at 22 °C to remove particulate matter, and 10 mL of clarified supernatant was transferred to fresh polypropylene tubes. Samples were either analyzed the same day or stored at −20 °C for no longer than 48 h before analysis; freeze–thaw cycles were limited to one. Urine pH was recorded at the time of analysis using a Thermo Scientific Orion Star A214 pH/ISE meter calibrated with Thermo Scientific Orion Application Solution buffers at pH 4.01 (catalog no. 910104), 7.00 (catalog no. 910107), and 10.01 (catalog no. 910110) prior to each measurement session. This measurement verified the expected urine pH range for healthy participants and was not used for any additional purposes.
From the full collected dataset, paired-measurement subsets of n = 10 samples each were used for the two head-to-head Cobas comparisons (Section 2.7.2); the cross-method ISE–API comparison used n = 10 paired samples (Section 2.7.3).

2.5. Method I: Enzymatic Potentiometric Quantification (Ammonium ISE)

2.5.1. Sample Preparation for ISE Analysis

Following the initial centrifugation described in Section 2.4, a 5 mL volume of either fresh or thawed urine was centrifuged a second time under identical conditions (3500 rpm, 15 min, 22 °C). A 3 mL aliquot of clarified supernatant was carefully collected from the upper layer and transferred to a clean 15 mL tube. A 1:1000 working dilution was prepared by adding 10 µL of clarified urine to 9990 µL of PBS (pH 7.4). This dilution factor was determined from preliminary studies to bring analyte concentrations within the Nernstian linear range of the ISE (see Section 3.1.1) while minimizing matrix effects from urinary ionic strength.

2.5.2. Enzymatic Hydrolysis with Urease for ISE Analysis

Urea-to-ammonium conversion was done by adding 130 µL of freshly prepared urease solution (0.08 g mL−1 in PBS, pH 7.4) to 2 mL aliquots of each diluted urine sample or calibration standard, according to the reaction CO(NH2)2 + 2 H2O + H+ → 2 NH4+ + HCO3. The 130 µL urease operating volume was selected from an 11-point volume-titration study (Section S1.1: Urease Volume Optimization), which established that the ISE response reaches a single-exponential plateau at V95 ≈ 102 µL; then, 130 µL provides a safety margin above this threshold, ensuring substrate saturation across all sample dilutions.
Reaction mixtures were incubated at 25 °C with orbital shaking for 5 min in capped tubes to allow complete hydrolysis under the dilution conditions used. Three blanks were prepared for each measurement session: (i) Blank 1 (no-urease blank; 2 mL diluted urine + 130 µL PBS + 40 µL ISA) captures the combined electrode baseline and endogenous urinary signal (preexisting ammonia, and potential matrix interferents) in the absence of enzymatic conversion; (ii) Blank 2 (reagent blank; 2 mL PBS, 130 µL urease, and 40 µL ISA) establishes the electrode baseline response in the presence of urease, and (iii) Blank 3 (system-quality blank; 2 mL PBS + 40 µL ISA) controls for the buffer and electrode and is not used in the per-sample signal correction equation.

2.5.3. Potentiometric Detection

Ammonia was quantified using a Thermo Scientific gas-sensing electrode (ISE; Model 9512HPBNWP, Waltham, MA, USA) connected to a Thermo Scientific Orion Star A214 pH/ISE meter with automatic temperature compensation. Before each measurement session, the electrode was conditioned in a 10−4 M NH4Cl solution for 30 min. Immediately before measurement, 40 µL of ISA was added to each 2 mL reaction mixture to raise the pH to ≥11 and drive quantitative conversion of NH4+ to NH3 at the gas-permeable membrane of the electrode. Potential (mV) was recorded under stirring after signal stabilization (±0.1 mV changes over 10 s), with a maximum equilibration time of 5 min per sample.
Daily calibration curves were constructed by plotting measured potential (mV) against log10[analyte] (mM) using per-run ordinary least-squares (OLS) regression, yielding slope, intercept, and R2. Two parallel calibrations were performed: (i) a urease-coupled urea calibration using five log-spaced urea standards (0.01, 0.1, 1.0, 10, 100 mM in PBS, pH 7.4) processed through the full urease + ISA + ISE method, and (ii) a direct-ammonia calibration using eight NH3 standards (0.3, 0.5, 0.7, 0.9, 1, 10, 50, 100 mM in PBS) processed with ISA only (no urease), isolating the electrode response from the enzymatic step, providing an internal consistency check of the electrode performance and ammonia concentration intrinsic detection. The corrected analytical signal was computed as:
E s a m p l e =   E t e s t   E b l a n k 1 +   E b l a n k 2
where Etest is the potential of the urease-treated sample, Eblank1 is the potential of the no-urease blank, and Eblank2 is the potential of the reagent blank. The −Eblank1 term removes the endogenous-urine and electrode-baseline contributions; the +Eblank2 term restores the electrode baseline measured in the presence of urease, ensuring that the corrected sample signal is referenced to the same baseline as the urease-coupled urea calibration standards (Section 2.5.2). The resulting Esample was converted to urea concentration via the same-day urease-coupled calibration curve and back-calculated to the undiluted urine using the per-sample dilution factor. Urinary ammonia concentration was obtained directly from Eblank1 using the same-day direct-ammonia calibration curve and back-calculated as previously described. All volumetric transfers were performed using Eppendorf Research® plus micropipettes (20, 200, and 1000 µL; Hamburg, Germany) with regular gravimetric verification. A schematic of the complete ISE method workflow is presented in Figure S8.

2.6. Method II: Enzymatic Colorimetric Quantification (Berthelot–Salicylate, API)

2.6.1. Sample Preparation for API Analysis

Urine samples were clarified by the same two-step centrifugation protocol described in Section 2.5.1. Working dilutions were prepared in PBS (pH 7.4) at 1:100, 1:500, 1:1000, and 1:2000; the dilution factors were selected so that the corrected absorbance fell within the validated linear range of the colorimetric assay (0.1–1.0 mM; see Section 3.1.2). For routine adult urine (100–500 mM urea), 1:500 placed the diluted urea near the center of the linear window; higher dilutions (1:1000–1:2000) were used for concentrated specimens (>500 mM). The broader dilution range relative to the ISE method reflects the narrower linear range of the colorimetric method.

2.6.2. Enzymatic Hydrolysis with Urease for API Analysis

This measurement was performed in a 96-well microplate (Costar® Stripwell™, Corning Inc., Kennebunk, ME, USA; flat-bottom, polystyrene). Urease was reconstituted in 1× PBS buffer, pH 7.4, at 0.08 g mL−1 immediately before each session. To drive hydrolysis to completion, each microplate well received 13 µL of urease solution and 160 µL of standard or diluted sample, followed by a 5 min incubation at 25 °C under orbital shaking. A paired no-urease blank was prepared for each urine sample by substituting 13 µL of PBS for the urease solution; this blank captures endogenous ammonia and serves as the subtraction reference for urea quantification, in direct analogy to the ISE method.

2.6.3. Colorimetric Detection

After enzymatic incubation, chromophore development was completed by sequentially adding 13 µL of Solution 1 and 13 µL of Solution 2 from the API® NH3/NH4+ kit directly to each well, followed by 2 min of orbital shaking at 25 °C for each addition. The final per-well reaction volume was 199 µL. Under the resulting alkaline conditions, ammonia liberated by urease reacts with hypochlorite to form a monochloramine intermediate, which then condenses with salicylate (catalyzed by nitroprusside) to yield the 5-aminosalicylate indophenol derivative absorbing at λmax = 670 nm [38,39,40,51].
Absorbance at 670 nm was acquired on a SpectraMax® i3x microplate reader (Molecular Devices, San Jose, CA, USA) in kinetic mode (60s intervals over 20 min at 25 °C; the plateau value within this window was used as the analytical endpoint [39]. Same-day calibration was performed in parallel for urea (urease-coupled method) and ammonia (direct, bypassing urease), using the same kit and plate format as for the samples.
Quantification was performed exclusively within the validated linear Beer–Lambert range (0.1–1.0 mM; R2 ≥ 0.99 per run) using per-run OLS regression of blank-corrected absorbance against standard concentration. The full-range response profile (0.1–100 mM) and Langmuir saturation characterization are discussed in Section S2 (Linear Range and Detection Limits). Two on-plate blanks were used for absorbance correction: (i) a reagent blank (PBS + urease + Solution 1 + Solution 2, no urea) to subtract background color, and (ii) per-sample no-urease blanks (diluted urine + PBS + Solution 1 + Solution 2, no urease) to subtract endogenous urine coloration and endogenous ammonia on a per-sample basis. The urea concentration of each urine sample was calculated as: [(absorbance of urease-treated well) − (absorbance of paired no-urease blank) − (absorbance of reagent blank)] ÷ (per-run calibration slope) × (dilution factor). The complete plate layout, stepwise protocol, and performance validation are provided in Figure S9.

2.7. Method Validation and Statistical Analysis

2.7.1. Calibration and Reproducibility

Per-run calibration parameters (slope, intercept, R2) were obtained by OLS regression. Independent calibrations were performed on n = 10 separate days for both the potentiometric and the colorimetric methods. Inter-day reproducibility is reported as the mean and standard deviation ( x ¯ ± SD) of the per-run slopes, intercepts, and R2 values (Section S5). Limits of detection (LOD) and quantification (LOQ) were calculated according the International Council for Harmonization (ICH) guideline Q2(R1), Validation of Analytical Procedures: Text and Methodology, using the equations LOD = 3.3 σ/S and LOQ = 10 σ/S, where σ is the standard deviation of the y-intercept across the calibration runs, and S is the slope of the calibration curve [52]. Note that this ICH formula is applied only to the colorimetric (linear Beer–Lambert) method; for the potentiometric method, which yields a logarithmic Nernstian response, the lower analytical limit is reported as the lowest standard concentration at which R2 ≥ 0.99 is maintained across all calibration runs (see Section 3.1.1). All measurements were performed in triplicate, with intra-replicate acceptance criteria: CV < 5%.

2.7.2. Method Comparison Against the Cobas C311 Reference

Two head-to-head comparisons against the Roche Cobas C311 were performed on n = 10 paired samples each, as described in Section 2.4, with each method compared at the analytical endpoint. The ammonium ISE method was compared at the ammonia level using the Cobas NH3L GLDH-coupled method (Section 3.2.1); since urease conversion is stoichiometrically quantitative (1 mol urea → 2 mol NH4+), agreement at the ammonia level validates the ISE for indirect urea quantification via the urease-coupled method. The Berthelot–salicylate API method (API) was compared at the urea level using the Cobas NH3L channel after urease treatment (Section 3.2.2).
Sample-adaptive predilution was applied independently for each platform (deionized water for Cobas; PBS, pH 7.4, for ISE and API) to bring undiluted urinary analytes into the validated working range of each method; reported concentrations are back-calculated to undiluted urine throughout. Per-sample metadata, dilution factors, raw readings, and back-calculated concentrations are listed in Section S6.
Method-comparison statistics were computed for both urea methods, API and ISE, as follows. OLS regression of the evaluated urea method against the Cobas reference yielded a slope, intercept, and R2 calculated parametrically with 95% confidence intervals (CIs) from the regression residual variance. Statistical equivalence with the reference was inferred when the 95% CI slope was close to 1, and the 95% CI intercept was close to zero. Bland–Altman analysis was performed on the same paired data to obtain the mean bias, the standard deviation of the differences, and the 95% limits of agreement (LoA = mean bias ± 1.96 × SD) [53]. In addition, Lin’s concordance correlation coefficient was computed for the API–Cobas urea comparison (Section 3.2.2). Furthermore, recovery tests were performed, and the mean recovery of the urea methods relative to Cobas was reported as the mean ± SD of the per-sample ratio (method/Cobas) × 100%.

2.7.3. Cross-Method Comparison Across the Full Physiological Urea Range

To extend the Cobas-anchored validation across the full physiological urinary urea range, the colorimetric (API) and potentiometric (ISE) methods were compared head-to-head across n = 10 paired urine samples spanning 0–470 mM undiluted urea (Section 3.3) from healthy volunteers under physiological conditions described in Section 2.4. Both methods were applied to each sample in parallel using the same urease lots and microplate methods; sample-adaptive dilution was applied independently for each method to bring readings within the respective validated linear ranges. OLS regression was used to estimate the slope, intercept, and R2, with 95% CIs; Bland–Altman analysis of the same paired data yielded the mean bias, SD of differences, and 95% LoA (Table S6).

2.7.4. Spike–Recovery Experiments

Matrix interference was assessed by spiking pooled midstream urine with urea at four concentrations (20, 80, 180, and 350 mM) and assaying in parallel using both methods. Recovery was calculated as [(measured concentration − endogenous concentration)/spiked × 100%], where the endogenous concentration was obtained from the non-spiked aliquot of the same pool measured in the same run. Reported values are the mean ± SD across four spike levels; inter-method differences at matched spike levels were evaluated by a paired t-test (α = 0.05).

2.7.5. Statistical Analysis

Data handling and primary statistical analyses—including ordinary least-squares regression, Bland–Altman analysis, ICH Q2(R1) LOD/LOQ calculations, spike–recovery evaluations, and paired t-tests—were performed using Microsoft® Excel® for Microsoft 365 MSO (Version 2506, Build 18925.20184, 64-bit; Microsoft Corporation, Redmond, WA, USA). All figures were prepared in OriginPro 2025b (OriginLab Corporation, Northampton, MA, USA).

3. Results

3.1. Calibration of Each Method Against Standards

3.1.1. Potentiometric (ISE) Calibration

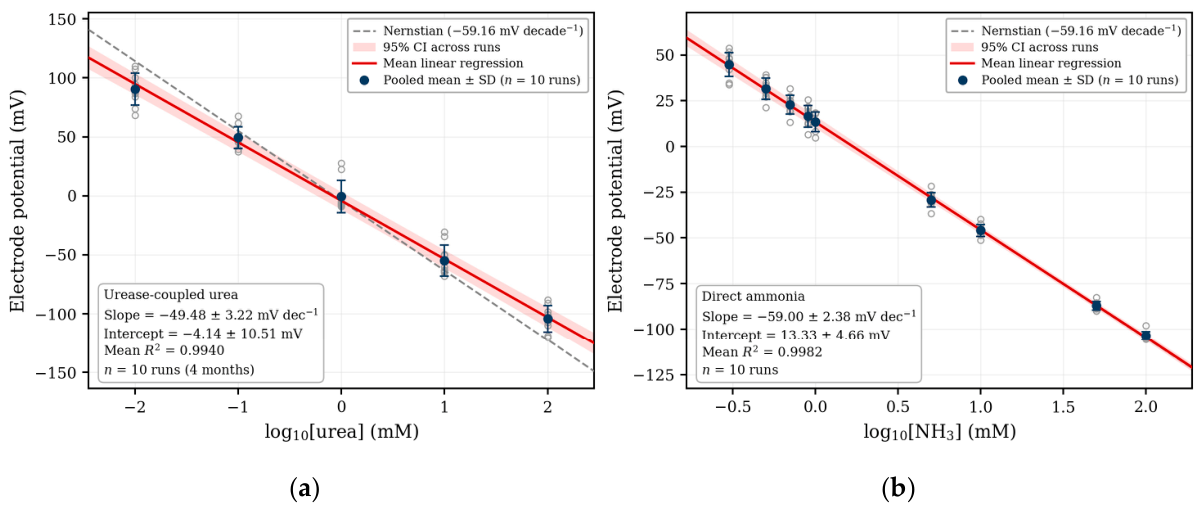
Overlaid calibration curves for the urease-coupled urea method and the direct-ammonia assay are shown in Figure 1a and Figure 1b, respectively. Per-run calibrations were fit as electrode potential (mV) versus log10[analyte] (mM) by unweighted ordinary least-squares regression; the theoretical Nernstian slope for a monovalent ion at 25 °C is −59.16 mV decade−1. Across 10 independent runs (per-run parameters in Table S2, Figures S10 and S11), the urease-coupled urinary urea ISE method gave an averaged slope of −49.48 ± 3.22 mV decade−1 (mean ± SD; CV ~6.5%), and the direct urinary ammonia method showed a mean slope of −59.00 ± 2.38 mV decade−1 (CV 4.0%). The direct urinary ammonia slope closely approaches the theoretical Nernstian value, confirming that NH4+ is detected by the gas-permeable ammonia-selective electrode at its thermodynamic limit. The urea method was systematically sub-Nernstian (slope −49.48 vs. −59.00 mV decade−1; ~16% lower than direct urinary ammonia) and showed greater inter-day intercept dispersion (SD of intercepts: 10.51 mV vs. 4.66 mV for direct urinary ammonia). This difference could be due to the additional enzymatic conversion step and small differences in enzyme solution dilutions. Per-run linearity was nonetheless excellent for both the urinary urea ISE method (mean R2 = 0.9940) and the urinary ammonia (mean R2 = 0.9982), with all retained runs R2 ≥ 0.99; Table S2.
To ensure quantitative accuracy, the urease step must operate within the enzyme-saturated, conversion-independent plateau. A urease-concentration titration (Figure S2) confirmed that the ISE response remains independent of enzyme concentration within the selected range and pH values (Section 2). Thus, any observed sub-Nernstian urea slope may have originated from small concentration differences rather than incomplete hydrolysis.
Because the ISE response is logarithmic in analyte activity, the analytically meaningful LOD is defined by the lowest concentration at which the calibration retains a near-Nernstian slope and per-run linearity (R2 ≥ 0.99). Across the 10 calibration runs (Table S2), this lower bound was 0.01 mM for urea (urease-coupled method) and 0.3 mM for ammonia (direct method). At the working urine dilutions of 1:100 to 1:600 in PBS, these limits map to undiluted urinary urea concentrations of 1–6 mM—two orders of magnitude below the physiological lower bound of ~100 mM (reaching ~1000 mM in concentrated specimens)—confirming that the ISE method has ample dynamic-range headroom across all clinical states.

3.1.2. Colorimetric (API) Calibration

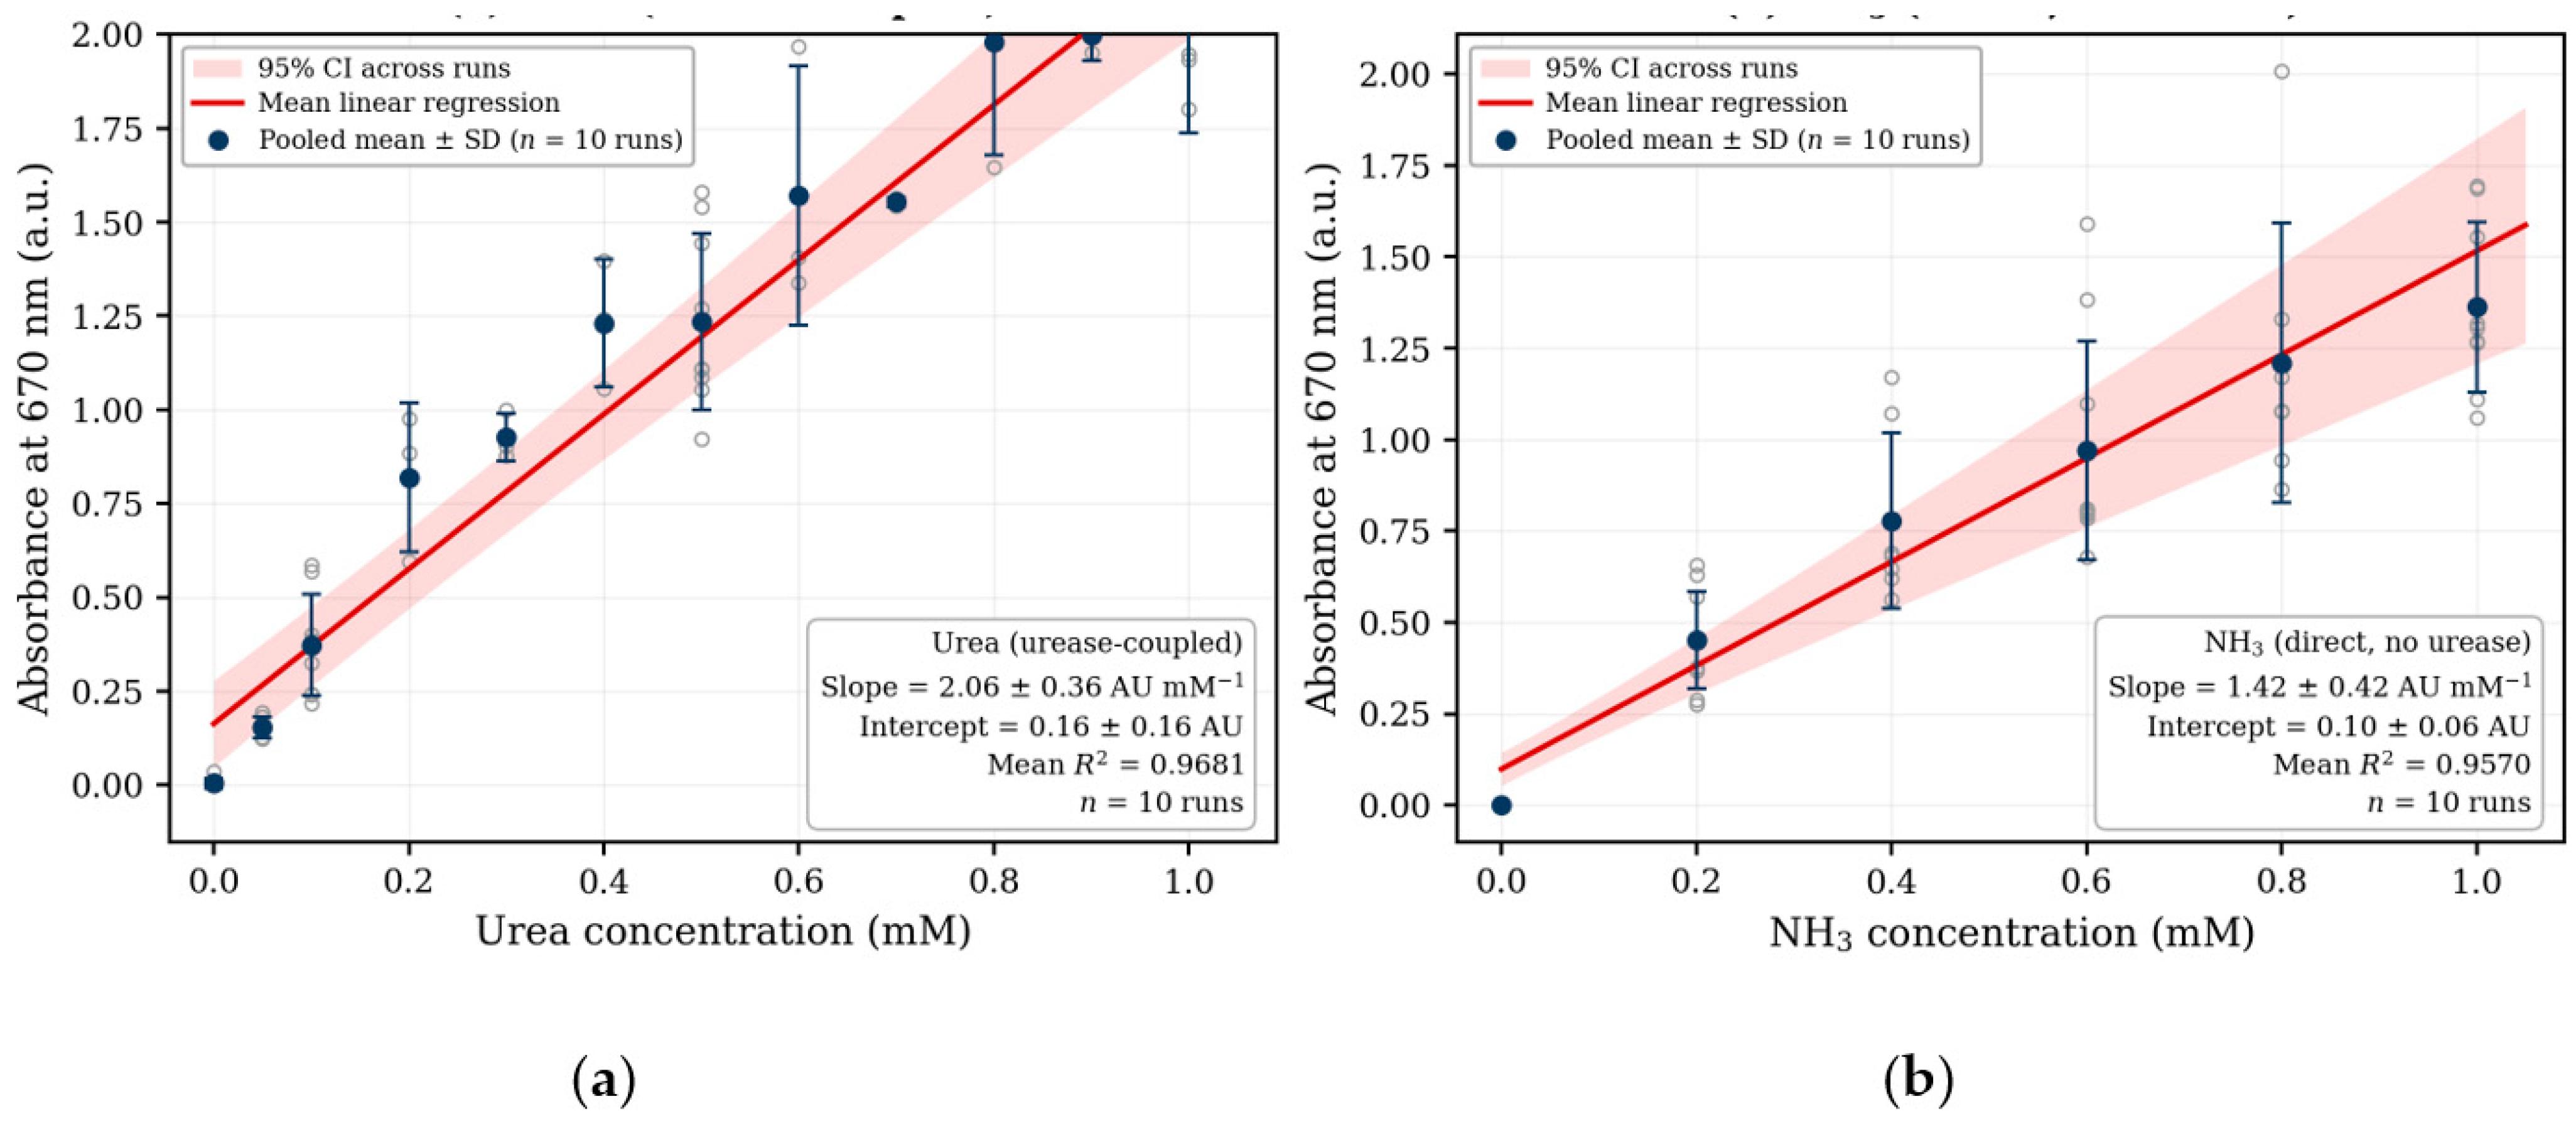
The API® colorimetric assay was calibrated against urea standards in PBS as described in Section 2.6. The calibrations for urinary urea and urinary ammonia are shown in Figure 2a,b, respectively; the extended-range characterization and dilution-selection logic are shown in Figures S5 and S6. Calibrations were fitted with linear equations; non-linear Michaelis–Menten-like fitting would also be applicable.
Unlike the logarithmic response of ISE, the Berthelot–salicylate absorbance (measured in absorbance units, AU) shows a dynamic response within a narrow, low-concentration window. Evaluation across a 0.1–400 mM range (Figure S5) reveals that absorbance rises linearly up to ~1 mM, peaks, and then declines progressively at higher concentrations. This collapse is more pronounced for urea than for ammonia due to the 2:1 ammonia-per-urea stoichiometry of enzymatic hydrolysis, which exhausts the fixed concentrations of hypochlorite and salicylate twice as rapidly per mole of analyte. These experiments were employed to rationalize the dilution strategy, and all quantification was performed exclusively within the 0.1–1.0 mM linear regime, with urine samples pre-diluted (1:100–1:2000).
Quantitation was performed exclusively within the validated linear sub-range of 0.1–1.0 mM urea, where the response obeyed Beer–Lambert behavior (calibration: y = 2.06 AU mM−1 x + 0.16 AU; per-run parameters in Table S3). Following the ICH Q2(R1) method, LOD and LOQ were 0.01 mM urea and 0.03 mM urea, respectively. The direct urinary ammonia calibration of the same reagent system (urease omitted) gave a slope (1.42 ± 0.42 AU mM−1) over the same 0.1–1.0 mM linear window, with LOD = 0.07 mM ammonia and LOQ = 0.22 mM ammonia. With the routinely used 1:500 dilution, the 0.1–1.0 mM linear window maps onto an effective undiluted range of ~50–500 mM, comfortably bracketing the physiological urinary urea window; higher dilutions (up to 1:1000–1:2000) extend quantitation to concentrated specimens.

3.2. Validation of ISE and API Against the Cobas C311 for Ammonia and Urea, Respectively

The ISE and API methods were independently validated against the Roche Cobas C311 analyzer. Exploiting the 1   urea : 2   NH 4 + stoichiometry of urease hydrolysis, the ISE method was directly evaluated for urinary ammonia (Figure 3), whereas the API method—incorporating the urease step—was validated for urinary urea (Figure 4).

3.2.1. Ammonium ISE Versus Cobas C311 (Ammonia Level, n = 10)

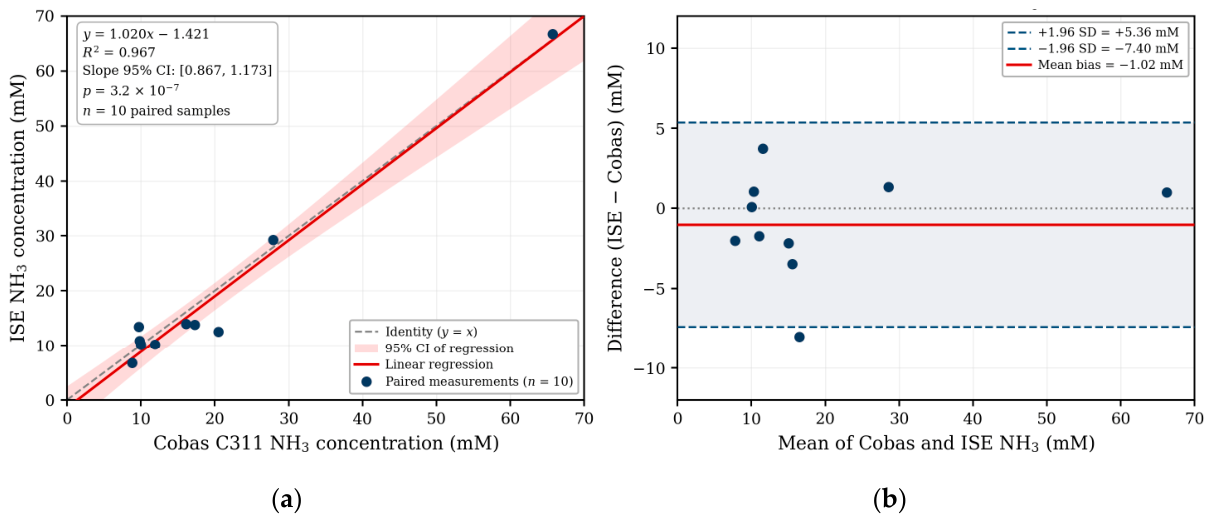
To evaluate the method across diverse metabolic conditions, urine samples from ten distinct participants were analyzed. OLS regression of the ISE against the Cobas analyzer for ammonia quantification (Figure 3a) yielded a slope of 1.020 (95% CI: 0.867 to 1.173), an intercept of −1.42 mM (95% CI: −5.35 to +2.51 mM), and a coefficient of determination R2 = 0.967 (p = 3.18 × 10⁻⁷, n = 10) across ammonia concentrations ranging from 8.80 to 65.70 mM. Because the confidence intervals for the slope and intercept include unity and zero, respectively, the ISE method demonstrates no significant proportional or constant bias relative to the clinical reference. Bland–Altman analysis (Figure 3b) confirmed this agreement, revealing a mean bias of −1.02 mM, an SD of differences of 3.26 mM, and 95% limits of agreement of −7.40, +5.36 mM.
Figure 3. Validation of the ammonium ISE against the Roche Cobas C311 clinical analyzer for urinary ammonia quantification in urease-treated paired samples (n = 10) from healthy volunteers. (a) OLS regression: y = 1.020 x − 1.42, R2 = 0.967, p = 3.18 × 10⁻⁷; slope 95% CI [0.867, 1.173] includes unity. Solid red line: linear regression; shaded band: 95% confidence interval on the regression; dashed gray line: identity. (b) Bland–Altman analysis: mean bias = −1.02 mM, SD of differences = 3.26 mM, 95% limits of agreement [−7.40, +5.36] mM. Source data are listed in Table S4.
Analytica 07 00051 g003

3.2.2. Berthelot–Salicylate (API) Versus Cobas C311 (Urea Level, n = 10)

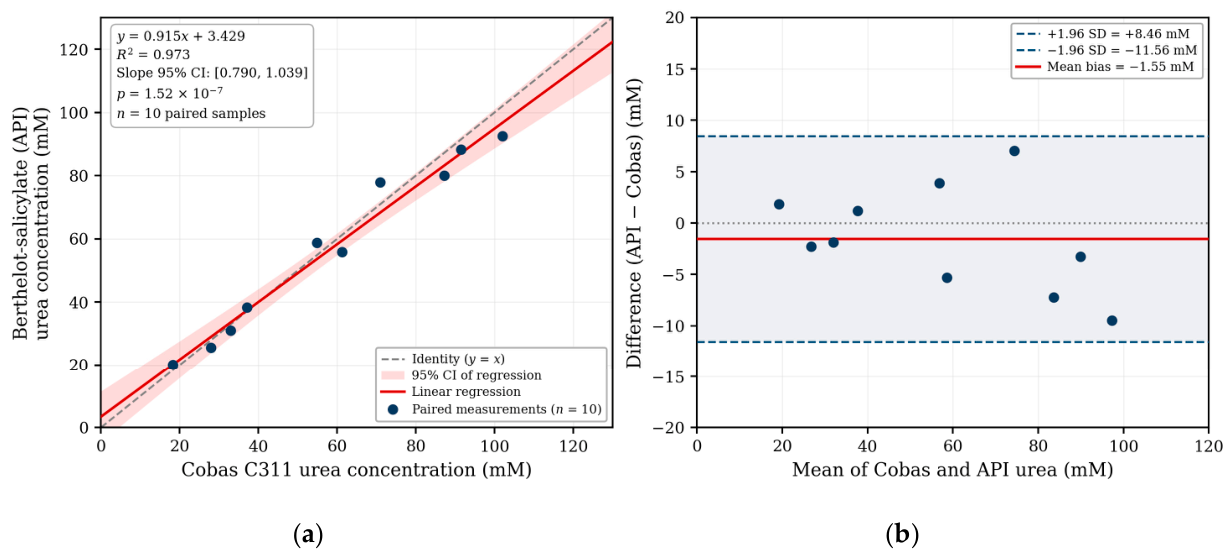
OLS regression of API against Cobas reference for urinary urea (Figure 4a) yielded a slope of 0.915 (95% CI: 0.790 to 1.039), an intercept of +3.43 mM (95% CI: −4.63 to +11.49 mM), and a coefficient of determination R2 = 0.973 (p = 1.52 × 10⁻⁷, n = 10). Consistent with the ISE evaluation, the confidence intervals for the slope and intercept include unity and zero, respectively, confirming the absence of significant proportional or constant bias. Bland–Altman analysis (Figure 4b) revealed a mean bias of −1.55 mM, an SD of differences of 5.11 mM, and 95% LoA of −11.56 to +8.46 mM. Method agreement was further supported by Lin’s concordance correlation coefficient (CCC) of 0.98. Per-sample metadata, dilution factors, and raw Cobas and API readings are listed in Table S5.
Figure 4. Validation of API method against the Roche Cobas C311 clinical analyzer for urea quantification in human urine (n = 10 paired samples from healthy adult volunteers). Urease concentration: 1200–4000 U/mL. (a) OLS regression: y = 0.915 x + 3.43, R2 = 0.973, p = 1.52 × 10⁻⁷; slope 95% CI [0.790, 1.039] includes unity. (b) Bland–Altman analysis: mean bias = −1.55 mM, SD of differences = 5.11 mM, 95% LoA [−11.56, +8.46] mM. Lin’s concordance correlation coefficient = 0.98; mean recovery (API/Cobas) = 98.6 ± 8.1%. Source data are listed in Table S5.
Analytica 07 00051 g004

3.3. Cross-Method Comparison: API Method vs. ISE Method

A comprehensive method comparison was performed using urine samples from 10 healthy volunteers representing diverse physiological conditions, including a normal diet, a ketogenic diet, fasting states, and post-exercise samples. This sample diversity ensured evaluation across a broad range of urea concentrations. Although higher dilutions were required for the salicylate method to mitigate sensor saturation at elevated urea levels, the robust correlation remained within the 0–470 mM range.
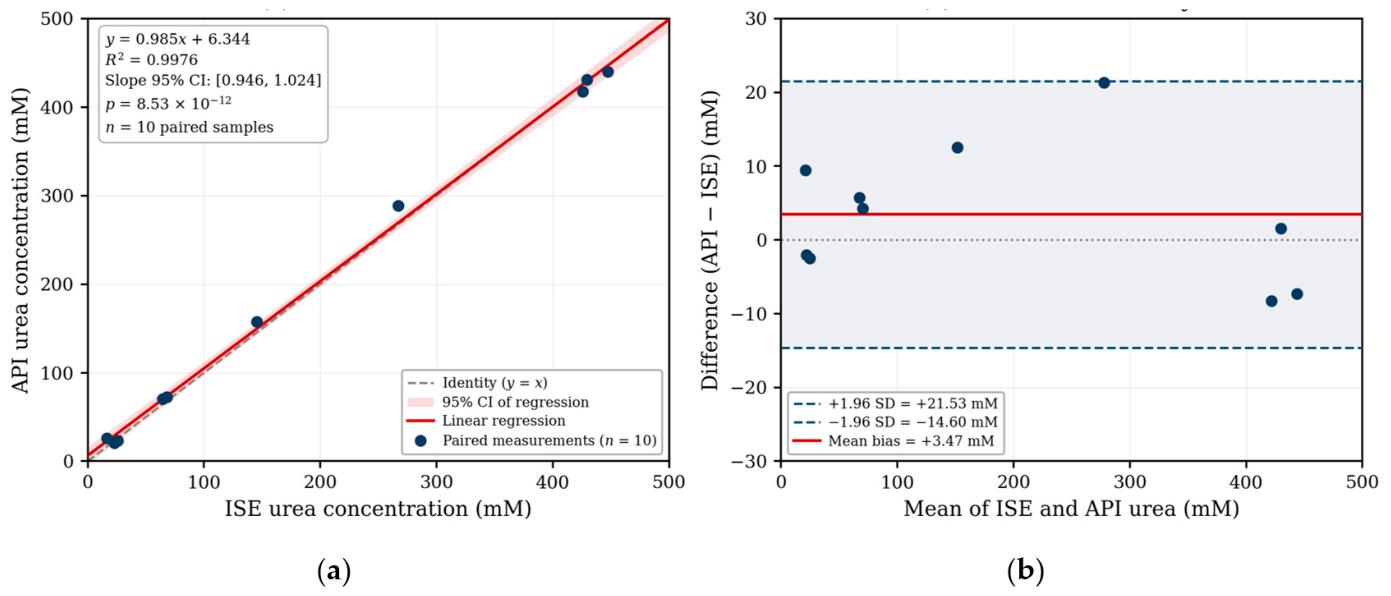
Linear regression of the API urea method against the ISE urea method (Figure 5a) yielded a slope of 0.985 with 95% confidence interval [0.946, 1.024], which includes unity, and an intercept of 6.34 mM with 95% CI [−3.76, 16.45] mM, which includes zero. The coefficient of determination R2 = 0.9976 indicates strong agreement. The Bland–Altman analysis (Figure 5b) further characterized inter-method agreement in the absolute-difference space. The mean bias (API − ISE) was +3.47 mM (95% CI [−3.25, +10.19] mM), indicating that API tends to read slightly higher than ISE; the bias confidence interval includes zero and corresponds to less than 2% of the mean concentration (192.99 mM). The 95% limits of agreement spanned [−14.60, +21.53] mM, with no apparent concentration-dependent bias (proportional error). This demonstrates that the cost-effective potentiometric (ISE) method and repurposed colorimetric (API) method produce mutually consistent urinary urea quantification across a physiologically relevant concentration range.
The spike–recovery experiment was performed using pooled urine across a physiological range (direct clinical validation = 18–102 mM; head-to-head = up to 447 mM). To provide an independent check on cross-method accuracy in the same concentration window, pooled midstream urine was spiked with urea at four levels (20, 80, 180, and 350 mM) and assayed in parallel by both methods. Mean recoveries were API: 100.7 ± 2.9% (range 97.6–103.9%) and ISE: 100.6 ± 5.4% (range 95.0–108.0%), with no statistically significant difference between methods at matched spike levels (Table 1).

4. Discussion

4.1. Analytical Performance and Calibration Reproducibility

A distinctive feature of the paired colorimetric calibrations is that the urease-coupled urinary urea and direct urinary ammonia assays yielded pooled slopes of 2.06 ± 0.36 and 1.42 ± 0.42 AU·mM−1, respectively, across ten independent sessions each (Figures S12 and S13; Table S3). Although these values are in the same order of magnitude, the ratio does not equal 2:1 as would be expected if the colorimetric step were strictly rate-limiting. The 2:1 ammonia-per-urea stoichiometry of enzymatic hydrolysis predicts that the urea-coupled calibration should yield double the absorbance per mole compared to free ammonia, since each mole of urea releases two moles of NH4+, if the reagents are not depleted within the working range. The observed ratio of approximately 1.4:1 (urinary urea: urinary ammonia slopes) instead indicates that the hypochlorite and salicylate reagents in the API® kit are partially stoichiometry-limiting even within the 0.1–1.0 mM window, such that the additional ammonia load from urea hydrolysis partially saturates the chromogenic step. This interpretation is fully consistent with the extended full-range response profiles (Figures S5a and S6a): the urea calibration saturates sharply above 1 mM, whereas the ammonia calibration peaks near 6 mM, a factor-of-six shift in concentration at peak absorbance, corresponding to the ~2× molar ammonia load per mole of urea.
These two calibrations differ in inter-run dispersion. The direct ammonia assay produced a tighter linear fit (mean per-run R2 = 0.9570 vs. 0.9681 for urea; Table S3) and a higher slope CV across sessions (29.9% for direct urinary ammonia vs. 17.6% for urinary urea, all 10 runs). For urinary urea detection, the urease enzymatic conversion step introduces additional run-to-run variability: lot-to-lot differences in urease specific activity, incubation temperature, and the fixed 5 min hydrolysis endpoint contribute to the wider inter-run spread observed in the urinary urea vs. direct urinary ammonia comparison. These findings identify the most actionable strategies for future LOD improvement: use of single-batch urease aliquots, tighter thermal control, and kinetically monitored hydrolysis endpoints. This interpretation is independently reproduced in the potentiometric method (Figure 1, Table S2). The parallel sub-Nernstian deviation and elevated CV of the urea assay, observed independently in both the ISE and API methods—two methods sharing only the urease step—constitute the strongest available evidence that enzymatic conversion is the dominant source of inter-run noise in both methods.
The inter-day reproducibility of both methods, expressed as the CV of the calibration slope across 10 independent sessions (CV = SD/mean slope × 100%; ISE: 6.5% for urinary urea, 4.0% for urinary ammonia; API: 17.6% for urinary urea, 29.9% for urinary ammonia; Tables S2 and S3), is higher than that of fully automated clinical platforms (e.g., Roche Cobas inter-run CV < 2%), but does not translate to clinically meaningful per-sample error when calibration is performed daily and restricted to that session’s measurements: within-session CV remained ≤5% across all specimens (Tables S4 and S5). This behavior—stable within-session agreement despite modest session-to-session slope drift—is the hallmark of an assay optimized for decentralized deployment, where within-day agreement with a co-run calibration standard is the operationally relevant performance criterion.

4.2. Cross-Validation: ISE vs. Cobas, API vs. Cobas, and ISE vs. API

The validation strategy followed a hierarchical framework in which the ISE method was independently validated against an external clinical reference for urinary ammonia. The API method was independently validated against the same external clinical reference for urinary urea and was subsequently benchmarked against the validated ISE method. The resulting analytical hierarchy is summarized in Table S7. In each comparison, slope confidence intervals included unity and intercept confidence intervals included zero, confirming the absence of significant proportional or constant bias (Figure 3, Figure 4 and Figure 5; Tables S4–S6).
ISE vs. Cobas C311 (ammonia level). The ISE potentiometric workflow showed no significant proportional or constant bias relative to the Cobas C311 clinical reference at the ammonia level (Figure 3; Table S4). The near-Nernstian direct-ammonia slope confirms near-ideal electrode performance, while the sub-Nernstian urea-channel slope reflects upstream enzymatic uncertainty, as discussed in Section 4.1. Together, these results establish the ISE as a clinically validated, low-cost reference method suitable for research laboratories and decentralized settings.
API Berthelot–salicylate vs. Cobas C311 (urea level). The API colorimetric method demonstrated equivalent agreement with the Cobas C311 at the urea level, with no significant proportional or constant bias detected and mean recovery indistinguishable from unity (Figure 4; Table S5). This confirms that repurposing a consumer-grade aquarium reagent kit introduces no systematic analytical error relative to a certified clinical analyzer.
API vs. ISE (urea level). A head-to-head comparison across the physiological urinary urea range confirmed mutual equivalence between the two low-cost platforms, with both proportional and additive biases statistically and clinically negligible (Figure 5; Table S6). This establishes that a consumer-grade aquarium ammonia kit is analytically interchangeable with the validated potentiometric workflow across a physiological range—the principal analytical finding of the present work. Recoveries of nearly 100% across the full 20–350 mM spike range further indicate negligible matrix interference and consistent quantitative behavior of both methods across the physiological urinary urea span (Table 1).
Need for multiple dilutions to ensure accuracy. To prevent underestimating urinary urea concentration, multiple dilutions are essential. This requirement arises because the colorimetric assay’s instrumental linear range is approximately two orders of magnitude narrower than the physiological range of urinary urea. This is resolved through sample-adaptive predilution in PBS—a standard strategy employed by the Cobas C311 and other automated analyzers. Ultimately, this shared approach explains why three distinct platforms, despite operating entirely different detection principles, converge on equivalent results.
Three-way concordance and cost hierarchy. Across all three method comparisons (Section 3.2, Table S7), the platforms converged on equivalent urea and ammonia concentrations despite operating on different detection principles. Critically, this analytical agreement is achieved at a per-sample reagent cost approximately one to two orders of magnitude lower than the clinical reference (Table S1), a reduction that fundamentally shifts urinary urea and ammonia quantification from a centralized laboratory procedure to one deployable in decentralized, point-of-care, and resource-limited settings.
Potential Clinical and Point-of-Care Applications. These validated methods address a distinct, unmet analytical need: the direct, selective, and cost-effective quantification of urinary urea outside clinical reference laboratories. By directly applying to urine samples, the API method underscores the potential application for non-invasive monitoring of dialysis adequacy, whole-body protein catabolism, and nitrogen balance—assessments historically restricted to automated clinical analyzers. Consequently, this approach may be suited for longitudinal monitoring, where high sampling frequencies make cost-per-test the primary practical constraint.

4.3. Methodological Considerations and Matrix Effects

Spike–recovery experiments confirmed that variation in urinary pH, ionic strength, and electrolyte composition did not introduce systematic bias across the dynamic range for either method (Table 1). This result is noteworthy because ionic and matrix interference are well-documented limitations of enzyme-based urea biosensors [29,30,31], and the absence of such interference here reflects two deliberate design choices. First, urease was used at saturating activity in PBS-buffered conditions (Section 2.5.2 and Section 2.6.2), driving hydrolysis to effective completion and decoupling urea quantification from variable enzymatic kinetics. Second, the paired with-urease/without-urease subtraction removes endogenous urinary ammonia and any matrix-derived signal on a per-sample basis, providing an internal correction unavailable in single-aliquot designs. The two-step pre-analytical pipeline—centrifugation followed by sample-adaptive PBS dilution—addresses the two largest sources of urinary matrix interference: particulates from cellular debris and crystallized solutes (removed by centrifugation), and the high background ionic strength of concentrated urine (diluted into the validated linear window). PBS (pH 7.4) was selected as the diluent to maintain consistency with the calibration pH and to preserve urease activity across samples and standards [21].
While the wide variation in endogenous urinary ammonia across participants and physiological states poses a challenging matrix variable, our subtraction design mitigates this issue. Because the no-urease blank captures the specific background ammonia contribution of each specimen, urinary urea is recovered stoichiometrically in every case (Equation (1)). Consequently, the diverse ammonia profiles observed across dietary and exercise conditions serve as a built-in stress test, validating the robustness of the method under variable physiological conditions.

4.4. Reproducibility, Lot Stability, and Cross-Vendor Transfer

Repurposing a consumer-grade reagent for quantitative analytical use raises a legitimate concern: API® kits ship without lot-specific certificates of analysis and may be reformulated without notification. Three features of the present design mitigate this risk. First, the Berthelot–salicylate chemistry is intrinsically robust: its mechanism and stoichiometry are well characterized [18,38,39,40], and modest variations in reagent concentrations within the proprietary formulation range produce a proportional change in the calibration slope without compromising linearity or selectivity. Second, a freshly constructed calibration curve is required for every analytical run (triplicate CV ≤ 5%; Section 2.6.3), so lot-to-lot and bottle-to-bottle variation is absorbed into per-session calibration before any result is issued. The absence of systematic slope or intercept drift across the 10 sessions spanning several months (Table S3) provides direct empirical support for this mitigation strategy. Third, the same principle applies to alternative vendors (e.g., Red Sea Ammonia Pro™), so the validated protocol can, in principle, be transferred to any salicylate-based kit if a per-run calibration is performed with the specific lot in use.

4.5. Limitations and Future Directions

Several limitations of the present work warrant explicit acknowledgment, with a specific direction for future investigation. First, the colorimetric method’s linear range (0.1–1.0 mM) requires sample-adaptive dilution from 1:100 to 1:2000, introducing a pre-analytical pipetting step that contributes to per-sample variability (Section 3.3, spike–recovery data). Future optimization work should explore extending the linear range through alternative reagent formulations, longer-path-length cuvettes, or detection at a less reagent-saturated wavelength, where the chromophore has not reached optical saturation—any of which would reduce the required dilution factor and its associated uncertainty. Second, the healthy-volunteer cohort was diverse in metabolic state (normal, post-exercise, ketogenic, fasting, high-protein) but excluded patients with kidney disease, liver dysfunction, or other conditions affecting renal urea and ammonia handling. Validation in these clinical populations is necessary before analytical equivalence to a clinical analyzer can be claimed in those diagnostic contexts. Third, the present study is cross-sectional; longitudinal studies tracking within-subject day-to-day variability under controlled dietary and hydration conditions would clarify whether the inter-session calibration slope CV (~17.6% for urinary urea, ~29.9% for urinary ammonia across all 10 runs) translates to clinically meaningful between-day interpretation error, or whether it is fully absorbed by daily recalibration, as the near-unity spike recoveries and the tight ISE–API Bland–Altman agreement data (mean bias +1.80% of mean; Figure 5b) suggest. Finally, the ISE was benchmarked against the clinical analyzer only for ammonia; a direct ISE-versus-Cobas comparison for urea was not performed and should be addressed in future work.

5. Conclusions

In summary, we implemented and independently validated two low-cost laboratory methods that resolve urinary urea from endogenous ammonia using a well-established differential urease principle. In healthy adults (n = 10 per comparison), the ion-selective electrode (ISE) method showed close agreement with a clinical analyzer (Roche Cobas C311) for urinary ammonia, while the colorimetric method (API)—based on a repurposed consumer-grade aquarium reagent—showed comparable agreement with the same clinical analyzer for urinary urea. A head-to-head comparison of the ISE and API methods across a concentration range of 16–447 mM yielded an R2 of 0.9976, with mean spike recoveries near 100% (API: 100.7 ± 2.9%; ISE: 100.6 ± 5.4%); both methods were calibrated independently during each analytical run.
By reducing per-sample reagent costs, the API method expands access to urinary urea testing in research and resource-limited laboratory settings. Although the API method remains laboratory-based and its validation was limited to healthy adults, it may also support future work in precision nutrition, sports medicine, and metabolic management, where high-protein dietary trends make individualized monitoring increasingly relevant. Validation in clinically diverse populations, longitudinal within-subject studies, and continued engineering development are required before point-of-care translation can be realized.

Supplementary Materials

The following supporting information can be downloaded at: https://www.mdpi.com/article/10.3390/analytica7030051/s1, Figure S1: Ammonium ISE schematic representation. Figure S2: Urease volume optimization for the ISE potentiometric method. Figure S3: Berthelot reaction. Figure S4: The schematic of urine color changes following salicylate addition. Figure S5: Calibration of the API® colorimetric assay for direct urea quantification. Figure S6: Direct ammonia calibration of the API® colorimetric reagent system. Figure S7: Step-by-step protocol for the API® colorimetric urea assay developed in this work. Figure S8: ISE potentiometric method for urinary urea and ammonia. Figure S9: API colorimetric method for urinary urea and ammonia. Figure S10: Per-run ISE urea calibration. Figure S11: Per-run ISE ammonia calibration. Figure S12: Per-run API calibration curves for urinary urea. Figure S13: Per-run API calibration curves for urinary ammonia. Table S1: Detailed per-sample reagent-cost breakdown for the evaluated methods. Table S2: Per-run ISE calibration parameters. Table S3: Per-run API calibration parameters. Table S4: Paired Cobas C311 and ISE ammonia measurements. Table S5: Paired Cobas C311 and API-urea measurements. Table S6: Paired ISE and API for urinary urea. Table S7: Side-by-side performance comparison of the three methods for urinary urea and urinary ammonia quantification [32,34,36].

Author Contributions

Conceptualization, R.E.D., M.T., V.Y., A.F., E.H.C., P.H., A.P., F.C., and E.F.; methodology, M.T., V.Y., A.F., E.H.C., A.P., and E.F.; validation, M.T., A.F., and E.H.C.; formal analysis, R.E.D., M.T., V.Y., A.F., E.H.C., A.P., and E.F.; investigation, R.E.D., M.T., V.Y., A.F., E.H.C., P.H., A.P., S.M., C.S., L.T., M.L.L.T., F.C., and E.F.; resources, E.F.; writing—original draft preparation, R.E.D. and A.F.; writing—review and editing, R.E.D., F.C., and E.F.; visualization, R.E.D., M.T., A.F., and E.H.C.; supervision, E.F.; project administration, E.F.; funding acquisition, L.T., M.L.L.T., F.C., and E.F. All authors have read and agreed to the published version of the manuscript.

Funding

This research was funded by the National Science Foundation (Project Grant 2122901), Arizona State University—Mayo Clinic Team Science Grant (2018), and NIH Catalyze Program (1R61HL173926).

Institutional Review Board Statement

Arizona State University approved the Institutional Review Board (IRB Protocol STUDY00016374) for this project.

Informed Consent Statement

Informed consent was obtained from all subjects involved in the study.

Data Availability Statement

The raw data from these experiments used to generate the plots and analyses presented in this article are publicly available at https://doi.org/10.5281/zenodo.20839693 (accessed on 26 June 2026).

Conflicts of Interest

The authors declare that they have no conflicts of interest.

Abbreviations

The following abbreviations are used in this manuscript:
APIAquarium ammonia test kit (API® NH3/NH4+, Mars Fishcare)
BABland–Altman
CCCConcordance Correlation Coefficient
CIConfidence Interval
CVCoefficient of Variation
GLDHGlutamate Dehydrogenase
ICHInternational Council for Harmonization
IRBInstitutional Review Board
ISAIonic Strength Adjuster
ISEIon-Selective Electrode
LODLimit of Detection
LOQLimit of Quantification
LoALimits of Agreement
mMMillimolar
mVMillivolts
mV/decadeMillivolts per Decade of Analyte Activity (Nernstian slope unit)
NADPHNicotinamide Adenine Dinucleotide Phosphate (reduced form)
OLSOrdinary Least Squares
PBSPhosphate-Buffered Saline
R2Coefficient of Determination
SDStandard Deviation
UAGUrine Anion Gap
% w/vPercent Weight by Volume
[NH3]Molar Concentration of Ammonia
[urea]Molar Concentration of Urea
°CDegrees Celsius
µLMicroliter
AAbsorbance
λWavelength

References

  1. Kumar, V.; Gill, K.D. Estimation of urea in serum and urine. In Basic Concepts in Clinical Biochemistry: A Practical Guide; Springer: Singapore, 2018; pp. 67–70. [Google Scholar]
  2. Liu, L.; Mo, H.; Wei, S.; Raftery, D. Quantitative analysis of urea in human urine and serum by 1H nuclear magnetic resonance. Analyst 2012, 137, 595–600. [Google Scholar] [CrossRef] [Scilit]
  3. Weiner, I.D.; Mitch, W.E.; Sands, J.M. Urea and ammonia metabolism and the control of renal nitrogen excretion. Clin. J. Am. Soc. Nephrol. 2015, 10, 1444–1458. [Google Scholar] [CrossRef] [Scilit] [PubMed]
  4. Taylor, A.J.; Vadgama, P. Analytical reviews in clinical biochemistry: The estimation of urea. Ann. Clin. Biochem. 1992, 29, 245–264. [Google Scholar] [CrossRef] [Scilit] [PubMed]
  5. Maroni, B.J.; Steinman, T.I.; Mitch, W.E. A method for estimating nitrogen intake of patients with chronic renal failure. Kidney Int. 1985, 27, 58–65. [Google Scholar] [CrossRef] [Scilit] [PubMed]
  6. Micic, D.; Fu, Y. Nitrogen balance: Revisiting clinical applications in contemporary practice. Pract. Gastroenterol. 2024, 29, 28–35. [Google Scholar]
  7. Daugirdas, J.T.; Depner, T.A.; Inrig, J.; Mehrotra, R.; Rocco, M.V.; Suri, R.S.; Weiner, D.E.; Greer, N.; Ishani, A.; MacDonald, R.; et al. KDOQI clinical practice guideline for hemodialysis adequacy: 2015 update. Am. J. Kidney Dis. 2015, 66, 884–930. [Google Scholar] [CrossRef] [Scilit] [PubMed]
  8. Vanholder, R.; Gryp, T.; Glorieux, G. Urea and chronic kidney disease: The comeback of the century? Nephrol. Dial. Transplant. 2018, 33, 4–12. [Google Scholar] [PubMed]
  9. U.S. Department of Health and Human Services; U.S. Department of Agriculture. Dietary Guidelines for Americans, 2025–2030; USDA and HHS: Washington, DC, USA, 2026. [Google Scholar]
  10. Jacob, M.; Lopata, A.L.; Dasouki, M.; Abdel Rahman, A.M. Metabolomics toward personalized medicine. Mass Spectrom. Rev. 2019, 38, 221–238. [Google Scholar] [PubMed]
  11. Dimski, D.S. Ammonia metabolism and the urea cycle: Function and clinical implications. J. Vet. Intern. Med. 1994, 8, 73–78. [Google Scholar] [CrossRef] [Scilit] [PubMed]
  12. McPherson, R.A.; Pincus, M.R. Henry’s Clinical Diagnosis and Management by Laboratory Methods; Elsevier Health Sciences: St. Louis, MO, USA, 2021. [Google Scholar]
  13. Lerma, E.V. Approach to the patient with renal disease. Prim. Care 2008, 35, 183–194. [Google Scholar] [CrossRef] [Scilit] [PubMed]
  14. Jung, K. Tietz Textbook of Clinical Chemistry and Molecular Diagnostics, Fourth Edition. Carl A. Burtis, Edward R. Ashwood, and David E. Bruns, editors. St. Louis, MO: Elsevier Saunders, 2006, 2448 pp., $229.00, hardcover. ISBN 0-7216-0189-8. Clin. Chem. 2006, 52, 1214. [Google Scholar] [CrossRef] [Scilit]
  15. Hoge, J.H.C.; Hazenberg, H.J.A.; Gips, C.H. Determination of ammonia in urine with an ammonium electrode and with a direct method. Clin. Chim. Acta 1974, 55, 273–279. [Google Scholar] [CrossRef] [Scilit] [PubMed]
  16. Petersson, B.A. Enzymatic determination of urea in undiluted whole blood by flow injection analysis using an ammonium ion-selective electrode. Anal. Chim. Acta 1988, 209, 239–248. [Google Scholar] [CrossRef] [Scilit]
  17. Lippi, G.; Salvagno, G.L.; Montagnana, M.; Franchini, M.; Guidi, G.C. Phlebotomy issues and quality improvement in the results of laboratory testing. Clin. Lab. 2006, 52, 217–230. [Google Scholar] [PubMed]
  18. Searle, P.L. The Berthelot or indophenol reaction and its use in the analytical chemistry of nitrogen: A review. Analyst 1984, 109, 549–568. [Google Scholar] [CrossRef] [Scilit]
  19. Krom, M.D. Spectrophotometric determination of ammonia: A study of a modified Berthelot reaction using salicylate and dichloroisocyanurate. Analyst 1980, 105, 305–316. [Google Scholar] [CrossRef] [Scilit]
  20. Wang, J. Analytical Electrochemistry, 3rd ed.; Wiley: Hoboken, NJ, USA, 2006. [Google Scholar]
  21. Krajewska, B.; Ureases, I. Functional, catalytic and kinetic properties: A review. J. Mol. Catal. B Enzym. 2009, 59, 9–21. [Google Scholar] [CrossRef] [Scilit]
  22. Weiner, I.D.; Verlander, J.W. Renal ammonia metabolism and transport. Compr. Physiol. 2013, 3, 201–220. [Google Scholar] [CrossRef] [Scilit]
  23. Weiner, I.D.; Verlander, J.W. Ammonia transporters and their role in acid-base balance. Physiol. Rev. 2017, 97, 465–494. [Google Scholar] [CrossRef] [Scilit] [PubMed]
  24. Uribarri, J.; Goldfarb, D.S.; Raphael, K.L. Beyond the urine anion gap: In support of the direct measurement of urinary ammonium. Am. J. Kidney Dis. 2022, 80, 667–676. [Google Scholar] [CrossRef] [Scilit] [PubMed]
  25. Georges, J. Determination of ammonia and urea in urine and of urea in blood by use of an ammonia-selective electrode. Clin. Chem. 1979, 25, 1888–1890. [Google Scholar] [CrossRef] [Scilit]
  26. Bowling, J.L.; Katayev, A. An evaluation of the Roche Cobas c 111. Lab. Med. 2010, 41, 398–402. [Google Scholar] [CrossRef] [Scilit]
  27. Rehman, M.Z.; Melamed, M.; Harris, A.; Shankar, M.; Rosa, R.M.; Batlle, D. Urinary ammonium in clinical medicine: Direct measurement and the urine anion gap as a surrogate marker during metabolic acidosis. Adv. Kidney Dis. Health 2023, 30, 197–206. [Google Scholar] [CrossRef] [Scilit] [PubMed]
  28. Gruzdys, V.; Cahoon, K.; Pearson, L.; Raphael, K.L. Measurement of urinary ammonium using a commercially available plasma ammonium assay. Kidney360 2022, 3, 926–932. [Google Scholar] [CrossRef] [Scilit] [PubMed]
  29. Singh, S.; Sharma, M.; Singh, G. Recent advancements in urea biosensors for biomedical applications. IET Nanobiotechnol. 2021, 15, 358–379. [Google Scholar] [CrossRef] [Scilit] [PubMed]
  30. Botewad, S.N.; Gaikwad, D.K.; Girhe, N.B.; Thorat, H.N.; Pawar, P.P. Urea biosensors: A comprehensive review. Biotechnol. Appl. Biochem. 2023, 70, 485–501. [Google Scholar] [CrossRef] [Scilit] [PubMed]
  31. Shurbaji, S.; Khan, A.; Hassan, M.K.; Bermak, A.; Li, W.D.; Biswas, K.H.; Wang, B. Advances in electrochemical urea biosensors: Trends and future prospects. Adv. Sens. Res. 2026, 5, e00117. [Google Scholar] [CrossRef] [Scilit]
  32. Solsky, R.L. Ion-selective electrodes. Anal. Chem. 1990, 62, 21–33. [Google Scholar] [CrossRef] [Scilit] [PubMed]
  33. Nien Hsuan, C.; Chou, J.C.; Sun, T.P.; Hsiung, S.K. Measurement and comparison of potentiometric selectivity coefficients of urea biosensors based on ammonium ion-selective electrodes. IEEE Sens. J. 2005, 5, 1362–1368. [Google Scholar] [CrossRef] [Scilit]
  34. Covington, A.K. Ion-Selective Electrode Methodology, Volume 2; CRC Press: Boca Raton, FL, USA, 2018. [Google Scholar]
  35. Cuartero, M.; Colozza, N.; Fernández-Pérez, B.M.; Crespo, G.A. Why ammonium detection is particularly challenging but insightful with ionophore-based potentiometric sensors—An overview of the progress in the last 20 years. Analyst 2020, 145, 3188–3210. [Google Scholar] [CrossRef] [Scilit] [PubMed]
  36. Wen, Y.; Mao, Y.; Kang, Z.; Luo, Q. Application of an ammonium ion-selective electrode for the real-time measurement of ammonia nitrogen based on pH and temperature compensation. Measurement 2019, 137, 98–101. [Google Scholar] [CrossRef] [Scilit]
  37. Berthelot, M. Violet d’aniline. Rep. Chim. Appl. 1859, 1, 284. [Google Scholar]
  38. Gordon, S.A.; Fleck, A.; Bell, J. Optimal conditions for the estimation of ammonium by the Berthelot reaction. Ann. Clin. Biochem. 1978, 15, 270–275. [Google Scholar] [CrossRef] [Scilit] [PubMed]
  39. Yu, H.; Zhang, G.; Cai, Y.; Dong, F. Altering the substituents of salicylic acid to improve the Berthelot reaction for ultrasensitive colorimetric detection of ammonium and atmospheric ammonia. Anal. Bioanal. Chem. 2021, 413, 5695–5702. [Google Scholar] [CrossRef] [Scilit] [PubMed]
  40. Chaney, A.L.; Marbach, E.P. Modified reagents for determination of urea and ammonia. Clin. Chem. 1962, 8, 130–132. [Google Scholar] [CrossRef] [Scilit]
  41. Gałuszka, A.; Migaszewski, Z.; Namieśnik, J. The 12 principles of green analytical chemistry and the SIGNIFICANCE mnemonic of green analytical practices. TrAC Trends Anal. Chem. 2013, 50, 78–84. [Google Scholar] [CrossRef] [Scilit]
  42. Han, S.; Yamamoto, S.; Jung, C.Y.; Jin, D.Y.; Lee, T.; Kim, J.S. Wearable sensors for monitoring chronic kidney disease. Commun. Mater. 2024, 5, 153. [Google Scholar] [CrossRef] [Scilit]
  43. Salatiello, S.; Spinelli, M.; Cassiano, C.; Amoresano, A.; Marini, F.; Cinti, S. Sweat urea bioassay based on the degradation of Prussian Blue as the sensing architecture. Anal. Chim. Acta 2022, 1210, 339882. [Google Scholar] [CrossRef] [Scilit] [PubMed]
  44. Thepchuay, Y.; Costa Carolina, F.A.; Mesquita Raquel, B.R.; Sampaio-Maia, B.; Nacapricha, D.; Rangel António, O.S.S. Flow-based method for the determination of biomarkers urea and ammoniacal nitrogen in saliva. Bioanalysis 2020, 12, 455–465. [Google Scholar] [CrossRef] [Scilit] [PubMed]
  45. Roche Diagnostics. NH3L Ammonia Method Sheet: Cobas Integra 400 Plus/800; Roche Diagnostics: Indianapolis, IN, USA, 2014. [Google Scholar]
  46. Lugosi, R.; Thibert, R.J.; Holland, W.J.; Lam, L.K. A study of the reaction of urea with diacetyl monoxime and diacetyl. Clin. Biochem. 1972, 5, 171–181. [Google Scholar] [CrossRef] [Scilit] [PubMed]
  47. Francis, P.S.; Lewis, S.W.; Lim, K.F. Analytical methodology for the determination of urea: Current practice and future trends. TrAC Trends Anal. Chem. 2002, 21, 389–400. [Google Scholar] [CrossRef] [Scilit]
  48. Langenfeld, N.J.; Payne, L.E.; Bugbee, B. Colorimetric determination of urea using diacetyl monoxime with strong acids. PLoS ONE 2021, 16, e0259760. [Google Scholar] [CrossRef] [Scilit] [PubMed]
  49. Mars Fishcare North America, Inc. Safety Data Sheet: Liquid Ammonia Test Solution #1 (Solution ID# 3335A; Chemwatch No. 4650-12, Version 7.1.1.1); Mars Fishcare North America, Inc.: Chalfont, PA, USA, 2014. [Google Scholar]
  50. Mars Fishcare North America, Inc. API® Ammonia NH3/NH4+ Test Kit (Catalog No. LR8600). Available online: https://apifishcare.com/product/ammonia-test-kit (accessed on 15 June 2026).
  51. Patton, C.J.; Crouch, S. Spectrophotometric and kinetic investigation of the Berthelot reaction for the determination of ammonia. Anal. Chem. 1977, 49, 464–469. [Google Scholar] [CrossRef] [Scilit]
  52. ICH. International Conference on Harmonization of Technical Requirements for Registration of Pharmaceuticals for Human Use. Validation of Analytical Procedures: Text and Methodology Q2(R1); ICH: Geneva, Switzerland, 2005. [Google Scholar]
  53. Bland, J.M.; Altman, D.G. Statistical methods for assessing agreement between two methods of clinical measurement. Lancet 1986, 327, 307–310. [Google Scholar] [CrossRef] [Scilit]
Scheme 1. Analytical validation strategy for urinary urea. Each urine sample is analyzed without and with urease pretreatment by Method 1 (ISE, potentiometry) and Method 2 (API®, colorimetric), yielding urinary ammonia and urea, respectively; the evaluated methods are validated against the Cobas C311 for the respective analyte (Analytical Validation) and against each other (Cross-Validation). The conventional total urinary nitrogen testing approach is shown for comparison.
Analytica 07 00051 sch001
Figure 1. Potentiometric calibration curves for the urease-coupled ISE method, overlaid across 10 independent runs. (a) Urea calibration: electrode potential (mV) versus log10[urea] (mM) following enzymatic conversion by urease; pooled slope = −49.48 ± 3.22 mV decade−1. Urease concentration: 1200–4000 U/mL. (b) Direct ammonia calibration: electrode potential (mV) versus log10[NH3] (mM) without enzymatic conversion; pooled slope = −59.00 ± 2.38 mV decade−1, near the theoretical Nernstian value of −59.16 mV decade−1 at 25 °C. Per-run data is presented in Table S2.
Analytica 07 00051 g001
Figure 2. Per-run linear calibration of the API® colorimetric assay (n = 10). (a) Urease-coupled urinary urea at λ = 670 nm. Urease concentration: 1200–4000 U /mL. (b) Direct urinary ammonia. In both panels, faint navy traces show the 10 individual per-run calibrations on blank-corrected mean absorbance; bold navy markers with error bars show the across-run pooled mean ± SD at each standard; the red solid line is the pooled linear regression with its 95% confidence interval (pink band). Stats insets give the mean ± SD of the per-run slope and intercept, the mean per-run R2, and the run count. Per-run parameters are listed in Table S3.
Analytica 07 00051 g002
Figure 5. Direct cross-method comparison between the API and ISE for urinary urea quantification. (a) OLS regression: y = 0.985 x + 6.34, R2 = 0.9976, p < 0.001; slope 95% CI [0.946, 1.024] includes unity. Navy markers show per-sample mean ± triplicate SD. The red solid line represents regression, the dashed gray line the identity (y = x). Source data and full statistics are in Table S6. (b) Bland–Altman analysis of the same paired data. Red solid line: mean bias = +3.47 mM, 95% LoA [−14.60, +21.53] mM.
Analytica 07 00051 g005
Table 1. Spike–recovery results of urinary urea. Comparison of API vs. ISE methods.
Spiked Urea
(mM)
SampleAPIISEAPI
(as % of ISE)
20199.0108.091.7
802102.195.0107.4
1803103.999.7104.2
350497.699.598.1
Mean 100.7100.6100.4
S.D. 2.95.46.9
Range 97.6–103.995.0–108.091.7–107.4
Disclaimer/Publisher’s Note: The statements, opinions and data contained in all publications are solely those of the individual author(s) and contributor(s) and not of MDPI and/or the editor(s). MDPI and/or the editor(s) disclaim responsibility for any injury to people or property resulting from any ideas, methods, instructions or products referred to in the content.