


Abstract
Against the background of the “dual carbon” goals and the integration of a high proportion of renewable energy, hydrogen energy storage, with its advantages of long duration and large scale storage as well as clean energy conversion, has become an important approach to improving the flexibility and security of energy systems. To address the accident risks associated with leakage from high pressure hydrogen storage in stationary hydrogen energy storage facilities, this study takes an integrated hydrogen energy storage station involving hydrogen production, storage, compression, and utilization as the research object. A numerical model for hydrogen leakage and dispersion from high-pressure storage cylinders in an open environment is established to investigate the effects of leakage aperture, natural ventilation, mechanical ventilation, and emergency shutdown on hydrogen cloud evolution and deflagration risk. The results show that an increase in leakage diameter significantly increases the flammable hydrogen volume and Q9 peak value. Large-scale leakage is prone to local accumulation under the influence of blast walls and obstacles, resulting in a 780 m3 combustible volume and 14.7 m3 Q9; medium-scale leakage has a longer duration, whereas small-scale leakage presents the lowest risk. Under natural wind conditions, crosswind provides better dilution, reducing Q9 by 53%. Mechanical ventilation can effectively reduce the value of Q9 by 36%, with ventilation layout exerting a more significant influence than wind speed. The combined use of mechanical ventilation and emergency shutdown can further reduce the 42% flammable volume and shorten the duration of high concentration hydrogen clouds. The findings can provide guidance for the safety layout, ventilation design, and emergency protection of hydrogen energy storage stations. Unlike conventional CFD-based leakage consequence analyses, this study couples hydrogen dispersion simulation with Q9-based deflagration risk assessment and a hierarchical safety strategy involving natural, mechanical ventilation, and emergency shutdown.
1. Introduction
Excessive dependence on fossil fuels leads to substantial greenhouse gas emissions, thereby accelerating global warming and deteriorating the living environment for human beings. It is also detrimental to national energy security [1,2]. Owing to its high gravimetric energy density and zero direct carbon emissions at the point of use, hydrogen has been regarded by many countries as a promising energy carrier and a strategic option [3]. China has also formulated strategic plans for hydrogen energy development. The medium- and long-term plan identifies hydrogen as an important component of the future energy system and sets phased targets for renewable hydrogen production and diversified applications [4,5]. Meanwhile, as an intermediate energy storage medium, hydrogen storage is being increasingly applied in power systems across the generation, transmission, and consumption sectors [6]. Its capability for large-scale and long-duration energy storage, particularly for renewable energy accommodation and seasonal energy balancing, is important for building flexible and reliable power systems and ensuring energy security [7]. Recent study on an integrated hydrogen energy chain further indicates that the coordination of hydrogen production, compression, storage, transportation, and utilization can mitigate renewable energy fluctuations and support the optimal allocation of heterogeneous energy resources across time and space [8]. However, it should be noted that the low-carbon benefit of hydrogen strongly depends on its production pathway, electricity source, storage method, and end use boundary. At present, global hydrogen demand is still mainly supplied by unabated fossil-fuel-based production, whereas low-emission hydrogen accounts for only a very small proportion of total production [3]. Therefore, the role of hydrogen in future energy systems should be distinguished as a forward-looking expectation supported by policy and technological development, rather than a fully realized fact.
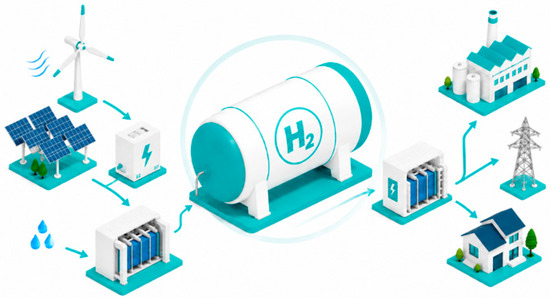
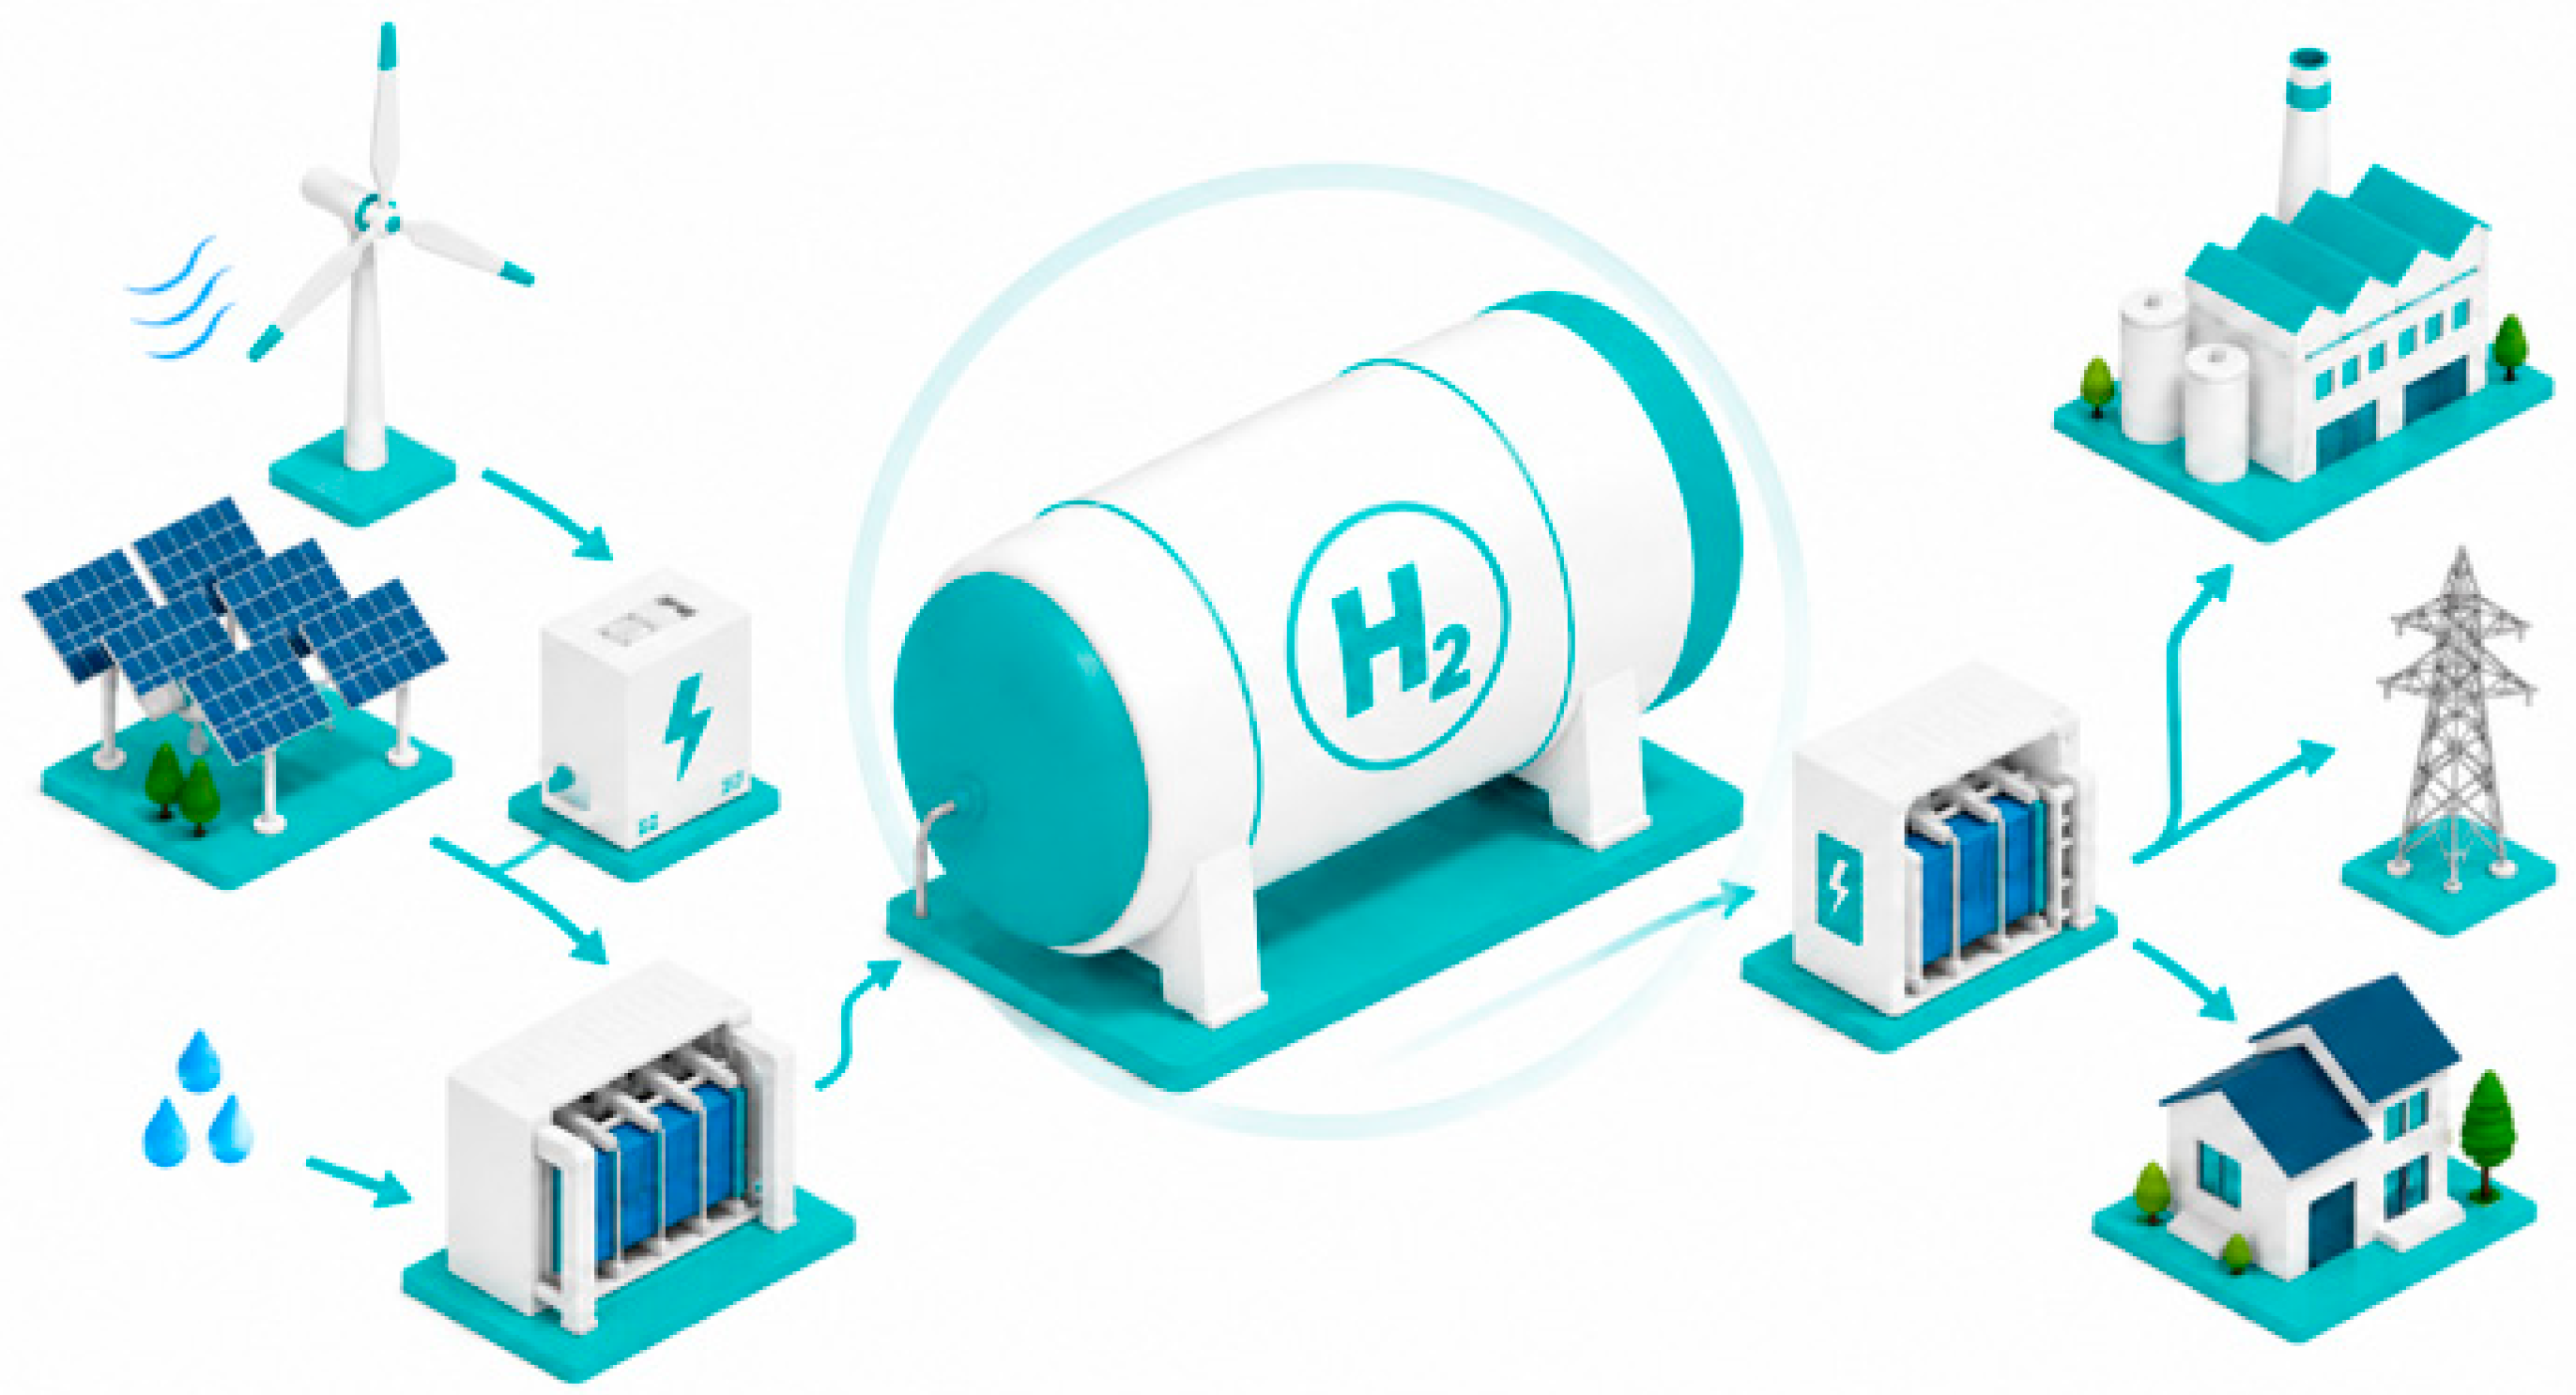
Zero-carbon hydrogen energy storage systems convert renewable energy, such as wind and solar power, into hydrogen through water electrolysis, and then store the produced hydrogen in storage cylinders [9]. In practical integrated hydrogen energy storage systems, the hydrogen produced by water electrolysis usually needs to be compressed before entering high-pressure storage vessels or downstream utilization units. Hydrogen compression is therefore a key intermediate step connecting hydrogen production, storage, and utilization, and its energy consumption has a direct influence on the efficiency and techno-economic performance of the whole system [10]. Meanwhile, the compressor and downstream high pressure pipelines introduce additional pressure fluctuation, temperature rise, sealing failure, and leakage risks, making compression-related safety an important consideration in the layout and protection design of hydrogen storage stations [11]. When needed, hydrogen can subsequently be converted back into electricity through fuel cells, thereby enabling near zero carbon operation when the hydrogen is produced from renewable electricity and when the full production–storage–utilization chain is properly considered, as shown in Figure 1, which is generated with the assistance of artificial intelligence. It should be noted that Figure 1 is a schematic diagram of the various work processes and does not specifically refer to any particular integrated work scenario. This hydrogen-based energy storage technology helps optimize energy flow between power grids and hydrogen energy systems, supports peak shaving, valley filling, and frequency regulation, and improves the grid stability of renewable energy integration [12]. As a result, it has become a global research hotspot and has attracted extensive attention. Nevertheless, large scale deployment of hydrogen energy storage still faces several critical challenges, including electrolysis cost, storage and transportation infrastructure, system level economic feasibility, and safety regulation [13]. Among these challenges, safety is particularly important because it directly affects the engineering feasibility and public acceptance of hydrogen energy systems.
Figure 1.
Flowchart of renewable energy hydrogen storage.
Recent studies on integrated hydrogen production and refueling stations have also shown that although integrated stations can reduce part of the transportation related risk by combining hydrogen production, storage, and utilization on site, they may introduce more complex leakage, thermal, and explosion risks because high pressure storage vessels, pipelines, valves, compressors, and electrical equipment are spatially coupled [14,15]. However, hydrogen has the characteristics of low density, a wide flammability range, and low minimum ignition energy, making it prone to leakage, combustion, and explosion. Specifically, hydrogen has a wide flammability range of approximately 4–75% in air and can be ignited by very low ignition energy under favorable mixture conditions, which makes leakage-induced fire and explosion risk a key constraint for hydrogen storage applications [16]. Since the early nineteenth century, fire and explosion accidents caused by hydrogen leakage have occurred frequently, and in most cases, have resulted in severe damage [17,18]. Therefore, a more systematic understanding of hydrogen leakage, diffusion, accumulation, ignition, and explosion behavior is necessary for the safe design and operation of zero-carbon hydrogen energy storage systems.
Several researchers have investigated hydrogen leakage through experimental methods. De Stefano et al. [19] released hydrogen into an enclosed space with dimensions of 0.47 m × 0.33 m × 0.20 m to examine the effects of leakage location and surrounding obstacles on hydrogen behavior. Li et al. [20] measured the concentration decay of under expanded hydrogen jets through rectangular leakage openings with different aspect ratios at a pressure of 1 MPa. Compared with a square nozzle, the jet released from a rectangular nozzle exhibited a wider mixing region and a faster decay rate. For cryo-compressed hydrogen at 90 MPa, Kobayashi et al. [21] measured hydrogen leakage flow rates through pinhole nozzles with diameters of 0.2 mm, 0.4 mm, 0.7 mm, and 1 mm, and confirmed that the hydrogen leakage flow rate increases as the supply temperature decreases.
Experimental studies may involve high costs as well as potential combustion and explosion hazards. Therefore, computational fluid dynamics simulation provides a safer and more effective approach for investigating hydrogen leakage. For hydrogen leakage from onboard storage cylinders, extensive studies have been conducted on releases through thermally activated pressure relief devices (TPRDs), considering different release diameters, including 0.5 mm [22], 2 mm [23,24], 4 mm [25,26], and 5 mm [24,26], as well as different release angles. Shen et al. [27] experimentally calibrated the leakage mass flow rates of threaded pipe connections in hydrogen storage cylinders under different tightening angles of 30°, 60°, and 90° and torque values of 0.5 Nm, 1.0 Nm, and 1.5 Nm. A three-dimensional model of a fuel cell vehicle was then established. The simulation results showed that installing a blower on the side of the fuel cell vehicle to generate crosswind could effectively reduce the hydrogen concentration below the alarm threshold. In addition, compared with a parking configuration in which the vehicle front is perpendicular to the wall, a configuration in which the vehicle is parked parallel to the wall leads to less severe accident consequences for surrounding vehicles after hydrogen leakage [28]. Numerical simulations by Hajji et al. [29,30] on hydrogen tank leakage in a residential garage showed that a dome-shaped structure facilitates hydrogen stratification, thereby reducing hydrogen concentration. When the leakage source is located at the center of the garage, stable stratification is more likely to form. Under low flow rate and long duration leakage conditions, the hydrogen concentration near the ceiling may reach the optimal ratio range of 25–30% vol. Subsequent ventilation studies indicated that the diffusion efficiency of two ventilation openings is approximately 30% higher than that of a single opening, and that square openings provide better discharge performance than circular and triangular openings [31].
For hydrogen refueling stations equipped with canopies, Cui et al. [32] found that among hydrogen leakage cases with release angles of 0°, 45°, and 90°, the 90° release was more likely to accumulate beneath the canopy. In addition, inclined canopies promoted hydrogen dilution more effectively than horizontal canopies. Zhou et al. [33] investigated the influence of canopy width, including 10, 12, and 14 m, and inclination angles of 0°, 5°, 15°, and 30° on the consequences of hydrogen dispenser leakage accidents. Their results showed that when the canopy inclination angle did not exceed 15° and the canopy width was no greater than 12 m, the retained volume of hydrogen released upward was relatively small. Liu et al. [34] found that hydrogen leakage risks in hydrogen refueling stations exhibit strong regional differences and operating-condition dependence. Low wind speeds are more unfavorable for safety outside the enclosure wall and in front of the trailer, whereas high wind speeds increase the risk near the ground and behind the trailer. Moreover, compared with cases involving wall obstruction, hydrogen jet dispersion without obstacles presents a higher combustion and explosion risk [35]. Yang et al. [36] and Zhang et al. [37] reported that leakage directed toward buildings or canopies is more likely to cause hydrogen accumulation. As the leakage duration increases, a longer release time does not significantly change the near-source peak hydrogen concentration; however, factors such as ambient wind can readily cause deviations in the plume centerline and variations in the time to reach the peak concentration. After ignition, the hydrogen jet forms a jet flame, and protective walls can significantly alter the flame morphology. When a high pressure hydrogen flame impinges on a wall, part of the flame propagates downward or laterally along the wall, while another part passes over the wall. Meanwhile, firewalls can reduce the high-temperature hazard distance by 74% [38].
Current studies on hydrogen leakage from storage cylinders mainly focus on fuel cell vehicles, residential garages, and hydrogen refueling stations. These studies have provided important insights into under expanded jet behavior, the effects of release diameter and direction, obstacle-induced accumulation, and mitigation through ventilation. However, stationary hydrogen storage facilities in integrated renewable energy storage stations differ substantially from the above scenarios in terms of system configuration, operating conditions, and accident evolution. In such facilities, hydrogen production, compression, storage, and utilization units are spatially coupled, and high-pressure storage vessels are usually arranged in open or semi-open areas together with blast walls, surrounding walls, pipelines, valves, and auxiliary equipment. Therefore, hydrogen leakage may be affected not only by the leak diameter and pressure decay of the storage vessel, but also by local obstructions, atmospheric wind direction, mechanical ventilation layout, and emergency shutdown actions.
Despite these practical differences, the leakage and dispersion characteristics of high-pressure hydrogen storage vessels in stationary renewable energy based hydrogen storage stations have not been sufficiently clarified. In particular, limited attention has been paid to the time-varying leakage and flammable cloud evolution caused by different leak diameters, the influence of blast walls and surrounding obstacles on hydrogen accumulation, the comparative mitigation effects of natural ventilation, mechanical ventilation, and emergency shutdown, and the quantitative assessment of deflagration risk using combustible cloud volume and equivalent stoichiometric cloud volume.
To address these gaps, this study developed a CFD assisted hierarchical safety assessment framework for high pressure hydrogen leakage in a stationary integrated hydrogen energy storage station. The framework combines time-dependent leakage modeling, flammable cloud evolution analysis, Q9-based deflagration risk quantification, natural ventilation assessment, sensor triggered mechanical ventilation, and emergency shutdown. Compared with previous CFD studies that mainly evaluate hydrogen dispersion consequences under prescribed leakage or ventilation conditions, the present work emphasizes the coupling between simulated hydrogen concentration fields and active safety responses. Therefore, the novelty of this study lies not only in modeling hydrogen leakage from storage vessels, but also in evaluating how different layers of safety measures can be activated and coordinated to reduce the flammable cloud volume and shorten the duration of high-risk hydrogen clouds.
2. Physical Model
In this work, FLACS was adopted as the numerical framework to simulate hydrogen leakage and dispersion in the integrated hydrogen energy storage station. As a consequence-oriented CFD framework, FLACS has been widely used and validated for flammable gas dispersion and hydrogen safety analysis, especially in scenarios involving complex obstacles [39] and ventilation [40]. Therefore, it is suitable for the present study, which focuses on hydrogen leakage, dispersion, and mitigation in a realistic stationary hydrogen energy storage station with blast walls, surrounding walls, natural wind, mechanical ventilation, and emergency shutdown.
2.1. Hydrogen Leakage Model
Hydrogen release at 22 MPa corresponds to a highly underexpanded jet, for which the pseudo-source model is currently one of the most commonly used approaches. The pseudo-source model proposed by Birch et al. [41,42] replaces the actual nozzle diameter with an effective notional nozzle diameter , thereby providing a better description of the decay of concentration and velocity fields in supercritical jets. However, when the hydrogen storage pressure exceeds 10–20 MPa, the method proposed by Birch et al. based on the ideal gas equation has certain limitations. To account for the non-ideal behavior of highly compressed hydrogen, Schefer et al. [43] adopted the Abel–Noble equation of state and improved the calculation of real-gas properties in the original method proposed by Birch et al. Subsequently, Molkov et al. [44] proposed a new notional nozzle model. This model incorporates the energy conservation equation and adopts the Abel–Noble equation of state, thereby overcoming the limitations of Schefer et al.’s method. It can predict the uniform supersonic flow at the notional nozzle under high-pressure conditions, and the model has also been validated by Lv et al. [28]. Therefore, the pseudo-source model developed by Molkov et al. was adopted for the numerical simulations in this study.
Considering the high storage pressure of 22 MPa, the ideal gas assumption may introduce deviations in hydrogen density and release rate estimation. Therefore, this paper employed a pseudo-source model based on the Abel–Noble real gas equation of state. This model equivalently describes the isentropic expansion of hydrogen from the high-pressure gas source (stage 1), through the actual nozzle (stage 2), to the pseudo-source set at atmospheric pressure (stage 3).
The Abel–Noble equation can be expressed as:
At the orifice, the flow is restricted, and the hydrogen flow velocity can be calculated using the sound velocity formula:
Assume that the velocity of hydrogen at the conceptual nozzle is equal to the local speed of sound:
Assume that the expansion of hydrogen from the high-pressure gas source (Stage 1) to the nozzle outlet (Stage 2) is an isentropic process, and using the Abel–Noble equation:
Based on the energy conservation equation from the high-pressure gas source to the nozzle outlet:
According to the energy conservation equation from the nozzle outlet (Stage 2) to the pseudo-source (Stage 3):
The temperature at the pseudo-source (Stage 3) can be expressed as:
When is the ambient pressure and is the speed of sound, by using the mass conservation equation, the diameter of the pseudo-source can be expressed as:
where RH2 is the gas constant for hydrogen, is the volume constant, is the isentropic index, and is the specific heat capacity at constant pressure.
2.2. Hydrogen Diffusion Model
The diffusion and mixing of high-pressure hydrogen in air are governed by four fundamental conservation laws: mass conservation, momentum conservation, energy conservation, and species conservation. These conservation equations are expressed as follows.
2.2.1. Mass Conservation Equation
This is given below, where denotes the volume porosity, which characterizes the mass transfer capacity of porous objects; is the density of the gas mixture; is the velocity of direction j; is the leakage mass flow rate; and is the volume of the fluid element.
2.2.2. Momentum Conservation Equation
Momentum conservation indicates that the rate of change of momentum of a fluid element is equal to the sum of the external forces acting on it. The governing equation is expressed as follows:
where denotes the stress tensor, represents the resistance exerted by the wall on the fluid, and is the structural resistance in the subgrid-scale model, which is expressed as follows:
2.2.3. Energy Conservation Equation
Energy conservation indicates that the heat entering a fluid element and the work conducted by volume forces are equal to the increase in energy of the fluid element. The energy conservation equation is expressed as follows:
where h denotes the specific enthalpy, is the effective viscosity, p is the pressure, is the heat generation rate, and is the Prandtl number.
2.2.4. Species Conservation Equation
Species conservation indicates that the mass variation of a given fluid species within a system is equal to the sum of its net flux through the open boundaries of the system and its production by chemical reactions. During the mixing process of hydrogen and air, hydrogen and oxygen may also be consumed by chemical reactions such as combustion. The species conservation equations for hydrogen and the hydrogen–air mixture are expressed as follows:
where denotes the mass fraction of the fuel species, is the mass fraction of air, and is the fuel reaction rate.
2.2.5. Turbulence Model
In FLACS-Hydrogen, gas turbulence is modeled using the standard k–ε model to calculate turbulent kinetic energy and its dissipation. The Reynolds stress tensor is modeled based on the eddy-viscosity hypothesis, using eddy viscosity.
where is the turbulent kinetic energy, is the turbulent energy dissipation, is the turbulent energy generation, is the fluid shear stress, is the wall shear stress, is the buoyancy, is the subgrid objects, and are the turbulent Prandtl numbers for and , respectively, with values of 1.0 and 1.3. , , and are constants, taken as 1.44, 1.92, and 0.8, respectively. is the model for the buoyancy term; is the average velocity in the i- and j-directions, respectively, and is the Kronecker delta function ( = 1 when i = j, otherwise = 0).
2.3. Equivalent Stoichiometric Cloud Model
Hydrogen clouds usually exhibit irregular shapes and non-uniform concentration distributions. To quantitatively assess the risk of such heterogeneous flammable hydrogen clouds and enable linearized treatment, the equivalent stoichiometric cloud (ESC) model was introduced in this study. Through energy-equivalent conversion, this method simplifies a gas cloud with complex geometry and non-uniform concentration into a regular and homogeneous ESC, while maintaining a hazard potential comparable to that of the original cloud when predicting damage parameters such as deflagration-induced blast waves. Considering that the maximum hydrogen deflagration effect generally occurs in regions close to the stoichiometric concentration, approximately 29.6% vol., the ESC model is theoretically well-justified.
According to differences in flame propagation dynamics and overpressure wave driving mechanisms under different scenarios, the ESC method can be further divided into several submodels. In well-ventilated semi-open or open spaces, flame propagation velocity plays a dominant role in deflagration evolution. The Q9 model couples the propagation velocity with the expansion factor and can therefore describe the deflagration process more accurately. Given that the scenario constructed in this study is a low-confinement space, the Q9 model is more suitable for ESC volume characterization and deflagration risk quantification. The Q9 model used in this study is not a newly proposed model, but an equivalent stoichiometric cloud method implemented in FLACS for gas explosion risk assessment. Previous studies [45,46] have evaluated different equivalent cloud methods and reported that Q9 can provide reasonable performance for a range of gas explosion scenarios, although its applicability may be affected by confinement and concentration distribution.
Nevertheless, the Q9 methodology also has inherent limitations. The ESC approach converts a non-uniform and irregular hydrogen cloud into an equivalent stoichiometric cloud, and therefore cannot fully preserve the actual spatial distribution of hydrogen concentration, turbulence intensity, flame acceleration path, and obstacle induced congestion effects. Thus, Q9 should be regarded as a comparative indicator of potential deflagration severity rather than a direct prediction of actual explosion overpressure or structural damage. In this work, Q9 was used together with the combustible cloud volume to compare the relative risk levels under different leakage and mitigation scenarios.
where the summation range (i = 1, …, n) covers all effective control volume cells within the study domain. The equivalence ratio lies within the flammable range, namely ERLFL < ERi < ERUFL. Vi denotes the open volume available for fluid motion in the (i)-th control volume. The effect of porosity is considered, and only the non-obstructed space is included. The denominator is used for normalization to reflect the maximum potential contribution to the explosion effect over the entire flammable range.
Since the ESC/Q9 method is concentration-dependent, the contribution of each computational cell to Q9 is not determined only by its volume, but also by its local hydrogen concentration or equivalence ratio. Cells with hydrogen concentrations close to the stoichiometric concentration contribute more strongly to Q9, whereas cells near the lower flammability limit mainly increase the combustible cloud volume but have a weaker contribution to Q9. Therefore, Q9 is more sensitive to the spatial distribution of high concentration hydrogen regions than to the total volume of the flammable cloud.
2.4. Wind Boundary Model
The wind boundary reproduces the characteristics of the atmospheric boundary layer near the Earth’s surface. Monin and Obukhov [47] proposed a theory to describe the influence of buoyancy on the atmospheric boundary layer and defined a characteristic length scale:
where denotes the sensible heat flux from the ground surface, and is the friction velocity. The Monin–Obukhov length is a measure of atmospheric boundary layer stability. In FLACS-CFD, the Monin–Obukhov length is estimated using the Pasquill classification, which categorizes the level of atmospheric turbulence. The initial conditions should specify the mean wind speed U0, reference height Zref, atmospheric roughness length Z0, and Pasquill stability class. The velocity profile follows a logarithmic form:
where Zd denotes the canopy height, and is commonly expressed as:
And is expressed as:
where . According to the values given in the wind profile parameter table, the Monin–Obukhov length can be calculated as follows:
2.5. Energy Storage Scenario
2.5.1. 3D Model
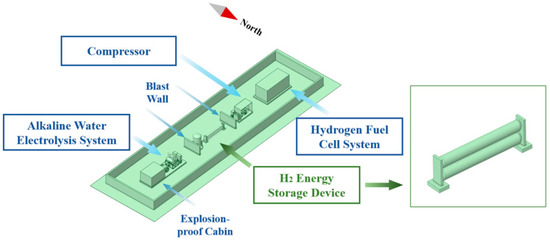
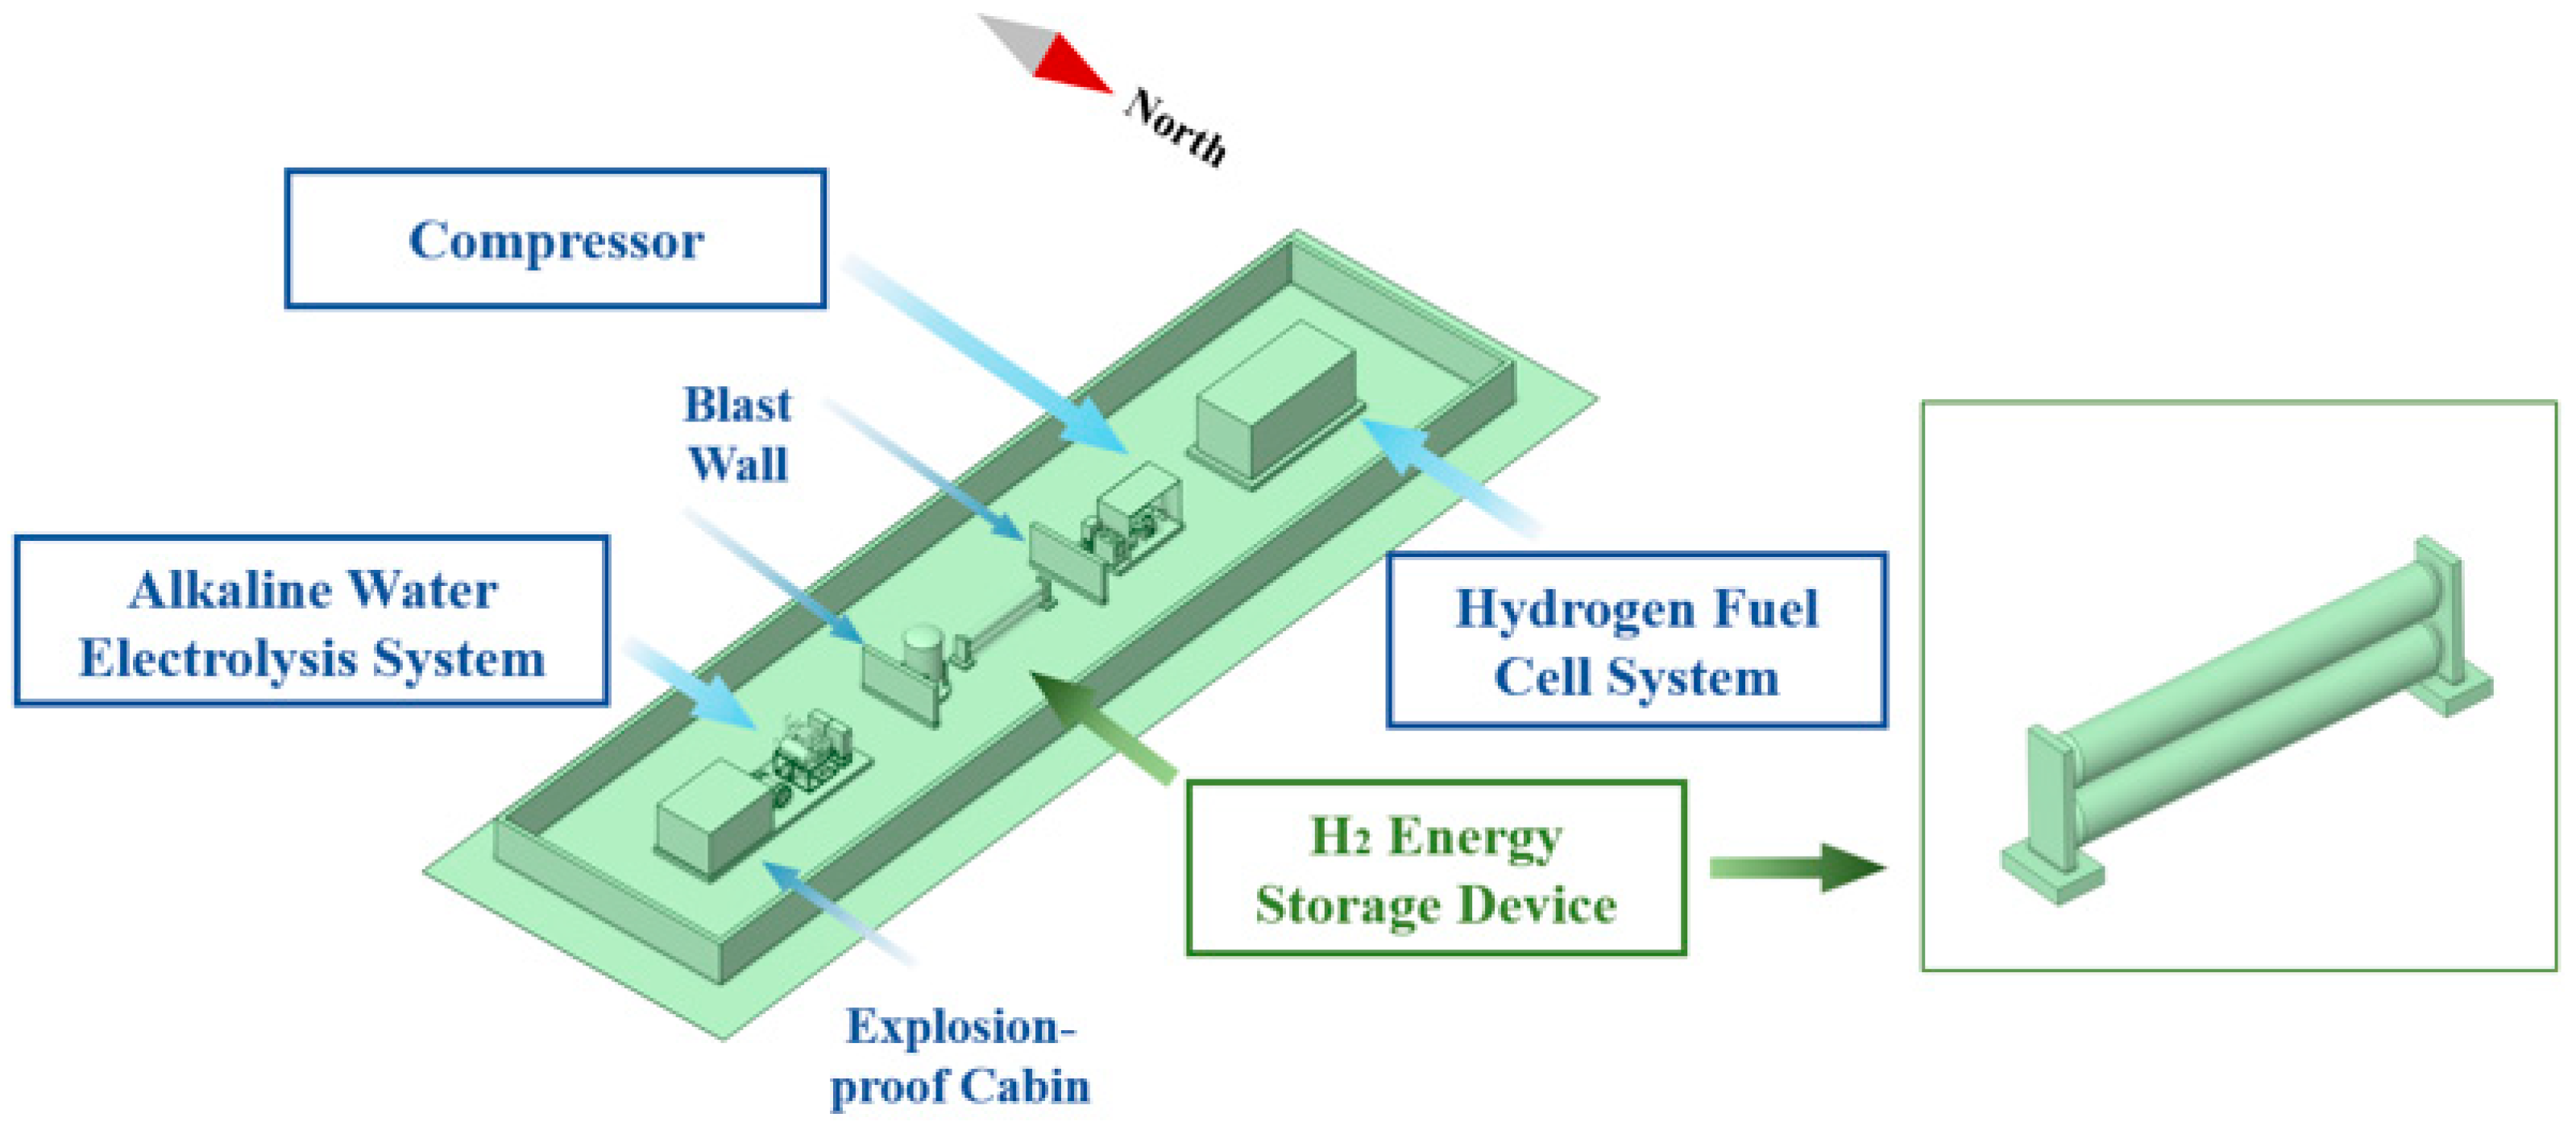
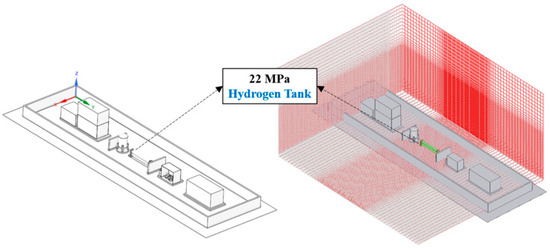
Based on the field survey results, a model of the integrated hydrogen energy storage station in Shandong, covering hydrogen production, storage, compression, and utilization scenarios, was established, as shown in Figure 2. The station consists of four main sections: the water electrolysis hydrogen production container, hydrogen storage equipment, compressor system, and fuel cell system. These four sections are interconnected. Hydrogen is produced in the water electrolysis container using an alkaline electrolyzer. After drying and purification, the hydrogen flows into a hydrogen buffer tank and is then compressed by the hydrogen compressor to 20 MPa. The compressed hydrogen is subsequently divided into two streams: one enters the 20 MPa hydrogen storage vessel, while the other passes through a pressure-reducing valve and enters the fuel cell power generation unit for combined heat and power supply.
Figure 2.
3D model of integrated hydrogen energy storage station.
The hydrogen storage equipment consists of a 20 MPa hydrogen storage vessel group exposed to an open space. It includes two hydrogen storage vessels with a rated working pressure of 20 MPa. Each vessel has a volume of approximately 1130 L, giving a total storage volume of 2260 L. The hydrogen storage vessels mainly receive hydrogen compressed by the 20 MPa compressor and store it in the two vessels. The three-dimensional model is shown on the right side of Figure 2. During hydrogen leakage from a storage vessel, the probability of vessel body rupture is relatively low. In most cases, hydrogen is rapidly released at high pressure through a safety valve or relief valve. In addition, the pressure in the storage vessel gradually decreases during leakage; therefore, the leakage flow rate is not constant.
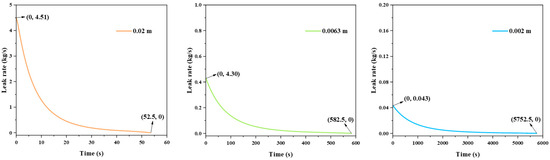
The diameter of the outlet pipe near the hydrogen relief valve of the storage vessel is 3/4 inch. Based on this pipe diameter, the leakage diameters correspond to 1%, 10%, and 100% of the flow area. The orifices are calculated to be 0.002 m, 0.0063 m, and 0.02 m, respectively. These three leakage hole diameters were selected to represent small-scale, medium-scale, and large-scale leakage scenarios, respectively. In the simulation, storage tanks, blast walls, perimeter walls, the ground, and equipment surfaces were defined as impermeable, non-slip, and thermally insulated surfaces. According to the characteristics of the pipeline connected to the hydrogen storage vessel, pipe rupture may occur when the internal pressure increases to approximately 22 MPa. Therefore, 22 MPa was selected as the maximum leakage pressure in this study to represent a conservative high-pressure pipe rupture scenario. The leakage temperature was set to the ambient temperature of 20 °C. A hydrogen leak is a non-steady state process; as the leak progresses, the pressure will continue to decrease. Therefore, the adiabatic blowdown model to describe this process was applied in FLACS to model an empty tank with decreasing pressure. Figure 3 shows the predicted relationship between the flow rate and empty time for a blowdown through orifices of 0.02, 0.0063, and 0.002 m. The overall blowdown times for the hydrogen release were 52.5 s, 582.5 s, and 5752.5 s from the orifices of 0.02 m, 0.0063 m, and 0.002 m, respectively, of the 2260 L tank at 22 MPa.
Figure 3.
Mass flow rate for an adiabatic blowdown at 22 MPa under leakage diameters of 0.02 m, 0.0063 m, and 0.002 mm.
2.5.2. Grid Independence
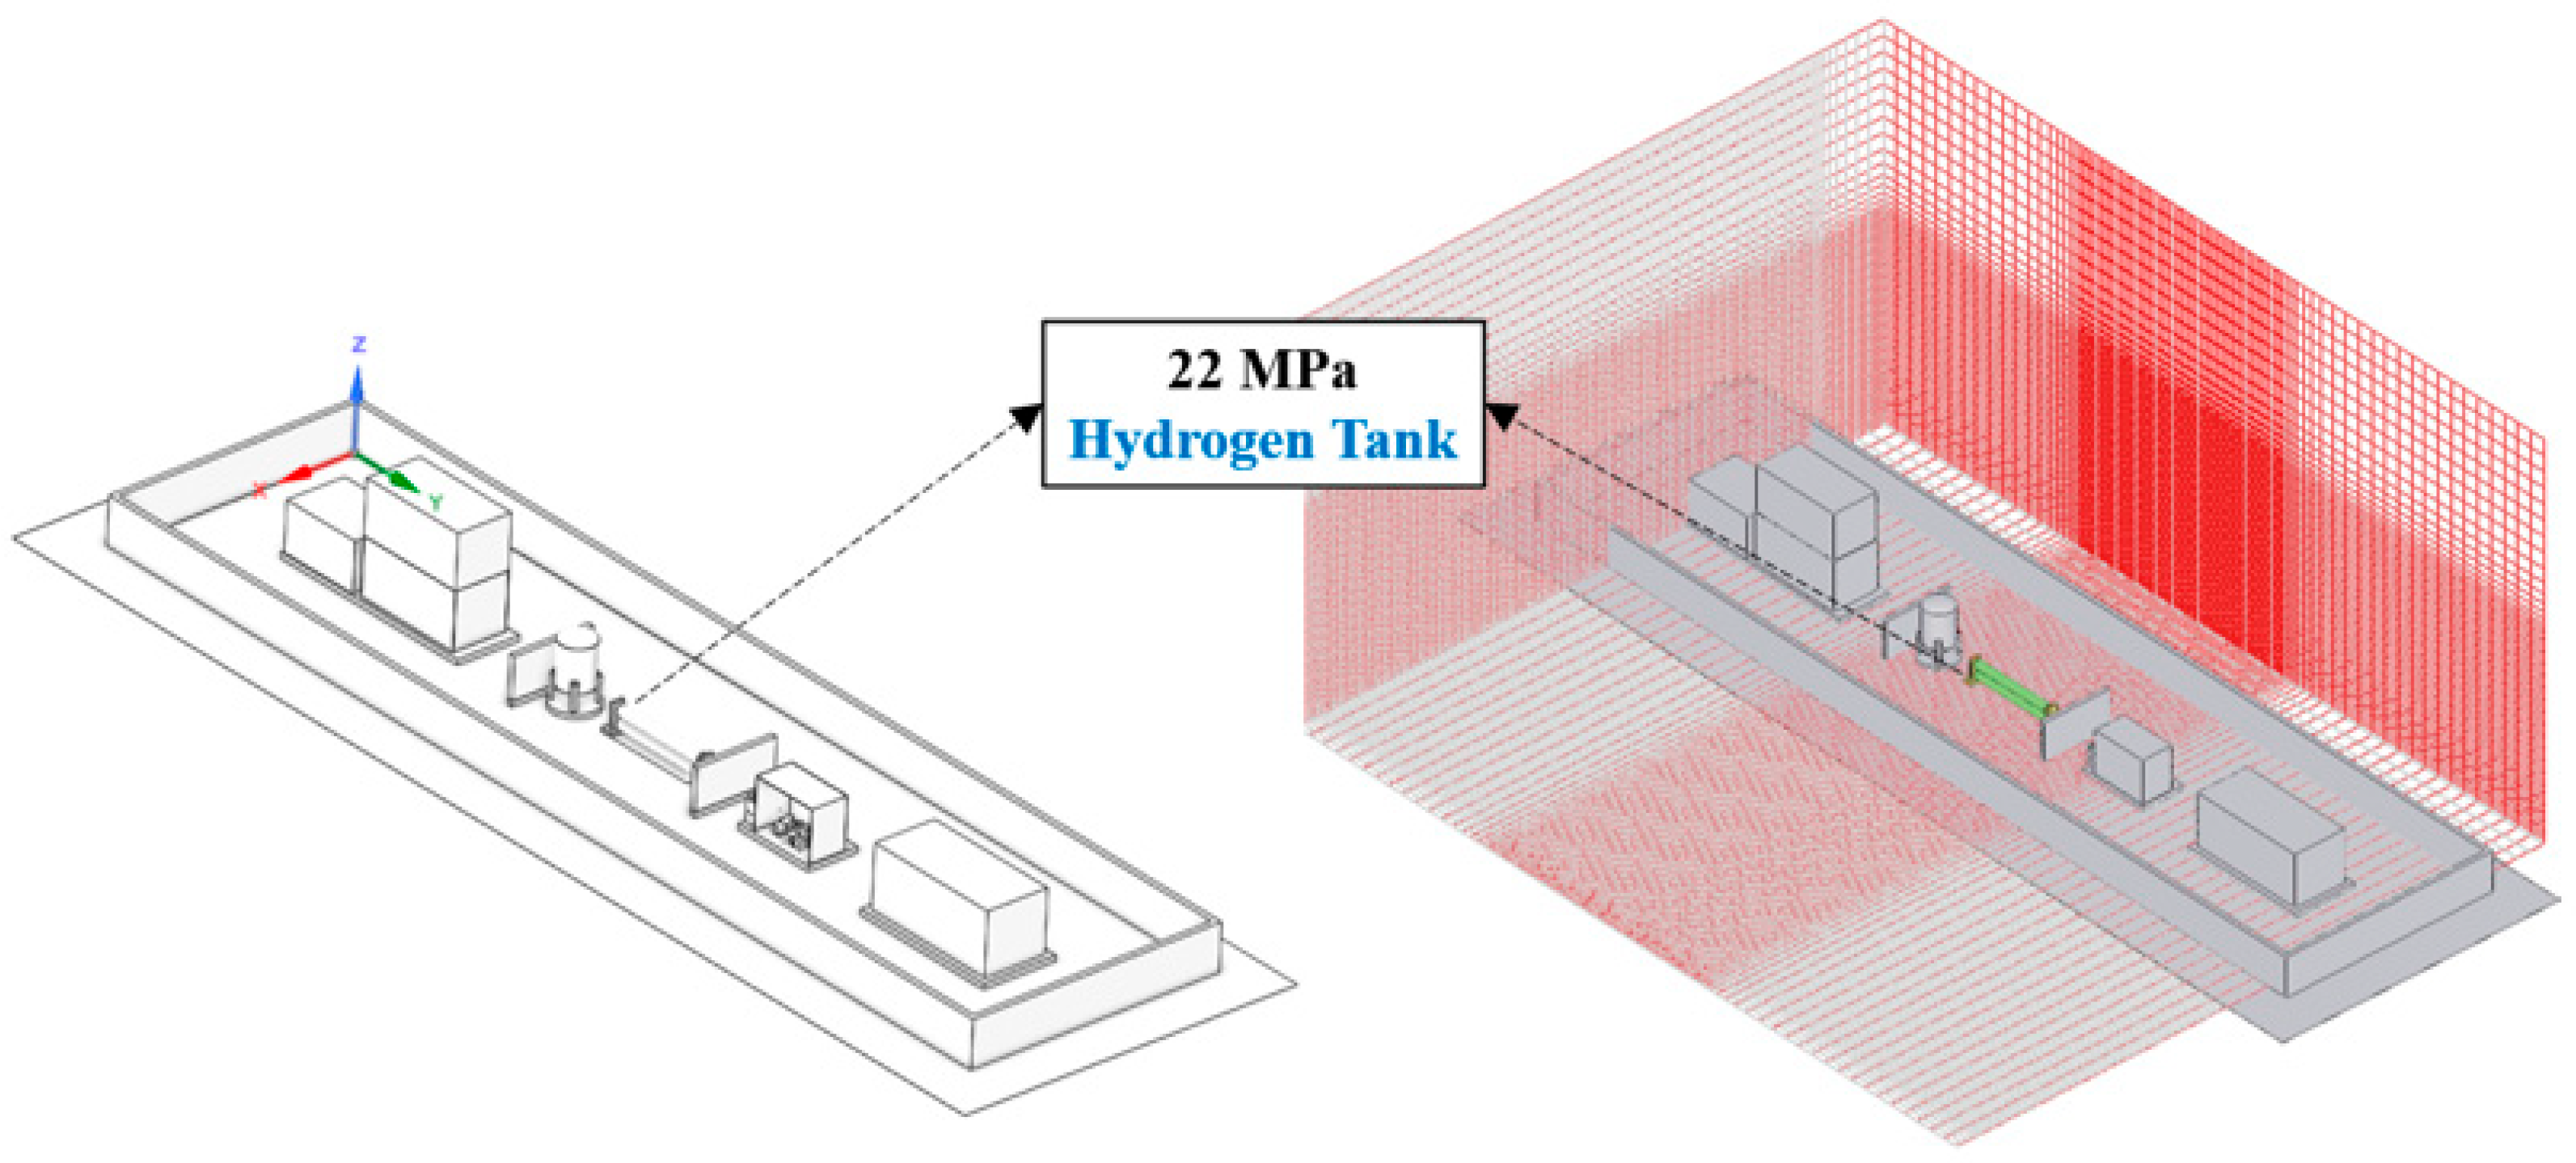
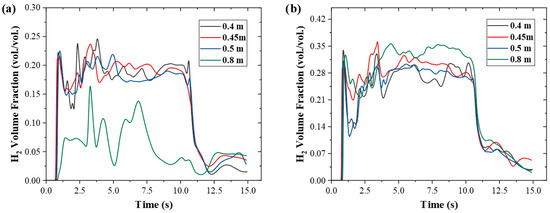
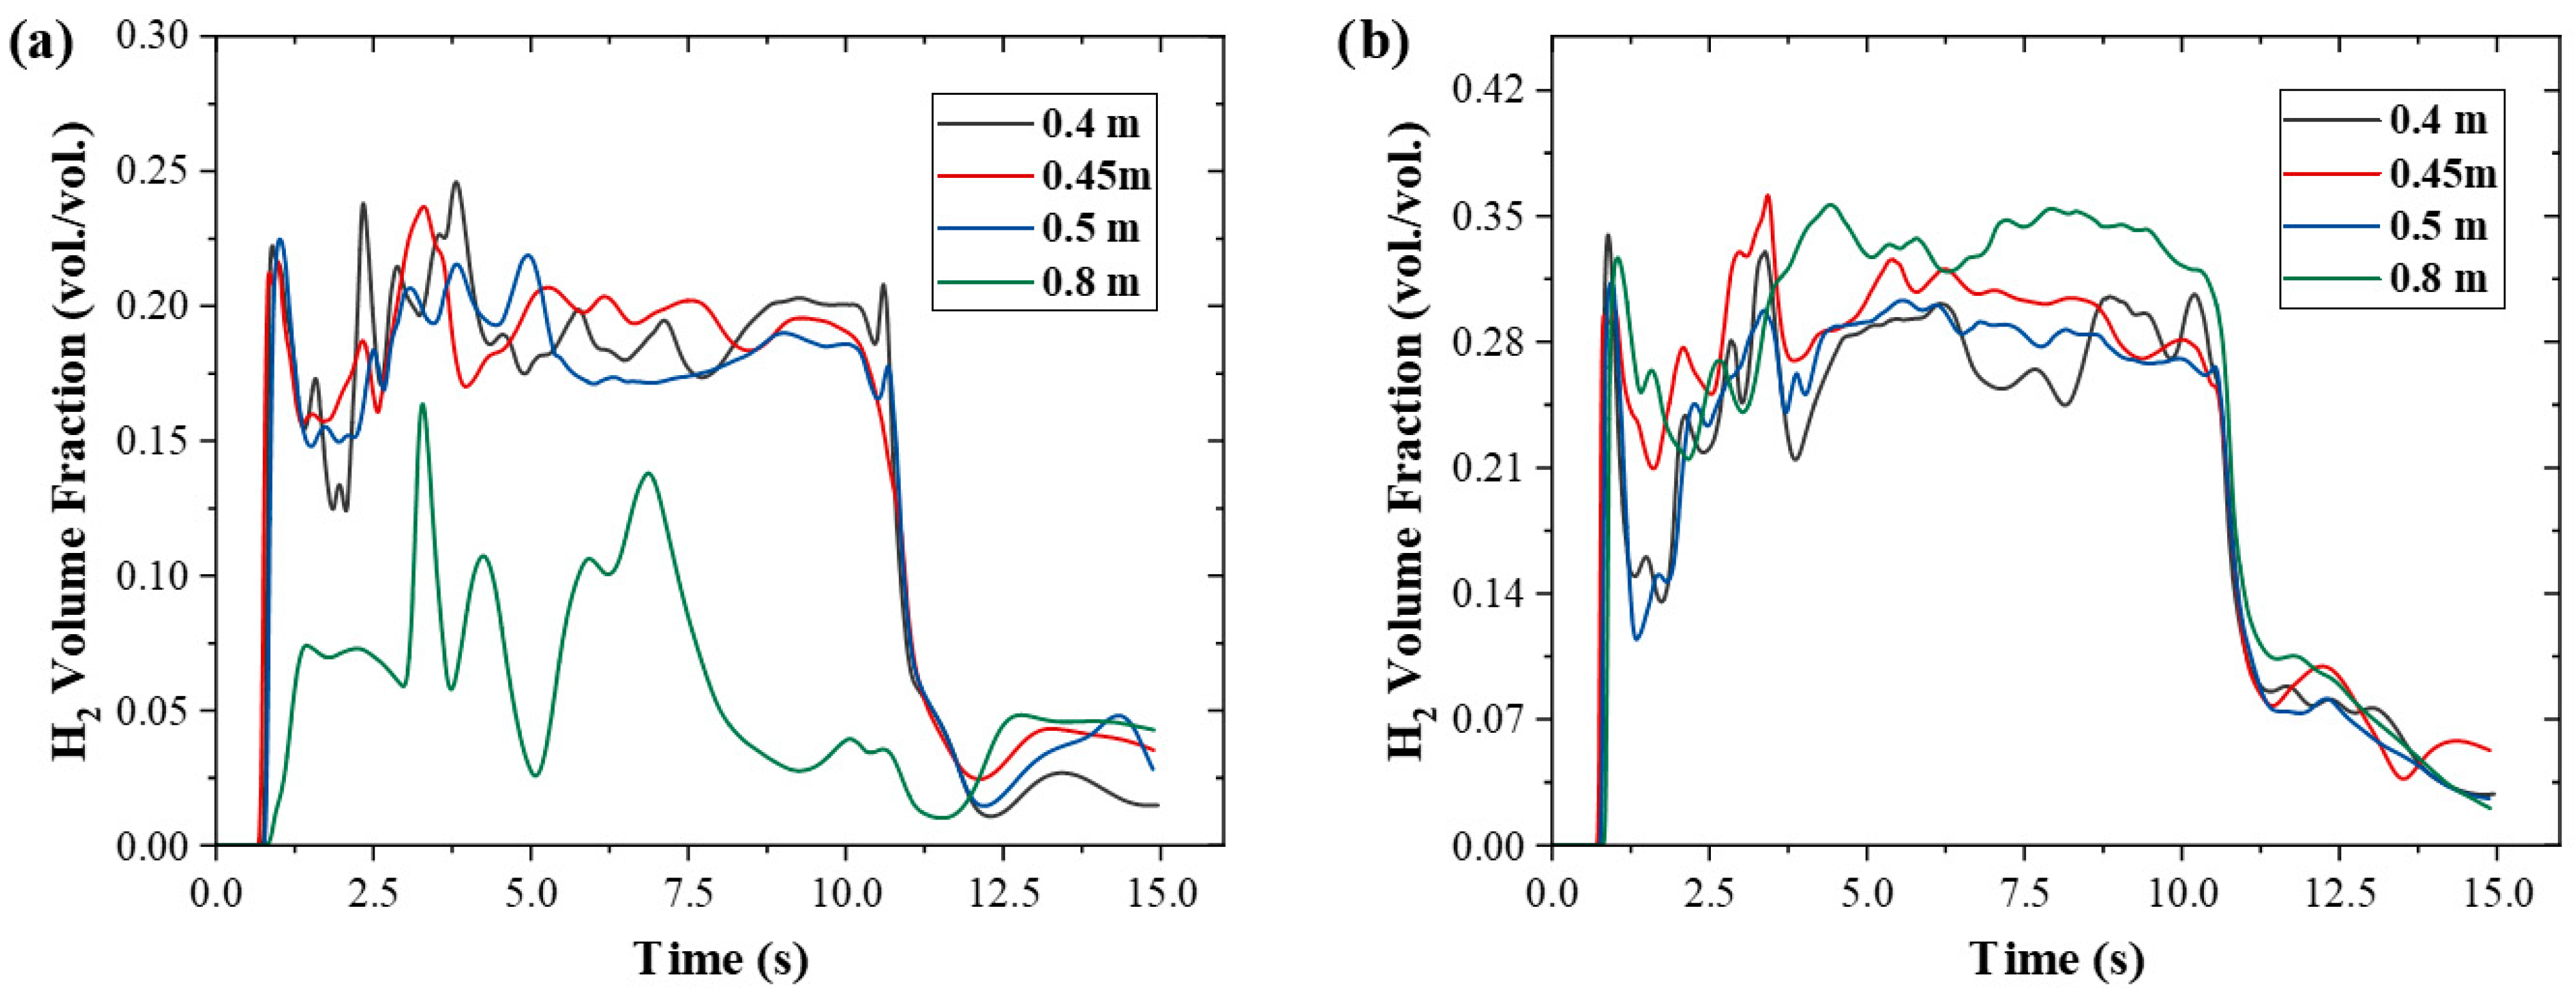
The 3D model was imported into FLACS, as shown in Figure 4, after which the computational mesh was generated for the scenario and a grid independence verification was conducted. The leakage diameter was set to that of the large-scale leakage scenario, namely 0.02 m. The leakage duration was set to 10 s, and the total simulation time was 15 s. Mesh sizes of 0.4 m, 0.45 m, 0.5 m, and 0.8 m were considered. The simulation results are shown in Figure 5.
Figure 4.
Mesh generation diagram after importing the 3D model into FLACS.
Figure 5.
Variation of hydrogen concentration at the monitoring point under different mesh sizes: (a) monitoring point 1; (b) monitoring point 2.
Based on the grid-independence simulation, for the first monitoring point, MP1, the meshes with sizes of 0.4 m, 0.45 m, and 0.5 m showed good consistency throughout the simulation. Their data fluctuation trends were generally consistent, and the corresponding hydrogen volume fractions at the same time instants were also relatively close. For the second monitoring point, MP2, during the initial stage of the simulation, the 0.4 m and 0.5 m meshes exhibited fluctuations with an amplitude of 10% vol. During the period of 5–10 s, the 0.8 m mesh deviated from the other three mesh sizes by approximately 5% vol., whereas the other three mesh sizes showed good agreement. After the leakage ended, during the residual hydrogen dispersion stage, the four mesh sizes exhibited good consistency. In summary, because the 0.8 m mesh showed relatively large deviations, and considering both computational efficiency and accuracy, the 0.5 m mesh was selected for the subsequent numerical simulations.
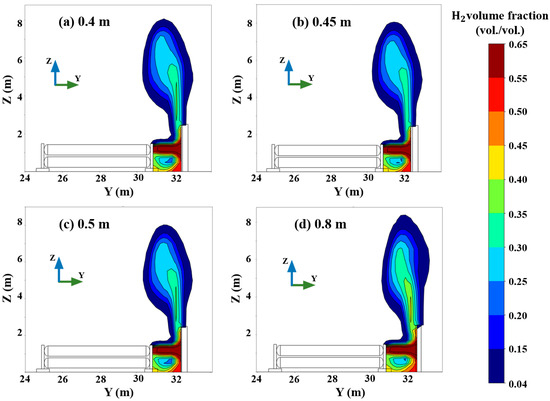
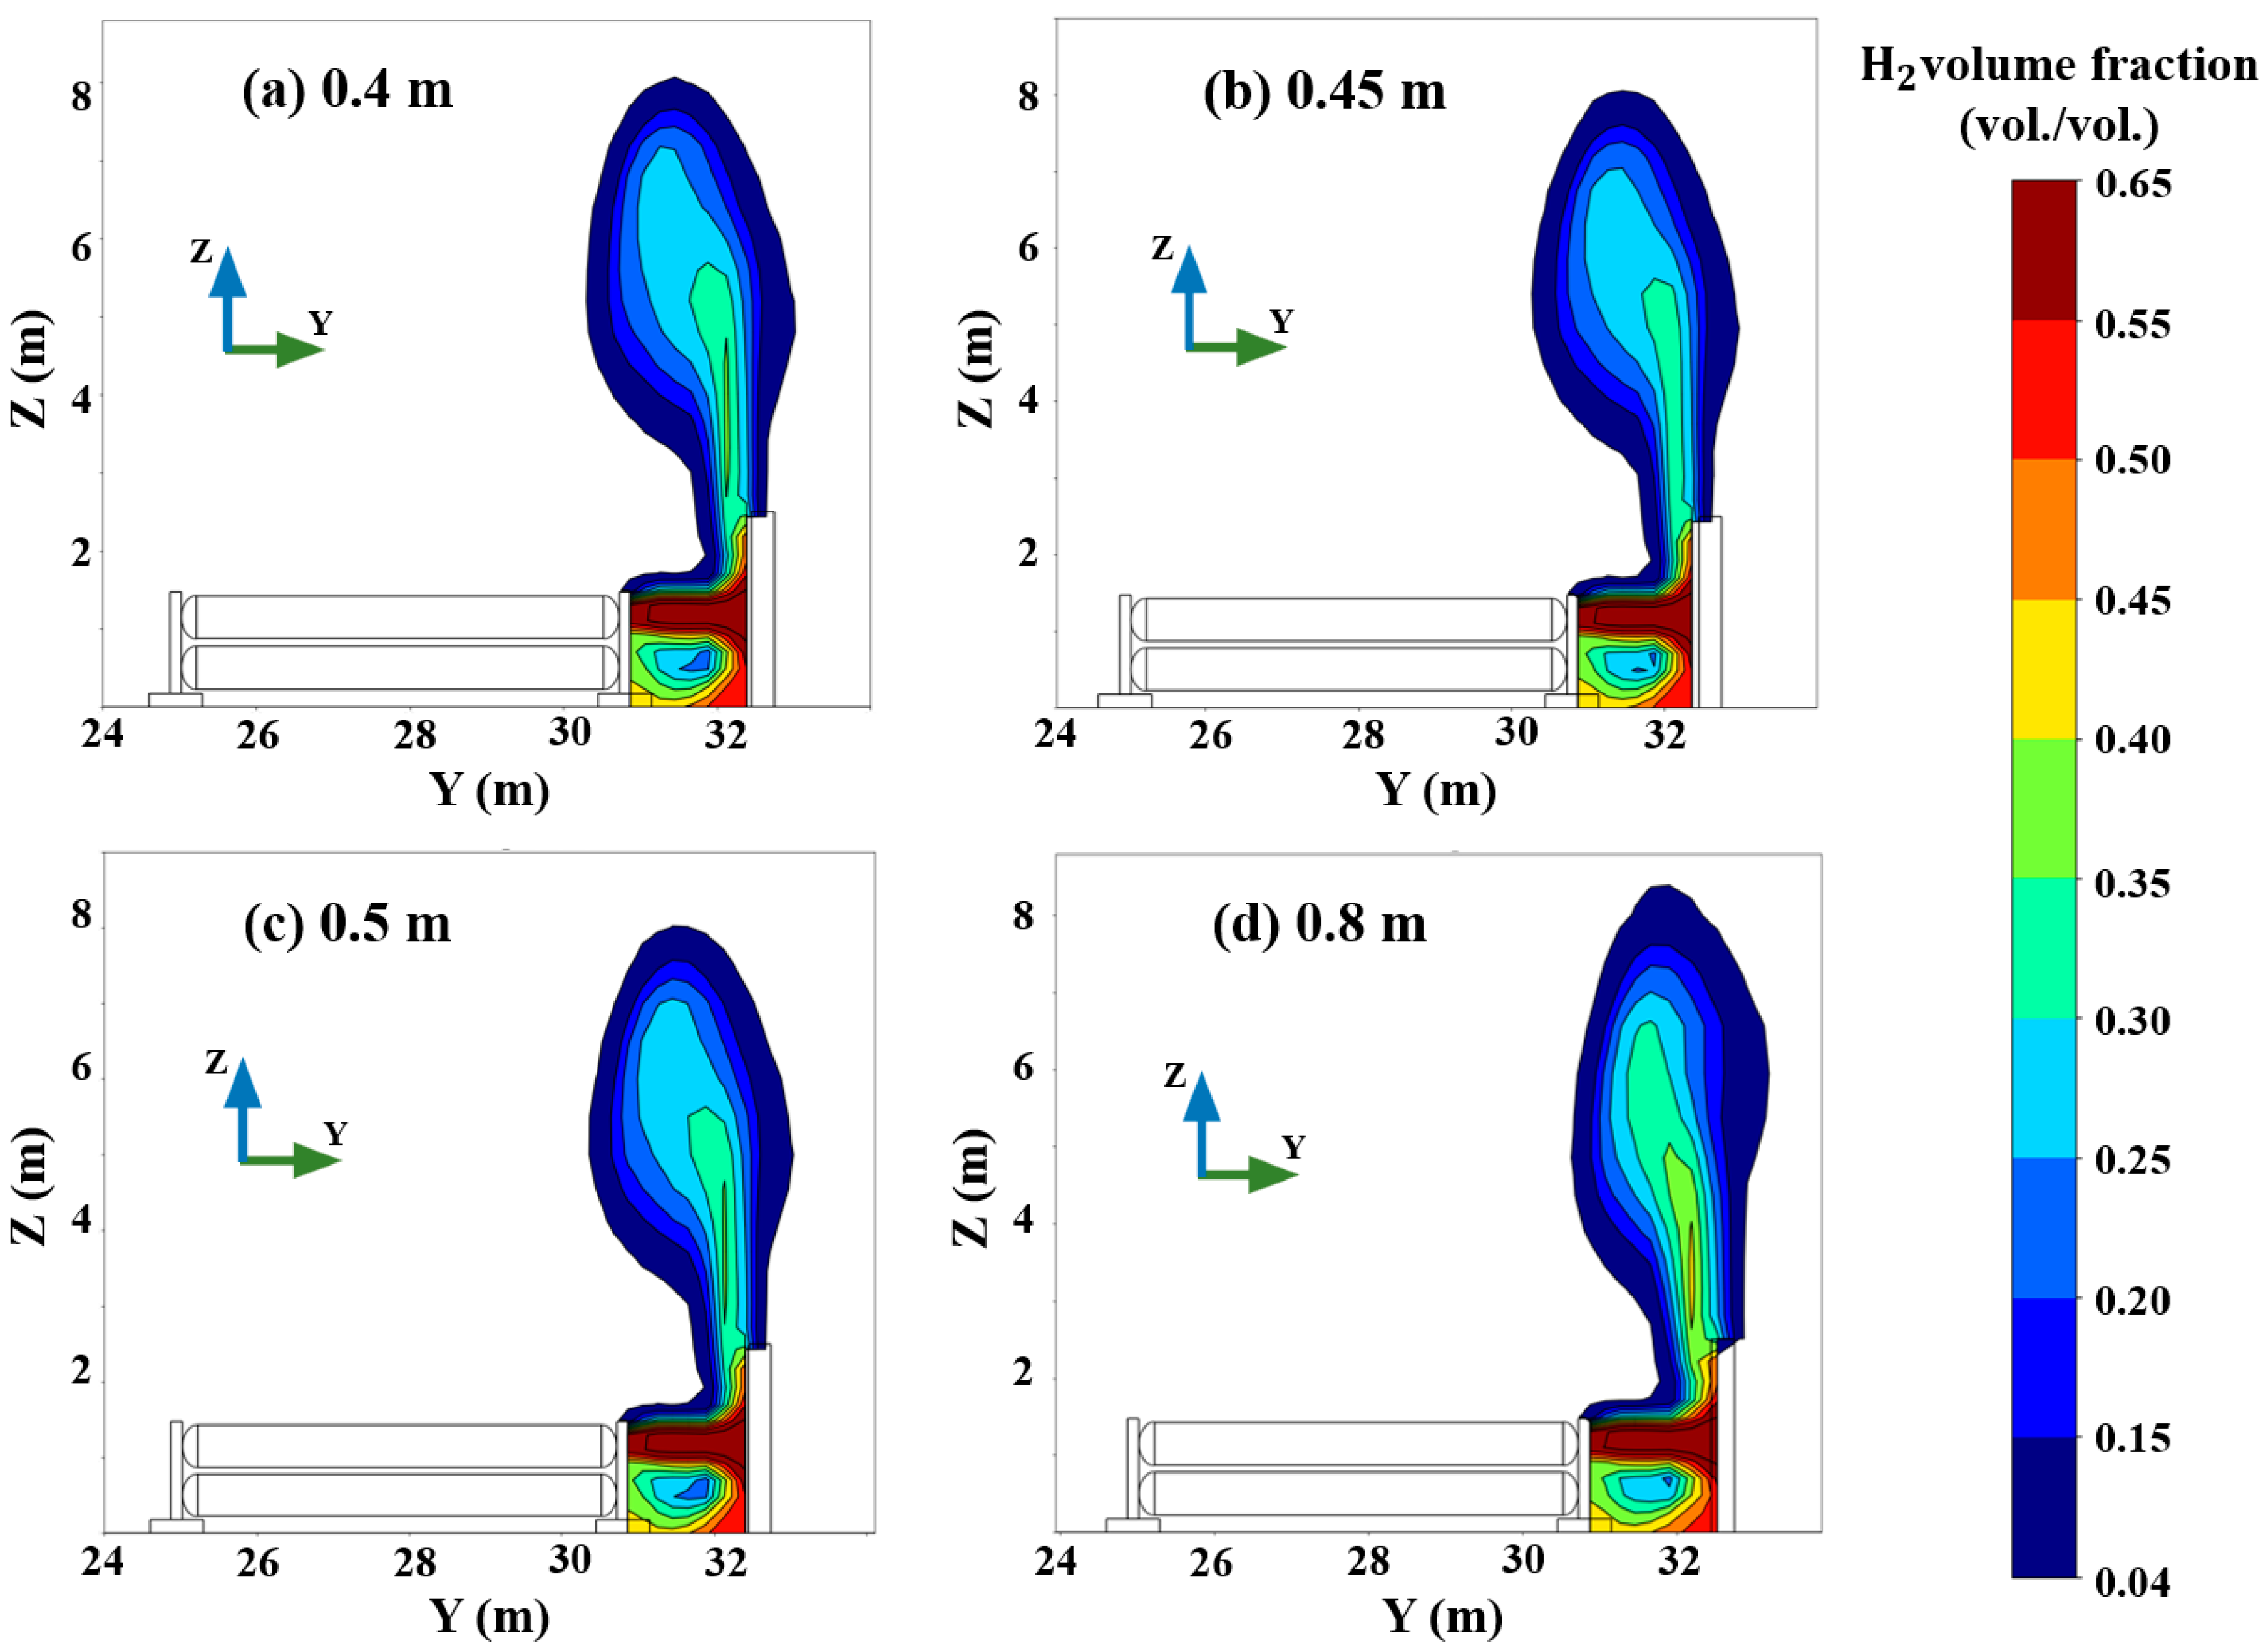
In addition, the global hydrogen volume-fraction distributions in the Y–Z plane under different mesh sizes were further compared at 1 s after the onset of leakage, as shown in Figure 6. It can be observed that with the 0.8 m mesh size, the hydrogen region with a volume fraction in the range of 0.30–0.35 was noticeably enlarged, whereas the other three mesh sizes showed almost similar hydrogen volume-fraction distribution regions. Therefore, this comparison further supports the accuracy of the grid independence verification from another perspective.
Figure 6.
Hydrogen volume fraction distribution in the YZ plane (X = 6.7 m) 1 s after leakage.
2.5.3. Model Validation
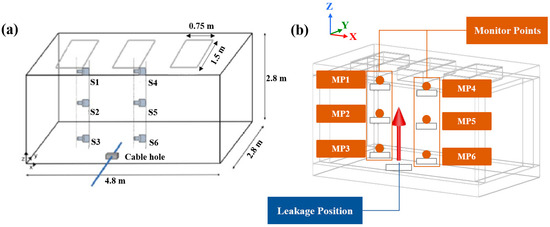
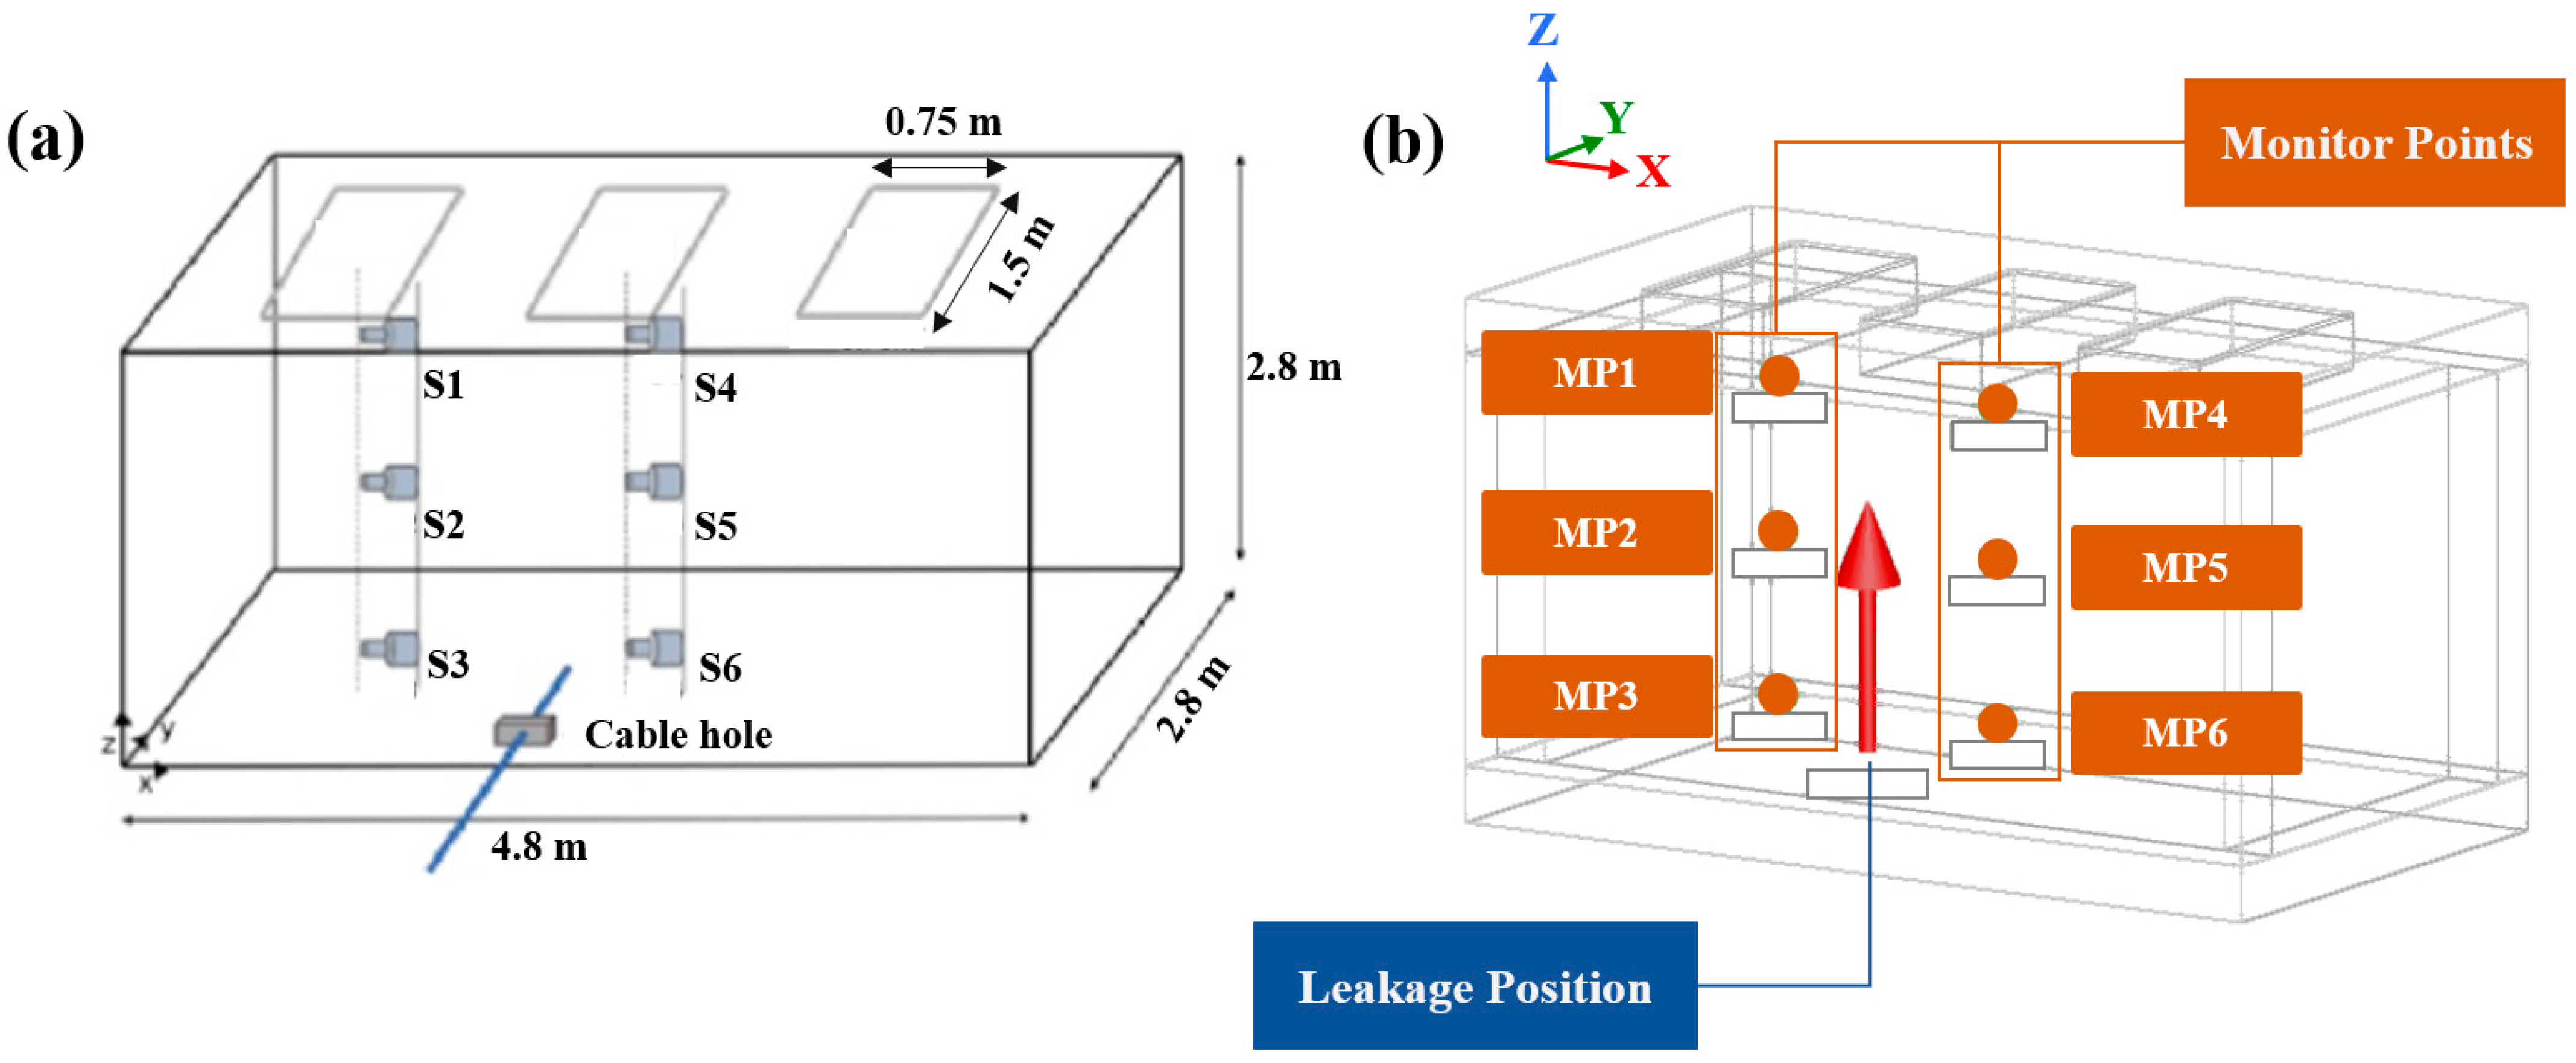
The three-dimensional model established in this study was developed with reference to the cement indoor space constructed outdoors by Kim et al. [48]. The accuracy of the numerical simulation model was validated by comparing the simulated and experimental hydrogen concentration variations at different monitoring locations. The physical model is shown in Figure 7. The external dimensions of the model were 4.9 m in length, 2.8 m in width, and 2.8 m in height, with an internal cement wall thickness of 0.3 m. Three ventilation openings, each measuring 0.75 m × 1.5 m, were located at the top of the structure, and the distance between the center points of adjacent openings was 1.35 m.
Figure 7.
Model validation: (a) Experimental models in the literature [48]; (b) simulation model.
According to the coordinate system shown in the figure, three sensors, namely S1, S2, and S3, were vertically arranged along the Z-axis at X = 1.05 m and Y = 1.4 m, with heights of 2.25 m, 1.40 m, and 0.55 m above the floor, respectively. A second group of sensors, S4, S5, and S6, was arranged at the same heights at X = 2.4 m and Y = 1.4 m. Hydrogen was released from a pipe located at the bottom of the model, with the leakage direction vertically upward along the positive Z-axis.
The experimental condition used for model validation involved hydrogen leakage and diffusion in an enclosed space. Specifically, hydrogen was introduced into the enclosure through a leakage pipe with a diameter of 12.7 mm (1/2 inch) at a flow rate of 600 L/min. Based on the leakage conditions and the parameters of the physical structure, a three-dimensional simulation model was then established, as shown in Figure 7.
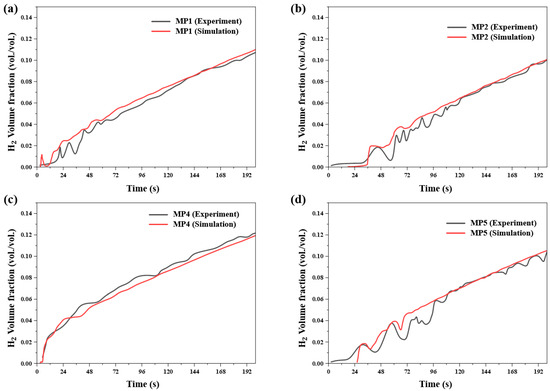
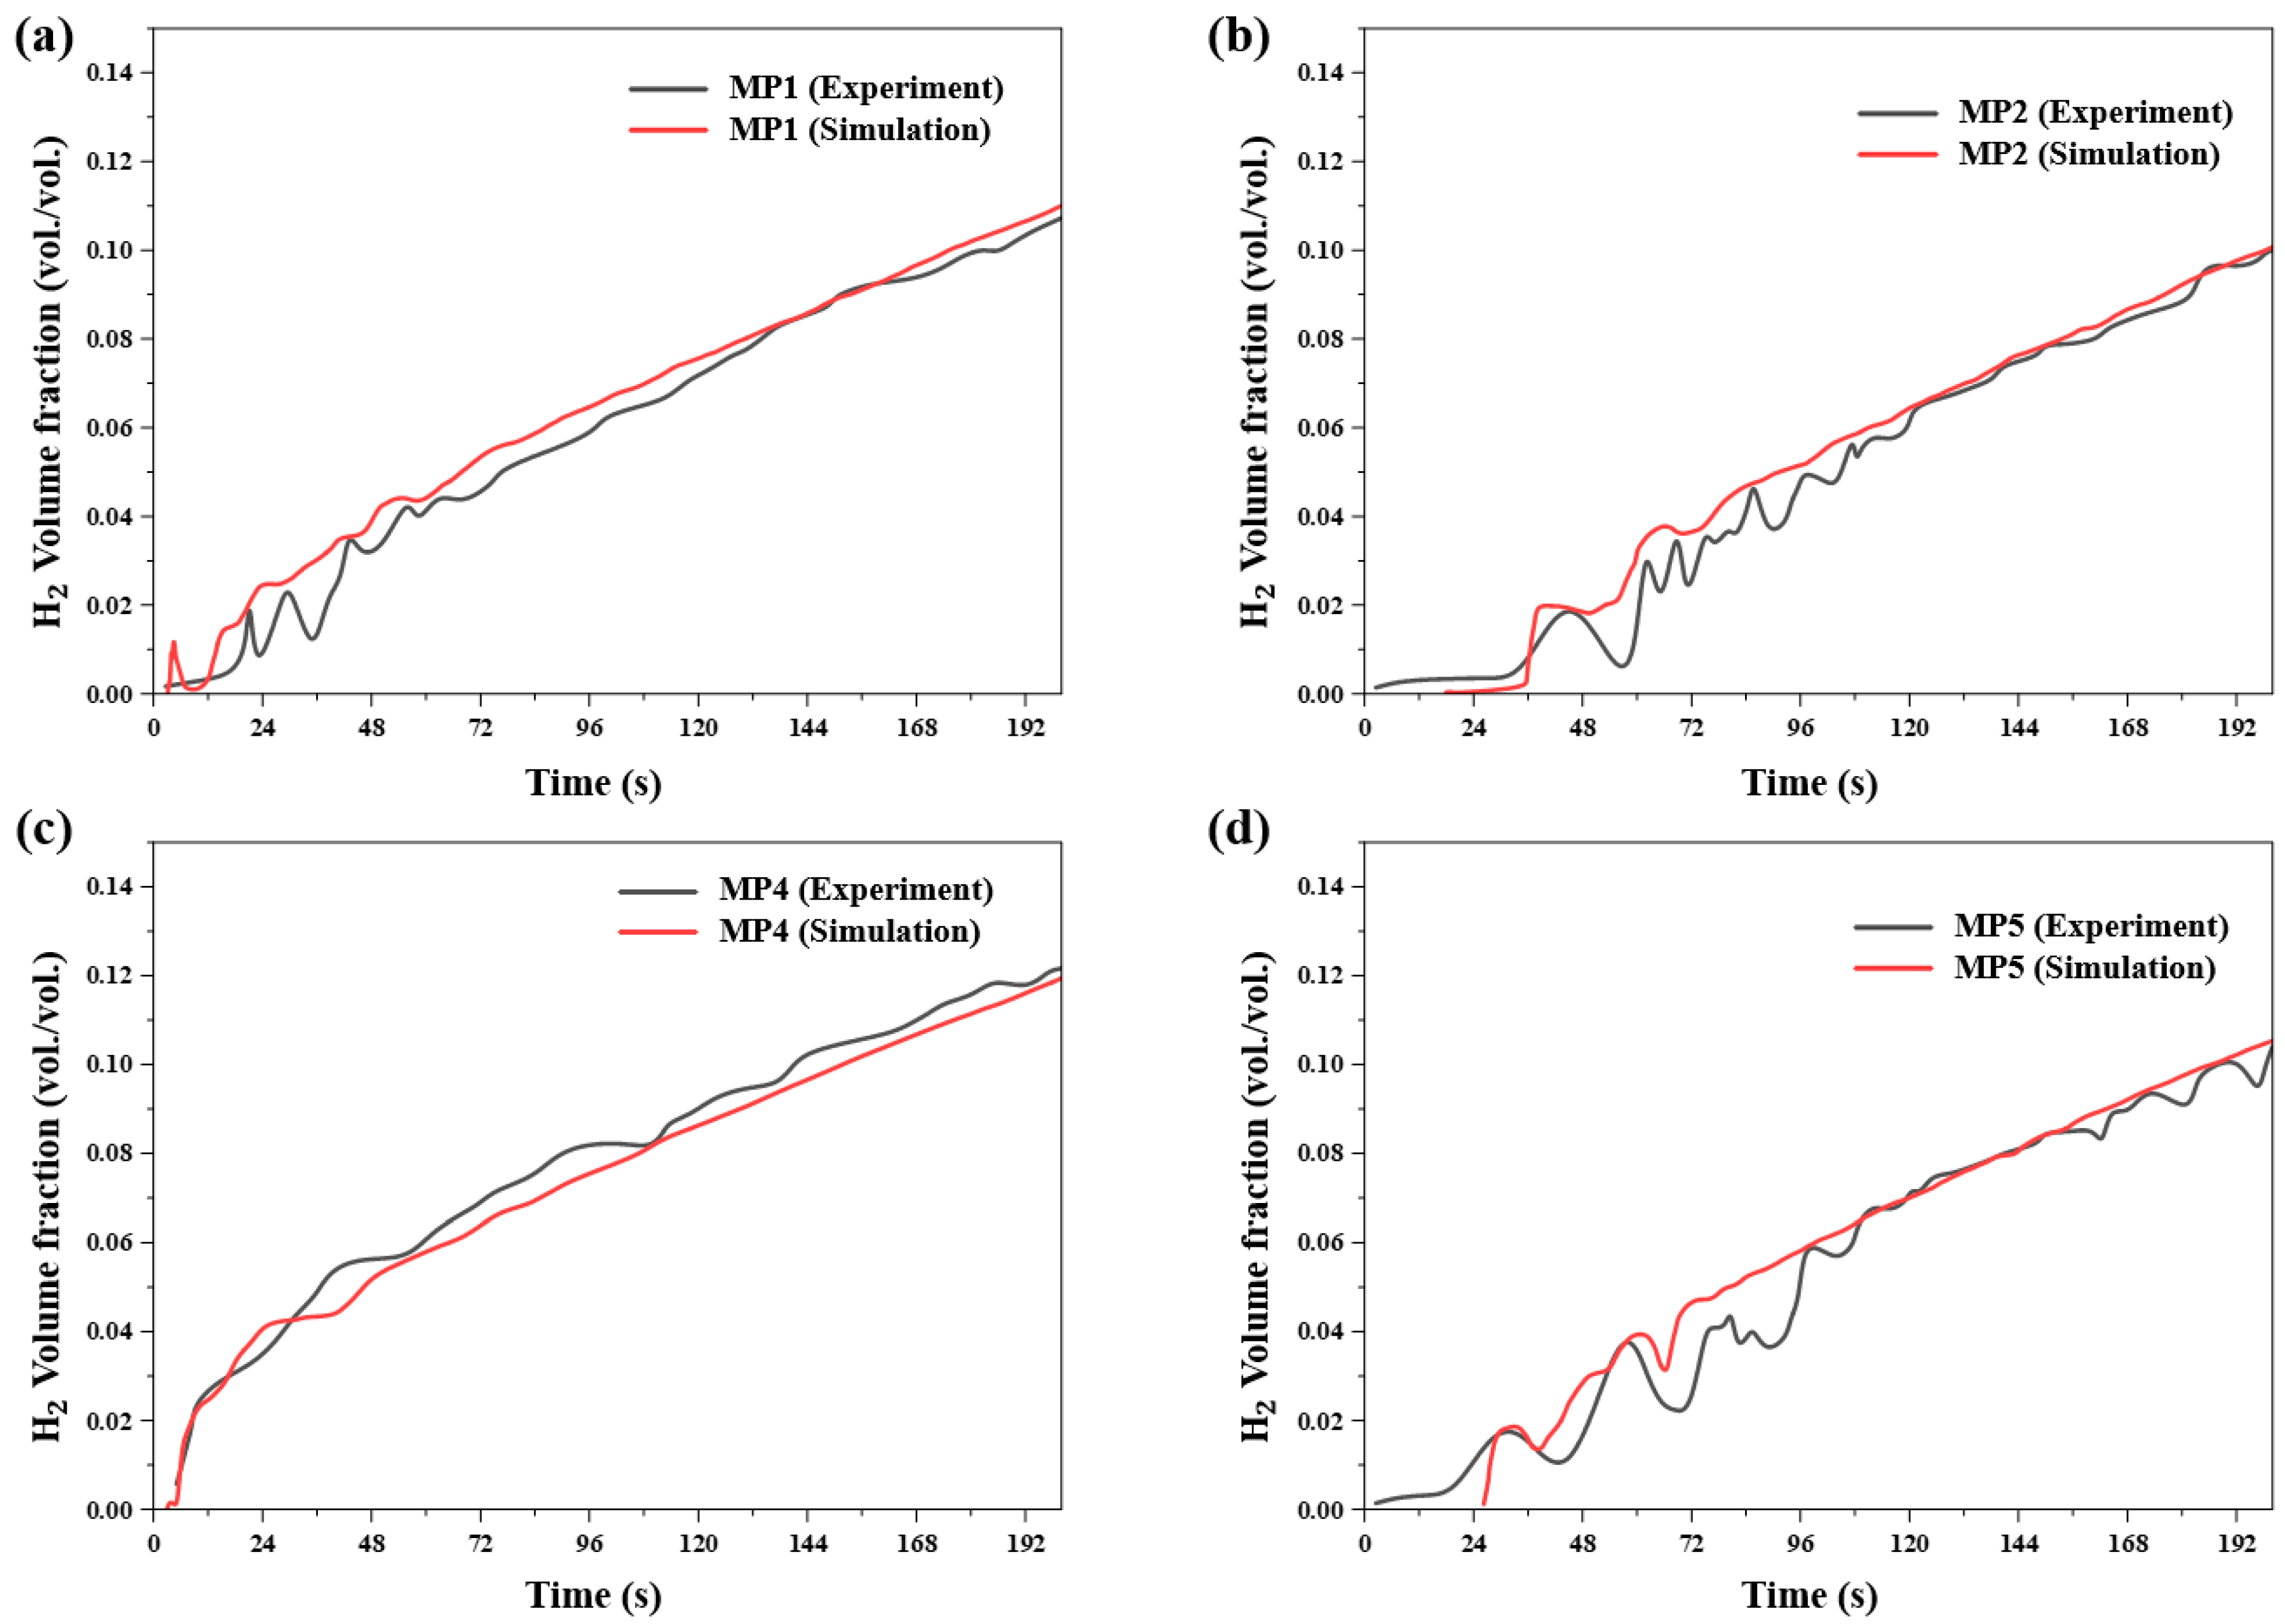
The simulation was subsequently carried out. Since the top ventilation openings in the experiment were opened only after the leakage had continued for 283 s, the present validation focused only on the first 200 s of the enclosed leakage process. The hydrogen concentration variations obtained from the experiment and the simulation at different sensor locations were compared, as shown in Figure 8.
Figure 8.
Hydrogen concentrations at different monitoring points: (a) MP1; (b) MP2; (c) MP4; (d) MP5.
At monitoring points 1, 2, 4, and 5, the experimental and simulated results showed good agreement. In the early stage of the experiment, the measured hydrogen concentrations exhibited certain fluctuations, which may be attributed to variations in the natural environment or the sensitivity of the hydrogen concentration sensors. These deviations are considered acceptable. In the later stage of both the experiment and the simulation, after 100 s, the hydrogen concentration varied more steadily with time, and the results remained in good agreement.
Therefore, the numerical model for hydrogen leakage and diffusion used in this study shows a high degree of consistency with the actual hydrogen leakage and diffusion process, and can be applied to subsequent simulation studies.
3. Result and Discussion
3.1. Hydrogen Leakage and Diffusion Analysis Based on the Pressure Relief Valve
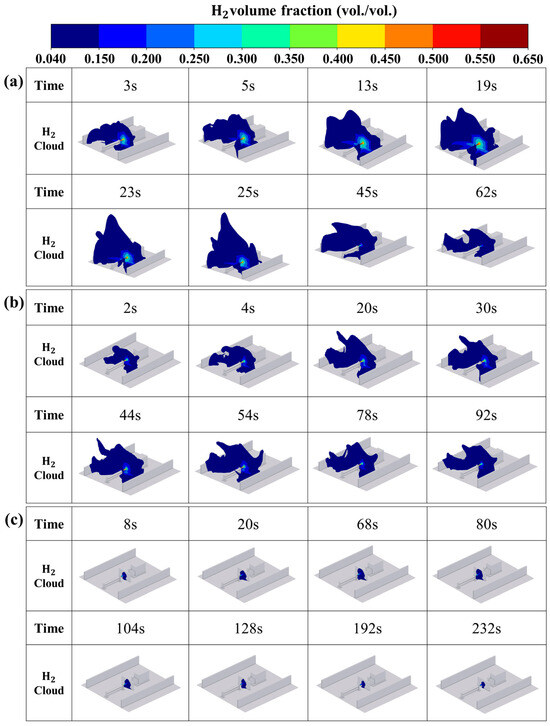
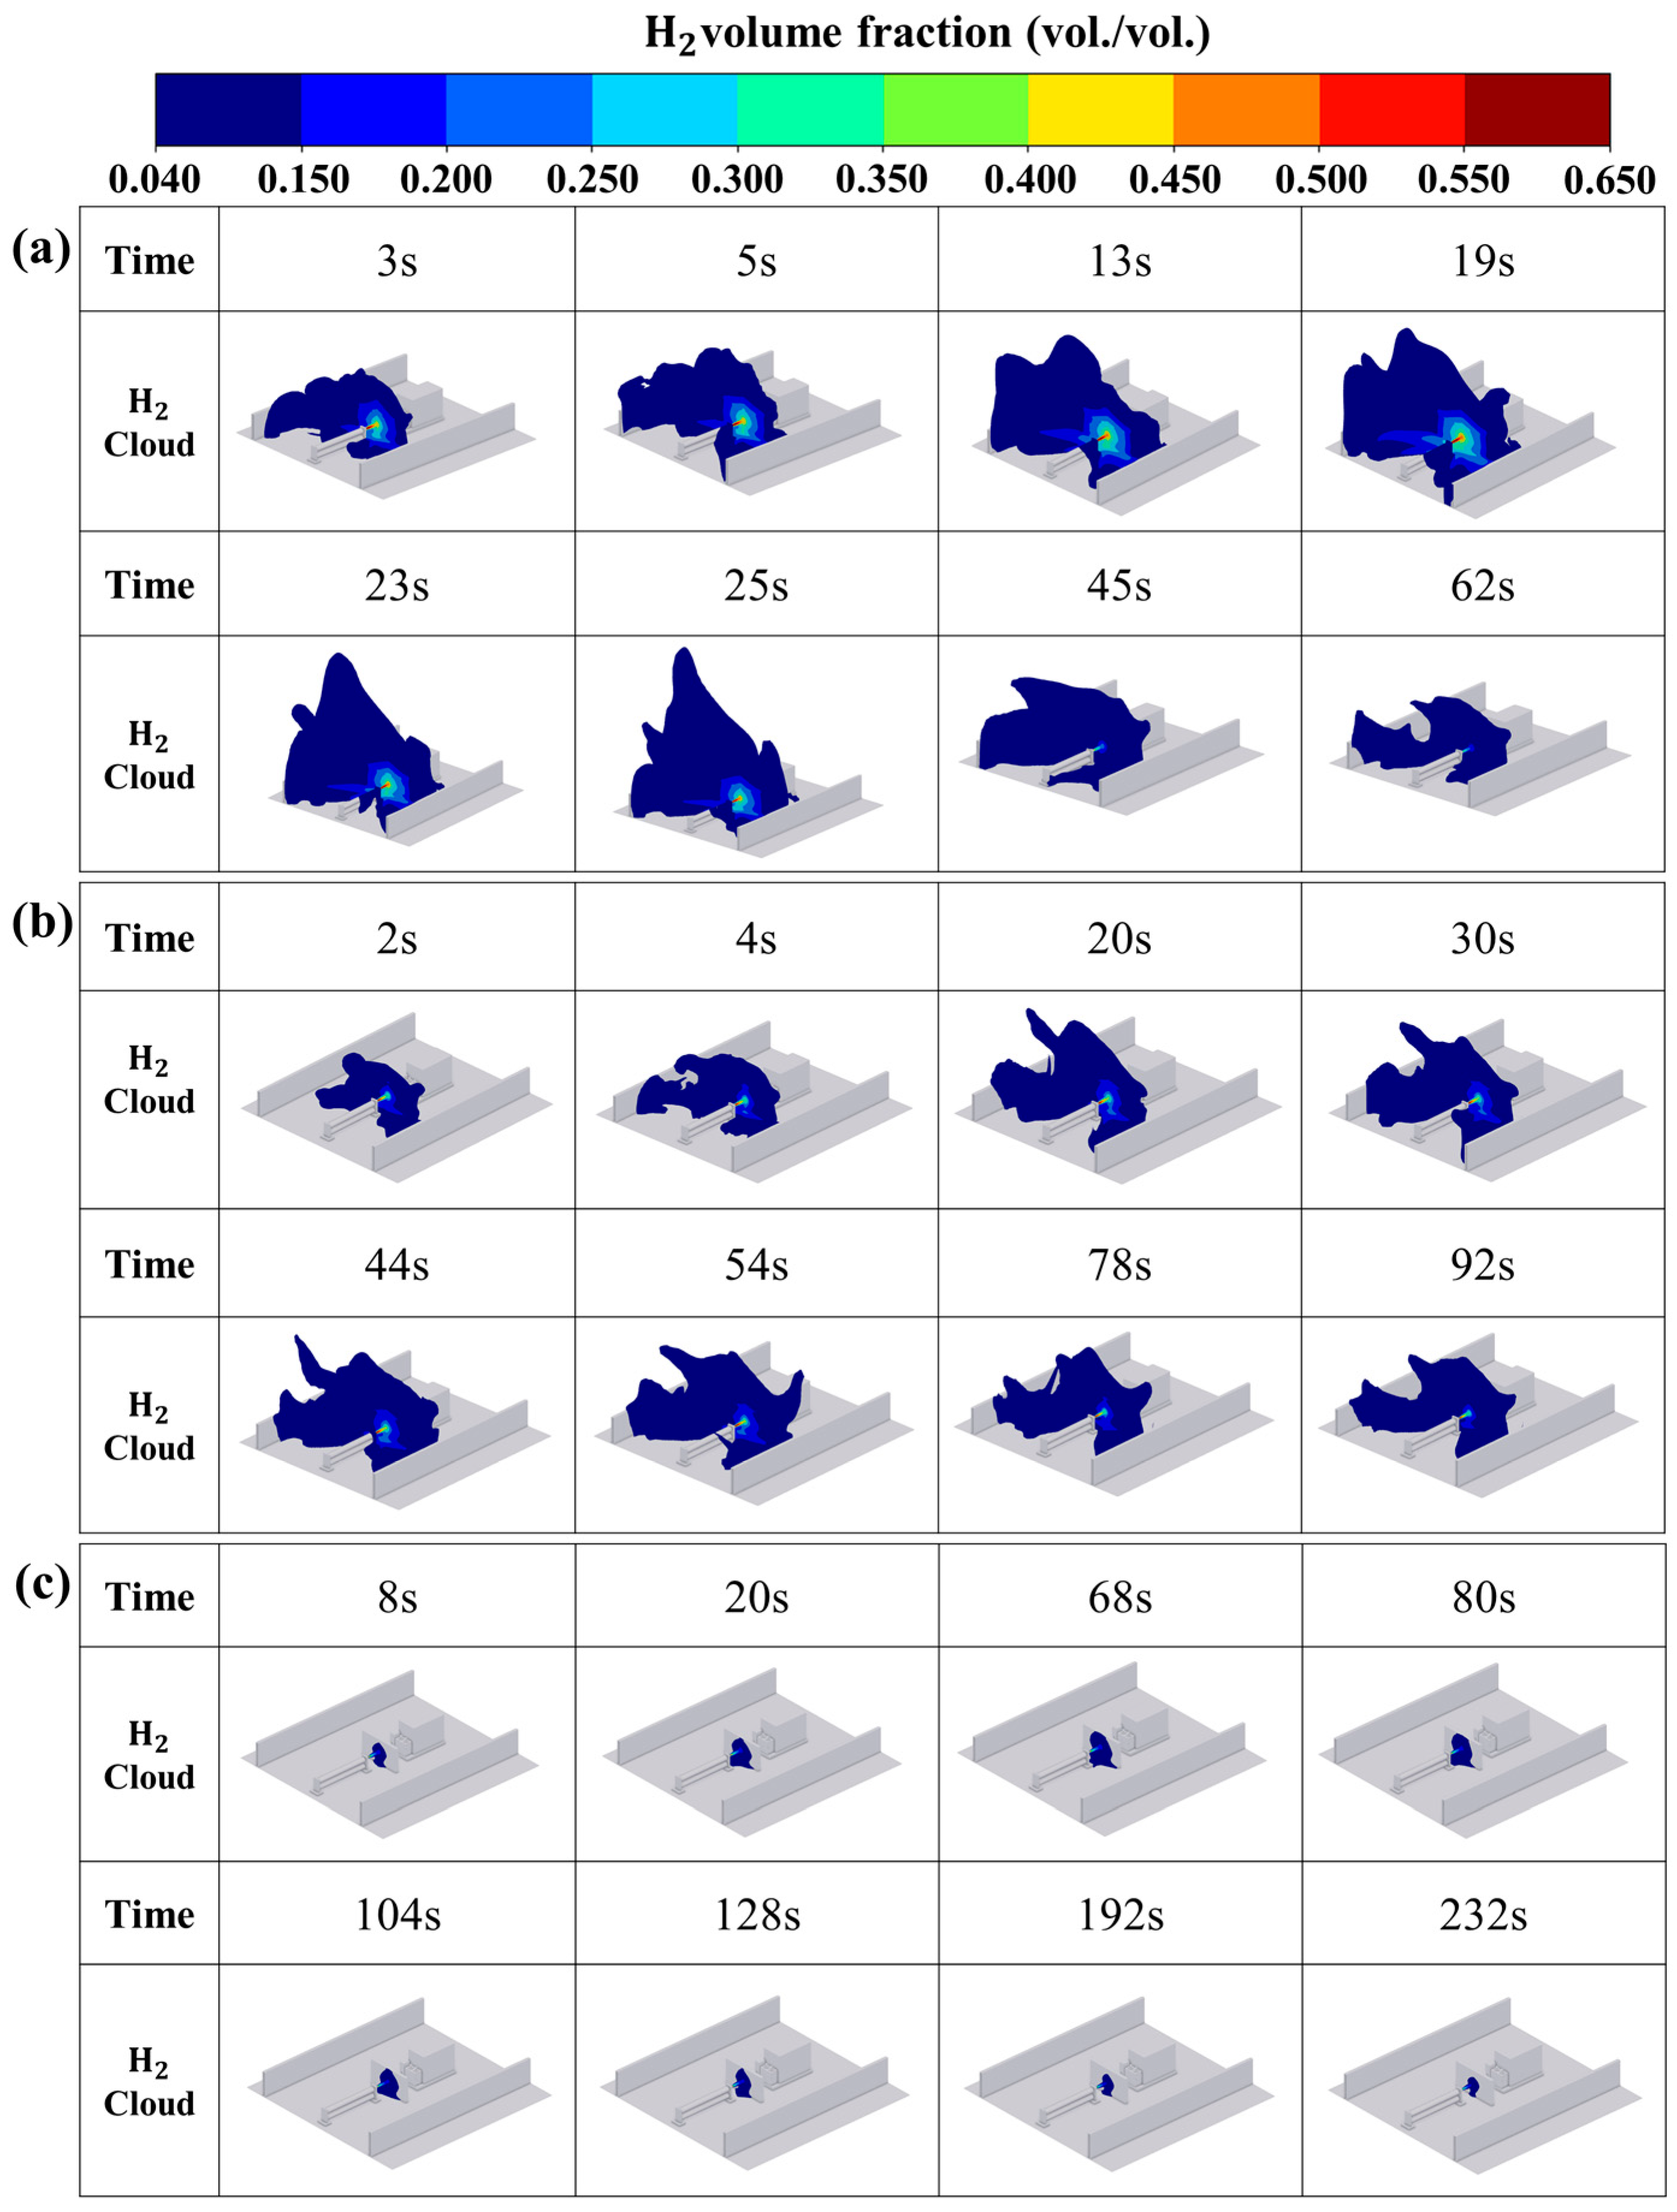
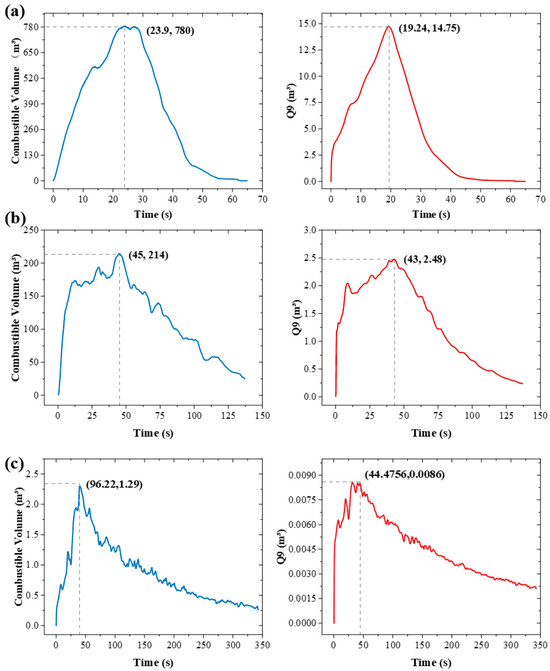
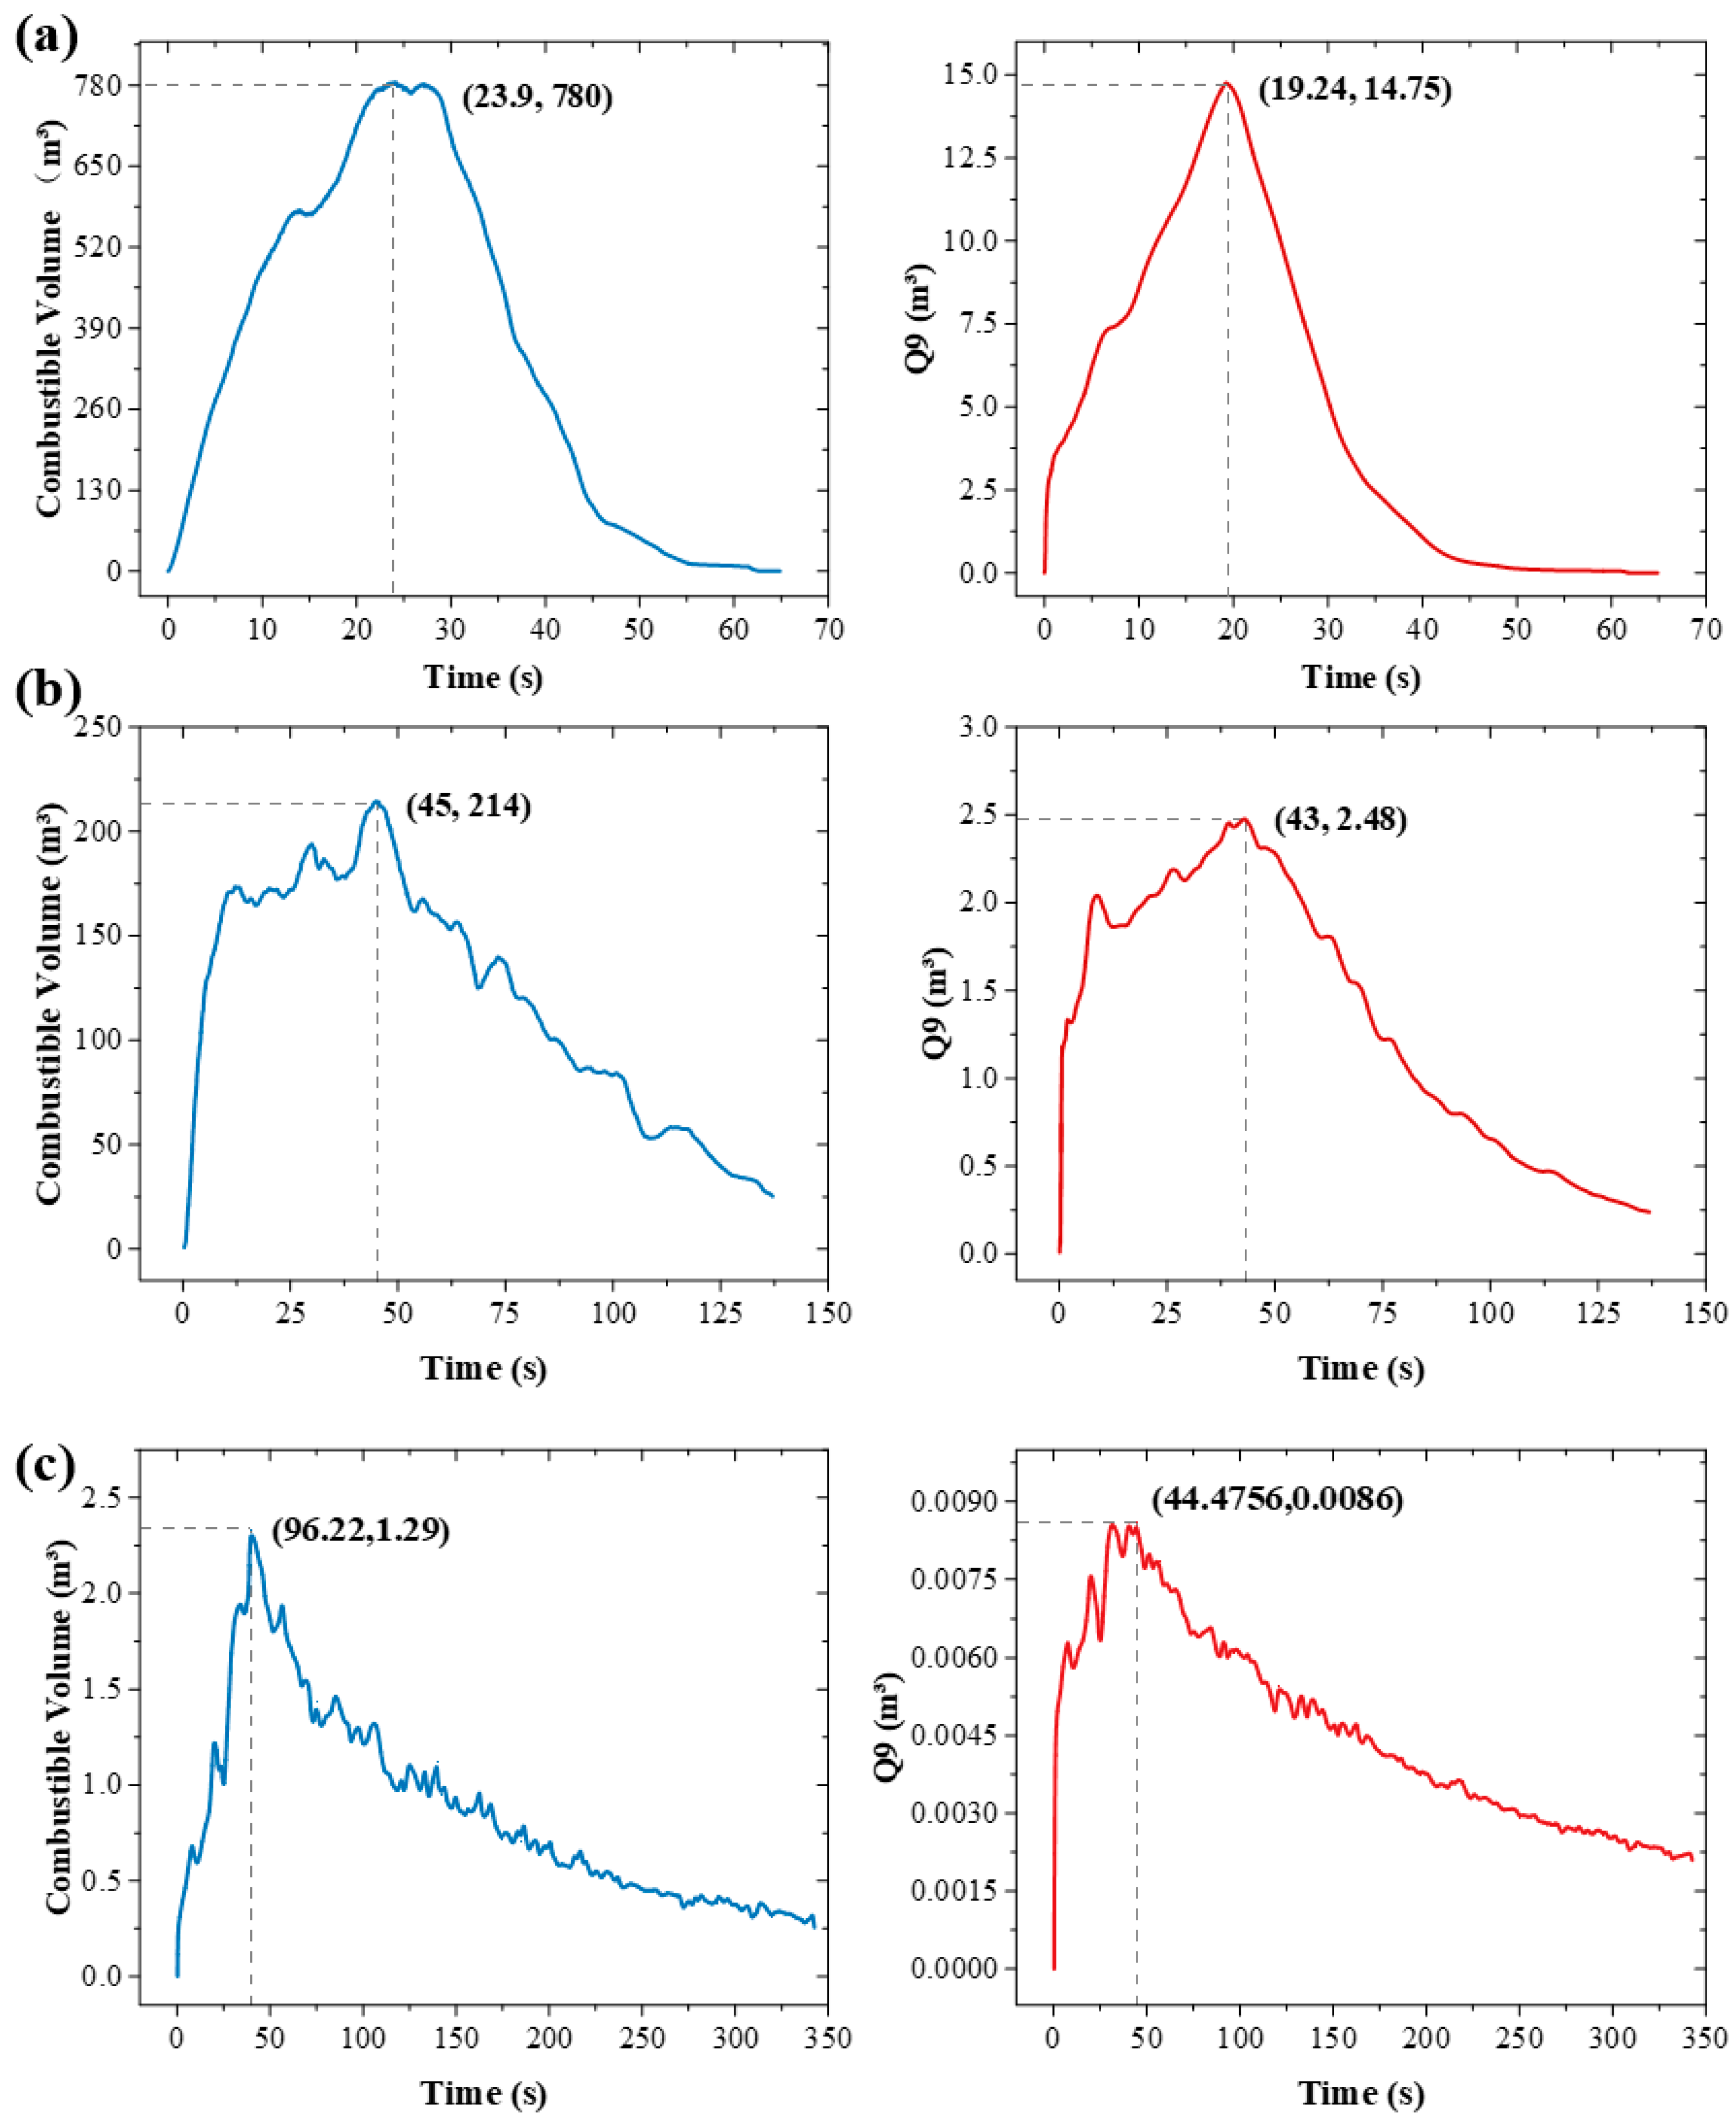
For the three leakage diameters, hydrogen cloud distributions were extracted at eight representative time instants, as shown in Figure 9. The corresponding combustible volume and Q9 evolution curves under the three leakage scenarios are presented in Figure 10.
Figure 9.
Diffusion of hydrogen in storage tanks: (a) large-scale; (b) medium-scale; (c) small-scale.
Figure 10.
Combustible volume and Q9 variation: (a) large-scale; (b) medium-scale; (c) small-scale.
At 3 s, hydrogen had already dispersed along both side walls and spread into the surrounding area. Due to the impingement of the hydrogen jet on the blast wall, the dispersion direction deviated from the initial jet direction and propagated in the opposite direction along the wall corners. At 5 s, buoyancy effects became significant, causing the hydrogen cloud to rise upward. The maximum dispersion height occurred directly above the storage vessel, while hydrogen simultaneously spread upward along both side walls. At 23 s, the combustible hydrogen cloud volume and Q9 reached their peak values, indicating that the hydrogen concentration within the flammable range of 4–75% vol. occupied its maximum spatial extent.
Subsequently, as hydrogen continued to leak, the pressure inside the storage vessel gradually decreased. As a result, the diameter of the jet impinging on the blast wall became smaller, and the region with hydrogen concentrations exceeding 34% vol. progressively shrank. Meanwhile, dilution by ambient air reduced the combustible hydrogen volume. By 45 s, the maximum hydrogen concentration within the jet had decreased to below 28% vol. At 62 s, the jet became very weak, and the region with hydrogen concentrations above the lower flammability limit was confined mainly to the vicinity of the blast wall and side walls. By 64 s, the leakage process had essentially ceased, with the remaining hydrogen primarily accumulating near the leakage source and the blast wall.
For the medium-scale leakage scenario with a leakage diameter of 0.0063 m, the hydrogen dispersion range was smaller than that in the large-scale leakage scenario, mainly reflected by the decreases in the maximum combustible volume and the equivalent stoichiometric cloud volume, Q9, as shown in Figure 10. The maximum combustible hydrogen volume reached 780 m3 under large-scale leakage, whereas it was only 214 m3 under medium-scale leakage. In terms of the Q9 indicator, the maximum Q9 value for large-scale leakage approached 15 m3, while that for the 0.0063 m leakage case was 2.48 m3, less than one-fifth of the large-scale leakage value. Therefore, the maximum hazard of medium-scale leakage is generally lower than that of large-scale leakage. However, its longer leakage duration results in a longer time window with potential fire and explosion risks.
The overall hydrogen dispersion trend was similar to that of large-scale leakage. In both cases, the initial hydrogen jet impinged on the blast wall and then spread along the wall in all directions. Hydrogen accumulation could be observed near the wall corners and above the blast wall. The combustible hydrogen volume and Q9 increased continuously until the combustible volume reached a peak of 215 m3 and Q9 reached 2.5 m3 at 44 s. Subsequently, owing to the low density and high diffusivity of hydrogen, both the combustible volume and Q9 gradually decreased, indicating an improvement in the overall safety of the scenario. After 78 s, both the jet diameter and hydrogen volume fraction decreased rapidly. After 92 s, the hydrogen dispersion height also decreased to approximately the height of the blast wall. Hydrogen near the side walls remained mainly around the leakage source, while the hydrogen volume fraction far from the leakage source fell below the lower flammability limit of 0.04 volume fraction.
The temporal evolution of hydrogen dispersion under small-scale leakage is shown in Figure 9c. During the leakage process, the hydrogen dispersion range was relatively limited. Compared with large-scale and medium-scale leakage, the hydrogen cloud in the small-scale leakage scenario remained mainly within the area covered by the blast wall. The maximum vertical dispersion height did not exceed the top of the blast wall, and the horizontal dispersion range did not extend beyond the side walls of the blast wall. This may be attributed to the small leakage diameter and the relatively low hydrogen volume fraction in the jet. In addition, because hydrogen disperses readily, the leaked hydrogen cannot accumulate substantially above the lower flammability limit of 4% vol. Compared with large-scale and medium-scale leakage, the variations in the maximum combustible hydrogen volume and Q9 were much smaller for small-scale leakage, as shown in Figure 10c. The maximum combustible volume of small-scale hydrogen leakage was only 2.34 m3, and the maximum equivalent stoichiometric cloud volume was 0.0086 m3, both of which were much lower than those of large-scale and medium-scale leakage.
During the leakage process, the maximum hydrogen volume fraction in the jet did not exceed 46% vol. Moreover, throughout the entire dispersion process, the combustible hydrogen volume remained below 2.5 m3, and the maximum Q9 value did not exceed 0.01 m3. Therefore, the overall hazard associated with hydrogen diffusion was the lowest under the small-scale leakage scenario.
3.2. Hydrogen Diffusion Analysis in Open Scenarios Under Natural Ventilation
The results in the previous section indicate that when hydrogen leaks from a storage tank in an open space, the hydrogen jet is released along the +Y direction. Under large-scale leakage conditions, the hydrogen cloud tends to accumulate near the blast wall and surrounding walls, leading to potential combustion and explosion risks. In addition, both the peak combustible hydrogen volume and the peak equivalent stoichiometric cloud volume are positively correlated with the leakage diameter. Since a blast wall has already been installed as a safety measure at the site, the following two sections focus on the large-scale leakage scenario to investigate the mitigation effects of natural ventilation and forced ventilation on hydrogen leakage and dispersion. This section mainly examines the influence of natural ventilation under different wind directions on hydrogen dispersion and dilution.
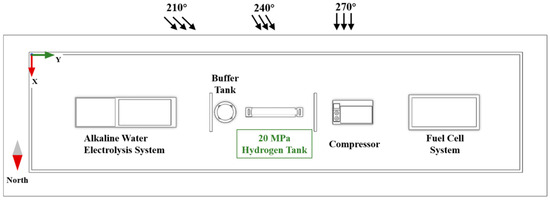
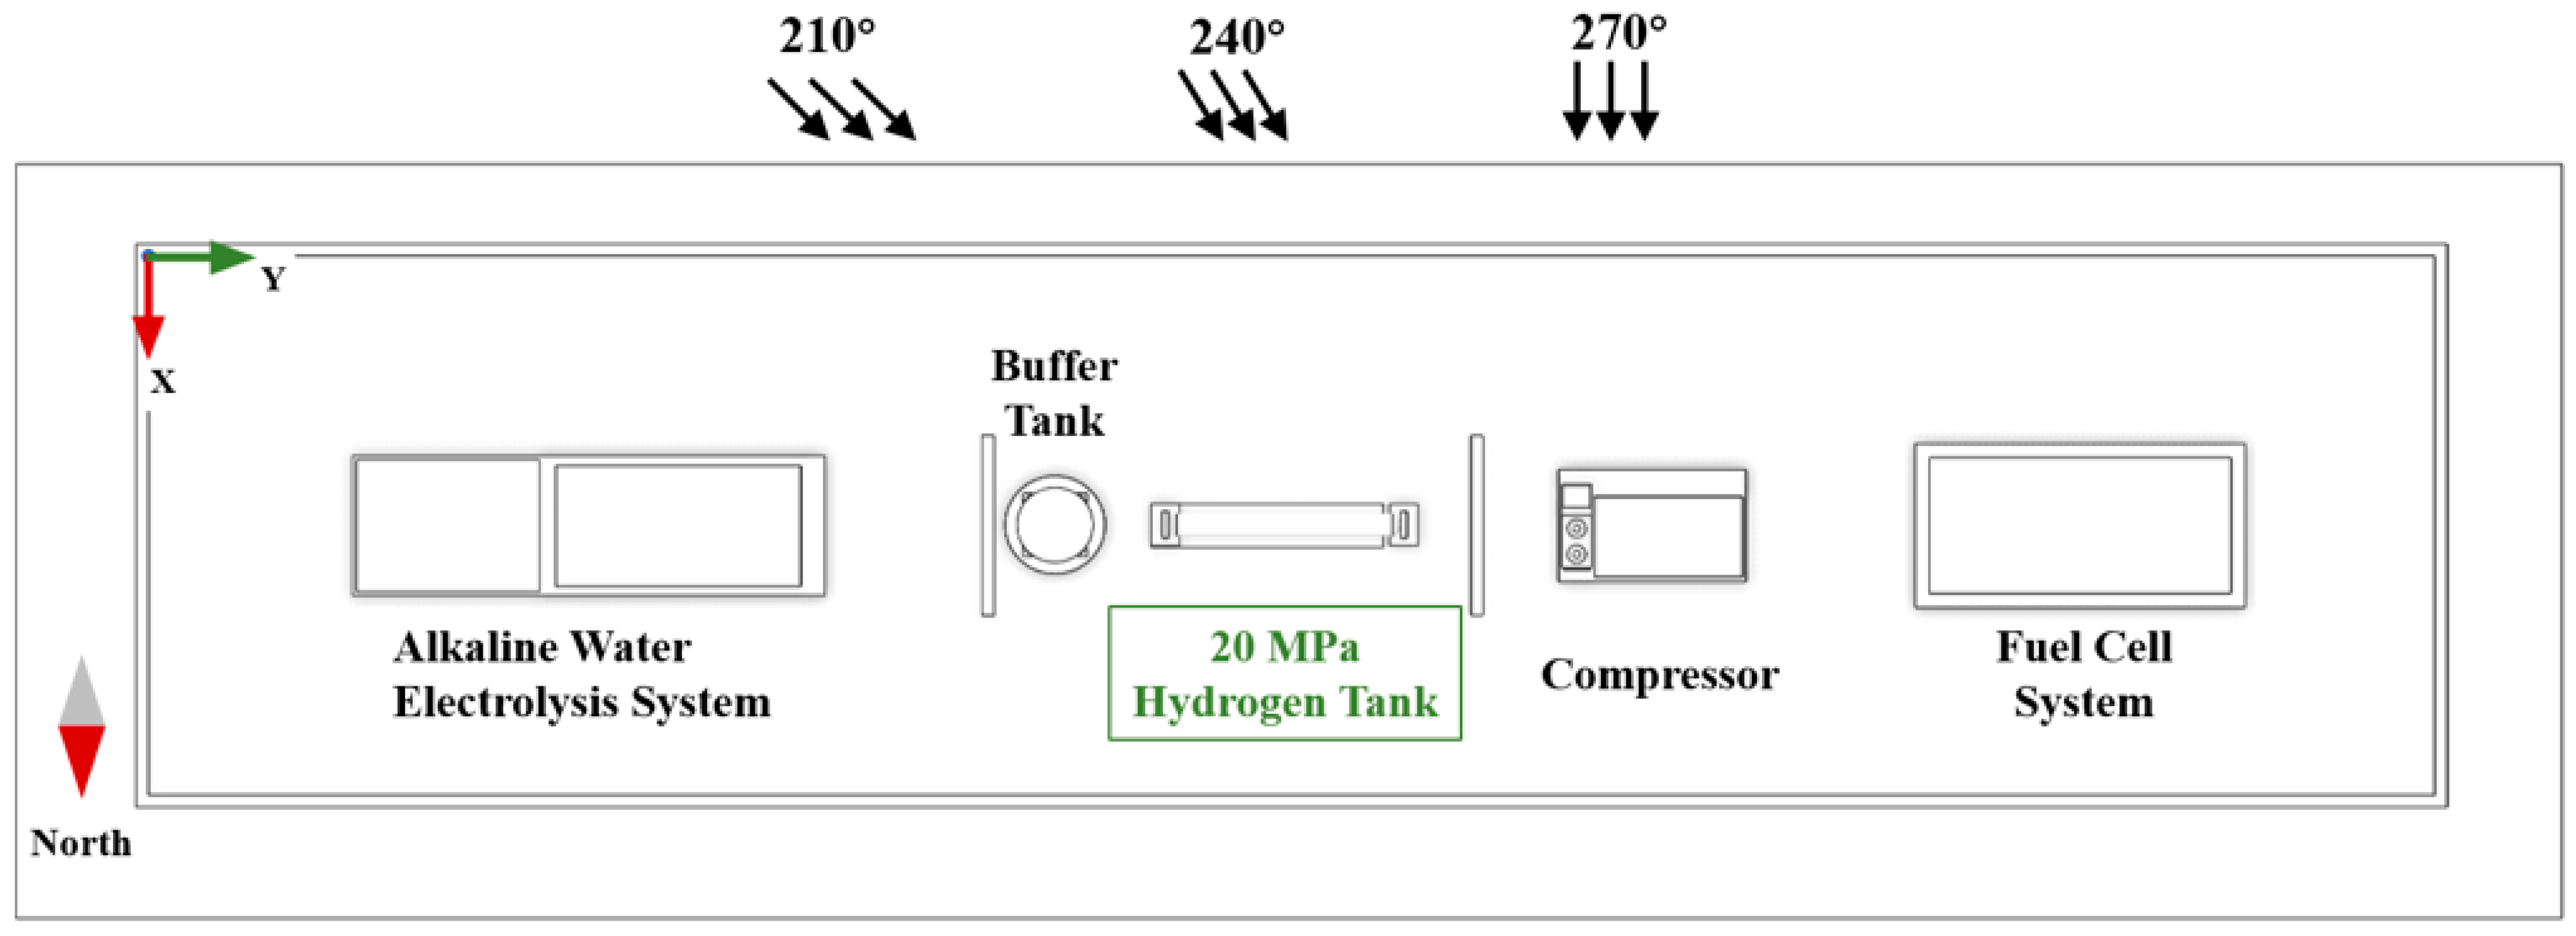
Based on an investigation of the wind field in Shandong, the annual average wind speed was found to be 2.6–3 m/s. Therefore, the median value of 2.8 m/s was selected as the natural wind speed. In addition, the prevailing annual wind directions in Shandong are mainly southerly and southeasterly winds. The schematic diagram of natural wind is shown in Figure 11. Taking the positive Y-axis of the coordinate system in the figure as the reference direction, different clockwise rotation angles were used to define the natural wind direction. Accordingly, three wind directions of 270°, 240°, and 210° were set, corresponding to southerly and southeasterly wind directions.
Figure 11.
Top view diagram of natural wind under different wind directions.
The simulation parameters of the wind can be obtained, as shown in Table 1.
Table 1.
Operating conditions of natural wind.
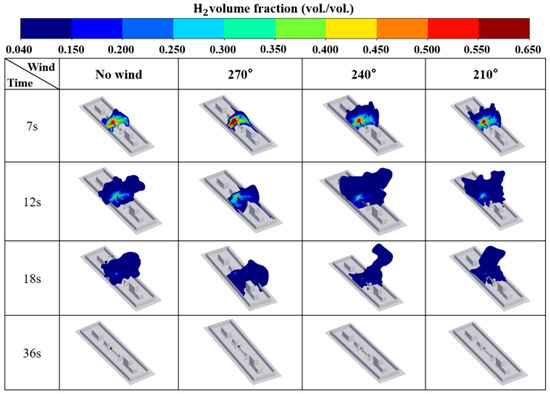
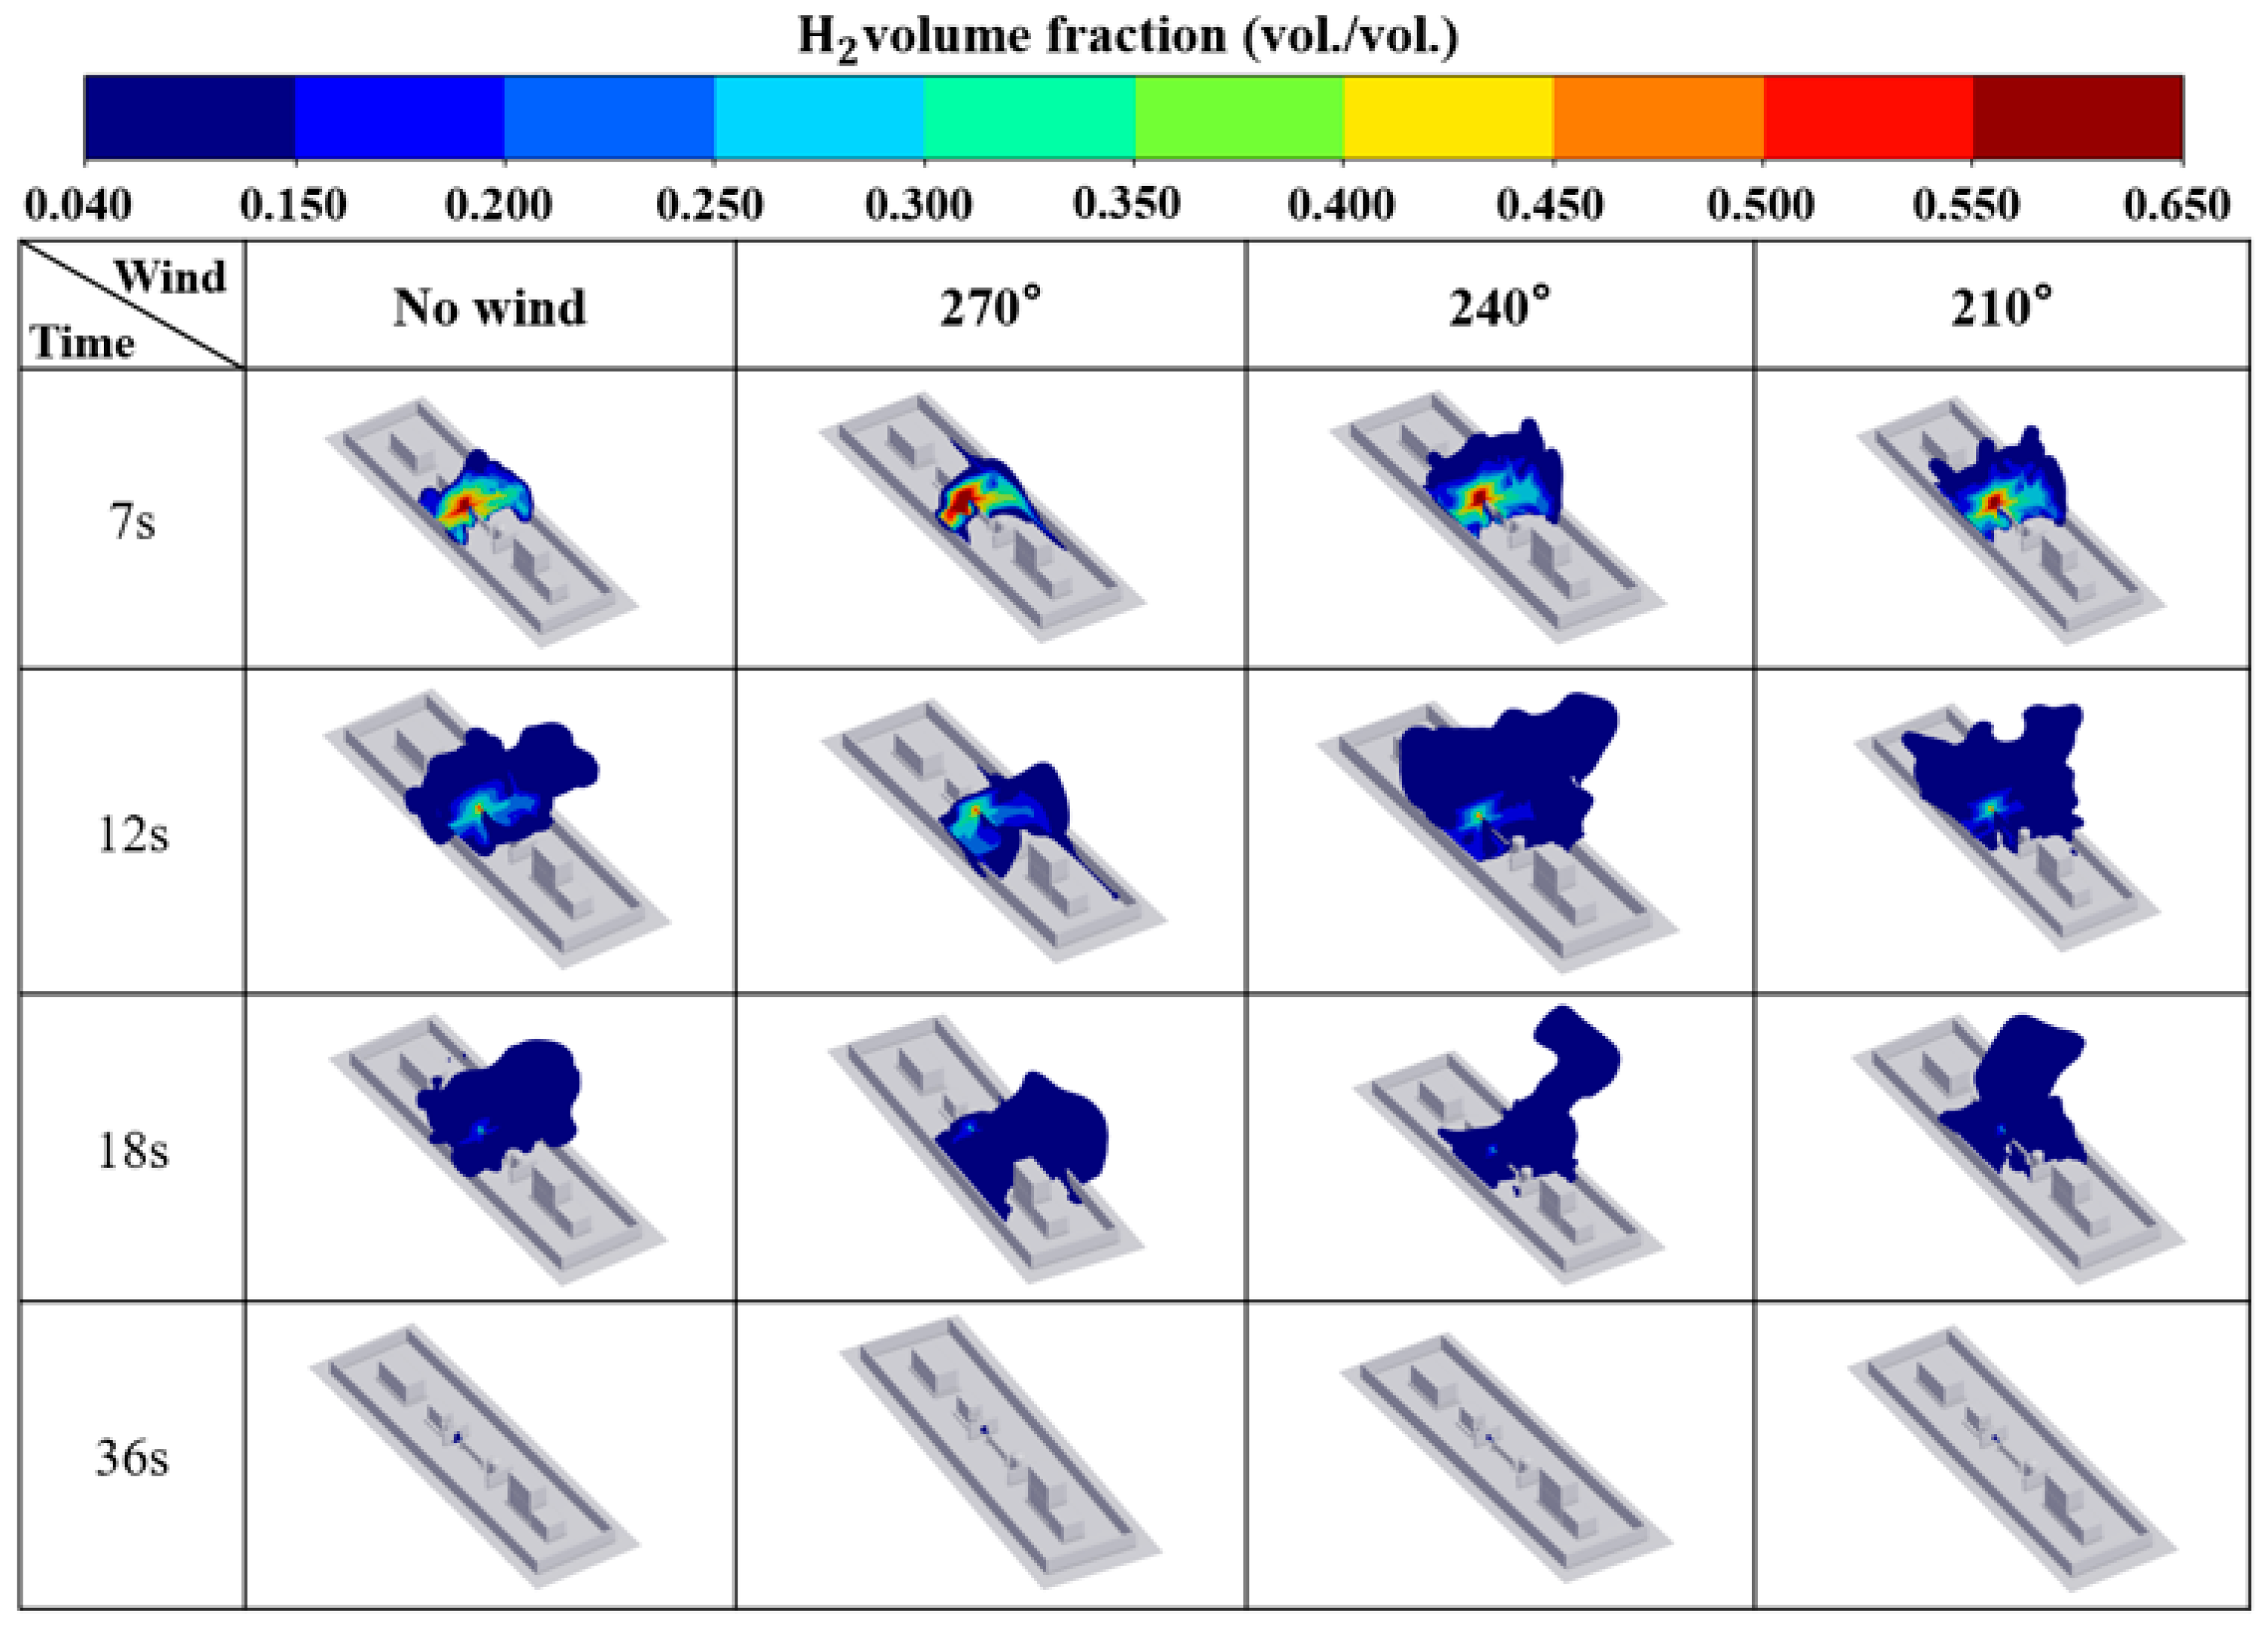
The hydrogen cloud distributions are shown in Figure 12. From a qualitative perspective, in the absence of natural wind, hydrogen leakage remains relatively stable. Driven by its initial momentum, the hydrogen jet impinges on the blast wall and then rises uniformly under the effect of buoyancy. Under natural wind conditions with different wind directions, the hydrogen cloud shows a tendency to drift along the wind direction during dispersion. When the wind direction was 270°, hydrogen exhibited an obvious tendency to disperse outside the surrounding wall during the period from 16 to 26 s. Similarly, under wind directions of 240° and 210°, hydrogen tended to disperse toward the rear side of the blast wall. In addition, natural wind can reduce the hydrogen volume fraction at different time instants. At 36 s, under the 240° and 210° wind directions, the region with hydrogen concentrations above the lower flammability limit was significantly reduced, and the hydrogen volume fraction range was the smallest under the 210° natural wind condition.
Figure 12.
Comparison of the hydrogen cloud under different natural wind directions.
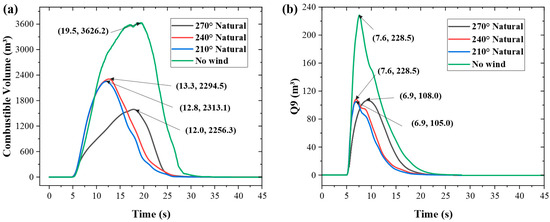
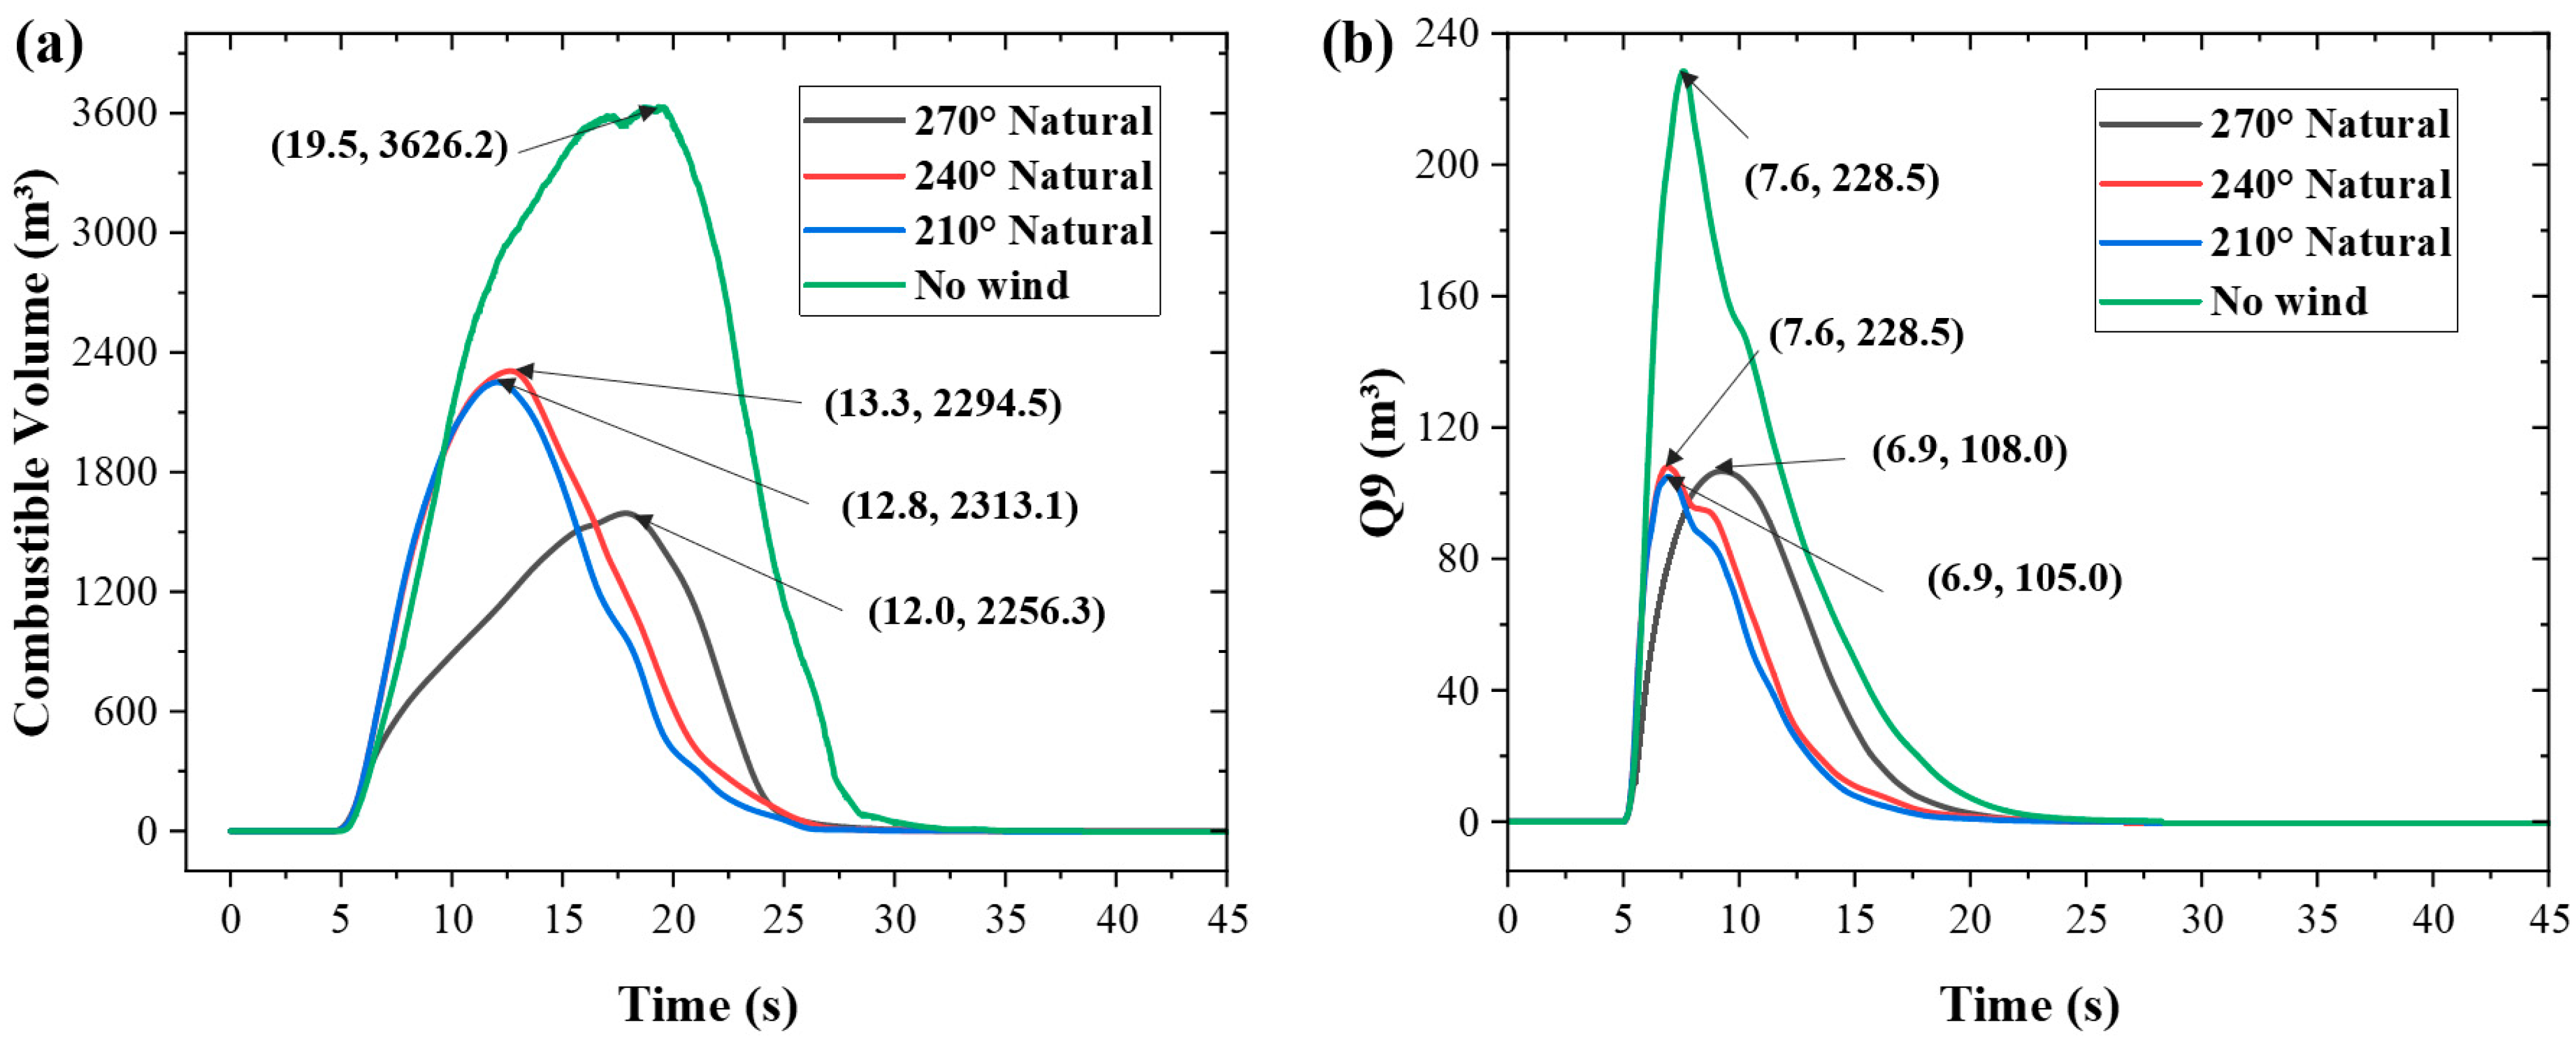
From a quantitative perspective, under windless conditions, the peak combustible hydrogen volume in the open-space scenario can reach 3652 m3. Under natural wind conditions, the peak combustible volume was less than 2320 m3 in all cases, with a maximum reduction of 56%. A comparison among different wind directions showed that the peak combustible volume was generally similar, indicating that wind speed is the primary factor determining the peak combustible volume.
However, the decay rate of the combustible volume varied with wind direction. Compared with the other wind directions, the combustible hydrogen cloud dissipated most slowly under the 270° wind direction, extending the complete dissipation time from 27 s under the 210° and 240° wind directions to approximately 33 s. This may be because the natural wind from the 270° direction first encounters the 2.2 m-high surrounding wall, causing part of its kinetic energy to be dissipated and thereby weakening its dilution effect on the combustible hydrogen cloud.
No leakage was introduced during the first 0–5 s of the simulation in order to allow the natural wind field to reach a stable state. After 40 s, the combustible hydrogen volume and Q9 showed no significant variation. Therefore, based on the temporal evolution of these two indicators, eight characteristic time instants within the period of 5–40 s were selected to obtain three-dimensional hydrogen cloud distributions. The comparison of hydrogen flammable cloud distributions with and without safety measures is shown in Figure 13.
Figure 13.
Comparison of changes under natural wind: (a) combustible volume; (b) Q9.
It can be observed that in the absence of natural wind, hydrogen leakage is relatively stable. Driven by its initial momentum, the hydrogen jet impinges on the blast wall and then rises uniformly under buoyancy. Under natural wind conditions with different wind directions, the hydrogen cloud tends to drift along the wind direction during dispersion. When the wind direction is 270°, hydrogen showed an obvious tendency to disperse outside the surrounding wall during 16–26 s. Similarly, under wind directions of 240° and 210°, hydrogen tended to disperse toward the rear side of the blast wall. In addition, natural wind can reduce the hydrogen volume fraction at different time instants. At 36 s, under the 240° and 210° wind directions, the region with hydrogen concentrations above the lower flammability limit was significantly reduced, and the hydrogen volume fraction range was the smallest under the 210° natural wind condition.
The temporal variation of Q9 was consistent with that of the combustible volume, showing a single-peak evolution pattern. However, Q9 was one order of magnitude lower than the combustible hydrogen volume. This is because the combustible hydrogen cloud refers to the hydrogen cloud within the concentration range of 4–75% vol., and the spatial coverage of the hydrogen cloud near the lower flammability limit of 4% vol. largely determines the peak combustible volume. In contrast, Q9 represents the equivalent hydrogen cloud volume at a hydrogen concentration of 30%. This portion of the hydrogen cloud was confined mainly to the semi-enclosed region formed by the leakage source and the surrounding walls, as shown in Figure 6, which limits further volume expansion.
The simulation results indicate that natural wind has a certain mitigation effect on Q9 during hydrogen leakage in open space. Among the investigated wind directions, 210° and 240° provided relatively better mitigation, reducing the peak Q9 from 228.5 m3 to 108 m3, corresponding to a reduction of 53%. In comparison, the mitigation effect of the 270° wind direction was weaker, although it still provided a certain protective effect by reducing the peak Q9 to approximately 138.5 m3. This is because for natural ventilation, oblique winds corresponding to the 210° and 240° directions increase the contact area between the wind field and the combustible hydrogen cloud compared with the southerly wind direction of 270°, thereby improving the dilution efficiency of the combustible hydrogen cloud.
3.3. Analysis of Hierarchical Early-Warning and Protective Measures Based on Mechanical Ventilation
Based on the leakage and dispersion characteristics obtained from the CFD simulations, this section further evaluates a hierarchical safety strategy for the hydrogen storage area. Unlike a single ventilation scenario, the proposed strategy links local hydrogen concentration monitoring with graded protective actions. The sensor network is used to identify the time at which the hydrogen concentration reaches the predefined safety thresholds, after which mechanical ventilation and emergency shutdown are activated sequentially. Therefore, the following analysis focuses not only on the dispersion consequence itself, but also on the response process and mitigation efficiency of the integrated safety framework.
3.3.1. Hydrogen Concentration Monitoring Using a Hydrogen Sensor Network
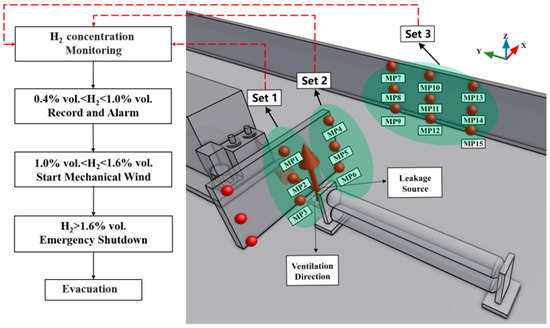
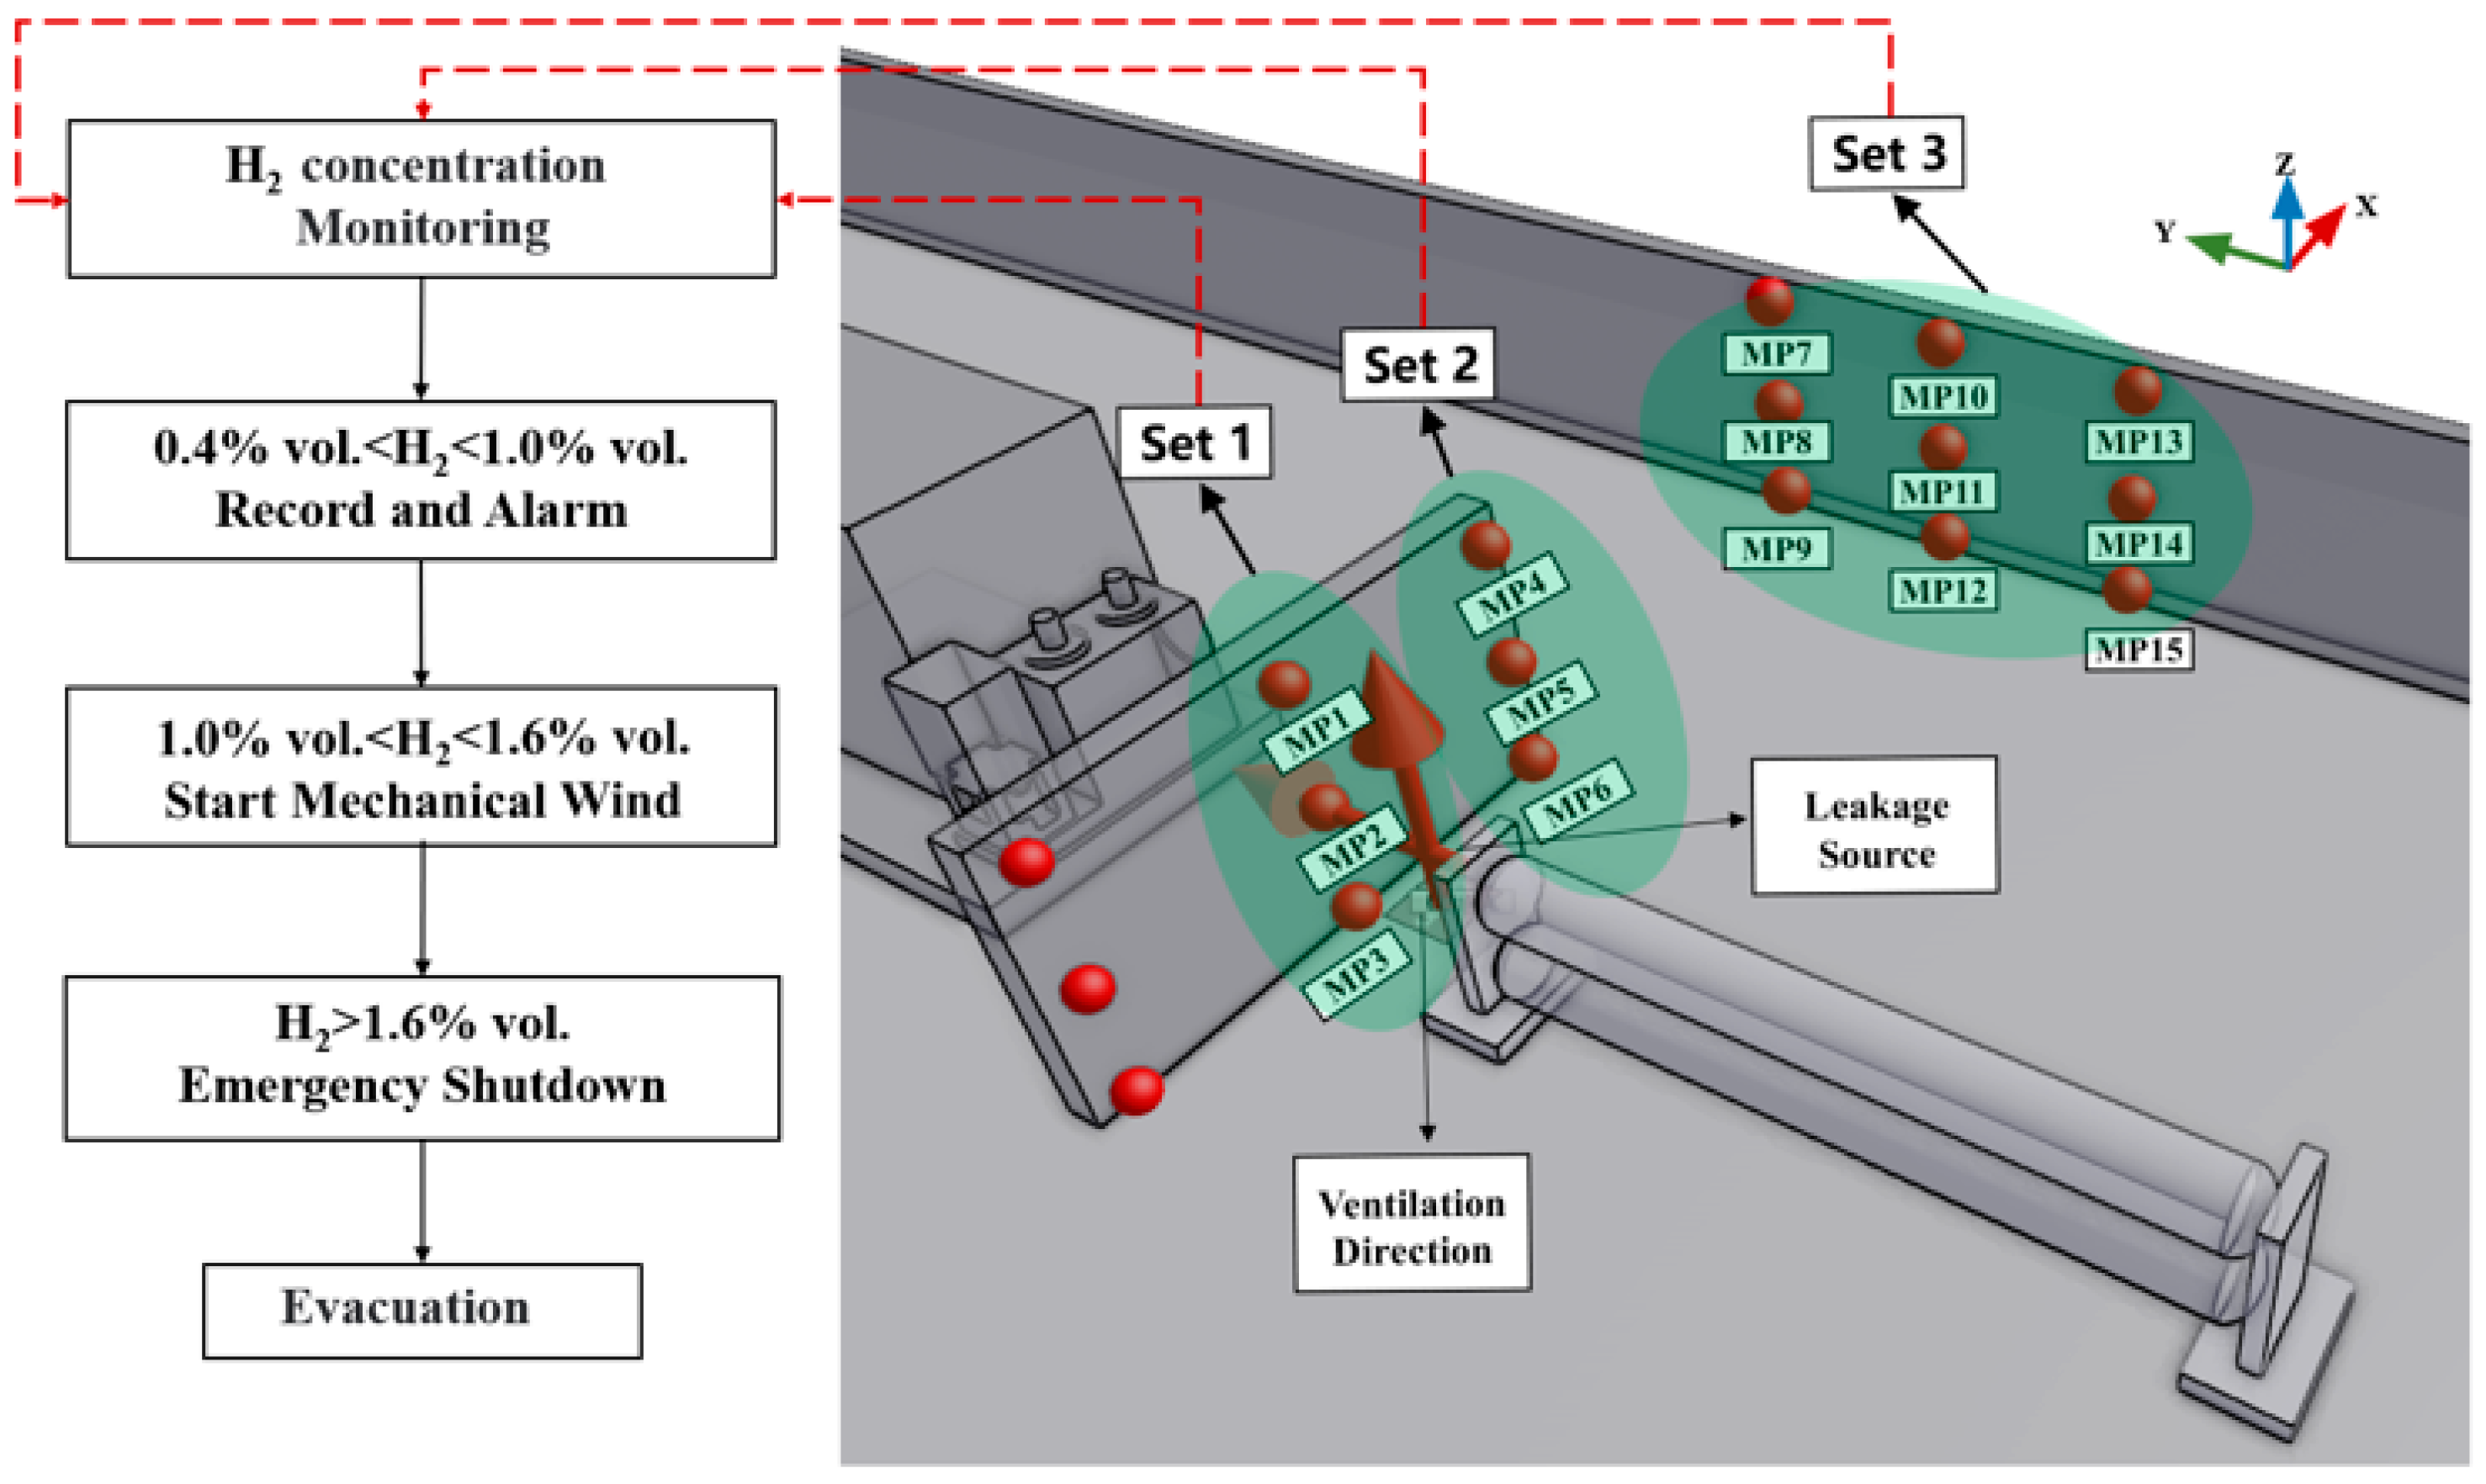
For the open space in the hydrogen storage area, an active safety hierarchical response strategy based on hydrogen concentration monitoring was developed. The overall operation process is shown in Figure 14. Hydrogen concentration is monitored using a sensor matrix. When the hydrogen concentration reaches 10–25% of the lower flammability limit (LFL), a concentration alarm is triggered and recorded. When the hydrogen concentration exceeds 25% of the LFL, mechanical ventilation is activated to mitigate the accumulation of the flammable hydrogen cloud. If the hydrogen concentration continues to increase and reaches 40% of the LFL, the hydrogen relief valve is shut off immediately, and relevant personnel are evacuated.
Figure 14.
Active safety hierarchical response strategy for the open space in the hydrogen storage area.
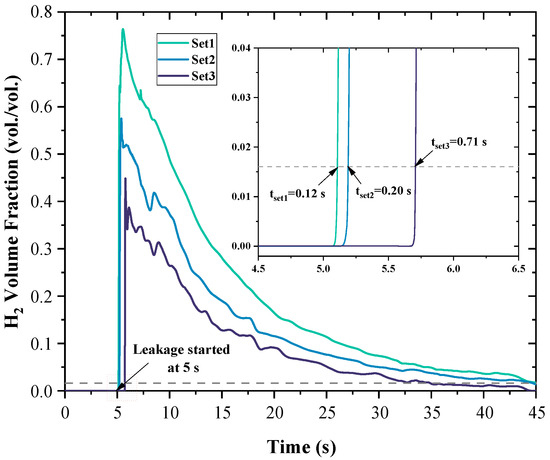
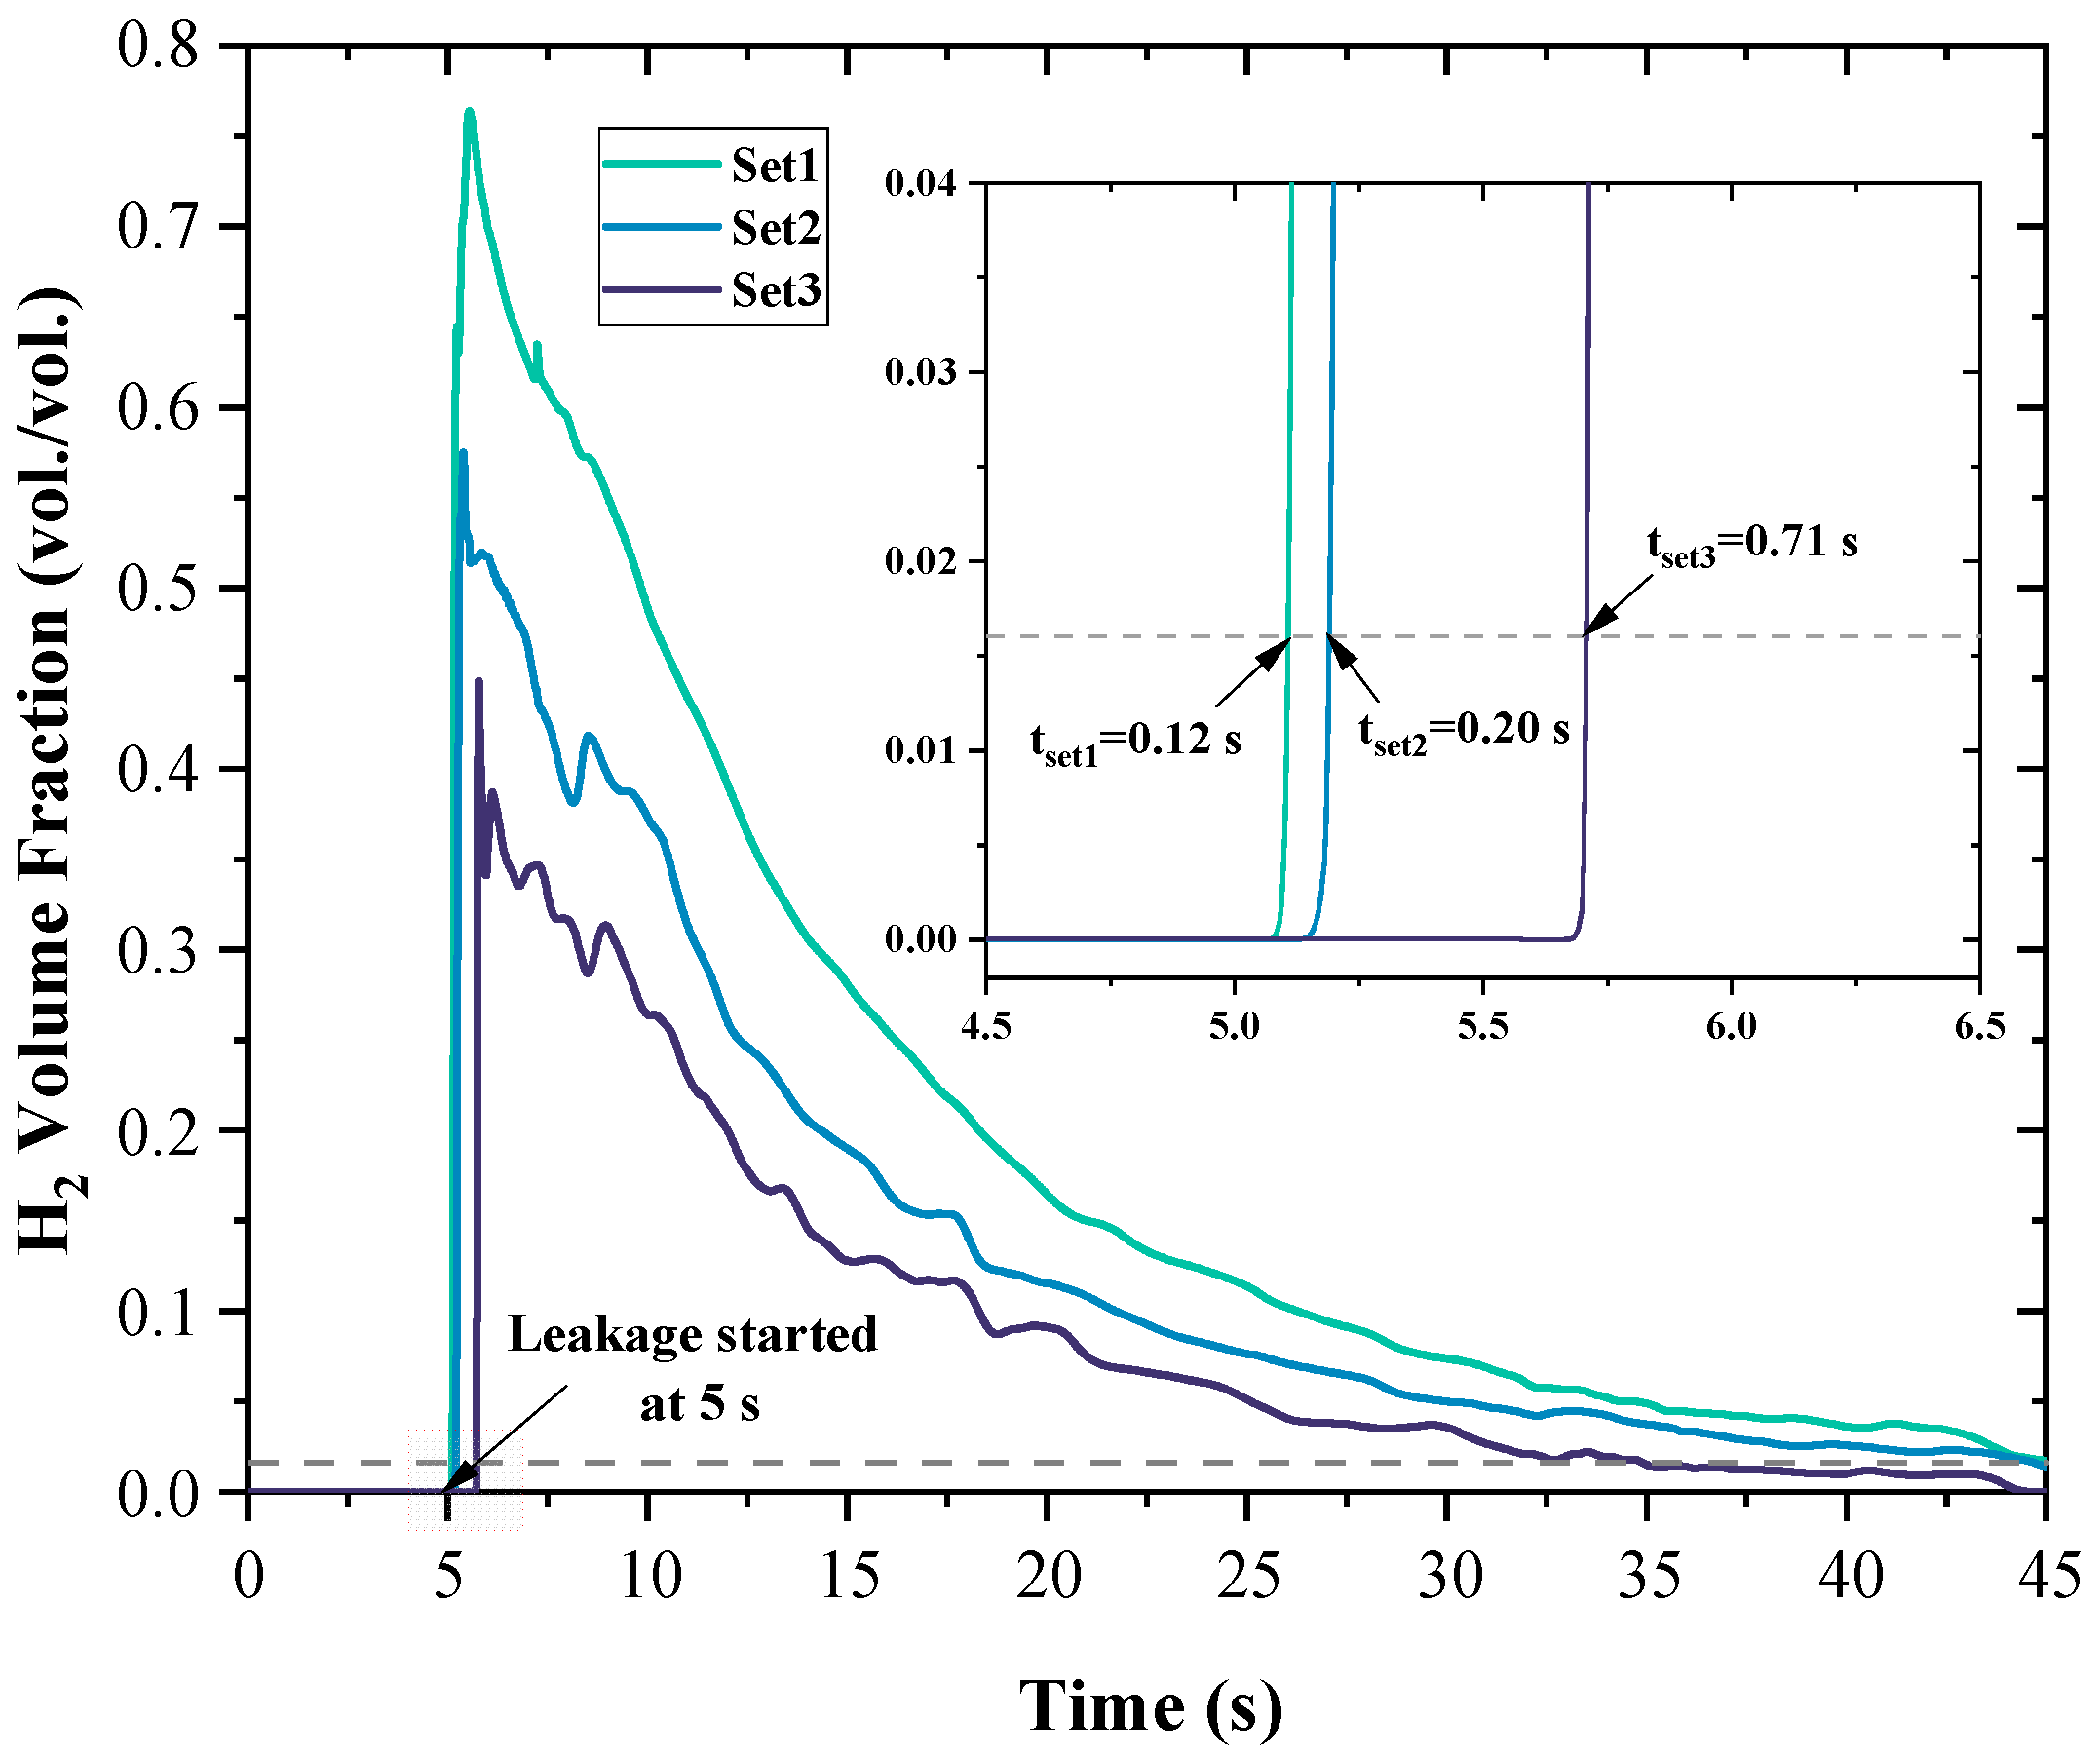
Figure 15 shows the temporal variation in the average hydrogen volume fraction measured by hydrogen concentration sensor groups, namely Set1, Set2, and Set3, located in different regions. Overall, the hydrogen concentration evolution trends in the three monitoring regions were generally consistent. After leakage occurred, the hydrogen concentration increased rapidly to a peak and then gradually decreased with time. However, the peak concentration decreased as the monitoring location moved farther from the leakage source. Specifically, the Set1 region, which was closest to the leakage source, exhibited the highest average hydrogen concentration peak, approximately 76% vol. The Set2 region showed the second-highest peak, approximately 57.5% vol., while the Set3 region, located in the far field, had a relatively lower peak of approximately 44.8% vol.
Figure 15.
The variation relationship of the average hydrogen concentration of sensor groups at different positions over time.
Furthermore, the response characteristics of the average hydrogen concentration reaching the medium-level threshold of 1.0% vol. and the highest-level threshold of 1.6% vol. were compared among different regions. Set1, Set2, and Set3 reached these thresholds at approximately 0.12 s, 0.20 s, and 0.71 s, respectively. Taking the average of the three monitoring times obtained 0.34 s. Considering the sensor response time of 3 s, the approximate average time required for the sensors to detect the signal and respond is 3.34 s.
3.3.2. Analysis of Hydrogen Dispersion in an Open Space Scenario Under Mechanical Ventilation
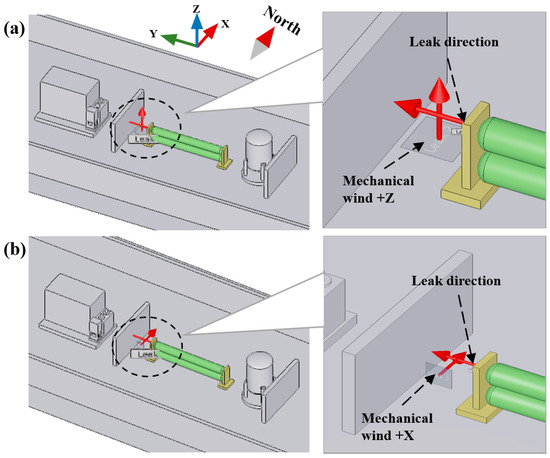
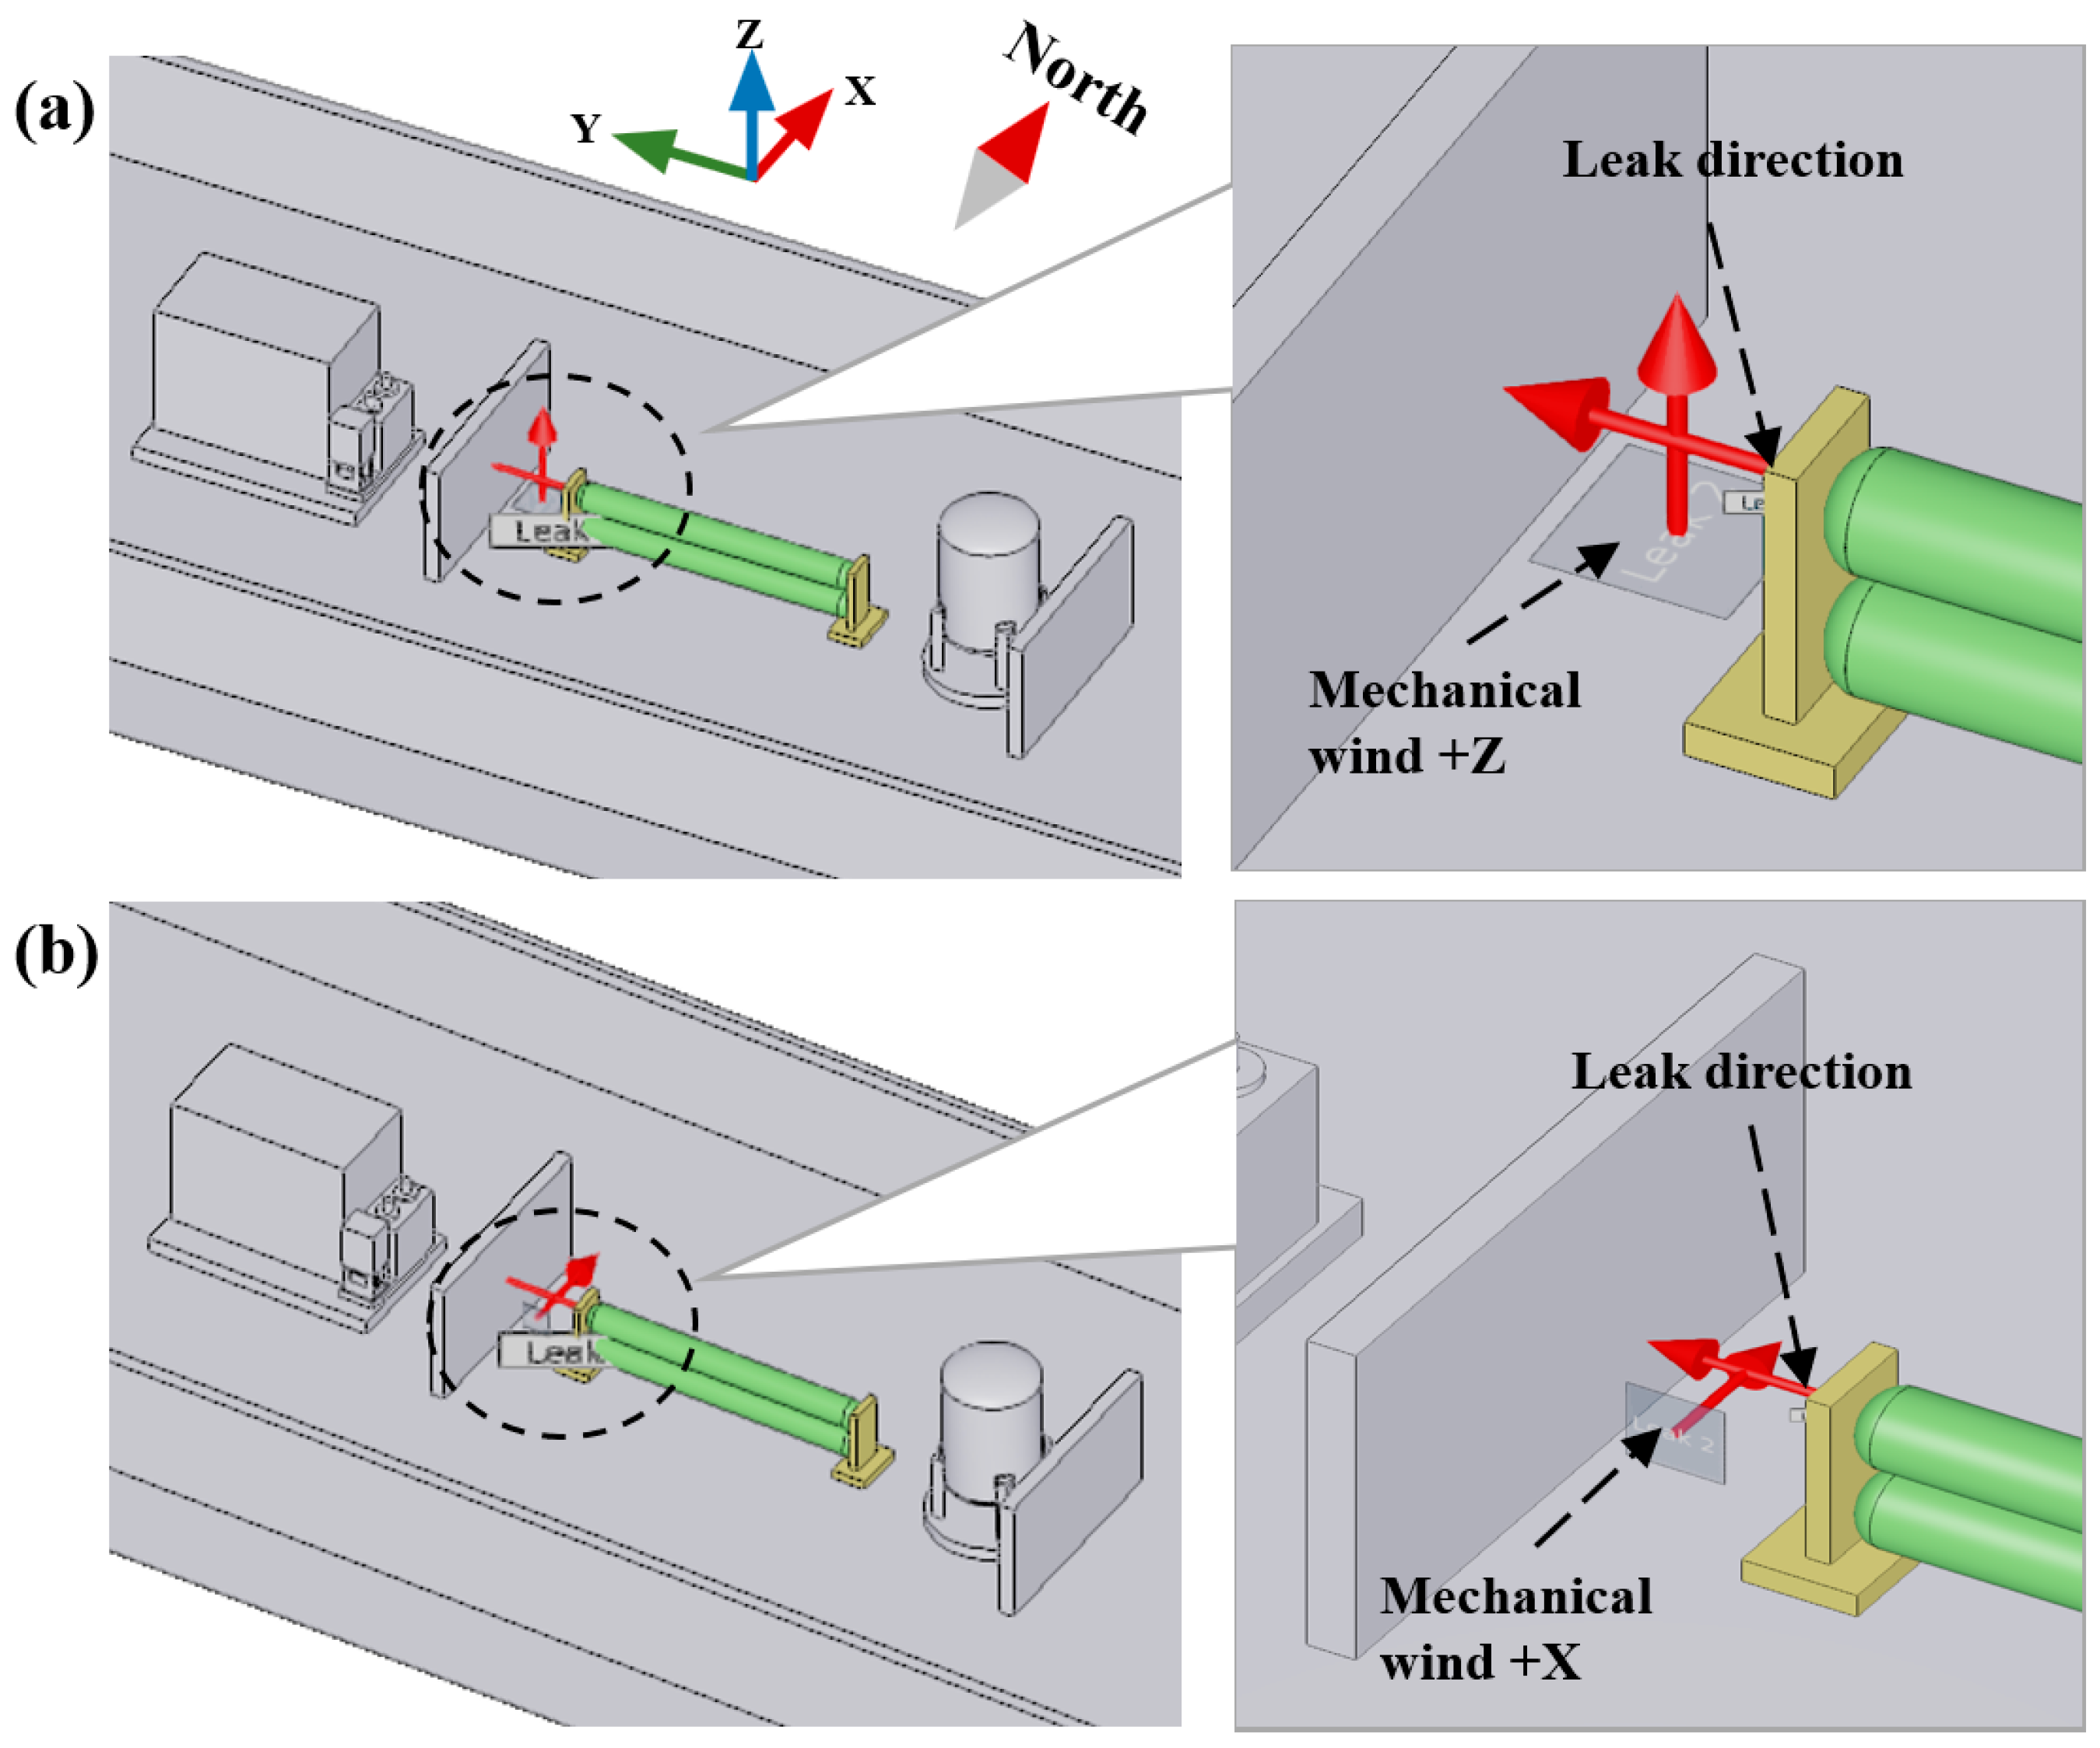
Considering that the times at which the average hydrogen concentrations measured by the sensor groups in the three regions reached the threshold were very close, their average value was taken as the activation time for mechanical ventilation. With the sensor response time included, mechanical ventilation was activated at 3.34 s after the onset of hydrogen leakage. The mitigation effects of mechanical ventilation in two different directions on the flammable hydrogen cloud generated by leakage from the hydrogen storage vessel were investigated. Two mechanical ventilation configurations were considered in this study, and their parameters are listed in Table 2. As shown in Figure 16, the two ventilation directions were set along the +X and +Z directions, respectively.
Table 2.
Operating conditions of mechanical ventilation.
Figure 16.
Schematic diagram of mechanical wind from different direction: (a) Direction +Z; (b) Direction +X.
Taking the ZF-050 model as an example, its rated flow rate ranges from 5700 to 11,500 m3/h, and the outlet area is 0.3 m2, corresponding to a wind speed range of 5.28–10.65 m/s. Therefore, gradient wind speeds of 6, 8, and 10 m/s within this range were selected in this study. Taking the leakage source as the coordinate origin, the centroid coordinates of the ventilation outlet were set as (−0.7 m, 0.15 m, −0.3 m).
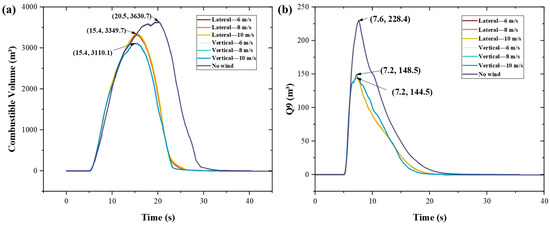
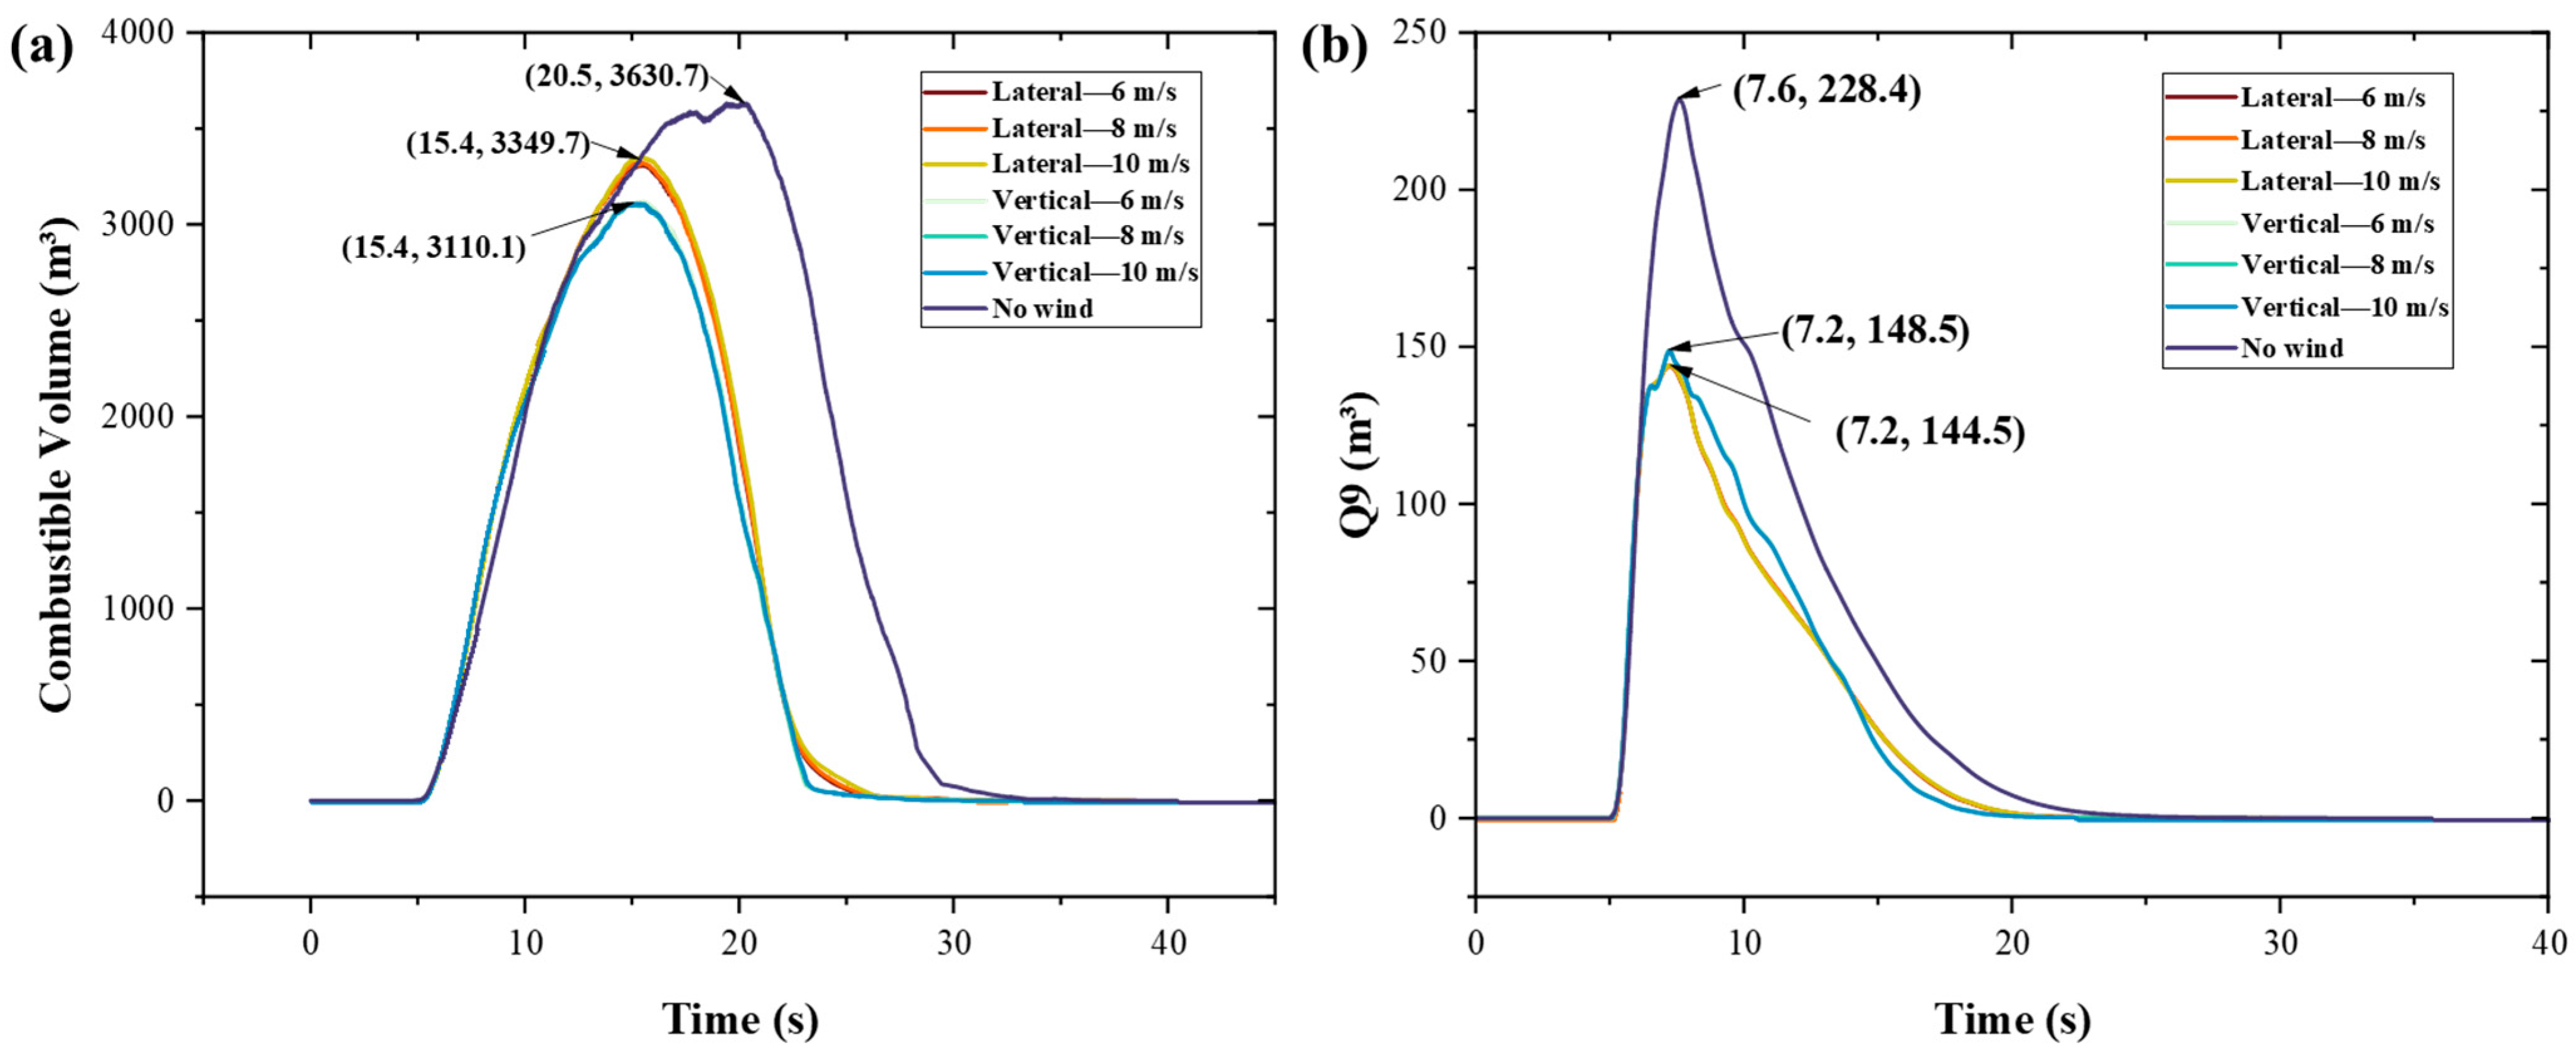
Figure 17 systematically presents the temporal evolution of the hydrogen cloud volume during the release process from the hydrogen storage vessel. Figure 17a shows the variation in the combustible hydrogen cloud volume, while Figure 17b presents the variation in the equivalent stoichiometric cloud volume, Q9. The results indicate that under windless conditions and different mechanical ventilation conditions, the hydrogen cloud volume increases rapidly, reaches a peak, and then gradually decreases. Under windless conditions, the peak combustible hydrogen cloud volume was the largest, reaching approximately 3630.7 m3. After mechanical ventilation was introduced, this peak value decreased significantly. Specifically, the peak combustible volume was approximately 3349.7 m3 under lateral ventilation in the +X direction, and further decreased to approximately 3110.1 m3 under vertical ventilation in the +Z direction. Correspondingly, the peak Q9 value was approximately 228.4 m3 under windless conditions and decreased markedly under mechanical ventilation, with similar peak Q9 values observed under lateral and vertical ventilation conditions.
Figure 17.
Evolution under different mechanical ventilation: (a) combustible volume; (b) Q9.
For the same ventilation direction, the volume evolution curves under different wind speeds largely overlapped, indicating that under mechanical ventilation conditions, the fan arrangement has a more significant influence on the hydrogen cloud volume than the wind speed. Further comparison shows that in the evolution of combustible volume shown in Figure 17a, the lateral airflow generated by a fan arranged on the side of the leakage source is more favorable for reducing the peak volume of the combustible hydrogen cloud than the vertical airflow generated by a fan arranged below the leakage source. This is mainly because lateral ventilation can more directly disrupt the leakage jet and its upward dispersion path, thereby accelerating the dilution and transport of hydrogen into the surrounding space. In contrast, for the equivalent stoichiometric cloud volume shown in Figure 17b, the difference in Q9 peak reduction under different ventilation directions was relatively small. This is because Q9 is based on the equivalent stoichiometric cloud model, which converts an actual hydrogen cloud with complex morphology and non-uniform concentration into a regular gas cloud with a uniform concentration. Its peak value is mainly controlled by the high-concentration region close to the stoichiometric ratio. Mechanical ventilation has limited capability to weaken such high-concentration regions and tends to have a greater influence on low-concentration regions near the lower flammability limit. Overall, Figure 17 reveals the mechanism by which mechanical ventilation controls hydrogen leakage risk and highlights the critical role of ventilation arrangement in reducing the risk associated with combustible hydrogen clouds.
From an engineering perspective, the proposed mechanical ventilation strategy is intended for emergency mitigation rather than continuous operation. Therefore, its energy consumption is mainly determined by the rated fan power, activation duration, and accident frequency. In the present scenarios, mechanical ventilation is activated only after the sensor threshold is reached, and the effective mitigation period is short. Thus, the additional energy consumption is expected to be limited compared with the normal operation of electrolysis and compression equipment. Nevertheless, practical implementation should further consider explosion proof fan selection, power supply reliability, maintenance cost, and coordination with the station control system. A detailed techno-economic optimization of the ventilation system was beyond the scope of this work and will be investigated in future studies.
3.3.3. Analysis of the Effect of Mechanical Ventilation on Hydrogen Dispersion After Emergency Shutdown
This section further investigates the dilution effect of adding emergency shutdown measures on the basis of lateral ventilation for combustible hydrogen clouds. The results show that lateral ventilation is more effective than vertical ventilation in diluting combustible hydrogen clouds. Therefore, when the hydrogen concentration reaches the threshold of 1.6% vol., a combined strategy of lateral ventilation and emergency shutdown is adopted to verify whether dual protective measures can further improve the dilution of combustible hydrogen clouds.
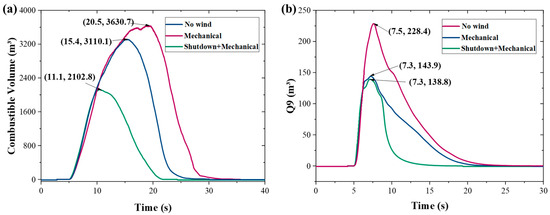
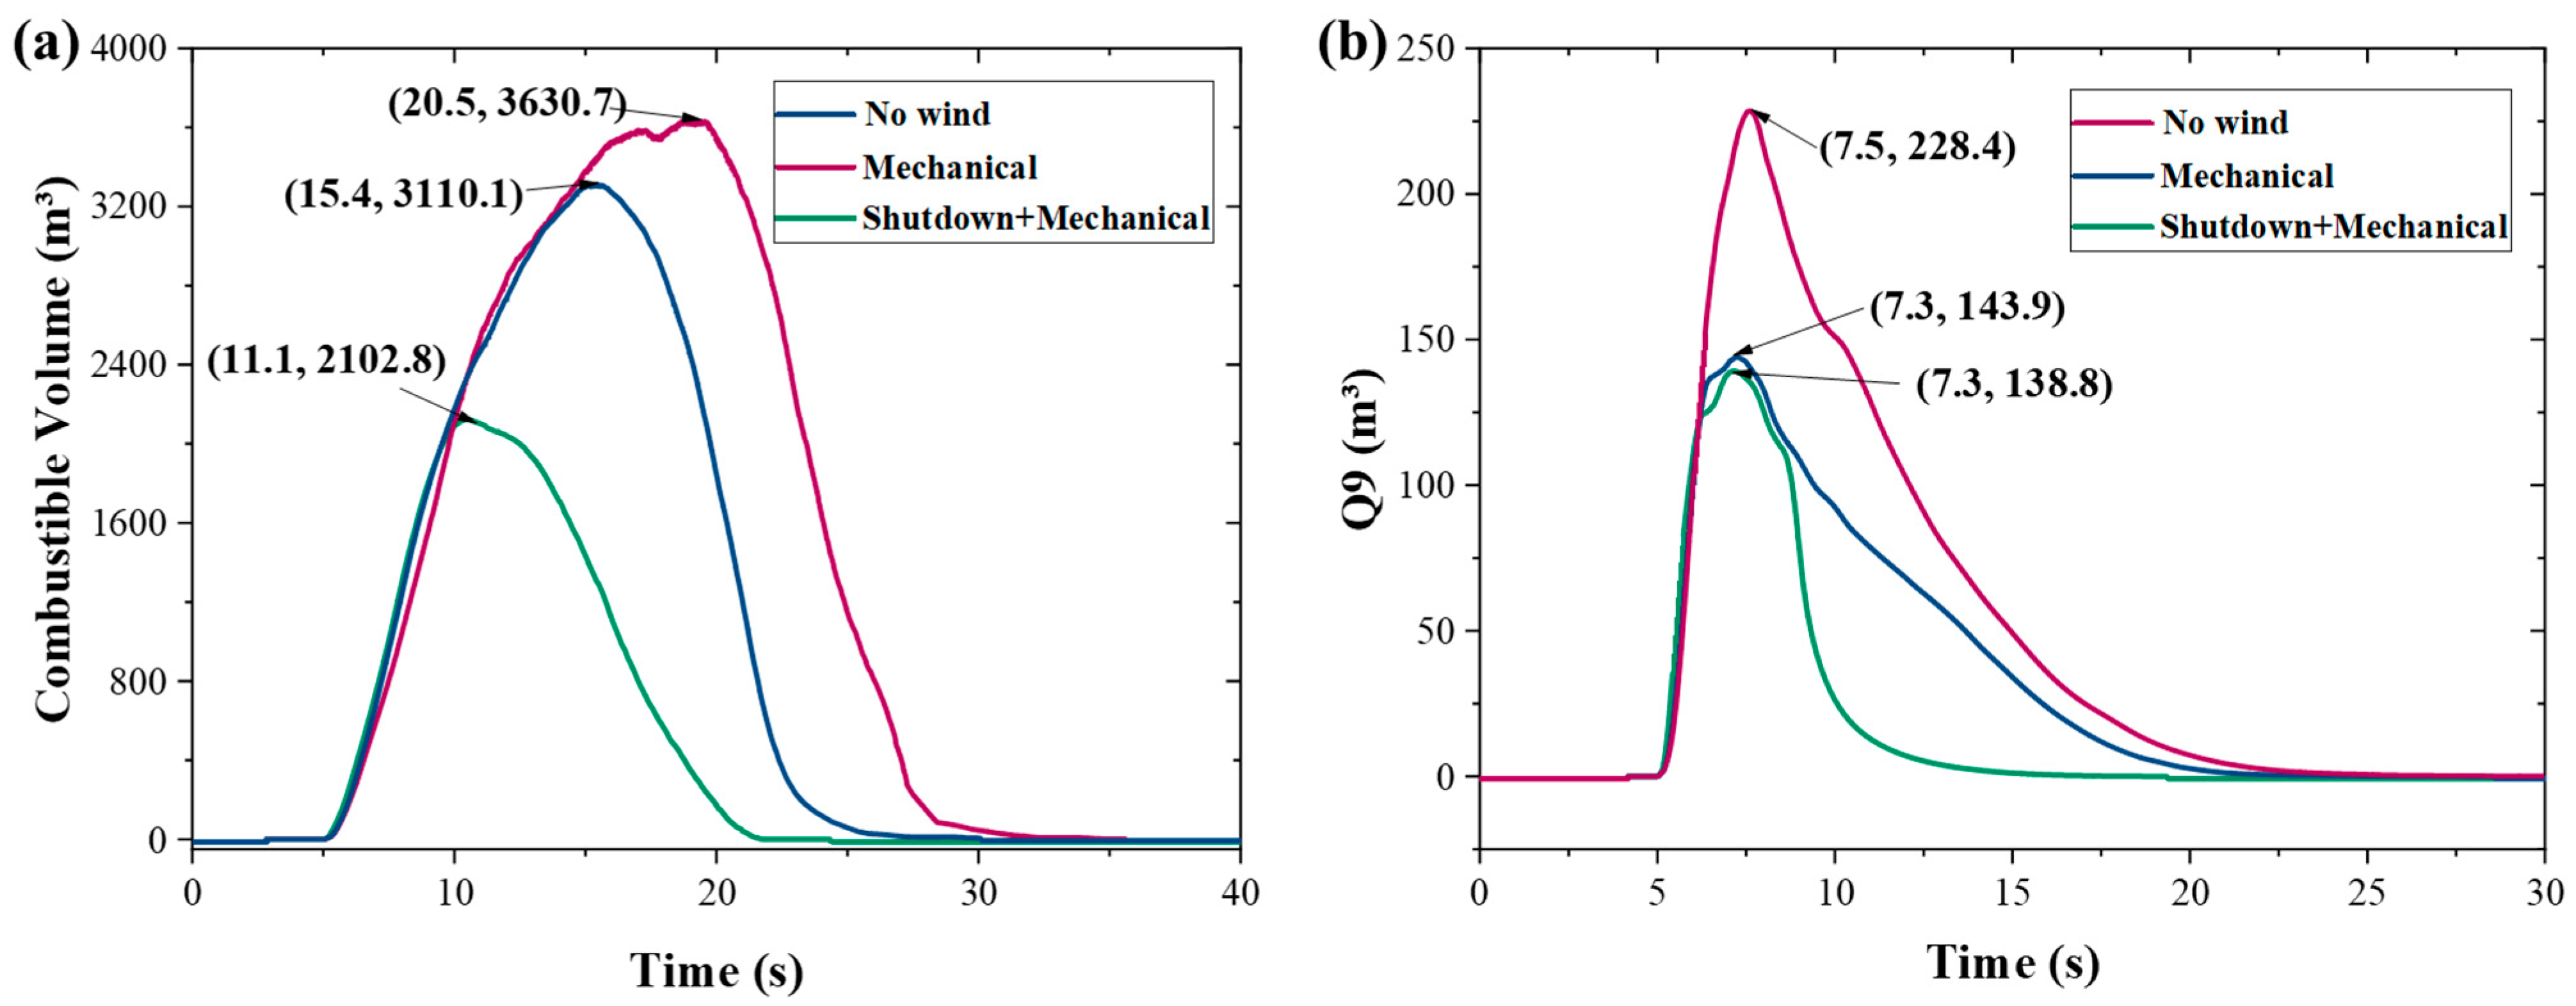
Figure 18a shows the variation in combustible hydrogen cloud volume under different protective measures. Compared with the peak combustible volume of 3630.7 m3 under windless conditions, the combined strategy of lateral ventilation and emergency shutdown significantly reduced the peak volume to 2102.8 m3, corresponding to a reduction of approximately 42.08%. When lateral mechanical ventilation alone was applied, the peak combustible volume decreased to 3110.1 m3, with a reduction of approximately 14.34%. These results indicate that compared with mechanical ventilation alone, the combined strategy incorporating emergency shutdown further enhances the dilution effect and significantly reduces the volume of the combustible hydrogen cloud.
Figure 18.
Evolution of hydrogen cloud under mechanical ventilation + emergency shutdown. (a) combustible volume; (b) Q9.
Figure 18b presents the variation in Q9 under different protective strategies. Although emergency shutdown was applied, the peak Q9 value under the combined strategy, 143.9 m3, was nearly the same as that under forced ventilation alone, 138.8 m3. This is because the sensor has a response delay of 3 s, and the hydrogen cloud reaches its peak before the emergency shutdown measure is activated. However, after emergency shutdown, Q9 rapidly decreased to zero at approximately 12 s, which was much earlier than in the case with mechanical ventilation alone. This indicates that once the emergency shutdown measure takes effect, the high-concentration hydrogen cloud dissipates rapidly, while the low-concentration cloud escapes quickly under the effect of buoyancy.
In summary, the combined protective strategy integrating mechanical ventilation and emergency shutdown can significantly shorten the time required for the hydrogen concentration to decrease and reduce the volume of the combustible hydrogen cloud. This strategy is particularly effective in mitigating potential risks under emergency conditions. Therefore, it is recommended that such a dual protective strategy be promoted in high-risk environments. In addition, hydrogen concentration sensors with short response times should be adopted as far as possible within an acceptable cost range, in order to improve the safety and response efficiency after hydrogen leakage.
4. Conclusions
This study conducted a numerical investigation of the dispersion evolution and combustion–explosion risk caused by high-pressure hydrogen leakage from storage equipment in an open space of an integrated hydrogen energy storage station based on photovoltaic power generation, including hydrogen production, storage, compression, and utilization. A hydrogen leakage model considering the characteristics of high-pressure underexpanded jets was established. Combined with the ESC model, the combustible hydrogen cloud volume and Q9 indicator were comparatively analyzed under different leakage diameters, natural ventilation, mechanical ventilation, and emergency shutdown conditions. The main conclusions are as follows.
- (1)
- The leakage diameter is a key factor affecting the consequences of hydrogen leakage accidents from storage vessels. As the leakage diameter increases, both the combustible hydrogen cloud range and the equivalent stoichiometric cloud volume increase significantly. Under large-scale leakage conditions, the hydrogen jet impinges on the blast wall under its initial momentum, and its dispersion direction changes under the influence of the wall and surrounding obstacles. Local accumulation is likely to occur near the blast wall, surrounding walls, and wall corners, resulting in a significant increase in the peak combustible volume and Q9 value, and thus the highest combustion and explosion risk. The peak hazard of medium-scale leakage is lower than that of large-scale leakage; however, its longer duration indicates that although the instantaneous consequences are relatively limited, the hazardous atmosphere may persist for a longer period. The hydrogen cloud generated by small-scale leakage is mainly confined near the leakage source, with relatively low combustible volume and Q9 values, indicating a comparatively lower accident hazard.
- (2)
- Under natural ventilation conditions, the combustible hydrogen cloud volume after leakage is significantly affected by wind speed and wind direction. The results show that, under windless conditions, the peak combustible hydrogen volume can reach 3652 m3, whereas this value decreases by up to 56% under natural wind. Wind speed has a relatively significant influence on the combustible volume, while the effect of wind direction is comparatively limited. However, the hydrogen dispersion rate varies under different wind directions. In particular, wind directions of 210° and 240° can effectively reduce the hydrogen concentration and associated risk. Natural ventilation can mitigate the hazard of hydrogen leakage to a certain extent, but its effectiveness depends on the actual wind speed and wind direction.
- (3)
- Under mechanical ventilation conditions, forced ventilation effectively reduces both the combustible volume of the hydrogen cloud and the equivalent stoichiometric cloud volume, Q9. Compared with the windless condition, mechanical ventilation significantly decreases the peak combustible volume, and lateral ventilation in the +X direction is more effective than vertical ventilation in the +Z direction. Further analysis indicates that the combined protective strategy of mechanical ventilation and emergency shutdown can significantly reduce the hydrogen cloud volume. When lateral ventilation and emergency shutdown are applied together, the peak combustible volume decreases to 2102.8 m3, representing a reduction of 42.08% compared with the windless case. The peak Q9 value is 143.9 m3, slightly higher than the value of 138.8 m3 obtained with mechanical ventilation alone. However, the overall response time is significantly shortened, and rapid dissipation can be achieved within approximately 12 s. These results demonstrate that in high-risk environments, the combined strategy of mechanical ventilation and emergency shutdown can control hydrogen leakage risk more effectively, especially under emergency conditions, by rapidly reducing the hydrogen cloud volume and explosion risk. Therefore, this dual protective measure is recommended for high-risk hydrogen leakage scenarios to enhance safety. Future studies may further consider complex meteorological conditions, multiple leakage sources, deflagration overpressure evolution after ignition, and the influence of different station layout parameters on accident consequences, thereby improving the risk assessment and safety protection system for integrated hydrogen energy storage stations.
- (4)
- The main contribution of this work is the development of a CFD assisted hierarchical safety framework for stationary hydrogen energy storage stations. By coupling leakage consequence simulation with natural ventilation assessment, sensor-based threshold identification, mechanical ventilation activation, and emergency shutdown, the framework provides a more practical tool for safety layout and emergency response design than conventional CFD analyses that only evaluate hydrogen dispersion under fixed boundary conditions.
Author Contributions
Conceptualization, Y.Z. and Y.S.; methodology, Y.Z. and Y.S.; software, Y.Z.; formal analysis, Y.Z. and Y.S.; data curation, Y.Z. and Y.S.; writing—original draft preparation, Y.Z.; writing—review and editing, Y.Z. and Y.S.; visualization, Y.Z. and Y.S.; supervision, Y.S.; project administration, Y.S. All authors have read and agreed to the published version of the manuscript.
Funding
This research was funded by the National Key Research and Development Program of China, grant number 2023YFB4004500.
Data Availability Statement
The original contributions presented in this study are included in the article. Further inquiries can be directed to the corresponding author.
Acknowledgments
During the preparation of this manuscript, the authors used ChatGPT 5.5 for the purposes of generating Figure 1. The authors have reviewed and edited the output and take full responsibility for the content of this publication.
Conflicts of Interest
The authors declare no conflicts of interest.
Abbreviations
The following abbreviations are used in this manuscript:
| LFL | Lower flammable limit |
| ESC | Equivalent stoichiometric cloud |
References
- Shang, Y.; Sang, S.; Tiwari, A.K.; Khan, S.; Zhao, X. Impacts of Renewable Energy on Climate Risk: A Global Perspective for Energy Transition in a Climate Adaptation Framework. Appl. Energy 2024, 362, 122994. [Google Scholar] [CrossRef] [Scilit]
- Iyke, B.N. Climate Change, Energy Security Risk, and Clean Energy Investment. Energy Econ. 2024, 129, 107225. [Google Scholar] [CrossRef] [Scilit]
- IEA. Global Hydrogen Review 2026; IEA: Paris, France, 2026. [Google Scholar]
- Wang, S.; Kong, L.; Cai, G.; Yan, H. Current Status, Challenges and Prospects of Key Application Technologies for Hydrogen Storage in Power System. Proc. CSEE 2023, 43, 6660–6681. [Google Scholar]
- National Development and Reform Commission. National Energy Administration Medium-and Long-Term Development Plan for the Hydrogen Energy Industry (2021–2035); National Development and Reform Commission: Beijing, China, 2022.
- Rabiee, A.; Keane, A.; Soroudi, A. Green Hydrogen: A New Flexibility Source for Security Constrained Scheduling of Power Systems with Renewable Energies. Int. J. Hydrogen Energy 2021, 46, 19270–19284. [Google Scholar] [CrossRef] [Scilit]
- Pan, G.; Gu, W.; Zhang, H.; Qiu, Y. Electricity and Hydrogen Energy System Towards Accomodation of High Proportion of Renewable Energy. Autom. Electr. Power Syst. 2020, 44, 1–10. [Google Scholar] [CrossRef]
- Lu, T.; Yi, X.; Li, J.; Wu, S. Collaborative Planning of Integrated Hydrogen Energy Chain Multi-Energy Systems: A Review. Appl. Energy 2025, 393, 126019. [Google Scholar] [CrossRef] [Scilit]
- Zhao, H.; Yanqi, X. Risk Assessment of Zero-Carbon Hydrogen Energy Storage Systems Coupled with Renewable Energy Power Generation Systems. Int. J. Hydrogen Energy 2025, 149, 150141. [Google Scholar] [CrossRef] [Scilit]
- Khan, M.A.; Young, C.; MacKinnon, C.; Layzell, D.B. The Techno-Economics of Hydrogen Compression; The Transition Accelerator: Calgary, AB, Canada, 2021; Volume 1. [Google Scholar]
- Konuhova, M.; Bezrukovs, V.; Bezrukovs, V.; Bezrukovs, D.; Buryi, M.; Gorbunovs, N.; Popov, A.I. Numerical Simulations of Scaling of the Chamber Dimensions of the Liquid Piston Compressor for Hydrogen Applications. Technologies 2025, 13, 226. [Google Scholar] [CrossRef] [Scilit]
- Chen, Y.; Zhao, J.; Li, J.; Mao, L. Challenges and Prospects of Hydrogen Energy Storage under the Background of Low-Carbon Transformation of Power Industry. Power Gener. Technol. 2023, 44, 296–304. [Google Scholar]
- Shan, R.; Reagan, J.; Castellanos, S.; Kurtz, S.; Kittner, N. Evaluating Emerging Long-Duration Energy Storage Technologies. Renew. Sustain. Energy Rev. 2022, 159, 112240. [Google Scholar] [CrossRef] [Scilit]
- Yang, T.; Xiao, Z.; Zeng, S.; Zhao, Y.; Xu, L.; Chen, S.; Song, C.; Yan, X.; Li, X.; Luo, H.; et al. Characteristics of Hydrogen Leakage and Dissipation from Storage Tanks in an Integrated Hydrogen Production and Refueling Station. Fire 2024, 7, 306. [Google Scholar] [CrossRef] [Scilit]
- Qu, J.; Zhou, T.; Zhao, H.; Deng, J.; Luo, Z.; Cheng, F.; Wang, R.; Chen, Y.; Shu, C. Risk Analysis of Hydrogen Leakage at Hydrogen Producing and Refuelling Integrated Station. Processes 2025, 13, 437. [Google Scholar] [CrossRef] [Scilit]
- H2tools. Hydrogen Tools Hydrogen Compared to Other Fuels. Available online: https://h2tools.org/bestpractices/best-practices-overview/hydrogen-basics/hydrogen-compared-to-other-fuels (accessed on 6 July 2026).
- Yang, F.; Wang, T.; Deng, X.; Dang, J.; Huang, Z.; Hu, S.; Li, Y.; Ouyang, M. Review on Hydrogen Safety Issues: Incident Statistics, Hydrogen Diffusion, and Detonation Process. Int. J. Hydrogen Energy 2021, 46, 31467–31488. [Google Scholar] [CrossRef] [Scilit]
- Astbury, G.R.; Hawksworth, S.J. Spontaneous Ignition of Hydrogen Leaks: A Review of Postulated Mechanisms. Int. J. Hydrogen Energy 2007, 32, 2178–2185. [Google Scholar] [CrossRef] [Scilit]
- De Stefano, M.; Rocourt, X.; Sochet, I.; Daudey, N. Hydrogen Dispersion in a Closed Environment. Int. J. Hydrogen Energy 2019, 44, 9031–9040. [Google Scholar] [CrossRef] [Scilit]
- Li, X.; Chen, M.; Wang, Y.; Hu, J.; Sun, Z.; Christopher, D.M.; Cheng, L. Measurements of Concentration Decays in Underexpanded Jets through Rectangular Slot Nozzles. Int. J. Hydrogen Energy 2018, 43, 9884–9893. [Google Scholar] [CrossRef] [Scilit]
- Kobayashi, H.; Naruo, Y.; Maru, Y.; Takesaki, Y.; Miyanabe, K. Experiment of Cryo-Compressed (90-MPa) Hydrogen Leakage Diffusion. Int. J. Hydrogen Energy 2018, 43, 17928–17937. [Google Scholar] [CrossRef] [Scilit]
- Hussein, H.; Brennan, S.; Molkov, V. Dispersion of Hydrogen Release in a Naturally Ventilated Covered Car Park. Int. J. Hydrogen Energy 2020, 45, 23882–23897. [Google Scholar] [CrossRef] [Scilit]
- Shen, Y.; Zheng, T.; Lv, H.; Zhou, W.; Zhang, C. Numerical Simulation of Hydrogen Leakage from Fuel Cell Vehicle in an Outdoor Parking Garage. World Electr. Veh. J. 2021, 12, 118. [Google Scholar] [CrossRef] [Scilit]
- Makarov, D.; Shentsov, V.; Kuznetsov, M.; Molkov, V. Pressure Peaking Phenomenon: Model Validation against Unignited Release and Jet Fire Experiments. Int. J. Hydrogen Energy 2018, 43, 9454–9469. [Google Scholar] [CrossRef] [Scilit]
- Li, Z.; Sun, K. Mitigation Measures for Intended Hydrogen Release from Thermally Activated Pressure Relief Device of Onboard Storage. Int. J. Hydrogen Energy 2020, 45, 9260–9267. [Google Scholar] [CrossRef] [Scilit]
- Lach, A.W.; Gaathaug, A.V.; Vaagsaether, K. Pressure Peaking Phenomena: Unignited Hydrogen Releases in Confined Spaces—Large-Scale Experiments. Int. J. Hydrogen Energy 2020, 45, 32702–32712. [Google Scholar] [CrossRef] [Scilit]
- Shen, Y.; Lv, H.; Zheng, T.; Liu, Y.; Zhou, W.; Zhang, C. Temporal and Spatial Evolution of Hydrogen Leakage and Diffusion from Tube Fittings on Fuel Cell Vehicles under the Effect of Ambient Wind. Renew. Sustain. Energy Rev. 2023, 185, 113596. [Google Scholar] [CrossRef] [Scilit]
- Lv, H.; Shen, Y.; Zheng, T.; Zhou, W.; Ming, P.; Zhang, C. Numerical study of hydrogen leakage, diffusion, and combustion in an outdoor parking space under different parking configurations. Renew. Sustain. Energy Rev. 2023, 173, 113093. [Google Scholar] [CrossRef] [Scilit]
- Hajji, Y.; Bouteraa, M.; Bournot, P.; Bououdina, M. Assessment of an Accidental Hydrogen Leak from a Vehicle Tank in a Confined Space. Int. J. Hydrogen Energy 2022, 47, 28710–28720. [Google Scholar] [CrossRef] [Scilit]
- Hajji, Y.; Jouini, B.; Bouteraa, M.; Elcafsi, A.; Belghith, A.; Bournot, P. Numerical study of hydrogen release accidents in a residential garage. Int. J. Hydrogen Energy 2015, 40, 9747–9759. [Google Scholar] [CrossRef] [Scilit]
- Hajji, Y.; Bouteraa, M.; ELCafsi, A.; Belghith, A.; Bournot, P.; Kallel, F. Natural ventilation of hydrogen during a leak in a residential garage. Renew. Sustain. Energy Rev. 2015, 50, 810–818. [Google Scholar] [CrossRef] [Scilit]
- Cui, W.; Yuan, Y.; Tong, L.; Shen, B. Numerical simulation of hydrogen leakage diffusion in seaport hydrogen refueling station. Int. J. Hydrogen Energy 2023, 48, 24521–24535. [Google Scholar] [CrossRef] [Scilit]
- Zhou, C.; Yang, Z.; Chen, G.; Li, X. Optimizing hydrogen refueling station layout based on consequences of leakage and explosion accidents. Int. J. Hydrogen Energy 2024, 54, 817–836. [Google Scholar] [CrossRef] [Scilit]
- Liu, K.; He, C.; Yu, Y.; Guo, C.; Lin, S.; Jiang, J. A Study of Hydrogen Leak and Explosion in Different Regions of a Hydrogen Refueling Station. Int. J. Hydrogen Energy 2023, 48, 14112–14126. [Google Scholar] [CrossRef] [Scilit]
- Yang, Z.; Chen, Z.; Han, X.; Chen, G.; Wang, X. Numerical and experimental studies on the evolution characteristics of high-pressure hydrogen leakage and explosion accidents in hydrogen refueling stations. Int. J. Hydrogen Energy 2025, 142, 580–595. [Google Scholar] [CrossRef] [Scilit]
- Yang, Z.; Li, K.; Xin, F.; Deng, H.; Wang, X. Experimental study and dynamic combination weight analysis of hydrogen leakage and diffusion evolution characteristics in hydrogen refueling stations. Int. J. Hydrogen Energy 2026, 204, 153287. [Google Scholar] [CrossRef] [Scilit]
- Zhang, L.; Duan, Z.; Ding, R.; Liu, C. A Numerical Study of the Leakage and Diffusion Behavior of Hydrogen Dispensers in Hydrogen Refueling Stations Under Different Leakage Conditions. Energies 2024, 17, 6224. [Google Scholar] [CrossRef] [Scilit]
- Yu, X.; Yan, W.; Liu, Y.; Zhou, P.; Li, B.; Wang, C. The flame mitigation effect of vertical barrier wall in hydrogen refueling stations. Fuel 2022, 315, 123265. [Google Scholar] [CrossRef] [Scilit]
- Middha, P.; Hansen, O.R.; Storvik, I.E. Validation of CFD-Model for Hydrogen Dispersion. J. Loss Prev. Process Ind. 2009, 22, 1034–1038. [Google Scholar] [CrossRef] [Scilit]
- Lucas, M.; Atanga, G.; Hisken, H.; Mauri, L.; Skjold, T. Simulating Vented Hydrogen Deflagrations: Improved Modelling in the CFD Tool FLACS-Hydrogen. Int. J. Hydrogen Energy 2021, 46, 12464–12473. [Google Scholar] [CrossRef] [Scilit]
- Birch, A.D.; Brown, D.R.; Dodson, M.G.; Swaffield, F. The Structure and Concentration Decay of High Pressure Jets of Natural Gas. Combust. Sci. Technol. 1984, 36, 249–261. [Google Scholar] [CrossRef] [Scilit]
- Birch, A.D.; Hughes, D.J.; Swaffield, F. Velocity Decay of High Pressure Jets. Combust. Sci. Technol. 1987, 52, 161–171. [Google Scholar] [CrossRef] [Scilit]
- Schefer, R.W.; Houf, W.G.; Williams, T.C.; Bourne, B.; Colton, J. Characterization of High-Pressure, Underexpanded Hydrogen-Jet Flames. Int. J. Hydrogen Energy 2007, 32, 2081–2093. [Google Scholar] [CrossRef] [Scilit]
- Molkov, V.; Makarov, D.; Bragin, M. Physics and Modelling of Under-Expanded Jets and Hydrogen Dispersion in Atmosphere. In Proceedings of the Physics of Extreme State of Matter; Russian Academy of Sciences: Moscow, Russia, 2009; pp. 143–145. [Google Scholar]
- Hansen, O.R.; Gavelli, F.; Davis, S.G.; Middha, P. Equivalent Cloud Methods Used for Explosion Risk and Consequence Studies. J. Loss Prev. Process Ind. 2013, 26, 511–527. [Google Scholar] [CrossRef] [Scilit]
- Tam, V.H.Y.; Tan, F.; Savvides, C. A Critical Review of the Equivalent Stoichiometric Cloud Model Q9 in Gas Explosion Modelling. Eng 2021, 2, 156–180. [Google Scholar] [CrossRef] [Scilit]
- Monin, A.S.; Obukhov, A.M. Basic Laws of Turbulent Mixing in the Surface Layer of the Atmosphere. Contrib. Geophys. Inst. Acad. Sci. USSR 1954, 151, e187. [Google Scholar]
- Kim, J.; Kim, Y.; Park, B.; Yoon, U.; Kang, C. The Effect of Natural Ventilation through Roof Vents Following Hydrogen Leaks in Confined Spaces. Int. J. Hydrogen Energy 2024, 50, 1395–1405. [Google Scholar] [CrossRef] [Scilit]

Disclaimer/Publisher’s Note: The statements, opinions and data contained in all publications are solely those of the individual author(s) and contributor(s) and not of MDPI and/or the editor(s). MDPI and/or the editor(s) disclaim responsibility for any injury to people or property resulting from any ideas, methods, instructions or products referred to in the content. |
© 2026 by the authors. Licensee MDPI, Basel, Switzerland. This article is an open access article distributed under the terms and conditions of the Creative Commons Attribution (CC BY) license.