


Abstract
This study presents a mathematical programming approach for the optimal design of a renewable energy system in a grid-connected public building, incorporating green hydrogen production for surplus energy storage. The system includes wind turbines, solar panels, batteries, a hydrogen unit, and a grid connection. Hydrogen can also be sold as vehicle fuel, generating revenue and reducing the environmental impact. Unlike traditional hydrogen smart grid models that rely on continuous capacity variables—which often yield non-commercial fractional unit sizes—our MILP framework strictly enforces discrete equipment capacities matching real-world procurement specifications. The methodology is applied to the Chemical Engineering Department Building at the University of Patras, Greece, with two objectives: minimizing annual cost and minimizing carbon dioxide emissions. While higher grid electricity tariffs increase absolute total energy costs, they significantly enhance the economic competitiveness and payback of local renewable energy and green hydrogen installations, shifting the optimal system configuration toward self-sufficiency and deep decarbonization. Emission minimization achieves substantial reductions with acceptable economic trade-offs, mainly through hydrogen replacing fossil fuels in transport. A GAMS-based model demonstrates that integrating renewables and hydrogen storage can enhance energy security, lower costs, and reduce the environmental impact in public buildings.
1. Introduction
The increasing global concern for environmental protection has intensified the need for clean, efficient fuel technologies and sustainable power generation systems. In response, both renewable energy sources and green hydrogen are being actively pursued as promising solutions to address the environmental challenges faced worldwide [1]. However, their effective integration into energy systems requires long-term planning and strategic actions to ensure sustainable development, highlighting a strong interconnection between renewable energy adoption and sustainability goals.
Renewable energy sources are naturally replenished through solar radiation, wind, hydro, and other environmental phenomena, and unlike fossil fuels, they do not exacerbate environmental pollution or carbon emissions [2]. Their utilization is therefore critical for mitigating climate change and reducing global carbon footprints. Complementarily, green hydrogen—produced exclusively from renewable electricity via water electrolysis—provides an additional pathway to decarbonize energy and transportation systems, serving as a clean alternative fuel for vehicles and industrial applications.
The ongoing global energy transition emphasizes the importance of integrating renewable resources for green hydrogen production. This approach not only supports the reduction of carbon emissions but also advances the development of a low-carbon economy [3]. Energy systems are evolving rapidly to accommodate growing shares of variable renewable energy, with wind and solar technologies benefiting from policy incentives, economic support, and the emergence of energy communities and smart grids [4]. Smart grids enable active consumer participation in energy management, optimize energy use, and facilitate efficient integration of renewable sources. Consequently, investment in smart grids and renewable energy infrastructure contributes to a more sustainable and resilient energy future.
Smart grids provide controlled electricity distribution, improving the management of distributed energy resources and enhancing energy independence, security, and reliability [5,6]. They mitigate fossil fuel dependency, maintain continuous supply during outages, reduce environmental pollution, and offer long-term economic benefits by stimulating local economies and creating jobs [5]. Technologically, smart grids employ advanced energy storage systems to counteract the intermittency of renewables, improving overall system efficiency and reliability [7]. In off-grid applications, batteries or other storage solutions can store excess energy, which can be used later for electricity supply or for green hydrogen production [8,9,10].
A typical smart grid integrates distributed generators, flexible loads, energy storage devices, and control systems. Photovoltaic cells and wind turbines, combined with controllable generation units like diesel generators and energy storage (batteries, supercapacitors), balance energy reserves from short-term to long-term requirements. The inclusion of electrolyzers allows excess energy to be converted into hydrogen, which can be stored, used, or sold, adding both operational flexibility and potential revenue streams. Connection to the main electricity grid further enhances energy management, while integrating green hydrogen production improves overall grid efficiency and aligns with national and local energy policies [11].
Hydrogen production is a key component of the renewable energy transition. Green hydrogen, generated by electrolysis using electricity from solar or wind power, produces no direct carbon emissions and can be used in fuel cells, transportation, and as a raw material in chemical industries [3,12]. Beyond energy storage, hydrogen’s versatility spans sectors including chemicals, oil refining, food processing, space, and aviation, highlighting its potential for widespread adoption [11].
Recent studies demonstrate the financial and environmental benefits of green hydrogen production from renewable sources, including cost savings, carbon emission reductions, and improved energy security [13,14,15,16,17,18]. Rajasekaran et al. [19] investigated renewable electrification and green hydrogen production for a net-zero institutional building using a tri-objective optimization framework. Their results demonstrated the potential of hydrogen-integrated energy systems for reducing both carbon emissions and energy costs. However, most research focuses on industrial-scale applications or off-grid systems. The novelty of this study lies in investigating the integration of renewable energy and green hydrogen production within a public building, leveraging real meteorological data and actual power demand profiles. It evaluates a hybrid system combining solar and wind power, battery storage, and green hydrogen production while remaining grid-connected. Financial benefits are assessed alongside potential revenue from hydrogen sales, and the impact of electricity pricing on system design is analyzed. This study provides a comprehensive assessment of both economic and environmental sustainability for urban-scale applications.
Specifically, the proposed system uses wind and solar energy as primary sources. Excess energy is stored in a battery system and/or used to produce green hydrogen via a PEM electrolyzer, which can either supply the building, feed the grid, or generate revenue through hydrogen sales. A mathematical formulation that incorporates several novel elements is presented. The proposed model is of the general form of a mixed-integer nonlinear programming problem (MINLP). The model is subsequently linearized, resulting in a mixed-integer linear programming (MILP) problem that can be solved to global optimality.
The contribution of this work are fundamentally threefold:
- Real-World Institutional Integration: Unlike purely theoretical or generic smart grid studies, this work delivers a highly contextualized case study based on high-resolution demand profiles from an operational public building. It evaluates the practical, economic, and regulatory viability of integrating hydrogen production within an institutional urban ecosystem.
- Linearized Thermodynamic Modeling: The manuscript introduces a novel, rigorous inequality constraint derived from the real-gas equation of a state to capture high-pressure hydrogen storage dynamics. This methodology successfully bridges the gap between thermodynamic accuracy and computational efficiency, providing a highly precise representation of mass and pressure limits inside the storage vessel without compromising the linearity of the global optimization model.
- Discrete Sizing of Renewable Energy and Processing Units: In contrast to most traditional mathematical programming frameworks for hybrid renewable energy systems that rely on continuous capacity variables, the proposed formulation explicitly incorporates discrete equipment sizing. By restricting component capacities to discrete, commercially available scales, the optimization model eliminates unrealistic fractional sizing and aligns directly with real-world procurement and engineering constraints. While accommodating discrete variables significantly expands the combinatorial search space and increases optimization complexity, it vastly enhances the practical fidelity and utility of the model when addressing real-world case studies.
Unlike traditional hydrogen smart grid models that rely on continuous capacity variables—which often yield non-commercial fractional unit sizes—our MILP framework strictly enforces discrete equipment capacities matching real-world procurement specifications.
The remainder of this paper is organized as follows. Section 2 presents the overall methodology and the detailed system modeling framework. Section 3 introduces the case study of a public building located in Patras, Greece, including the relevant input data and assumptions. The results obtained from the application of the proposed mathematical programming formulation are presented and analyzed in the same section. Finally, Section 4 concludes the paper with a discussion of the key findings, along with recommendations for future research.
2. Materials and Methods
The methodology of this study focuses on the optimal design of a smart grid for buildings that currently rely solely on the national grid and fossil fuels. The proposed system integrates renewable energy sources, including wind turbines and photovoltaic panels, alongside a connection to the national grid. When the electricity generated from renewable sources exceeds the building’s demand, the surplus energy is either stored in a battery energy storage system or used by a proton exchange membrane electrolyzer to produce green hydrogen.
To enable a realistic and accurate design, the model requires detailed input data, including:
- Hourly electricity demand of the building over a full year,
- Hourly wind speed, and
- Hourly solar irradiance for the region.
These inputs allow for precise estimation of the local renewable energy potential and provide the basis for optimizing system performance.
The mathematical formulation begins by defining all components of the smart grid and their operational characteristics. Component-specific equations and constraints are established to represent technical specifications, performance limitations, and operational behavior. Economic parameters are also incorporated to allow for financial assessment. The model then defines an objective function, which can focus on:
- Minimization of the total annual cost (TAC);
- Minimization of carbon emissions;
- A multi-objective combination of both.
The resulting optimization problem is formulated as a Mixed Integer Linear Programming model, incorporating both continuous and discrete decision variables to ensure realistic representation of the system. The optimization is implemented in the General Algebraic Modeling System (GAMS) (version 32.2.0), a platform for mathematical programming and complex system modeling.
The solution provides:
- The optimal value of the selected objective function;
- Optimal sizing of all system components;
- Hourly operational schedules over the entire year.
Thus, the optimization defines both the structural configuration and operational strategy of the smart grid, enabling evaluation of either financial or environmental benefits for the two case study scenarios.
2.1. Mathematical Formulation
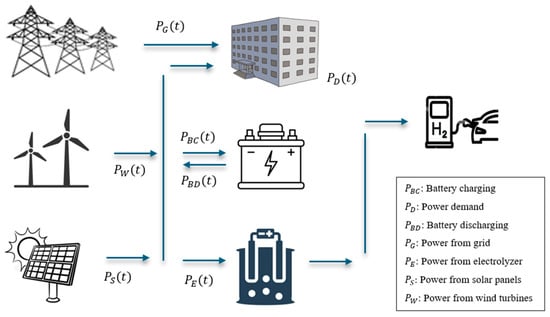
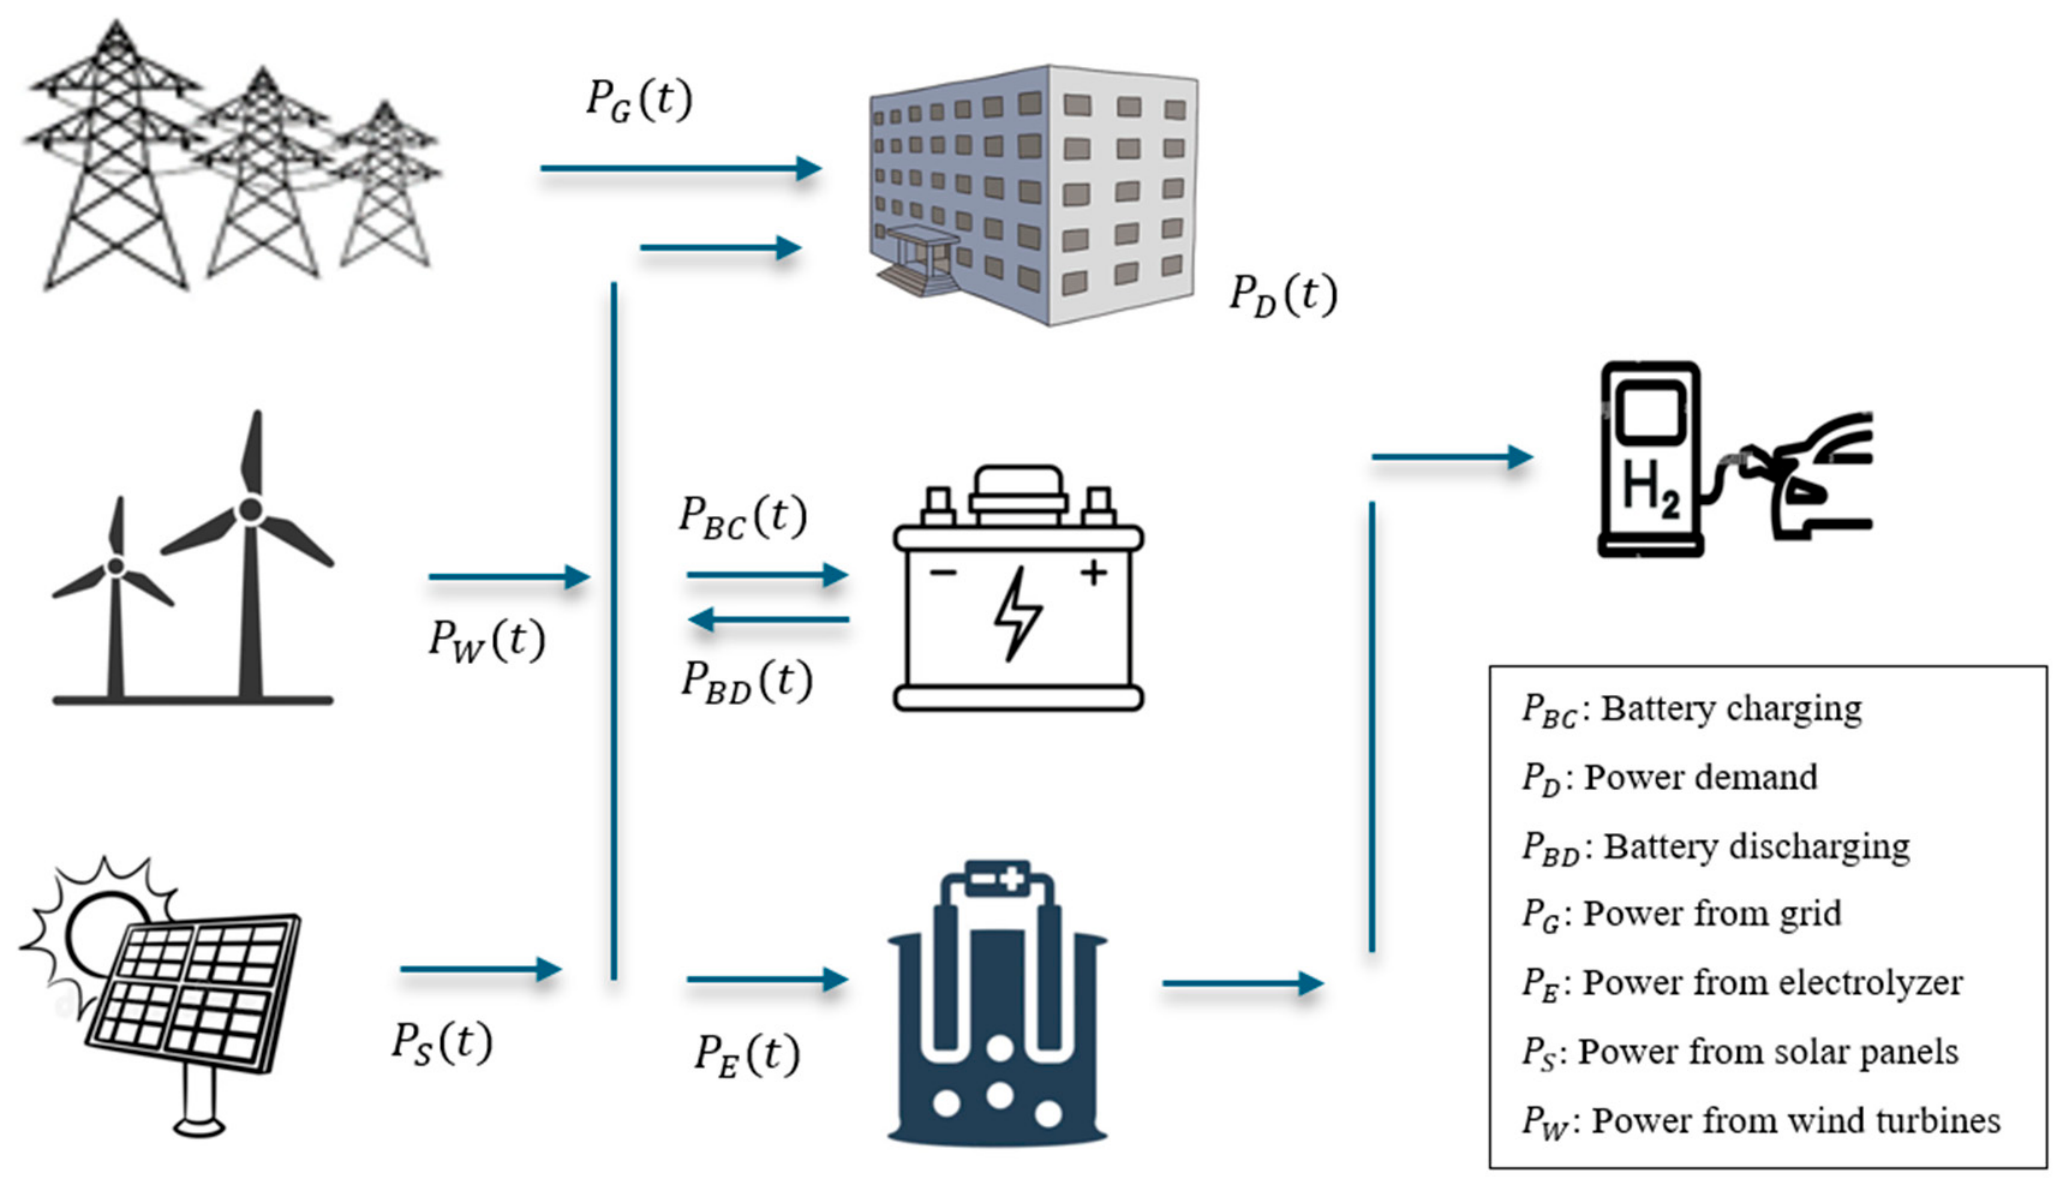
The smart grid considered in this study integrates multiple energy generation and storage components, including a wind turbine, a photovoltaic array, a battery energy storage system, and a green hydrogen production system. The hydrogen system consists of a proton exchange membrane (PEM) electrolyzer, a compression unit, and a high-pressure storage tank. Green hydrogen is produced at a final pressure of 350 bar and can be sold to generate additional revenue, enhancing the economic viability of the system. This integrated configuration provides a sustainable energy solution while maintaining a connection to the national grid for reliability and support. Figure 1 illustrates the alternative system powered by the combination of renewable energy sources, storage, and hydrogen production considered in this study.
Figure 1.
Structure of the smart grid considered in this study.
The system operation is modeled using an hourly energy balance [20]:
where , , , are the power supplied from the national grid (G), solar panels (S), wind turbines (W) and battery discharge (BD), respectively; represents the building’s power demand (D); and , , correspond to the power consumed for battery charging (BC), operation of the PEM electrolyzer (E), and the hydrogen compressor (C), respectively. Note that the inequality in Equation (1) inherently accounts for potential energy curtailment; when generation exceeds demand and both battery and hydrogen storage capacities are fully saturated, any remaining surplus renewable energy is curtailed.
2.1.1. Wind Turbines
The power output of a wind turbine is determined by the wind speed at the hub height and its corresponding power curve. The instantaneous power generated by the wind turbine, , depends on the wind speed and can be approximated using the following expression [21]:
where is the rated power of the wind turbine, and is the wind availability factor, which depends on the wind velocity at the turbine rotor, . Here, is the rated wind speed, is the cut-in speed, and is the cut-out speed, all of which are specific to the turbine type. To accurately estimate the turbine power, the measured wind velocity, , must be corrected to account for the height difference between the measurement instrument and the turbine hub. This correction is applied using Equation (4), where is the hub height of the turbine (m), while is the measurement height. It is important to note that Equations (2)–(4) are used to determine , which is an input parameter to our mathematical formulation.
2.1.2. PV Array
The smart grid also includes a PV array. The power supplied to the microgrid from the PV array can be estimated by the following equation [22]
where is the rated power of the PV array, is the reference solar irradiance under standard test conditions, and is the measured solar irradiance on the PV modules at time .
2.1.3. Battery Storage System
The energy generated from renewable sources is inherently variable due to its dependence on natural phenomena. To ensure system reliability and sustainability, a battery energy storage system (BESS) is incorporated. The BESS charges by storing excess energy and discharges to supply energy when renewable generation is insufficient. The operation of the battery can be described by the following state-of-charge () equation [22,23]:
where is the state of charge of the battery, and are the efficiencies for charging and discharging, is the self-discharging coefficient, and and are the powers of battery charging and discharging every hour ( = 1 h is the time discretization).
There are also lower and upper bounds for the proper operation of the battery, which ensure optimal performance and increase the number of charging cycles [23]:
where is the rated capacity of the battery. Equations (7) and (8) define the limits on the battery’s charging and discharging rates based on its rated capacity. The parameter represents the minimum acceptable time required to fully charge or discharge the battery. Equation (9) specifies the allowable range for the battery’s state of charge, setting both minimum and maximum limits.
During the operation of the battery energy storage system, simultaneous charging and discharging are not allowed. Therefore, at any given hour, the battery can either charge or discharge, but not both:
Equation (10) introduces nonlinearity into the optimization problem. To linearize this condition, it can be equivalently expressed using a set of linear inequalities with a binary decision variable [20]:
where is a sufficiently large constant, and is a binary variable. While this alternative formulation makes the problem linear, it introduces 8760 binary variables and 2 × 8760 linear inequality constraints that replace one nonlinear equation.
2.1.4. Green Hydrogen Production System
To efficiently manage excess renewable energy, the system incorporates, in addition to battery storage, a proton exchange membrane water electrolysis unit. The electrolyzer utilizes surplus electricity to split water into hydrogen and oxygen, thereby producing green hydrogen [24]. This configuration is particularly advantageous when the battery storage system is fully charged or when the high capital cost of battery expansion makes hydrogen production a more economically viable option for energy management.
The hydrogen electrolyzer is supplied with electrical power from the smart grid, which includes photovoltaic panels, wind turbines, and the battery energy storage system. The produced hydrogen is subsequently compressed to a final pressure of 350 bar and stored in specialized high-pressure tanks, enabling its distribution to the market as a transportation fuel. This process creates an additional revenue stream, improving the economic performance of the overall system while contributing to a significant reduction in CO2 emissions.
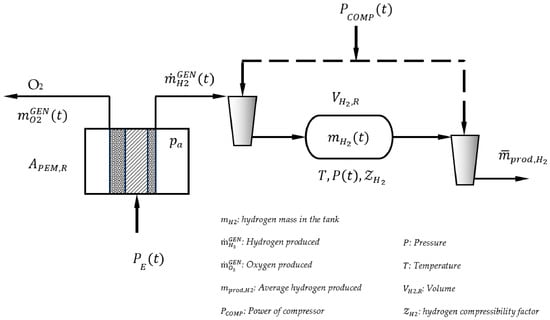
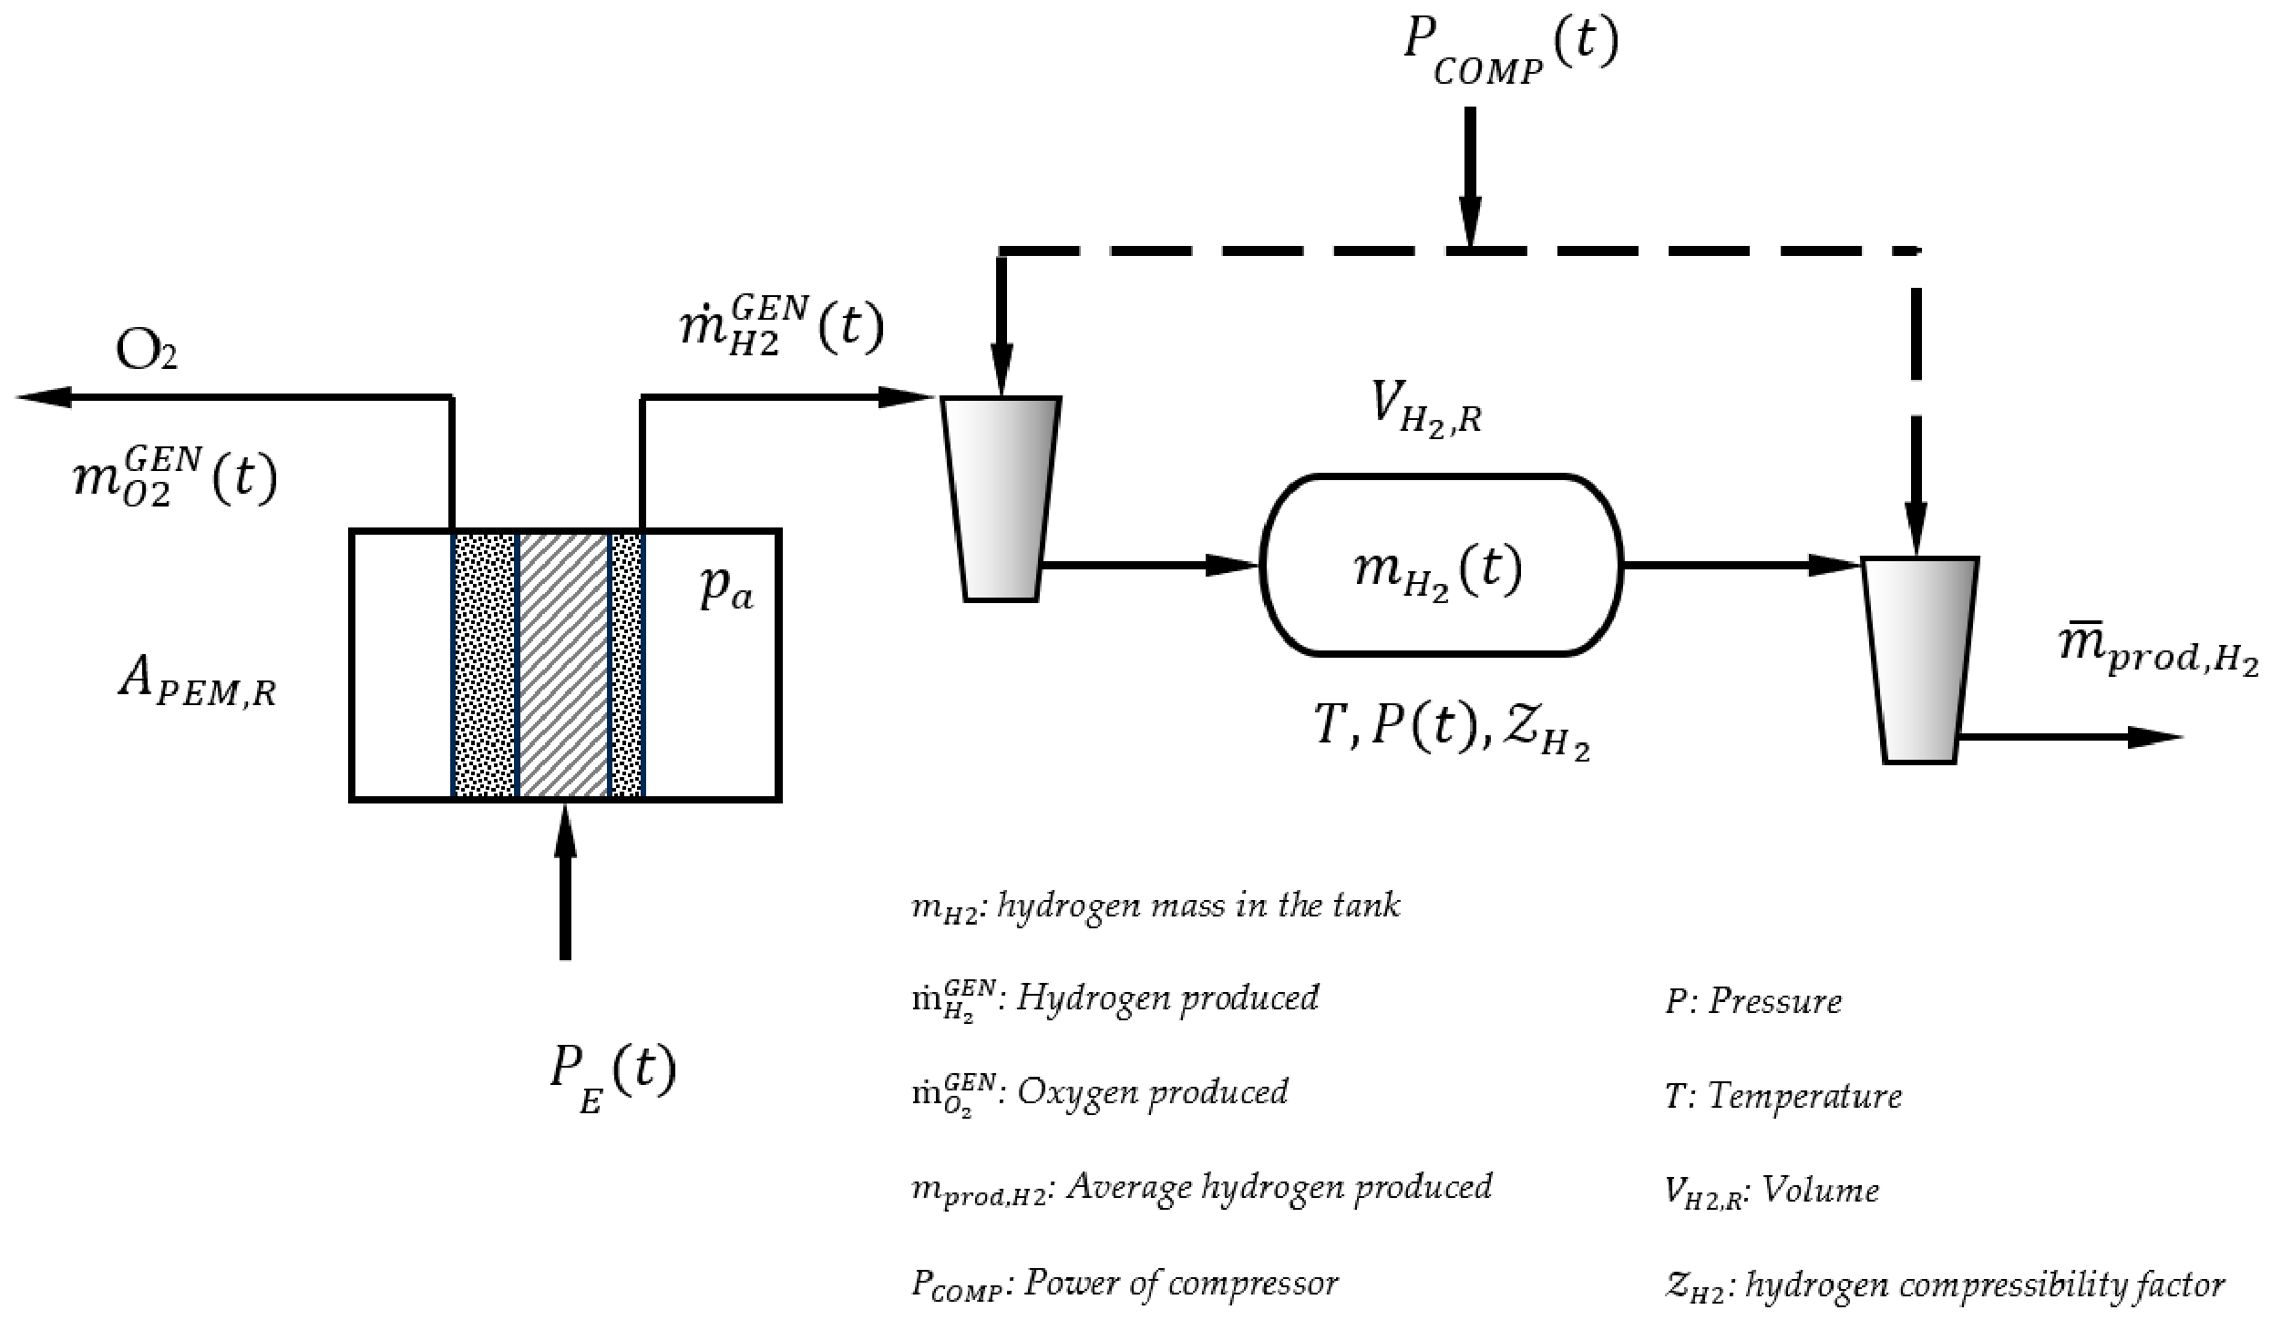
Following production in the electrolyzer, hydrogen undergoes a staged compression process. Initially, it is compressed to approximately 80 bar and stored in an intermediate buffer tank. From this buffer, the hydrogen is further compressed to a final pressure of 350 bar before being transferred to dedicated high-pressure storage tanks. The staged compression strategy minimizes operational fluctuations in the final compression stage and ensures a stable and continuous hydrogen supply from the buffer tank. The overall hydrogen production, compression, and storage system configuration is illustrated in Figure 2 [24,25].
Figure 2.
General structure and components of the hydrogen production system.
The hourly hydrogen production of the PEM electrolyzer, as well as its operational constraints, is described by Equations (13)–(15) [24]. To maintain operational stability and limit excessive fluctuations in the electrolyzer output between consecutive time steps, the ramping constraints defined in Equations (14) and (15) are applied. These constraints ensure that variations in the electrolyzer operating level remain within acceptable limits, thereby preventing adverse effects on system efficiency, equipment lifespan, and operational safety.
where is the rate of hydrogen production, is the electrical energy consumed in the electrolyzer, is the nominal value of the electrical energy consumed per kg of H2 produced (in kWh per kg H2), and is the rated power of the electrolyzer. The parameter is a time constant that reflects the permissible rate of change in the electrolyzer operating point between two consecutive time steps. It can also be interpreted as the minimum required time for the PEM electrolyzer to transition from minimum to maximum operating load.
The hydrogen produced can be compressed to high pressure and stored as compressed gas in an intermediate buffer tank. The tank operates within a defined pressure range, bounded by a maximum pressure and a minimum pressure . Maintaining the tank pressure within these limits ensures a continuous hydrogen supply from the buffer tank and allows the downstream compressor to operate without significant fluctuations in suction pressure.
The mass balance of hydrogen within the buffer tank is described by the following equation:
where is the mass of hydrogen stored in the hydrogen storage tank at time , and is the constant average rate of hydrogen production.
If the rated volume of the hydrogen storage tank is then the pressure in the hydrogen storage tank can be calculated from the following equation of state
where is the molar mass of hydrogen, is the ideal gas constant and is the temperature in the tank (assumed to be constant). is the compressibility factor which is a complex function of the pressure and temperature. Based on experimental data obtained from [26] for pressures up to 100 bar, the following simplified equation can be used for determining the compressibility factor of hydrogen using the second virial coefficient approximation
The error associated with this approximation remains below 3% for pressures up to 100 bar. However, when Equation (19) is combined with Equations (17) and (18), two nonlinear inequality constraints are introduced that apply to all time steps. As a result, the linearity of the optimization problem is lost, transforming the formulation into a nonlinear programming (NLP) problem. Such nonlinearities arise from bilinear terms that couple decision variables () and/or system states (). These terms significantly increase the computational complexity of the problem and reduce the tractability of the optimization model, particularly for large time horizons. Since there is no straightforward method to linearize these bilinear expressions without introducing substantial approximation errors, an alternative modeling approach must be adopted to preserve a linear or mixed-integer linear programming formulation.
To address this issue, it is noted that the explicit calculation of the tank pressure is not essential for the optimization formulation, except for ensuring that the pressure satisfies its prescribed bounds. By substituting Equations (17) and (19) into Equation (18) and evaluating the resulting expression at the pressure limits, the following two linear inequality constraints are obtained:
These constraints are conservative when the actual pressure deviates from the bounds, which is a desirable property as it guarantees feasibility of the solution. More importantly, the constraints become exact when the pressure approaches the upper or lower limits. Consequently, they provide a linear and exact representation of the pressure bound constraints in the hydrogen storage tank.
This formulation avoids the explicit calculation of the tank pressure within the optimization problem, thereby preserving linearity. The pressure can instead be determined in a post-processing step once the tank volume and the stored hydrogen mass have been calculated.
The hydrogen produced is subsequently compressed to a final pressure of 350 bar in order to enable high-pressure storage and distribution as a transportation fuel [27]. This compression is achieved through a multistage compression system equipped with intercooling heat exchangers to reduce the gas temperature between stages and improve overall compression efficiency. The rated power of the compressor, , can be estimated based on the thermodynamic compression work required to raise the hydrogen pressure from the inlet pressure to the final storage pressure, accounting for the operating conditions and compressor performance characteristics. The resulting expression for the compressor rated power is given by:
The specific energy required to compress 1 kg of hydrogen to 350 bar, , is calculated as 3.4 kWh/kg using the Peng–Robinson equation of state to capture real-gas effects. After compression, hydrogen is transferred from the storage tank to specialized high-pressure tanks designed for fuel cell vehicles, providing sustainable and low-carbon transportation fuel.
Hydrogen production is also subject to specific operational constraints. In particular, production is not allowed when electricity is drawn from the national grid, in order to ensure that only “green” hydrogen is produced. Consequently, for hydrogen to be generated exclusively from direct renewable electricity, the following condition must be satisfied:
where represents the power drawn from the grid at time , and is the power supplied to the PEM electrolyzer at time . Equation (23) ensures that, at each time step, at least one of these two variables is zero, effectively preventing instances in which electricity from the grid is used for hydrogen production. This, however, constitutes a nonlinear constraint.
An alternative, linearized formulation can be obtained by introducing a binary variable, , and the following set of linear constraints:
Here, is a sufficiently large constant representing the upper bound of the power variables. The binary variables enforce the mutual exclusivity between grid consumption and electrolyzer operation, thus ensuring that hydrogen is produced only from renewable electricity while preserving the linearity of the optimization problem.
2.1.5. Economic Model
The optimal economic performance of the system is achieved by minimizing an approximate total annual cost [19,27]:
where is the capital charge factor, denotes the real interest rate, and represents the lifetime of the project. In the first term of Equation (26), corresponds to the unit equipment cost (in ) and is the rated power of each equipment unit. The product of these two terms represents the purchase cost of each component within the smart grid. Additionally, is the lifetime factor, and is the installation factor for each equipment type, accounting for additional costs incurred during installation and expressed as a percentage of the equipment purchase cost [20,28]. The index denotes each equipment element, with W representing wind turbines, S the photovoltaic system, B the battery bank, E the electrolyzer, C the compressor, and T the hydrogen storage tank.
The second term in Equation (26) corresponds to the maintenance cost of the system’s equipment, calculated as a percentage of the purchase cost, where denotes the maintenance factor. The third term accounts for expenses associated with electricity supplied by the grid, with representing the unit cost of grid electricity (in ) and the power drawn from the grid.
The last term in Equation (26) represents the revenue generated from the sale of the produced hydrogen and oxygen. Here, and denote the average hydrogen (kg H2/h) and oxygen (kg O2/h) production, respectively, while and represent their respective selling prices (). The mass of oxygen produced and available for sale can be calculated based on the stoichiometry of water electrolysis.
The lifetime factor, , accounts for the cost of replacing equipment at the end of its operational lifespan. If the equipment’s lifetime exceeds that of the project, no replacement is required, and therefore . However, if the equipment’s lifespan is shorter than the project duration, replacement becomes necessary. In such cases, is calculated using the following expression [20]:
where is the real interest rate, is the lifetime of each equipment element (in y) and is the lifetime of the project (in y).
Equation (28) can incorporate a coefficient in the numerator representing the expected annual reduction in the purchase cost of a specific equipment component due to technological maturation. This cost reduction is modeled using the learning curve concept associated with emerging energy technologies [29].
2.1.6. Carbon Emissions
The total CO2 emissions are calculated by multiplying the operating power of the system components by the CO2 emissions factor, CEF, expressed in kg CO2-equivalent per kWh. To obtain the net CO2 emissions, it is also necessary to account for the emissions avoided by substituting conventional fossil fuels with hydrogen in the transportation sector. For this purpose, reference consumption values are adopted based on the performance of the Hyundai Nexo. Specifically, an average diesel consumption of 5.333 L per 100 km and a hydrogen consumption of 1 kg H2 per 100 km are used as representative values for conventional and hydrogen-powered vehicles, respectively [30]. Based on these assumptions, the net CO2 emissions are calculated by subtracting the avoided emissions associated with diesel consumption from the emissions generated during system operation. The resulting expression used to estimate the total CO2 emissions is given by the following equation [31]:
where CEF is the carbon emissions factor (in kg CO2-eq kWh−1), is the total annual amount of hydrogen produced and is the amount of diesel (in L/kg H2) replaced by the use of green hydrogen as an alternative transportation fuel.
2.1.7. Discrete Equipment Rated Capacities
Assuming continuous values for the rated capacity of system components is convenient from a mathematical perspective, as it simplifies the formulation of the optimization problem. However, this assumption is not realistic from a practical engineering standpoint, since energy system equipment is typically manufactured and sold in standardized capacity sizes. Technologies such as photovoltaic inverters, wind turbines, battery modules, and PEM electrolyzers are available only in specific rated capacities determined by manufacturers. Consequently, treating these capacities as continuous variables may lead to optimal solutions that correspond to equipment sizes that do not exist in the market and therefore cannot be implemented in practice at a reasonable cost.
A more practically relevant approach consists of using discrete values for the rated power of each equipment unit, corresponding to specifications available in the market. By restricting the optimization to discrete capacity values that reflect commercially available equipment sizes, the resulting system design becomes more realistic and directly implementable, while still enabling the identification of cost-optimal configurations. In this framework, the rated power of each system component is defined as a discrete parameter within specified minimum and maximum bounds, from which the optimization algorithm selects the most appropriate value.
For the photovoltaic panels, wind turbines, battery system, and PEM electrolyzer, it is assumed that each equipment type is available in , discrete capacity sizes . Among these available sizes, only one capacity option can be selected for each equipment type in the optimal solution.
To model this selection process, binary decision variables are introduced, where
The rated capacity of each equipment unit is then expressed as [20]
To ensure that only one discrete capacity value is selected for each equipment type, the following constraint is imposed:
This formulation allows the optimization model to select the most appropriate equipment size from commercially available options while preserving the linear structure of the mixed-integer linear programming problem.
2.1.8. Complete Mathematical Formulation
The proposed mathematical programming formulation consists of linear equality and inequality constraints. Specifically, the model includes linear equality constraints and linear inequality constraints, where denotes the number of discrete time steps considered. Together with the linear objective function (Equations (26) and (29), or any linear combination thereof), these constraints define a mixed-integer linear programming problem.
The model contains continuous variables and approximately binary variables. These dimensions correspond to a large-scale MILP problem. When the model is applied to a full-year analysis ( h), the resulting problem includes 35 040 equality constraints, 122 640 inequality constraints, 87 605 continuous variables, and approximately 17 520 binary variables. Although these numbers are relatively large, they remain within the computational capabilities of modern optimization solvers [19]. The resulting MILP model can therefore be efficiently solved using state-of-the-art commercial optimization software, such as CPLEX Optimization and the Gurobi Optimizer, which are widely used for large-scale energy system optimization problems [20,32].
2.1.9. Core Modelling Assumptions
To establish a tractable optimization framework, the following operational and thermodynamic assumptions are adopted:
- Thermodynamics & Storage: Hydrogen gas in the buffer tank is modeled at an isothermal state (T = 298.15 K) using the second virial coefficient real-gas equation of state up to 80 bar.
- Equipment & Operations: System efficiencies (, ) and specific compressor power () are assumed constant across hourly time steps.
- Grid & Market: Grid connection is bidirectional for power import, but electrolyzer operation is restricted exclusively to direct local renewable generation. Carbon offsets are modeled on linear replacement of conventional transportation fuels.
3. Results
3.1. Presentation of the Case Study for a Public Building in Patras, Greece
An application of the proposed mathematical formulation for the optimal design and operation of a smart grid is implemented for the Chemical Engineering Department building at the University of Patras (Figure 3), located in the northwestern part of the Peloponnese, Greece. The building consists of four floors with a total area of approximately 9000 m2. The optimal modeling relies on site-specific renewable energy and load data, including solar irradiance () and wind speed measurements () over an entire year [33,34]. These data represent the potential power that could be harnessed from on-site renewable energy sources. In addition, the building’s annual hourly electricity demand () is incorporated to determine the required energy supply. Collectively, the dataset spans 8760 h, with the three input data types—wind speed, solar irradiance, and electricity demand—serving as the basis for the optimization study.
Figure 3.
Main building of the Chemical Engineering Department.
The dataset employed in this study provides not only hourly power demand but also solar irradiation and wind availability obtained from the Atmospheric Physics Laboratory at the Physics Department of the University of Patras [33,34].
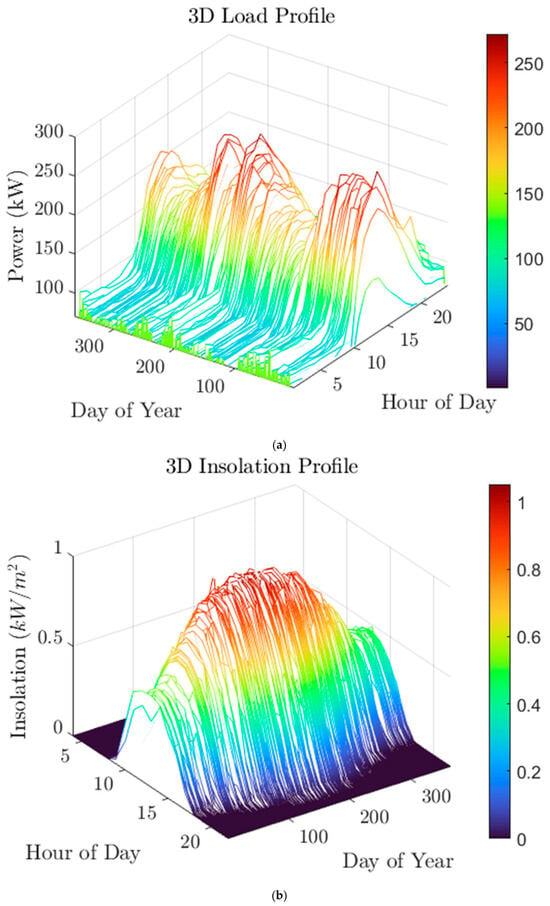
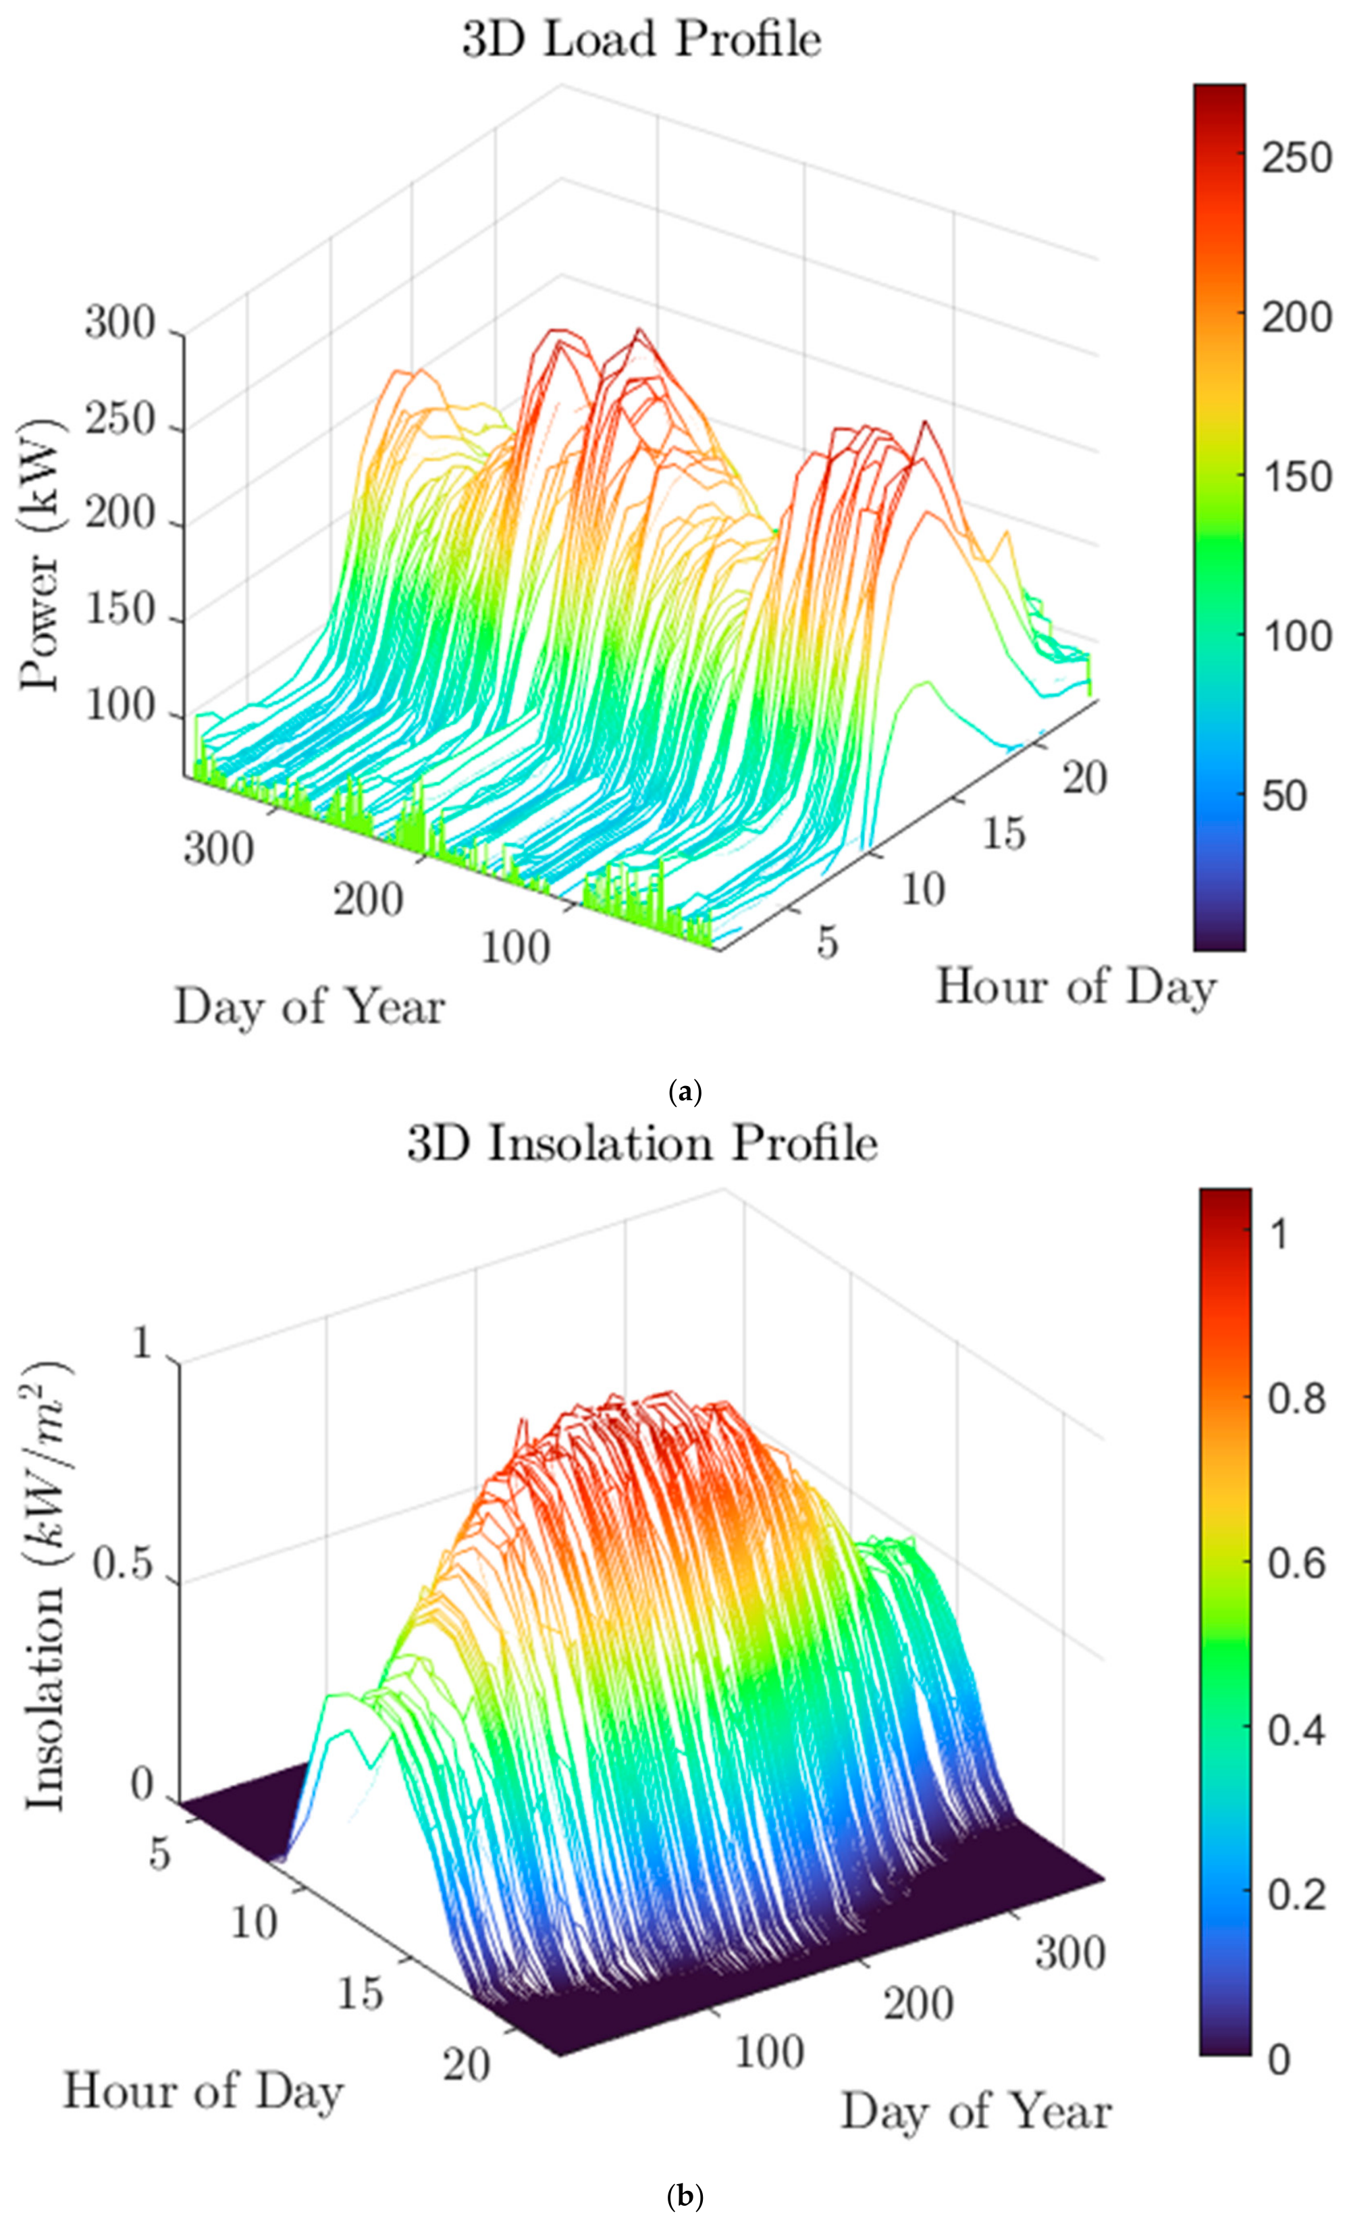
Figure 4a illustrates the daily power demand profile of the Chemical Engineering building over the course of a year, highlighting its temporal energy consumption patterns. The building’s power demand ranges from 49 kW to 271 kW throughout the year. On a typical day, demand begins at approximately 60 kW in the early morning, remains relatively stable until 08:00 (local time), and then gradually increases to a peak of around 150 kW by 13:00. Thereafter, it declines progressively, returning to roughly 60 kW by 22:00.
Figure 4.
(a) Daily power demand of the building. (b) Solar irradiance.
Regarding solar irradiance, as shown in Figure 4b, no solar radiation is observed before 05:00. Irradiation then rises steadily, reaching an average peak of 0.7 kW/m2 at 13:00 before gradually decreasing until 21:00. Overall, solar radiation varies between 0 and 1.05 kW/m2 throughout the day, reflecting the typical diurnal pattern of solar availability at the site.
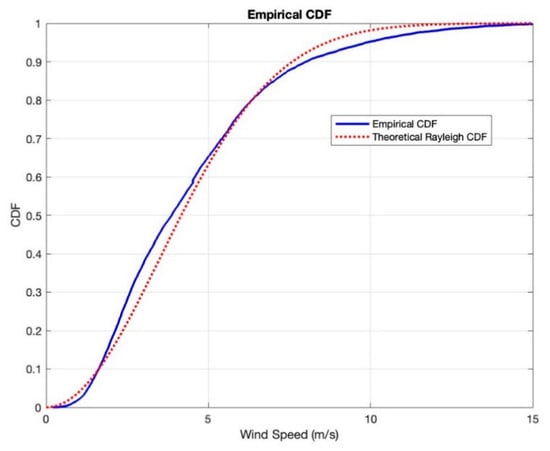
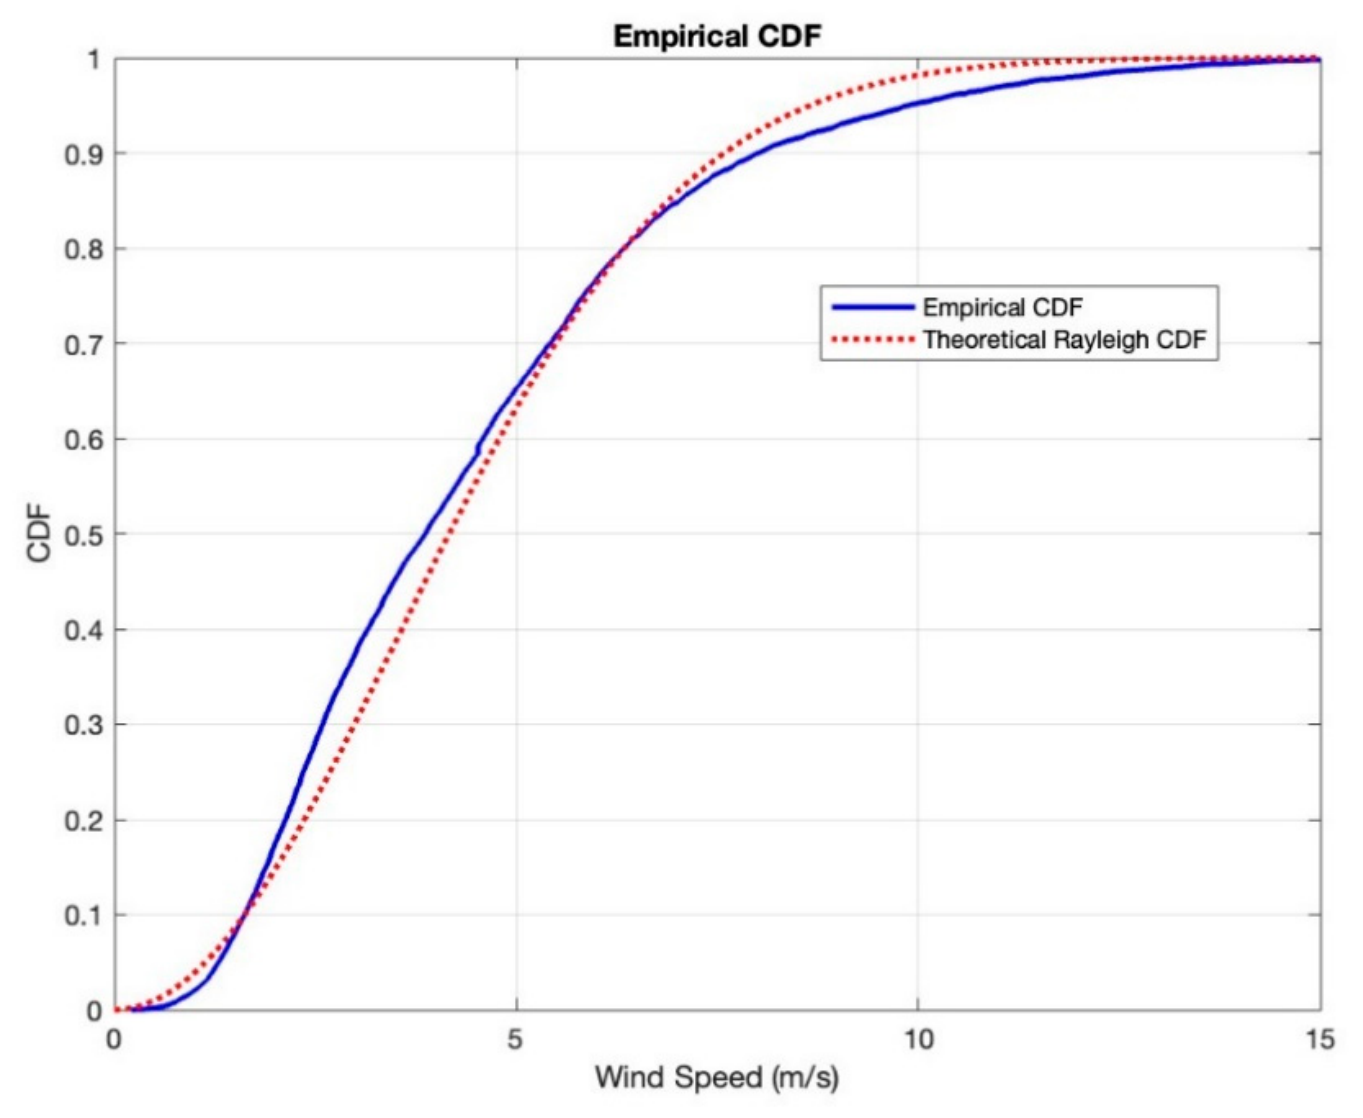
Wind turbines can generate electricity only within specific ranges of wind velocity, which can be quantified using the wind availability factor. To determine this factor, accurate wind speed data are required. In this study, the primary dataset provides hourly wind velocities for the site. To capture the temporal variability of wind speeds, the Rayleigh probability density function is employed as a theoretical model. Figure 5 compares the cumulative distribution functions of the empirical wind data and the Rayleigh model, demonstrating a high degree of correlation between the observed and modeled distributions [34].
Figure 5.
The theoretical and empirical CDF of the wind speed data for Patras, Greece.
The current total annual electricity cost for the building is estimated at 0.1323 M$/y, based on the current electricity price in Greece, which is approximately 0.15 $/kWh. When relying exclusively on the national grid for electricity supply, the building’s total carbon emissions amount to 356 t CO2-eq/y, calculated using the most recent data on the Greek electricity generation mix.
The proposed mathematical formulation is applied to the case study of the Chemical Engineering Building to evaluate the potential integration of renewable energy production systems into the building’s operation. In the first part of the analysis, the primary parameter of interest is the unit cost of grid electricity, and the objective is to minimize the total annual cost associated with electricity supply, storage, and system equipment. This provides an economic assessment of different configurations and operational strategies under realistic market conditions. In the second part, the focus shifts to the environmental impact, examining the potential for reducing carbon emissions by replacing grid electricity with renewable energy and stored hydrogen. This two-step approach enables a comprehensive evaluation of both economic and environmental performance, highlighting trade-offs between cost savings and emissions mitigation while accounting for technical and operational constraints.
Table 1 and Table 2 provide a comprehensive summary of all parameters considered in the design and sizing of the renewable energy systems.
Table 1.
Technical parameters of the hybrid renewable energy production system.
Table 2.
Economic parameters ([16,20,22,24,31,35,36,37]).
3.2. Results and Discussion
The project lifetime is assumed to be 20 years, with a real interest rate of 7%. The mathematical problem was implemented using the General Algebraic Modeling System (GAMS) and solved with the IBM ILOG CPLEX Optimization Studio mixed-integer programming (MIP) solver [20,38]. To solve the optimization problem, it is necessary to define the system components, provide annual hourly input data, specify the lower and upper operational bounds for each equipment unit, determine the relevant economic parameters, and formulate the objective function. Based on these inputs, the optimization software solved the MILP model, yielding the optimal value of the objective function, the optimal sizing of each system component, and the optimal hourly operating schedule for each element of the system. The computational time varies with operational complexity; however, for a target optimality gap of 0.1%, execution times typically range from a few minutes to one hour.
3.2.1. Minimization of Annual Cost
The problem formulation was investigated over a wide range of grid electricity prices, varying from 0.1 to 0.5 $/kWh, to capture the impact of energy cost uncertainty on optimal system design and operation. Representative solutions for three indicative price levels are summarized in Table 3.
Table 3.
Representative solutions summary for three cases of grid electricity unit cost and comparison with current operation and minimum CO2 emission solution.
At the lower bound of 0.1 $/kWh, grid electricity remains highly competitive compared to local renewable generation technologies. As a result, optimization favors minimal capital investment, leading to the installation of only a small-scale wind turbine (100 kW). No photovoltaic capacity, battery storage, or hydrogen production infrastructure is deployed under these conditions. Despite the limited system configuration, a modest reduction in CO2 emissions of approximately 18.7% is achieved compared to the baseline case. This reduction is primarily attributed to partial substitution of grid electricity with wind-generated power. The total annualized cost (TAC) remains low (85,380$), reflecting the economic attractiveness of grid reliance when electricity prices are minimal.
As the grid electricity price increases to 0.3 $/kWh, a transition in the optimal system configuration is observed. The model begins to favor diversification of energy sources, with the introduction of both wind (200 kW) and PV (180 kW) capacity. This indicates that renewable technologies become increasingly cost-competitive at intermediate electricity prices. Interestingly, no battery storage or hydrogen production is selected at this stage, suggesting that the variability of renewable generation can still be accommodated without additional flexibility measures. The CO2 emissions are significantly reduced to 181,255 kg/y, corresponding to nearly a 50% reduction relative to the reference case. However, this environmental benefit comes at a substantially higher TAC (181,213 $), highlighting the trade-off between cost and emissions.
At the highest electricity price of 0.5 $/kWh, the system undergoes a complete transformation toward a highly integrated and low-carbon configuration. All available technologies are deployed, including a large wind turbine (400 kW), substantial PV capacity (240 kW), battery storage (50 kWh), and a 200 kW PEM electrolyzer. The inclusion of battery storage reflects the need to manage intermittency and enhance system flexibility under high renewable penetration. Moreover, the integration of the electrolyzer enables the conversion of excess electricity into hydrogen, resulting in an annual production of approximately 3 t of hydrogen. This not only provides an additional energy vector but also contributes to improved system efficiency and potential revenue streams. Under these conditions, CO2 emissions are reduced dramatically to 97,210 kg/y, corresponding to a reduction of nearly 75%. However, this comes at the expense of the highest TAC (243,919 $), indicating that deep decarbonization requires significant capital investment and higher overall system costs.
Overall, the results clearly demonstrate that the unit cost of grid electricity is a key driver in determining both the optimal system design and its environmental performance. Low electricity prices discourage investment in renewable and storage technologies, while higher prices incentivize the deployment of a diversified, low-carbon energy system. The findings also highlight a nonlinear relationship between cost and emissions reduction: substantial environmental benefits can be achieved at intermediate price levels, but achieving near-complete decarbonization requires disproportionately higher investments and system complexity.
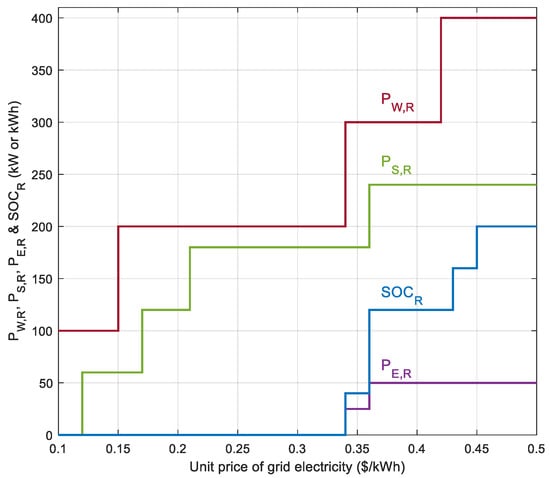
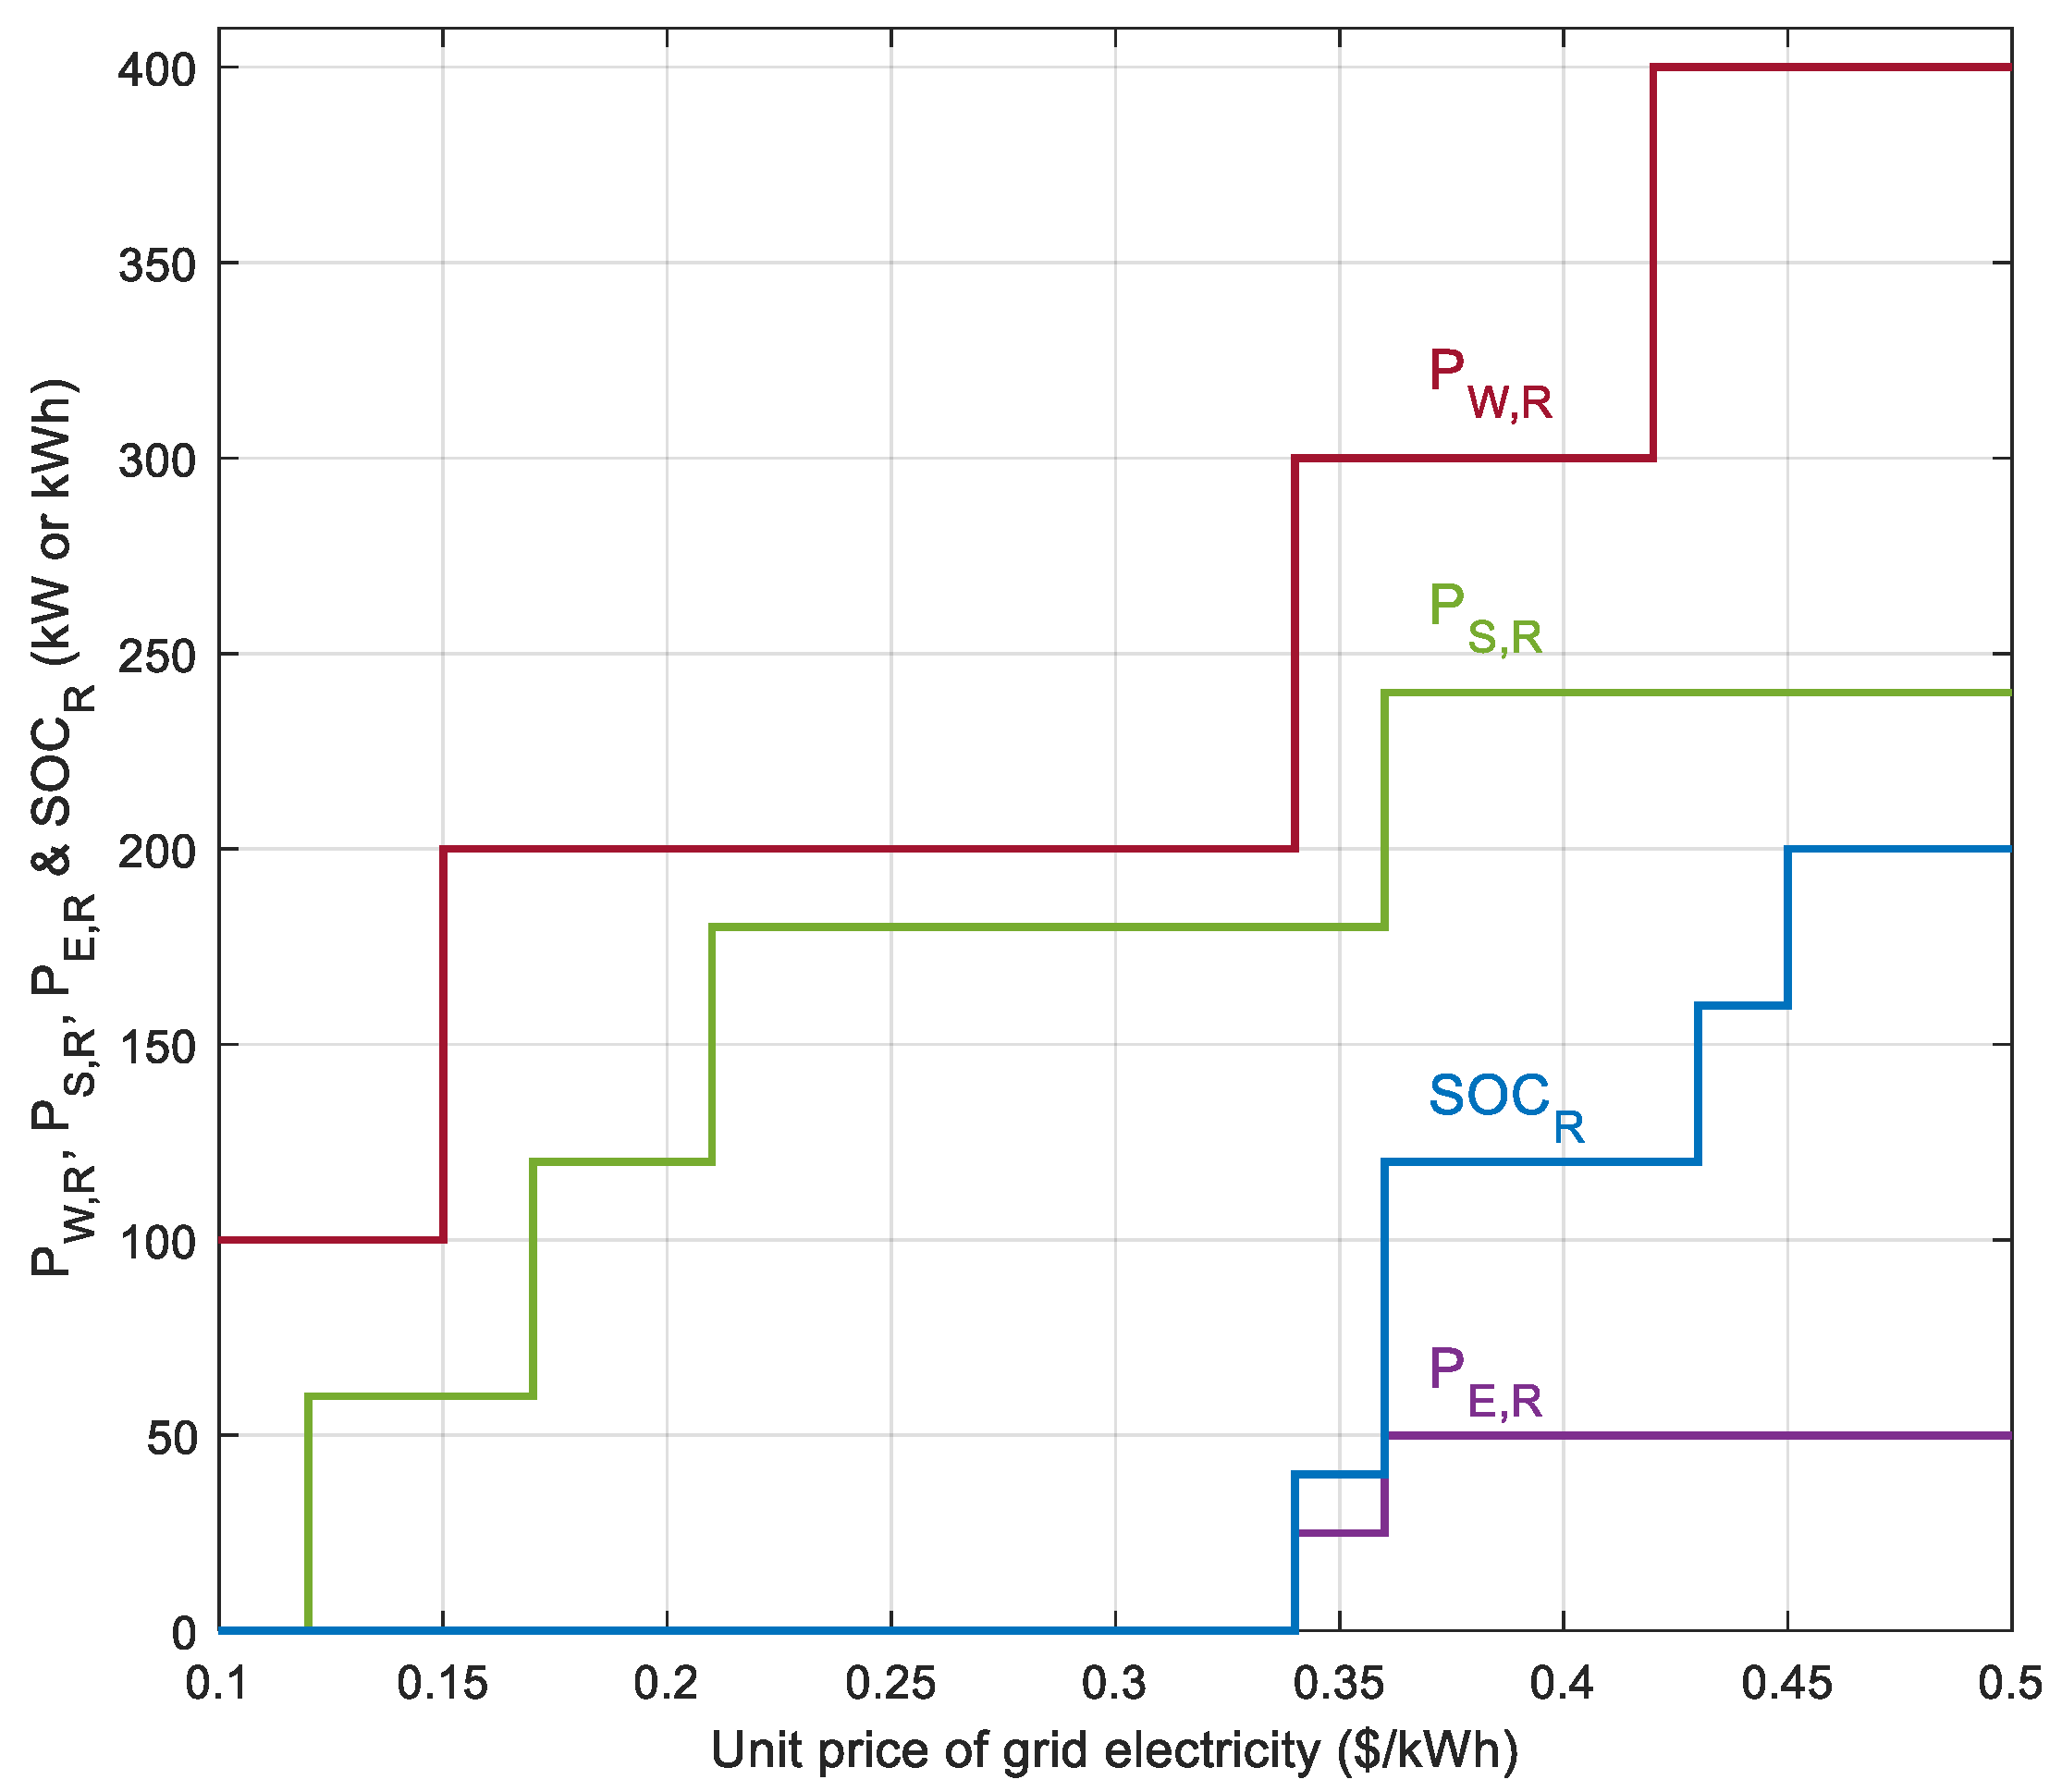
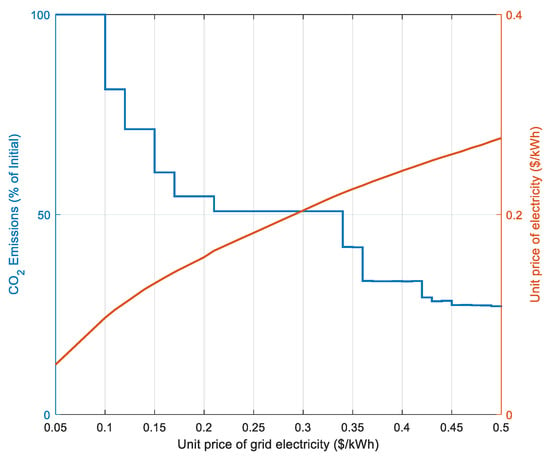
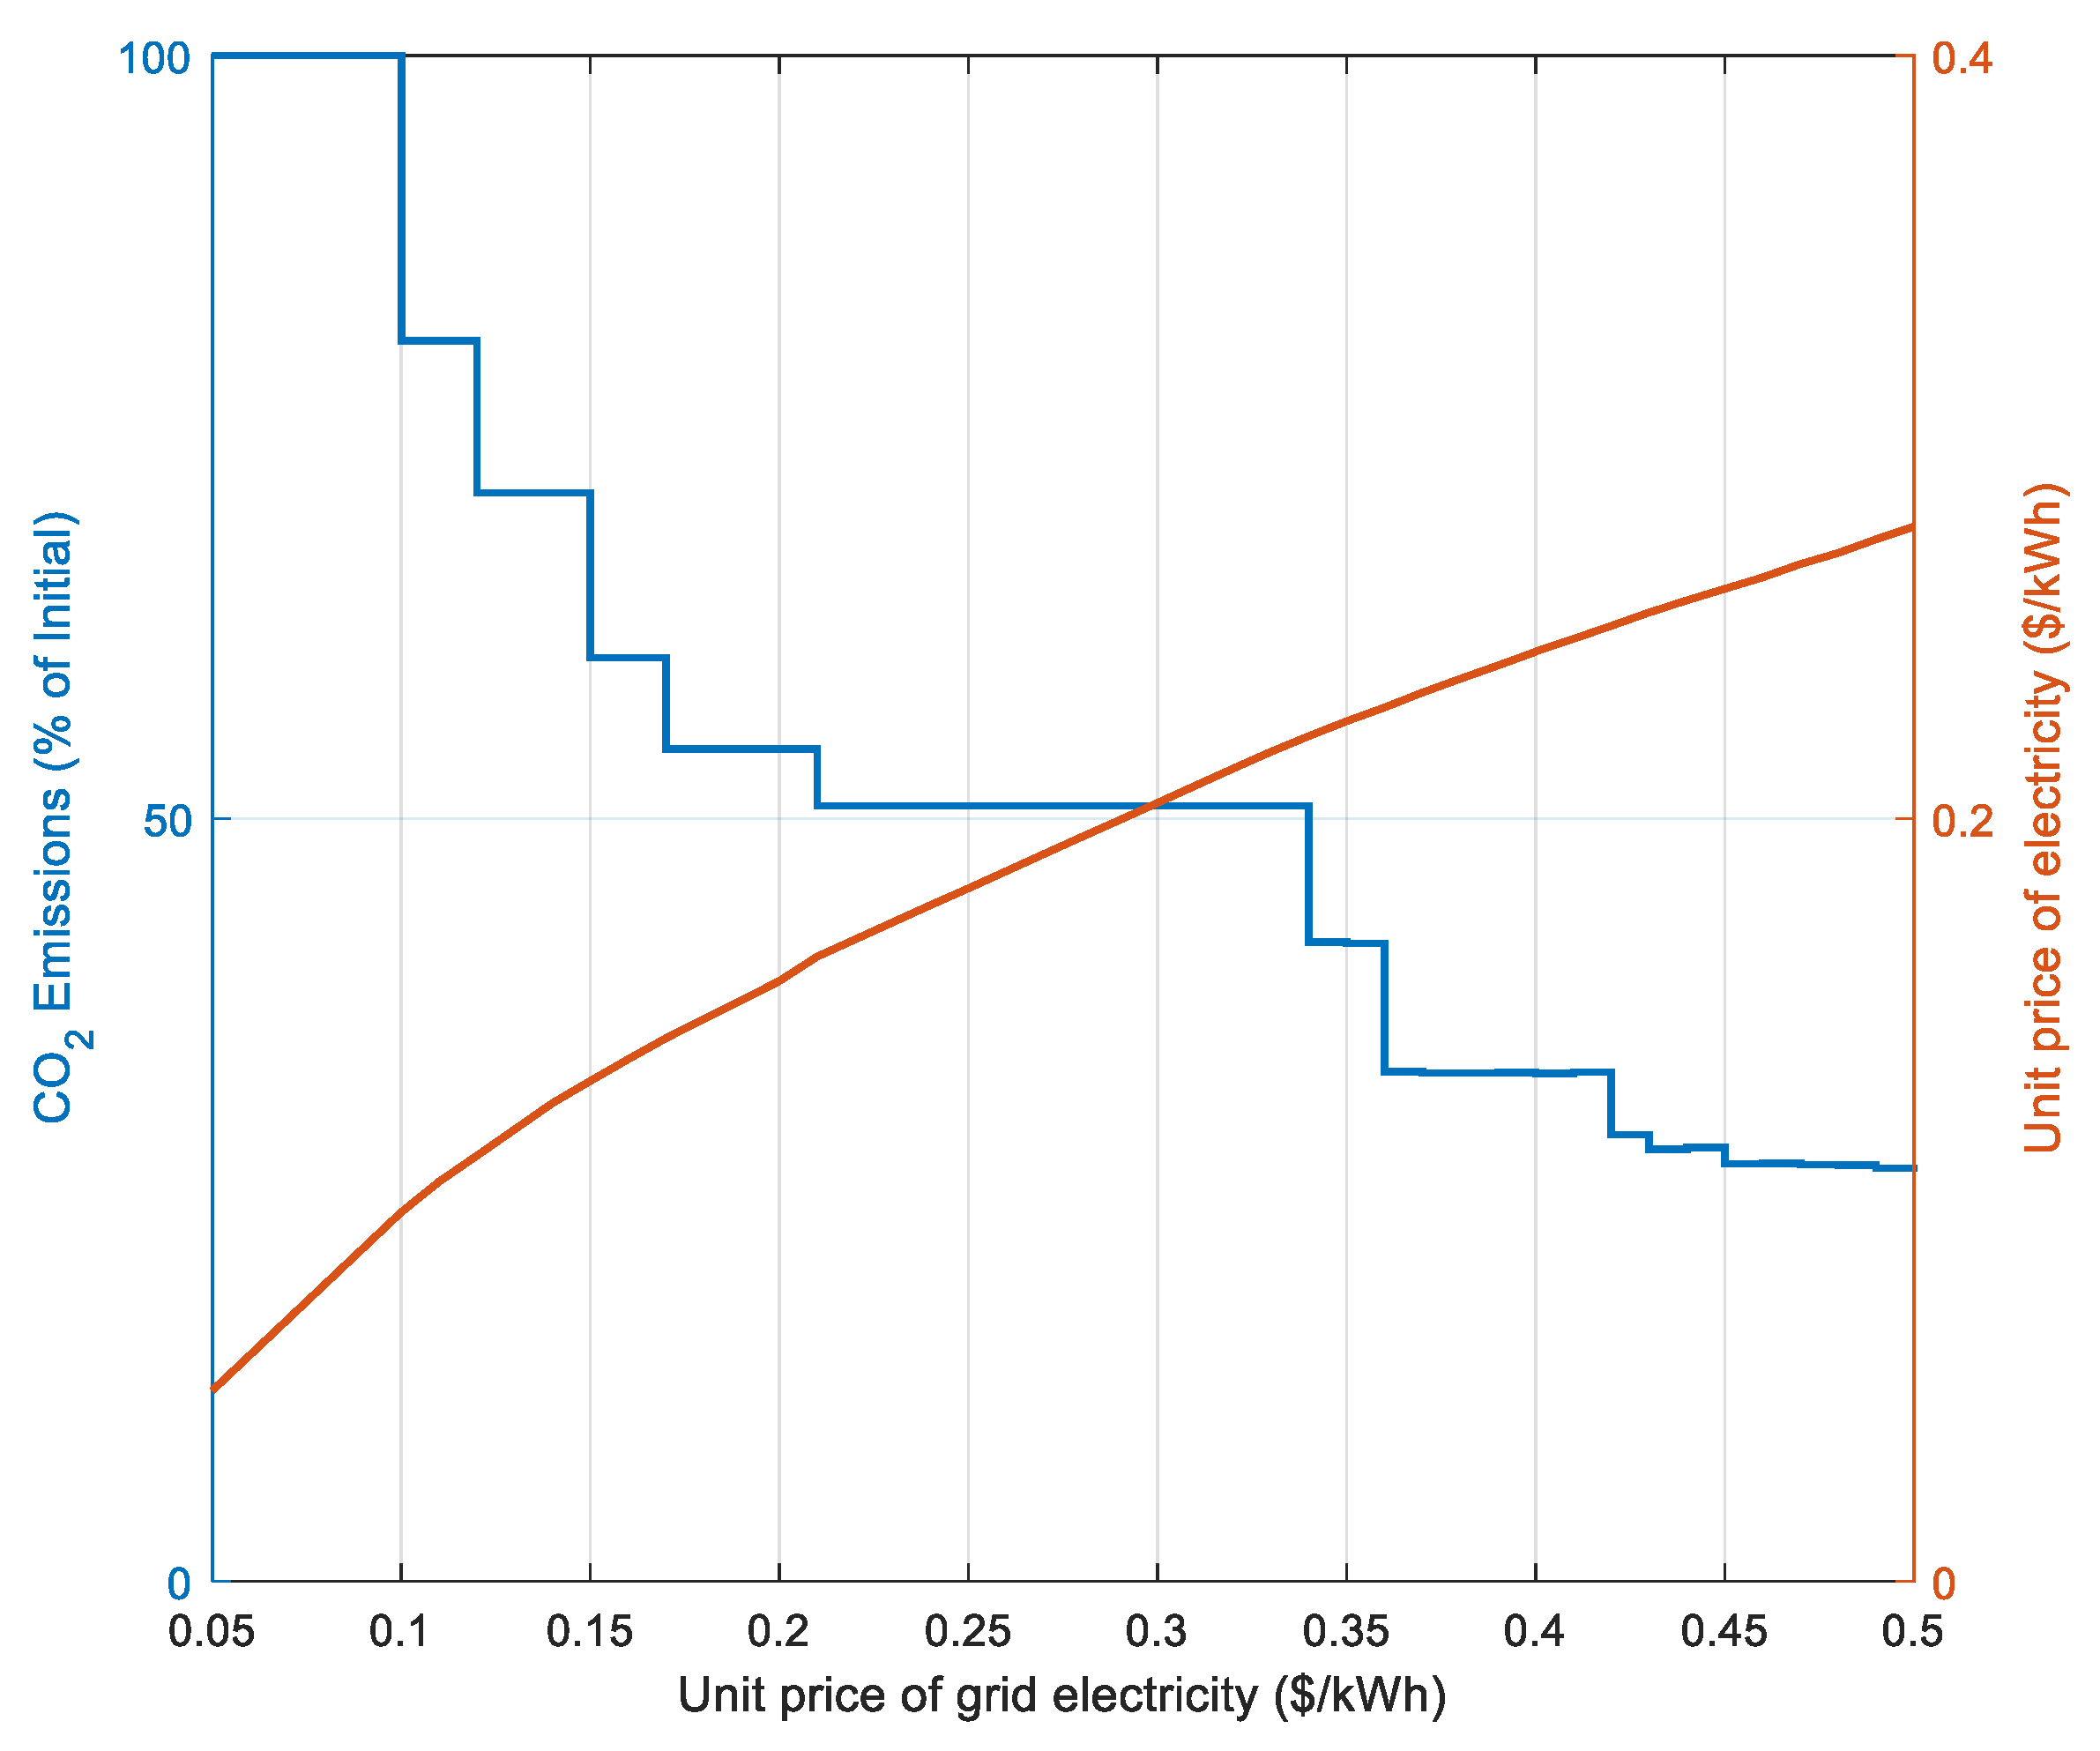
A more comprehensive view of the transformation of the cost-optimal system configuration as a function of the grid electricity unit cost is provided in Figure 6 and Figure 7. Specifically, Figure 6 illustrates the evolution of the installed (rated) capacities of the main system components, while Figure 7 presents the corresponding reduction in CO2 emissions relative to the reference case, where all electricity demand is satisfied exclusively by grid supply. In addition, Figure 7 includes the evolution of the actual (effective) unit cost of electricity delivered by the optimized hybrid system.
Figure 6.
Transition in the optimal system configuration as a function of the price of grid electricity.
Figure 7.
CO2 emissions reduction relative to current case and real unit cost of electricity as a function of the price of grid electricity.
As shown in Figure 6, the system undergoes a gradual but non-linear transition as the grid electricity price increases. At low price levels, the optimal solution is dominated by grid electricity, with only marginal integration of renewable capacity—primarily wind power—due to its relatively favorable cost-performance ratio. However, as the grid electricity price rises, the model increasingly favors investment in local generation assets. Wind capacity expands first, followed by the progressive adoption of photovoltaic systems, indicating a diversification of renewable sources to exploit complementary generation profiles. At higher price levels, the system further incorporates energy storage and hydrogen production technologies, reflecting the growing importance of flexibility, energy shifting, and sector coupling in achieving cost efficiency under high renewable penetration.
Figure 7 reveals a strong correlation between increasing grid electricity prices and CO2 emissions reduction. Initially, emissions decrease modestly, but beyond a certain price threshold, a more pronounced decline is observed, corresponding to the accelerated deployment of renewable energy technologies. At the highest grid price levels, the system achieves deep decarbonization, approaching reductions on the order of 70–75%, as grid dependency is significantly curtailed.
A particularly important observation from Figure 7 is the divergence between the actual unit cost of electricity and the grid electricity price. At low grid electricity prices, the actual cost closely tracks the grid price, indicating that the system relies heavily on grid imports and that local generation plays a minor role. However, as the grid electricity price increases, the actual unit cost grows at a much slower rate, leading to a widening gap between the two. This behavior reflects the increasing contribution of capital-intensive but low-operating-cost renewable technologies, which effectively hedge against high grid electricity prices.
This divergence highlights a key economic insight: although the total annualized cost of the system increases with higher penetration of renewables and supporting technologies, the effective cost of electricity becomes progressively less sensitive to grid price volatility. Consequently, significant economic advantages emerge in high-price scenarios, where the hybrid system mitigates exposure to expensive grid electricity. These results underscore the dual benefit of investing in renewable-based hybrid systems, namely enhanced environmental performance and improved long-term economic resilience against rising electricity prices.
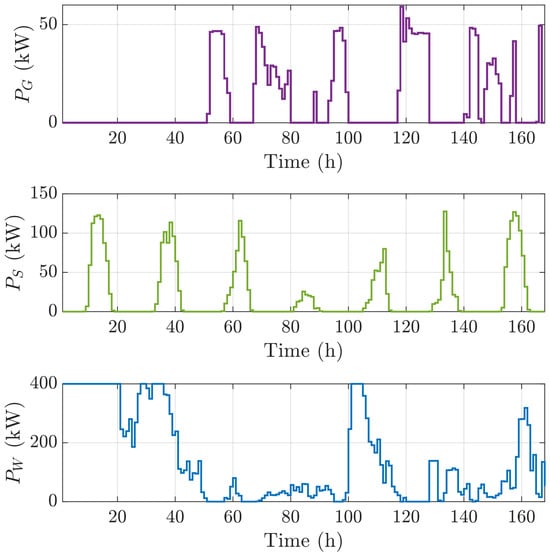
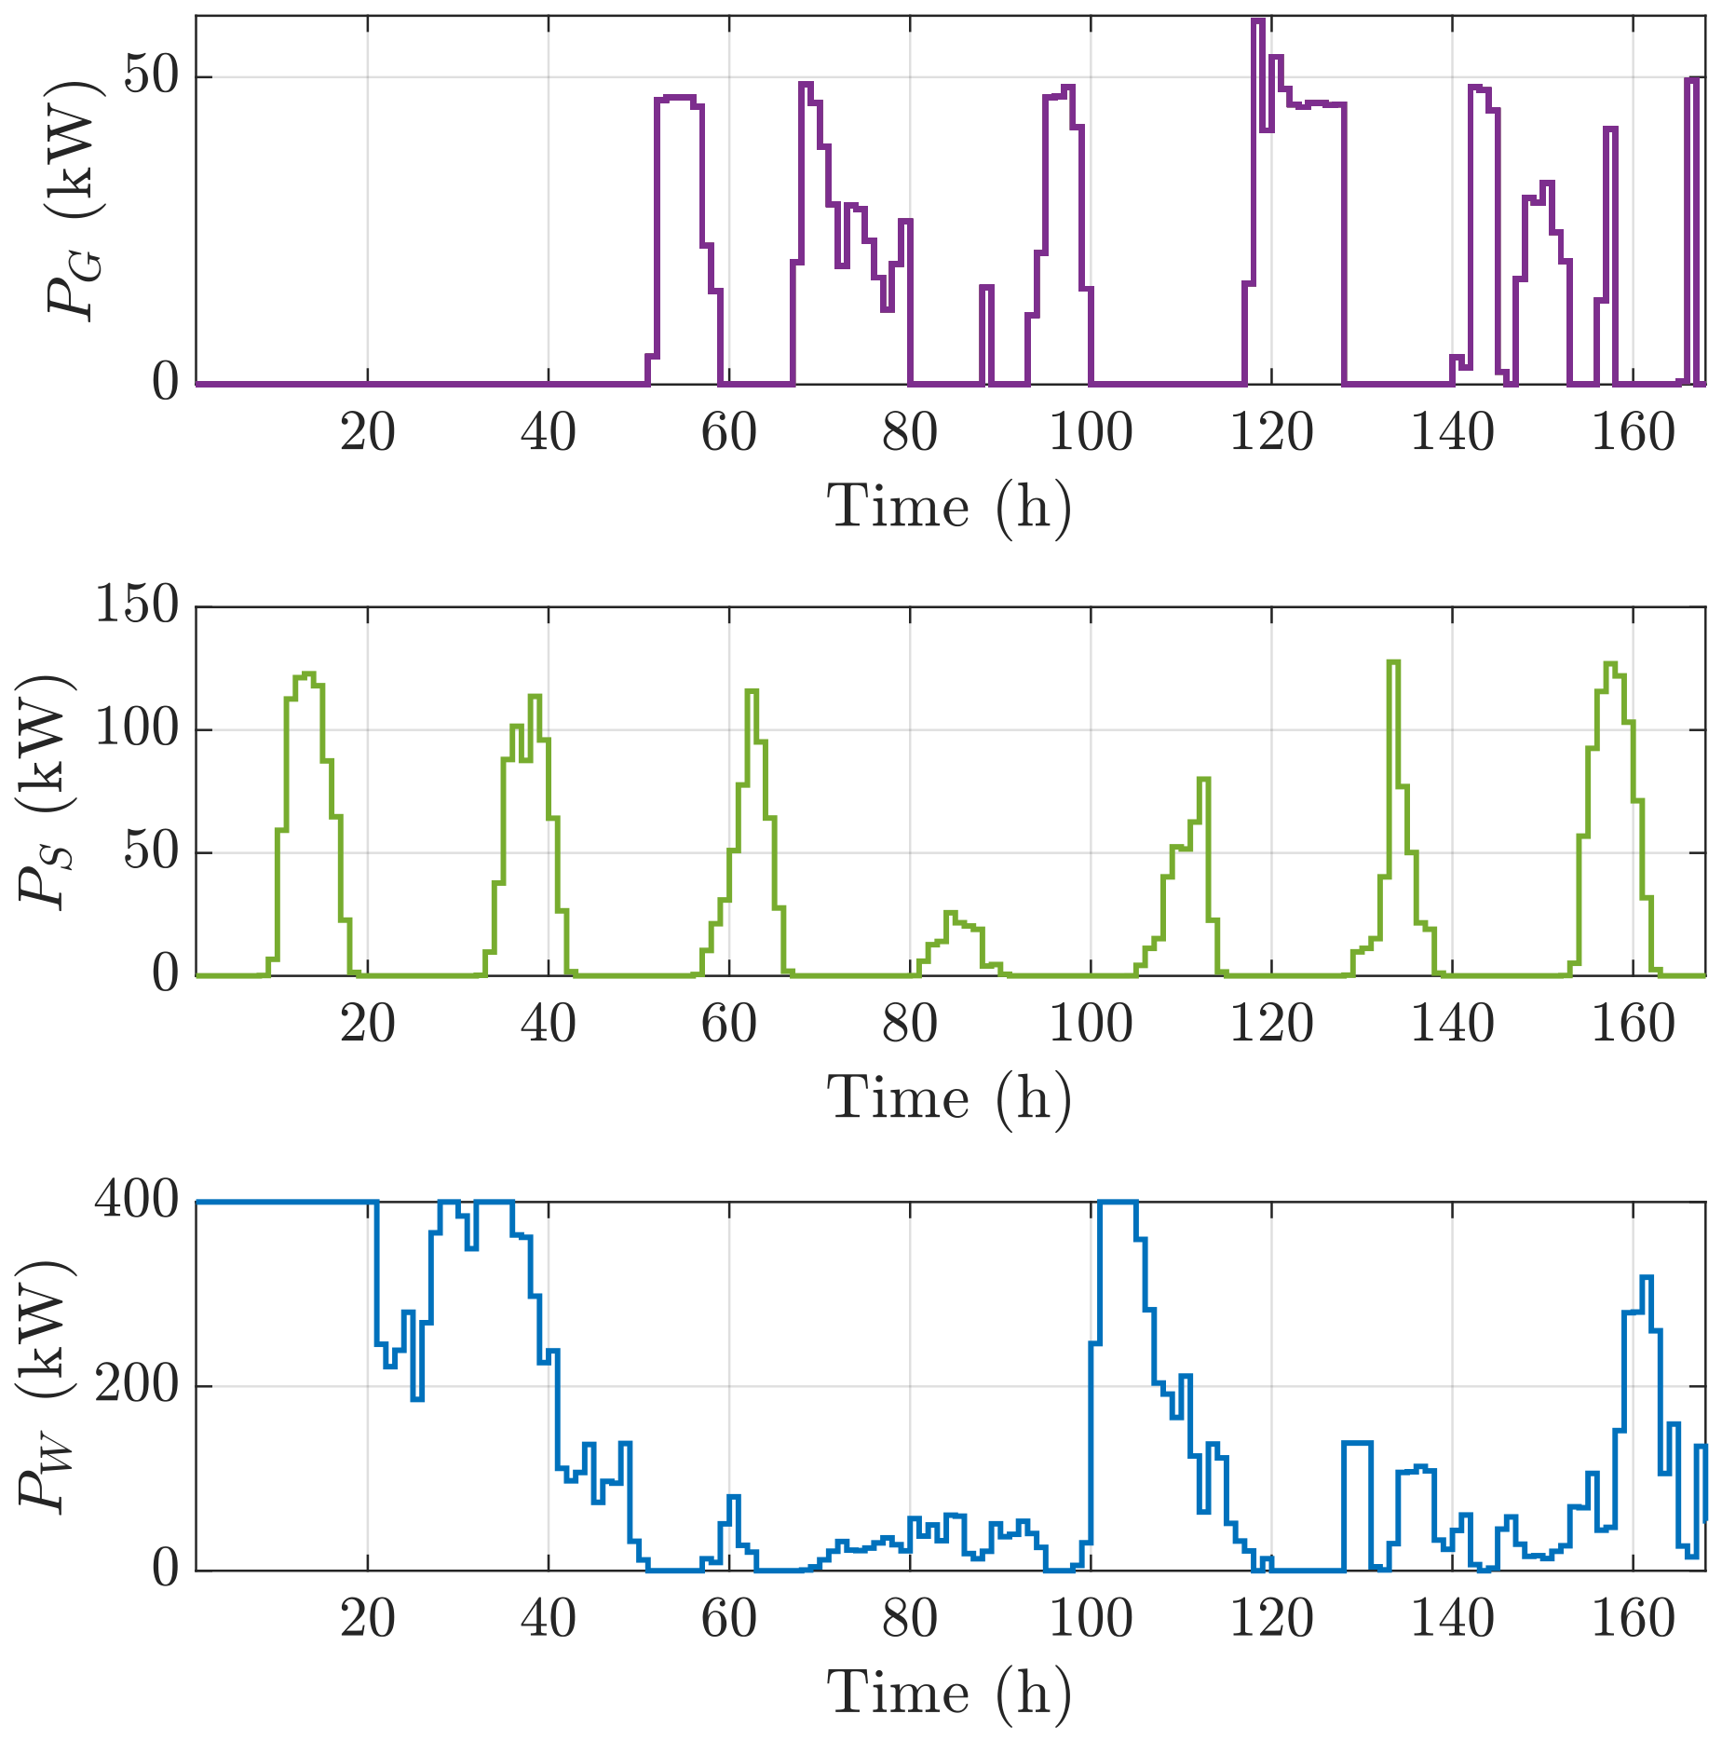
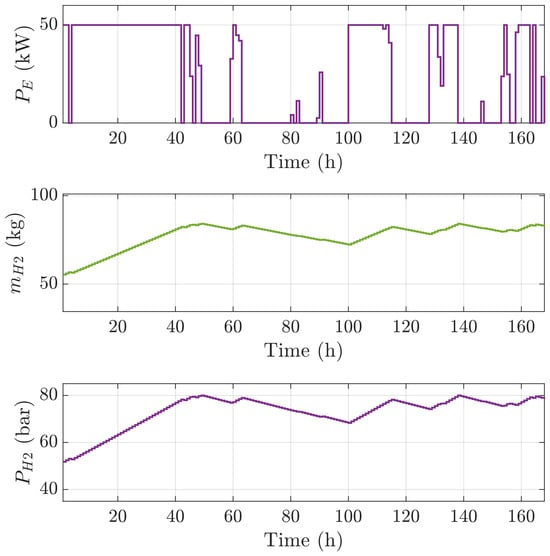
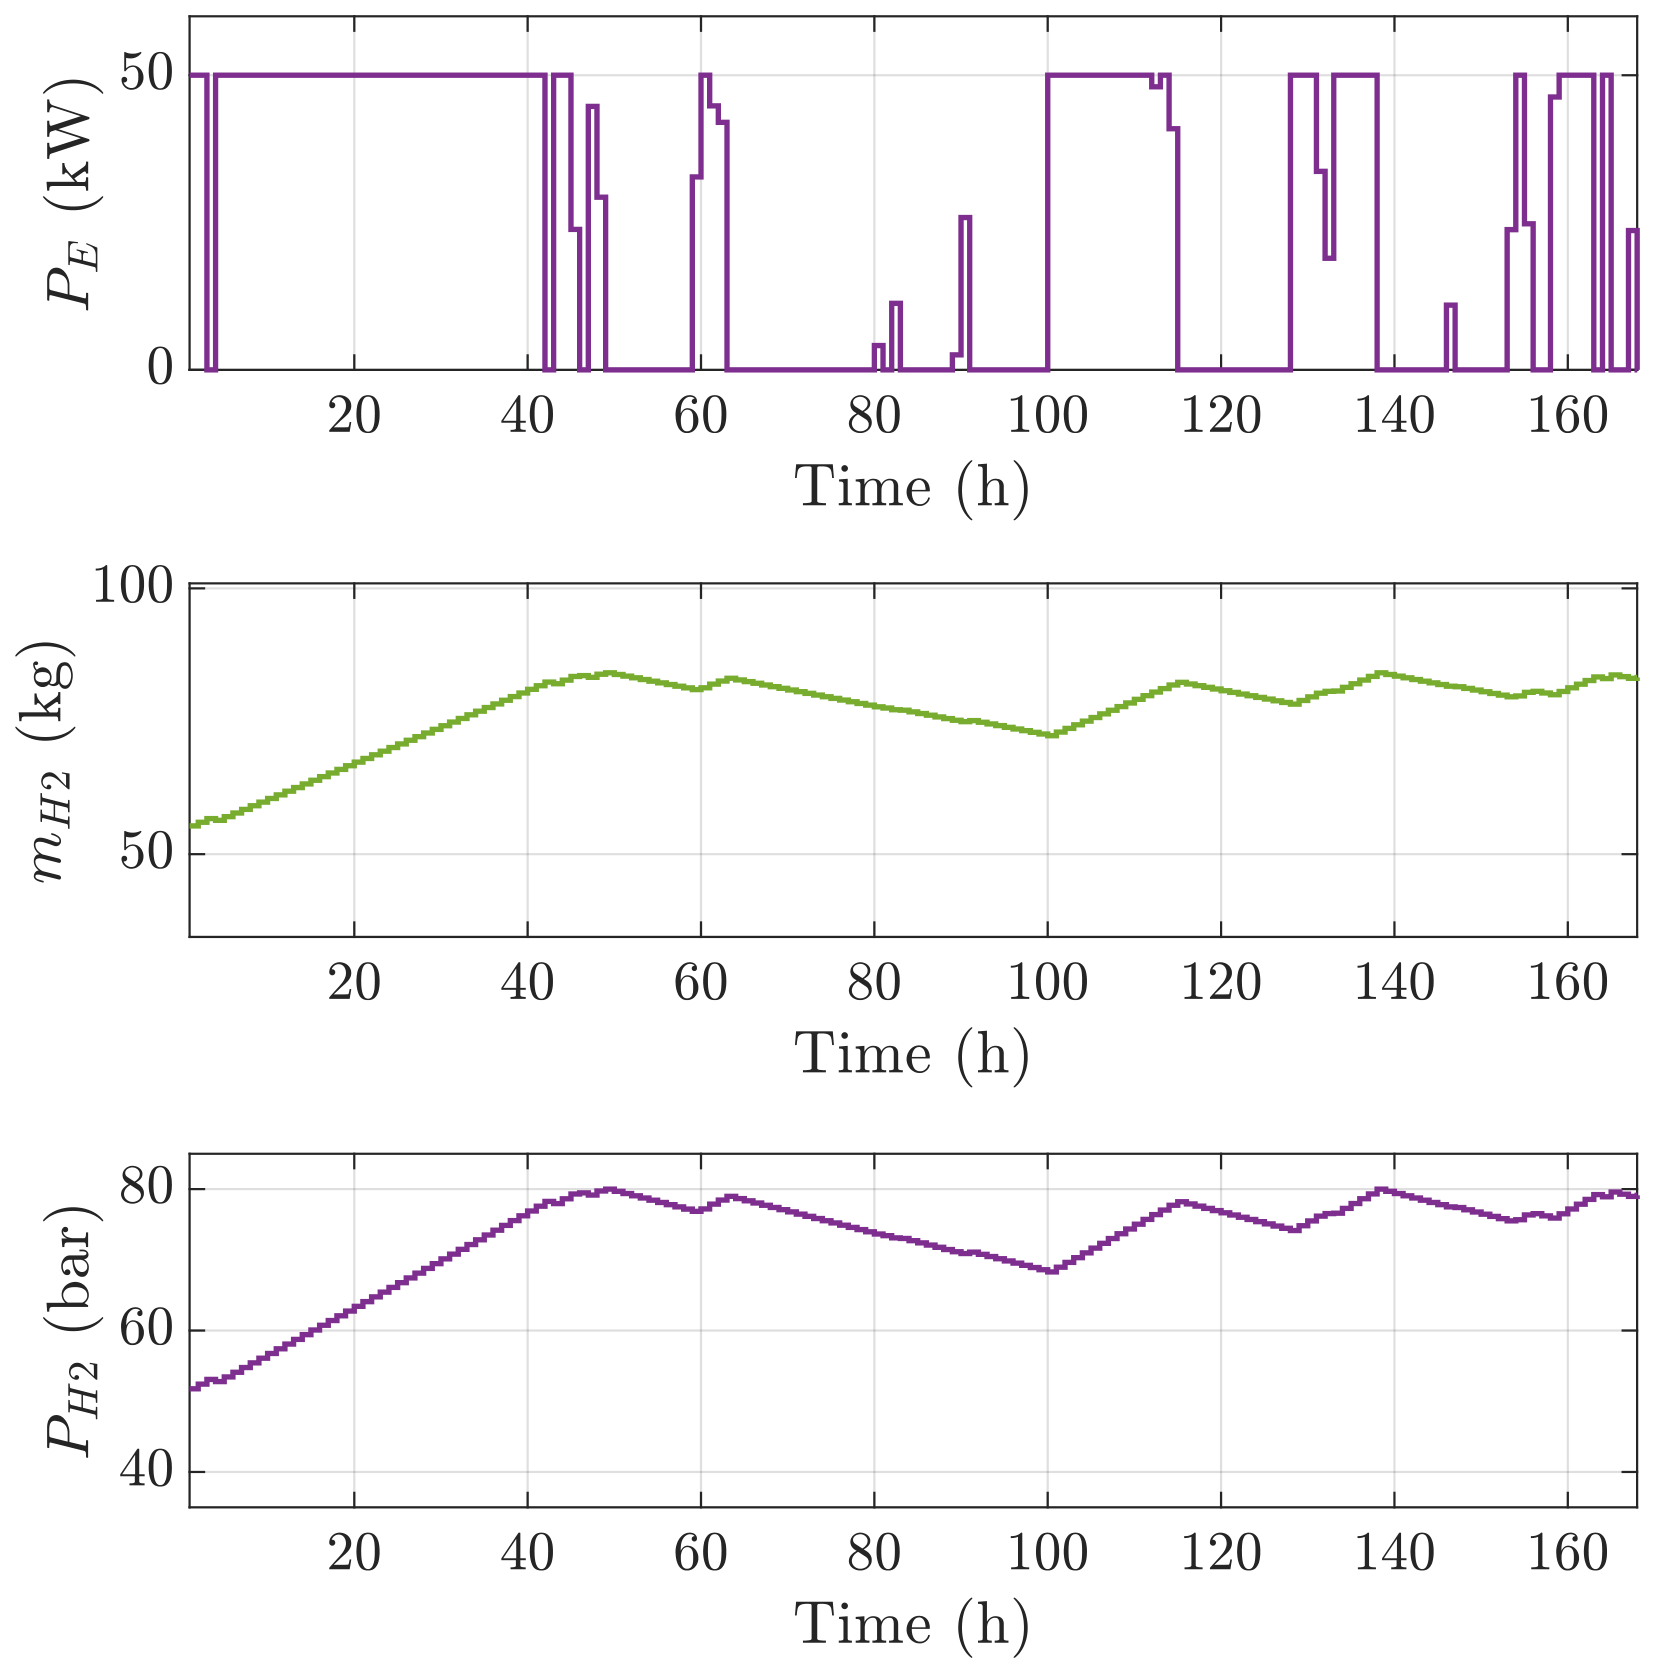
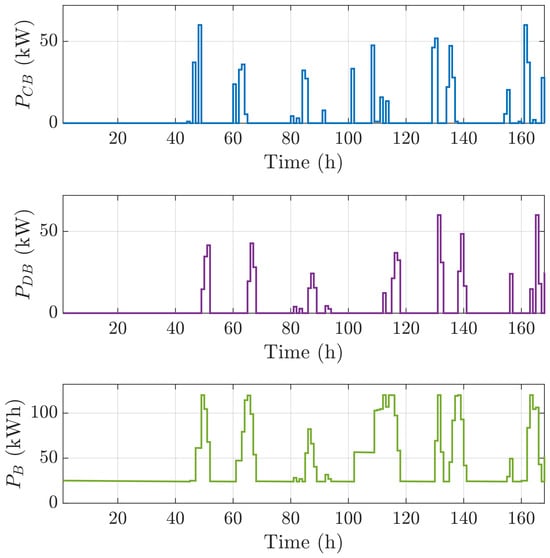
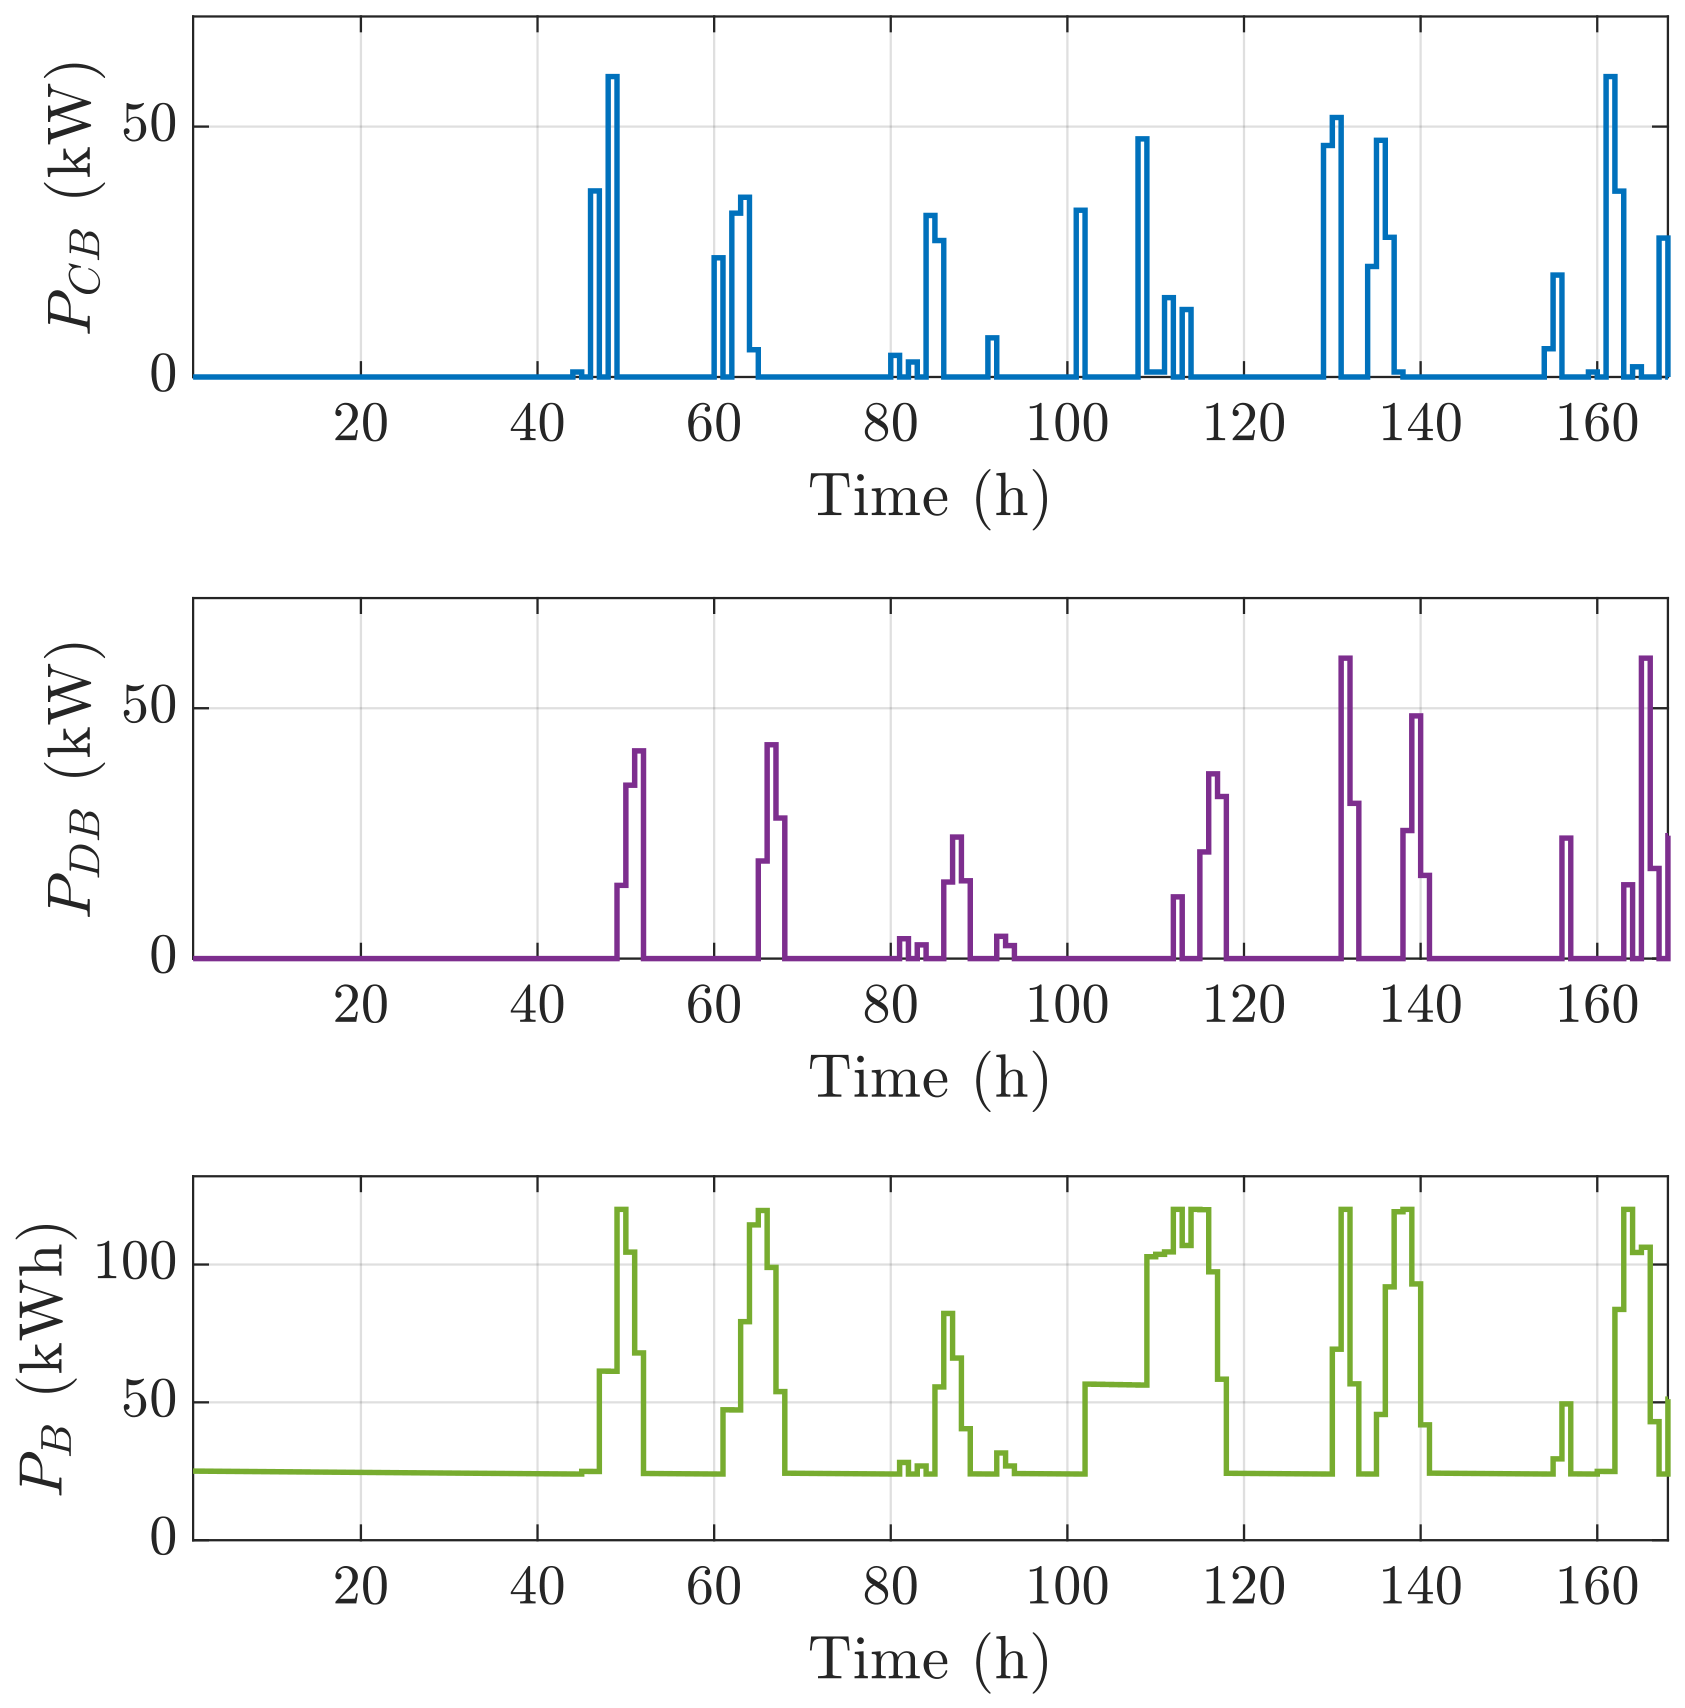
Figure 8, Figure 9 and Figure 10 provide a detailed representation of the operational behavior of the integrated energy system over the first week of the operation, offering valuable insight into the dynamic interaction among its individual components. These figures correspond to the cost optimal solution for a grid electricity price of 0.4 $ kWh−1.
Figure 8.
Variation in the electrical power of the grid, the power generation from the wind turbine and the solar photovoltaic panels for the first week of operation.
Figure 9.
Operation of the hydrogen production system during the first week of operation.
Figure 10.
Operation of the battery during the first week of the operation.
More specifically, Figure 8 illustrates the temporal variation in the electrical power flows within the system, including the power imported from the grid, as well as the electricity generated by the wind turbine and the photovoltaic panels. This figure highlights the variability of renewable energy production and its contribution to meeting the building’s demand, as well as the complementary role of the grid in balancing supply and demand.
Figure 9 focuses on the operation of the hydrogen production and storage subsystem. It presents the power consumption of the electrolyzer, the corresponding hydrogen production rates as reflected in the stored mass, and the pressure variation within the storage tank. These results demonstrate the system’s ability to convert excess renewable energy into hydrogen and store it for later use, while also illustrating the temporal coupling between energy availability and hydrogen generation.
Finally, Figure 10 summarizes the performance of the battery energy storage system, including the charging and discharging power profiles, as well as the evolution of the state of charge (SOC). The results reveal the critical role of the battery in short-term energy balancing, smoothing fluctuations in renewable generation, and reducing reliance on the grid.
Overall, these figures collectively demonstrate the coordinated operation of the hybrid system components and provide a comprehensive understanding of the energy management strategy under the examined conditions.
3.2.2. Minimization of Carbon Emissions
The second primary case study investigates the minimization of the carbon footprint of the proposed energy system. In this scenario, the objective function defined in Equation (29) represents the total annual CO2 emissions associated with the building’s energy consumption and operation. All available system components are actively engaged in the optimization process, while the national grid is considered a supplementary energy source due to its relatively high emission factor.
The optimal system configuration obtained from the optimization algorithm is summarized in the last column of Table 3. The results indicate that grid electricity covers 24% of the total annual energy demand, with the remaining share being covered by on-site renewable energy systems and hydrogen-based energy pathways.
From an economic perspective, the total annual cost (TAC) of the optimal configuration is estimated at 235,430 $, corresponding to a unit energy cost of 0.267 $ kWh−1. This value is significantly higher than the current average electricity price in Greece, highlighting that the carbon-optimal solution is not economically competitive under present market conditions. This outcome is primarily attributed to the extensive deployment of renewable energy technologies and hydrogen production systems, which, despite their environmental benefits, involve high capital and operational costs. The economic gap becomes more pronounced in environments with relatively low grid electricity prices (e.g., 0.15 $ kWh−1), where conventional electricity remains cost-effective.
In contrast, the environmental performance of the system is substantially improved. The total annual emissions are reduced to approximately 15 t CO2-eq, corresponding to only 4% of the baseline emissions associated with conventional building operation. This drastic reduction is largely driven by the high penetration of renewable energy and the integration of hydrogen as an energy carrier.
Hydrogen production plays a dual role in the system. Beyond serving as an energy storage medium, it functions as an alternative fuel that displaces diesel consumption. This indirect substitution effect contributes significantly to emission reductions. At sufficiently high hydrogen production levels, the amount of displaced diesel can exceed the baseline fossil fuel consumption, potentially leading to a net-negative carbon footprint. However, achieving such performance requires substantial system oversizing, which in turn leads to a considerable increase in the total annual cost.
Table 3 further illustrates the trade-off between economic and environmental performance under different grid electricity price scenarios. As the unit cost of grid electricity increases, the system progressively favors higher renewable penetration and hydrogen production, resulting in lower emissions but higher capital investment. The carbon minimization case represents the extreme of this trade-off, where environmental performance is maximized at the expense of economic feasibility.
4. Conclusions
This study developed a comprehensive Mixed-Integer Linear Programming formulation for the optimal design and operation of an integrated renewable energy and green hydrogen system supplying a grid-connected building. The proposed framework simultaneously determines the optimal sizing and dispatch of wind turbines, photovoltaic panels, a battery energy storage system, and a hydrogen production and storage unit. The methodology was applied to a real-world case study concerning the Department of Chemical Engineering at the University of Patras, Greece, using detailed meteorological data and actual building load profiles. The optimization problem was successfully implemented and solved using GAMS, demonstrating the robustness and applicability of the proposed approach.
Two distinct optimization objectives were examined, namely cost minimization and carbon emissions minimization, enabling a comprehensive assessment of the economic–environmental trade-offs inherent in such hybrid energy systems.
In the cost minimization scenario, the results revealed that the optimal system configuration is highly sensitive to the unit price of grid electricity. At relatively low electricity prices, the grid remains a dominant energy source, complemented by moderate investments in wind and photovoltaic systems. However, as electricity prices increase, the model progressively shifts toward higher penetration of renewable energy technologies, alongside the integration of battery storage and hydrogen production. This transition reflects the system’s ability to hedge against rising electricity costs while simultaneously reducing dependence on external energy supply. Importantly, the results indicate that economically favorable solutions can be achieved across a wide range of electricity price scenarios while also delivering measurable reductions in CO2 emissions due to partial substitution of grid electricity with renewable generation.
In contrast, the carbon minimization scenario prioritizes environmental performance, leading to configurations with extensive renewable deployment and significant hydrogen production. Under current electricity price conditions, the system can achieve extremely low, and even net-negative, carbon emissions. This outcome is primarily driven by the role of green hydrogen as an alternative energy carrier that displaces fossil fuels, particularly in transportation applications. However, these environmental benefits come at a substantial economic cost, as the required system oversizing and reliance on capital-intensive technologies result in a significantly higher total annual cost. This highlights a fundamental trade-off between economic feasibility and environmental performance, which remains a key challenge in the transition toward low-carbon energy systems.
Overall, the study demonstrates that the proposed integrated system can reliably meet the energy demand of a public building while offering flexible pathways toward either cost efficiency or deep decarbonization. The findings underline the importance of external factors, such as electricity pricing and policy incentives, in determining the optimal system configuration.
The optimization framework developed in this study provides a deterministic baseline for evaluating the optimal design, economic performance, and carbon intensity of green hydrogen and renewable energy smart grids under high temporal resolution. To build upon these results, future research can extend this methodology in two key directions. First, integrating stochastic programming or robust optimization techniques will allow the framework to explicitly account for micro-variations in weather patterns and real-time forecast uncertainties. Second, incorporating dynamic, multi-tier grid tariffs alongside variable market pricing models for hydrogen will capture long-term market volatility and provide deeper insights into investment risk under evolving policy and economic landscapes.
Author Contributions
A.T.: investigation, software, formal analysis, and writing—original draft; K.C.: investigation, software, and writing—review and editing; I.K.K.: conceptualization, validation, and writing—review and editing, supervision. All authors have read and agreed to the published version of the manuscript.
Funding
This research received no external funding.
Data Availability Statement
The data supporting the findings of this study are available within the article. Further inquiries can be directed to the corresponding author.
Conflicts of Interest
The authors declare no conflicts of interest.
References
- Dincer, I. Renewable energy and sustainable development: A crucial review. Renew. Sustain. Energy Rev. 2000, 4, 157–175. [Google Scholar] [CrossRef] [Scilit]
- Ellabban, O.; Abu-Rub, H.; Blaabjerg, F. Renewable energy resources: Current status, future prospects and their enabling technology. Renew. Sustain. Energy Rev. 2014, 39, 748–764. [Google Scholar] [CrossRef] [Scilit]
- Nnabuife, S.G.; Hamzat, A.K.; Whidborne, J.; Kuang, B.; Jenkins, K.W. Integration of renewable energy sources in tandem with electrolysis: A technology review for green hydrogen production. Int. J. Hydrogen Energy 2025, 107, 218–240. [Google Scholar] [CrossRef] [Scilit]
- Khalid, M. Smart grids and renewable energy systems: Perspectives and grid integration challenges. Energy Strategy Rev. 2024, 51, 101299. [Google Scholar] [CrossRef] [Scilit]
- Lamnatou, C.; Chemisana, D.; Cristofari, C. Smart grids and smart technologies in relation to photovoltaics, storage systems, buildings and the environment. Renew. Energy 2022, 185, 1376–1391. [Google Scholar] [CrossRef] [Scilit]
- Gielen, D.; Boshell, F.; Saygin, D.; Bazilian, M.D.; Wagner, N.; Gorini, R. The role of renewable energy in the global energy transformation. Energy Strategy Rev. 2019, 24, 38–50. [Google Scholar] [CrossRef] [Scilit]
- Arif, S.; Taweekun, J.; Ali, H.M.; Ahmed, A.; Bhutto, A.A. Building resilient communities: Techno-economic assessment of standalone off-grid PV powered net zero energy (NZE) villages. Heliyon 2023, 9, e21426. [Google Scholar] [CrossRef] [Scilit] [PubMed]
- Majumder, R.; Dewadasa, M.; Ghosh, A.; Ledwich, G.; Zare, F. Control and protection of a microgrid connected to utility through back-to-back converters. Electr. Power Syst. Res. 2011, 81, 1424–1435. [Google Scholar] [CrossRef] [Scilit]
- Olabode, O.E.; Ajewole, T.O.; Okakwu, I.K.; Alayande, A.S.; Akinyele, D.O. Hybrid power systems for off-grid locations: A comprehensive review of design technologies, applications and future trends. Sci. Afr. 2021, 13, e00884. [Google Scholar] [CrossRef] [Scilit]
- Tu, T.; Rajarathnam, G.P.; Vassallo, A.M. Optimization of a stand-alone photovoltaic–wind–diesel–battery system with multi-layered demand scheduling. Renew. Energy 2019, 131, 333–347. [Google Scholar] [CrossRef] [Scilit]
- Panchenko, V.A.; Daus, Y.V.; Kovalev, A.A.; Yudaev, I.V.; Litti, Y.V. Prospects for the production of green hydrogen: Review of countries with high potential. Int. J. Hydrogen Energy 2023, 48, 4551–4571. [Google Scholar] [CrossRef] [Scilit]
- Zainal, B.S.; Ker, P.J.; Mohamed, H.; Ong, H.C.; Fattah, I.M.R.; Rahman, S.M.A.; Nghiem, L.D.; Mahlia, T.M.I. Recent advancement and assessment of green hydrogen production technologies. Renew. Sustain. Energy Rev. 2024, 189, 113941, Corrigendum in Renew. Sustain. Energy Rev. 2024, 202, 114734. https://doi.org/10.1016/j.rser.2024.114734. [Google Scholar] [CrossRef] [Scilit]
- Akdağ, O. Modeling and economic evaluation of hybrid renewable energy sources for green hydrogen production: A case study for the Mediterranean region. Renew. Energy 2025, 240, 122228. [Google Scholar] [CrossRef] [Scilit]
- Farah, S.; Bokde, N.; Andresen, G.B. Cost and CO2 emissions co-optimisation of green hydrogen production in a grid-connected renewable energy system. Int. J. Hydrogen Energy 2024, 84, 164–176. [Google Scholar] [CrossRef] [Scilit]
- Lim, L.K.; Ho, W.S.; Hashim, H.; Zubir, M.A.; Ab Muis, Z.; Chee, W.C.; Muda, N.; Elias, M.A.; Mohd Jais, R. Cost optimization of green hydrogen production from floating solar photovoltaic system. Renew. Energy 2025, 245, 122808. [Google Scholar] [CrossRef] [Scilit]
- Birwatkar, S.S.; Manousiouthakis, I.V.; Manousiouthakis, V.I. Techno-Economic Analysis of Hydrogen Fueling. Hydrogen 2026, 7, 82. [Google Scholar] [CrossRef] [Scilit]
- El Hassani, S.; Lebrouhi, B.E.; Kousksou, T. A feasibility study of green hydrogen and E-fuels production from a renewable energy hybrid system in the city of Dakhla, Morocco. Int. J. Hydrogen Energy 2024, 73, 316–330. [Google Scholar] [CrossRef] [Scilit]
- Hassan, Q.; Al-Jiboory, A.K.; Sameen, A.Z.; Barakat, M.; Abdalrahman, K.Y.M.; Algburi, S. Transitioning to sustainable economic resilience through renewable energy and green hydrogen: The case of Iraq. Unconv. Resour. 2025, 5, 100124. [Google Scholar] [CrossRef] [Scilit]
- Rajasekaran, S.; Krishnamoorthy, M.; Srinivasan, S.; Gouda, P.K. Integrated renewable electrification system modeling and tri-objective optimization analysis for net zero energy institutional building: A simulated case study of green hydrogen production. Environ. Dev. Sustain. 2026, 28, 3955–3984. [Google Scholar] [CrossRef] [Scilit]
- Kookos, I.K. Practical Chemical Process Optimization; Optimization and Its Applications; Springer Nature: Cham, Switzerland, 2022; Volume 197. [Google Scholar]
- Carrillo, C.; Obando Montaño, A.F.; Cidrás, J.; Díaz-Dorado, E. Review of power curve modelling for wind turbines. Renew. Sustain. Energy Rev. 2013, 21, 572–581. [Google Scholar] [CrossRef] [Scilit]
- Masters, G.M. Renewable and Efficient Electric Power Systems; John Wiley & Sons, Inc.: Hoboken, NJ, USA, 2004. [Google Scholar]
- Hannan, M.A.; Wali, S.D.B.; Ker, P.J.; Mansor, M.; Ramachandaramurthy, V.K.; Muttaqi, K.M.; Mahlia, T.M.I.; Dong, Z.Y. Battery energy-storage system: A review of technologies, optimization objectives, constraints, approaches, and outstanding issues. J. Energy Storage 2021, 42, 103023. [Google Scholar] [CrossRef] [Scilit]
- Sayed-Ahmed, H.; Toldy, Á.I.; Santasalo-Aarnio, A. Dynamic operation of proton exchange membrane electrolyzers—Critical review. Renew. Sustain. Energy Rev. 2024, 189, 113883. [Google Scholar] [CrossRef] [Scilit]
- Kookos, I.K. Systematic optimization of off-grid green hydrogen production systems. Int. J. Hydrogen Energy 2024, 79, 1299–1312. [Google Scholar] [CrossRef] [Scilit]
- Chen, H.; Zheng, J.; Xu, P.; Li, L.; Liu, Y.; Bie, H. Study on real-gas equations of high-pressure hydrogen. Int. J. Hydrogen Energy 2010, 35, 3100–3104. [Google Scholar] [CrossRef] [Scilit]
- Franco, A.; Giovannini, C. Hydrogen Gas Compression for Efficient Storage: Balancing Energy and Increasing Density. Hydrogen 2024, 5, 293–311. [Google Scholar] [CrossRef] [Scilit]
- İzgeç, M.M.; Emre, T. Strategic siting and cost modeling for green hydrogen export from off-grid renewables: A multi-hub approach for Türkiye. Int. J. Hydrogen Energy 2026, 210, 153616. [Google Scholar] [CrossRef] [Scilit]
- Böhm, H.; Goers, S.; Zauner, A. Estimating future costs of power-to-gas—A component-based approach for technological learning. Int. J. Hydrogen Energy 2019, 44, 30789–30805. [Google Scholar] [CrossRef] [Scilit]
- U.S. Department of Energy. FuelEconomy.gov. Hyundai Nexo 2023. Available online: https://www.fueleconomy.gov/feg/noframes/47281.shtml (accessed on 15 November 2024).
- Bertolini, M.; Duttilo, P.; Lisi, F. Accounting carbon emissions from electricity generation: A review and comparison of emission factor-based methods. Appl. Energy 2025, 392, 125992. [Google Scholar] [CrossRef] [Scilit]
- GAMS Development Corporation. GAMS: A User’s Guide; GAMS Development Corporation: Washington, DC, USA, 2023. [Google Scholar]
- Vamvakas, I.; Salamalikis, V.; Kazantzidis, A. Evaluation of enhancement events of global horizontal irradiance due to clouds at Patras, South-West Greece. Renew. Energy 2020, 151, 764–771. [Google Scholar] [CrossRef] [Scilit]
- Salamalikis, V.; Tzoumanikas, P.; Argiriou, A.A.; Kazantzidis, A. Site adaptation of global horizontal irradiance from the Copernicus Atmospheric Monitoring Service for radiation using supervised machine learning techniques. Renew. Energy 2022, 195, 92–106. [Google Scholar] [CrossRef] [Scilit]
- Shash, A.Y.; Abdeltawab, N.M.; Hassan, D.M.; Darweesh, M.; Hegazy, Y.G. Computational Methods,Artificial Intelligence, Modeling, and Simulation Applications in Green Hydrogen Production Through Water Electrolysis: A Review. Hydrogen 2025, 6, 21. [Google Scholar] [CrossRef] [Scilit]
- Wang, J.; Kang, L.; Huang, X.; Liu, Y. An analysis framework for quantitative evaluation of parametric uncertainty in a cooperated energy storage system with multiple energy carriers. Energy 2021, 226, 120395. [Google Scholar] [CrossRef] [Scilit]
- Krishnan, S.; Koning, V.; de Groot, M.T.; de Groot, A.; Granados Mendoza, P.; Junginger, M.; Kramer, G.J. Present and future cost of alkaline and PEM electrolyser stacks. Int. J. Hydrogen Energy 2023, 48, 32313–32330. [Google Scholar] [CrossRef] [Scilit]
- Superchi, F.; Bianchini, A.; Moustakis, A.; Pechlivanoglou, G. Towards sustainable energy independence: A case study of green hydrogen as seasonal storage integration in a small island. Renew. Energy 2025, 245, 122813. [Google Scholar] [CrossRef] [Scilit]



Disclaimer/Publisher’s Note: The statements, opinions and data contained in all publications are solely those of the individual author(s) and contributor(s) and not of MDPI and/or the editor(s). MDPI and/or the editor(s) disclaim responsibility for any injury to people or property resulting from any ideas, methods, instructions or products referred to in the content. |
© 2026 by the authors. Licensee MDPI, Basel, Switzerland. This article is an open access article distributed under the terms and conditions of the Creative Commons Attribution (CC BY) license.