


Abstract
The transition towards climate-neutral metallurgical production requires a broader transformation than the simple substitution of fossil-fuel combustion with electrical heating. While process electrification is a fundamental step towards reducing greenhouse gas emissions, achieving truly sustainable high-temperature processing also depends on the ability to maintain tightly controlled reaction environments, minimise thermal losses, and maximise the efficient use of process gases. These factors become increasingly important as the industry moves towards hydrogen-assisted processing routes and greater integration of renewable energy sources. By controlling heat transfer and gas composition, a stable processing environment can be maintained in which temperature, and gases’ partial pressure, can be accurately regulated throughout the treatment cycle. This study introduces the engineering concept of an airtight electrified indirect-fired rotary furnace, developed as a new process for efficient calcination, and also, hydrogen-based reduction processes. To assess the applicability of the proposed reactor concept, a bench-scale experimental campaign was carried out using two representative metallurgical processes: magnesite calcination and hydrogen-assisted reduction of lateritic ores. Throughout the testing campaign, the reactor maintained stable thermal conditions and a well-controlled process atmosphere, while the integrated monitoring system enabled continuous observation of temperature evolution and gas composition. The calcination trials achieved conversion efficiencies above 98%, whereas the hydrogen-reduction experiments successfully promoted the transformation of iron and nickel oxide phases into their metallic state. The results demonstrate that the integration of indirect electrical heating with airtight reactor operation provides a robust platform for hydrogen-assisted thermal processing. The proposed architecture improves atmosphere control and process efficiency while offering a scalable solution for the future implementation of electrified, low-carbon metallurgical technologies.
1. Introduction
According to the Intergovernmental Panel on Climate Change (IPCC) Sixth Assessment Report [1], the industrial sector remains one of the most challenging areas for climate change mitigation because it combines high energy demand with process-related greenhouse gas emissions that cannot be eliminated through energy efficiency measures alone. The production of basic materials—including iron, steel and non-ferrous metals—represents the largest share of industrial emissions due to the need for high-temperature processing and the continued reliance on fossil fuels. The report highlights that achieving climate neutrality will require a combination of low-carbon electricity, process electrification, hydrogen-based technologies, improved material efficiency, circular resource use and carbon capture where direct emissions cannot be avoided. Rather than relying on a single technological solution, the transition of the metallurgical industry will depend on the integration of multiple complementary strategies capable of reducing both energy consumption and process-related emissions while maintaining industrial productivity and competitiveness.
The decarbonisation of high-temperature metallurgical operations is no longer treated as a single-fuel substitution problem. The recent literature increasingly presents the transition as a combined process-engineering challenge in which the heat source, the reducing agent, the reactor atmosphere and the solids’ handling concept must be redesigned together. This point is particularly important for rotary and moving-bed systems, where the material is continuously mixed, the gas phase is in direct contact with the reacting solids and the local oxygen potential can change rapidly along the reactor length. In this context, electrification and hydrogen use are not independent solutions; their real value appears when they are integrated into reactor architectures that can control temperature and gas composition at the same time.
Recent work on industrial process heat has shown that electrification and hydrogen will both be required for deep decarbonisation, but their suitability depends strongly on temperature level, process configuration and the role of the gas phase. Leicher et al. [2] note that electrical heating can provide high controllability and direct coupling with renewable power, while hydrogen can replace fossil fuels in processes where a gaseous fuel or reducing agent is required. For metallurgical processing, this distinction is essential. Electrical heating can remove combustion products from the reactor, but it does not automatically create a stable reducing atmosphere. Process-level assessments of electrified mineral processing similarly indicate that its environmental benefit depends on the electricity mix, thermal integration and configuration of the electrically heated reactor [3]. Conversely, hydrogen can provide a carbon-free reduction route, but only if the reactor is sufficiently tight and well controlled to avoid air ingress, hydrogen dilution and unnecessary gas losses.
This has direct relevance to extractive metallurgy. The steel sector has been the main reference point for hydrogen-based process redesign because it combines very high energy demand with direct carbon use in reduction reactions. Recent MDPI studies have examined how hydrogen direct reduction, electrification and changes in energy structure can be combined to reduce emissions from steelmaking [4,5]. These studies are useful beyond ironmaking because they show that the low-carbon transition depends on the coupling between renewable electricity, hydrogen supply, heat generation and process control. In practice, this means that a new reactor cannot be assessed only by its energy source—it must also be evaluated by its ability to maintain a useful reaction environment under realistic operating conditions.
The hydrogen reduction of iron oxides has been widely reviewed in the recent literature. Zakeri et al. [6] emphasised that the reduction behaviour is affected not only by temperature and gas composition, but also by impurities and phase evolution within the solid. Heidari et al. [7] similarly showed that hydrogen-reduction kinetics depend on ore type, porosity, particle size, temperature and gas-flow conditions. These findings reinforce a central point for rotary reactors: the gas–solid contact is beneficial only when it occurs under a controlled atmosphere. If oxygen ingress or water-vapour accumulation is not managed, the effective H2/H2O ratio decreases and the reduction potential of the gas phase is weakened.
More recent studies have moved from general feasibility towards reactor-scale behaviour and process optimisation. Ji et al. [8] reviewed the development and application of hydrogen-based direct reduction and highlighted the need for improved integration between reduction reactors, hydrogen supply and downstream processing. Experimental and modelling work by Cavaliere et al. [9] on the hydrogen reduction of pellets confirmed that temperature, exposure time and gas transport strongly influence the degree of reduction. Özgün et al. [10] further showed that hydrogen pressure can modify reduction kinetics and microstructural evolution. Although these studies mainly concern iron ore pellets, they provide an important mechanistic basis for the hydrogen-assisted treatment of more complex oxide feedstocks, including nickel-bearing laterites.
The extension of hydrogen metallurgy to non-ferrous and complex ores is now receiving increasing attention. Nickel laterites are especially relevant because they are abundant, chemically heterogeneous and increasingly important for battery and stainless-steel supply chains. Conventional laterite processing relies on energy-intensive pyrometallurgical routes or acid-based hydrometallurgical flowsheets. Selective reduction studies further show that the reduction temperature, reductant availability and mineralogical association of nickel and iron determine ferronickel formation and subsequent metal recovery [11]. Kinetic analysis of laterite calcination has shown that several overlapping transformations occur below 1000 °C, including dehydroxylation, carbonate decomposition and structural changes that subsequently influence oxide reducibility [12]. Recent work has therefore explored hydrogen-assisted routes as a way to reduce direct carbon use and improve selectivity [13]. Wijenayake et al. [13] investigated ferronickel production from limonitic laterite using hydrogen reduction combined with cementation, demonstrating that hydrogen can participate effectively in laterite processing. Fan et al. [14] reviewed the comprehensive utilisation of nickel laterite ores and identified hydrogen and other clean reductants as promising options for future low-carbon flowsheets.
A particularly important recent development is the work of Manzoor et al. [15], who demonstrated a hydrogen-based reduction of laterites for sustainable nickel production. Their study is significant because it shows that hydrogen routes are not limited to high-grade or simple oxide feedstocks. Instead, hydrogen can be used to target complex mineral assemblages when the process conditions are properly designed. Investigations employing gaseous reductants have also confirmed that temperature and exposure time control the sequential transformation of iron oxides and the formation and growth of Fe–Ni metallic phases [16]. Earlier hydrogen-reduction experiments on nickel laterite also showed that additives such as sodium sulphate can promote nickel liberation and ferronickel formation, although relatively long treatment periods were required [17]. For an electrified rotary system, this literature supports the idea that laterite pre-reduction can become faster and cleaner, provided that temperature, residence time and gas composition are held within a narrow and reproducible operating window.
The importance of gas-atmosphere control is also evident in rotary furnace studies. Chung et al. [18] investigated the hydrogen reduction of tellurium oxide in a rotary kiln furnace and showed that controlled hydrogen treatment can promote oxide reduction under rotary processing conditions. Although the material system differs from laterite, the reactor implications are directly relevant. Rotary motion improves contact between particles and the gas phase, but it also increases the importance of sealing, gas distribution and consistent residence time. These are precisely the aspects that must be addressed if hydrogen is to be used efficiently in rotary metallurgical systems.
Hydrogen plasma studies point in the same direction from a different technological angle. Satritama et al. [19] reviewed hydrogen plasma for low-carbon extractive metallurgy and identified both the potential of hydrogen-based reduction and the limitations associated with scale-up, heat utilisation, reoxidation and process stability. The review is useful for the present work because it confirms that hydrogen-based metallurgy is not only a question of thermodynamic feasibility. Reactor design, heat-transfer efficiency and atmosphere integrity determine whether the reducing potential of hydrogen can be translated into reproducible metallurgical performance.
In parallel, the decarbonisation of calcination processes has become a major research topic. Calcination is difficult to decarbonise because CO2 is released not only from fuel combustion but also from carbonate decomposition. Electrification can eliminate the combustion-related part of the emissions, while airtight or indirectly heated operation can avoid dilution of the process CO2 stream. Electrified calciner configurations can therefore simultaneously reduce combustion-related emissions and generate a more concentrated CO2 stream that is better suited to capture and utilisation [20]. This is important for magnesite and limestone calcination, where a concentrated CO2 outlet stream can simplify capture, utilisation or further processing. Magnesite calcination is the principal industrial route for MgO production, while the calcination temperature and residence time strongly influence the reactivity, surface area and final properties of the produced magnesia [21]. Recent analysis of the magnesia sector has also demonstrated that fuel substitution, process optimisation and improved kiln-energy management can substantially influence both production costs and CO2 emissions [22]. Ryan et al. [23] modelled calcination in a rotary lime kiln and showed that heat transfer, reaction kinetics and particle behaviour must be considered together. Zhu et al. [24] also demonstrated through modelling that limestone decomposition is governed by coupled heat transfer, mass transfer and chemical reaction steps.
Recent MDPI work on carbonate decomposition provides additional support for this interpretation. Zhuang et al. [25] studied the thermal decomposition of calcium carbonate under different atmospheres and heating rates, showing that decomposition temperature and reaction rate are strongly linked to heating conditions and atmosphere. While calcium carbonate differs from magnesite, the underlying carbonate-decomposition logic is comparable: reaction progress depends on the ability of the reactor to supply heat uniformly and remove the evolved gas without creating local mass-transfer limitations. For magnesite calcination in an electrified indirect rotary kiln, this means that temperature uniformity and controlled gas removal are central to achieving high conversion within a practical treatment time.
The recent literature on industrial thermal applications of hydrogen also supports the need for careful reactor design. Mirshokraee et al. [26] reviewed hydrogen substitution for natural gas in thermal industrial applications and highlighted that hydrogen use changes combustion behaviour, safety requirements and process-control needs. Even when hydrogen is not combusted but used as a reducing gas, the same broader conclusion remains valid: hydrogen-compatible equipment must be designed around gas tightness, monitoring, ventilation and operating stability. Joyo et al. [27] similarly showed that hydrogen integration in steel decarbonisation requires a techno-economic evaluation of supply, process efficiency and operational constraints.
Taken together, the most recent MDPI and Scopus-indexed literature shows that the next generation of low-carbon metallurgical reactors must move beyond simple electrification. Electrically heated systems offer clear advantages by removing combustion gases and improving thermal control. Experimental investigation of an externally heated rotary calciner has demonstrated the technical feasibility of transferring heat through the kiln wall, with radiation providing the dominant heat-transfer contribution at calcination temperatures [28]. Hydrogen processing requires an additional layer of atmosphere management. Rotary systems are attractive because they provide solids mixing, particle renewal and flexible residence time; however, conventional direct-fired rotary kilns are poorly suited to hydrogen operation because they do not fully isolate the heat source from the process atmosphere. This creates a clear technological gap for sealed, indirectly heated rotary reactors able to control temperature and gas composition independently.
In this framework, this study presents the engineering of a fully sealed reaction chamber assembled in an indirect electrically heated rotary kiln to investigate how reactor electrification and atmosphere isolation can be combined within a single processing unit. Rather than focusing solely on replacing conventional burners with electrical heating, the reactor was engineered to provide independent control of heat transfer and gas composition, creating stable conditions for thermochemical reactions while reducing air ingress, thermal losses and unnecessary consumption of reducing gases. To examine its performance under representative metallurgical conditions, the system was tested in two different applications: magnesite calcination and hydrogen-assisted reduction of lateritic ores. The behaviour of both the feed and treated materials was evaluated through physicochemical characterisation, whereas temperature profile and process gas composition were monitored continuously throughout each experimental campaign. The results provide an assessment of the reactor’s ability to maintain accurate processing conditions during high-temperature treatment and demonstrate its potential as a flexible process for future electrified and hydrogen-compatible metallurgical applications.
The airtight electrified indirect-fired rotary kiln examined in the present study is positioned within this gap. Its relevance lies in the integration of three elements that are often treated separately in the literature: electrical heat supply, atmosphere isolation and hydrogen-compatible rotary processing. By separating the heat source from the reaction chamber, the system avoids combustion-gas dilution and allows the gas phase to be selected according to the process requirement. During magnesite calcination, this can support controlled CO2 evolution and concentrated off-gas formation. During laterite treatment, it can preserve a reducing hydrogen atmosphere and promote oxide reduction under reproducible conditions. “The novelty of the proposed reactor does not lie simply in replacing conventional fuels with electricity or hydrogen, but in integrating indirect electrical heating, atmosphere isolation and hydrogen-compatible rotary processing within a single reactor architecture specifically designed for high-temperature metallurgical applications.” The materials, experimental procedures and analytical methods adopted in this work are described in the Section 2.
2. Materials and Methods
2.1. Integrated Methodological Framework
Two representative mineral feedstocks were selected to evaluate the applicability of the electrified indirect-fired rotary kiln under different thermochemical processing conditions. A cryptocrystalline magnesite was used for calcination experiments, whereas a nickel-bearing lateritic ore served as the feed material for the hydrogen-reduction tests. These materials were selected because they represent two important extractive processes with fundamentally different reaction mechanisms: thermal decomposition in the case of magnesite and the solid-state reduction of metal oxides in the case of laterite.
2.2. Raw Materials Characterisation
Before each experimental campaign, the feedstocks were subjected to comprehensive physicochemical characterisation to establish their initial properties and provide a reliable basis for interpreting the transformations occurring during thermal treatment. Chemical composition was determined by X-ray fluorescence (XRF), using a Spectro XEPOS (SPECTRO Analytical Instruments GmbH, Kleve, Germany) energy-dispersive spectrometer, while the mineralogical assemblage was identified by XRD employing a Bruker D8 Focus diffractometer (Bruker AXS GmbH, Karlsruhe, Germany). Particle-size distribution (PSD) measurements were carried out with a HORIBA Partica LA-960V2 laser diffraction particle-size analyser (HORIBA Ltd., Kyoto, Japan), while the coarse fraction (>150 μm) was additionally evaluated by conventional sieve analysis. For the calcination tests, thermal behaviour was investigated using simultaneous thermogravimetric and differential thermal analysis (TG-DTA) using a SETARAM THEMYS ONE thermal analyser (SETARAM–KEP Technologies, Caluire-et-Cuire, France) under an argon atmosphere. Following the laterite reduction experimental campaigns, selected samples were further examined by using a JEOL JSM-5600 SEM (JEOL Ltd., Akishima, Tokyo, Japan) equipped with an Oxford ISIS 300 EDS detector (Oxford Instruments plc, Abingdon, UK), operating at an accelerating voltage of 20 kV.
To ensure the reliability of the experimental data, all measuring instruments were operated within their specified performance limits and were calibrated before the experimental campaign. The analytical equipment used for material characterisation, including the XRF, XRD, laser diffraction particle-size analyser, TG-DTA and SEM-EDS systems, provides measurement uncertainties that are small compared with the changes observed during thermal treatment. During reactor operation, furnace temperature was monitored using a Class 1 K-type thermocouple with an accuracy of ±1.5 °C (or ±0.4% of the measured value), while the PID controller maintained the selected temperature within approximately ±1 °C of the setpoint. The hydrogen and nitrogen flow rates were regulated by a calibrated mass-flow controller with an accuracy of approximately ±1% of full scale, and the outlet-gas composition was continuously measured using a portable infrared gas analyser with a typical accuracy of ±2% of full scale. These uncertainties are significantly lower than the experimental variations observed during calcination and hydrogen reduction, providing confidence that the measured trends reflect the behaviour of the process rather than limitations of the instrumentation.
The post-treatment characterisation combined XRD and SEM–EDS analyses to obtain complementary information on the reduction process. XRD was used to identify changes in the crystalline phase assemblage, while SEM–EDS provided a comparative evaluation of the elemental composition by examining the relative changes in oxygen and metallic elements after reduction. Together, these techniques provide qualitative evidence of the progression of the reduction process and the formation of metallic phases. No quantitative metallisation measurements were performed.
2.2.1. Magnesite
This was the feed material used throughout the calcination experiments by TERNA MAG [29] which is a leading Greek producer of high-purity magnesite and magnesia products, operating integrated mining and processing facilities in northern Euboea and supplying industrial markets worldwide. Chemical analysis indicated that the sample consisted predominantly of magnesium carbonate, with an MgCO3 content of approximately 93 wt.%, confirming the high purity of the material. Minor quantities of naturally occurring gangue minerals were also present, as expected for industrial magnesite ores, but their concentration was sufficiently low that they were not expected to influence the decomposition behaviour significantly. The main mineralogical phases determined using XRD analysis in the magnesite sample, as shown in Figure 1, were MgCO3 (magnesite), SiO2 (crystallised as quartz and silicon oxide) and dolomite (CaMg(CO3)2). The thermal behaviour of the feed was assessed using simultaneous TG-DTA. The analysis revealed a single dominant decomposition stage corresponding to the decarbonation of MgCO3. Weight loss began at approximately 500 °C and progressed rapidly until around 700 °C, where the decomposition reaction was essentially completed, with approximately 48.6% total mass loss. Particle-size analysis demonstrated that most particles were distributed between approximately 2 and 16 mm, although both coarser particles and a measurable fine fraction below 1.18 mm were also present. All particles were below 22.4 mm, with the majority concentrated in the intermediate size fractions; 86.7% of the sample passed the 16 mm sieve and 58.0% was finer than 10 mm. The amount of fine material was relatively limited, with 27.8%, 16.6% and 10.6% passing the 4 mm, 2 mm and 1.18 mm sieves, respectively.
Figure 1.
XRD analysis in the feed magnesite sample.
2.2.2. Lateritic Ore
The lateritic ore used in this study was supplied by LARCO General Mining & Metallurgical Company S.A. [30], one of Europe’s largest ferronickel producers, exploiting nickel-bearing laterite deposits from central Greece. Chemical composition was determined by XRF, revealing a predominantly silicate–iron oxide material. Silicon dioxide was the major constituent (41.37 wt.%), followed by Fe2O3 (28.57 wt.%), indicating that the ore is primarily composed of silicate minerals with abundant iron oxides. Moderate concentrations of MgO (7.51 wt.%) and Al2O3 (7.07 wt.%) were also detected, while CaO accounted for 3.53 wt.%. Chromium was present at relatively high levels (3.03 wt.% Cr2O3), reflecting the occurrence of chromium-bearing spinel minerals commonly associated with lateritic deposits. Nickel, the target metal for the reduction process, was measured at 1.05 wt.% as NiO. Minor quantities of Na2O, K2O, TiO2, MnO, V2O5 and ZnO were also identified. The measured loss on ignition (LOI) was only 5.39 wt.% indicating the presence of minor quantities of carbonates. XRD (Figure 2) showed that the laterite is composed mainly of Fe2O3 (hematite), CaCO3 (calcium carbonate), SiO2 (quartz), (Mg,Fe,Al)6(Si,Cr)4O10(OH)8 (clinochlore). There was a possible presence of Mg3Si2O5(OH)4 (clinochrysotile) and MgCr2O4 (magnesium chromium oxide) as minor constituents. The particle-size distribution exhibited a relatively broad range, extending from below 0.25 mm to over 22.4 mm. Approximately 94% of the material passed the 22.4 mm sieve, while 73% was finer than 12.5 mm and 55% was below 7.1 mm. The proportion of fine particles gradually decreased towards smaller size fractions, with only 11.2% passing the 0.50 mm sieve and less than 5% passing the 0.25 mm sieve.
2.3. Laboratory IFRK and Instrumentation
The experimental campaign was performed using a laboratory-scale electrically heated indirect-fired rotary kiln (IFRK) designed to provide precise control of both temperature and processing atmosphere during high-temperature treatment. The system was built around a horizontal rotary tube furnace, in which heat was transferred indirectly through electrically heated furnace walls rather than by direct contact between the heat source and the reacting material. This configuration ensured a uniform thermal environment while preventing contamination from combustion gases. The reactor tube was fabricated from heat-resistant STS310S stainless steel to withstand prolonged exposure to elevated temperatures and hydrogen-containing atmospheres. It uses a symmetrical three-section assembly to provide a well-defined reaction zone while ensuring stable gas flow and reliable sealing during operation (Figure 3). The central section (Zone C) forms the main reaction chamber and is positioned entirely within the heated region of the furnace. On either side of the reactor, the central chamber is connected to the inlet and outlet tubes through two identical conical transition sections (Zones B). The inlet and outlet sections (Zones A) are straight cylindrical tubes which thermally separate the hot reaction chamber from the external connections, allowing instrumentation and gas fittings to operate at significantly lower temperatures. Inside the tube, four longitudinal lifters continuously mixed the material during rotation, improving particle movement and promoting more uniform heat distribution throughout the bed. Rotation was provided by a variable-speed drive operating between 1 and 10 rpm, while the furnace temperature was continuously monitored by a K-type thermocouple positioned in the hot zone. A PID controller maintained the desired thermal profile with high accuracy throughout each experimental run.
Figure 2.
XRD analysis in the lateritic ore sample.
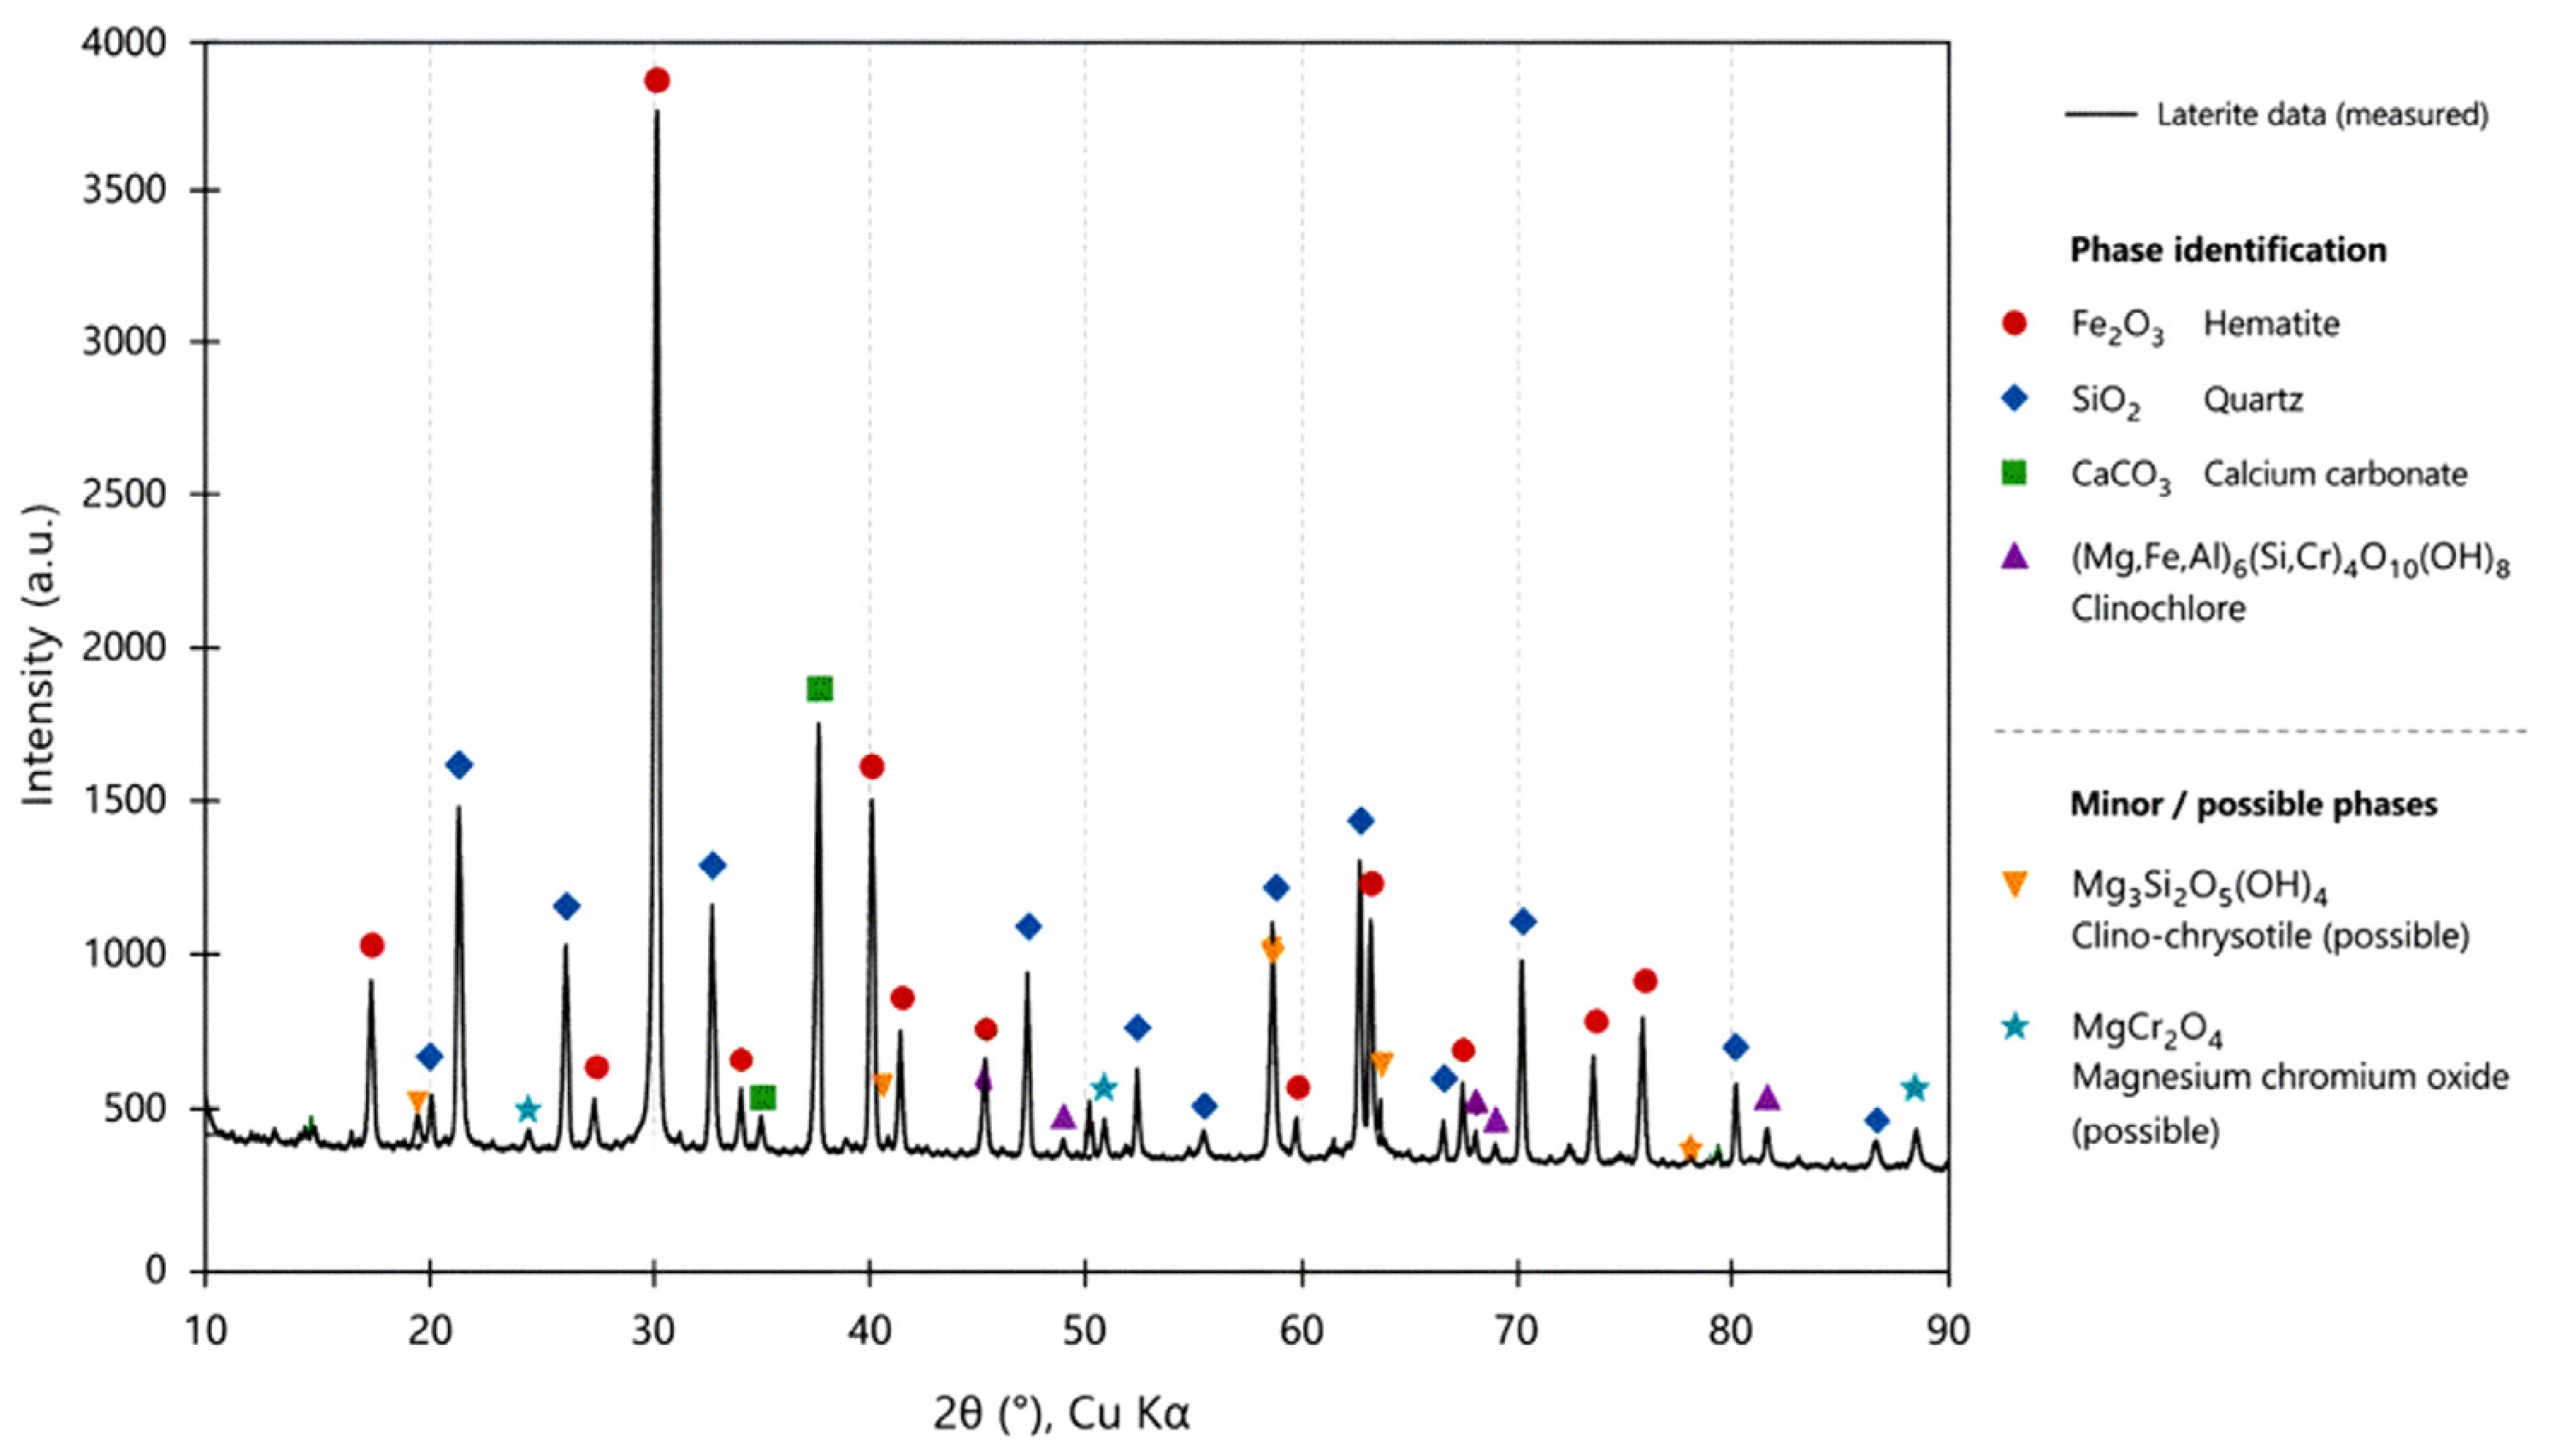
Figure 3.
IFRK cylindrical tube simulation in SOLIDWORKS 2026 [31].
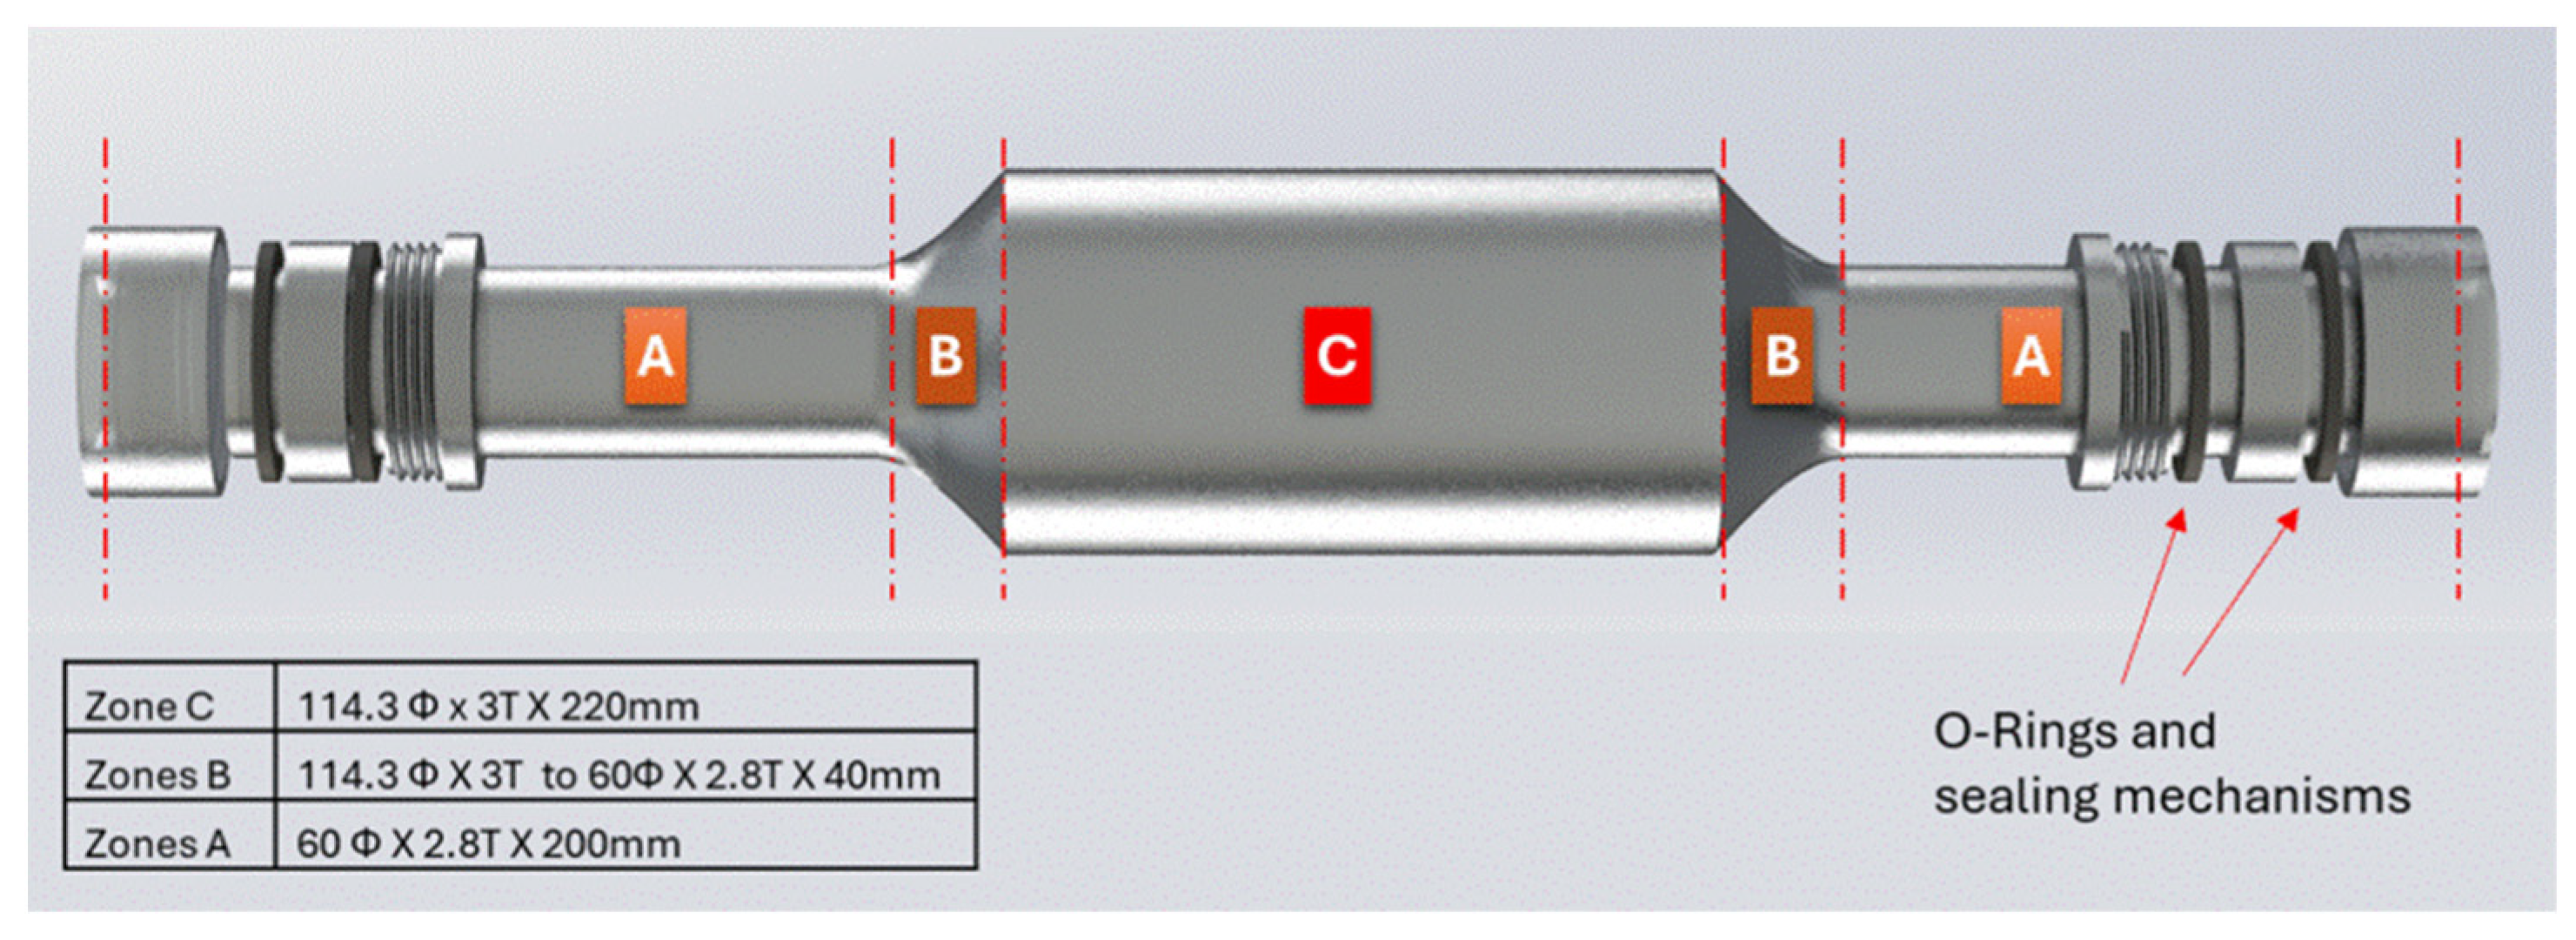
To preserve the controlled process atmosphere, both reactor ends were equipped with threaded sealing assemblies incorporating multiple high-temperature O-rings. This sealing arrangement was designed to accommodate thermal expansion while maintaining reactor tightness throughout rotation, effectively preventing air ingress and minimising process gas losses. The symmetric layout of the reactor also promotes balanced gas distribution and uniform thermal conditions, both of which are essential for reproducible calcination and hydrogen-reduction experiments.
2.4. Experimental Procedures
2.4.1. General Operating Procedure
The experimental platform combined the IFRK with the gas supply network, atmosphere control system and data acquisition infrastructure, allowing all process variables to be monitored through a single integrated architecture (Figure 4 and Figure 5).
Figure 4.
Experimental IFRK platform setup diagram.
Figure 5.
IFRK platform setup.
Nitrogen (99.999% purity) was supplied from a commercial compressed gas cylinder at an initial pressure of 200 bar and was used to purge the reactor before each experiment, establish an inert atmosphere during heating, and perform the final purge after the hydrogen-reduction tests. Hydrogen was generated on demand using a Parker 60H-MD proton exchange membrane (PEM) electrolyser, producing high-purity hydrogen (>99.999%). This approach eliminated the need for compressed hydrogen storage while ensuring a stable and continuous hydrogen supply throughout the reduction experiments. The hydrogen flow rate was regulated using a calibrated mass-flow controller before entering the sealed reactor. Once introduced into the sealed rotary reactor, the gas atmosphere was maintained under continuous control while the main operating parameters, including temperature, reactor rotation, gas-flow rate, inlet pressure and electrical power consumption, were recorded throughout each experimental run. The composition of the exhaust gas was monitored continuously using a portable infrared gas analyser (PGA-3510), enabling real-time measurement of gas composition.
The composition of the exhaust gas was continuously monitored throughout each experiment using a gas analyser connected directly to the reactor outlet. Since the reactor operated as a sealed system and the hydrogen inlet flow was accurately controlled by a calibrated mass-flow controller, the measured outlet hydrogen concentration was combined with the known inlet hydrogen flow to estimate hydrogen consumption during each reduction test. Although this approach was not intended to establish a complete mass balance, it provided a reliable and consistent basis for comparing hydrogen consumption under the different operating conditions examined in this work.
Particular attention was given to operational safety during commissioning. The laboratory was equipped with a dedicated mechanical ventilation system, fixed hydrogen leak detectors and portable gas detectors positioned around the installation to provide continuous leak monitoring. Before each experimental campaign, the reactor sealing system, gas distribution lines and all measurement devices were inspected, pressure-tested and calibrated to ensure stable and reproducible operation.
All process signals were collected through a central monitoring and data acquisition platform, enabling real-time visualisation and continuous recording of the experimental data. The commissioning procedure confirmed the integrity of the reactor, the stability of the gas handling system and the reliability of the monitoring equipment, providing a robust experimental platform for both magnesite calcination and hydrogen-assisted reduction under tightly controlled operating conditions.
During the experiments, the main operating variables—including furnace temperature and gas flow—were continuously regulated by the PID control system. Minor fluctuations around the selected setpoints were expected because of the thermal inertia of the furnace and the dynamic response of the gas supply system, and these were considered part of the normal operation of the experimental setup. Experimental measurements were recorded only after the operating conditions had stabilised, ensuring that the results presented in this work correspond to steady-state operation rather than transient start-up conditions.
Before the experimental programme commenced, the entire installation was commissioned to verify the performance of the reactor, gas handling system and monitoring equipment under both inert and hydrogen-based operating conditions. Nitrogen was supplied from a pressurised cylinder and used to purge the reactor before each experiment and to establish an inert atmosphere whenever required. Once introduced into the sealed rotary reactor, the gas atmosphere was maintained under continuous control while the main operating parameters, including temperature, reactor rotation, gas-flow rate, inlet pressure and electrical power consumption, were recorded throughout each experimental run.
2.4.2. Case Study A: Magnesite Calcination Experiments
The experimental campaign was developed to investigate the calcination behaviour of magnesite in an airtight electrically heated indirect-fired rotary kiln over a range of representative operating temperatures. The study focused on the evolution of the decomposition process under controlled thermal conditions, with particular attention given to the relationship between temperature, reaction kinetics and residence time. The reactor was charged with the desired quantity of material, maintaining a filling degree below approximately 30% of the reaction chamber volume. This loading level ensured sufficient space for particle circulation and effective mixing during rotation. The reactor was operated at a constant rotational speed (10 rpm), allowing the internal lifters to continuously redistribute the material and maintain good contact between the particle bed and the heated reactor wall. Thermal treatment was performed at 800, 900 and 1000 °C, with temperature regulated automatically through the furnace PID controller at a nominal heating rate: approximately 8.0–9.8 °C min−1. A constant nitrogen flow was maintained during the entire thermal treatment to preserve the inert atmosphere and continuously remove the CO2 released during the decomposition of magnesite.
2.4.3. Case Study B: Laterite Hydrogen-Reduction Experiments
The experimental conditions were selected to evaluate the influence of the two parameters expected to have the greatest impact on hydrogen reduction, namely temperature and particle size, while keeping the remaining operating variables unchanged. Temperatures of 800 and 1000 °C were chosen to represent two characteristic operating regimes for hydrogen-assisted reduction, enabling the effect of increased thermal energy on the reduction process to be assessed. Two particle-size fractions were investigated to examine the influence of particle size on gas–solid interaction and reduction behaviour. Because reaction kinetics are significantly faster at higher temperatures, the hydrogen-treatment time was set to 35 min at 800 °C and reduced to 15 min at 1000 °C to achieve representative reduction conditions without unnecessarily extending the experiments. Throughout the study, the reactor rotation speed, hydrogen flow rate and all other operating conditions were maintained constant so that the observed differences could be attributed primarily to the selected experimental variables. During all tests, the reactor rotated at 10 rpm, providing continuous movement of the particle bed and promoting uniform contact between the material and the heated reactor surface.
Heating was carried out in a flowing nitrogen atmosphere, which maintained inert conditions throughout the temperature ramp and prevented any reduction reactions before the desired operating temperature was attained. Once thermal equilibrium had been established, the nitrogen atmosphere was replaced by hydrogen, supplied at a nominal flow rate of approximately 0.55 standard L min−1—marking the beginning of the reduction stage. Two reduction temperatures were examined, namely, 800 °C and 1000 °C. To account for the expected increase in reaction rate at elevated temperatures, different hydrogen-treatment times were selected. The experiments at 800 °C were maintained under hydrogen for 35 min, whereas those conducted at 1000 °C were limited to 15 min. These conditions were selected to enable the evaluation of the temperature dependence of the reduction process while maintaining consistent operating conditions throughout the experimental campaign.
All experimental signals were recorded continuously through the laboratory data acquisition system. For quality assurance, only experiments with complete and uninterrupted datasets were used for the quantitative evaluation of temperature evolution, gas-flow behaviour and kinetic comparisons. During post-processing of the experimental data, a temporary communication interruption affected one reduction experiment (Reduction #4), resulting in incomplete controller and hydrogen-flow records. The interpolated values were used solely to preserve the continuity of the graphical presentation. They were not used in the calculation of reaction rates, kinetic parameters or any quantitative comparison. The interpretation of the reduction behaviour was based on the directly measured experimental data and independently supported by the physicochemical characterisation of the treated samples. Consequently, the interpolated intervals did not influence the interpretation of the overall reduction trend or the conclusions of this study.
2.5. Common Numerical Data-Processing Framework
A common numerical workflow was developed to process the measurements generated during the magnesite calcination and laterite hydrogen-reduction campaigns. Although the two processes were evaluated using different gas-phase indicators, both relied on the same underlying data architecture. Measurements from the IFRK controller, gas analyser and mass-flow controller were therefore imported, checked and aligned before the calculation of process-specific indicators. All numerical processing was performed in MATLAB R2026a [32].
The workflow was designed to preserve the temporal sequence of each experiment while accounting for the different acquisition systems and measurement principles involved. The IFRK controller provided the thermal and operational history of the furnace, the gas analyser recorded the composition of the exhaust stream, and the mass-flow controller supplied information on the inlet-gas conditions. These datasets were combined into a common run-specific table indexed by elapsed experimental time. The processed datasets were subsequently used to calculate thermal, gas-phase and mass-balance indicators for the calcination and hydrogen-reduction experiments, while laboratory characterisation results (TG–DTA, XRD, SEM–EDS and mass measurements) were incorporated for the validation and interpretation of the calculated process indicators.
2.5.1. Data Acquisition
Three main data streams were used in the numerical analysis. The IFRK controller recorded the measurement timestamp, kiln temperature, setpoint temperature and heater output signal. These variables were used to reconstruct the thermal history of each run and to assess the response of the furnace to the programmed heating profile.
The outlet-gas composition was measured using the PGA. The recorded variables included timestamped concentrations of CO2, N2, H2 and O2 together with the analyser sample-flow measurement. CO2 was the principal gas-phase indicator during magnesite calcination, whereas H2 was monitored during the laterite-reduction experiments. Oxygen and nitrogen measurements were retained as a supporting indicator for the identification of air ingress, incomplete purging or disturbances in the gas line.
The mass-flow controller recorded the inlet volumetric flow rate, flow setpoint, gas temperature, absolute pressure and selected gas identity. These measurements were used to assess the stability of the nitrogen and hydrogen supply and, where the required flow information was available, to support the calculation of inlet-gas quantities.
2.5.2. Data Quality and Handling of Missing, Invalid, and Censored Measurements
Data-quality assessment was performed before the calculation of reaction indicators. Each dataset was checked for missing timestamps, duplicated observations, inconsistent units, abrupt discontinuities and values outside the expected operating range. Records associated with known calibration procedures or equipment checks were identified using the experimental log and the corresponding gas-concentration patterns.
To ensure continuity in the synchronised datasets, missing observations were treated using a linear imputation approach. Missing values were primarily associated with short communication interruptions between the monitoring platform and the connected instruments. Prior to imputation, all missing intervals were identified and documented for each variable and experimental run.
After synchronisation with the common time base, missing observations were filled using linear interpolation of neighbouring, no missing values (MATLAB\fillmissing with the ‘linear’ option). This approach estimates missing values from the nearest valid observations before and after the gap and is equivalent to linear interpolation between adjacent measured points. The implementation was applied only to short gaps bounded by valid observations and exhibiting a continuous local trend. Missing values in temperature, heater output, gas composition, and flow rate records were interpolated when the gap duration was sufficiently short and no known process disturbance occurred during the interval. Interpolation was not applied across periods corresponding to genuine operational transitions, such as gas switching, analyser calibration, intentional flow adjustments, pressure-release events or extended communication failures, since these events cannot be reliably represented by a linear trend. Long gaps and operationally significant interruptions were therefore retained as missing values and excluded from calculations requiring continuous data.
All preprocessing operations were documented by run. The data-quality record included the original observation count, missing values, duplicated records, interpolated points, calibration periods, censored measurements and excluded values. Data treatment was limited to the synchronisation, quality assurance and calculation of physically interpretable experimental indicators.
2.6. Numerical Indicators for Magnesite Calcination
The calcination case study was analysed by combining the solid mass balance, thermogravimetric measurements, particle-size distributions and the time-dependent CO2 concentration recorded at the IFRK outlet. The goal is to evaluate calcination performance from complementary perspectives, including chemical conversion, solid-product recovery, particle-size transformation and the temporal evolution of CO2 release during decomposition. The mass balance provides an estimate of the overall removal of volatile material and the recovery of the solid product. TG–DTA is used to determine the residual carbonate content of the treated material. Particle-size analysis describes the physical transformation of the feed during heating and rotation, while the gas-phase measurements identify the timing and duration of the principal decomposition period.
2.6.1. Solid Mass Balance
The solid mass balance is established from the initial feed mass and the mass of material recovered after each IFRK experiment. For pure MgCO3, the theoretical fraction remaining after complete calcination (fMgO) is obtained from the molar masses of MgO and MgCO3:
where the molar mass of magnesium oxide (MMgO) is 40.30 g/mol and the molar mass of magnesium carbonate (MMgCO3) is 84.31 g/mol. Accordingly, complete decomposition of pure MgCO3 theoretically leaves 0.478 of the initial carbonate mass as MgO, while approximately 52.2% is released as CO2.
fMgOtheor = MMgO/MMgCO3
The theoretical final mass is estimated, also considering that the feed was not composed exclusively of MgCO3, taking into account the non-reactive and secondary mineral fractions. If wMgCO3 represents the mass fraction of MgCO3 in the initial sample, the theoretical residual mass after complete decomposition (mf,theor) can be calculated as
where m0 is the initial sample mass and wMgCO3 is the mass fraction of reactive MgCO3. This simplified expression assumes that the non-MgCO3 fraction remains in the solid phase. Where other carbonate phases contribute measurably to the thermal mass loss, the theoretical residual mass should instead be determined from the complete mineral-specific decomposition balance or directly from the initial TG–DTA mass-loss fraction. A TG-based formulation was therefore also used:
where Δmraw is the fractional mass loss of the untreated material over the carbonate-decomposition interval. This expression uses the experimentally measured volatile fraction and incorporates the combined contribution of all thermally decomposing phases detected under the selected TG–DTA conditions.
mf,theor = m0 × [wMgCO3 × fMgOtheor + (1 − wMgCO3)]
mf,TG = m0 × (1 − Δmraw)
The mass-based calcination conversion was calculated as
where mf is the measured recovered final mass. The quantities calculated for each experiment were organised according to Table 1.
Xcalc,m = (m0 − mf)/(m0 − mf,TG)
Table 1.
Solid mass-balance quantities calculated for each magnesite run.
2.6.2. TG-Based Residual Carbonate and Calcination Degree
Thermogravimetric and differential thermal analysis was used to establish the decomposition behaviour of the untreated magnesite and to determine whether carbonate remained after IFRK processing. The untreated sample was first analysed to identify the decomposition interval and the corresponding total mass loss. Treated samples were analysed under the same or directly comparable conditions so that the remaining decomposition-related mass loss could be expressed relative to that of the raw feed.
The TG–DTA was applied to both untreated and IFRK-treated magnesite samples. The resulting thermograms and differential thermal analysis curves are presented and discussed in Section 3, where the residual carbonate content and calcination degree are evaluated based on the measured mass-loss behaviour and thermal events.
2.6.3. Particle-Size Analysis
Particle-size analysis was performed before and after calcination to determine whether thermal decomposition and rotary motion altered the physical size distribution of the material. Coarser particles were analysed by sieving, while the finer fraction was analysed using laser-diffraction measurements where applicable. The analysis focused on changes in the cumulative passing curves and on characteristic particle-size indicators derived from the measured distributions.
For each sieve size, the mass fraction retained was calculated as
where wi is the mass fraction retained in size interval i and mi is the mass retained in size interval i.
wi = (mi/total sample mass) × 100
Characteristic particle sizes were determined from the cumulative passing curve. D50 represents the particle size below which 50% of the sample mass is found, while D80 corresponds to the size below which 80% of the sample mass passes. Where the required passing percentage occurred between two measured sieve sizes, logarithmic interpolation was used because particle-size distributions are conventionally represented on a logarithmic size axis. Consequently, the particle-size results describe the net physical transformation produced by the complete treatment procedure and not exclusively the chemical decomposition mechanism.
2.6.4. Comparative Analysis of Operating Variables
The magnesite experiments were conducted at target temperatures of 800, 900 and 1000 °C. The principal comparison, therefore, concerned the influence of the maximum temperature on the thermal history, CO2 response, processing duration and final solid condition. However, the experiments did not constitute a fully balanced design because the initial sample mass and the actual heating rate were not identical in all runs. The measured heating rates ranged approximately from 8.0 to 9.8 °C min−1. Direct comparison of raw gas-concentration values could therefore reflect differences in sample inventory and operating history in addition to the target temperature.
The comparative evaluation was based on analyses performed using the synchronised temperature and CO2 datasets. The temperature profiles over time were compared using the actual average heating rate, the time required to reach the target temperature, and the total run duration. In addition, the synchronised CO2 measurements were evaluated in terms of the onset of detectable CO2 evolution, the duration of the main CO2-evolution period, and the timing of CO2 depletion.
The influence of target temperature was evaluated using the measured mass loss, TG-based calcination degree, product recovery, particle-size distributions and the temporal characteristics of the CO2 signal. Because only one run was available at each main condition and the sample masses differed, the comparison was treated as exploratory. The observed differences were therefore interpreted as experimental trends rather than statistically replicated temperature effects.
Particle-size analysis was used to compare the feed material and the calcined product and to assess the physical transformation associated with calcination and kiln rotation.
2.6.5. Gas-Control Performance and CO2-Evolution Indicators
The outlet CO2 concentration was used to identify the temporal development of the calcination reaction. Since the analyser measured gas concentration, the primary indicators were formulated as concentration-based temporal metrics. These indicators were used to compare the timing and relative shape of the CO2 response between experiments.
The beginning and end of the principal CO2-evolution interval were identified from the sustained rise above baseline and the subsequent return toward the baseline range. The duration of the interval was calculated as
where tend was defined as the first point after the main release period at which the concentration fell below the selected endpoint threshold and remained below it for a specified period.
ΔtCO2 = tend − tonset
The end of the CO2-evolution period was identified using a concentration threshold of approximately 0.6 vol.% CO2. This threshold was established after reviewing the CO2 profiles from all calcination experiments and was found to consistently indicate the point at which the main decomposition stage had essentially finished and the outlet gas entered the final depletion phase. The selected value also remained comfortably above the normal baseline fluctuations of the gas analyser, minimising the influence of measurement noise while providing a consistent basis for comparing the different experimental conditions. The concentration-rise slope was calculated as the change in CO2 concentration divided by the corresponding change in time. The concentration-rise slope (rCO2) was calculated as
where ΔyCO2 is the change in measured CO2 concentration and Δt is the corresponding change in time.
rCO2 = ΔyCO2/Δt
Where the temperature dependence of the signal was examined, the local concentration change with temperature was expressed as the CO2 concentration change per unit temperature (rCO2,T):
(rCO2,T) = ΔyCO2/ΔT
Both slopes were calculated only from valid, unsaturated measurements. Data points at the analyser ceiling were treated as censored observations and were excluded from numerical differentiation. The combination of these indicators allowed the calcination experiments to be examined at three complementary levels: chemical conversion of the solid, physical recovery and fragmentation of the product, and temporal development of the gaseous decomposition response.
2.7. Numerical Indicators for Laterite Hydrogen Reduction
The hydrogen-reduction experiments were evaluated by combining the recorded IFRK temperature and outlet-gas measurements with the initial and final sample masses and the post-treatment mineralogical and microstructural analyses. The purpose of this combined approach was to assess the progress of reduction from both the gas and solid phases. The H2 concentration profiles were used to examine the response of the reactor after the transition from nitrogen to hydrogen, while the mass measurements provided an overall indication of the material changes occurring during heating and reduction. XRD and SEM–EDS analyses were subsequently used to identify the reduction products and to examine the distribution of iron-, nickel-, cobalt- and oxygen-containing phases in the treated samples.
2.7.1. Solid Mass Balance
The solid mass balance was determined from the mass of the laterite sample before and after each reduction experiment. The measured mass loss (Δm) was calculated as
where m0 is the initial sample mass and mf is the final sample mass.
Δm = m0 − mf
The corresponding relative mass loss was calculated as
where Δmrel is the relative mass loss expressed as a percentage of the initial sample mass. This quantity represents the total mass removed during the complete thermal treatment. It includes the heating stage under nitrogen, the hydrogen-reduction stage and the subsequent cooling and product-recovery operations.
Δmrel (%) = [(m0 − mf)/m0] × 100
The measured mass loss could not be treated as a direct reduction degree because several processes may contribute to the decrease in sample mass. These include the removal of free and structurally bound water, the dihydroxylation of hydrated silicate phases, the decomposition of carbonate phases, the removal of oxygen from iron and nickel oxides, and the physical loss of fine particles during handling or recovery. Furthermore, the raw laterite had a measured loss on ignition of 5.39 wt.%, indicating that a proportion of the total mass loss could occur independently of hydrogen reduction. The initial mass, final mass, absolute mass loss and relative mass loss were therefore reported together with the gas-phase and mineralogical results.
2.7.2. XRD Analysis of the Reduction Products
XRD was used to identify the mineral phases present after hydrogen treatment and to evaluate the progression of the reduction sequence. The untreated laterite was used as the mineralogical reference. Its principal identified phases included hematite, quartz and calcium carbonate, with possible minor contributions from clinochrysotile and magnesium chromite.
The XRD patterns of the treated samples were examined for changes in the iron-bearing phases. Particular attention was given to the reduction or disappearance of hematite reflections, the formation of magnetite and wüstite, the presence of fayalite or other iron-bearing silicate phases, the appearance of metallic iron and metallic nickel, and the changes associated with treatment temperature. The reduction pathway was interpreted according to the progressive transformation of iron oxides:
Fe2O3 → Fe3O4 → FeO → Fe
The identification of intermediate phases was used as evidence of partial reduction, whereas the presence of metallic iron and the disappearance of hematite were used as evidence of more advanced reduction. Since laterite contains several overlapping crystalline phases, phase identification was based on the combined position and intensity of the characteristic diffraction peaks rather than on isolated reflections.
The XRD analysis was used primarily for qualitative phase identification. A quantitative phase fraction or bulk reduction percentage was not calculated from the diffraction patterns because a full quantitative refinement was not performed. The results were instead compared across the two treatment temperatures and interpreted together with the SEM–EDS observations.
2.7.3. SEM–EDS Analysis
Scanning electron microscopy (SEM) coupled with energy-dispersive X-ray spectroscopy was used to examine the morphology and local elemental composition of the treated laterite samples. The analyses were performed on polished specimens obtained from the −1 mm fraction treated at 800 °C and 1000 °C. The samples were prepared by grinding and mechanical polishing with 6 μm and 1 μm diamond pastes before examination.
SEM images were assessed for changes in particle and grain morphology, the development of pores and microchannels, disruption of the oxide structure, the formation of dense or metallic regions, and evidence of heterogeneous or locally uniform reduction. The formation of internal pores and channels was considered in relation to the production and removal of water vapour during hydrogen reduction. These features may develop as oxygen is removed from the oxide lattice and gaseous H2O migrates out of the reacting grains. EDS point analyses and elemental maps were used to examine the local distribution of oxygen, iron, nickel, cobalt, chromium, magnesium, aluminium and silicon. The comparison focused on changes in oxygen intensity and on the development of Fe-, Ni- and Co-rich regions after treatment. The analyses were also used to examine whether the metallic elements were concentrated in isolated areas or distributed across the observed microstructure.
2.7.4. Comparative Analysis of Operating Variables
The reduction experiments were arranged to examine the combined influence of temperature and particle size. Two particle-size fractions were tested, including material finer than 1 mm and material between 1 and 2.5 mm. Each fraction was treated at 800 and 1000 °C. All experiments were conducted using the same kiln rotation speed (10 rpm) and the same nominal hydrogen flow rate (approximately 0.55 L/min), ensuring that temperature and particle size were the primary variables under investigation. The four runs therefore formed the comparison matrix shown in Table 2.
Table 2.
Experimental matrix for the laterite hydrogen-reduction comparison.
The influence of temperature was examined by comparing runs performed with the same particle-size fraction. For the −1 mm fraction, the comparison was made between Run 1 and Run 2, while for the −2.5 + 1 mm fraction, the comparison was made between Run 3 and Run 4. The influence of particle size was examined by comparing runs performed at the same target temperature. At 800 °C, the comparison was made between Run 1 and Run 3, whereas at 1000 °C, the comparison was made between Run 2 and Run 4.
The comparative evaluation was based on the time required to reach the target temperature; the duration of hydrogen treatment; the H2 concentration profile after gas switching; hydrogen breakthrough and stabilisation behaviour; the calculated inlet, outlet and consumed hydrogen quantities; sample mass loss; XRD phase evolution, and SEM–EDS observations where available.
The duration of hydrogen treatment was not the same at the two temperatures. The tests at 800 °C were performed for 35 min, whereas the tests at 1000 °C were performed for 15 min. The temperature comparison therefore reflects the combined effect of temperature and treatment duration. The results were interpreted as experimental trends under the applied operating conditions rather than as an isolated kinetic effect of temperature.
2.7.5. Gas-Control Performance and H2 Indicators
The H2 concentration measured at the IFRK outlet was used to examine the transition from the nitrogen atmosphere to the hydrogen-reduction stage. The reduction experiments consisted of three main gas-related periods: heating of the sample under nitrogen, replacement of nitrogen by hydrogen at the target temperature, and termination of hydrogen feeding followed by nitrogen purging.
The beginning of hydrogen treatment was defined from the recorded gas-switching time and the subsequent increase in outlet H2 concentration. The initial increase in measured H2 represents the combined effects of gas transport, nitrogen displacement, filling of the kiln and connecting lines, analyser response and hydrogen consumption by the reacting material. The concentration increase was therefore not interpreted independently as a direct reduction rate.
The synchronised temperature and H2 profiles were used to identify the time at which hydrogen was introduced, the first detectable H2 response at the analyser, the period of rapid H2 increase, the time required to reach selected H2 concentration levels, the period of H2 stabilisation, and the final decrease associated with the termination of hydrogen supply and nitrogen purging. Hydrogen breakthrough time was defined as the interval between the recorded introduction of hydrogen and the first sustained increase in the outlet H2 concentration. The times required for the signal to reach 50%, 80% and 90% of its stable value were also determined where the recorded profile permitted this calculation. The local H2 concentration slope (SH2) was calculated as
where ΔCH2 is the change in H2 concentration, and Δt is the corresponding change in time. The result was expressed in concentration percentage points per minute. Positive values represent an increase in the measured outlet H2 concentration, whereas negative values represent a decrease. These slopes describe changes in the measured gas signal and were not treated as direct molar reaction rates.
SH2 = ΔCH2/Δt
- Hydrogen Input
The total volume of hydrogen supplied during each experiment was calculated from the measured or nominal inlet flow and the hydrogen-treatment duration:
where VH2,in is the total hydrogen volume supplied (L), QH2,in is the average hydrogen inlet-flow rate (L/min) and tH2 is the hydrogen-treatment time (min).
VH2,in = QH2,in × tH2
- The corresponding hydrogen mass was calculated using the hydrogen density adopted in the experimental analysis:where mH2,in is the hydrogen mass supplied (g) and ρH2 is the hydrogen density (g/L). A density of ρH2 = 0.08988 g/L was used for the conversion of hydrogen volume to mass.mH2,in = VH2,in × ρH2
- Hydrogen Output
The outlet hydrogen quantity was estimated from the measured H2 concentration profile and the gas-flow information used in the experimental analysis. The outlet hydrogen volume, VH2,out, was calculated by integrating the hydrogen fraction in the measured gas stream over the selected hydrogen-treatment period. The corresponding hydrogen mass, mH2,out, was calculated as
where mH2,out is the outlet hydrogen mass (g), VH2,out is the outlet hydrogen volume (L) and ρH2 is the hydrogen density (g/L). The outlet quantity represents the hydrogen detected in the measured gas stream during the selected period.
mH2,out = VH2,out × ρH2
- Apparent hydrogen consumption
The apparent hydrogen consumption (VH2,cons) was calculated as the difference between the inlet and outlet quantities:
VH2,cons = VH2,in − VH2,out
Similarly, the apparent hydrogen mass consumption was calculated as
mH2,cons = mH2,in − mH2,out
The fraction of the supplied hydrogen classified as consumed was calculated as
where ηH2 is the apparent hydrogen consumption (%).
ηH2 = (mH2,cons/mH2,in) × 100
This indicator was used to compare the four experimental runs. It was described as apparent hydrogen consumption because the calculation does not separately quantify all gas accumulation and displacement effects occurring in the kiln, connecting lines and analyser circuit during the transition from nitrogen to hydrogen.
During data processing, isolated missing data points resulting from brief interruptions in signal acquisition were treated using interpolation, only when necessary to preserve the continuity of the recorded time series for graphical presentation and trend interpretation. These interpolated points were not used to alter or influence the quantitative evaluation of the experimental results, and the main conclusions of the study remained unchanged when considering only the directly measured data. No experimental observations were intentionally excluded from the analysis. Accordingly, a clear distinction was maintained between genuinely missing measurements caused by temporary acquisition interruptions and censored data, the latter of which were not present in this experimental campaign.
3. Results
The experimental results are presented by first assessing the common operating performance of the electrified indirect-fired rotary kiln and then examining the two thermochemical applications separately. The common assessment considers temperature control, heating behaviour, heater demand, gas-flow stability, operational interventions and data continuity across the complete experimental campaign. This provides the basis for distinguishing process-related changes from variations associated with reactor operation or measurement conditions.
3.1. IFRK Thermal and Gas-Control Performance
The common operating performance of the IFRK was evaluated before interpreting the reaction-specific behaviour of magnesite and lateritic ore. The assessment covered the three calcination experiments and the four hydrogen-reduction experiments and included temperature-setpoint tracking, heating rates, heater-output response, inlet-gas stability, pressure-related interventions and data continuity. The aim was to determine whether the reactor maintained the programmed thermal and atmospheric conditions and to identify operational events that could affect the interpretation of the CO2 and H2 measurements.
Table 3 summarises the main operating conditions and the corresponding outcomes of the hydrogen-reduction experiments. The selected test matrix was designed to evaluate the combined influence of temperature and particle size on the reduction behaviour while maintaining the remaining operating parameters unchanged. As expected, the operating temperature had the strongest effect on the overall process, with the experiments performed at 1000 °C progressing more rapidly than those carried out at 800 °C. A noticeable influence of particle size was also observed, as the finer material generally promoted a more efficient interaction between the hydrogen atmosphere and the reacting solids. These results indicate that, although both variables contribute to the reduction performance, the increase in temperature plays the dominant role in accelerating the reaction under the investigated conditions.
Table 3.
Main operating conditions of the IFRK experiments.
3.1.1. Heating-Rate Behaviour
The actual heating rate was calculated from the measured temperature records rather than being taken only from the programmed furnace settings. For the magnesite experiments, the nominal rates reported during the campaign were approximately 8.3 °C min−1 for the 800 °C run, 8.0 °C min−1 for the 900 °C run and 9.8 °C min−1 for the 1000 °C run.
The average measured heating rate was calculated over the full temperature ramp. Local heating rates were also determined over successive temperature intervals in order to identify changes that were not visible from a single average value. For the calcination experiments, particular attention was given to the region between approximately 500 and 700 °C, corresponding to the principal MgCO3 decomposition interval identified by TG–DTA.
A reduction in the local heating rate within this interval, if accompanied by increased heater demand and rising CO2 concentration, would be consistent with the additional thermal demand of the endothermic calcination reaction. Such behaviour was only attributed to decomposition, where the temperature, heater and gas signals showed a corresponding temporal response. To better understand the evolution of the reduction process, the outlet-gas composition was continuously monitored throughout each experiment. The parameters presented in Table 4 provide complementary information to the solid-phase characterisation by illustrating how the gaseous products evolved during reduction. The recorded gas profiles reveal a clear dependence on the operating temperature, with higher temperatures leading to a faster transition through the active reaction stage and earlier stabilisation of the outlet-gas composition. Overall, these observations are consistent with the expected behaviour of hydrogen-assisted reduction reactions and confirm that the experimental conditions remained stable throughout the testing period.
Table 4.
Average and local heating rates determined from the IFRK temperature records.
The calcination runs differed both in initial sample mass and programmed heating rate. The laterite experiments differed in particle-size fraction and hydrogen treatment. Heating-rate differences were therefore treated as part of the actual operating history of each run and not as the isolated effect of temperature.
The calcination duration decreased from 155 min at 800 °C to 116 min at 1000 °C. This trend cannot be attributed only to the setpoint because the runs also differed in initial mass and heating rate. Similarly, the shorter durations of the 1000 °C reduction runs partly reflect the shorter H2-treatment period applied at that temperature. Operational consistency was assessed based on the IFRK’s ability to complete the programmed thermal and atmosphere sequence without sustained failure of temperature or gas control.
3.1.2. Missing and Flagged Measurements
The completeness of the kiln controller, gas analyser and inlet-flow datasets was evaluated before calculation of the operational and reaction-specific indicators. For each run, the assessment considered the number of expected one-minute observations, original missing values, observations reconstructed by interpolation, remaining missing values and measurements reaching the upper analyser limit.
Short internal gaps in temperature, heater output, CO2 concentration and inlet flow were reconstructed using the linear interpolation. Interpolation was applied only when the gap was bounded by valid observations and did not coincide with a documented gas-switching event, calibration period or operational intervention. Missing O2 and H2 measurements were not interpolated. CO2 measurements at the analyser ceiling were classified as censored rather than missing because they confirmed that the concentration had reached or exceeded the measurement range without providing the true value above that limit.
The results presented in Table 5 provide an overall comparison of the different operating conditions and demonstrate how the combined effect of temperature and particle size influences the reduction performance of the laterite. Although reducing the particle size improves the contact between hydrogen and the reacting material, the experimental results clearly show that temperature has a much greater influence on the overall reduction behaviour. The higher operating temperature significantly accelerates the reaction, allowing similar or improved reduction levels to be achieved within considerably shorter treatment times. From a practical perspective, these findings highlight the importance of carefully selecting the operating temperature in order to maximise process efficiency while maintaining reasonable energy requirements, providing useful guidance for the future scale-up of the electrified indirect-fired rotary kiln technology.
Table 5.
Summary of the principal data-quality indicators for the IFRK experiments.
For the calcination experiments, the temperature and heater-output gaps were fully reconstructed in all three runs. The affected fraction was 11.54% in Calcination #1, 11.94% in Calcination #2 and 3.42% in Calcination #3. All temperature and heater-output values were present after preprocessing. The censored CO2 values were retained for the identification of the duration of elevated CO2 release but were not interpreted as exact concentrations. Consequently, the CO2 profiles remained suitable for identifying reaction onset, periods of sustained gas evolution and reaction completion, although the true peak concentrations could not be determined during analyser-limited intervals. The inlet-flow signal was complete in Calcination #2 and Calcination #3. Calcination #1 contained 3.21% interpolated inlet-flow observations. Given the limited extent of these reconstructed values, the overall interpretation of gas-flow stability was not considered significantly affected.
The reduction experiments generally exhibited high data completeness. Reduction #1, Reduction #2 and Reduction #3 showed only minor fractions of interpolated kiln-controller observations, ranging from 0.87% to 2.68%. The corresponding H2 signals were affected by missing values at the same low levels, indicating that the principal atmosphere transitions and reduction stages could be interpreted with confidence.
Reduction #4 exhibited substantially lower data completeness than the other reduction runs. A total of 44.44% of kiln-controller observations required interpolation, while 24.24% of the H2 measurements were missing. In addition, 4.87% of the inlet-flow observations were interpolated. These values indicate a markedly greater degree of uncertainty in the detailed temporal behaviour of this experiment compared with the other reduction runs. Despite these limitations, Reduction #4 was retained in the analysis because the available measurements still captured the overall progression of the experiment. However, interpretation of this run was restricted primarily to broader process trends rather than detailed short-term fluctuations in temperature, gas composition or reaction behaviour. Overall, the datasets captured the principal heating, reaction and atmosphere-transition stages of the IFRK experimental campaign.
3.2. Magnesite Calcination
The magnesite calcination experiments were evaluated by combining the synchronised thermal and outlet-gas measurements with the solid mass balance, TG–DTA results and particle-size distributions of the treated products. The three experiments were performed at setpoint temperatures of 800, 900 and 1000 °C under a continuous nitrogen atmosphere.
3.2.1. Thermal Profiles
All three experiments showed a progressive temperature increase from near-ambient conditions toward the selected treatment temperature. The 800 °C run had the longest analysed duration, followed by the 900 °C and 1000 °C runs. The corresponding total durations were 155, 133 and 116 min, respectively.
Figure 6 presents the synchronised kiln-temperature and outlet-CO2 profiles for the three magnesite calcination experiments conducted at 800, 900 and 1000 °C. The combined representation allows the thermal evolution of each run to be related directly to the onset, sustained period and depletion of the CO2 signal.
Figure 6.
Measured kiln-temperature and outlet-CO2 concentration profiles during magnesite calcination at setpoint temperatures of 800, 900 and 1000 °C.
In each experiment, the outlet CO2 concentration remained close to the baseline during the initial heating stage and increased as the kiln temperature approached the magnesite decomposition range. The increase in CO2 occurred while the temperature continued to rise, indicating that decomposition developed progressively during the heating ramp rather than only after the final setpoint had been reached.
The temperature profiles also show that the kiln did not immediately enter a prolonged isothermal holding stage at the beginning of CO2 evolution. Instead, a substantial part of the decomposition occurred under non-isothermal conditions. This is important because differences in the CO2 profiles reflect not only the final setpoint but also the heating rate and the time spent within the active decomposition interval.
For the 800 °C experiment, the temperature increased to approximately the selected treatment condition and remained close to this level while the CO2 concentration declined from the analyser-limited interval toward the baseline. The longer depletion stage indicates that completion of the gas-evolution process required additional time after the kiln approached 800 °C.
In the 900 °C experiment, CO2 increased sharply during the later part of the temperature ramp, remained at the analyser limit for a sustained period and then declined as the kiln approached and slightly exceeded the nominal treatment temperature. The depletion stage was shorter than that observed at 800 °C.
At 1000 °C, the temperature increased at the highest measured rate. The CO2 concentration reached the analyser ceiling earlier relative to the total run duration and remained saturated during a substantial portion of the heating ramp. A rapid decrease followed near the end of the thermal programme, resulting in the shortest total analysed duration among the three experiments.
3.2.2. CO2 Evolution
The outlet CO2 response exhibited the same general sequence in all three calcination experiments: an initial baseline period, a progressive increase in concentration, a plateau at the analyser limit, and a final depletion stage. This sequence was used to identify the main stages of calcination and to compare the development of gas evolution under the three temperature programmes.
At the beginning of each experiment, the measured CO2 concentration remained close to the background level. As heating progressed and the material entered the decomposition range, the outlet concentration began to increase. This increase occurred while the kiln temperature was still rising, confirming that calcination started during the heating ramp and not only after the final setpoint had been reached.
In all three runs, the CO2 concentration eventually reached the upper measurement limit of the analyser, at approximately 3.2 vol.%. The corresponding plateau therefore represents an analyser-limited interval rather than a true constant CO2 concentration. These observations were treated as censored values and were used only to identify the duration of the main gas-evolution period. They were not interpreted as exact peak concentrations and were excluded from the calculation of the reported maximum concentration slopes.
Figure 7, Figure 8 and Figure 9 present the derivative-based analysis of the three calcination runs at 800, 900 and 1000 °C, respectively. In each figure, the measured CO2 concentration is shown together with the temperature-rate profile, the concentration change per unit time and the concentration change per unit temperature. Flagged points were excluded from the derivative assessment.
Figure 7.
Temperature-rate profile, outlet-CO2 concentration and calculated CO2 signal slopes for the 800 °C magnesite calcination experiment.
Figure 8.
Temperature-rate profile, outlet-CO2 concentration and calculated CO2 signal slopes for the 900 °C magnesite calcination experiment.
Figure 9.
Temperature-rate profile, outlet-CO2 concentration and calculated CO2 signal slopes for the 1000 °C magnesite calcination experiment.
For the 800 °C experiment, the main temperature ramp proceeded at an average rate of approximately 8.3 °C min−1. The kiln reached approximately 410 °C at minute 48 and approximately 800 °C at minute 95. The maximum measured CO2 concentration-rise slope before analyser saturation was approximately 34.4 percentage points min−1, while the corresponding temperature-normalised slope was approximately 4.17 percentage points °C−1. Following the main elevated-concentration interval, the CO2 signal declined with a maximum negative slope of approximately −28.5 percentage points min−1. The later part of the experiment showed a relatively mild temperature decrease, with a local temperature rate of approximately −0.075 °C min−1. The overall depletion stage was comparatively long, indicating that the return of the outlet CO2 signal toward the background concentration was slower than in the higher-temperature runs.
In the 900 °C experiment, the main heating ramp proceeded at approximately 8 °C min−1. The kiln temperature reached approximately 408 °C at minute 50, 800 °C at minute 99 and 900 °C at minute 112. The CO2 signal increased more sharply than in the 800 °C case, with a maximum concentration-rise slope of approximately 44.5 percentage points min−1 and a temperature-normalised slope of approximately 5.55 percentage points °C−1. After the analyser-limited interval, the final decrease in CO2 was also steeper, with a minimum concentration slope of approximately −56.4 percentage points min−1. The temperature decreased more noticeably than in the 800 °C run during the final stage, with a local temperature rate of approximately −0.25 °C min−1. Compared with the 800 °C experiment, the 900 °C run therefore showed both a steeper measurable signal increase and a shorter, sharper depletion period.
The 1000 °C experiment exhibited the fastest thermal profile, with an average temperature rise of approximately 9.8 °C min−1. The kiln reached approximately 409 °C at minute 42, 800 °C at minute 82, 900 °C at minute 93 and 1000 °C at minute 103. The measurable CO2 response was the sharpest among the three experiments. The maximum concentration-rise slope reached approximately 60.6 percentage points min−1, while the corresponding concentration change per degree Celsius was approximately 6.10 percentage points °C−1. The final decline was also the steepest, with a minimum concentration slope of approximately −77.1 percentage points min−1. This behaviour is consistent with a more abrupt measurable CO2 response and a shorter depletion stage under the 1000 °C thermal programme.
Taken together, the three figures show a systematic increase in the steepness of the measurable CO2 response with increasing treatment temperature. The maximum concentration-rise slope increased from 34.4 percentage points min−1 at 800 °C to 44.5 percentage points min−1 at 900 °C and 60.6 percentage points min−1 at 1000 °C. The corresponding temperature-normalised slopes increased from 4.17 to 5.55 and 6.10 percentage points °C−1, respectively. A similar trend was observed during depletion, where the most negative concentration slope increased in magnitude from −28.5 percentage points min−1 at 800 °C to −56.4 percentage points min−1 at 900 °C and −77.1 percentage points min−1 at 1000 °C.
3.2.3. Effect of Target Temperature
Increasing the target temperature from 800 to 1000 °C was associated with a shorter overall treatment period and a sharper measurable CO2 response. The total analysed duration decreased from 155 min at 800 °C to 133 min at 900 °C and 116 min at 1000 °C. The reduction in duration was mainly associated with the faster transition from the analyser-limited CO2 interval to the selected depletion endpoint as shown in Table 6.
Table 6.
Temperature-related CO2 response during magnesite calcination.
The three runs entered the principal magnesite decomposition range while the kiln temperature was still increasing. The 1000 °C experiment reached the relevant temperature thresholds earlier because it was operated at the highest heating rate. The kiln reached approximately 800 °C at minute 82 in the 1000 °C run, compared with minute 95 in the 800 °C run and minute 99 in the 900 °C run. The 900 °C and 1000 °C experiments subsequently continued to higher temperatures, increasing the time-integrated thermal exposure above the main decomposition range before the CO2 endpoint was reached.
The extended depletion observed at 800 °C suggests that the remaining carbonate decomposed more slowly near the lower treatment temperature. By contrast, continued heating toward 900 and 1000 °C provided a greater thermal driving force for completion of the decomposition reaction, resulting in a more rapid decline of the outlet CO2 signal. The 1000 °C setpoint was therefore the most effective in reducing the time required to reach the operational completion criterion.
Figure 10 compares the three calcination experiments using normalised duration. This representation removes the effect of different total run lengths and allows the relative position of the main thermal- and gas-evolution stages to be compared directly.
Figure 10.
Normalised kiln-temperature and outlet-CO2 concentration profiles for the magnesite calcination experiments at 800, 900 and 1000 °C.
The normalised profiles show that the onset of the main CO2 increase occurred at a broadly similar relative stage of the experiments, although the subsequent evolution differed. The 800 °C run entered the analyser-limited interval earlier relative to its total duration and exhibited the longest depletion stage. The 900 °C experiment showed an intermediate response, while the 1000 °C run maintained the analyser-limited concentration until a later fraction of the normalised cycle and then transitioned rapidly toward depletion.
The temperature profiles also confirm that the higher-temperature runs continued to increase throughout a larger portion of the normalised experiment, whereas the 800 °C run reached its treatment temperature earlier and remained close to the setpoint while CO2 depletion proceeded. This comparison supports the conclusion that the higher-temperature programmes produced a sharper and more compressed final gas-response stage.
The progression across the three experiments was consistent: higher-temperature operation produced a steeper measurable CO2 increase, a more rapid depletion stage and a shorter total treatment period. The solid mass balance and TG–DTA results presented in the following sections were used to determine whether these changes in gas-phase behaviour were accompanied by corresponding differences in the final degree of calcination.
3.2.4. Mass Balance and Product Recovery
The solid mass balance was evaluated from the initial magnesite mass and the mass of calcined product recovered after each experiment. The initial masses were 200 g for the 900 °C run, 100 g for the 800 °C run and 200 g for the 1000 °C run as shown in Table 7. The corresponding recovered masses were 95, 45 and 95 g, respectively.
Table 7.
Solid mass balance and product-recovery indicators for the magnesite calcination experiments.
The untreated material exhibited a TG mass loss of 48.63% over the carbonate-decomposition interval. Assuming complete removal of this thermally decomposable fraction, the theoretical residual solid mass was therefore calculated as 51.37% of the initial feed mass.
The theoretical residual masses were consequently 102.74 g for the 900 °C run, 51.37 g for the 800 °C run and 102.74 g for the 1000 °C run.
In each experiment, the measured recovered mass was lower than the TG-based theoretical residual mass. The differences between the theoretical and recovered masses were 7.74 g at 900 °C, 6.37 g at 800 °C and 7.74 g at 1000 °C.
The product-recovery efficiency, calculated as the ratio of recovered product mass to TG-based theoretical residual mass, was 92.47% for the 900 °C run, 87.60% for the 800 °C run and 92.47% for the 1000 °C run.
The lower recovery at 800 °C indicates that a larger fraction of the expected solid product was not recovered from the system. This difference cannot be interpreted as lower calcination performance because incomplete conversion would increase, rather than decrease, the final solid mass. The reduced measured mass is therefore more consistent with physical product loss during operation, discharge or sample handling.
The theoretical residual mass represented the expected solid remaining after complete decomposition, while the recovery efficiency described the fraction of that expected product that was physically retrieved. Chemical calcination degree was evaluated independently from the post-treatment TG–DTA results presented in Section 3.2.5.
3.2.5. TG-DTA Validation
TG–DTA measurements were used to verify whether carbonate remained in the magnesite after IFRK treatment.
Figure 11 compares the thermal behaviour of the untreated feed with that of the calcined product. The TG-DTA diagram before calcination refers to the sample used in all calcination runs, while the TG-DTA diagram after calcination refers to calcination #1.
Figure 11.
TG–DTA curves of magnesite before and after IFRK calcination. Green lines refer to TG curves, blue lines refer to DTA curves.
The untreated magnesite showed a dominant decomposition stage beginning at approximately 500 °C and ending near 700 °C. The measured mass loss over this interval was 48.63 wt.%, in agreement with the expected release of CO2 during the decomposition of MgCO3. The corresponding thermal event was also visible in the heat-flow curve, confirming that the principal mass change was associated with carbonate decomposition.
The TG curve of the treated product differed substantially from that of the untreated material. The pronounced mass-loss step observed in the raw magnesite was no longer present, and the residual mass change over the carbonate-decomposition interval was below 2 wt.%. The associated thermal response was also strongly reduced, indicating that only a limited amount of thermally decomposable carbonate remained after IFRK treatment. Using the TG-based definition introduced in Section 2.6.2
where Δmraw is the decomposition-related mass loss of the untreated material and Δmres is the residual mass loss of the treated product, the calcination degree can be estimated from the two thermograms.
Xcalc,TG = 1 − (Δmres/Δmraw)
With Δmraw equal to 48.63 wt.% and Δmres below 2 wt.%, the treated material achieved a TG-based calcination degree greater than approximately 95.9%. If the measured residual decomposition loss was below approximately 0.97 wt.%, the corresponding calcination degree exceeded 98%. The gas-phase, gravimetric and thermal analyses therefore provide complementary information. The outlet CO2 measurements identified the timing and duration of decomposition, the solid mass balance quantified product recovery, and TG–DTA independently confirmed that the recovered material contained only a small residual thermally decomposable carbonate fraction.
3.2.6. Particle-Size Transformation
Particle-size analysis showed that calcination in the rotating IFRK substantially altered the size distribution of the magnesite. Figure 12 compares the feed and calcined-product distributions using the retained-mass data and cumulative passing curves.
Figure 12.
Particle-size distribution of magnesite before and after IFRK calcination: (a) cumulative passing curve of the untreated feed and (b) cumulative passing curve of the calcined product.
Before treatment, the magnesite consisted predominantly of coarse particles. All material was below 22.4 mm, while 86.7% passed 16 mm, 70.2% passed 12.5 mm and 58.0% passed 10 mm. Only 27.8% of the feed was below 4 mm, 16.6% was below 2 mm and 10.6% was below 1.18 mm.
After calcination, the distribution shifted markedly toward smaller sizes. Approximately 95.4% of the product passed 16 mm, 91.6% passed 12.5 mm and 85.6% passed 5.613 mm. The proportion passing 2.8 mm reached 83.2%, while 71.1% was finer than 1.4 mm and 62.9% was below 1 mm. More than half of the recovered material, 54.0%, passed 0.8 mm. The results as shown in Table 8.
Table 8.
Characteristic particle sizes before and after magnesite calcination.
The reduction in D50 from approximately 8.45 to 0.72 mm corresponds to a decrease of about 91%, while D80 decreased by approximately 84%. These changes demonstrate that the treatment produced extensive fragmentation rather than a minor redistribution among adjacent sieve classes. The transformation can be attributed to the combined effects of thermal decomposition and mechanical motion within the kiln. The conversion of MgCO3 to MgO involves substantial CO2 release and a corresponding reduction in solid mass. Gas evolution from within the particles can generate internal pores, cracks and structural weakening. At the same time, continuous lifting, cascading and contact with the reactor wall promote breakage and attrition of the weakened calcined particles.
3.3. Laterite Hydrogen Reduction
The laterite reduction experiments were evaluated by combining the synchronised kiln-temperature and outlet-gas measurements with the sample mass balance and the mineralogical and microstructural characteristics of the treated products. Four experiments were performed using two particle-size fractions and two temperature setpoints. The fine fraction, below 1 mm, was treated at 800 °C in Reduction #1 and at 1000 °C in Reduction #3. The coarser fraction, between 1 and 2.5 mm, was treated at 800 °C in Reduction #2 and at 1000 °C in Reduction #4. The samples were heated under nitrogen before hydrogen was introduced at the selected treatment temperature. Hydrogen treatment was maintained for 35 min at 800 °C and 15 min at 1000 °C, followed by a final nitrogen purge.
3.3.1. Thermal and Atmosphere Profiles
Figure 13 presents the synchronised kiln-temperature and outlet-H2 concentration profiles for the four laterite reduction experiments. The profiles identify the main operating stages of each run: heating under nitrogen, transition to hydrogen, hydrogen breakthrough at the analyser, the treatment interval and the final return to nitrogen.
Figure 13.
Measured kiln-temperature and outlet-H2 concentration profiles during laterite reduction. Reduction #1 and Reduction #3 correspond to the −1 mm fraction treated at 800 and 1000 °C, respectively, while Reduction #2 and Reduction #4 correspond to the −2.5 + 1 mm fraction treated at 800 and 1000 °C, respectively.
The profiles at 800 °C included a 35 min hydrogen-treatment period. Both Reduction #1 and Reduction #2 showed a progressive outlet-H2 increase after gas switching, followed by a period in which the concentration approached a more stable level. The longer treatment duration allowed the breakthrough and stabilisation stages to be observed over a comparatively extended period.
At 1000 °C, hydrogen treatment was limited to 15 min. Reduction #3 and Reduction #4 therefore contained shorter reducing-atmosphere intervals. The higher temperature promoted a faster overall thermal programme, but the shorter treatment duration reduced the period available for observing a prolonged outlet-H2 stabilisation stage.
The temperature and atmosphere profiles confirmed that the intended sequence was achieved in all four experiments: inert heating, transition to a hydrogen-containing atmosphere, controlled hydrogen exposure and final nitrogen purging. No sustained presence of hydrogen was observed before the programmed gas-switching stage.
3.3.2. Hydrogen-Consumption Behaviour
The hydrogen-consumption behaviour was evaluated from the measured inlet flow, treatment duration and outlet-H2 concentration profile. For each experiment, the total hydrogen supplied to the reactor was compared with the estimated hydrogen detected in the outlet stream over the selected treatment interval as shown in Table 9.
Table 9.
Hydrogen balance for the laterite hydrogen-reduction comparison.
The calculated quantities are reported as apparent values because the initial transition from nitrogen to hydrogen involved gas displacement, mixing and filling of the kiln, connecting lines and analyser circuit. In addition, the analyser sample flow did not independently represent the complete reactor outlet flow. The difference between inlet and outlet hydrogen therefore includes both chemical consumption and unresolved gas-holdup effects.
The total inlet hydrogen volume reflected the different treatment durations applied at the two temperatures. The 800 °C experiments received hydrogen for 35 min, resulting in inlet volumes of 19.25 L for Reduction #1 and 20.68 L for Reduction #2. The 1000 °C experiments were maintained under hydrogen for 15 min, giving inlet volumes of 9.32 L for Reduction #3 and 8.25 L for Reduction #4.
The estimated outlet volumes were 4.78 L for Reduction #1, 10.09 L for Reduction #2, 1.89 L for Reduction #3 and 1.65 L for Reduction #4. The corresponding apparent hydrogen-consumption volumes were therefore 14.47, 10.59, 7.43 and 6.60 L, respectively.
The highest absolute apparent hydrogen consumption was observed in Reduction #1, followed by Reduction #2. This result is partly explained by the longer hydrogen-treatment period at 800 °C, which supplied approximately twice the hydrogen volume used in the 1000 °C experiments. Absolute consumption should therefore not be compared independently of treatment duration.
When expressed relative to the inlet quantity, apparent utilisation ranged from 51.22% to 80.05%. Reduction #2 showed the lowest value, while the remaining three experiments gave apparent utilisation values between approximately 75 and 80%.
At 800 °C, the fine fraction showed a higher apparent hydrogen utilisation than the coarser fraction. Reduction #1 consumed an apparent 75.15% of the supplied hydrogen, compared with 51.22% for Reduction #2. This behaviour suggests that the fine fraction interacted more strongly with the supplied hydrogen during the 800 °C trial. A smaller particle size provides a greater external surface area and shorter internal transport distances, which may facilitate gas–solid contact and oxygen removal. However, the apparent balance also contains the influence of gas displacement and outlet-flow estimation, so it cannot by itself establish a quantitative particle-size effect on reduction degree.
At 1000 °C, the two particle-size fractions produced similar apparent utilisation values. Reduction #3 reached 79.71%, while Reduction #4 reached 80.05%. This similarity suggests that the influence of particle size was less pronounced under the higher temperature setpoints or that the elevated temperature compensated for transport limitations associated with the coarser fraction.
3.3.3. Effect of Temperature
Figure 14, Figure 15, Figure 16 and Figure 17 present the temperature-rate, outlet-H2 concentration and H2 signal-slope profiles for the four experiments. The reported slopes describe the rate of change of the measured H2 concentration and not a physical hydrogen-consumption rate.
Figure 14.
Temperature-rate profile, outlet-H2 concentration and calculated H2 signal slopes for Reduction #1, performed with the −1 mm laterite fraction at 800 °C.
Figure 15.
Temperature-rate profile, outlet-H2 concentration and calculated H2 signal slopes for Reduction #3, performed with the −1 mm laterite fraction at 1000 °C.
Figure 16.
Temperature-rate profile, outlet-H2 concentration and calculated H2 signal slopes for Reduction #2, performed with the −2.5 + 1 mm laterite fraction at 800 °C.
Figure 17.
Temperature-rate profile, outlet-H2 concentration and calculated H2 signal slopes for Reduction #4, performed with the −2.5 + 1 mm laterite fraction at 1000 °C.
For the fine fraction treated at 800 °C, hydrogen was introduced after the kiln reached approximately 800 °C. The outlet concentration then increased progressively, with a maximum measured H2 concentration-rise slope of approximately 16.7 percentage points min−1. As the signal approached a relatively stable level, the slope decreased to approximately 0.117 percentage points min−1.
Following completion of the hydrogen supply and introduction of the final nitrogen purge, the H2 concentration decreased rapidly. The most negative measured slope was approximately −28.5 percentage points min−1. The extended hydrogen-treatment period allowed the outlet concentration to approach a quasi-stable condition before purging.
At 1000 °C, the fine fraction showed a steeper initial H2 response. The maximum concentration-rise slope reached approximately 22.1 percentage points min−1, compared with 16.7 percentage points min−1 at 800 °C. A secondary positive slope of approximately 5.5 percentage points min−1 was observed during the later part of the rising concentration profile. The maximum negative slope during the subsequent decline was approximately −23.5 percentage points min−1. Although the initial rise was sharper than at 800 °C, the 15 min treatment period limited the time available for development of a prolonged stable outlet concentration. For the fine fraction, the higher temperature therefore produced a faster measurable H2 breakthrough response. The apparent hydrogen utilisation also increased from 75.15% at 800 °C to 79.71% at 1000 °C. This difference was moderate, particularly considering that the treatment time was reduced from 35 to 15 min.
For the coarser fraction at 800 °C, the maximum H2 concentration-rise slope was approximately 15.4 percentage points min−1. The signal subsequently approached a slowly changing condition, with a slope of approximately 0.0617 percentage points min−1. The final nitrogen purge produced a maximum negative slope of approximately −28.2 percentage points min−1. The shape of the profile was broadly similar to that of Reduction #1, although the apparent hydrogen balance showed substantially lower utilisation for the coarser material.
At 1000 °C, the coarser fraction showed a maximum H2 concentration-rise slope of approximately 15.6 percentage points min−1, which was close to the value measured at 800 °C. A later positive slope of approximately 5.5 percentage points min−1 was identified during the development of the outlet-H2 profile.
The decline following termination of hydrogen supply was steeper than at 800 °C, reaching approximately −35.5 percentage points min−1. The apparent hydrogen utilisation increased markedly from 51.22% at 800 °C to 80.05% at 1000 °C.
For the coarser fraction, the principal temperature-related difference was therefore not a substantial increase in the maximum H2 rise slope, but a higher apparent utilisation and a sharper final decline. This suggests that the higher temperature improved the overall interaction between hydrogen and the coarser particles, despite the shorter treatment period. Table 10 summarises the main temperature-related indicators for both particle-size fractions.
Table 10.
Temperature-related hydrogen-response indicators for laterite reduction.
Figure 18 compares the temperature and H2 concentration profiles using normalised experimental duration. This removes the difference in total run length and allows the relative timing of hydrogen introduction, breakthrough and purging to be compared directly.
Figure 18.
Normalised kiln-temperature and outlet-H2 concentration profiles for the four laterite reduction experiments.
The normalised profiles show that hydrogen was introduced earlier relative to the total duration of the 800 °C experiments. In Reduction #1 and Reduction #2, the H2 concentration began to increase at approximately 55–60% of the normalised cycle and remained elevated over a comparatively long interval. Overall, operation at 1000 °C produced a faster and more compressed H2 response and increased apparent hydrogen utilisation despite the shorter treatment period. The temperature effect was most evident for the coarser fraction, whereas the fine fraction already showed relatively high apparent utilisation at 800 °C.
3.3.4. XRD Phase Evolution
XRD analysis was used to examine the mineralogical changes produced by hydrogen treatment and to assess the progression of the iron- and nickel-bearing phases with temperature. Figure 19 and Figure 20 show the diffraction patterns of the laterite samples treated at 800 and 1000 °C. To obtain a more complete understanding of the reduction process, the XRD findings were interpreted together with the SEM–EDS observations. While XRD identifies the changes in the crystalline phases, SEM–EDS provides a comparative view of how the elemental composition evolves, particularly with respect to oxygen and metallic elements. Together, these complementary techniques support the interpretation of the experimental results.
Figure 19.
XRD pattern of the −1 mm lateritic ore after hydrogen reduction at 800 °C (Process #1).
Figure 20.
XRD pattern of the −1 mm lateritic ore after hydrogen reduction at 1000 °C (Process #3).
At 800 °C, the diffraction pattern indicated that reduction had progressed beyond the original hematite-rich condition but remained incomplete. Reflections assigned to magnetite and wüstite were present together with residual hematite-related peaks, indicating the coexistence of several stages of the iron-oxide reduction sequence. The presence of magnetite and wüstite confirms that hydrogen removed part of the oxygen from the original iron oxides. However, the persistence of oxidised iron-bearing phases shows that the conversion to metallic iron was not complete under the 800 °C treatment. A nickel-related metallic phase was also identified in the 800 °C product. Its presence indicates that at least part of the nickel oxide fraction was reduced under these conditions. Nevertheless, the intensity and overlap of the identified reflections do not permit calculation of the bulk metallic nickel fraction.
At 1000 °C, the diffraction pattern showed clearer evidence of advanced reduction. Metallic iron and metallic nickel were identified together with residual wüstite and iron-bearing silicate phases. The appearance of metallic iron represents a further progression compared with the 800 °C product, where intermediate iron oxides remained more prominent. The reduced importance or absence of distinct hematite reflections at 1000 °C indicates that the initial Fe2O3 phase had been substantially transformed. Wüstite remained detectable, showing that complete conversion of all iron-bearing material to metallic iron was not achieved. The coexistence of Fe, FeO and fayalite-related phases therefore indicates an advanced but heterogeneous reduction state.
The comparison between the two temperatures therefore indicates a clear progression in the reduction pathway. At 800 °C, the product was characterised mainly by intermediate iron oxides, together with residual oxidised and silicate-bound phases. At 1000 °C, metallic iron and nickel became more evident, while hematite was no longer a dominant identified phase. This temperature-related evolution is consistent with the gas-phase results. The 1000 °C experiments showed high apparent hydrogen utilisation despite the shorter hydrogen-treatment period. The XRD results provide independent solid-phase evidence that the higher-temperature programme promoted a more advanced reduction of the iron- and nickel-bearing phases.
Diffraction peaks that may be attributed to metallic Ni were observed; however, their interpretation should be made with caution given the relatively low nickel content of the feed material and the potential overlap with neighbouring Fe-bearing phases. For this reason, the identification of metallic Ni is considered tentative and is interpreted in conjunction with the evolution of the iron-containing phases and the complementary SEM–EDS observations. Furthermore, under the reducing conditions investigated in this study, the formation of Fe–Ni alloy phases cannot be ruled out.
3.3.5. SEM–EDS Observations
SEM–EDS analysis clearly demonstrates the progressive transformation of the ore as the treatment temperature increases, providing direct evidence of the enhanced reduction achieved under the higher-temperature conditions. The microstructural evolution is also in excellent agreement with the XRD results, which indicate the progressive elimination of the iron oxide phases and increasing formation of metallic products. After reduction at 800 °C, the original compact oxide matrix had already undergone substantial modification. The particles exhibit a heterogeneous morphology consisting of partially reduced oxide regions together with newly formed metallic domains, confirming that hydrogen effectively penetrated the particle bed and initiated reduction throughout the material. The formation of pores and interconnected microchannels is evident across the microstructure, reflecting the continuous removal of lattice oxygen and the evolution of water vapour during the reduction reactions. These newly formed pathways facilitate hydrogen diffusion into the particle interior, allowing the reaction front to progress beyond the external surface and improving gas–solid contact as the reduction proceeds.
The EDS analyses further support these observations by revealing widespread enrichment of iron and nickel together with a noticeable decrease in oxygen intensity. Although oxygen-bearing regions are still present, their non-uniform distribution indicates that reduction has progressed extensively while residual oxides remain within portions of the particles. This behaviour is consistent with the expected reduction mechanism at intermediate temperatures, where hydrogen diffusion and oxygen transport through the developing product layer continue to influence the overall reaction rate. Figure 21 and Figure 22 present representative SEM images and EDS analyses of the samples treated at 800 and 1000 °C, respectively.
Figure 21.
Representative SEM images and local EDS analyses of the −1 mm laterite fraction after hydrogen treatment at 800 °C for 35 min.
Figure 22.
Representative SEM micrographs and local EDS analyses of the −1 mm laterite fraction after hydrogen treatment at 1000 °C for 15 min.
A much more advanced stage of reduction is observed after treatment at 1000 °C. The particle morphology changes considerably, with the oxide framework being largely replaced by a more continuous metallic structure. The internal pore network becomes more developed, indicating that oxygen removal proceeds more extensively and that gaseous products are able to escape more readily from the reacting particles. These structural changes reduce internal diffusion limitations and promote more efficient hydrogen transport, allowing the reduction reaction to proceed deeper into the particle within a significantly shorter treatment time.
The elemental distributions obtained by EDS clearly reflect this enhanced reduction. Metallic iron- and nickel-rich regions become more abundant and are distributed more uniformly throughout the examined microstructure, while the oxygen signal is considerably reduced compared with the material treated at 800 °C. These observations are fully consistent with the XRD results, which show the disappearance of hematite following treatment at 1000 °C, indicating that the higher operating temperature substantially increases the degree of metallization and promotes a more complete transformation of the iron-bearing phases.
The comparison between the two operating temperatures highlights the dominant influence of temperature on hydrogen reduction under the controlled conditions provided by the airtight electrified indirect-fired rotary kiln. While treatment at 800 °C already produces significant reduction and initiates the formation of metallic iron and nickel, the material retains locally unreduced oxide regions. Increasing the temperature to 1000 °C results in a markedly higher degree of reduction, a more homogeneous metallic microstructure and a significant decrease in residual oxygen-containing phases, despite the hydrogen-treatment time being reduced from 35 min to only 15 min.
These results show that the chamber maintains stable and highly favourable conditions for hydrogen-based reduction across the investigated temperature range. The airtight configuration prevents air ingress and minimises reoxidation, allowing the reducing atmosphere to be maintained throughout the experiments. Under these controlled conditions, increasing the operating temperature substantially accelerates the reduction kinetics and enhances hydrogen utilisation, leading to more efficient oxygen removal and greater metallisation. Overall, the combined SEM–EDS and XRD results confirm that although effective reduction can already be achieved at 800 °C, operation at 1000 °C provides a significantly more complete conversion of the lateritic ore, highlighting the potential of the proposed electrified indirect-fired rotary kiln for rapid, low-carbon ferronickel processing.
4. Discussion
The present work demonstrates that the improved performance achieved during both magnesite calcination and hydrogen-assisted laterite reduction originates from the combined operation of an airtight reactor and an electrified IFRK rather than from either feature individually. Conventional rotary kilns rely on combustion gases to provide both heat and the reaction atmosphere, making thermal control and gas composition intrinsically coupled. In contrast, the proposed reactor physically separates heat generation from the reacting material while maintaining a sealed reaction chamber, allowing temperature and atmosphere to be controlled independently throughout the process. This operating principle creates a stable thermochemical environment in which heat transfer is more uniform, air infiltration is eliminated and the composition of the process gas remains essentially constant. Such conditions become increasingly important as the metallurgical industry shifts towards hydrogen-based processing, where even small changes in oxygen partial pressure or hydrogen concentration can influence reaction pathways, gas utilisation and product quality.
The benefits of this integrated approach are evident in both investigated processes. During the calcination of magnesite, the combination of uniform indirect heating, continuous mixing, and a controlled atmosphere sped up the breakdown of carbonates, leading to a conversion rate of over 98% in much shorter treatment times than what is usually needed in industrial rotary kilns. The shorter residence time is not solely a consequence of higher operating temperature but also reflects improved reaction conditions inside the rotary kiln. Continuous removal of the evolved CO2 limits local equilibrium effects that can retard decomposition, while the homogeneous thermal field ensures that particles experience similar heating histories throughout the rotating bed. Together, these factors enhance reaction kinetics, reduce unnecessary heat losses associated with prolonged operation and increase reactor productivity without compromising product quality. The results therefore suggest that improving the reaction environment can be as important as increasing the supplied thermal energy when seeking higher calcination efficiency.
The same reactor characteristics proved even more beneficial during hydrogen-assisted laterite reduction. Unlike conventional systems, where hydrogen may be diluted by combustion products or consumed through air infiltration, the airtight configuration preserves a stable reducing atmosphere throughout the treatment. Consequently, hydrogen is primarily used for oxide reduction, improving both process efficiency and hydrogen utilisation. This effect becomes particularly evident when comparing the two operating temperatures. Increasing the reduction temperature from 800 °C to 1000 °C reduced the required hydrogen treatment time from 35 min to only 15 min, demonstrating the strong acceleration of reduction kinetics once favourable thermodynamic conditions are combined with efficient heat transfer and a stable hydrogen atmosphere. This short treatment duration compares favourably with earlier hydrogen-reduction studies of lateritic ores, in which treatment periods exceeding three hours were reported under additive-assisted conditions [17]. Such a substantial reduction in residence time directly increases throughput while simultaneously lowering the total hydrogen requirement and the electrical energy associated with prolonged furnace operation. Since hydrogen cost remains one of the principal challenges for industrial implementation of low-carbon metallurgy, reducing both hydrogen consumption and treatment time represents a significant technological advantage.
Beyond the experimental results themselves, the study highlights the importance of combining electrification with atmosphere isolation as an innovative decarbonised technology for high-temperature metallurgical reactors. Electrification alone cannot fully exploit the benefits of hydrogen if the reaction atmosphere remains poorly controlled, while airtightness alone cannot deliver the rapid and responsive thermal management offered by electrical heating. The synergy between these two concepts enables precise control of both thermal and chemical conditions, creating favourable conditions for faster reaction kinetics, improved gas efficiency and greater process flexibility. Furthermore, because the exhaust gas is not diluted by combustion products, the reactor provides favourable conditions for future hydrogen recovery and recirculation, offering an additional pathway for reducing operating costs and improving overall process sustainability. Although demonstrated at laboratory scale, these results indicate that airtight electrified rotary kilns could provide an effective platform for next-generation calcination and hydrogen-reduction processes, supporting the transition towards highly efficient, low-carbon and renewable electricity-driven metallurgical production.
5. Conclusions
This study demonstrated the laboratory-scale feasibility of an airtight electrified indirect-fired rotary kiln for two distinct thermochemical applications: magnesite calcination, and hydrogen reduction of lateritic ore. The reactor maintained controlled thermal and atmospheric conditions while enabling synchronised monitoring of temperature, gas composition and flow-related variables.
Magnesite calcination was successfully followed through the evolution and depletion of CO2. Higher treatment temperatures shortened the overall process duration and produced a sharper measurable gas response. TG–DTA confirmed extensive carbonate decomposition, while the mass-balance and particle-size results showed that calcination was accompanied by substantial fragmentation and some physical product loss.
During laterite reduction, the reactor achieved the required sequence of nitrogen heating, hydrogen treatment and final purging. The gas-phase results indicated substantial apparent hydrogen interaction, while XRD and SEM–EDS confirmed progressive transformation of iron- and nickel-bearing phases. Reduction remained partial at 800 °C and advanced further at 1000 °C, where metallic Fe- and Ni-rich regions became more evident, although residual oxides and silicate-bound phases persisted. The results highlight the potential benefits of hydrogen as a reducing agent, including the possibility of accelerating reduction kinetics, improving metal liberation and selectivity, and reducing direct carbon-related emissions compared with conventional reductants. These characteristics make hydrogen a promising pathway for optimising future laterite processing routes, particularly when coupled with electrified heating systems.
The main contribution of the work is the integration of indirect electrical heating, sealed rotary operation, controlled gas atmospheres and synchronised process monitoring within a common experimental platform. The results also confirm that online gas measurements must be combined with solid characterisation to assess reaction progress reliably. Further development should focus on complete outlet-gas measurement, direct monitoring of water vapour, improved bed-temperature characterisation and replicated experimental campaigns. These improvements are required to support quantitative process modelling, optimisation, scale-up and future digital twin applications.
Author Contributions
Conceptualization, A.P. and C.P.; methodology, C.P.; software, C.P.; validation, A.P.; formal analysis, C.P.; investigation, C.P. and A.G.; resources, A.G.; data curation, C.P.; writing—original draft preparation, A.G. and C.P.; writing—review and editing, A.P.; visualisation, A.P.; supervision, A.P.; project administration, A.P.; funding acquisition, A.P. All authors have read and agreed to the published version of the manuscript.
Funding
This research has received funding from the European Union’s Horizon Europe research and innovation program under a grant agreement with number 101178403, project PRIM-ROCK.
Data Availability Statement
The original contributions presented in this study are included in the article. Further inquiries can be directed to the corresponding author.
Acknowledgments
The feed material (magnesite) used throughout the calcination experiments was provided by TERNA MAG S.A. (Fournoi Mantoudiou, Euboea, Greece), a Greek producer of magnesite and magnesia products. The feed material (lateritic ore) used throughout the roasting experiments was provided by LARCO General Mining & Metallurgical Company S.A (Larymna, Fthiotida, Greece), a Greek ferronickel producer.
Conflicts of Interest
The authors declare no conflicts of interest.
References
- AR6 Synthesis Report: Climate Change 2023. Available online: https://www.ipcc.ch/report/ar6/syr/ (accessed on 23 June 2026).
- Leicher, J.; Giese, A.; Wieland, C. Electrification or Hydrogen? The Challenge of Decarbonizing Industrial (High-Temperature) Process Heat. J 2024, 7, 439–456. [Google Scholar] [CrossRef] [Scilit]
- Quevedo Parra, S.; Romano, M.C. Decarbonization of cement production by electrification. J. Clean. Prod. 2023, 425, 138913. [Google Scholar] [CrossRef] [Scilit]
- Sun, C.; Wang, J.; Zhou, M.; Hong, L.; Ai, L.; Wen, L. Process Path for Reducing Carbon Emissions from Steel Industry—Combined Electrification and Hydrogen Reduction. Processes 2024, 12, 108. [Google Scholar] [CrossRef] [Scilit]
- Miškovičová, Z.; Legemza, J.; Demeter, P.; Buľko, B.; Hubatka, S.; Hrubovčáková, M.; Futáš, P.; Findorák, R. An Overview Analysis of Current Research Status in Iron Oxides Reduction by Hydrogen. Metals 2024, 14, 589. [Google Scholar] [CrossRef] [Scilit]
- Zakeri, A.; Coley, K.S.; Tafaghodi, L. Hydrogen-Based Direct Reduction of Iron Oxides: A Review on the Influence of Impurities. Sustainability 2023, 15, 13047. [Google Scholar] [CrossRef] [Scilit]
- Heidari, A.; Niknahad, N.; Iljana, M.; Fabritius, T. A Review on the Kinetics of Iron Ore Reduction by Hydrogen. Materials 2021, 14, 7540. [Google Scholar] [CrossRef] [Scilit] [PubMed]
- Ji, Y.; Chi, Z.; Yuan, S.; Chen, Y.; Li, Y.; Jiang, T.; Liu, X.; Zhang, W. Development and Application of Hydrogen-Based Direct Reduction Iron Process. Processes 2024, 12, 1829. [Google Scholar] [CrossRef] [Scilit]
- Cavaliere, P.; Perrone, A.; Dijon, L.; Laska, A.; Koszelow, D. Direct reduction of pellets through hydrogen: Experimental and model behaviour. Int. J. Hydrogen Energy 2024, 49, 1444–1460. [Google Scholar] [CrossRef] [Scilit]
- Özgün, Ö.; Dirba, I.; Gutfleisch, O.; Ma, Y.; Raabe, D. Green Ironmaking at Higher H2 Pressure: Reduction Kinetics and Microstructure Formation During Hydrogen-Based Direct Reduction of Hematite Pellets. J. Sustain. Metall. 2024, 10, 1127–1140. [Google Scholar] [CrossRef] [Scilit] [PubMed]
- Wang, X.; Zhu, D.; Guo, Z.; Pan, J.; Lv, T.; Yang, C.; Li, S. Efficient Utilization of Limonite Nickel Laterite to Prepare Ferronickel by the Selective Reduction Smelting Process. Sustainability 2023, 15, 7147. [Google Scholar] [CrossRef] [Scilit]
- Sarbishei, S.; Tafaghodi Khajavi, L.T. Kinetic analysis on nickel laterite ore calcination using model-free and model-fitting methods. Miner. Eng. 2019, 136, 129–139. [Google Scholar] [CrossRef] [Scilit]
- Wijenayake, J.J.; Lee, S.Y.; Park, S.H.; Sohn, H.S. Production of ferronickel from limonitic laterite ore using hydrogen reduction and cementation. Hydrometallurgy 2021, 203, 105622. [Google Scholar] [CrossRef] [Scilit]
- Fan, Q.; Yuan, S.; Wen, J.; He, J. Review on comprehensive utilization of nickel laterite ore. Miner. Eng. 2024, 218, 109044. [Google Scholar] [CrossRef] [Scilit]
- Manzoor, U.; Mujica Roncery, L.; Raabe, D.; Souza Filho, I.R. Sustainable nickel enabled by hydrogen-based reduction. Nature 2025, 641, 365–373. [Google Scholar] [CrossRef] [Scilit] [PubMed]
- Shi, Y.; Qi, S.; Liu, X.; Liu, S.; Yan, J.; Yang, S. Study on the Medium-Temperature Reduction Behavior of Methane and Laterite Nickel Ore. Processes 2023, 11, 3291. [Google Scholar] [CrossRef] [Scilit]
- Lu, J.; Liu, S.; Shangguan, J.; Du, W.; Pan, F.; Yang, S. The effect of sodium sulphate on the hydrogen reduction process of nickel laterite ore. Miner. Eng. 2013, 49, 154–164. [Google Scholar] [CrossRef] [Scilit]
- Chung, H.; Friedrich, S.; Qu, M.; Friedrich, B. Hydrogen Reduction of Tellurium Oxide in a Rotary Kiln, Initial Approaches for a Sustainable Process. Crystals 2025, 15, 478. [Google Scholar] [CrossRef] [Scilit]
- Satritama, B.; Cooper, C.; Fellicia, D.; Pownceby, M.I.; Palanisamy, S.; Ang, A.; Mukhlis, R.Z.; Pye, J.; Rahbari, A.; Brooks, G.A.; et al. Hydrogen Plasma for Low-Carbon Extractive Metallurgy: Oxides Reduction, Metals Refining, and Wastes Processing. J. Sustain. Metall. 2024, 10, 1845–1894. [Google Scholar] [CrossRef] [Scilit]
- Jacob, R.M.; Tokheim, L.A. Electrified calciner concept for CO2 capture in pyro-processing of a dry process cement plant. Energy 2023, 268, 126673. [Google Scholar] [CrossRef] [Scilit]
- Nobre, J.; Ahmed, H.; Bravo, M.; Evangelista, L.; de Brito, J. Magnesia (MgO) Production and Characterization, and Its Influence on the Performance of Cementitious Materials: A Review. Materials 2020, 13, 4752. [Google Scholar] [CrossRef] [Scilit] [PubMed]
- Margaritis, N.; Evaggelou, C.; Grammelis, P.; Arévalo, R.; Yiannoulakis, H.; Papageorgiou, P. Application of Flexible Tools in Magnesia Sector: The Case of Grecian Magnesite. Sustainability 2023, 15, 12130. [Google Scholar] [CrossRef] [Scilit]
- Ryan, J.; Bussmann, M.; DeMartini, N. CFD Modelling of Calcination in a Rotary Lime Kiln. Processes 2022, 10, 1516. [Google Scholar] [CrossRef] [Scilit]
- Zhu, R.; Fu, L.; Liu, Q.; E, J.; Zhou, H. Model and Parameter Study of Limestone Decomposition Reaction. Processes 2024, 12, 150. [Google Scholar] [CrossRef] [Scilit]
- Zhuang, D.; Chen, Z.; Sun, B. Thermal Decomposition of Calcium Carbonate at Multiple Heating Rates in Different Atmospheres Using the Techniques of TG, DTG, and DSC. Crystals 2025, 15, 108. [Google Scholar] [CrossRef] [Scilit]
- Mirshokraee, S.A.; Bedogni, S.; Bindi, M.; Santoro, C. Substituting Natural Gas with Hydrogen for Thermal Application in a Hard-to-Abate Industry: A Real Case Study. Hydrogen 2025, 6, 37. [Google Scholar] [CrossRef] [Scilit]
- Joyo, F.H.; Groppi, D.; Villani, L.; Irfan; Astiaso Garcia, D. Techno-Economic Assessment of Hydrogen Integration for Decarbonizing the Steel Industry: A Case Study. Hydrogen 2025, 6, 104. [Google Scholar] [CrossRef] [Scilit]
- Jacob, R.M.; Pinheiro, J.P.; Tokheim, L.A. Electrified externally heated rotary calciner for calcination of cement raw meal. Heliyon 2023, 9, e22023. [Google Scholar] [CrossRef] [Scilit] [PubMed]
- Terna Mag|Magnesia Producer and Supplier. Available online: https://www.ternamag.com/ (accessed on 23 June 2026).
- Welcome to LARCO GMMSA—General Mining & Metallurgical Company. Available online: https://www.larco.gr/ (accessed on 23 June 2026).
- SOLIDWORKS 2026|SOLIDWORKS. Available online: https://www.solidworks.com/product/whats-new (accessed on 23 June 2026).
- R2026a—MATLAB & Simulink. Available online: https://www.mathworks.com/products/new_products/latest_features.html (accessed on 23 June 2026).
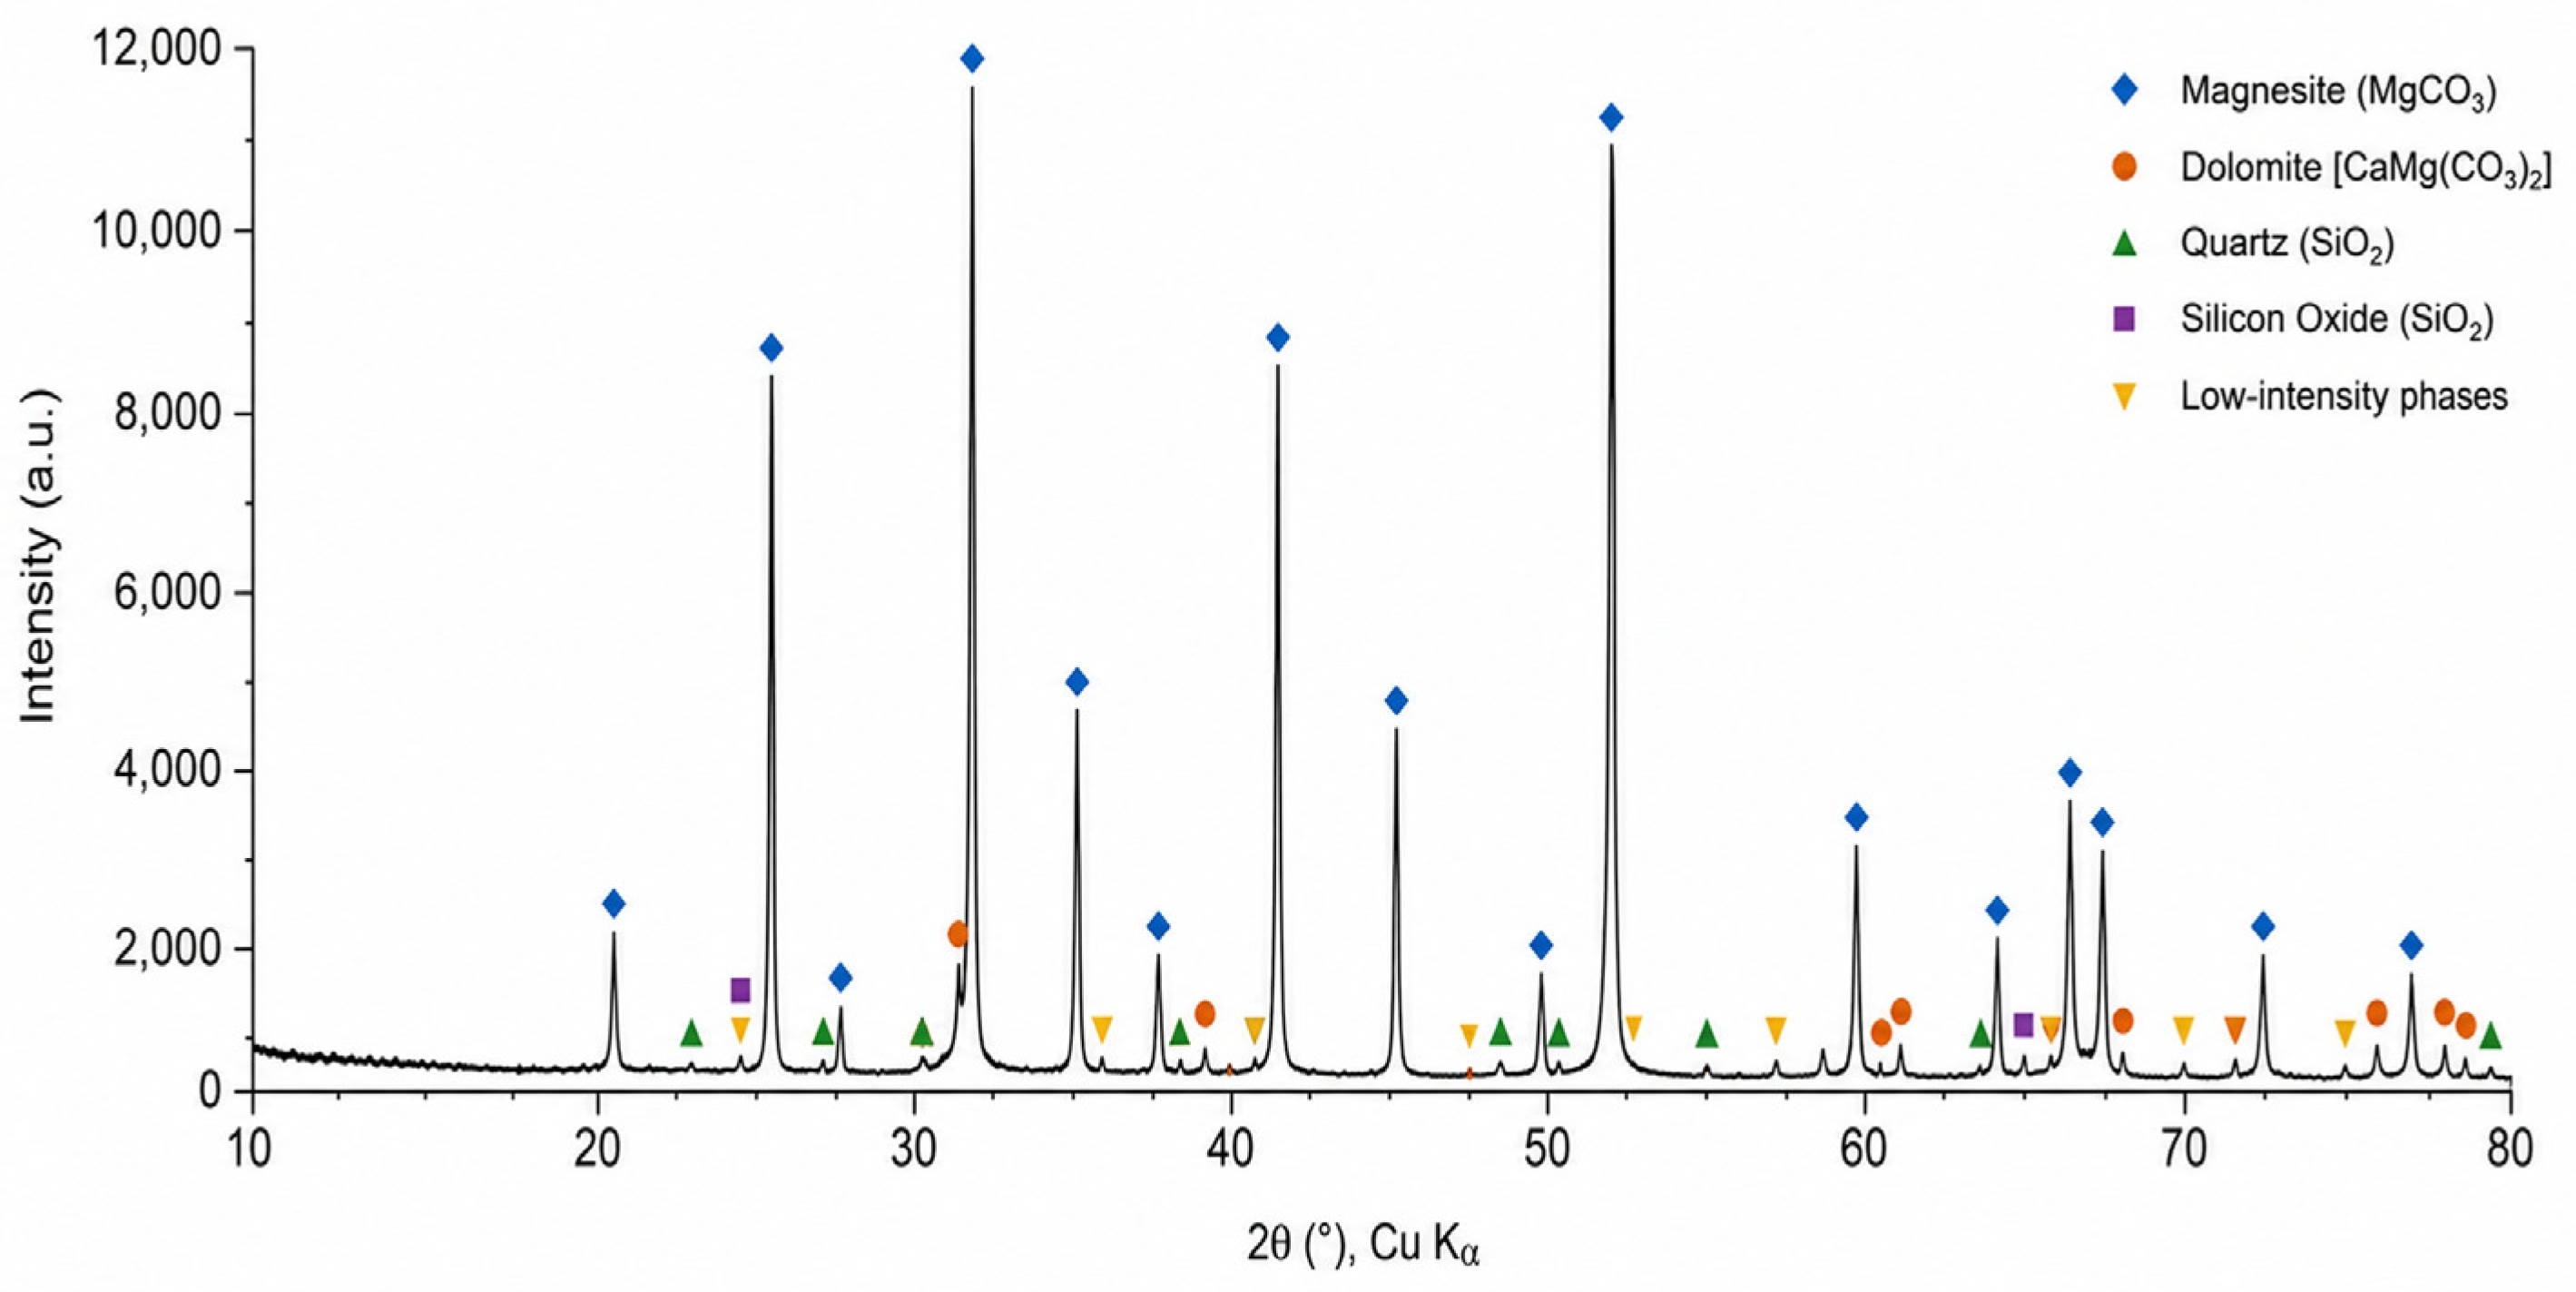
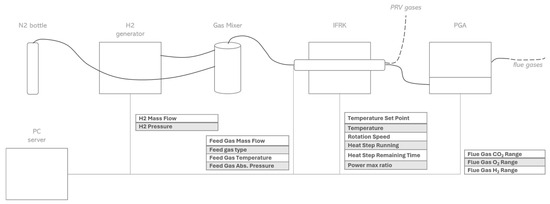
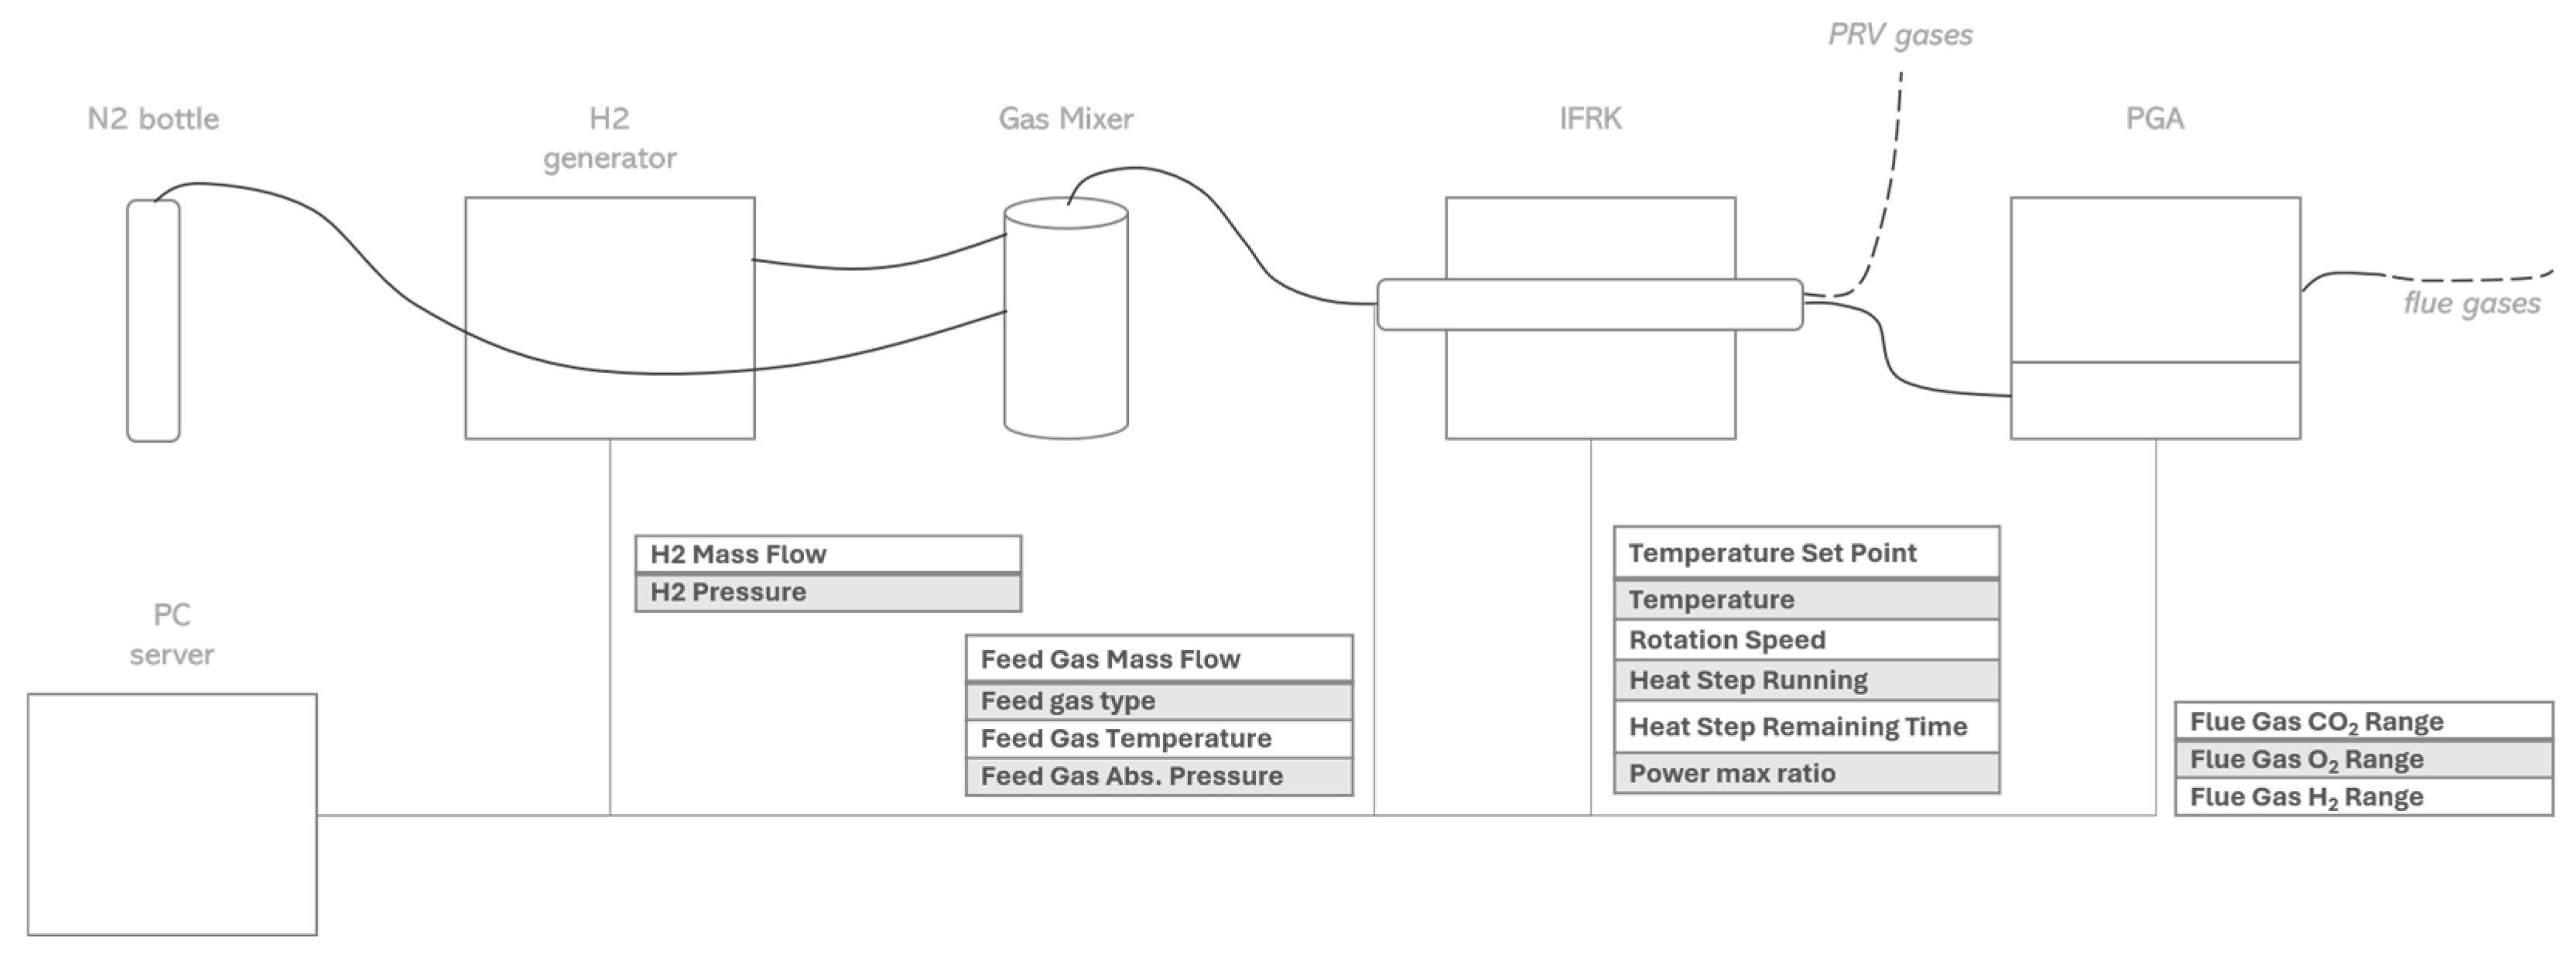
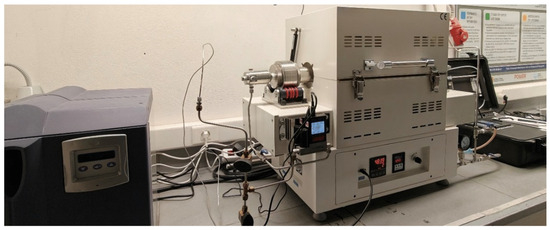
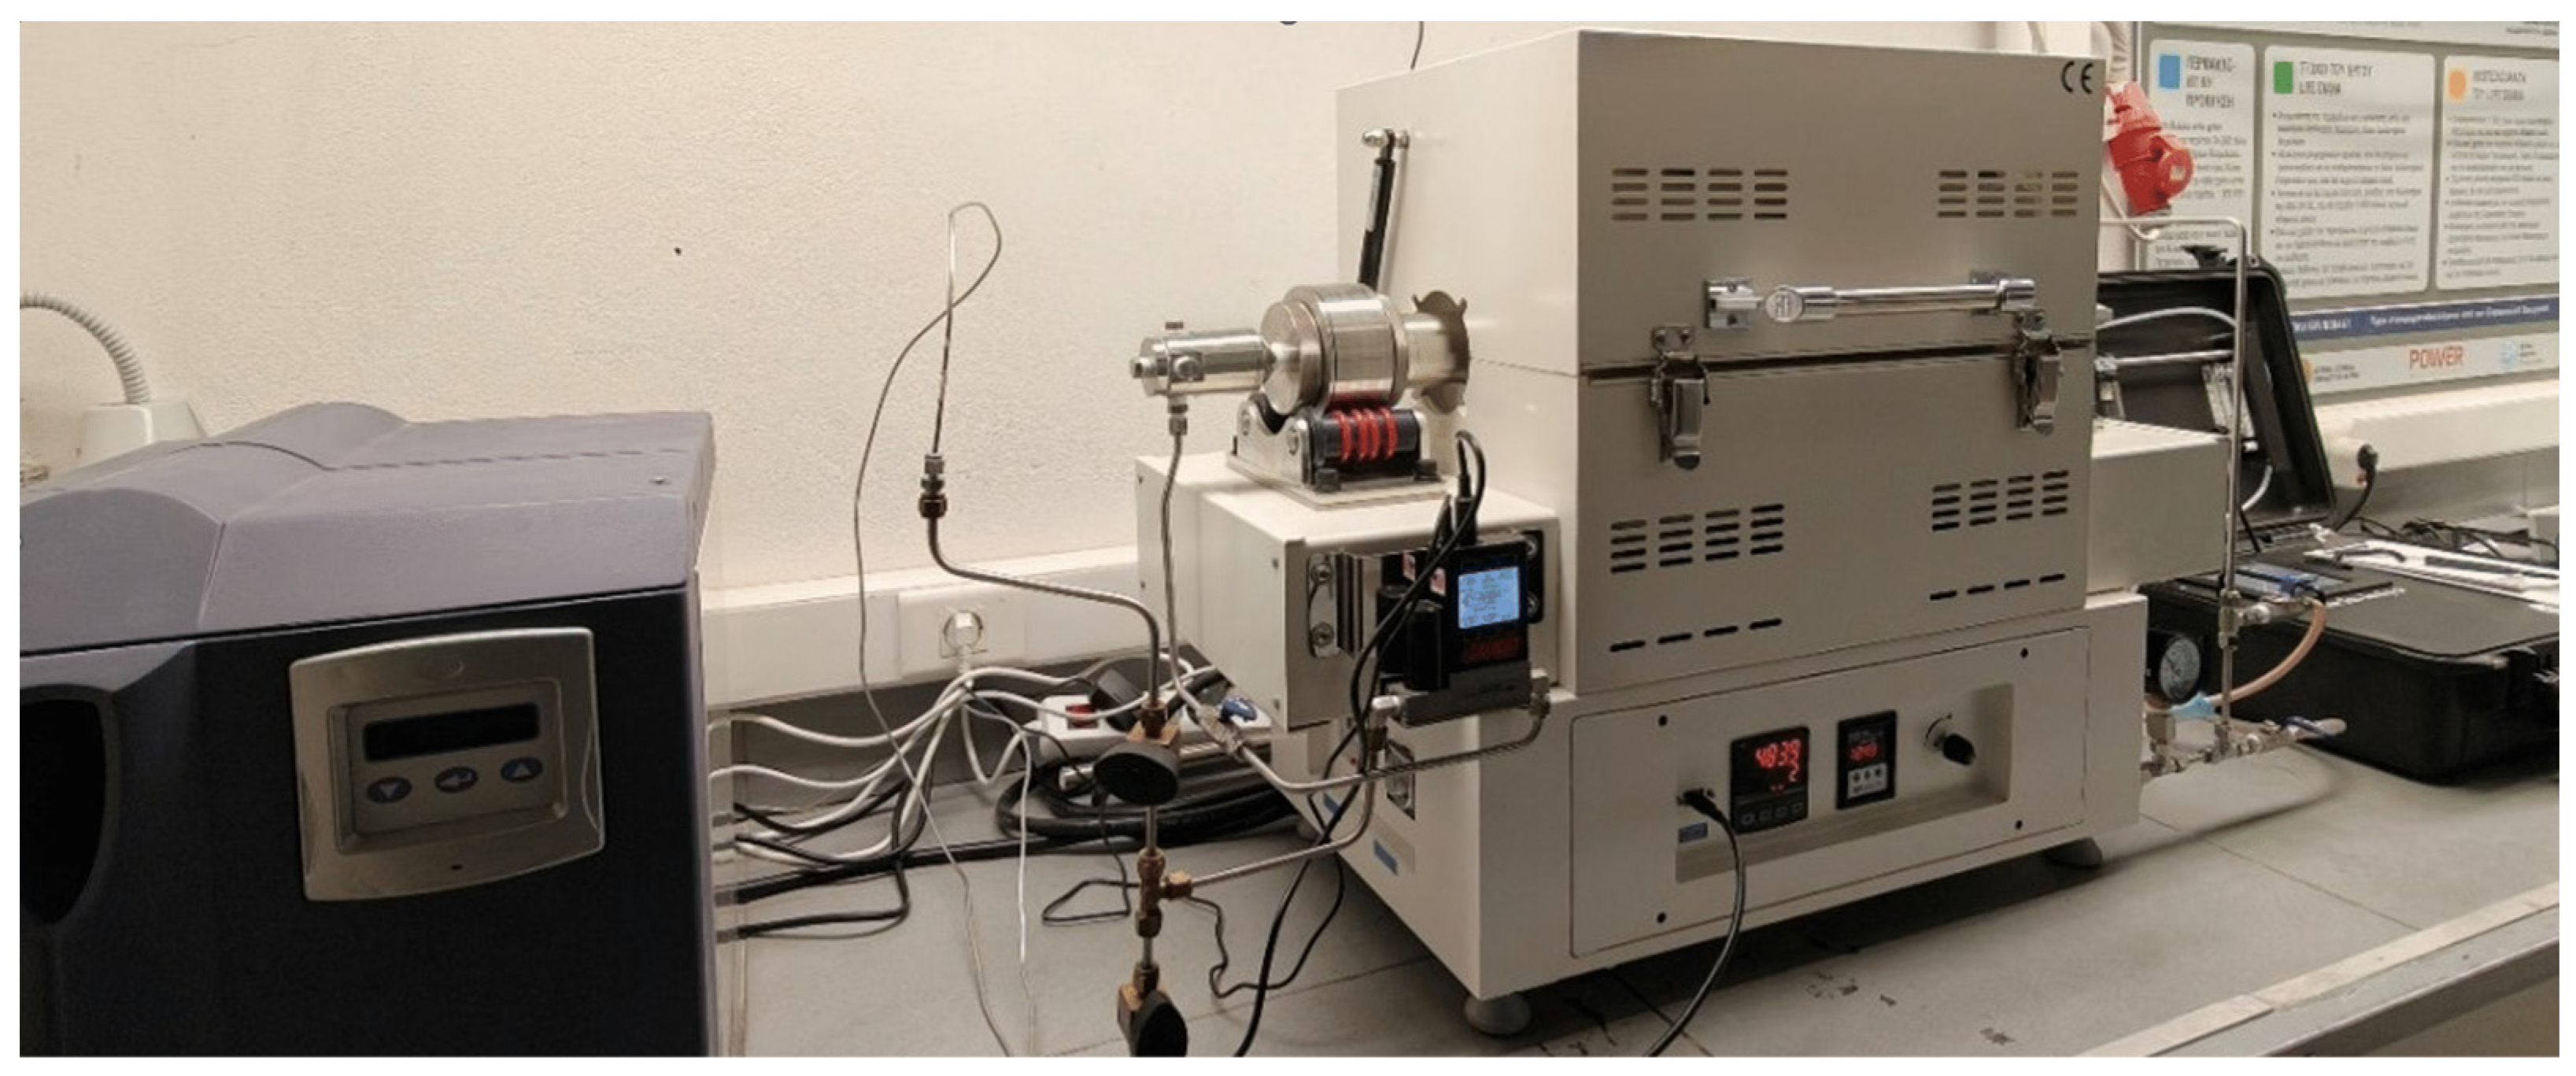
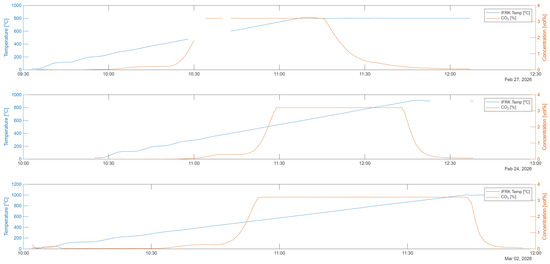
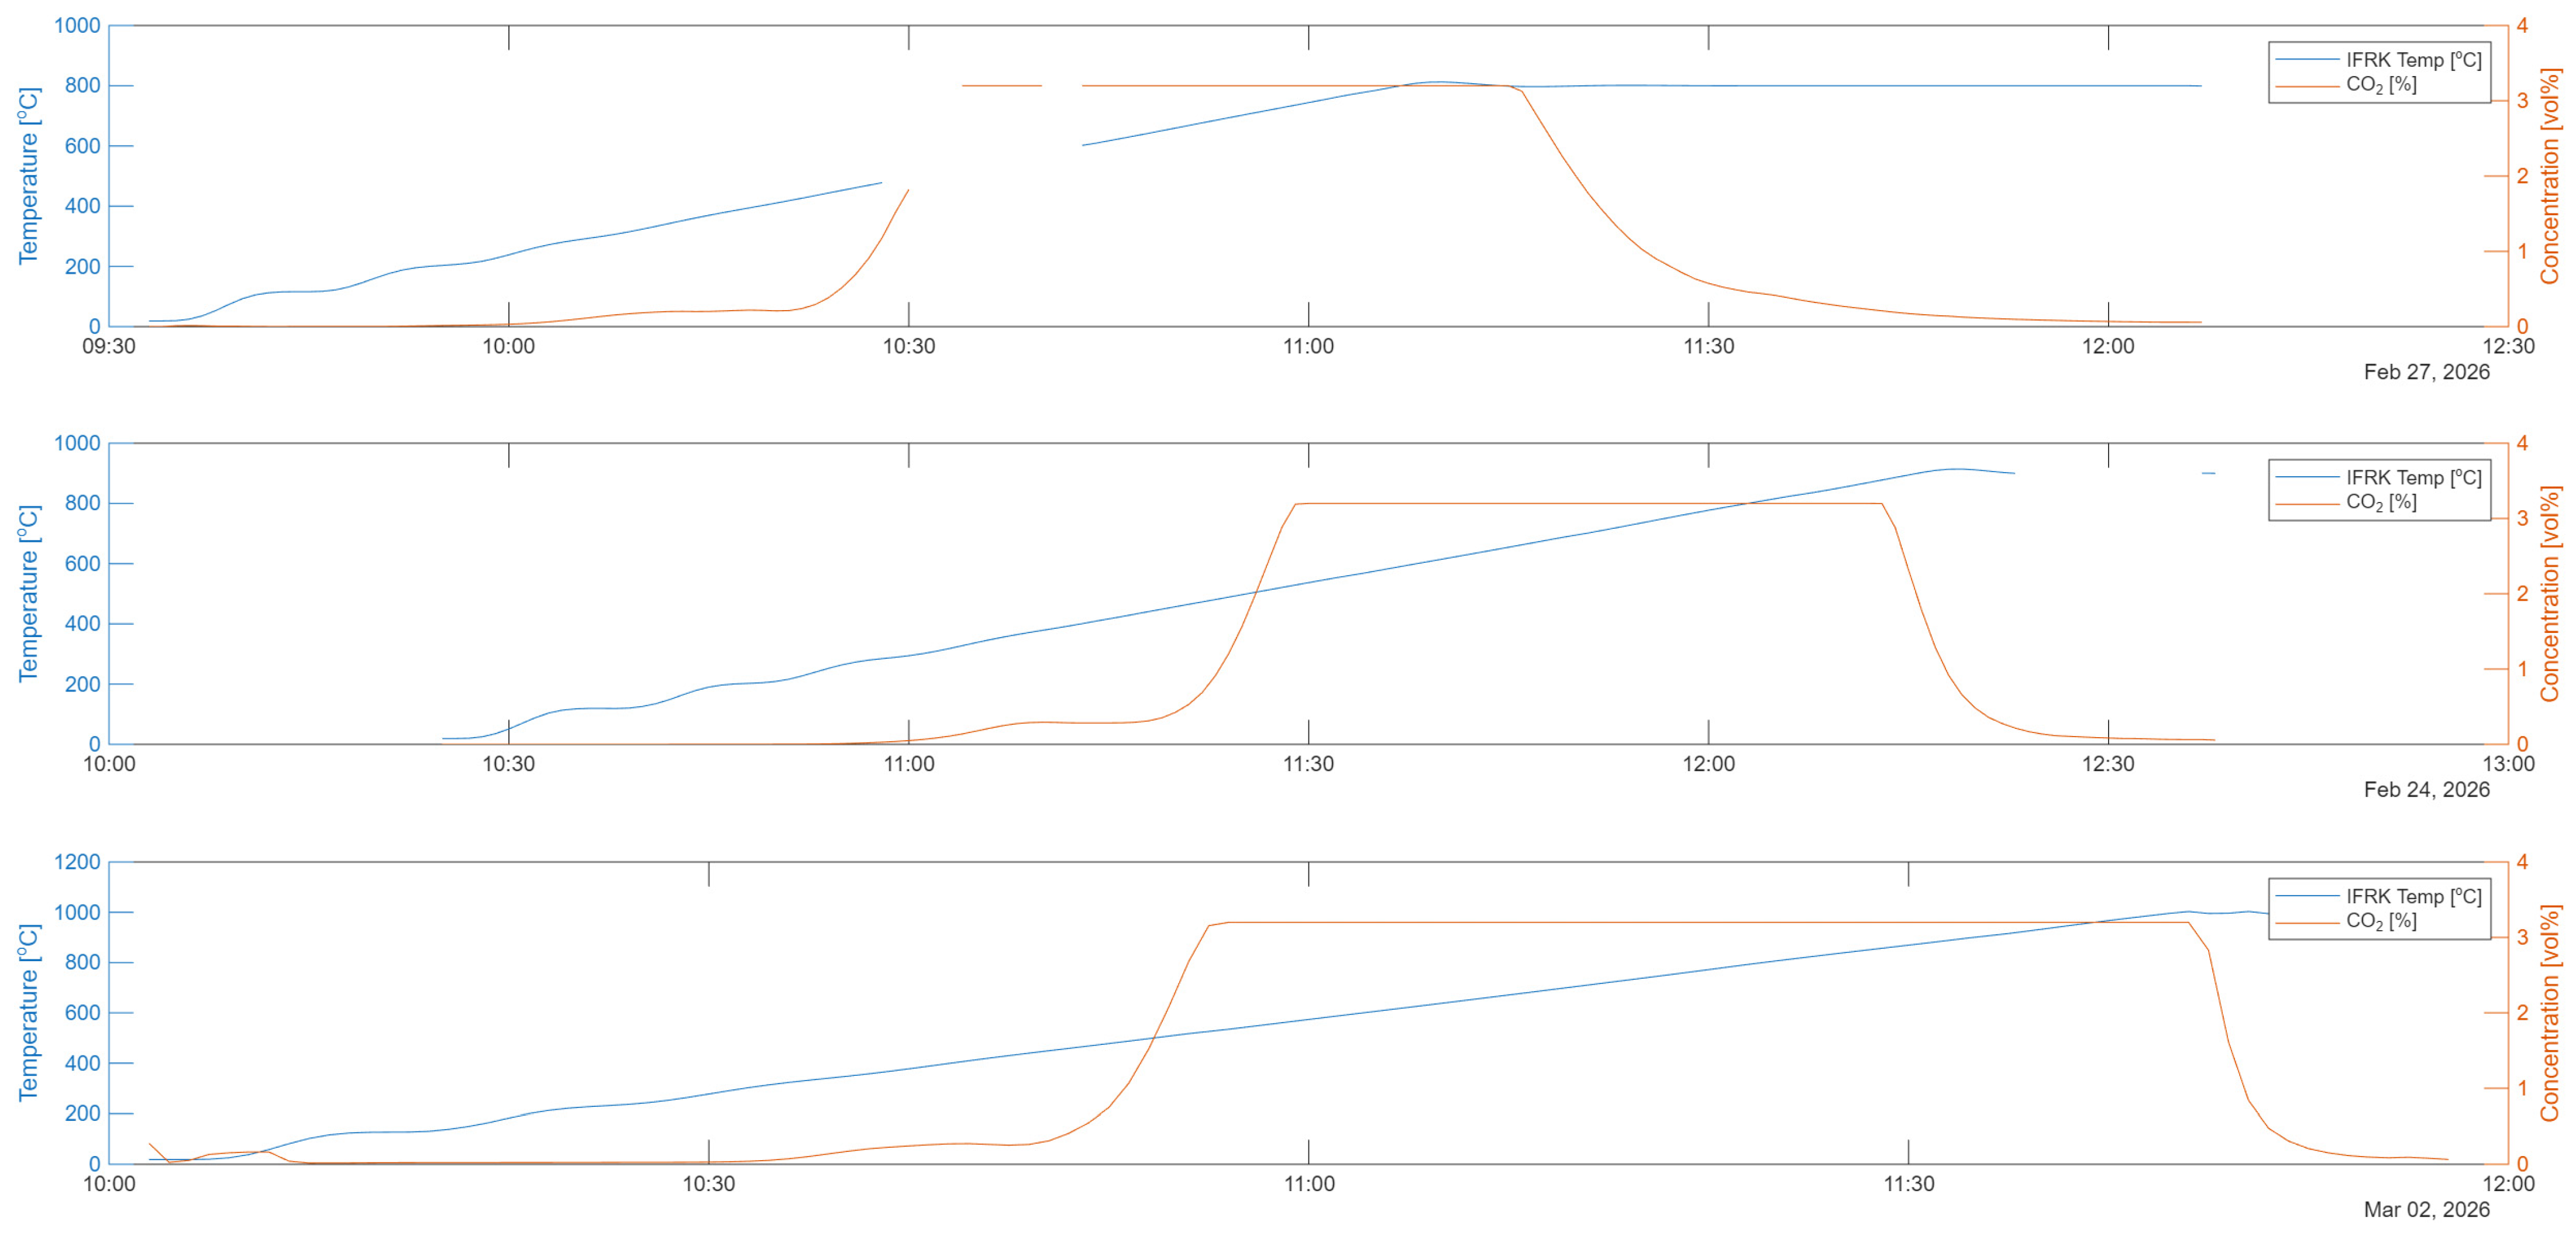
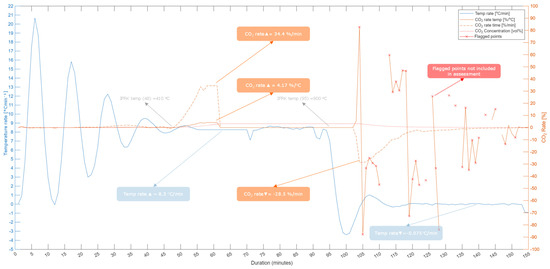
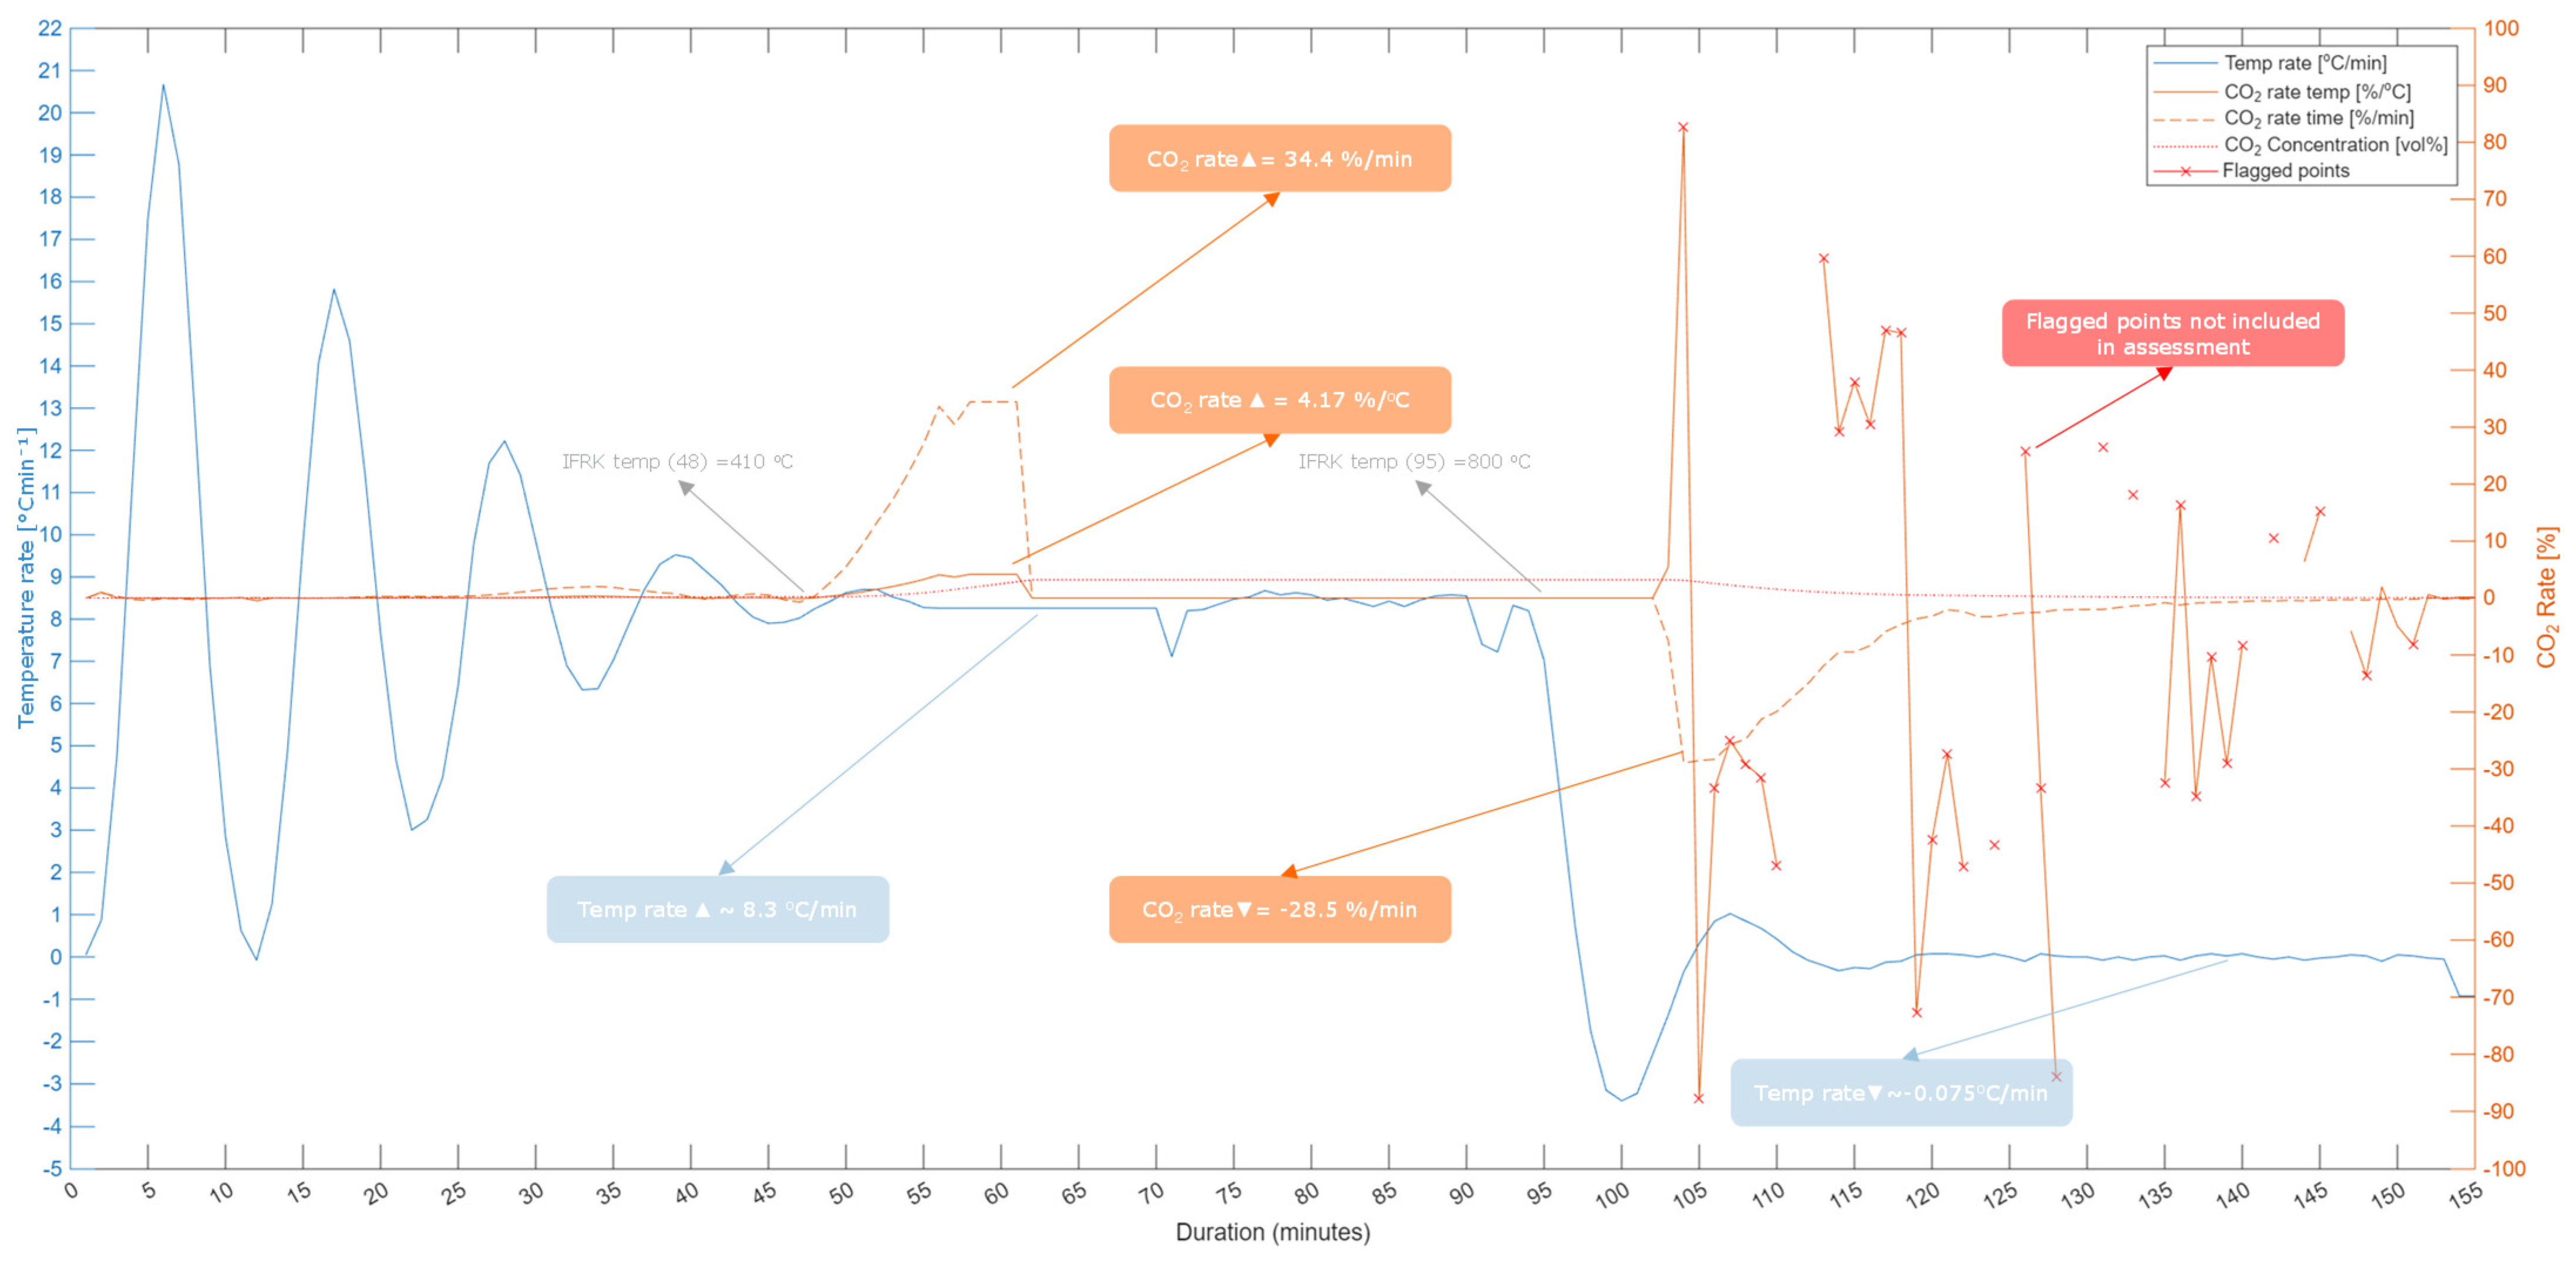
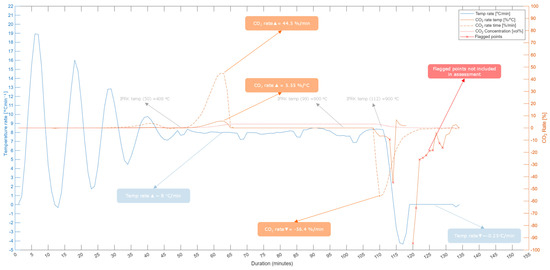
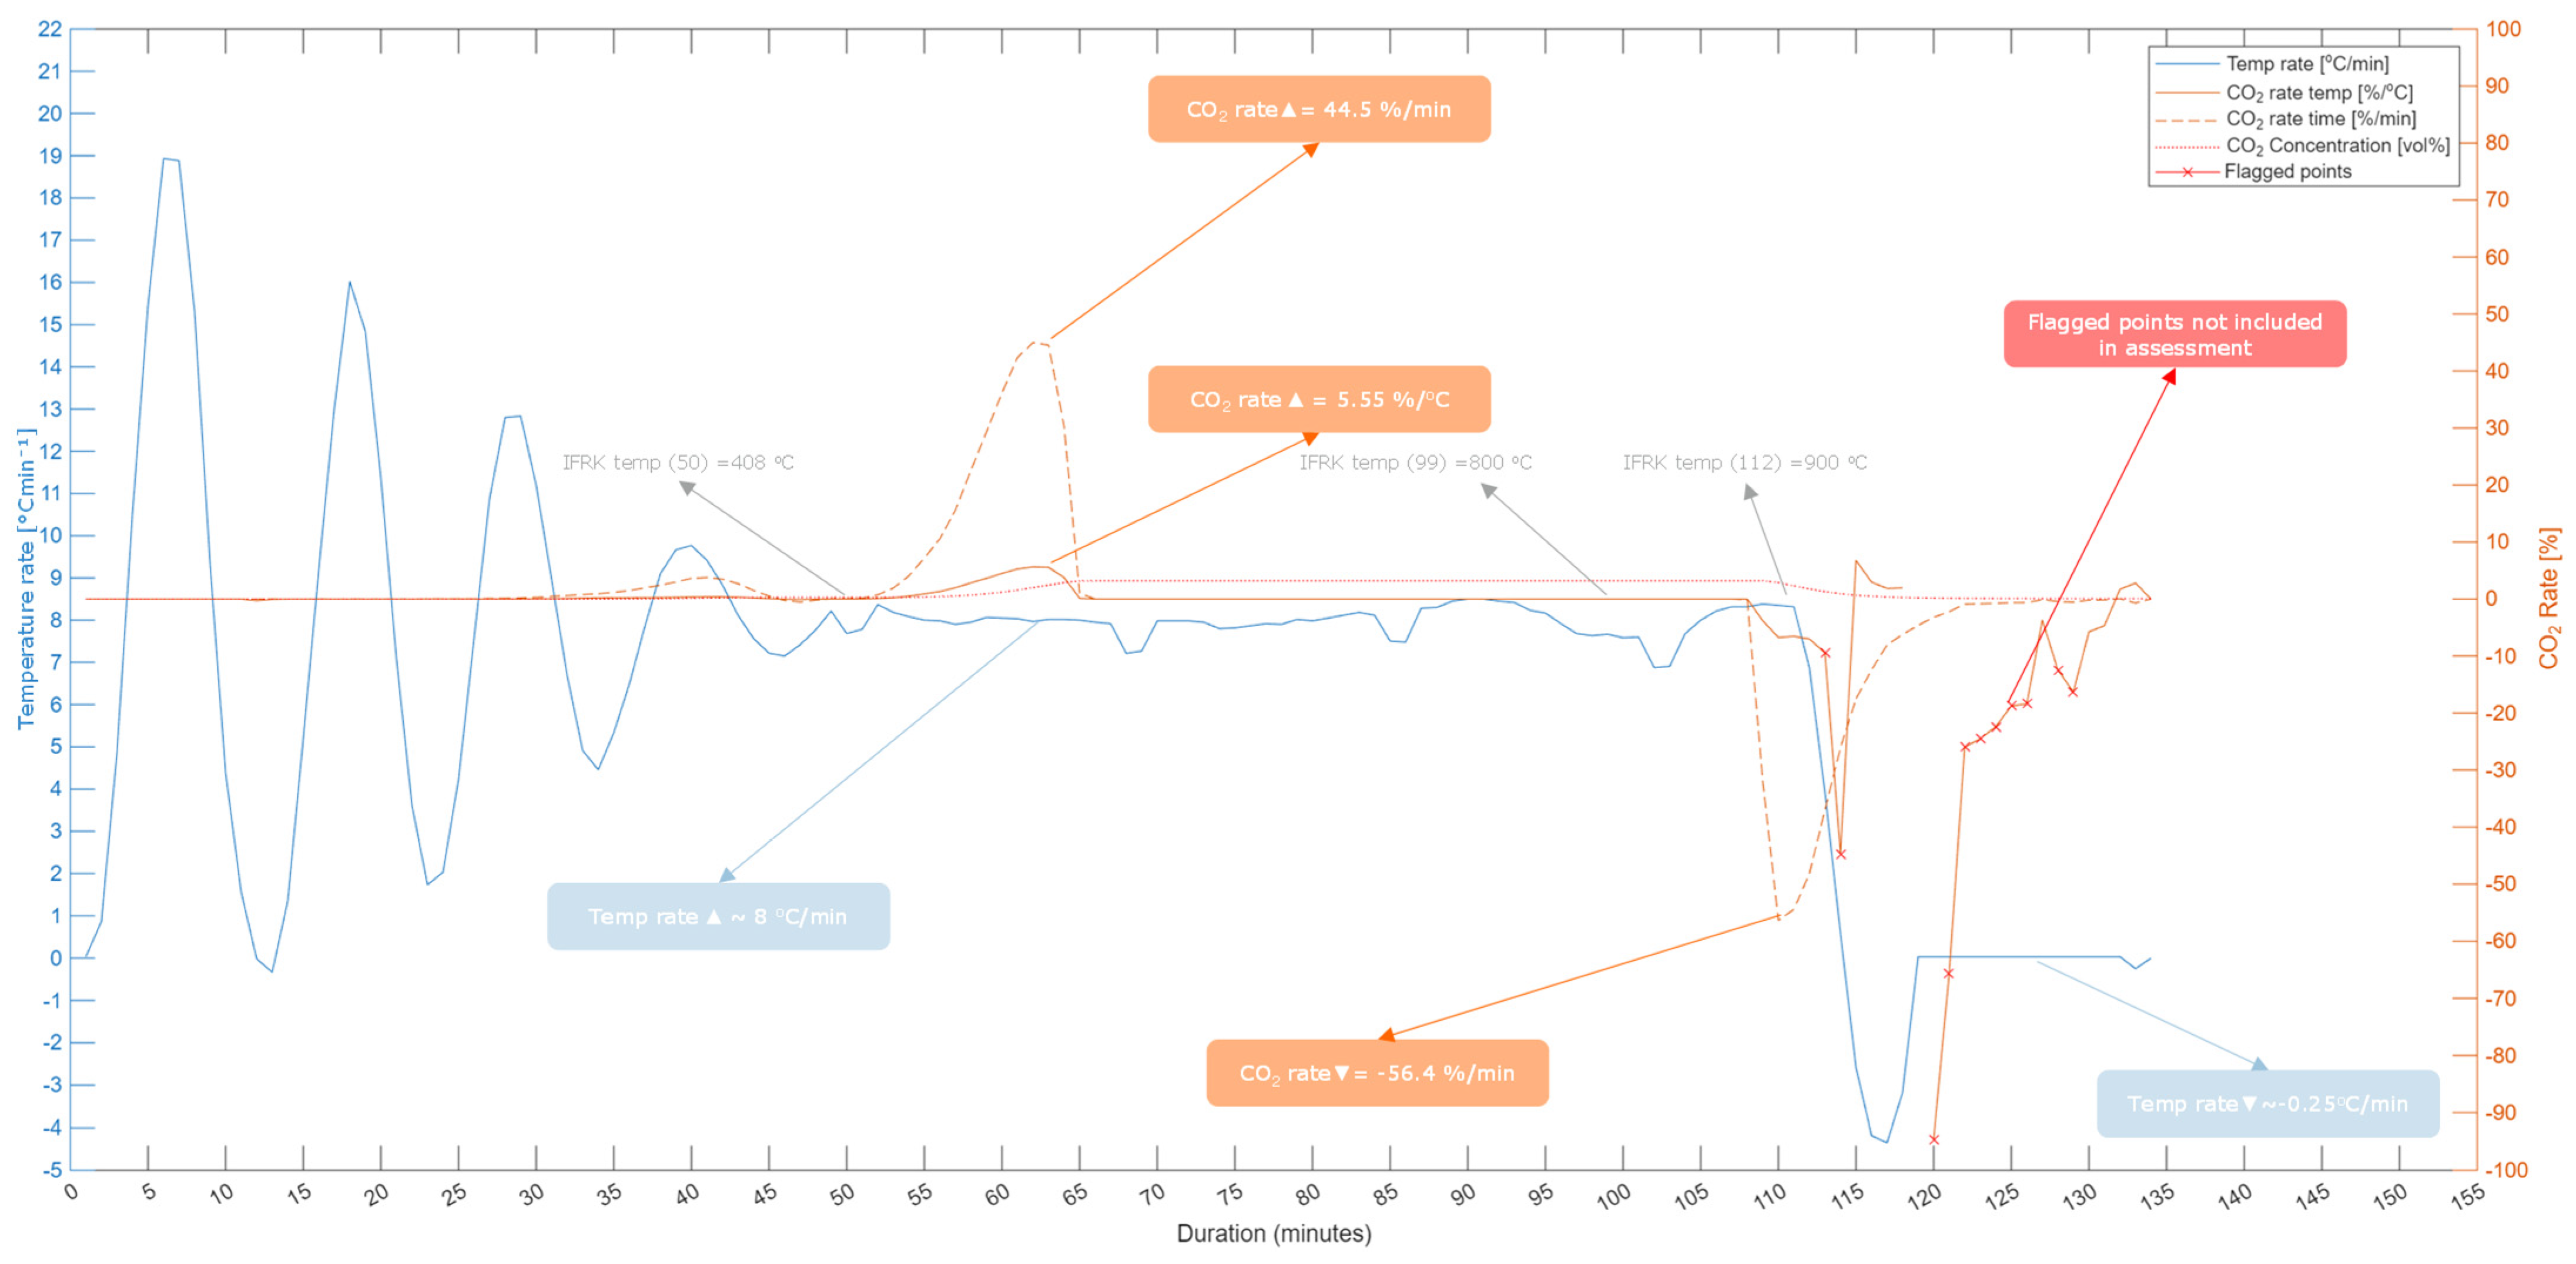
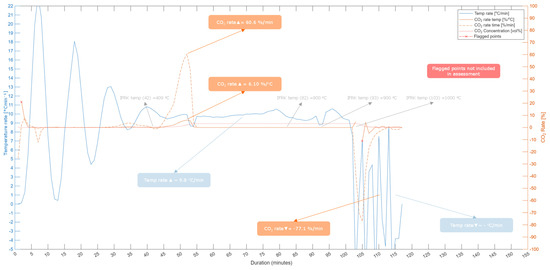
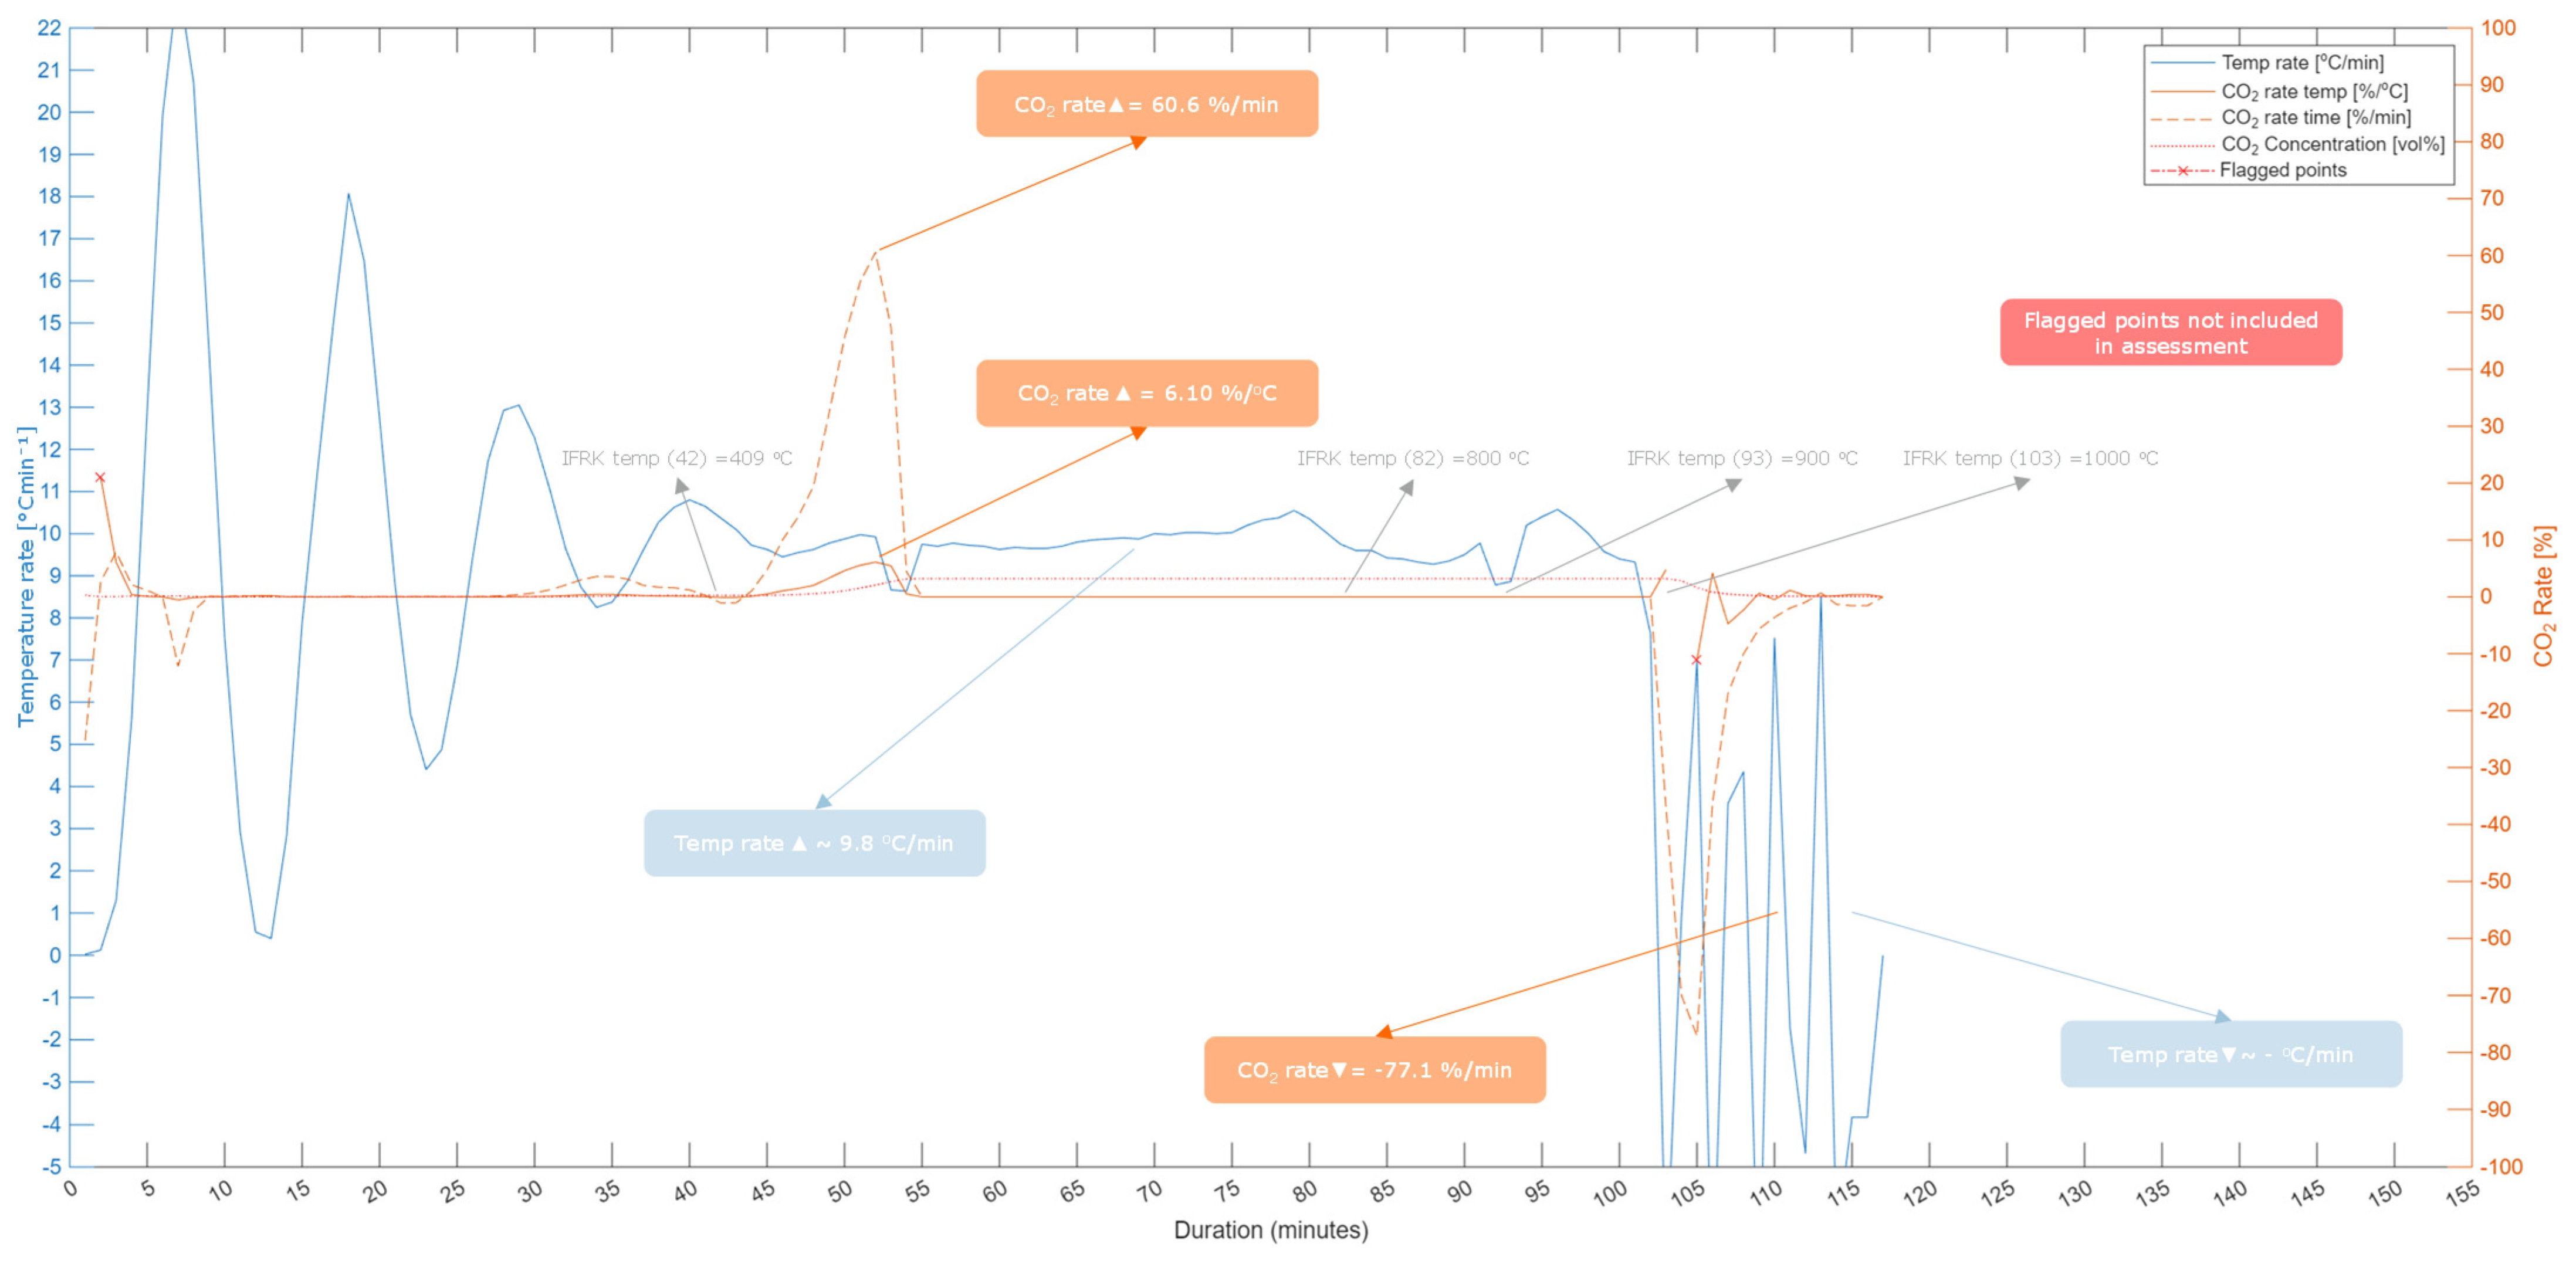
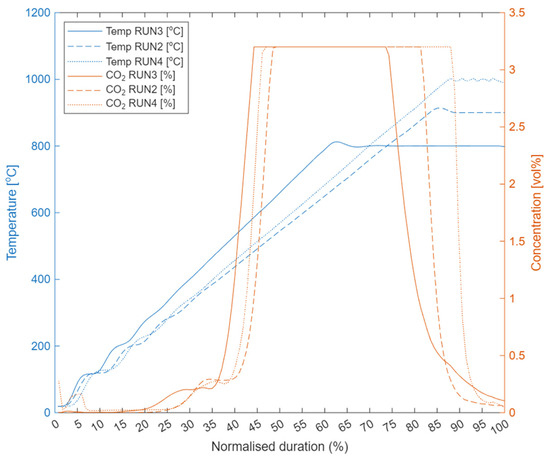
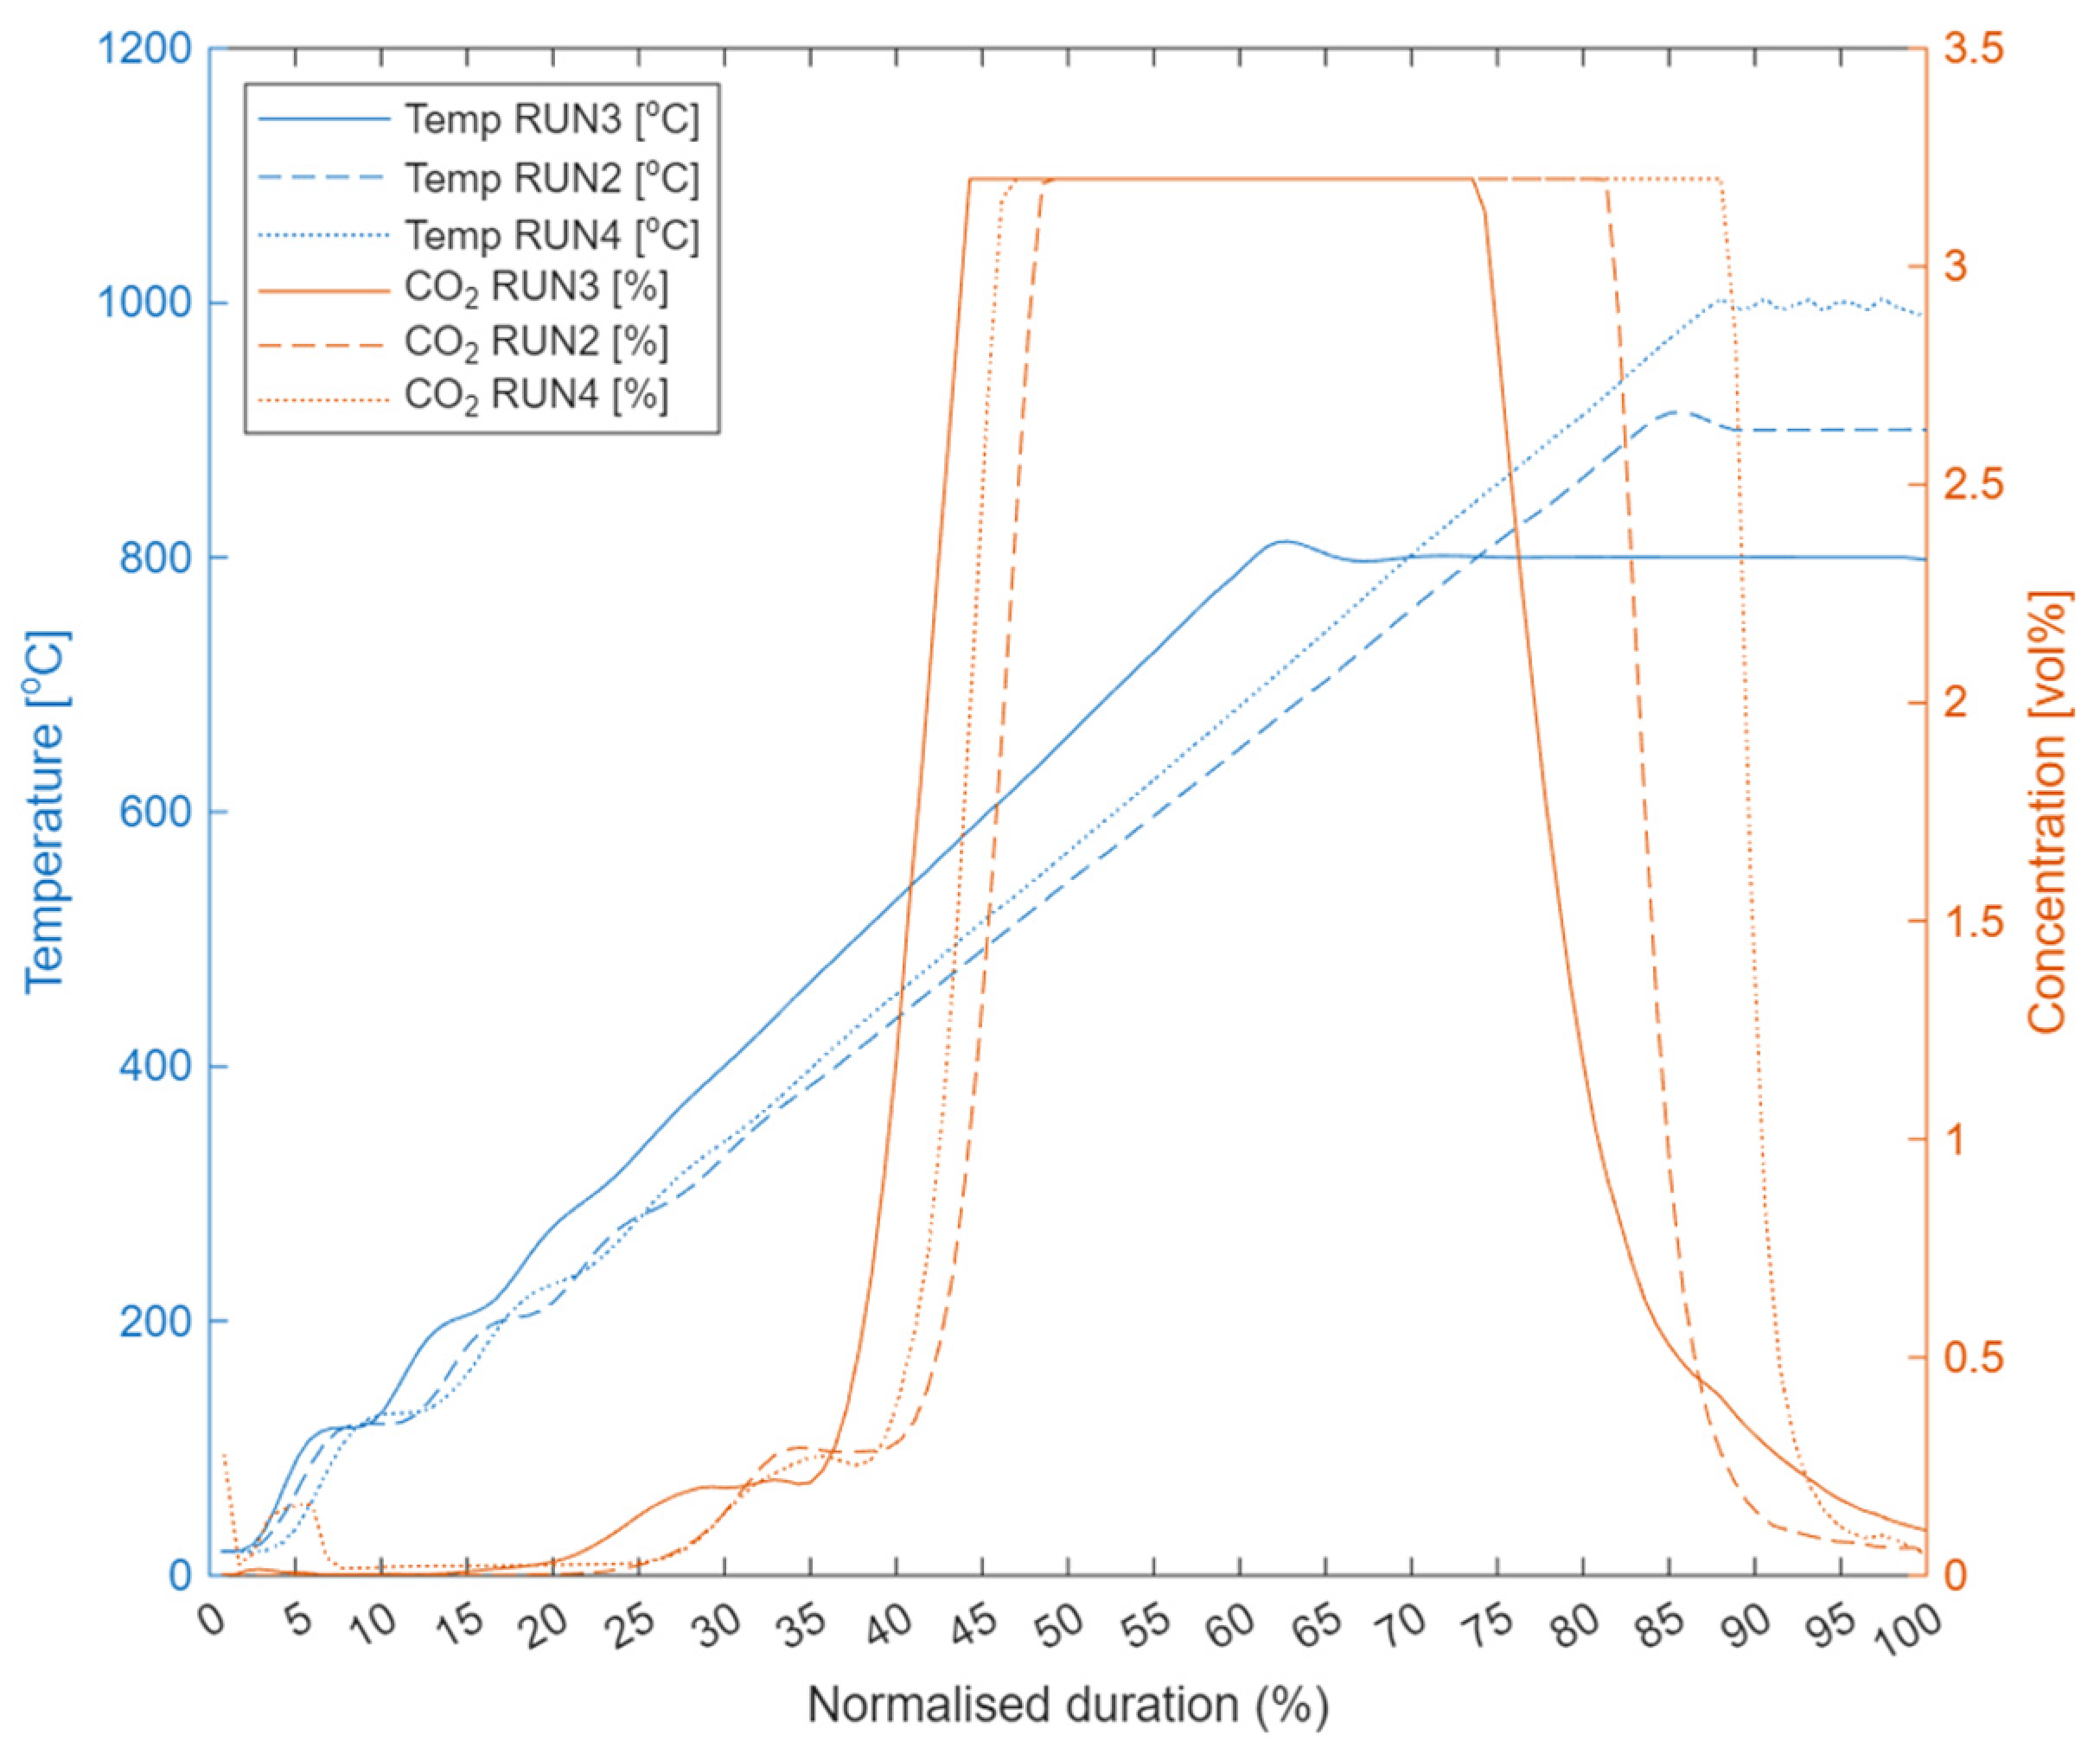
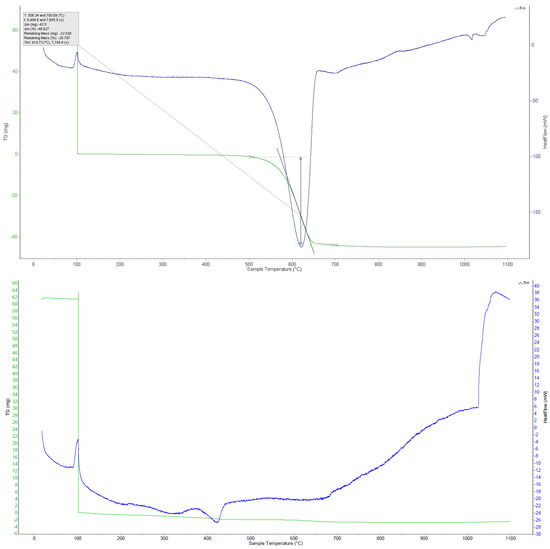
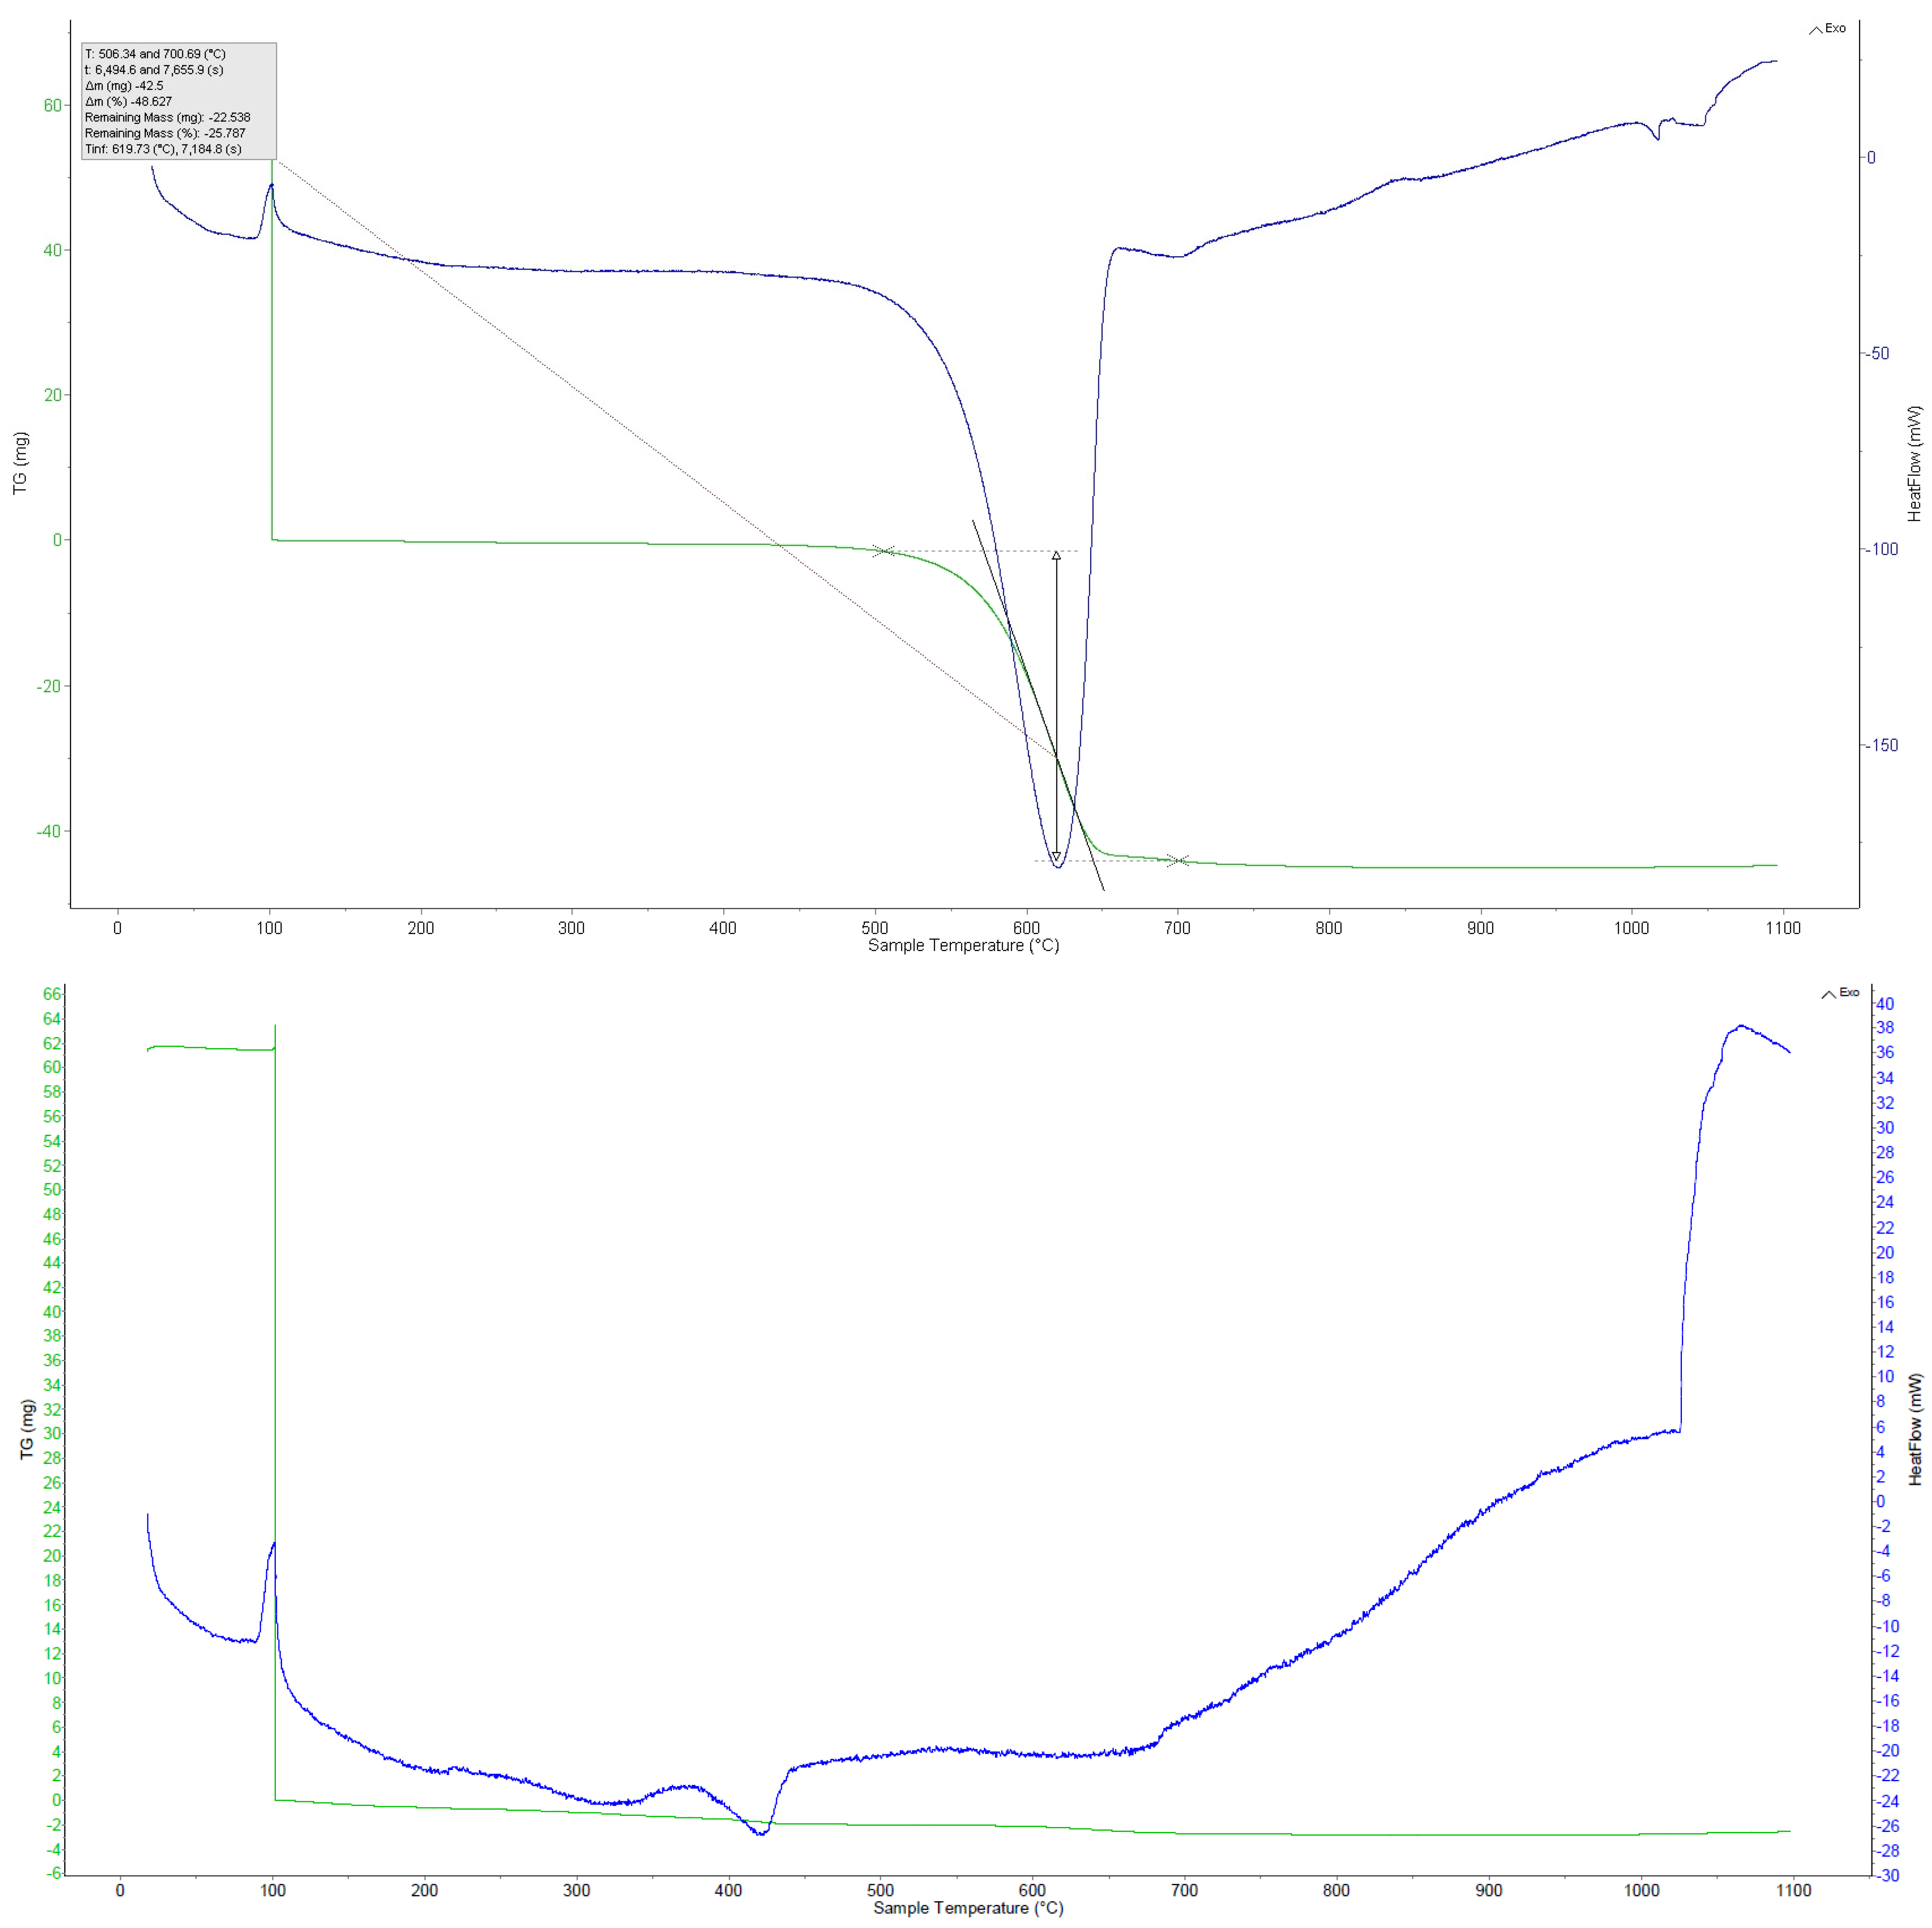
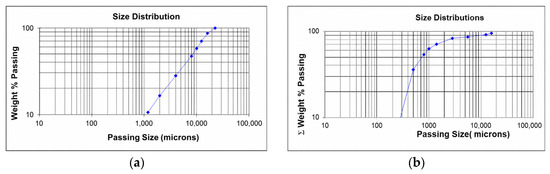
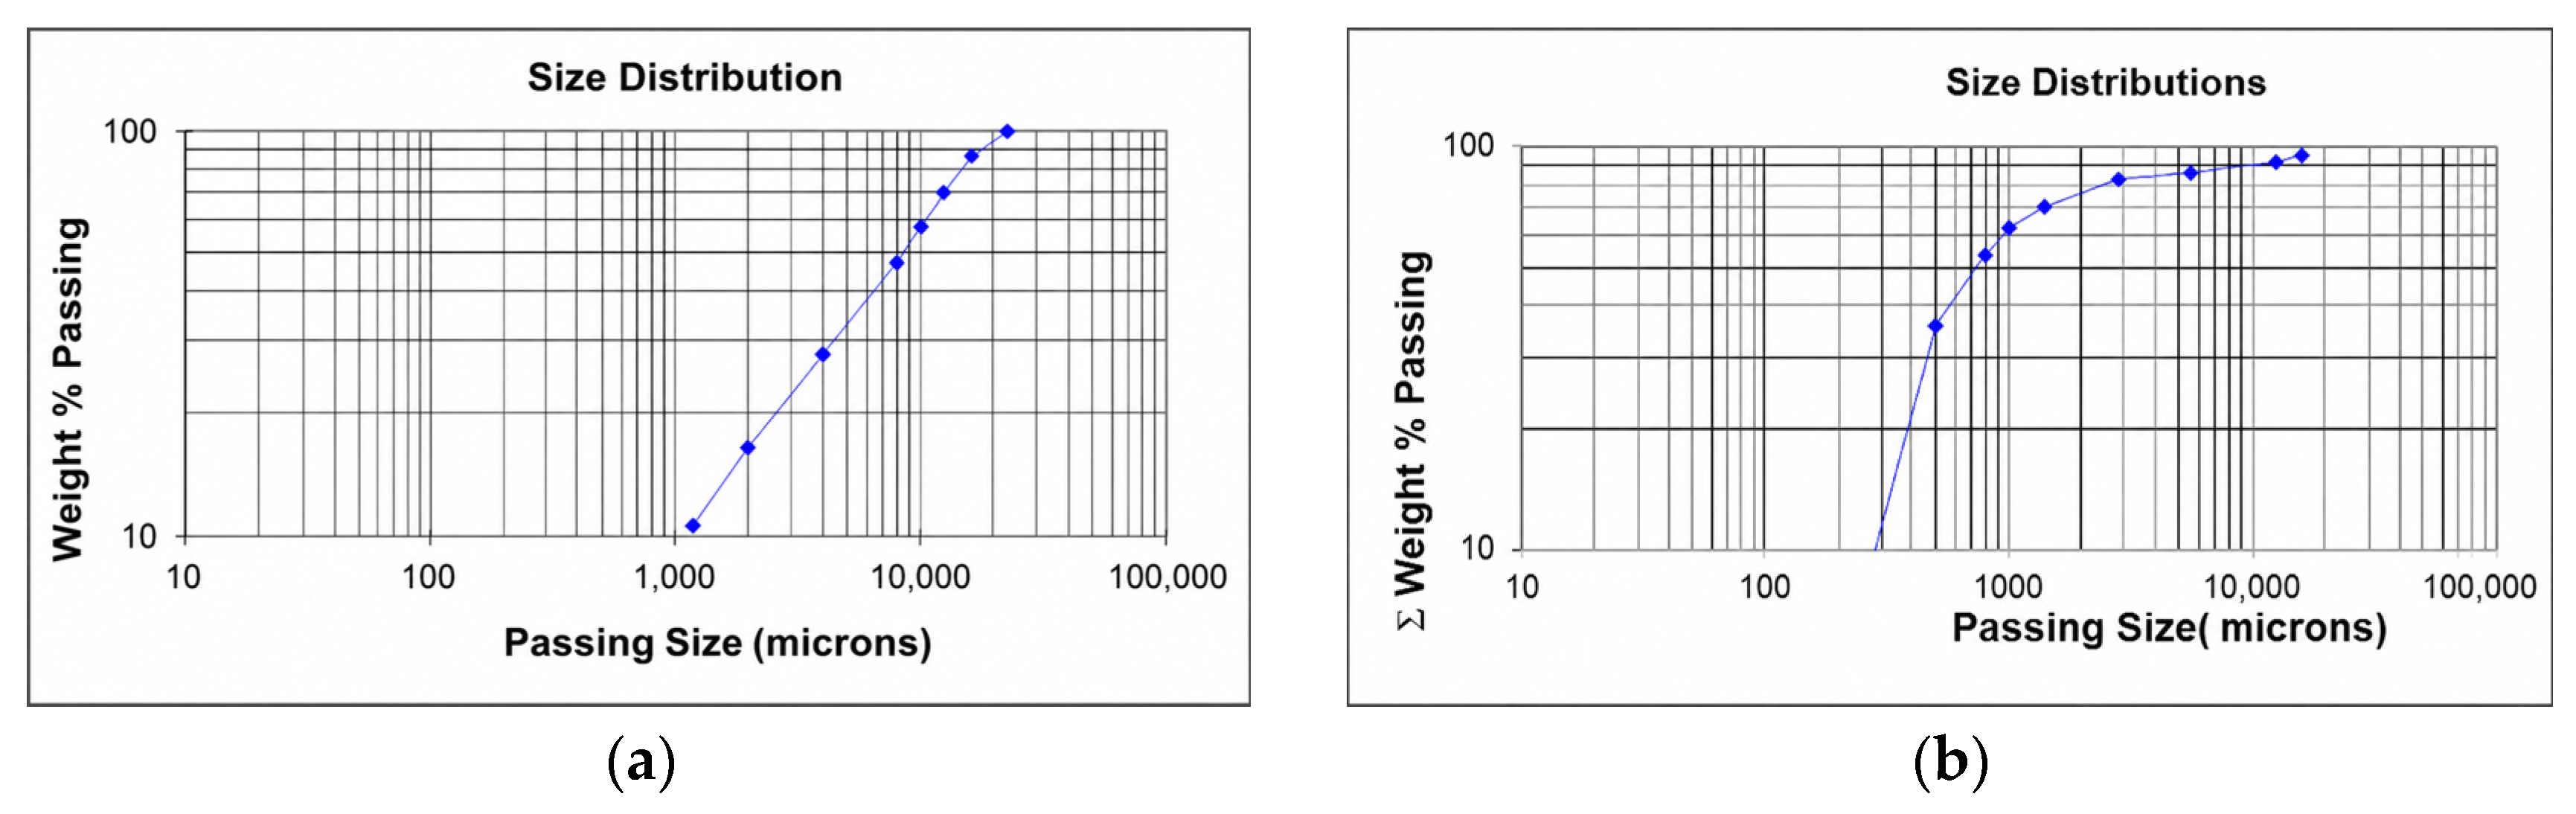
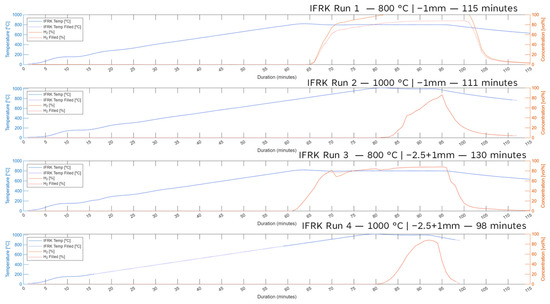
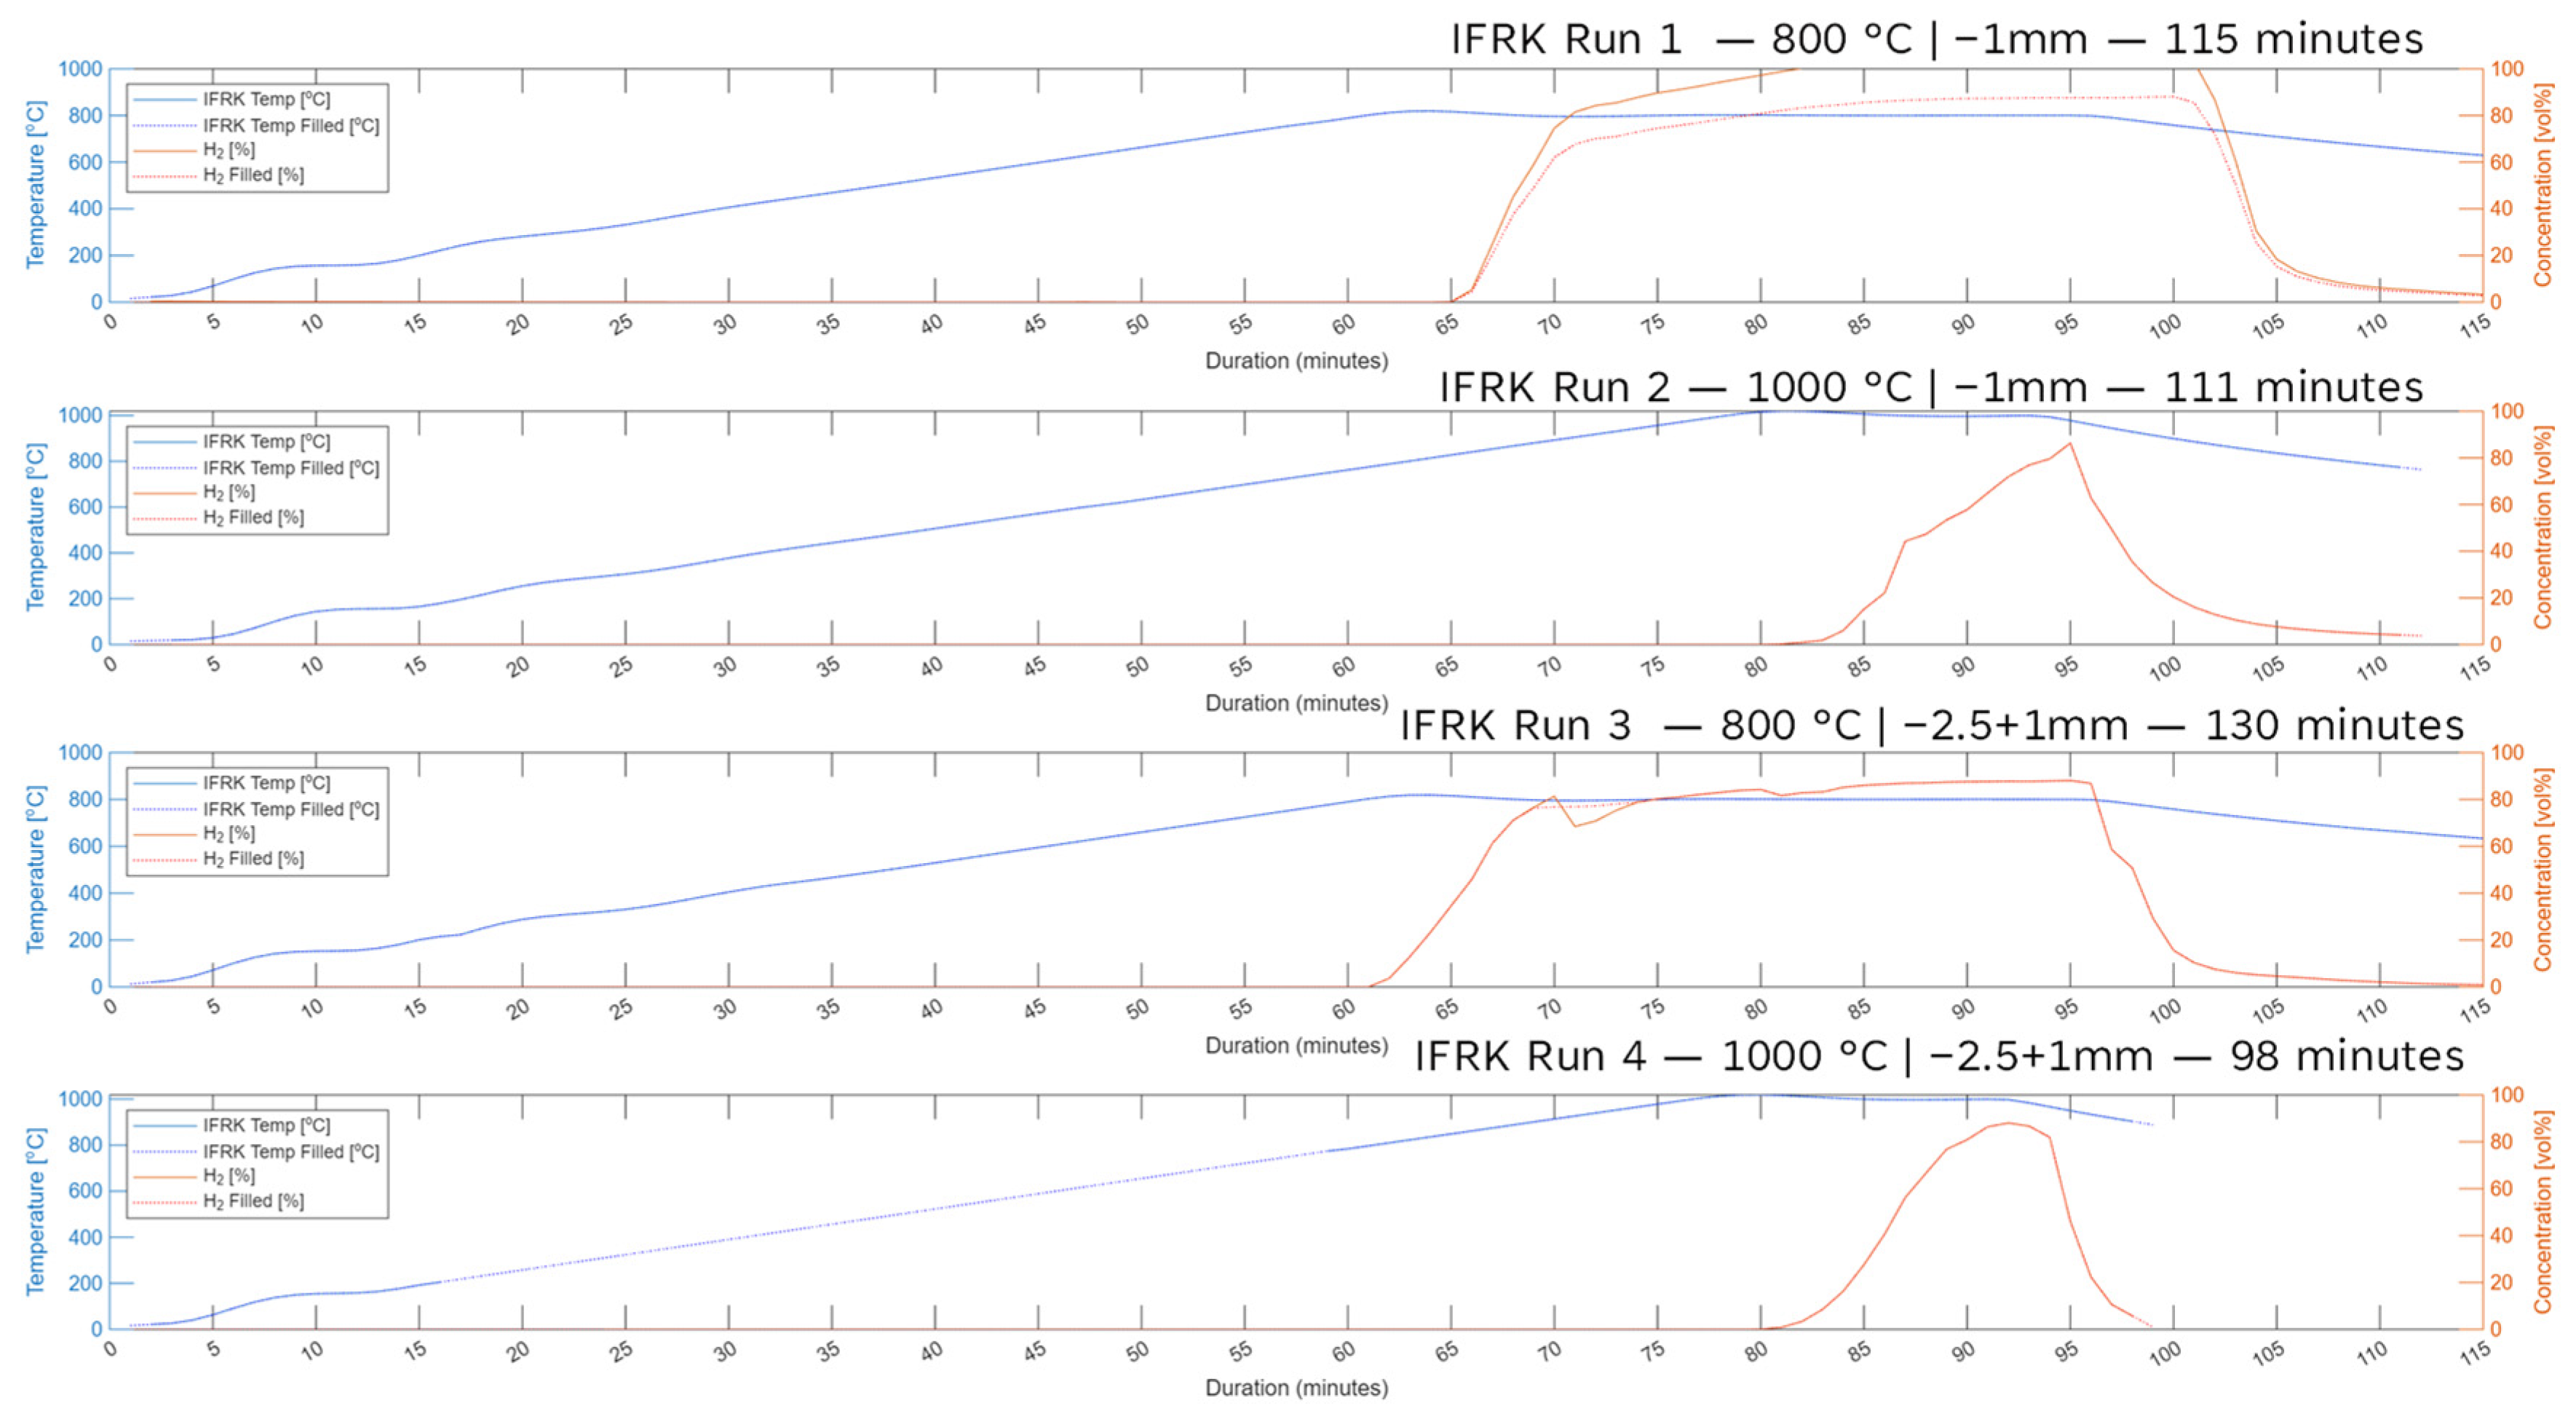
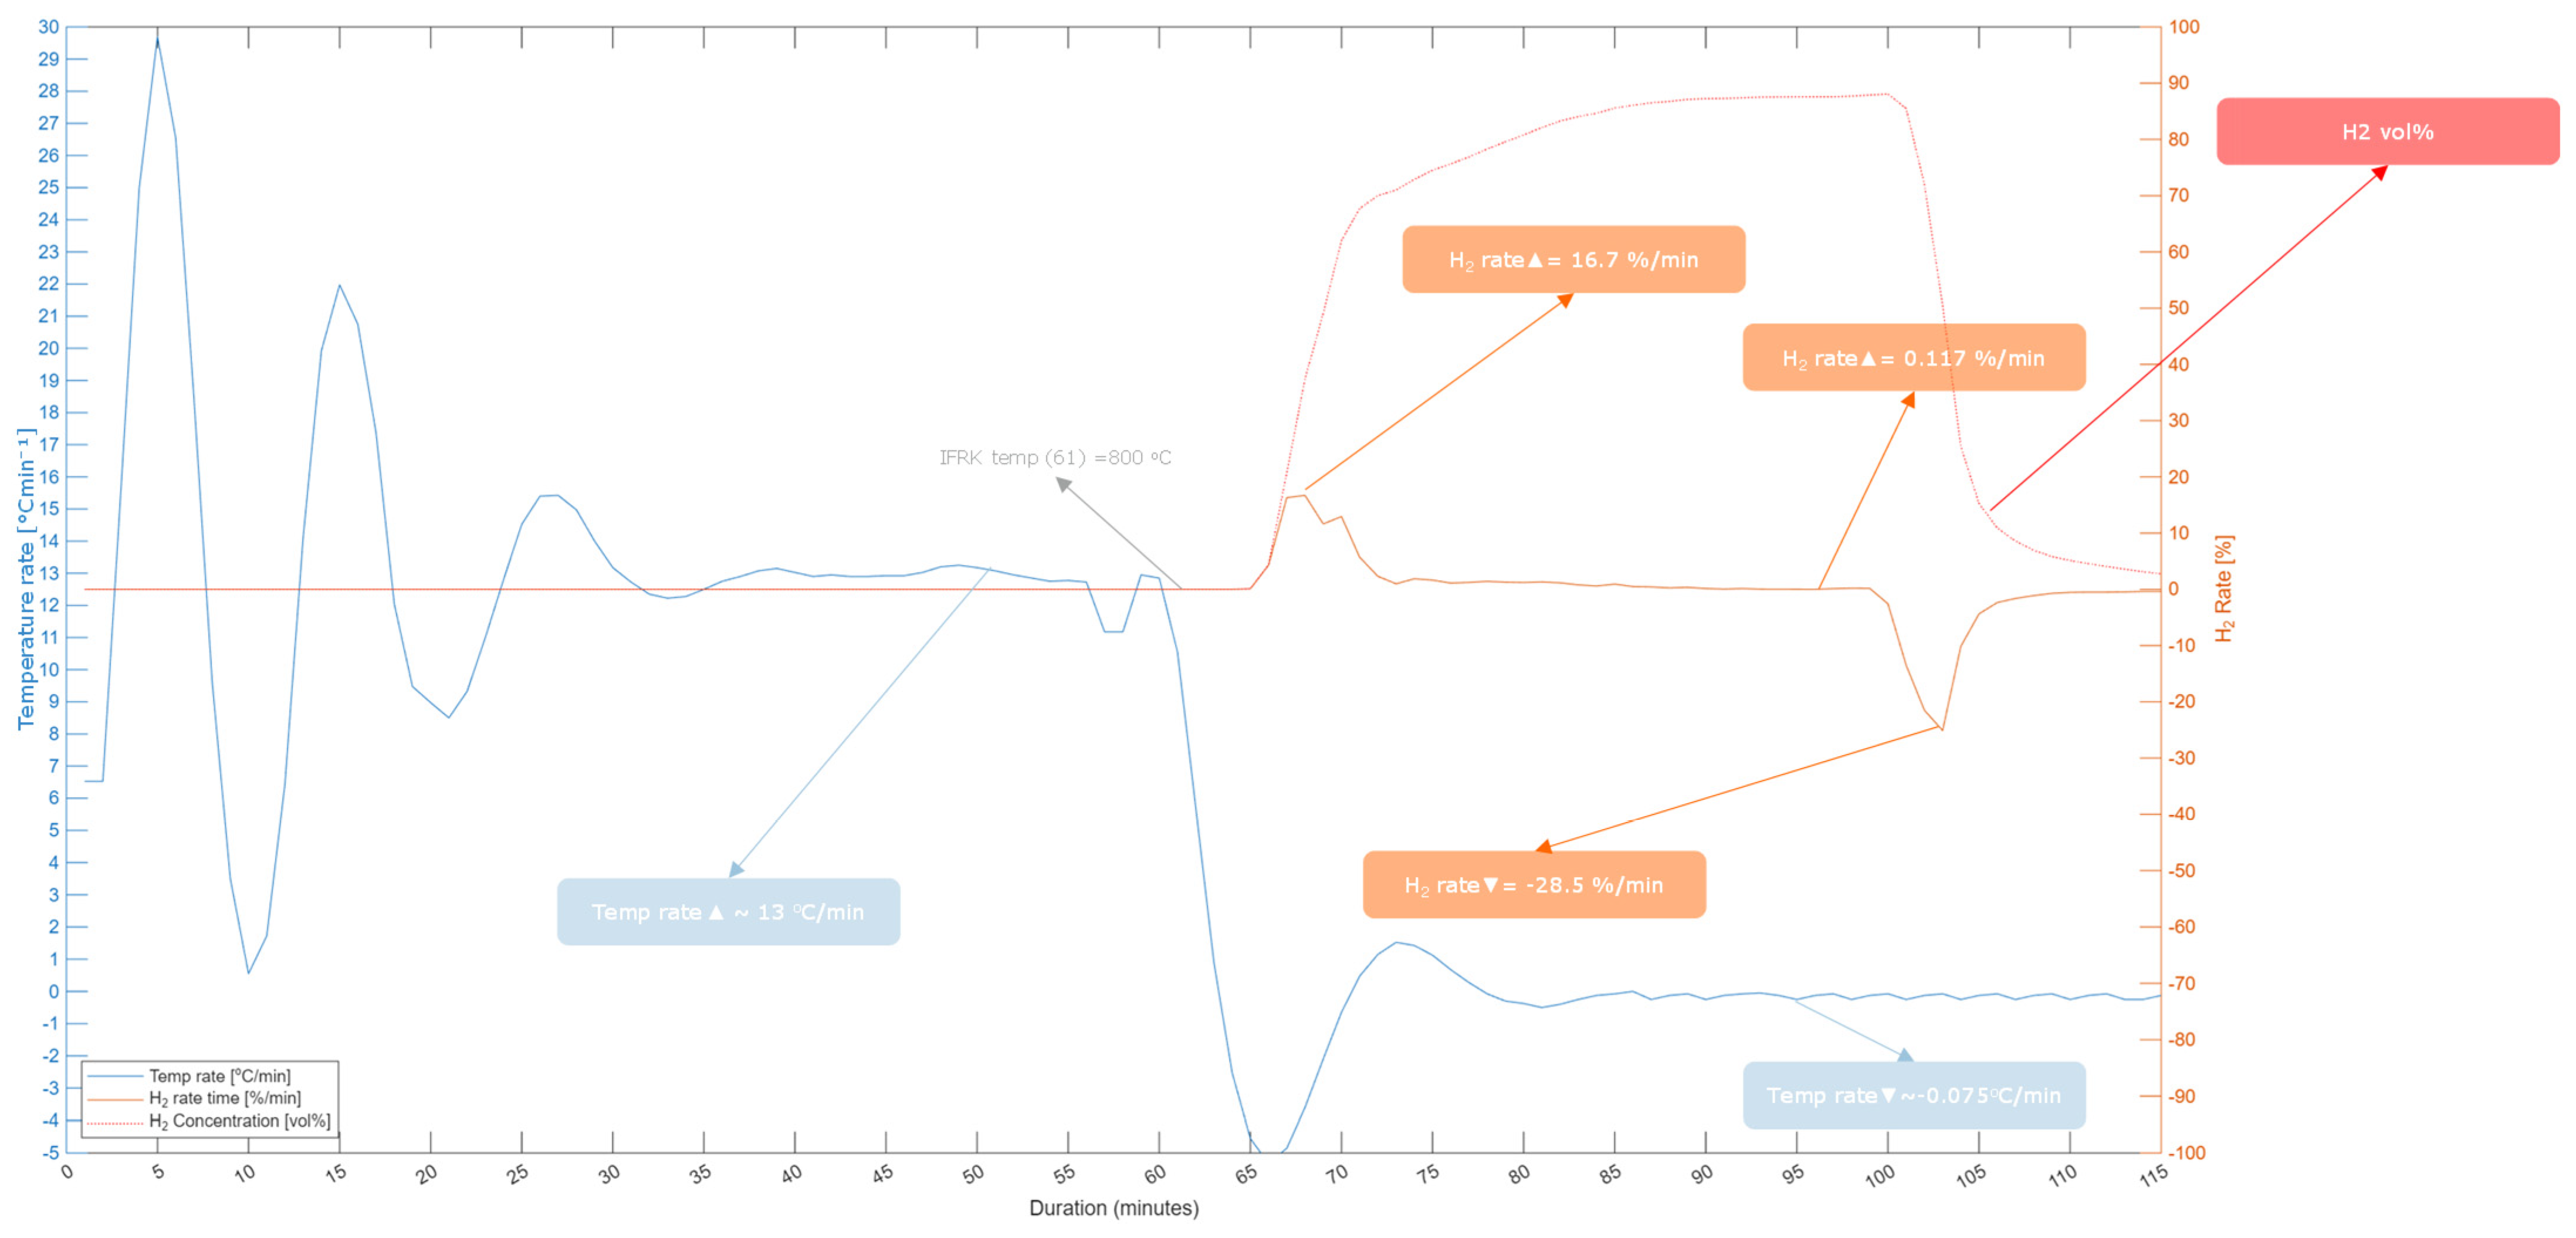
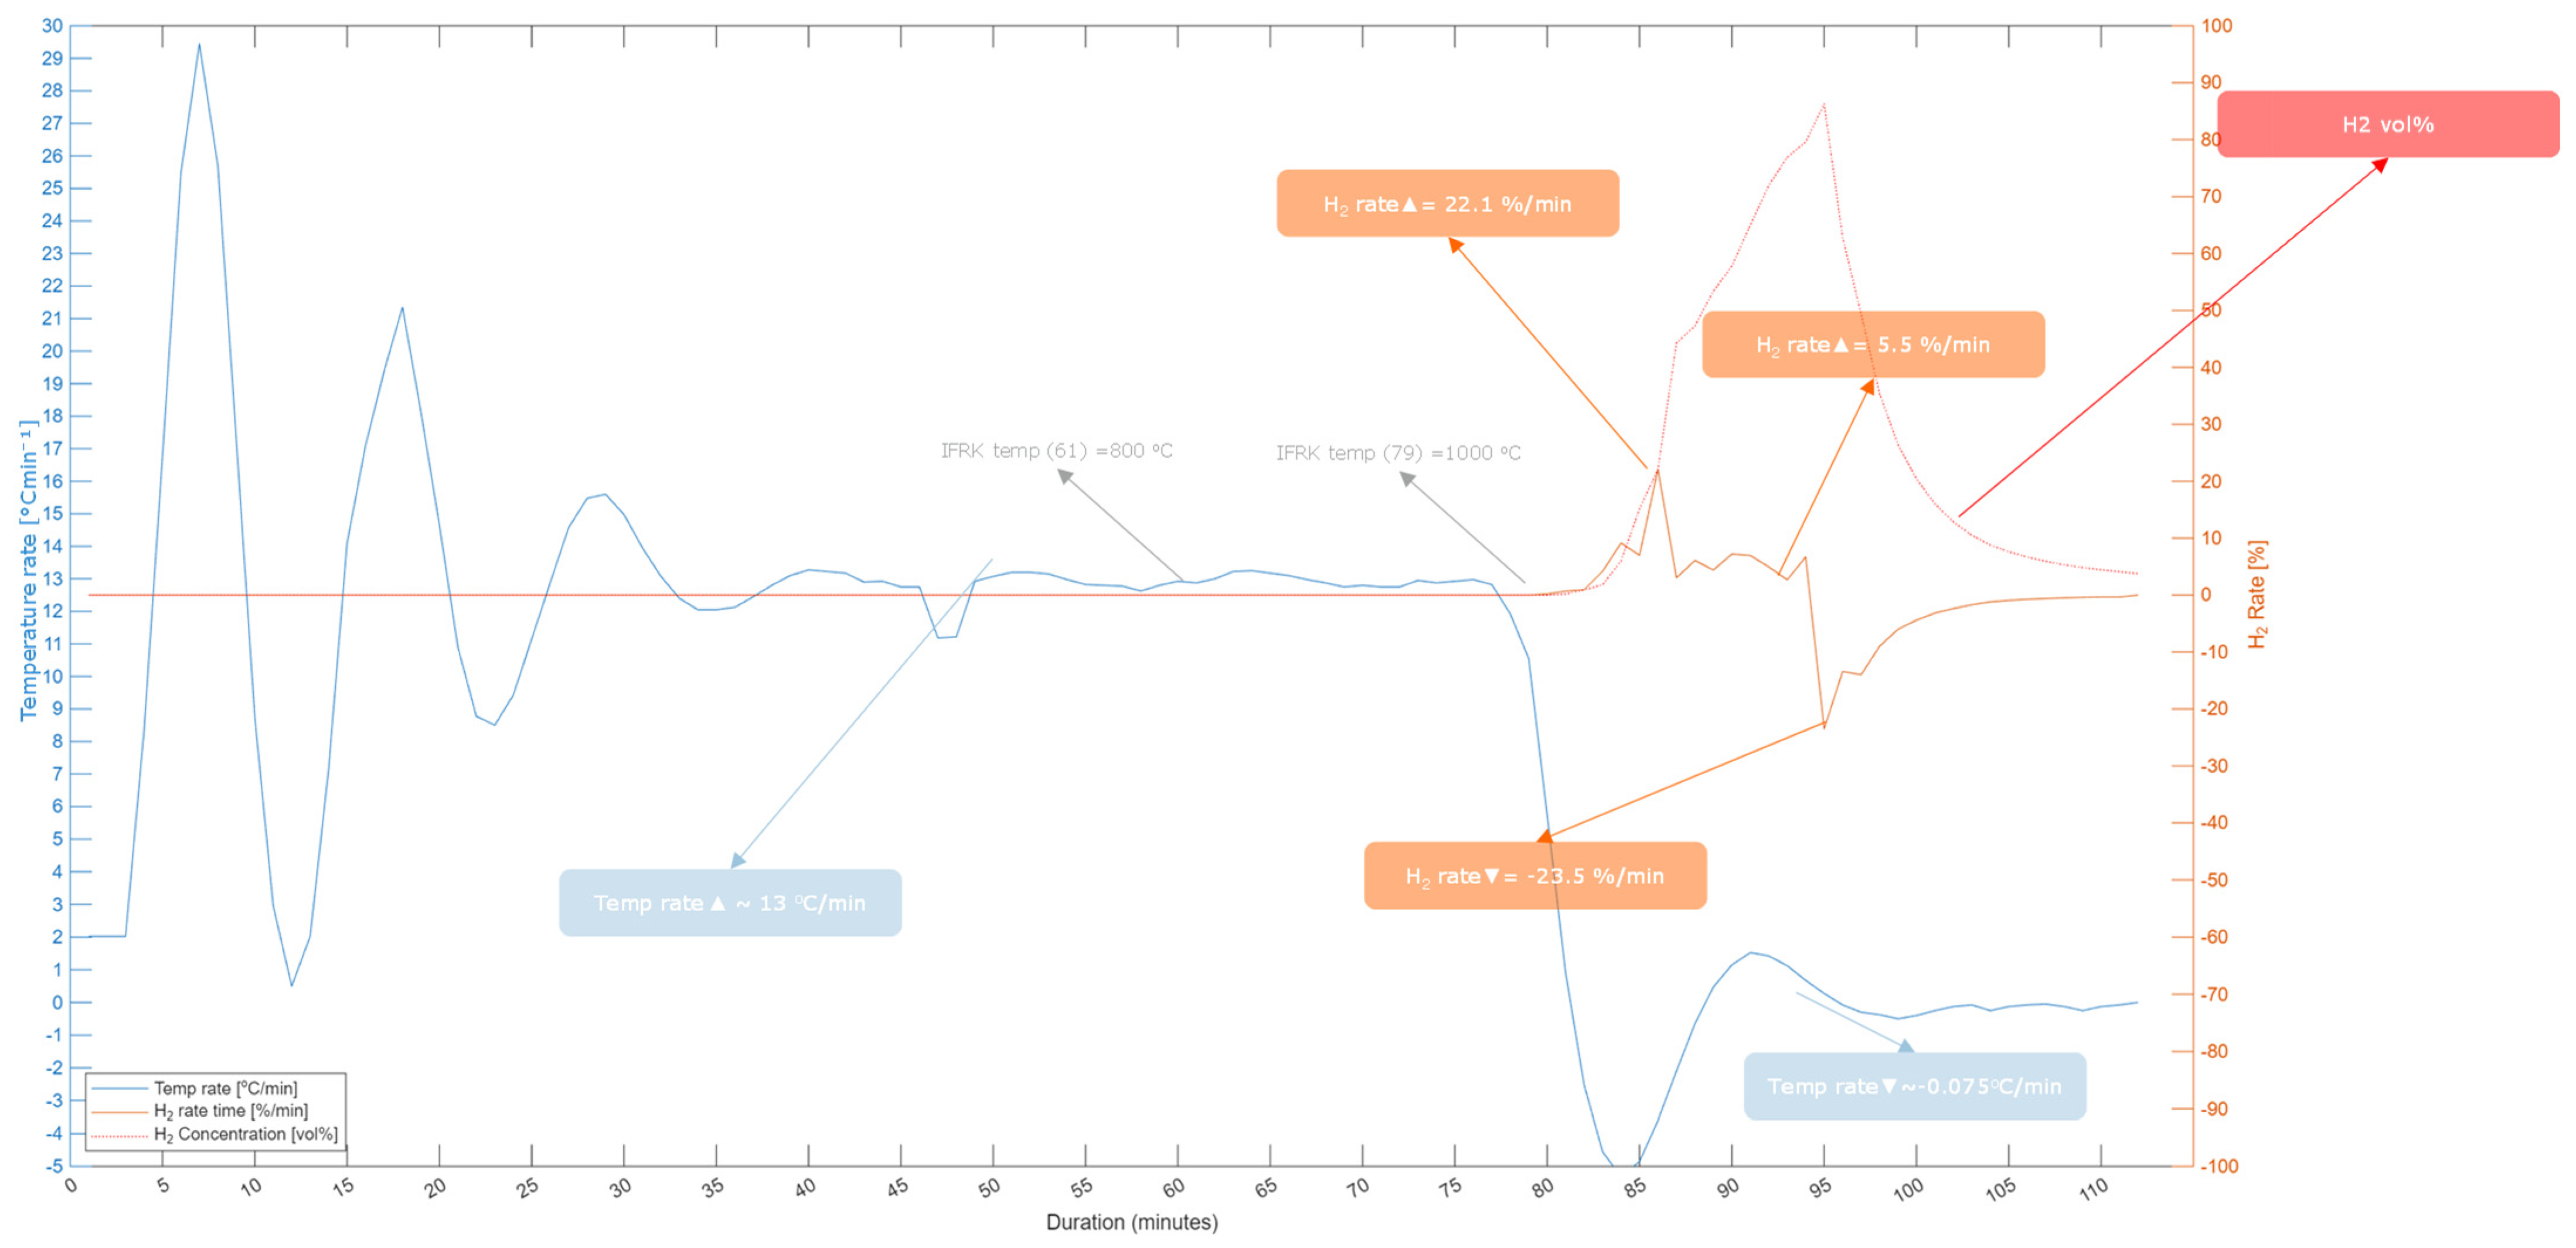
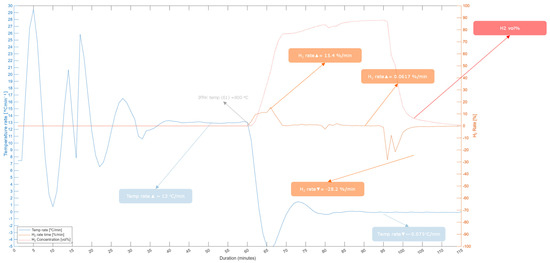
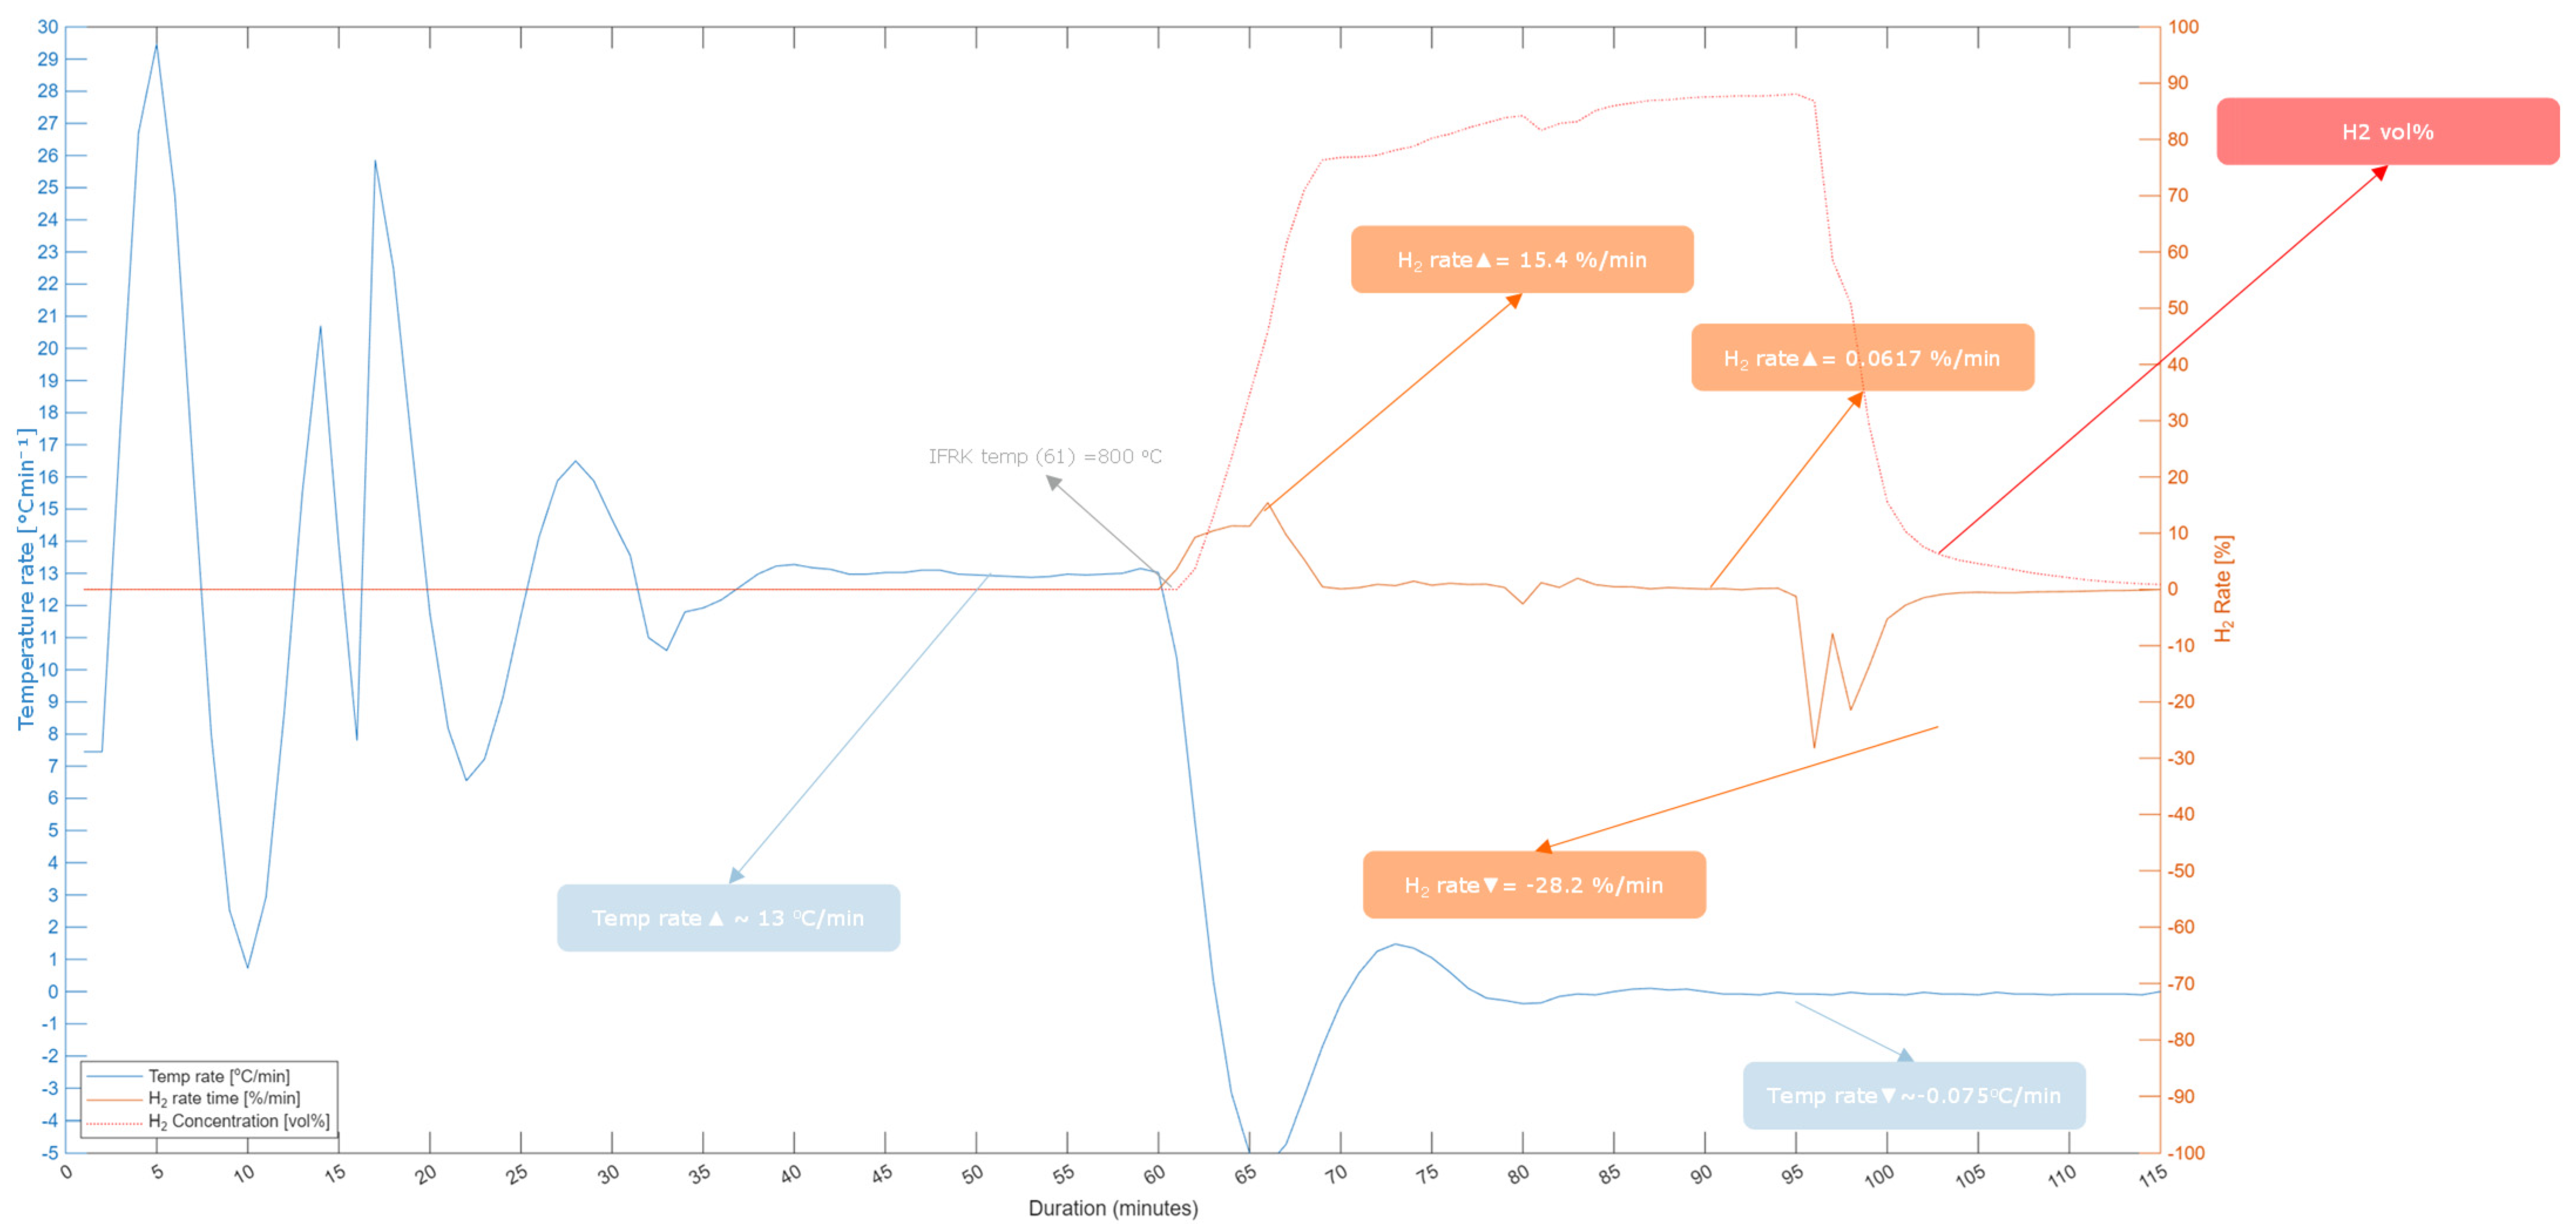
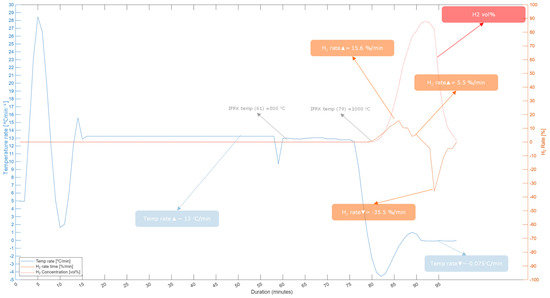
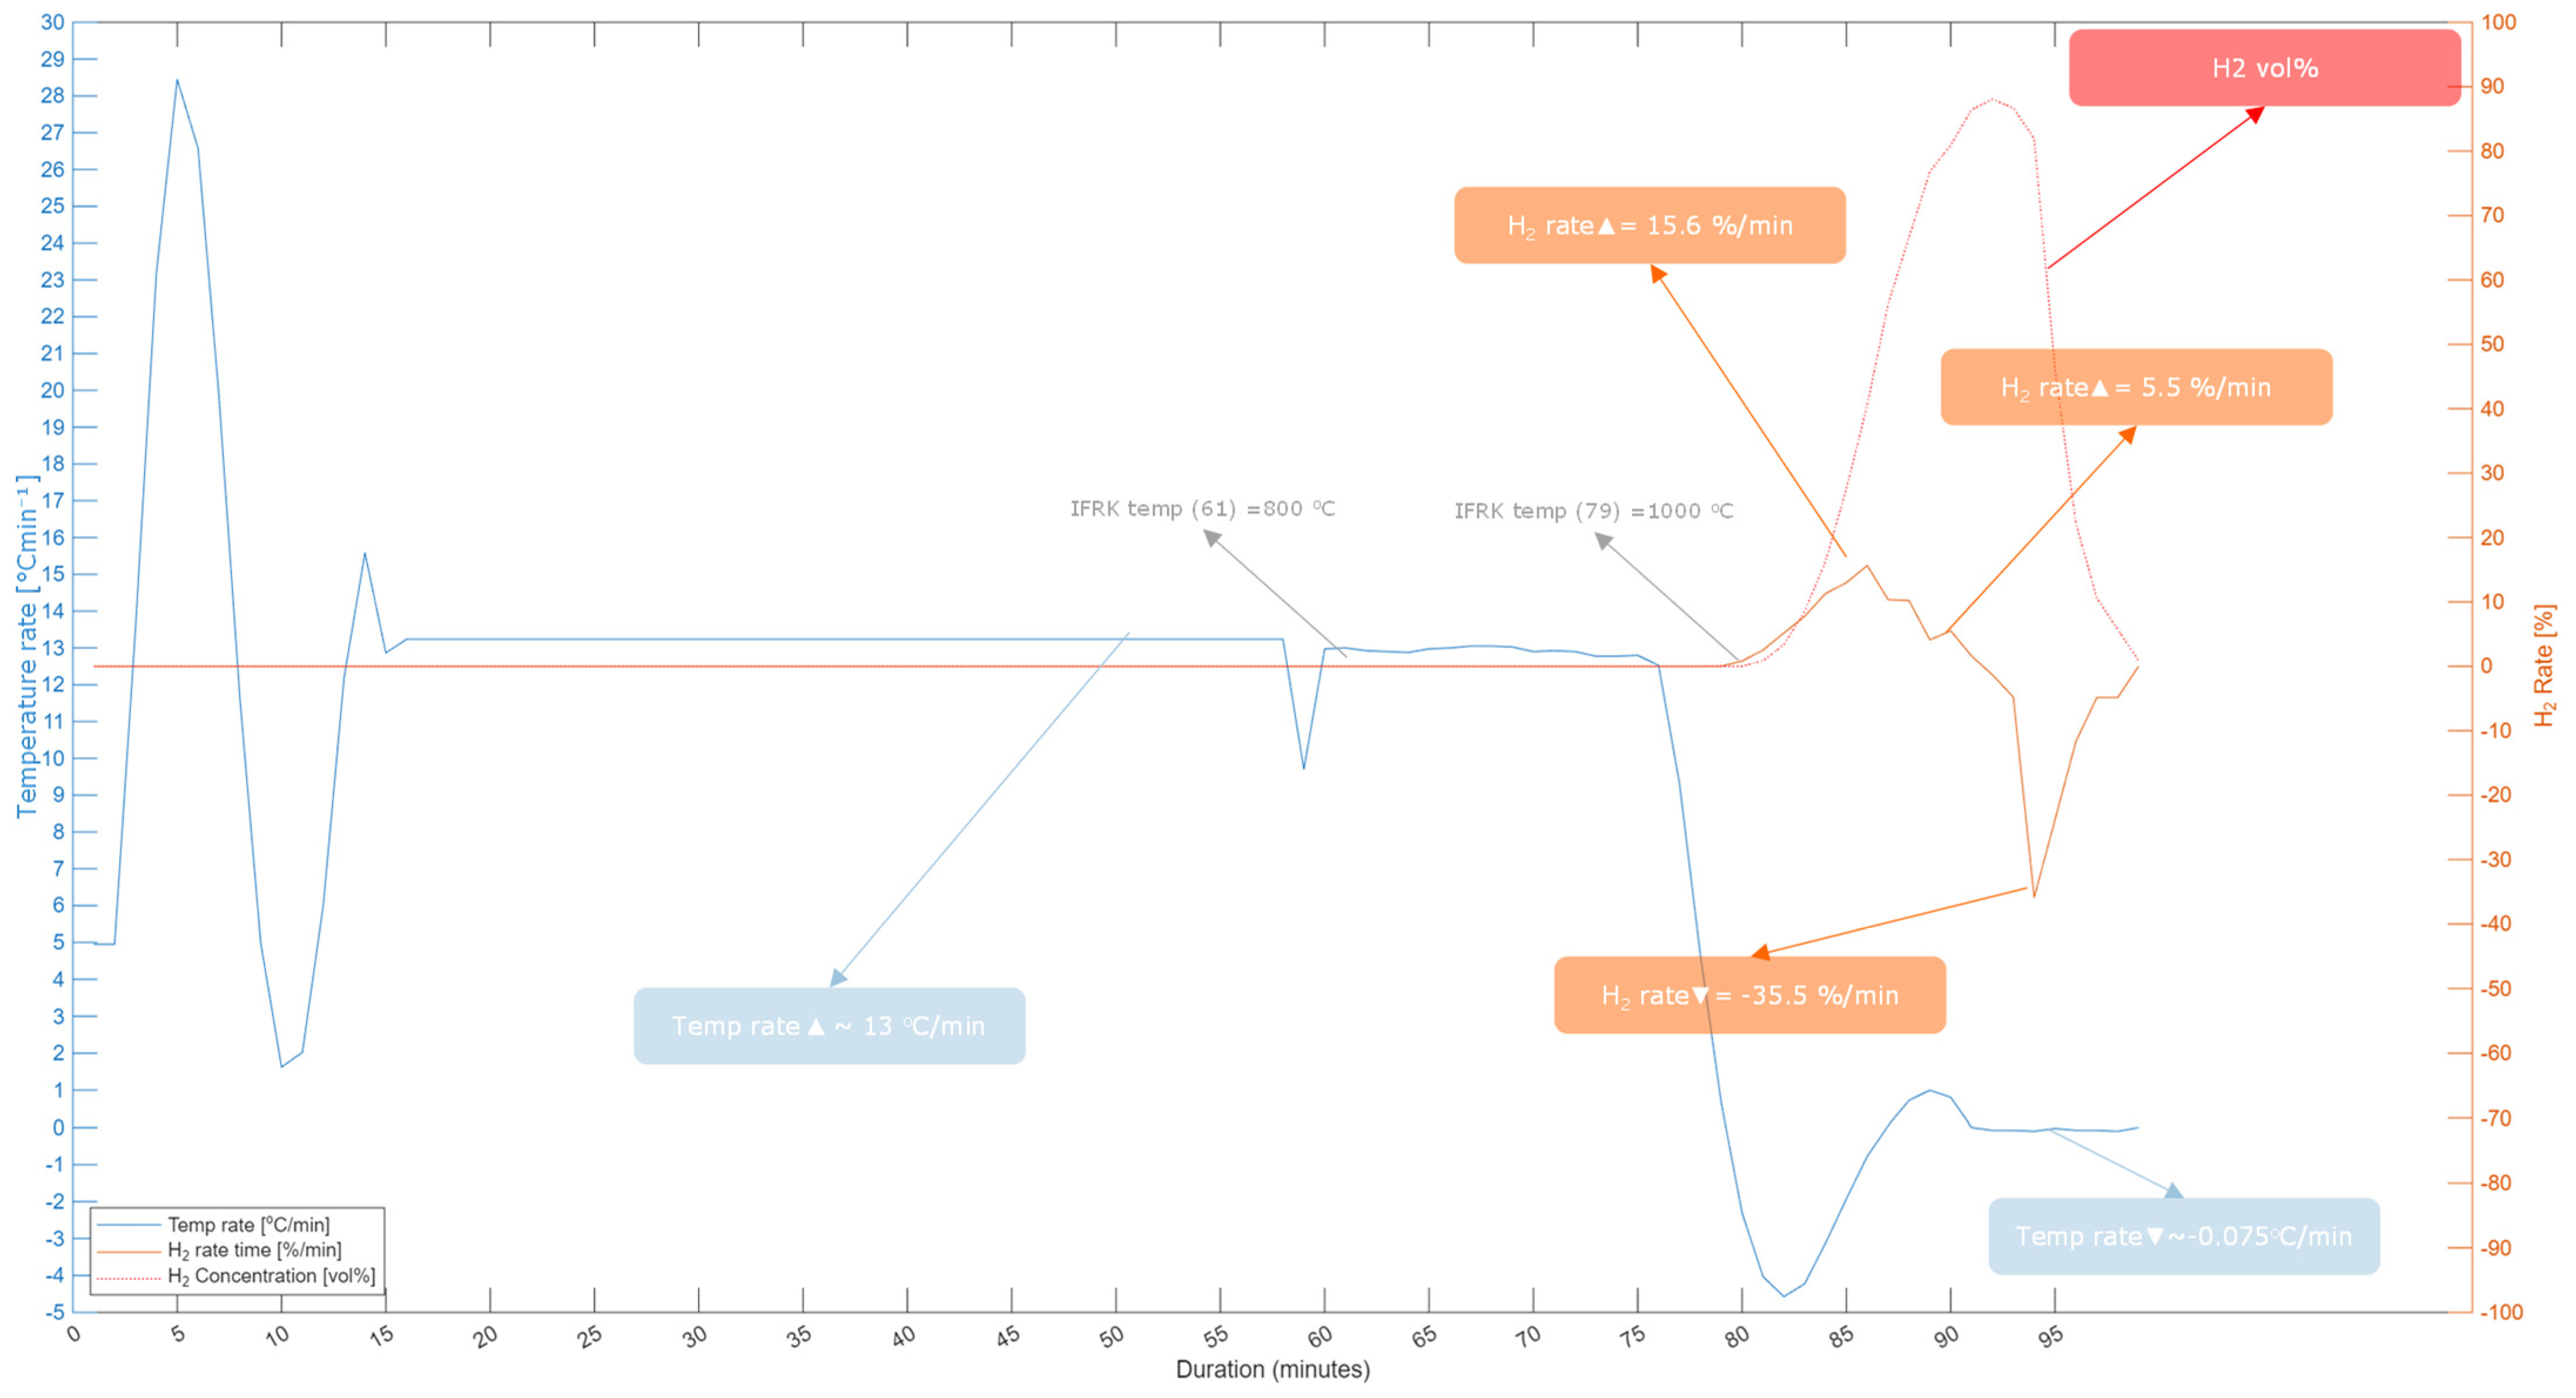
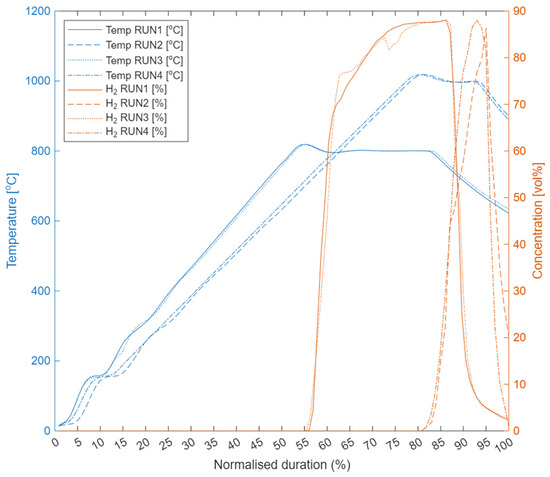
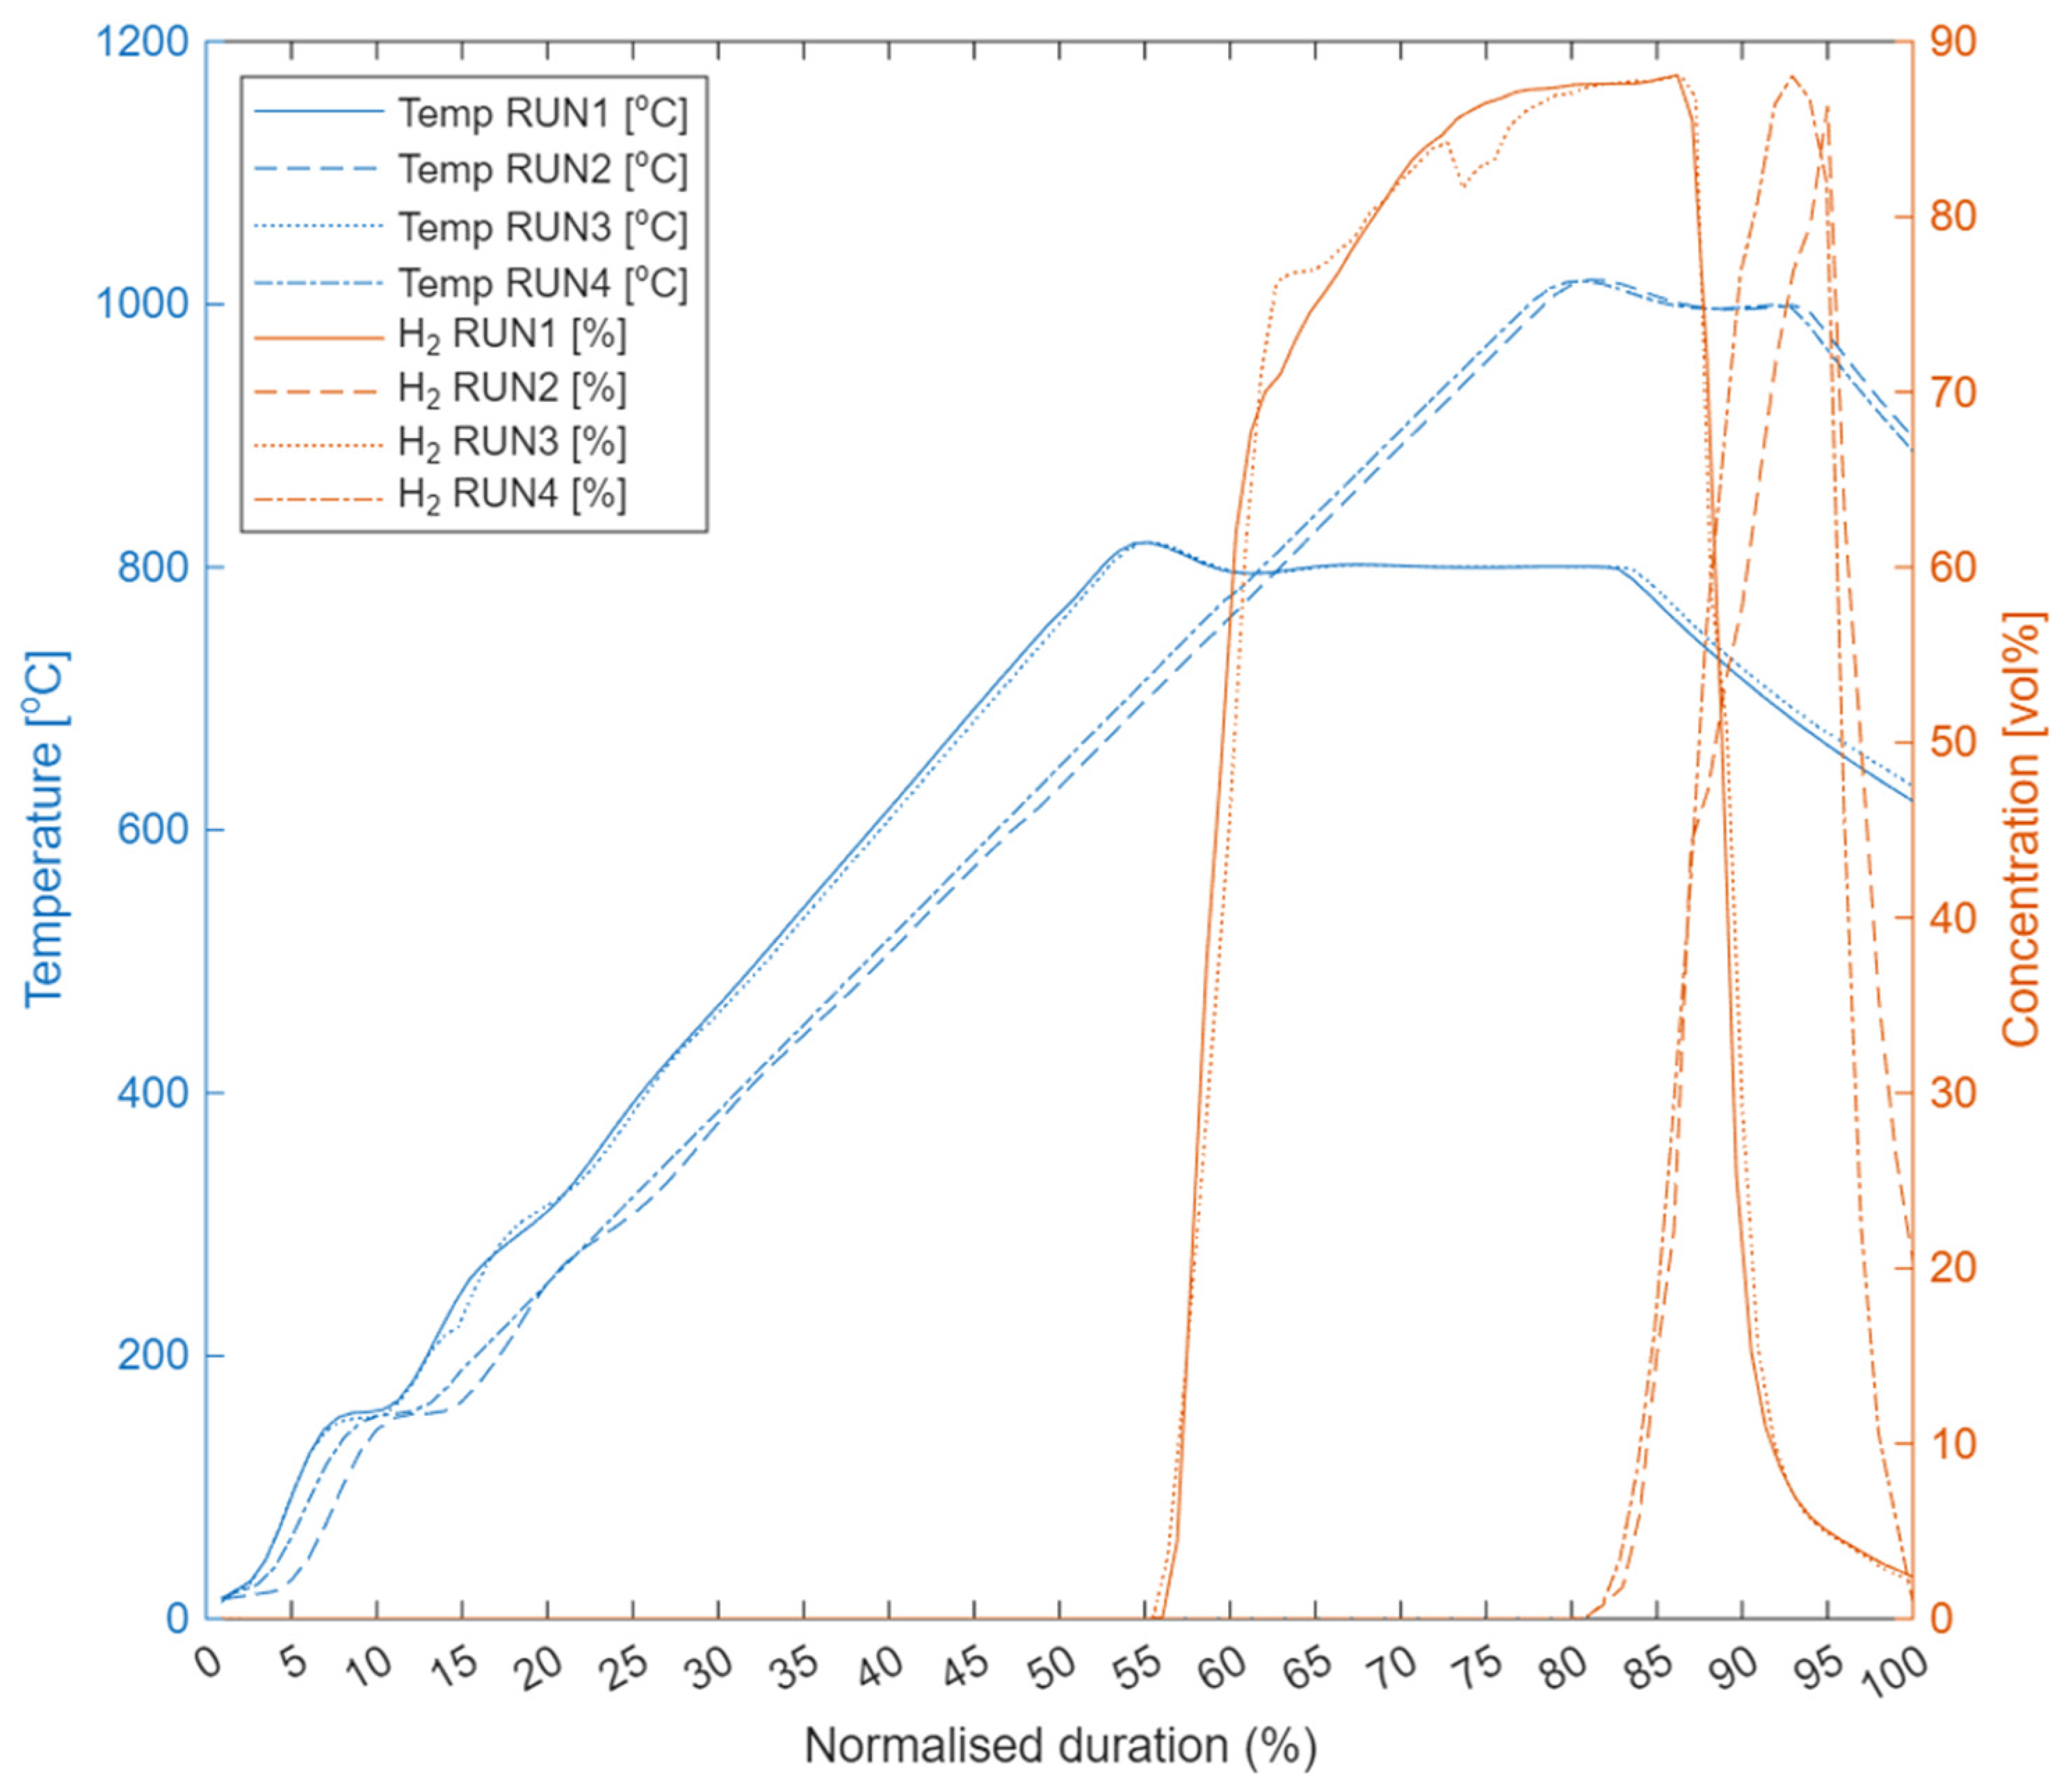
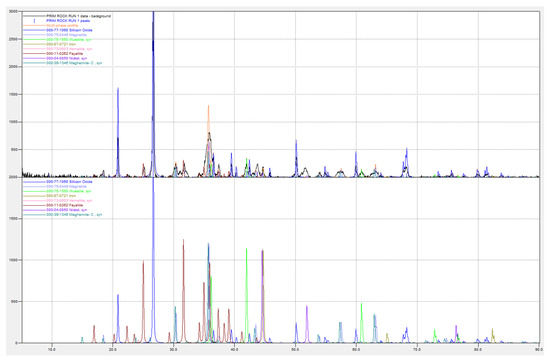
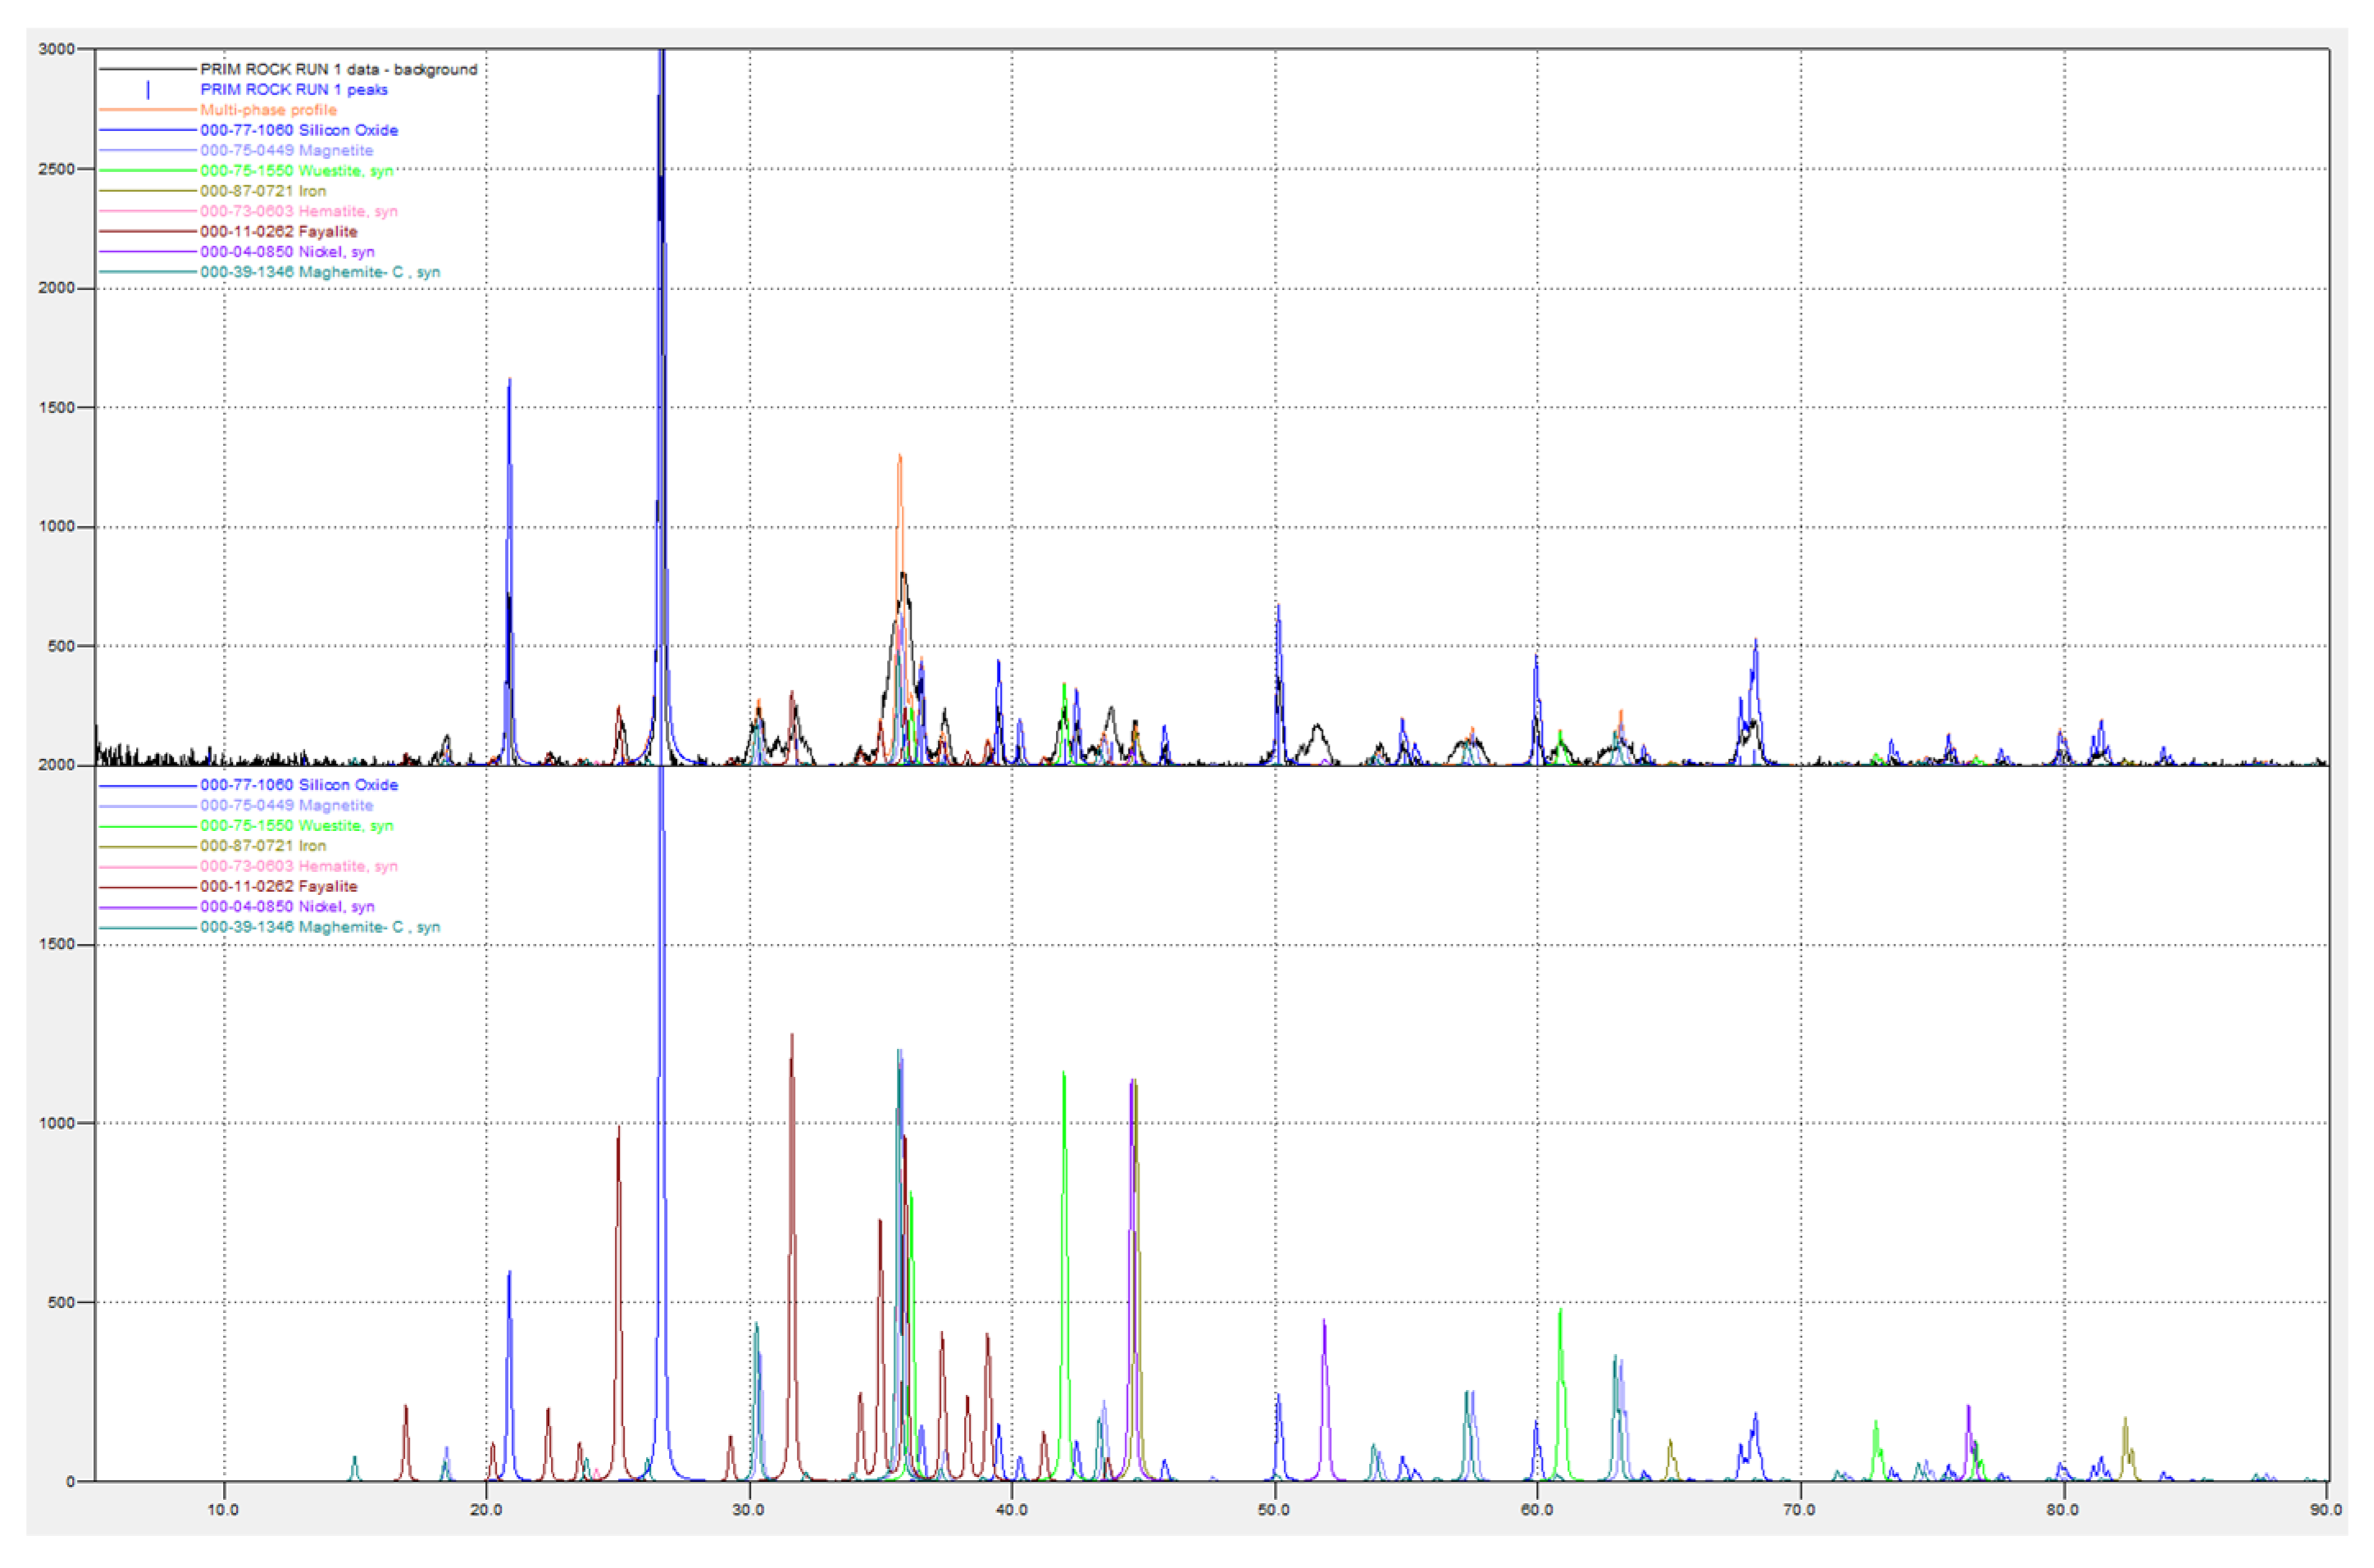
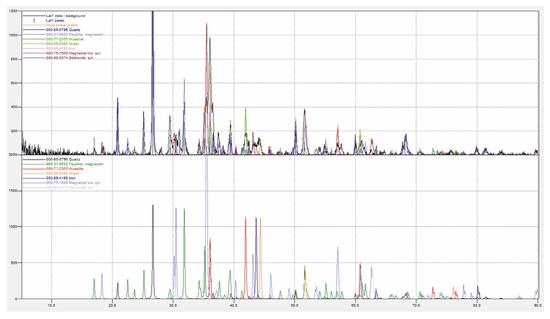
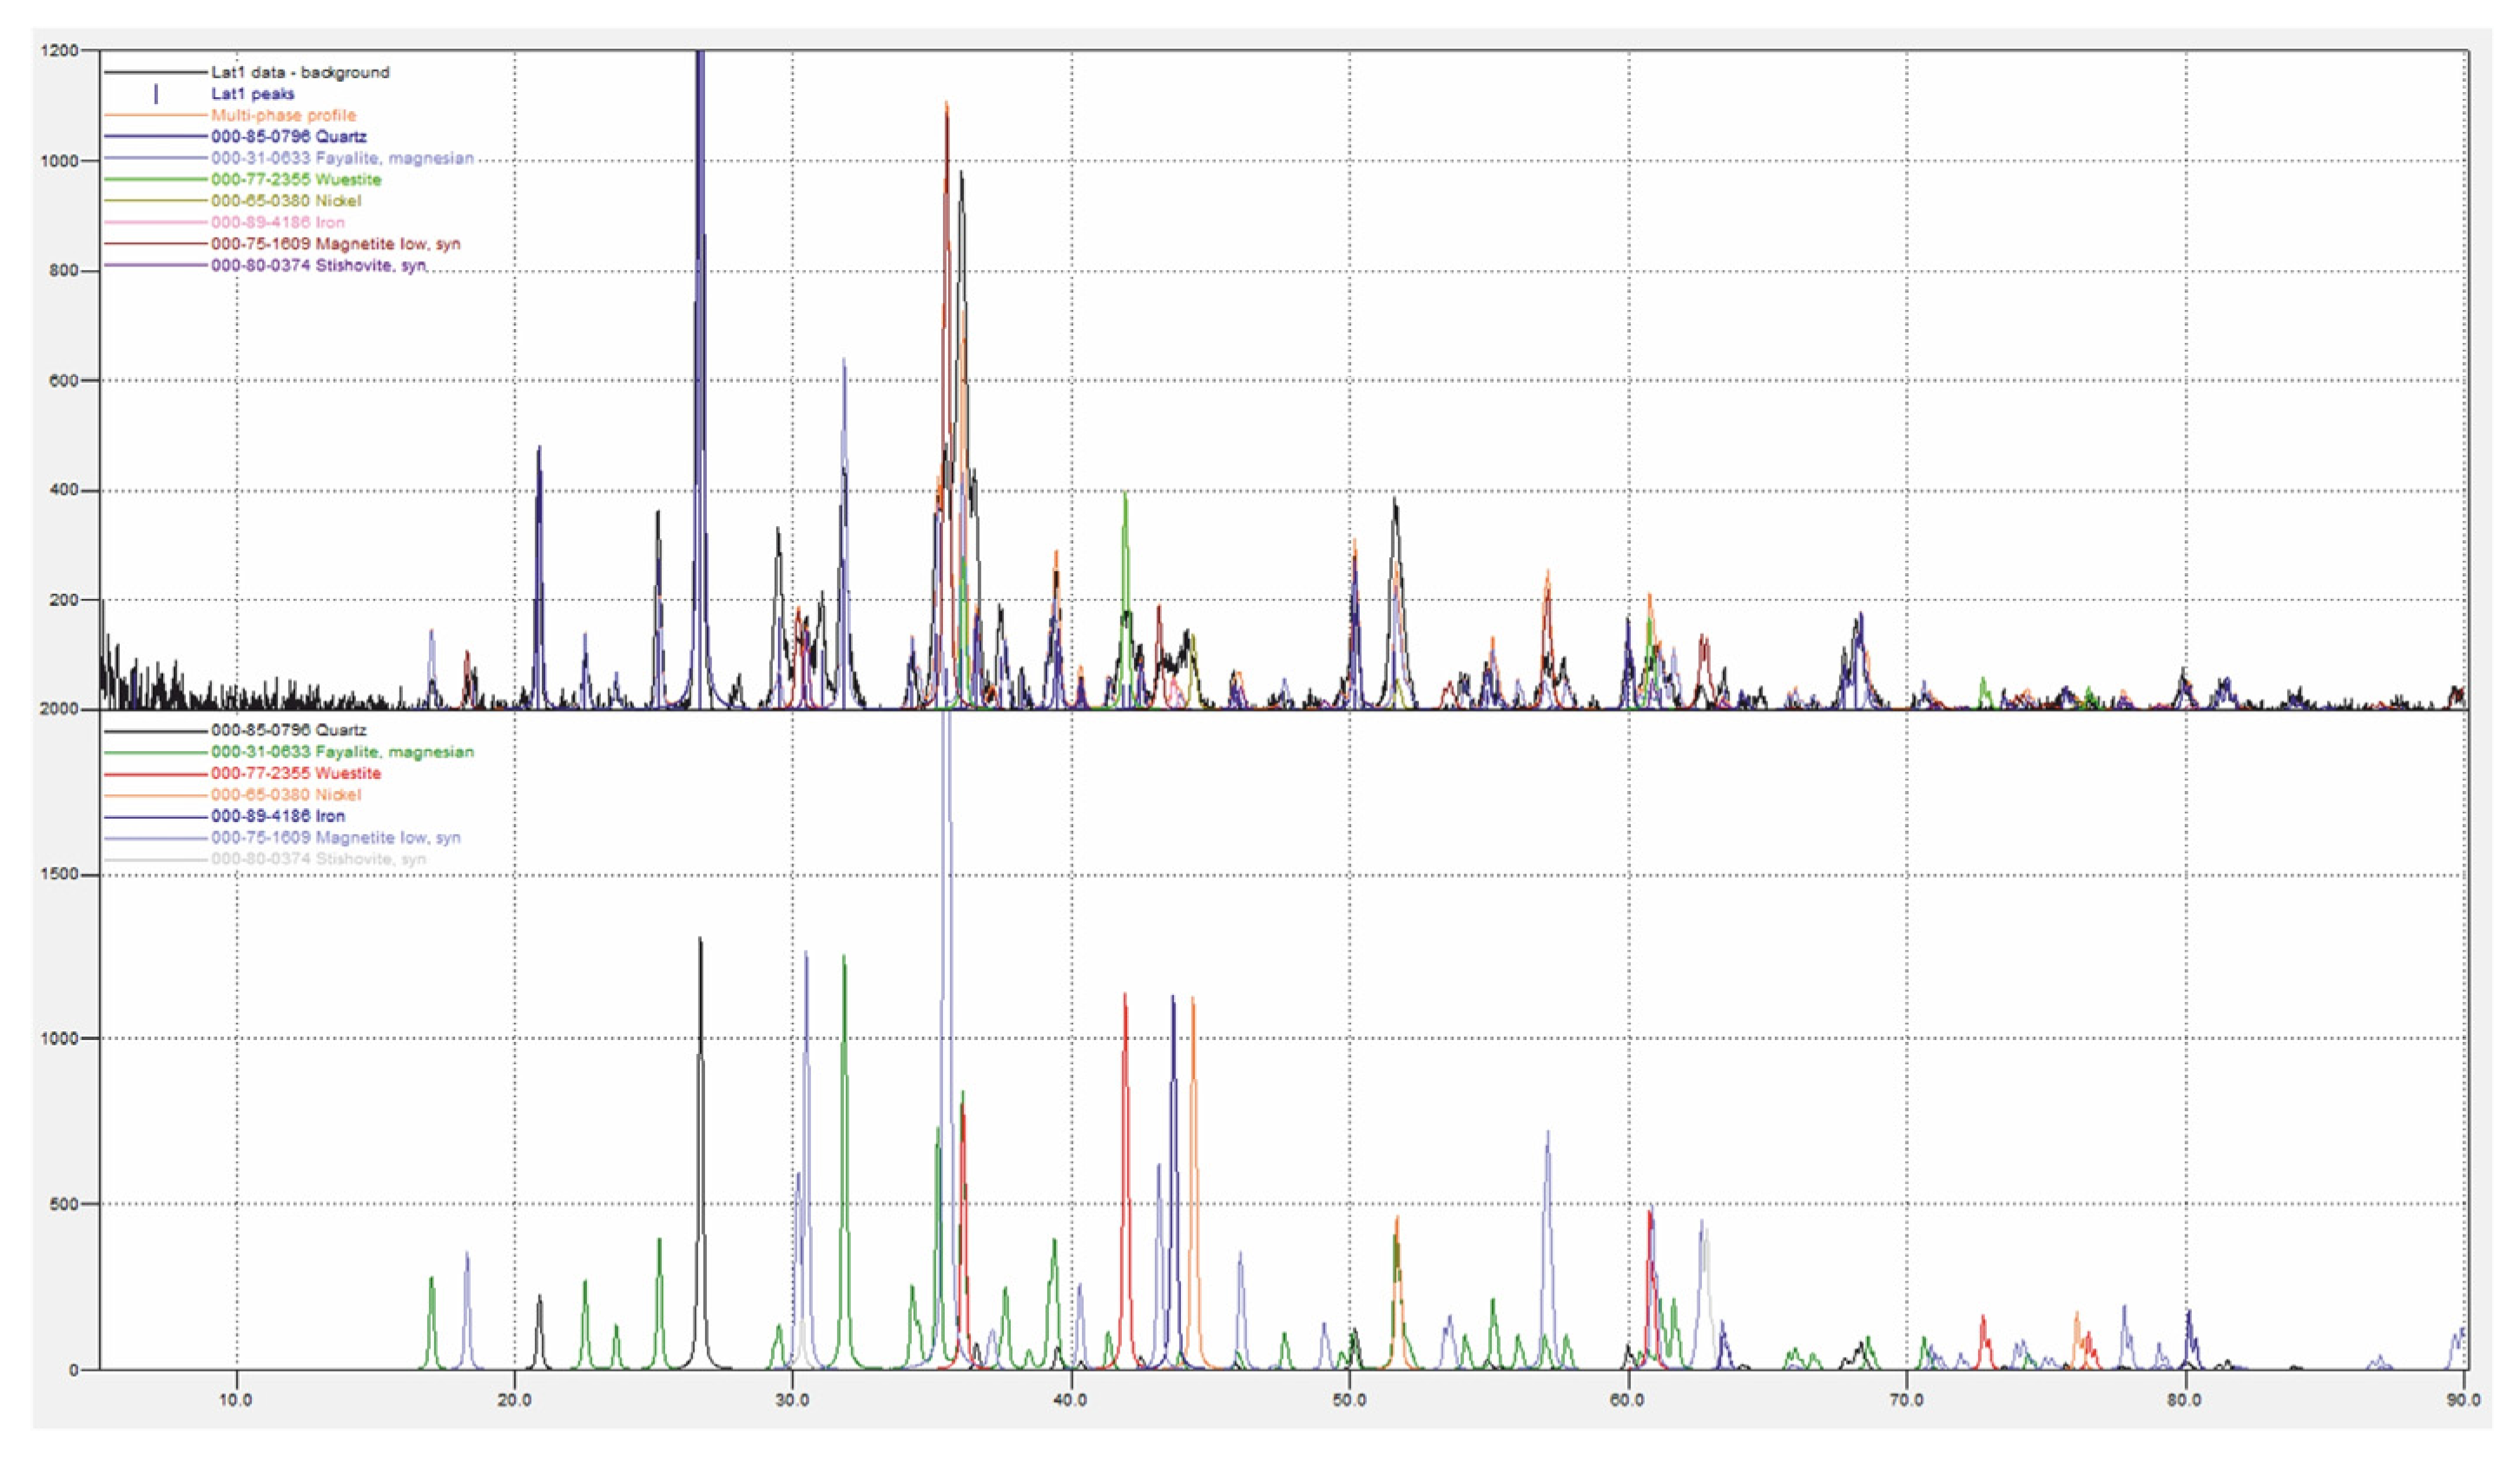
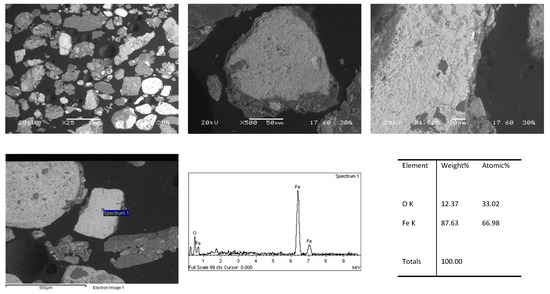
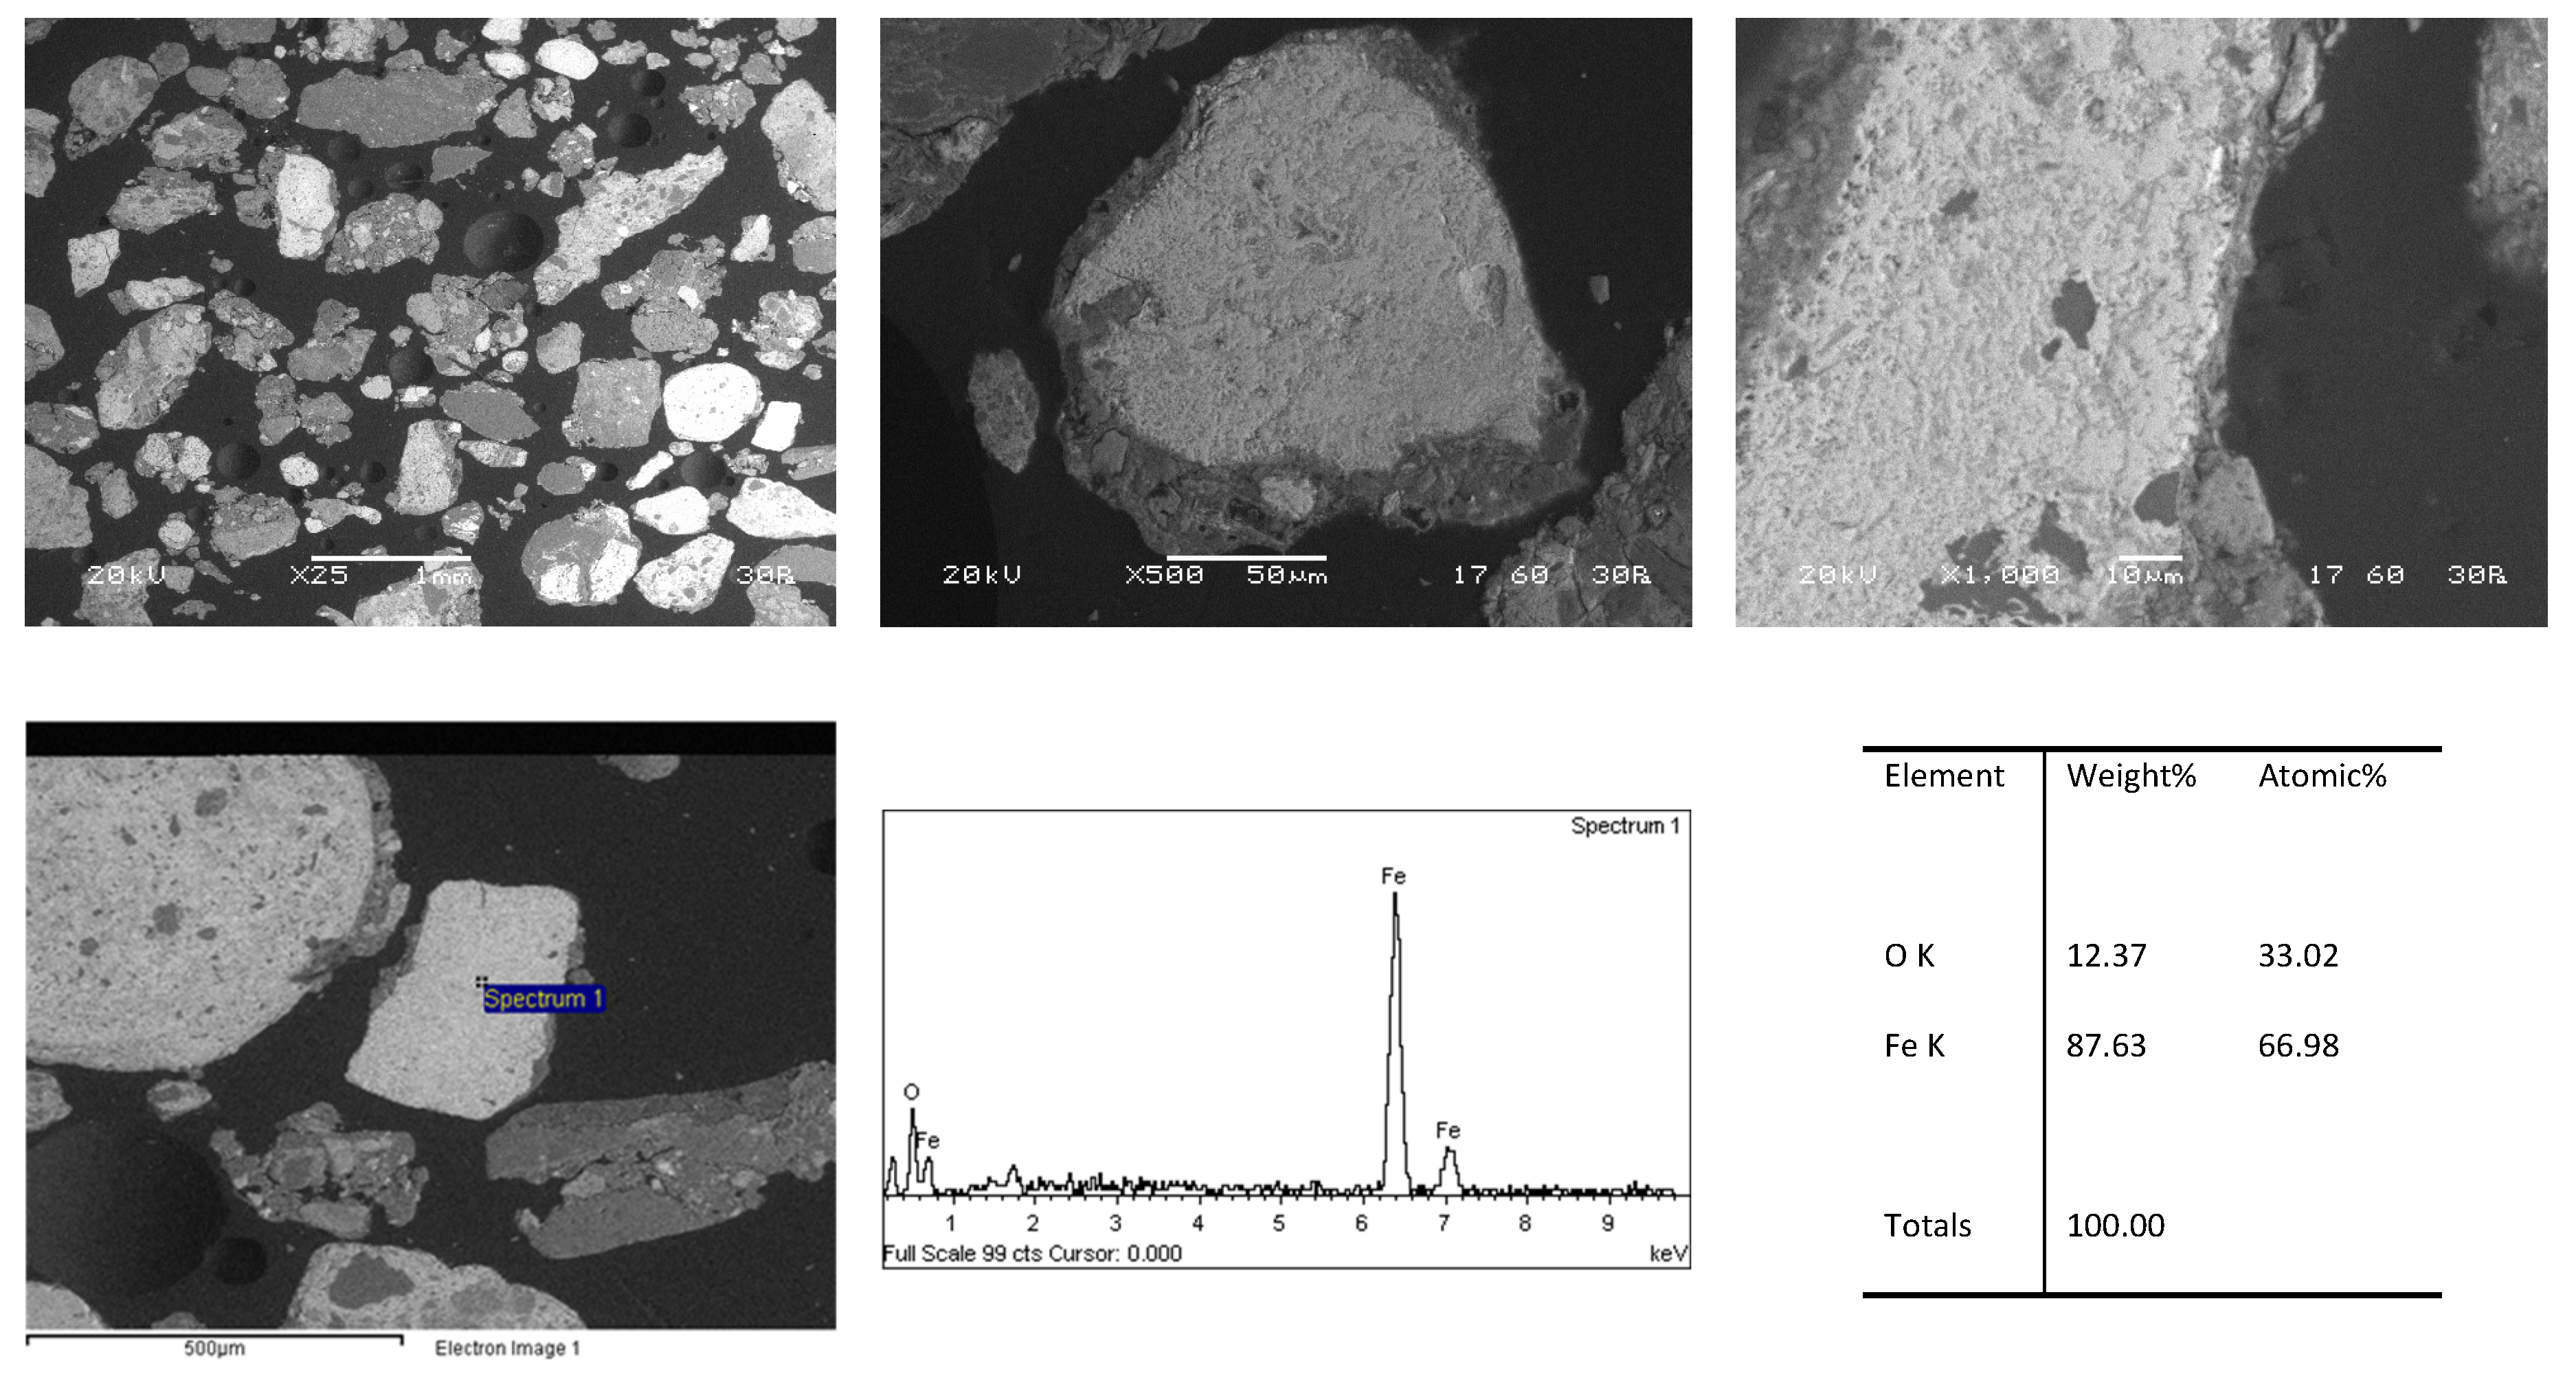
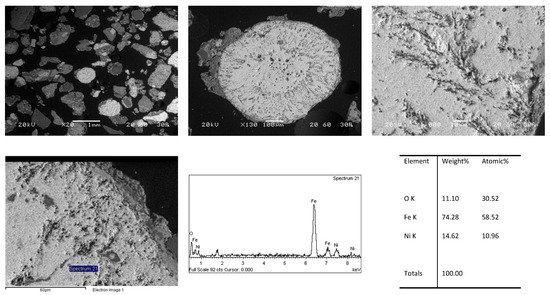
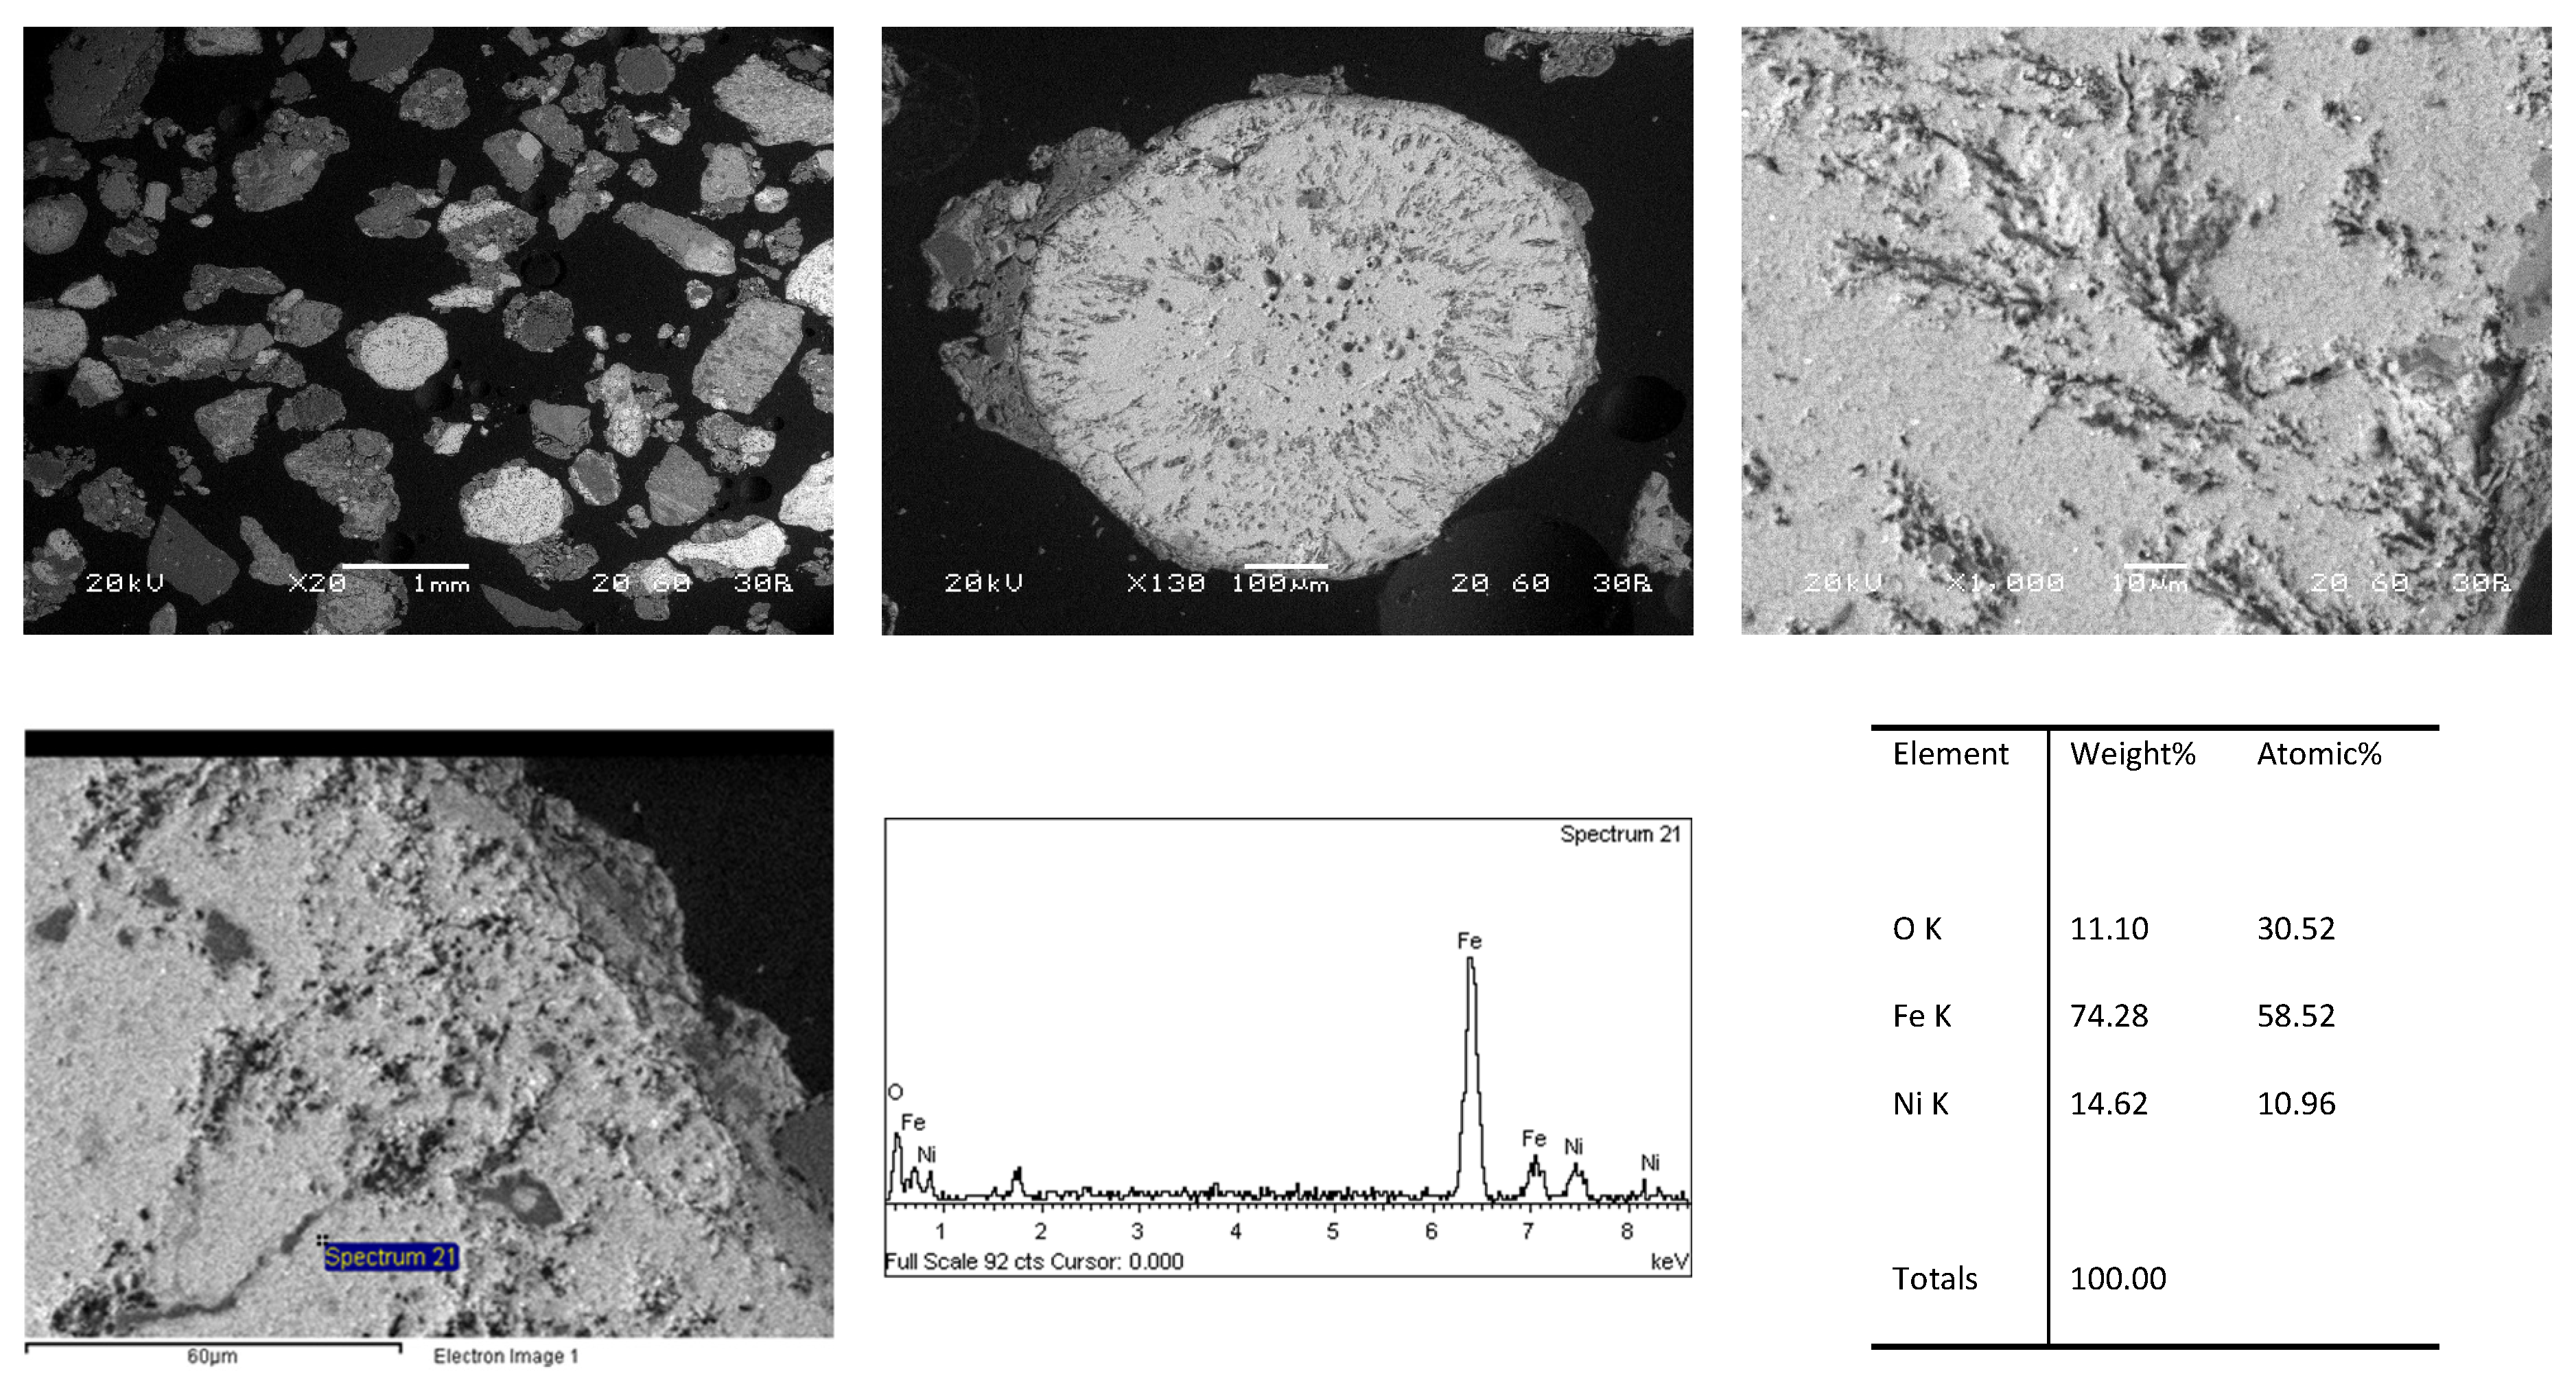

Disclaimer/Publisher’s Note: The statements, opinions and data contained in all publications are solely those of the individual author(s) and contributor(s) and not of MDPI and/or the editor(s). MDPI and/or the editor(s) disclaim responsibility for any injury to people or property resulting from any ideas, methods, instructions or products referred to in the content. |
© 2026 by the authors. Licensee MDPI, Basel, Switzerland. This article is an open access article distributed under the terms and conditions of the Creative Commons Attribution (CC BY) license.