


Abstract
After leakage from buried hydrogen-blended natural gas pipelines, gas may seep through the soil into quasi-closed enclosures and form buoyancy-driven non-uniform combustible clouds. The effect of ignition delay on such clouds remains insufficiently understood, particularly regarding the relationship between visible flame development and local thermal response. In this study, 44 soil-seepage combustion experiments were conducted in a 1.5 m × 1.5 m × 1.5 m enclosure. The methane and hydrogen concentrations at three heights, flame evolution, and transient temperatures were measured using gas sensors, high-speed imaging, and thermocouples. The ignition delay ranged from 27 s to 5429 s, with hydrogen blending ratios of 10–30 vol% and ignition positions at the floor, middle, and ceiling levels. The results show that longer ignition delays generally weakened the visible flame luminosity and propagation extent. However, the peak temperature measured by the central thermocouple did not decrease. For the long-delay subset with td > 307 s, the central peak temperature increased with the ignition delay, with R2 = 0.74. Concentration measurements indicated that preferential hydrogen migration and slower methane redistribution continuously reconfigured the local flammability state before ignition. These findings suggest that, in enclosed soil-seepage HBNG scenarios, prolonged ignition delay may weaken visible flame development but does not necessarily reduce local thermal exposure.
1. Introduction
Blending hydrogen into natural gas pipeline networks is regarded as a practical transitional approach for reducing the carbon intensity of pipeline-transported fuels [1,2,3]. It supports the low-carbon transition of energy systems by adjusting the hydrogen and carbon compositions of the gas supplied through pipeline networks [4,5]. However, hydrogen has a low molecular weight, high diffusion coefficient, wide flammability limits, and low ignition energy. These properties make the leakage, diffusion, and ignition risks of hydrogen-blended natural gas different from those of conventional natural gas [6,7,8]. After leakage from a buried hydrogen-blended natural gas (HBNG) pipeline, the released gas may seep upward through soil pores and enter overlying enclosed underground spaces, such as utility tunnels. Under the combined effects of buoyancy and molecular diffusion, a non-uniform flammable cloud with a vertical concentration gradient can form [9,10,11,12]. The non-uniformity arises from the leakage and seepage process, in which CH4 and H2 undergo transient multicomponent transport through the porous soil and locally redistribute during accumulation in the enclosure, forming a flammable cloud with a vertical concentration gradient.
Previous studies have advanced the understanding of HBNG safety by examining leakage diffusion, ventilation, premixed combustion, explosion characteristics, and risk assessment under different conditions [13,14,15,16,17,18,19,20]. Other studies have also discussed hydrogen blending from the perspectives of pipeline infrastructure compatibility, material compatibility, and engineering demonstration [21,22,23]. Enclosed-space flammable-atmosphere formation and quantitative risk assessment have also been investigated for hydrogen-blended natural gas leakage scenarios [24,25]. The key factors investigated in these studies include the hydrogen blending ratio (HBR), ignition position, initial fuel distribution, obstacles, ventilation conditions, and enclosure configuration. These studies have established important knowledge regarding HBNG leakage and combustion behavior. However, these studies do not fully represent buried leakage scenarios in which the released gas migrates through the soil, accumulates in a quasi-closed enclosure, and continuously undergoes concentration redistribution before ignition.
In a typical buried HBNG pipeline leakage accident, a time interval usually exists between the cessation of leakage and ignition by an external source. This interval is defined in this study as the ignition delay time. After the leakage stopped, the flow field gradually changed from momentum-induced residual turbulence to buoyancy-dominated motion. Light components continue to migrate under buoyancy, whereas the cloud boundary and local flammable zones continue to evolve. Therefore, the ignition delay time may affect the local composition distribution at the moment of ignition; however, its influence on the relationship between visible flame development and local thermal response in soil-seepage-induced non-uniform HBNG clouds remains unclear. Yang et al. [26] investigated the effect of millisecond-scale diffusion time on pure hydrogen leakage explosion in a small pipe with both ends open and identified 800 ms as the critical time for the transition from turbulence-dominated to buoyancy-dominated behavior. However, the fuel type, boundary conditions, geometric scale, time scale, and leakage pathway in their study differ fundamentally from those of HBNG leakage through soil into a quasi-closed enclosure.
To clarify this issue, a buried-pipeline soil-seepage experimental platform was used to investigate the effect of ignition delay on the flame behavior and local thermal response of non-uniform HBNG clouds. A total of 44 experiments were conducted with ignition delays of 27 s to 5429 s, HBRs of 10–30 vol%, and ignition positions at the floor, middle, and ceiling. By combining flame imaging, vertical concentration measurements, and transient temperature acquisition, this study reveals how the post-leakage redistribution of CH4 and H2 affects visible flame development and local thermal exposure. The results provide experimental evidence for assessing ignition and thermal hazards after the leakage of buried HBNG pipelines.
2. Experimental Methods
2.1. Experimental Setup
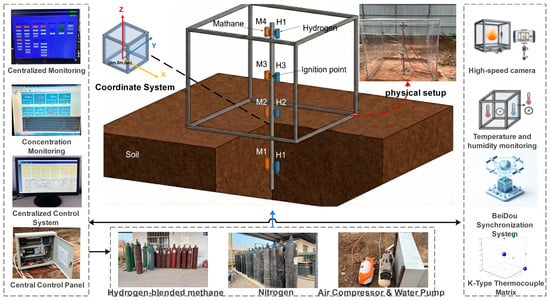
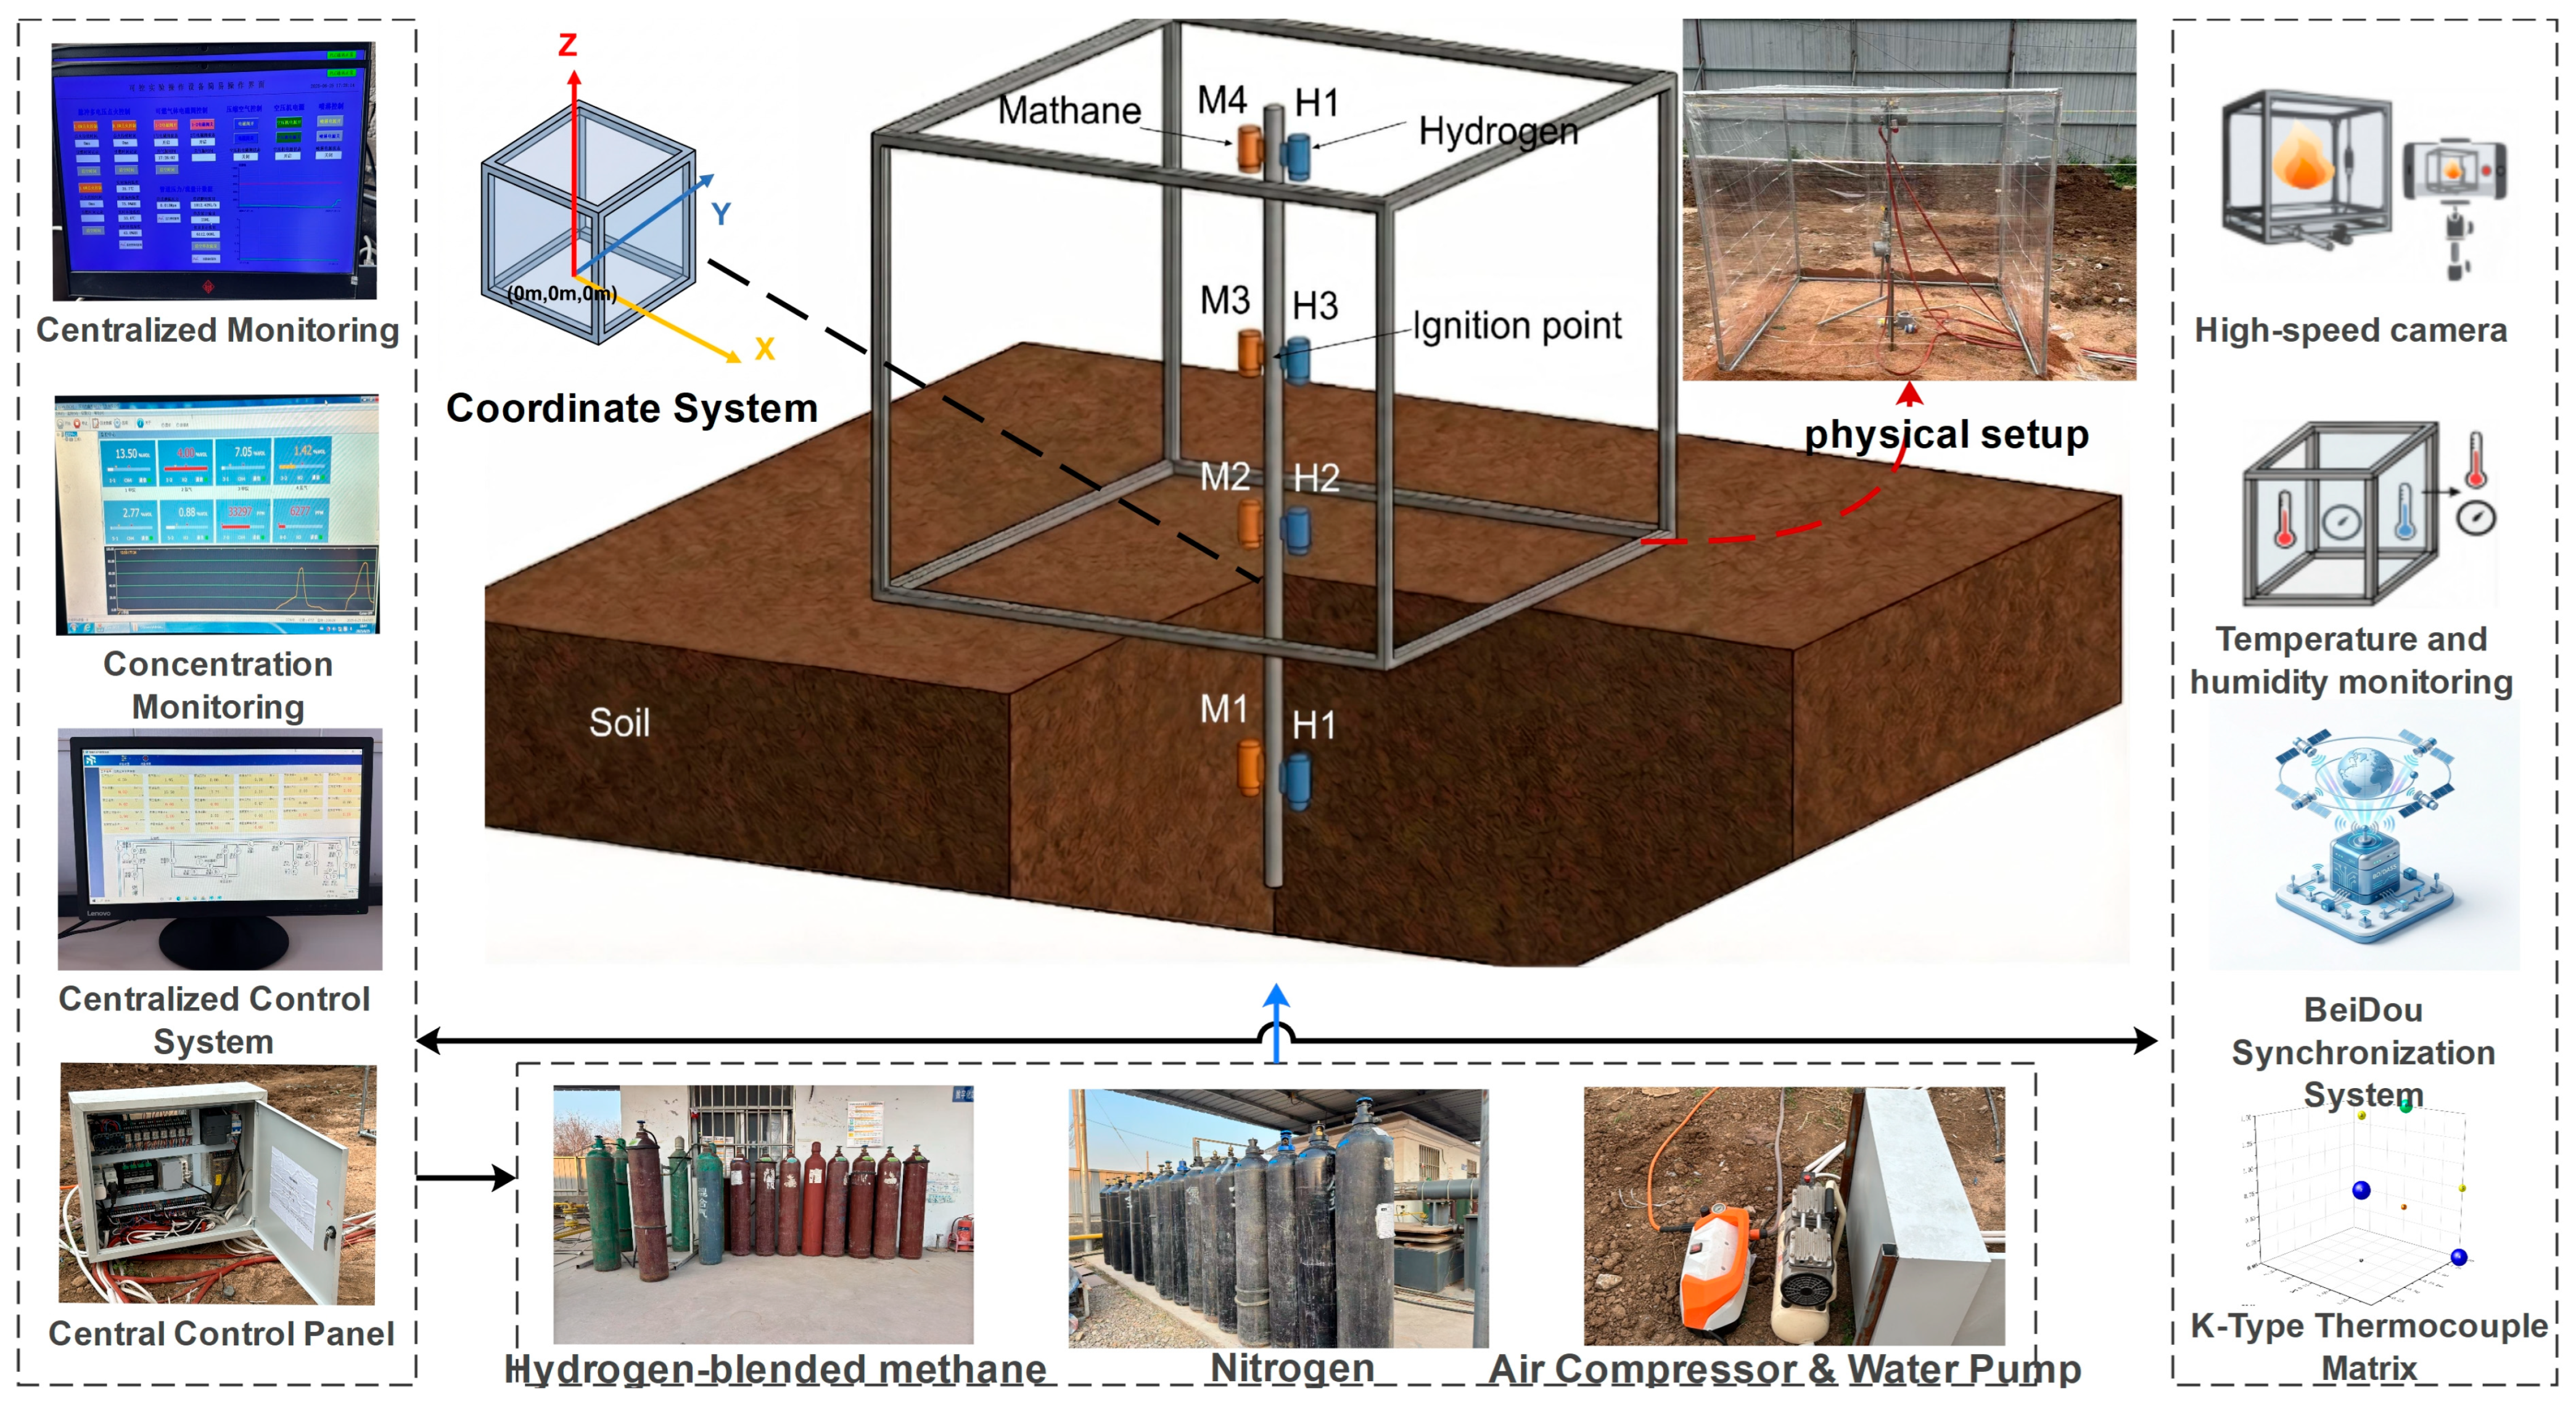
The HBNG soil leakage combustion experimental platform is illustrated in Figure 1. The system consisted of a quasi-closed enclosure simulator, soil leakage unit, high-speed imaging system, temperature acquisition system, and ignition system.
Figure 1.
Experimental platform.
The quasi-closed enclosure simulator was a metal frame structure with dimensions of 1500 mm × 1500 mm × 1500 mm. The enclosure was fully covered with a 0.22 mm thick transparent polyethylene (PE) film. All edges and joints were sealed before each test, and no ventilation openings were present during the leakage, ignition delay, or pre-ignition stages. Minor leakage through the film joints could not be completely excluded and was considered an experimental uncertainty. The enclosure had no designed ventilation opening and was treated as a quasi-closed space during the leakage, ignition delay, and pre-ignition stages. In cases where the PE film failed, it first inflated and then ruptured after ignition, indicating that the rupture was caused by a combustion-induced pressure increase rather than a pre-ignition leakage. An 800 mm deep soil pit was excavated in the quasi-closed enclosure. The in situ soil was replaced with medium-grained washed sand to simulate the upward seepage of gas through a homogeneous porous medium after leakage from a buried pipeline.
Flame images were recorded using a high-speed camera at 240 fps. The flame morphology was qualitatively evaluated using high-speed images. Flame visibility was qualitatively assessed from the high-speed images based on the presence, luminosity, and apparent propagation extent of the flame region. The observed flame luminosity and visible propagation extent were used to describe the apparent visible flame development rather than to quantify the total combustion intensity.
The temperature was measured using seven K-type thermocouples with exposed junctions of 0.5 mm in diameter. The sampling frequency was 1000 Hz, and the response time constant was approximately 0.05 s. The main instruments used in the experiments are listed in Table 1.
Table 1.
The main instruments used for flame imaging and temperature measurements are described below.
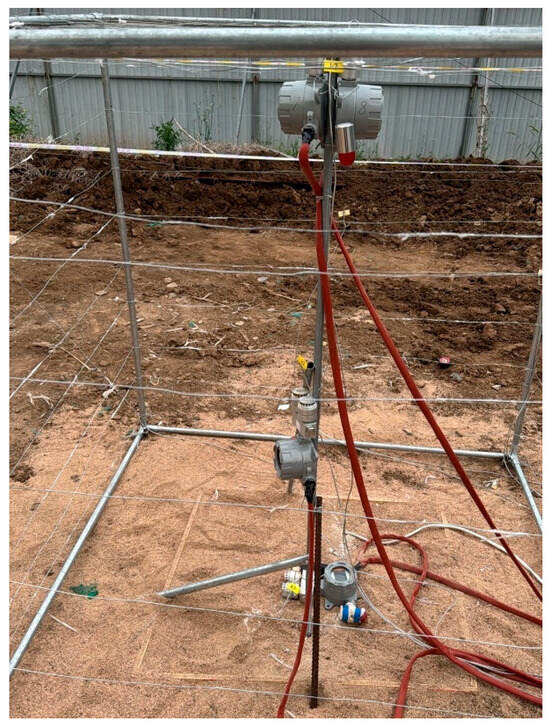
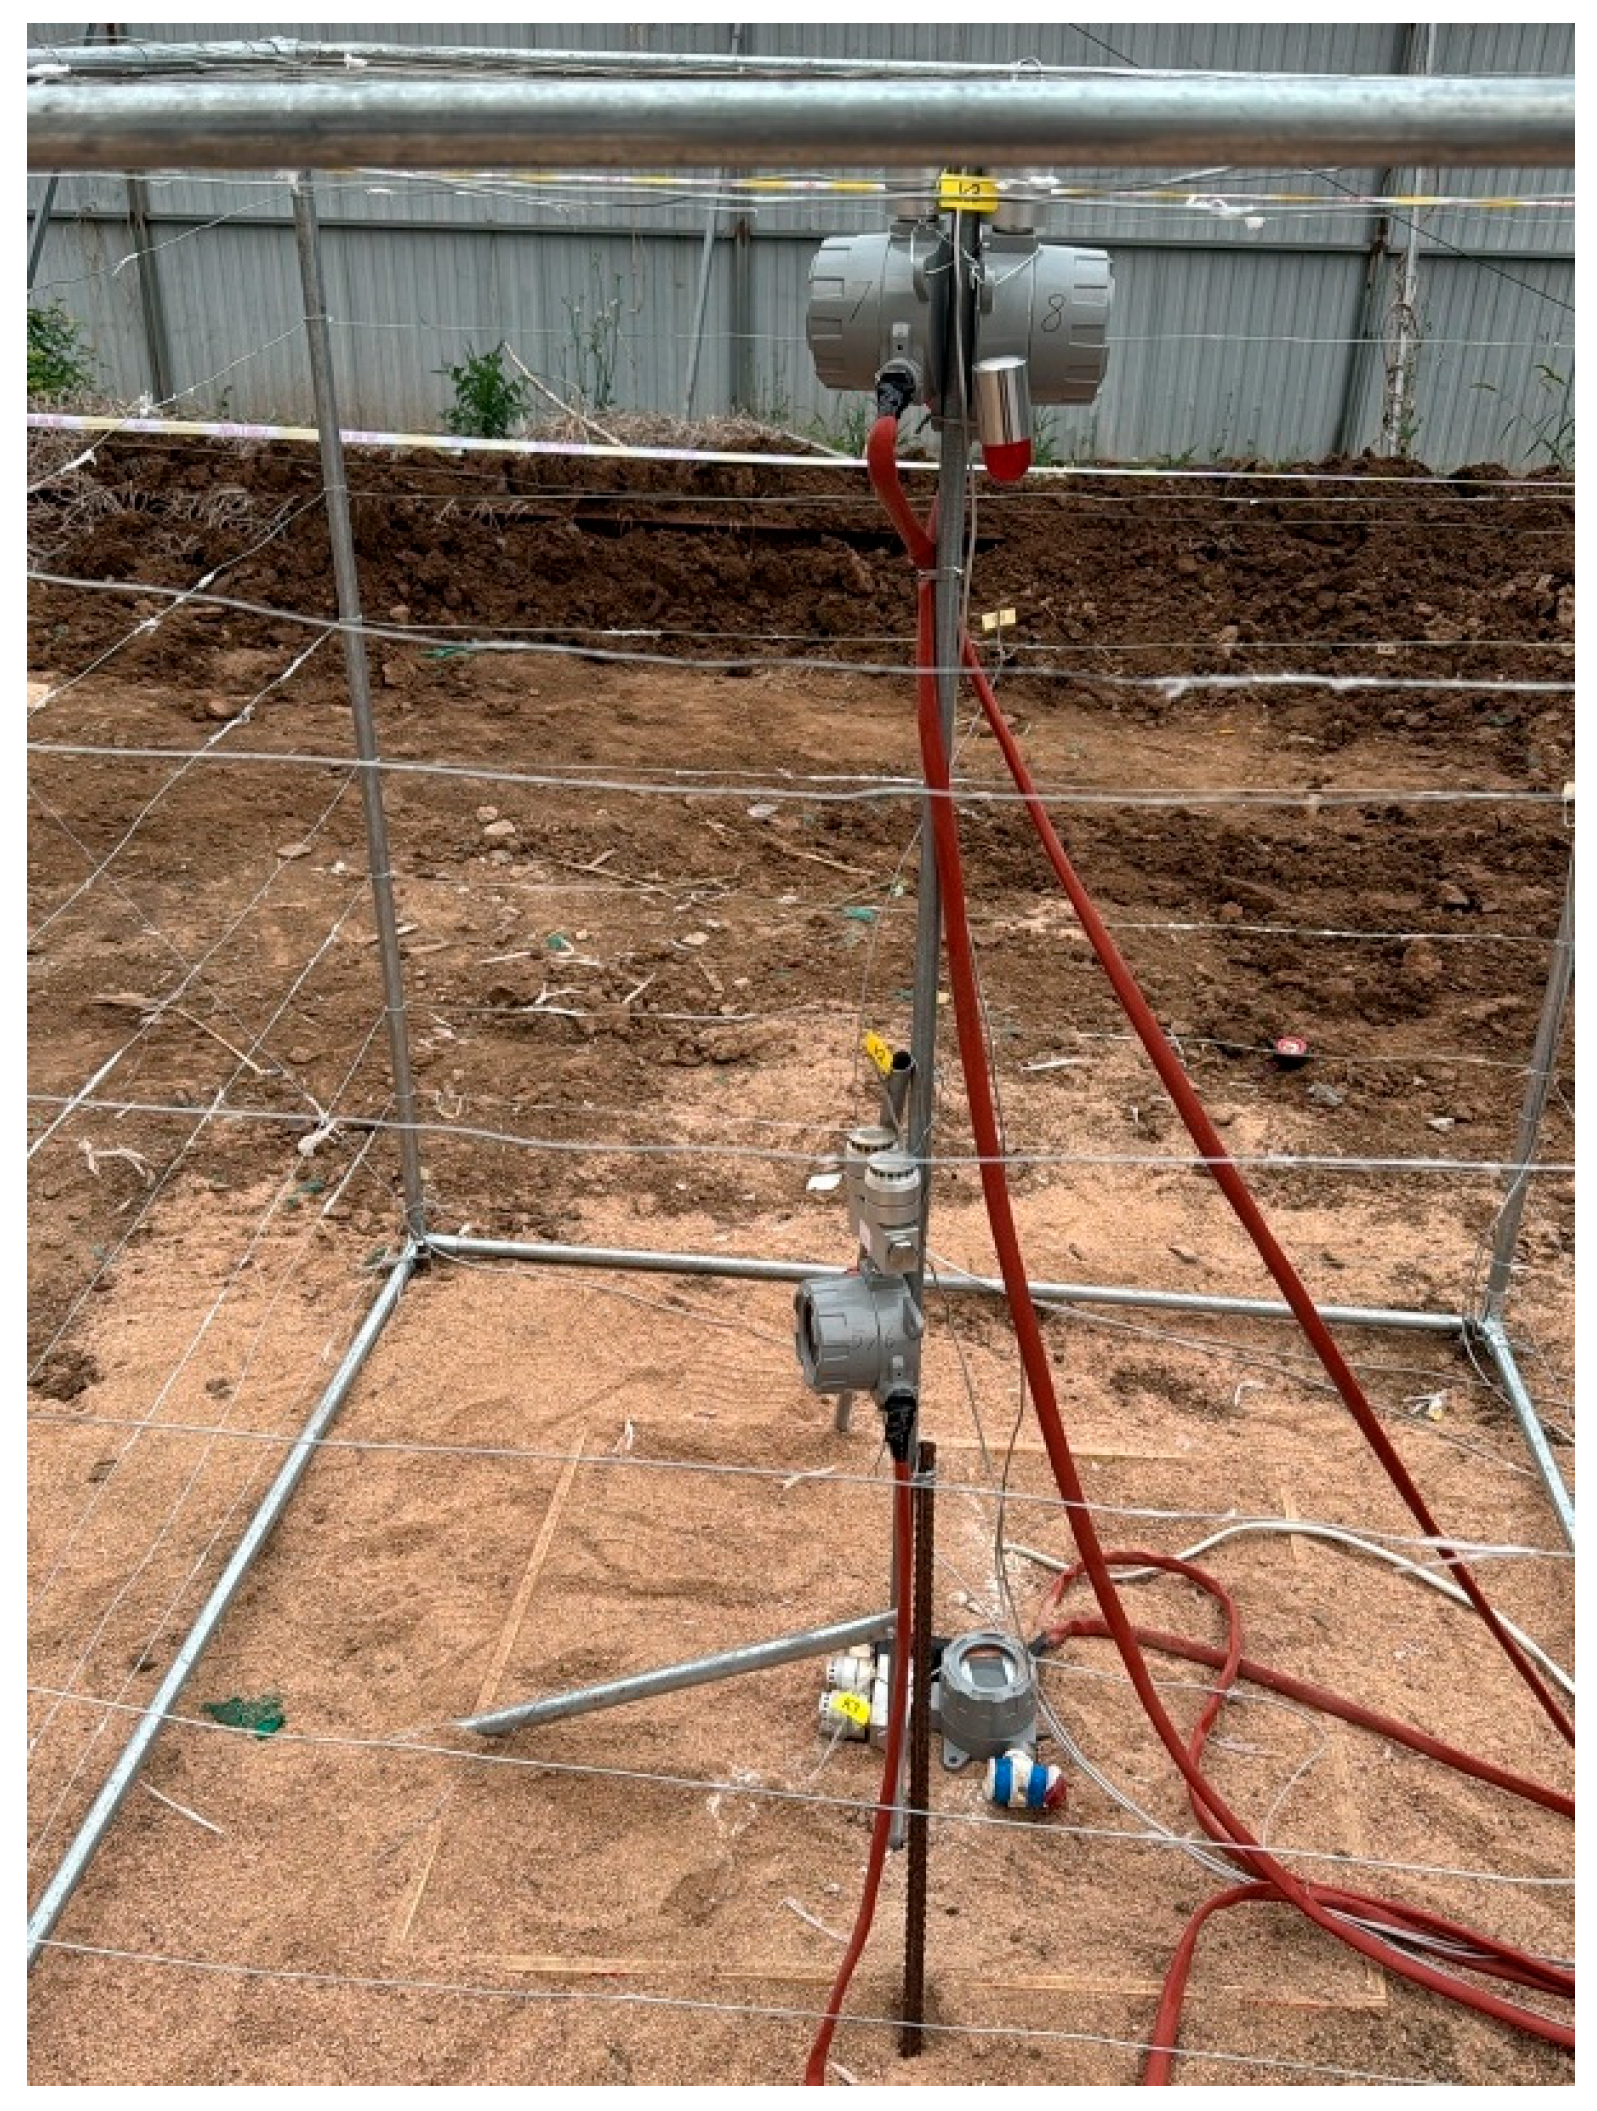
The detailed arrangement of the thermocouples is shown in Figure 2 and listed in Table 2. The main analysis in this study was based on K1, K2, and K3 along the central axis to characterize the vertical thermal response. K2 was located at the geometric center and used as the representative point for evaluating the local point-measured thermal response near the center of the enclosure. The other thermocouples were used to evaluate the spatial temperature distribution. The measured temperature represents the local gas-phase thermal response at the junction of the thermocouple. Owing to heat losses, finite thermocouple response, and possible displacement between the flame front and thermocouple junction, the measured peak temperature should be interpreted as a local thermal exposure indicator. This should not be interpreted as the flame temperature or adiabatic combustion temperature of the HBNG–air mixture. The thermocouple positions were not randomly selected but were arranged to cover representative vertical and spatial regions of the enclosure within the constraints of the experimental setup.
Figure 2.
Arrangement of the thermocouples along the central axis.
Table 2.
Coordinates of the K-type thermocouples.
The ignition system used an electric-spark igniter with three adjustable power settings. For each test, the discharge power and ignition duration were recorded, and the nominal electrical ignition energy was calculated as E = P × t. The calculated ignition energy ranged from 160 to 1600 mJ. This value represents the electrical input energy of the ignition system rather than the energy that is effectively deposited into the combustible mixture. Although the ignition energy was recorded for each test, it was not independently varied as a controlled factor in this study and was therefore used only to document the ignition condition. The igniter was placed at the floor, middle, and ceiling positions, corresponding to approximate heights of 0, 750, and 1500 mm.
The methane and hydrogen concentrations at the bottom, middle, and top of the central axis were measured using gas sensors. The concentration histories refer to the time-resolved CH4 and H2 concentration records obtained at the bottom, middle, and top measurement points during the leakage and ignition-delay periods. The methane sensor had a measurement range of 0–100 vol%, whereas the hydrogen sensor had a measurement range of 0–4 vol% and a resolution of 0.01 vol%. Before the experiments, the sensor calibration, response time, sampling-line delay, and potential cross-sensitivity of the H2 sensor to CH4 were evaluated. Because the upper range of the H2 sensor was close to the lower flammability limit of pure hydrogen in air, H2 readings approaching 4 vol% were checked for possible saturation, and only unsaturated data were used for the local flammability analysis. When the H2 sensor reached its upper limit, the reading was treated as ≥4 vol% rather than an exact concentration; such data were used only to indicate possible hydrogen enrichment and were excluded from the quantitative concentration analysis. For local flammability parameters calculated at points where H2 readings approached or reached this limit, HBRloc and φloc were interpreted as approximate lower-bound indicators rather than exact values. During the leakage stage, the gas supply was monitored and regulated to achieve the prescribed HBNG release volume for each experimental case. Because only three concentration sampling heights were used along the central axis, the measured concentrations should be interpreted as local time-resolved records rather than full-field concentration distributions.
The soil layer was filled with dry, medium-grained washed sand. Sand was used to provide a relatively homogeneous porous medium for upward gas seepage. The particle size distribution, porosity, permeability, and packing density were not independently measured or varied in this study. These soil properties can affect the flow resistance and gas propagation pathways; therefore, the same sand medium and similar filling procedures were used in all tests to maintain comparable soil-medium and seepage-boundary conditions. Because the experiments were conducted as outdoor field-scale soil-seepage tests, small variations in soil packing density, ambient conditions, and local seepage pathways were inevitable. These variations may contribute to case-to-case differences in the measured concentration histories and are considered as part of the experimental uncertainty. The ambient temperature and relative humidity were recorded during the experiments. Because a large number of tests were conducted intensively within a short period, the variations in the ambient temperature and humidity were small. The wind speed was not measured because of leakage, gas accumulation, and ignition inside the quasi-closed enclosure, where the direct influence of external wind was limited. Therefore, the exact repetition of each operating condition was difficult, and the analysis focused on the overall trends across 44 valid experimental cases rather than on averaged repeated measurements under identical conditions.
2.2. Experimental Procedure and Test Conditions
The test gases were HBNG mixtures with HBRs of 10, 20, and 30 vol%. The gas was injected into the bottom of the soil layer through a mass flow controller according to the preset leakage condition, and then seeped upward and accumulated inside the quasi-closed enclosure. The leakage rate was not constant for all tests but was set according to the experimental conditions. Based on the source-term fitting, the fitted mass flow coefficients for 10%, 20%, and 30% HBR were 15.71, 13.46, and 12.19 g·s−1·MPa−1, respectively. The ignition delay time, denoted as td, is defined as the time interval between the leakage cessation and ignition. During this stage, the flammable cloud formed through porous seepage evolved and restructured freely under the combined effects of residual momentum, buoyancy, and molecular diffusion.
Table 3 summarizes the distribution of the 44 valid experimental cases in terms of the ignition-delay range, global equivalence ratio, HBR, and ignition position. The ignition delay time, td, ranged from 27 s to 5429 s. Owing to fluctuations in the field soil seepage and gas accumulation processes, the global equivalence ratio φ varied among the test conditions, ranging from 0.36 to 2.06. Therefore, this study did not rely on a deterministic comparison of individual cases under nominally identical conditions. Instead, it examined trend-based evidence across the 44 valid cases to evaluate how the ignition-delay period was associated with flame behavior and local thermal response characteristics. For each experiment, the peak temperature Tmax and time to peak temperature tmax were extracted from K2, which was used as the representative central measurement point.
Table 3.
Summary of experimental conditions grouped by ignition delay time.
2.3. Definition of Indicators
To distinguish the spatially averaged fuel–air condition from the local flammability state, both the global equivalence ratio and local flammability indicators were defined as follows: The global equivalence ratio φ was calculated from the total released HBNG volume, HBR, and the quasi-closed enclosure volume. It represents the overall average fuel-air condition in the quasi-closed enclosure and is used only as a global reference parameter.
Natural gas was approximated as methane in the equivalence ratio calculation. For a methane-hydrogen mixture expressed in volume percentages, the equivalence ratio can be written as
where CCH4 and CH2 are the volume percentages of methane and hydrogen. When globally averaged concentrations estimated from the released gas volume are used, Equation (1) gives φ. When the pre-ignition concentrations measured at a local point are used, Equation (1) lists the local equivalence ratio φloc.
For a non-uniform flammable cloud in a quasi-closed enclosure, local combustion indicators were further defined based on the pre-ignition methane and hydrogen concentrations measured at each point. The local total fuel concentration Cfuel is defined as
Local HBR was defined as
According to the Le Chatelier mixing rule, the lower flammability indicator IL and upper flammability indicator IU are introduced as local flammability criteria:
The Le Chatelier mixing rule was used here as an approximate local flammability screening criterion, rather than as a strict prediction of flame propagation in transient non-uniform clouds. When IL ≥ 1 and IU ≤ 1, the mixture at the local measurement point was considered to be within the flammable range.
2.4. Data Processing and Statistical Analysis
For each valid experiment, the peak temperature Tmax and time to peak temperature tmax were extracted from the transient temperature curve at K2. Regression analysis was used to describe the relationships between the global equivalence ratio, ignition delay time, and Tmax, and the coefficient of determination R2 was used to quantify the goodness of fit. For the ignition-delay analysis, the sample size, fitted slope, and R2 value were reported for different lower thresholds of td to examine the consistency of the observed trend. Box plots were used to describe the distribution of tmax under different ignition-delay ranges, including the median values, data spread, and outliers. Because the experimental conditions were not fully orthogonalized and exact repeated tests under identical field-scale soil-seepage conditions were difficult, the statistical results were interpreted as trend-based evidence rather than deterministic predictions for individual cases.
3. Results
3.1. Flame Morphology
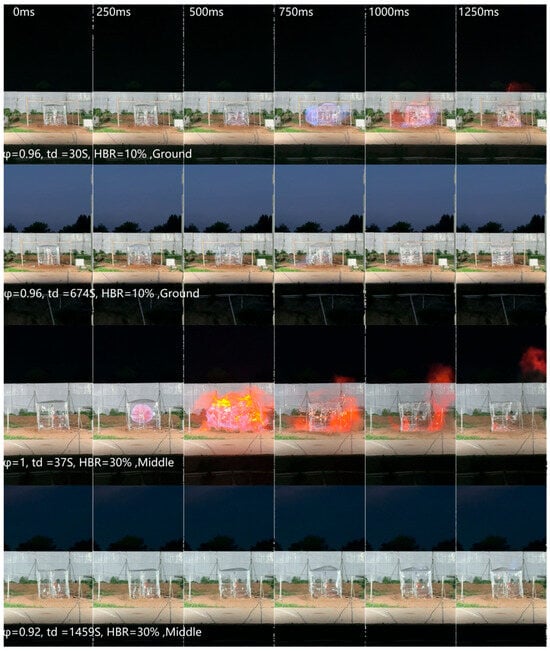
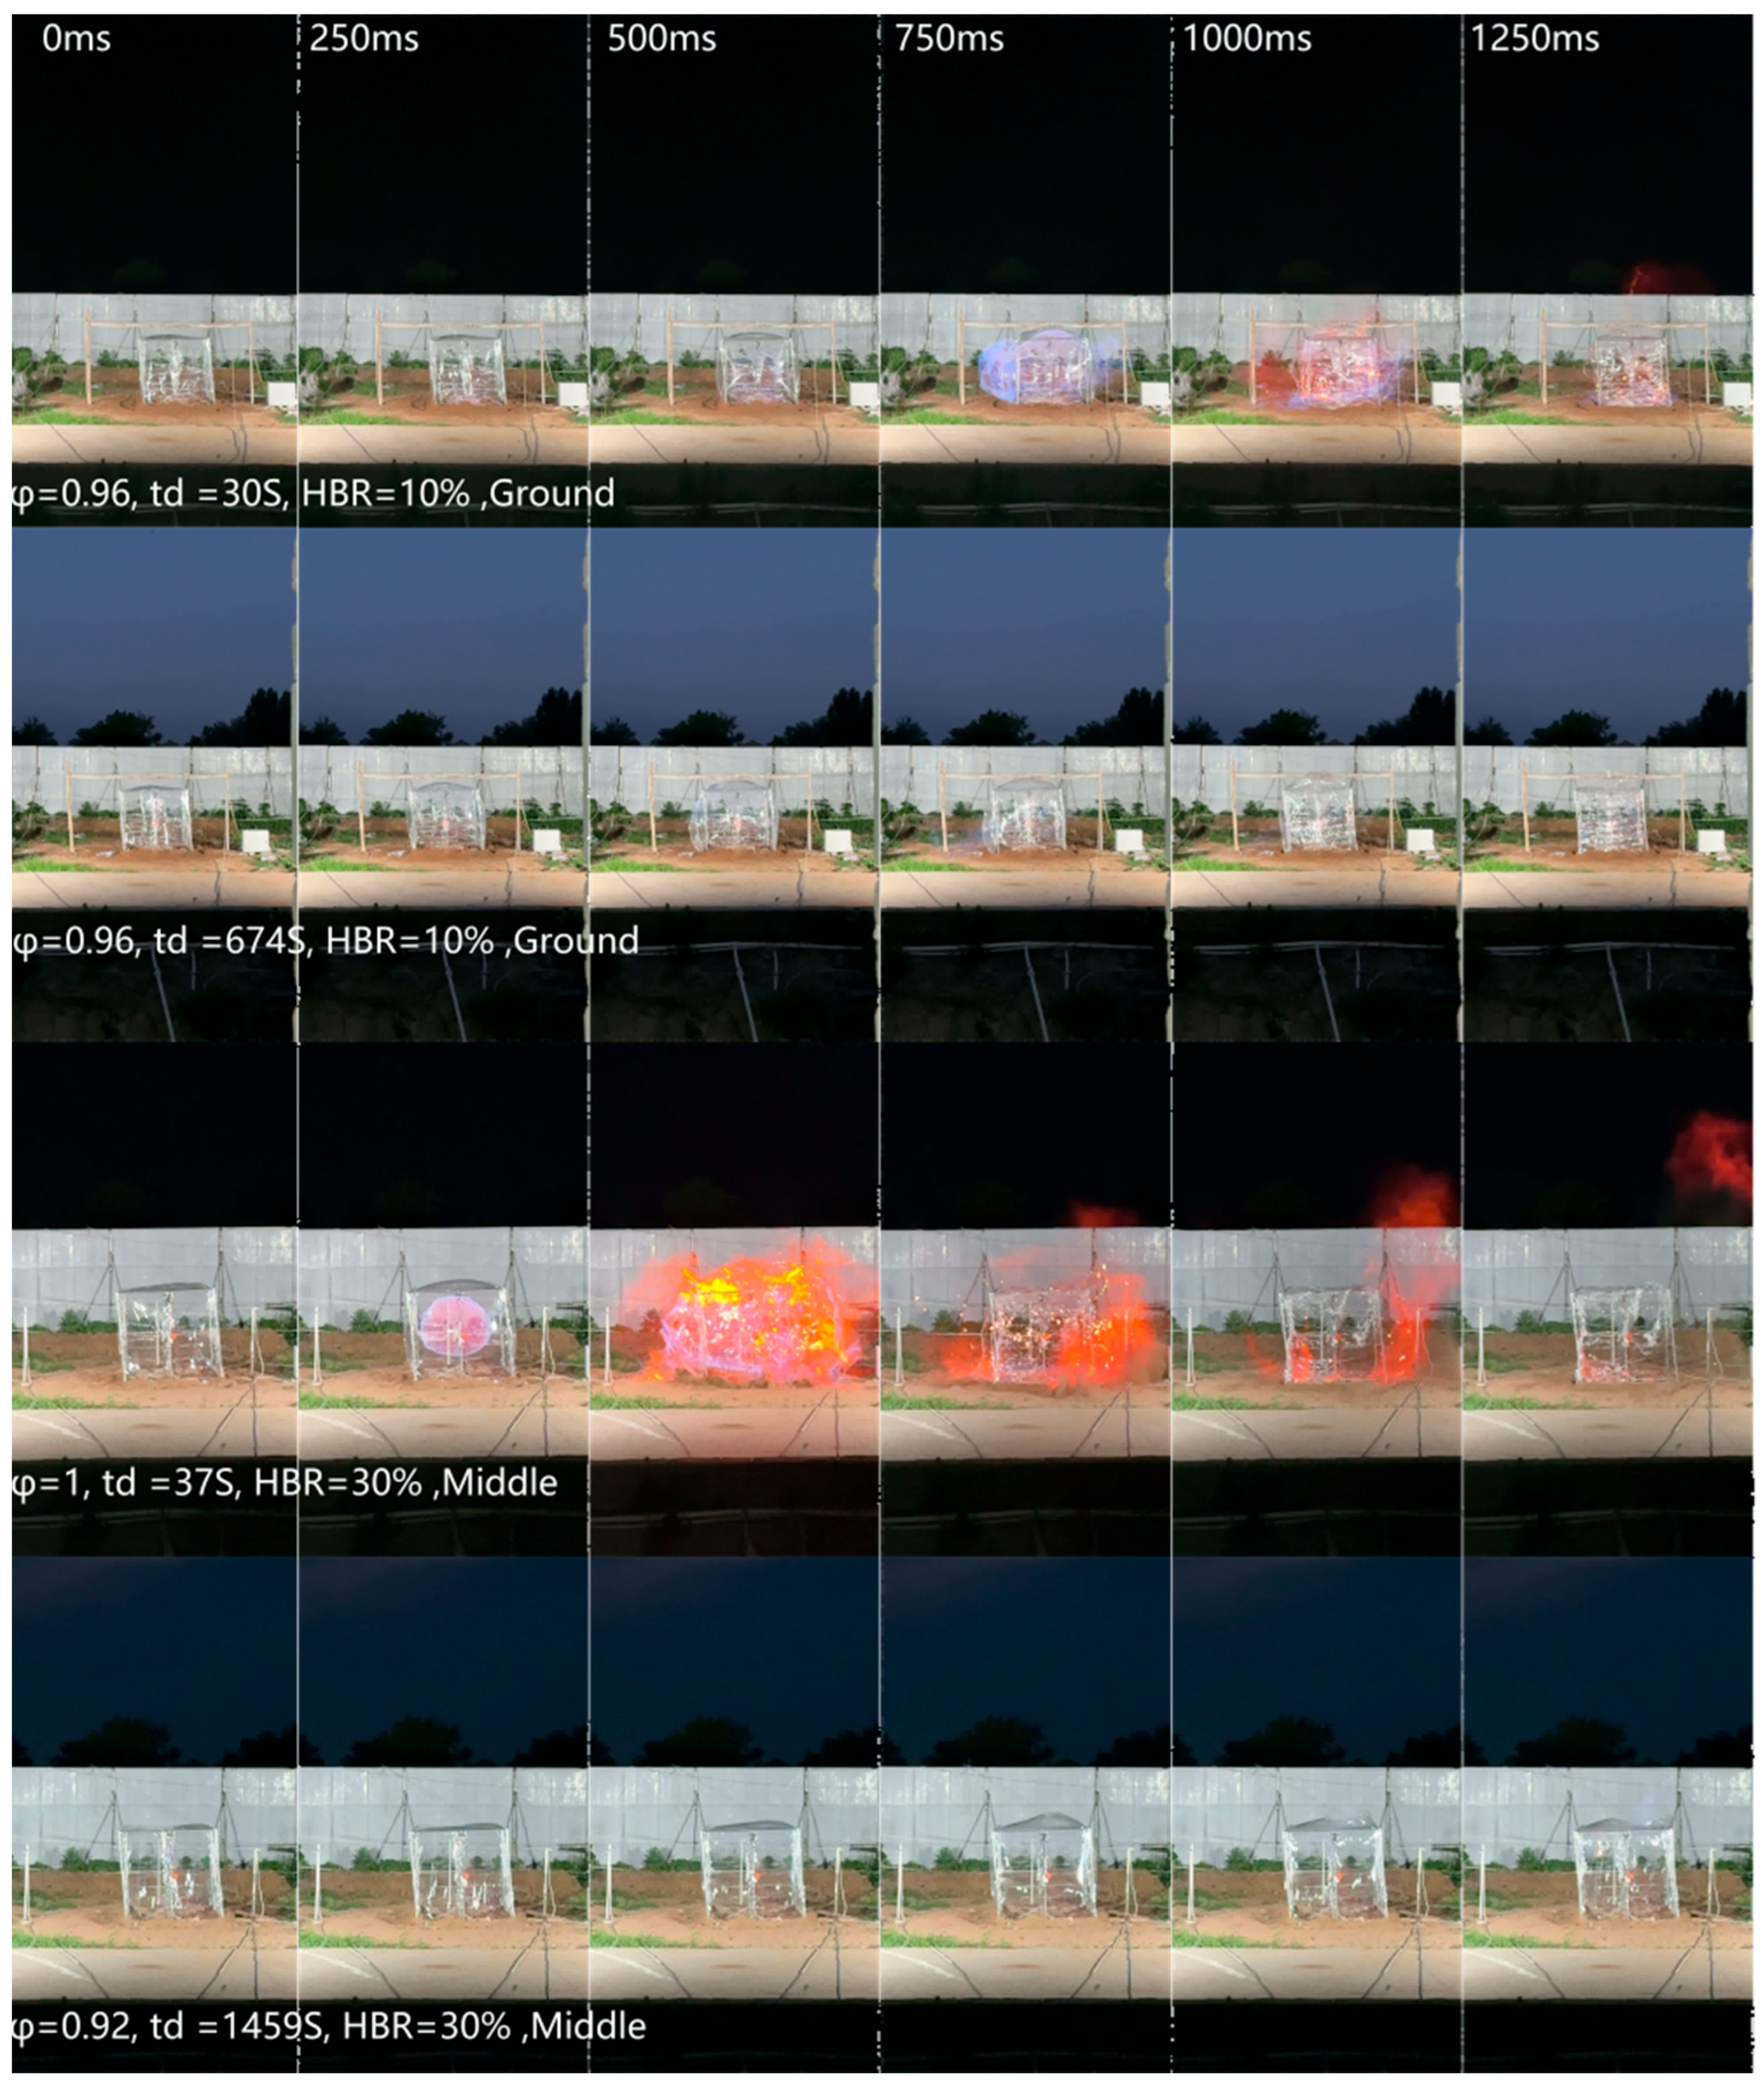
Figure 3 shows the flame evolution from 0 ms to 1250 ms after ignition for the four representative cases listed in Table 4. The flame morphologies differed markedly among the cases. These cases were selected to illustrate the typical differences in visible flame development and were not used alone to establish statistical trends.
Figure 3.
Flame evolution for representative cases from 0 to 1250 ms.
Table 4.
Representative cases for flame morphology comparison.
In Case a, the flame formed rapidly and intensified after ignition. By 750 ms, it penetrated the membrane and expanded outward. Subsequently, a highly luminous orange-yellow flame appeared, indicating a relatively large visible flame region and strong flame luminosity under short-delay conditions. Case b had an HBR and global equivalence ratio similar to those of Case a, whereas the ignition delay time td increased to 674 s. No sustained flame propagation was observed during the observation period. Only a weak localized blue flame appeared in the lower-left region at approximately 750 ms, indicating that the longer ignition delay markedly suppressed visible flame development.
Case c exhibited the strongest visible flame development among the four representative cases. A relatively large flame region was formed by 250 ms. After 500 ms, the flame penetrated the membrane and developed into a large-area, highly luminous, bright-yellow flame. The extent of the visible flame was significantly larger than that in Case a. Case d had the same HBR and a similar global equivalence ratio as Case c, but its ignition delay time td increased to 1459 s. In this case, no strong outwardly expanding flame, comparable to that in Case c, was formed. Instead, several short-lived blue flames appeared in the upper-right region after the rupture of the upper membrane at a later stage.
Figure 3 presents representative frames selected at 250 ms intervals for display purposes; the original videos were recorded at 240 fps or higher. Figure 3 shows the flame evolution from 0 ms to 1250 ms after ignition for the four representative cases listed in Table 4. These qualitative observations show that the ignition delay affected the apparent visible flame development of the non-uniform HBNG cloud. Under short-delay conditions, brighter flames and wider visible propagations were observed. Under long-delay conditions, the visible flame weakened or was difficult to observe, suggesting a reduction in the optically observable flame region. However, the visible flame morphology should not be interpreted as a direct measure of the total combustion intensity because it is affected by the local concentration distribution, flame position, hydrogen flame visibility, and optical observation conditions.
3.2. Concentration Field Evolution Under Long Ignition Delay Time
To interpret the weakened visible flame development in Case d under the long ignition-delay condition, this case was selected to analyze the pre-ignition concentration evolution of the HBNG–air cloud. Based on the local parameters defined in Section 2.3, the variations in the fuel concentration, fuel composition, and flammability state at different heights along the central axis were examined. This section focuses only on the vertical concentration field along the central axis rather than reconstructing the full three-dimensional cloud.
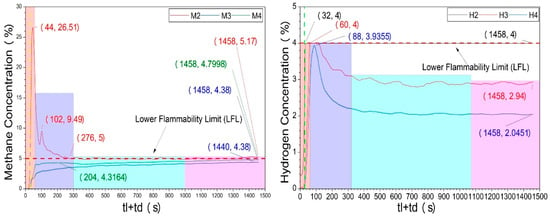
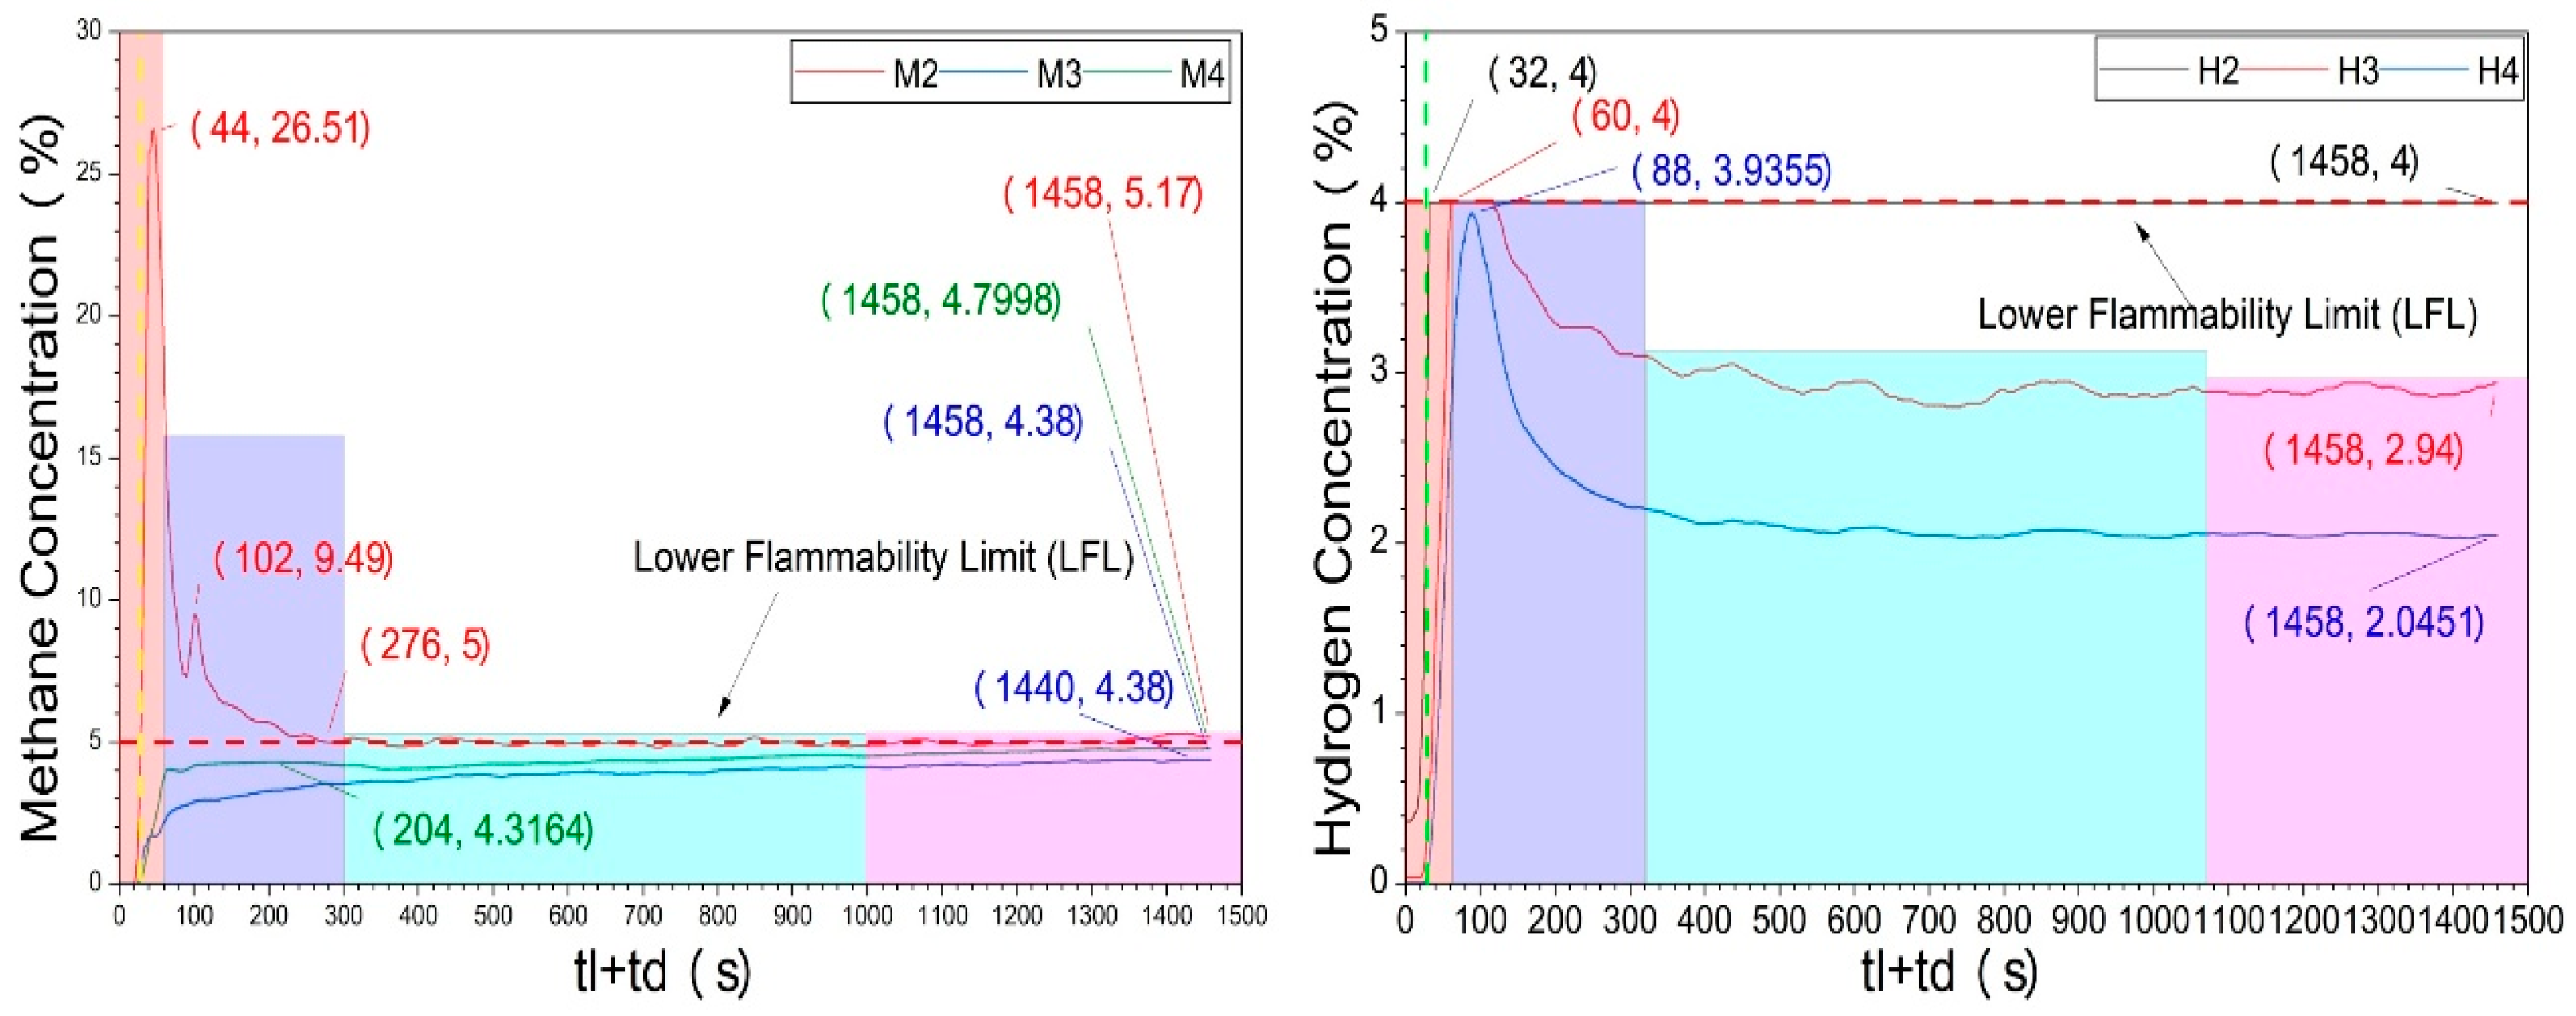
Figure 4 shows the variations in the methane and hydrogen concentrations during the leakage and subsequent ignition-delay periods in Case d. The leakage duration was 31 s and the ignition delay time, td, was 1459 s. During the leakage, methane first accumulated near the bottom, reaching 26.5% at the bottom measurement point at 44 s. After the leakage stopped, methane continued to migrate under buoyancy and diffusion. The top and middle measurement points reached their peak methane concentrations at approximately 204 s and 1440 s, respectively, indicating a transition from bottom enrichment to redistribution toward the middle and upper regions.
Figure 4.
CH4 and H2 concentrations during the leakage and ignition-delay periods in Case d.
The measured concentration histories show preferential hydrogen migration, with faster early-stage H2 transport relative to CH4. The bottom, middle, and top measurement points reached their peak hydrogen concentrations at approximately 32, 60, and 88 s, respectively, reflecting the higher diffusivity and buoyant tendency of hydrogen. At ignition, the methane concentrations at the bottom, middle, and top were 5.17%, 4.38%, and 4.80%, respectively, indicating that the methane concentration had become nearly uniform. In contrast, the hydrogen showed vertical stratification. At ignition, the hydrogen concentration at the bottom approached the upper measurement range of the hydrogen sensor, whereas the measured values at the middle and top decreased to 2.94% and 2.05%, respectively. Because the bottom H2 reading approached the upper sensor limit, the HBRloc and φloc values calculated at this point may be underestimated and should be interpreted as approximate lower-bound indicators rather than as exact quantitative values. This representative case indicates that under long ignition-delay conditions, the measured concentrations along the central axis did not simply undergo uniform dilution. Instead, at the three central-axis measurement heights, methane approached a relatively uniform level, whereas hydrogen still showed measurable vertical differences.
The different behaviors of CH4 and H2 resulted from transient multicomponent transport and local concentration redistribution under the combined effects of residual momentum, molecular diffusion, buoyancy, and the porous seepage pathway. Residual momentum mainly controlled the early transport after leakage but weakened with increasing delay time. H2 migrated faster than CH4 because of its higher diffusivity and stronger buoyancy; however, this faster migration did not necessarily produce complete homogenization before ignition, particularly near the soil seepage outlet. In contrast, CH4 redistributed more slowly, but the long delay time allowed its concentration along the central axis to become almost uniform.
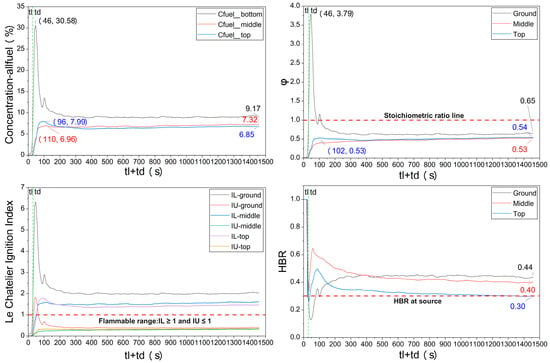
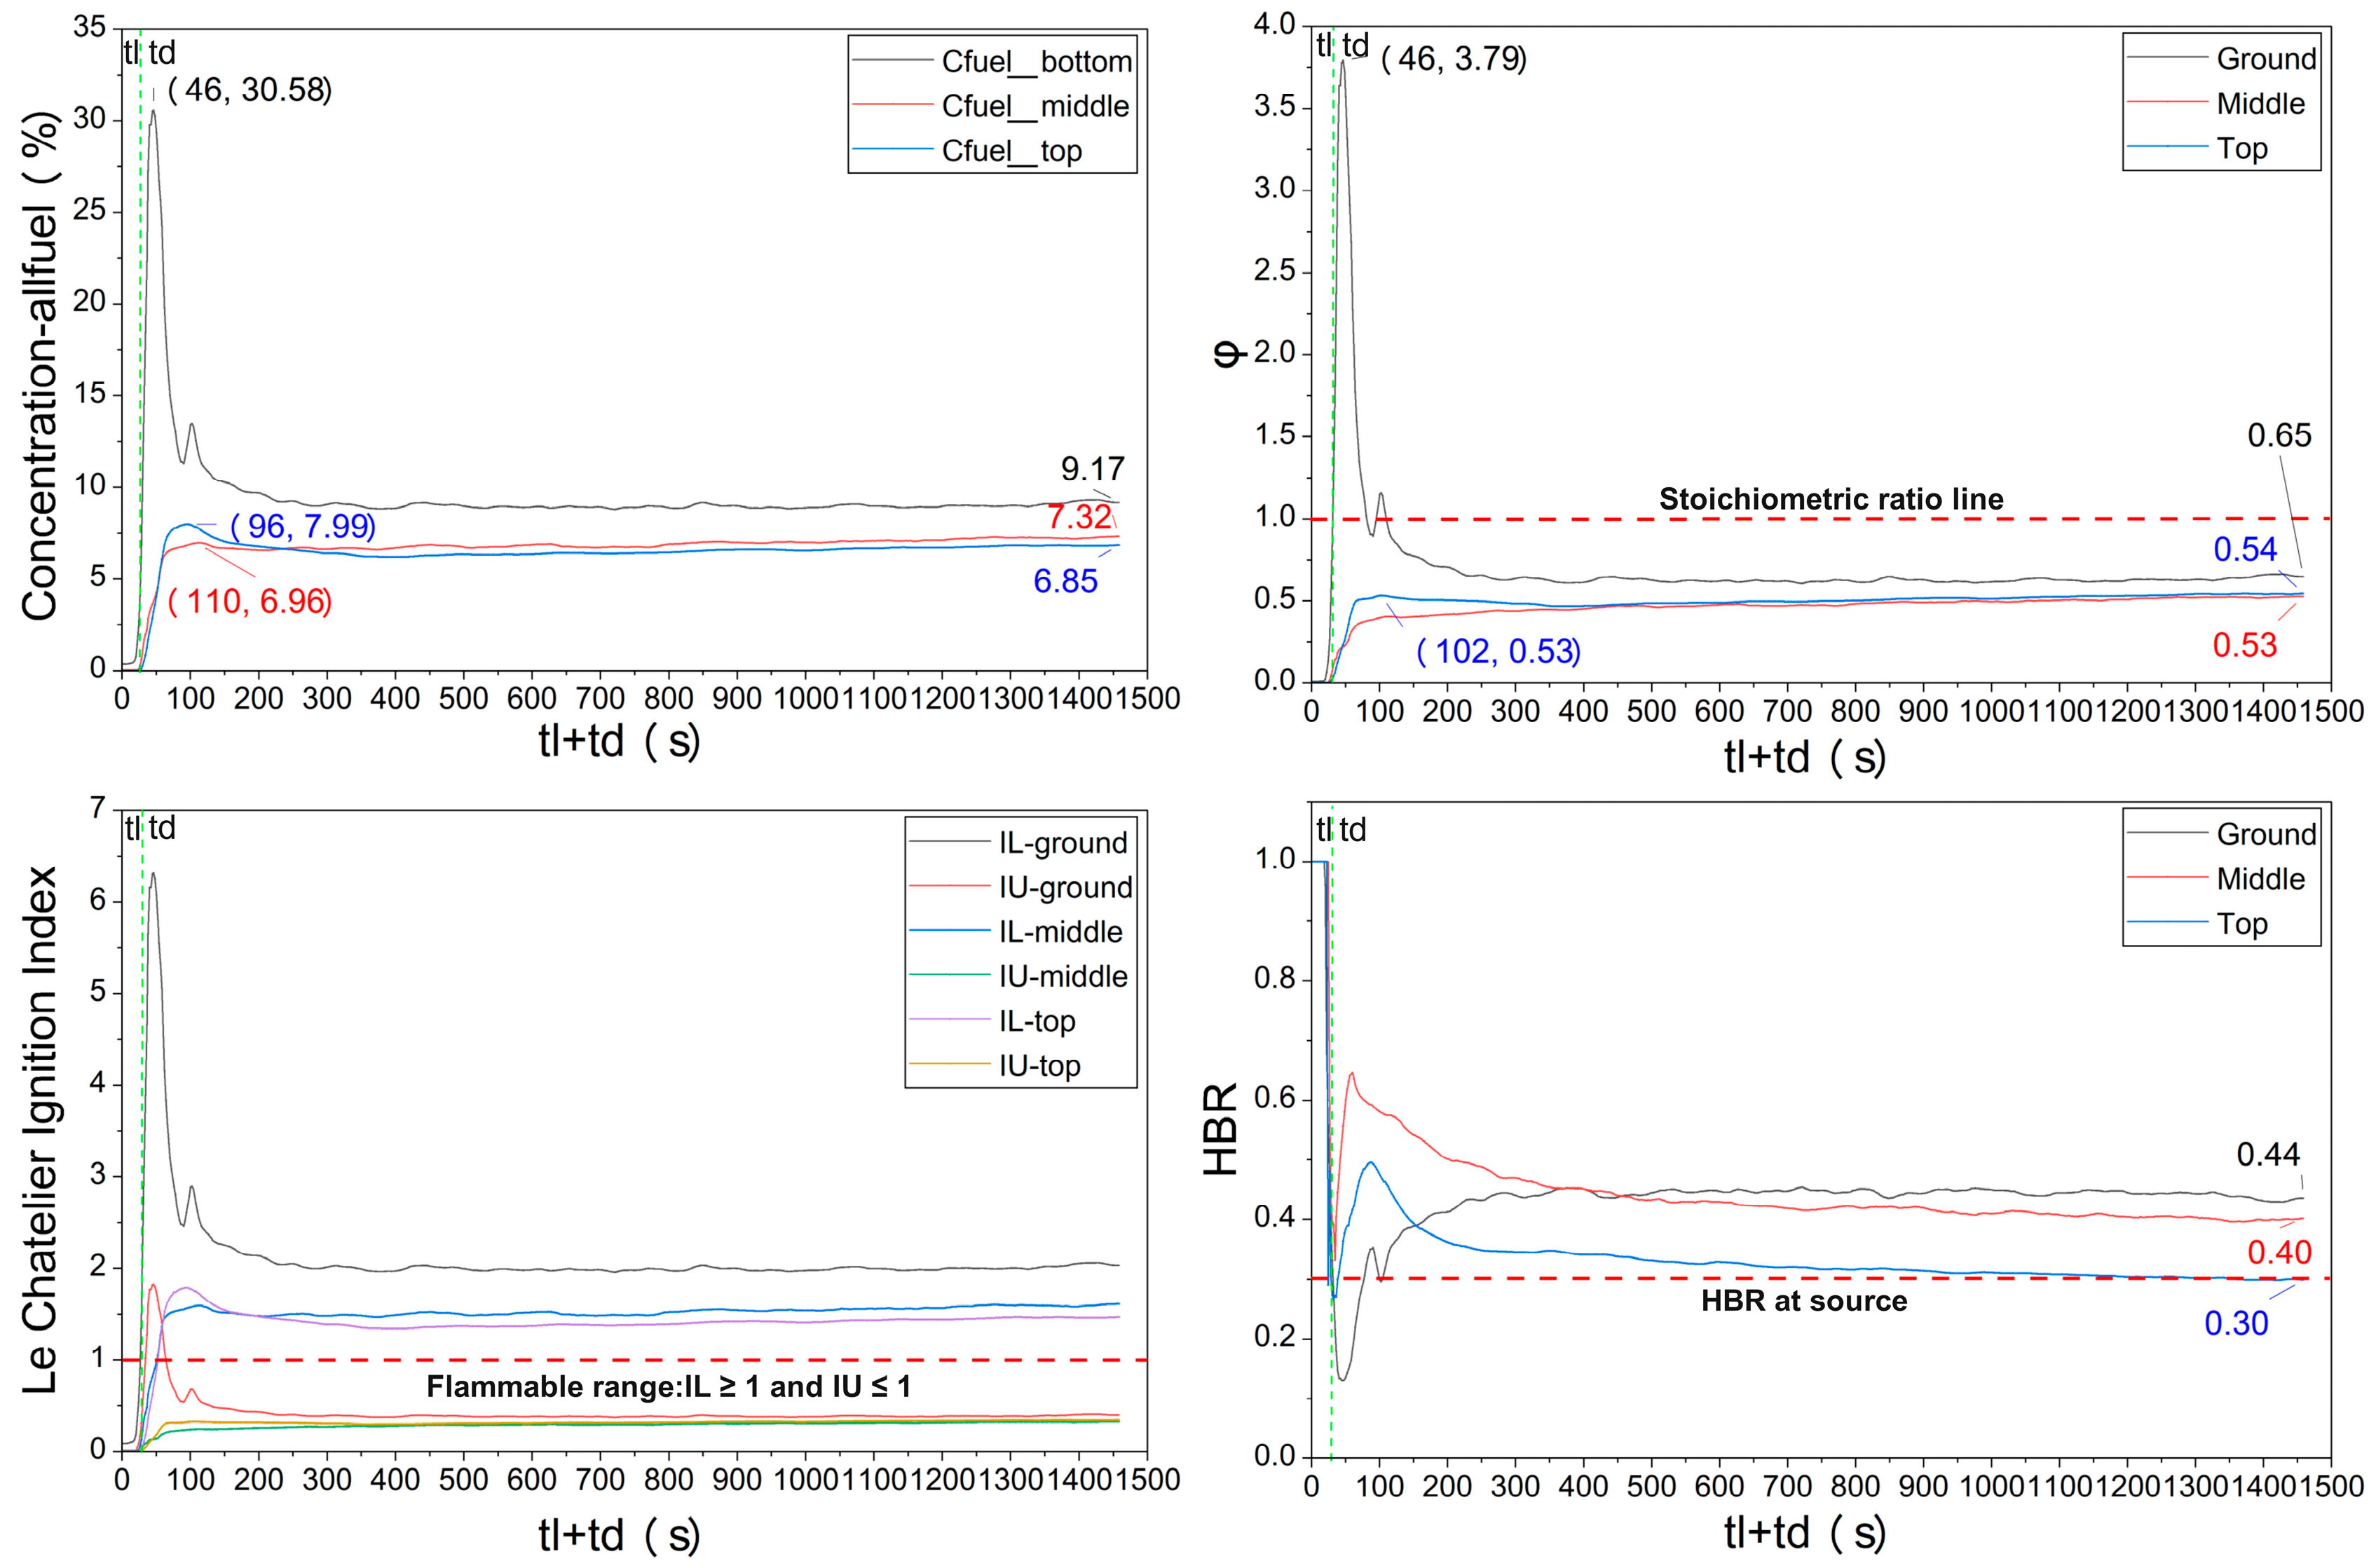
Figure 5 shows the temporal evolution of Cfuel, HBRloc, φloc, and the flammability indicators at different heights along the central axis.
Figure 5.
Temporal evolution of local flammability parameters along central axis.
The local total fuel concentration indicated that the leaked gas first formed a high-concentration region near the bottom. Cfuel at the bottom reached 30.58% at approximately 46 s, much higher than those at the middle and top measurement points, which reached 7.99% at 96 s and 6.96% at 110 s, respectively. This suggests that the cloud initially accumulated near the bottom and then migrated toward the middle and upper regions of the chamber. Therefore, Cfuel can characterize the local concentration of combustible fuel components. However, it is insufficient to determine the local combustion behavior by itself.
In the early leakage stage, HBRloc at all heights was higher than the HBR of the leakage source, indicating preferential hydrogen migration during soil seepage and entry into a confined space. With time, HBRloc gradually decreased and tended to stabilize as subsequent methane migration and internal mixing weakened the early hydrogen-enrichment effect. Before ignition, the HBRloc was different at the bottom, middle, and top measurement points, indicating persistent vertical non-uniformity in the fuel composition.
The flammability indicators further show that although the bottom region had the highest Cfuel in the early stage, it did not correspond to the most favorable combustion state. Near the bottom peak, φloc reached 3.79, indicating an obviously fuel-rich mixture. As the ignition delay time increased, the fuel concentration at the bottom gradually decreased, whereas the middle and upper regions gradually entered or approached the flammable range. Before ignition, Cfuel at the bottom, middle, and top was 9.17%, 7.32%, and 6.85%, respectively, with corresponding φloc values of 0.65, 0.53, and 0.54, respectively. Based on the local equivalence ratio and flammability indicators, the mixtures at all three heights were fuel-lean but remained within the flammable range. In terms of temporal evolution, Cfuel and φloc varied almost synchronously with each other. At the bottom, both reached their peaks at approximately 46 s, whereas the middle and top entered a relatively stable stage at similar times. This indicates that under these operating conditions, the local equivalence ratio mainly varied with the local fuel concentration, whereas HBRloc primarily reflected the relative composition of methane and hydrogen.
A long ignition-delay period allows continuous reconfiguration of the local fuel composition and flammability state. The global equivalence ratio or any single indicator cannot reliably predict the actual local combustion conditions in a non-uniform cloud; instead, the pre-ignition state should be evaluated based on the dynamic evolution of the local concentration, fuel composition, and equivalence ratio.
3.3. Effect of Global Equivalence Ratio on Peak Temperature
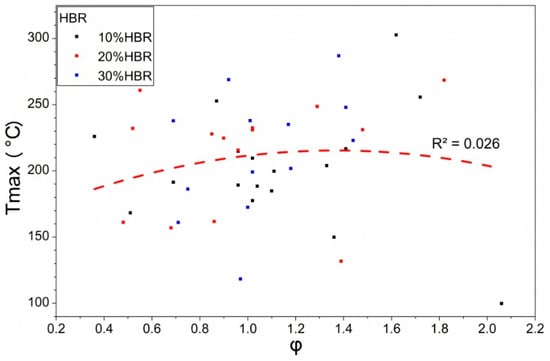
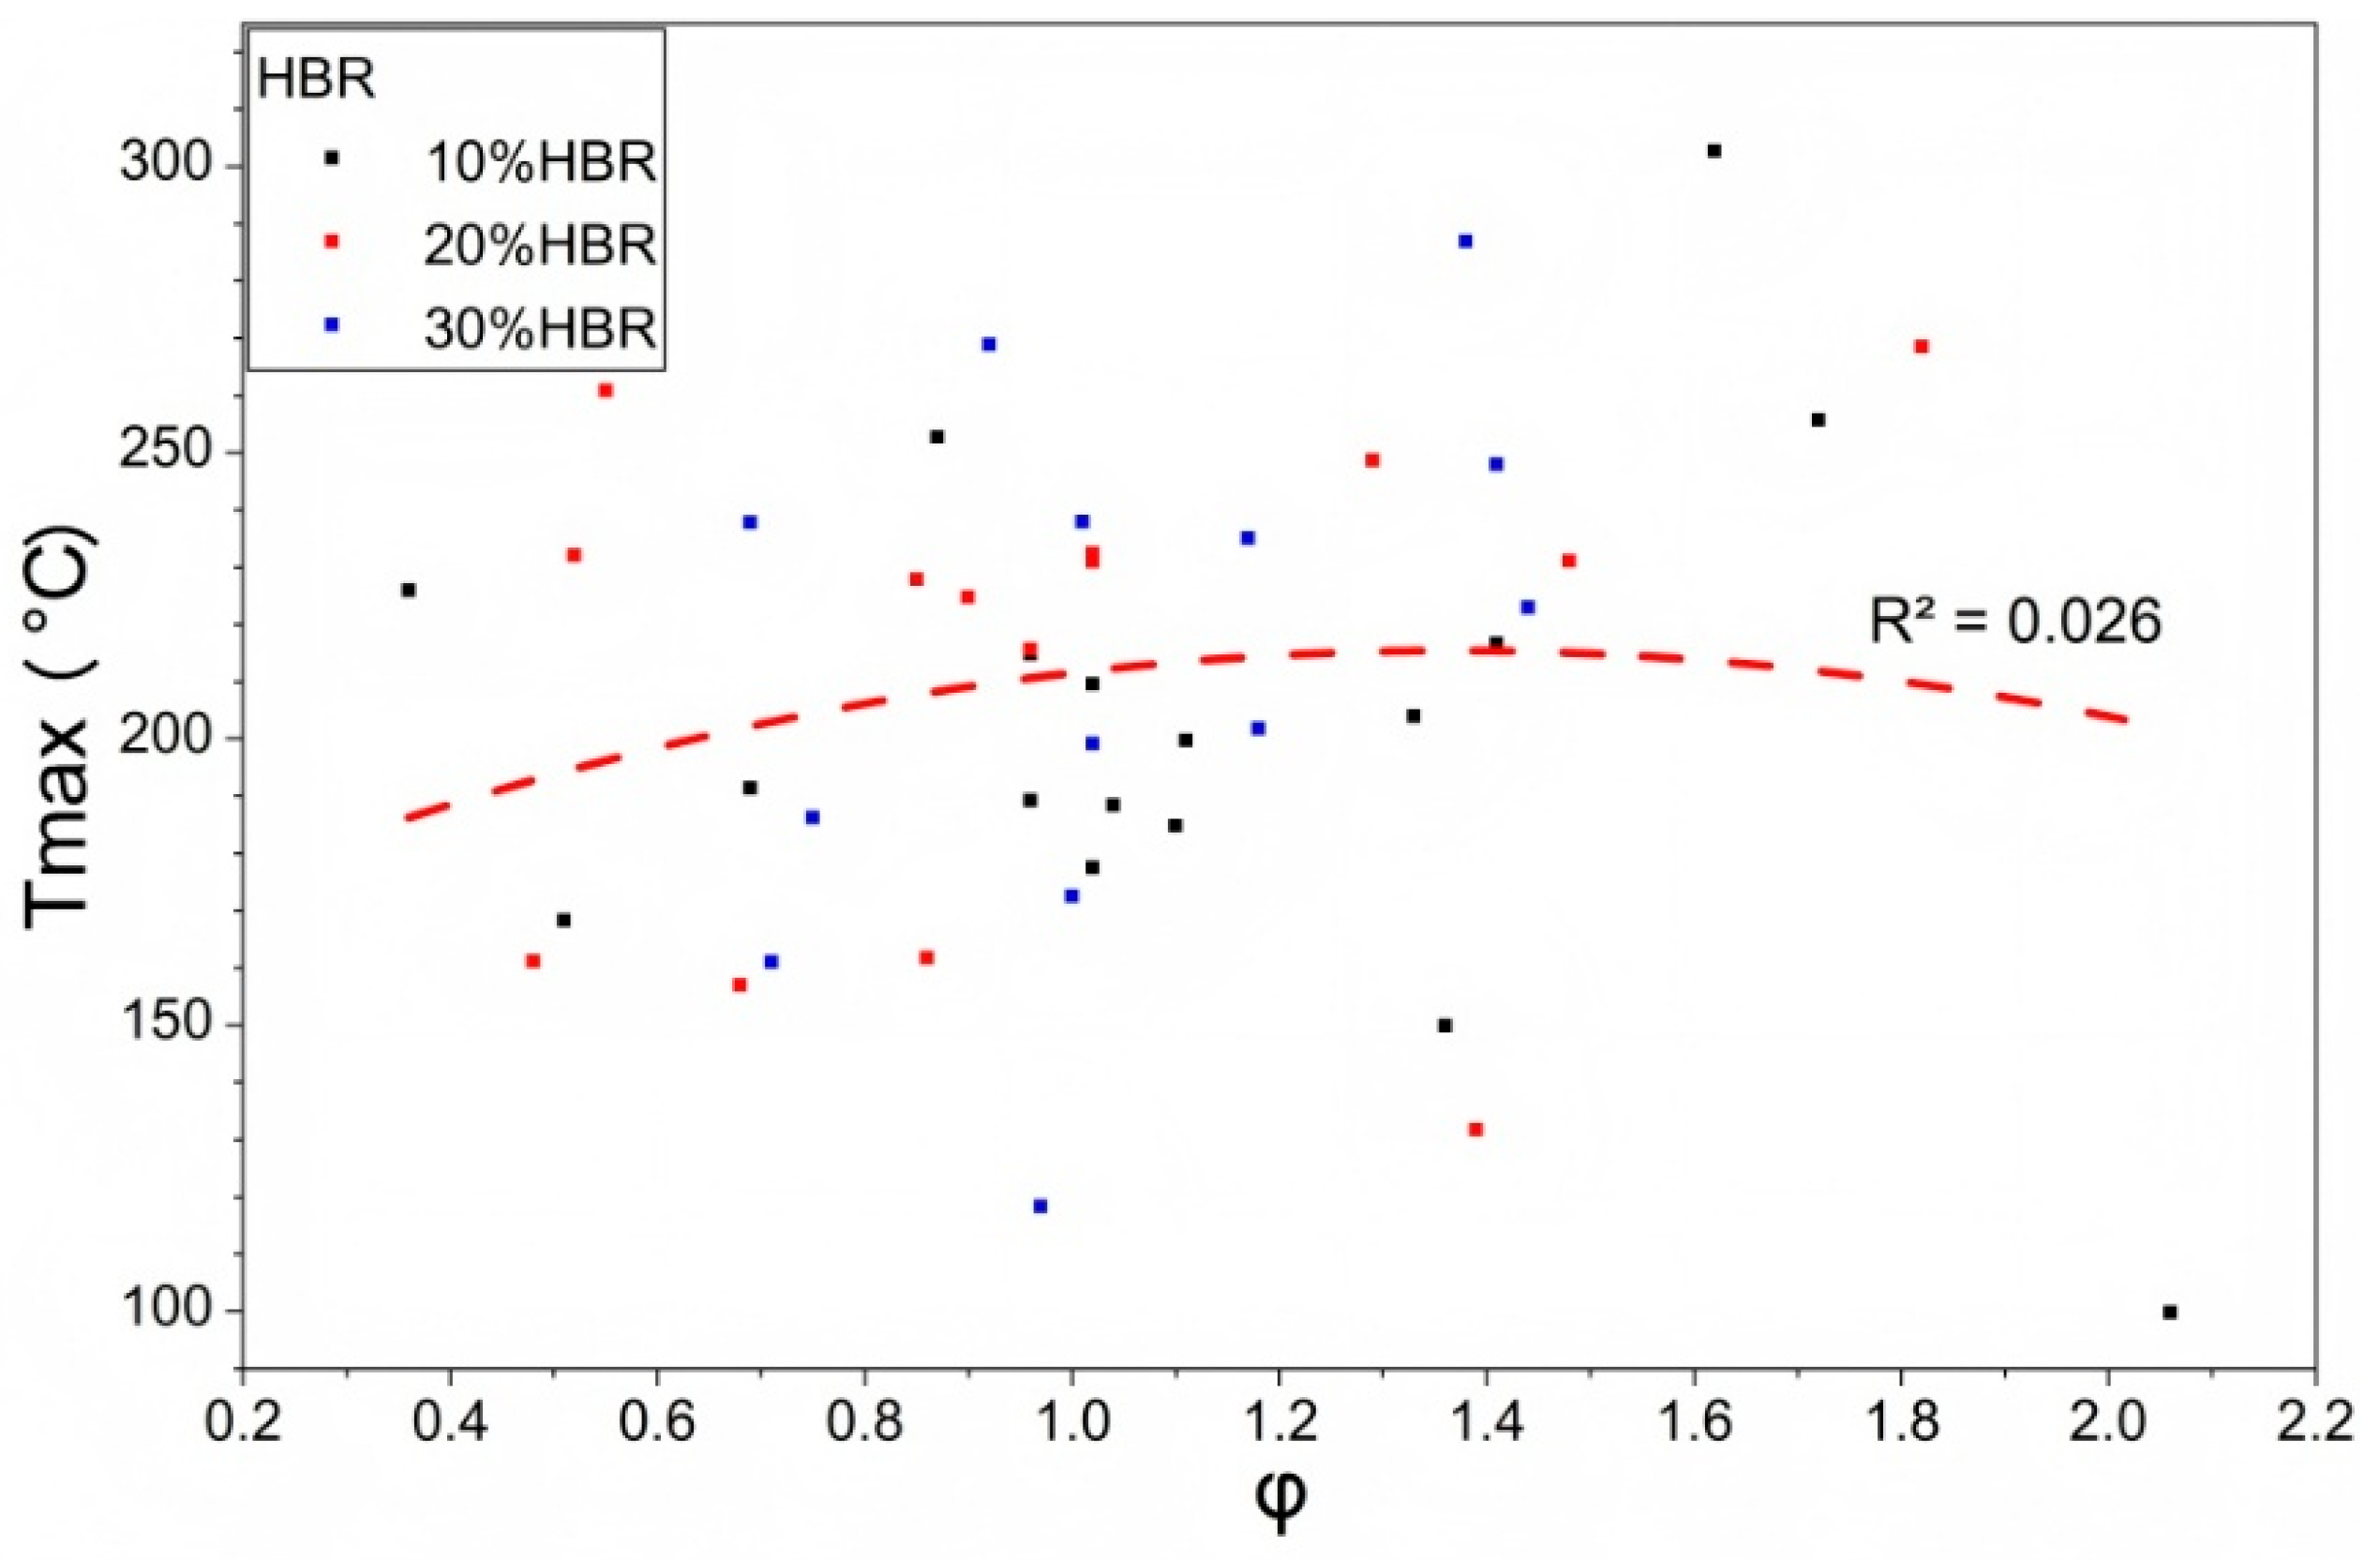
Figure 6 shows the variation in Tmax with the global equivalence ratio φ for the 44 experimental cases. The quadratic polynomial fit yielded a coefficient of determination R2 of only 0.026, indicating a very weak correlation between the two variables. Although the fitted curve showed a maximum near φ = 1.367, this trend has limited predictive significance owing to the strong scatter in the experimental data. Tmax ranged from 99.8 °C to 302.7 °C. These values represent point-measured thermal responses rather than the flame temperatures. Even within the near-stoichiometric to moderately fuel-rich range of φ = 1.1–1.367, Tmax varied from 131 °C to 268 °C, with a span of 137 °C. The case with the highest global equivalence ratio, φ = 2.06, was clearly fuel-rich, but its Tmax was only 99.8 °C, the lowest value among all experiments. These results indicate that there is no monotonic relationship between the global equivalence ratio and peak temperature at the central measurement point. Therefore, the global equivalence ratio alone is insufficient to predict the local point-measured thermal response of a non-uniform cloud.
Figure 6.
Peak temperatures under varying global equivalence ratios.
3.4. Effect of Ignition Delay Time on Peak Temperature
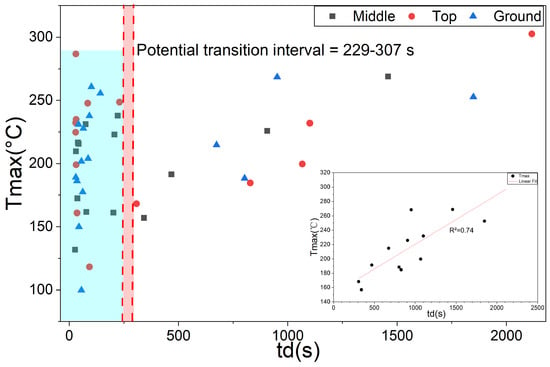
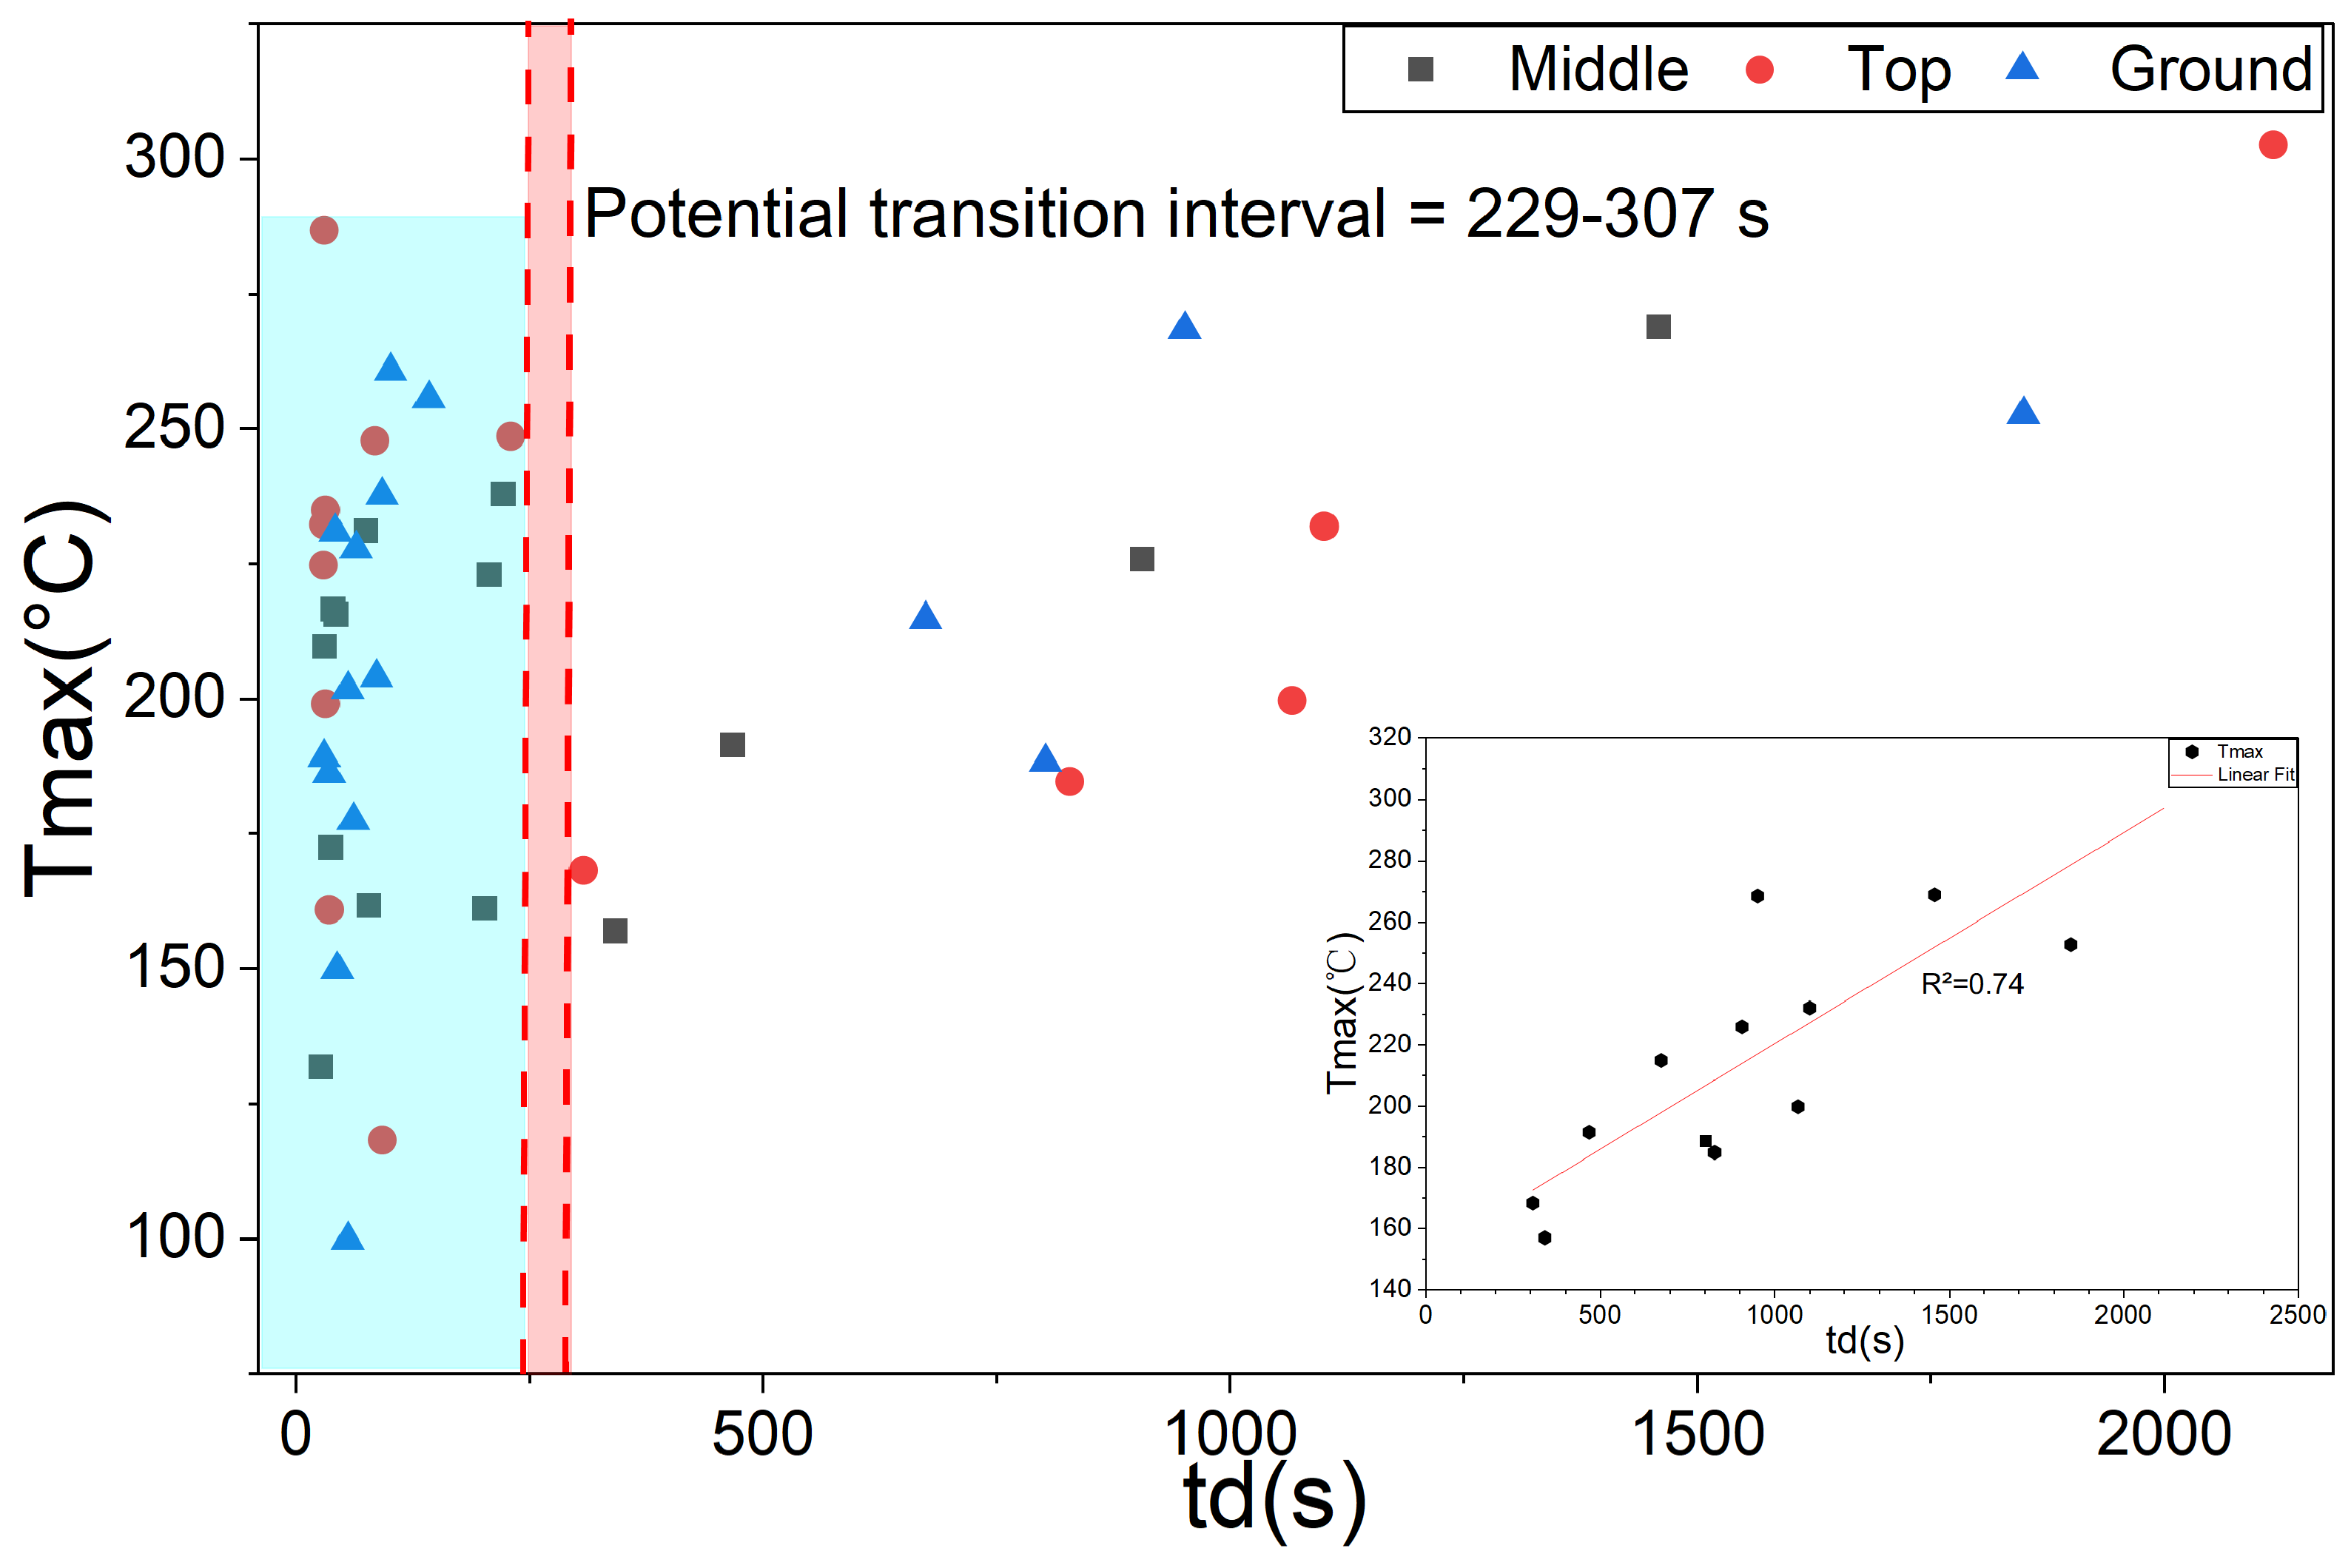
Figure 7 shows the relationship between td and Tmax, with different symbols representing ignition at the mid-height, top, and ground-level positions. The data show clear regime-dependent characteristics for the three regimes. In the short-delay region, mainly with td < 229 s, the data points are densely distributed but highly scattered, and Tmax fluctuates over a wide range. This indicates that under short ignition-delay conditions, Tmax is not governed by td alone but is jointly affected by the local concentration distribution, ignition position, and transient disturbances.
Figure 7.
Relationship between ignition delay time td and peak temperature Tmax.
For the subset with td > 307 s, Tmax showed an increasing trend with td in the present dataset. Because no experimental data were available in the interval of 229–307 s, this interval was treated as a data gap separating the short- and long-delay subsets, rather than as a sharply defined physical transition threshold. The inset in Figure 7 shows the linear fitting result for the long-delay region. The corresponding R2 value of 0.74 indicates an observed positive association between td and Tmax within this long-delay subset.
Table 5 shows that the goodness of fit improved markedly as the short-delay data were excluded. The strong scatter in the short-delay region weakened the overall association, whereas the increasing trend of Tmax with td became more apparent after excluding the short-delay data.
Table 5.
Linear fitting results for different ignition-delay thresholds.
The above trend in Tmax is consistent with the concentration-field reconfiguration mechanism described in Section 3.2. During the long-delay period, buoyancy-driven fuel migration and redistribution from the lower region toward the middle and upper regions altered the local combustion conditions near the central region. This compositional redistribution may explain why the visible flame development weakened, whereas the peak temperature at the central measurement point increased in the long-delay subset. Therefore, in the present soil-seepage experiments, long-delay ignition was associated with a higher point-measured thermal response in the middle region of the enclosure. This observation should be interpreted as a trend-based result under the tested non-orthogonal conditions, rather than as the isolated effect of ignition delay alone. It indicates that local thermal hazards may not necessarily decrease after a prolonged ignition delay.
3.5. Effect of Ignition Delay Time on Time to Peak Temperature
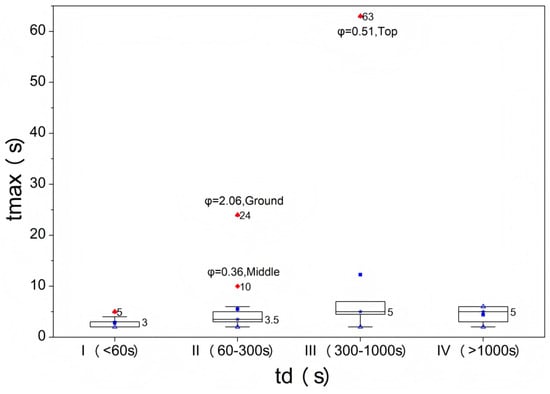
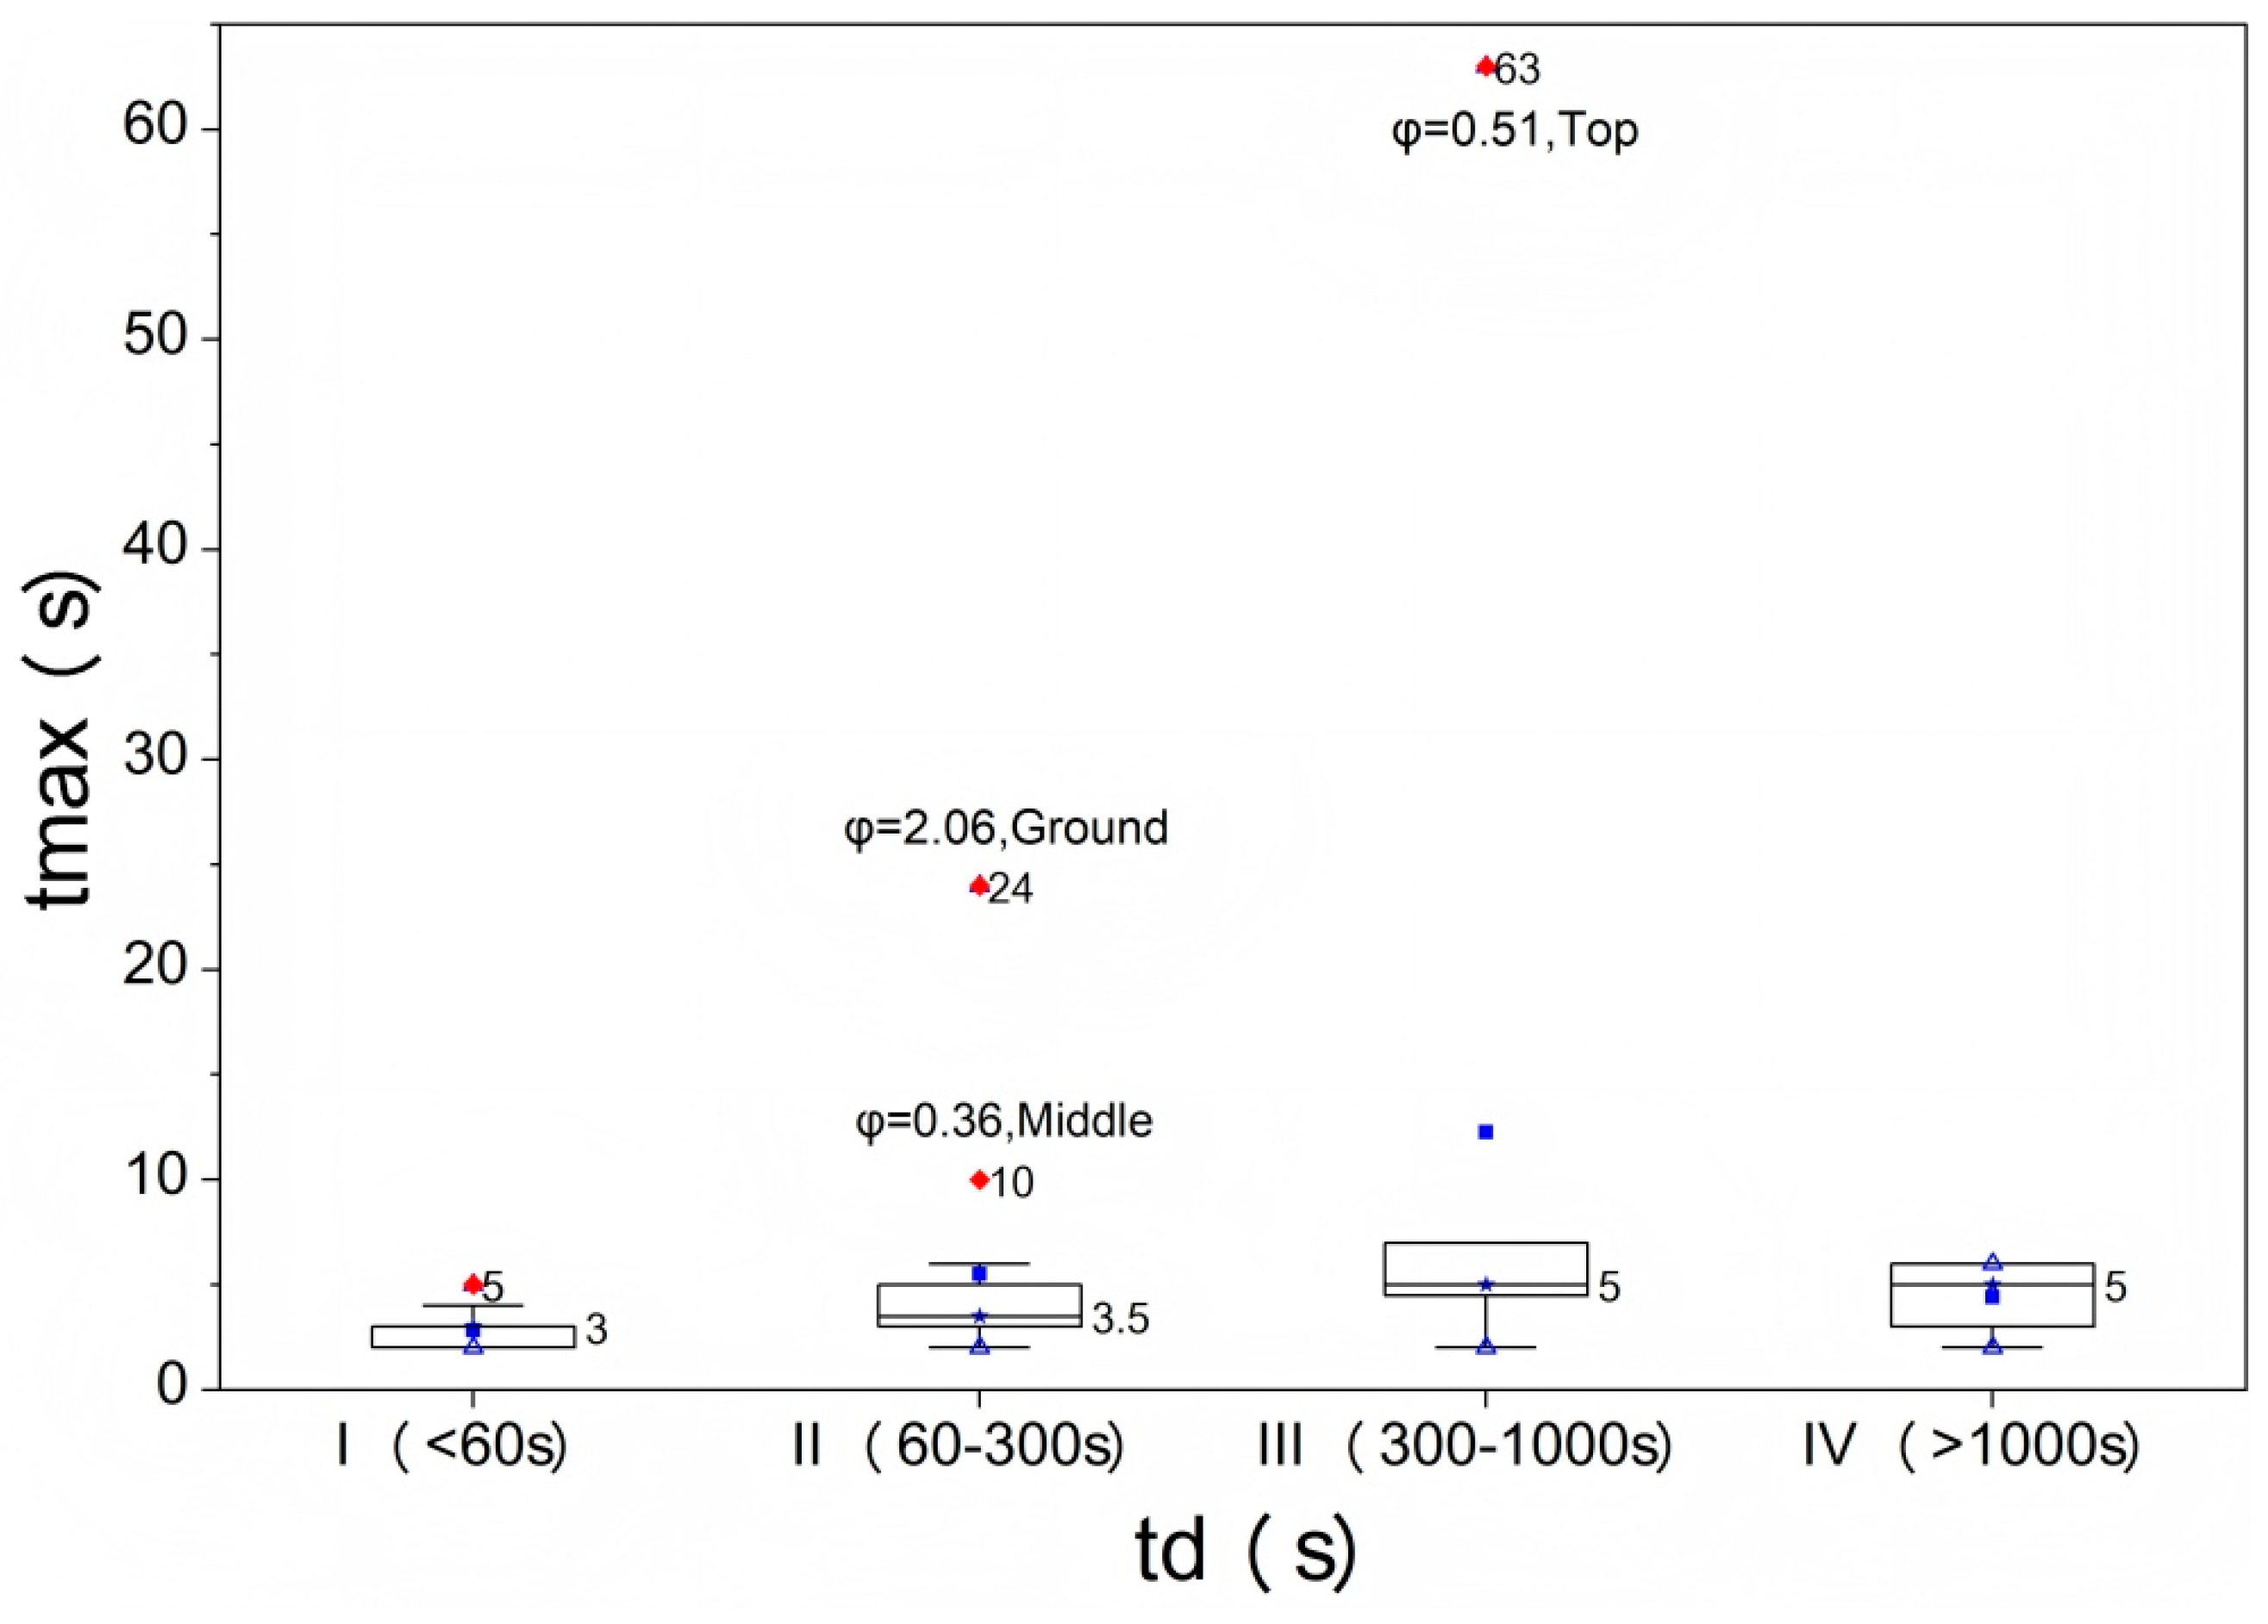
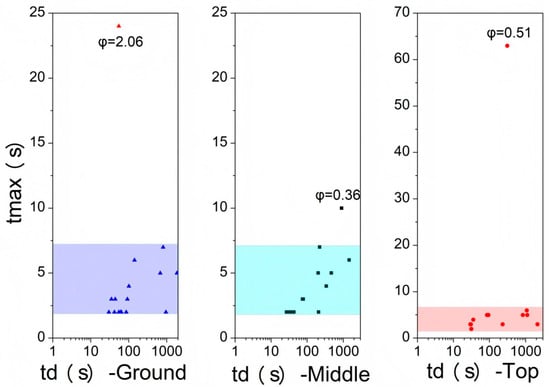
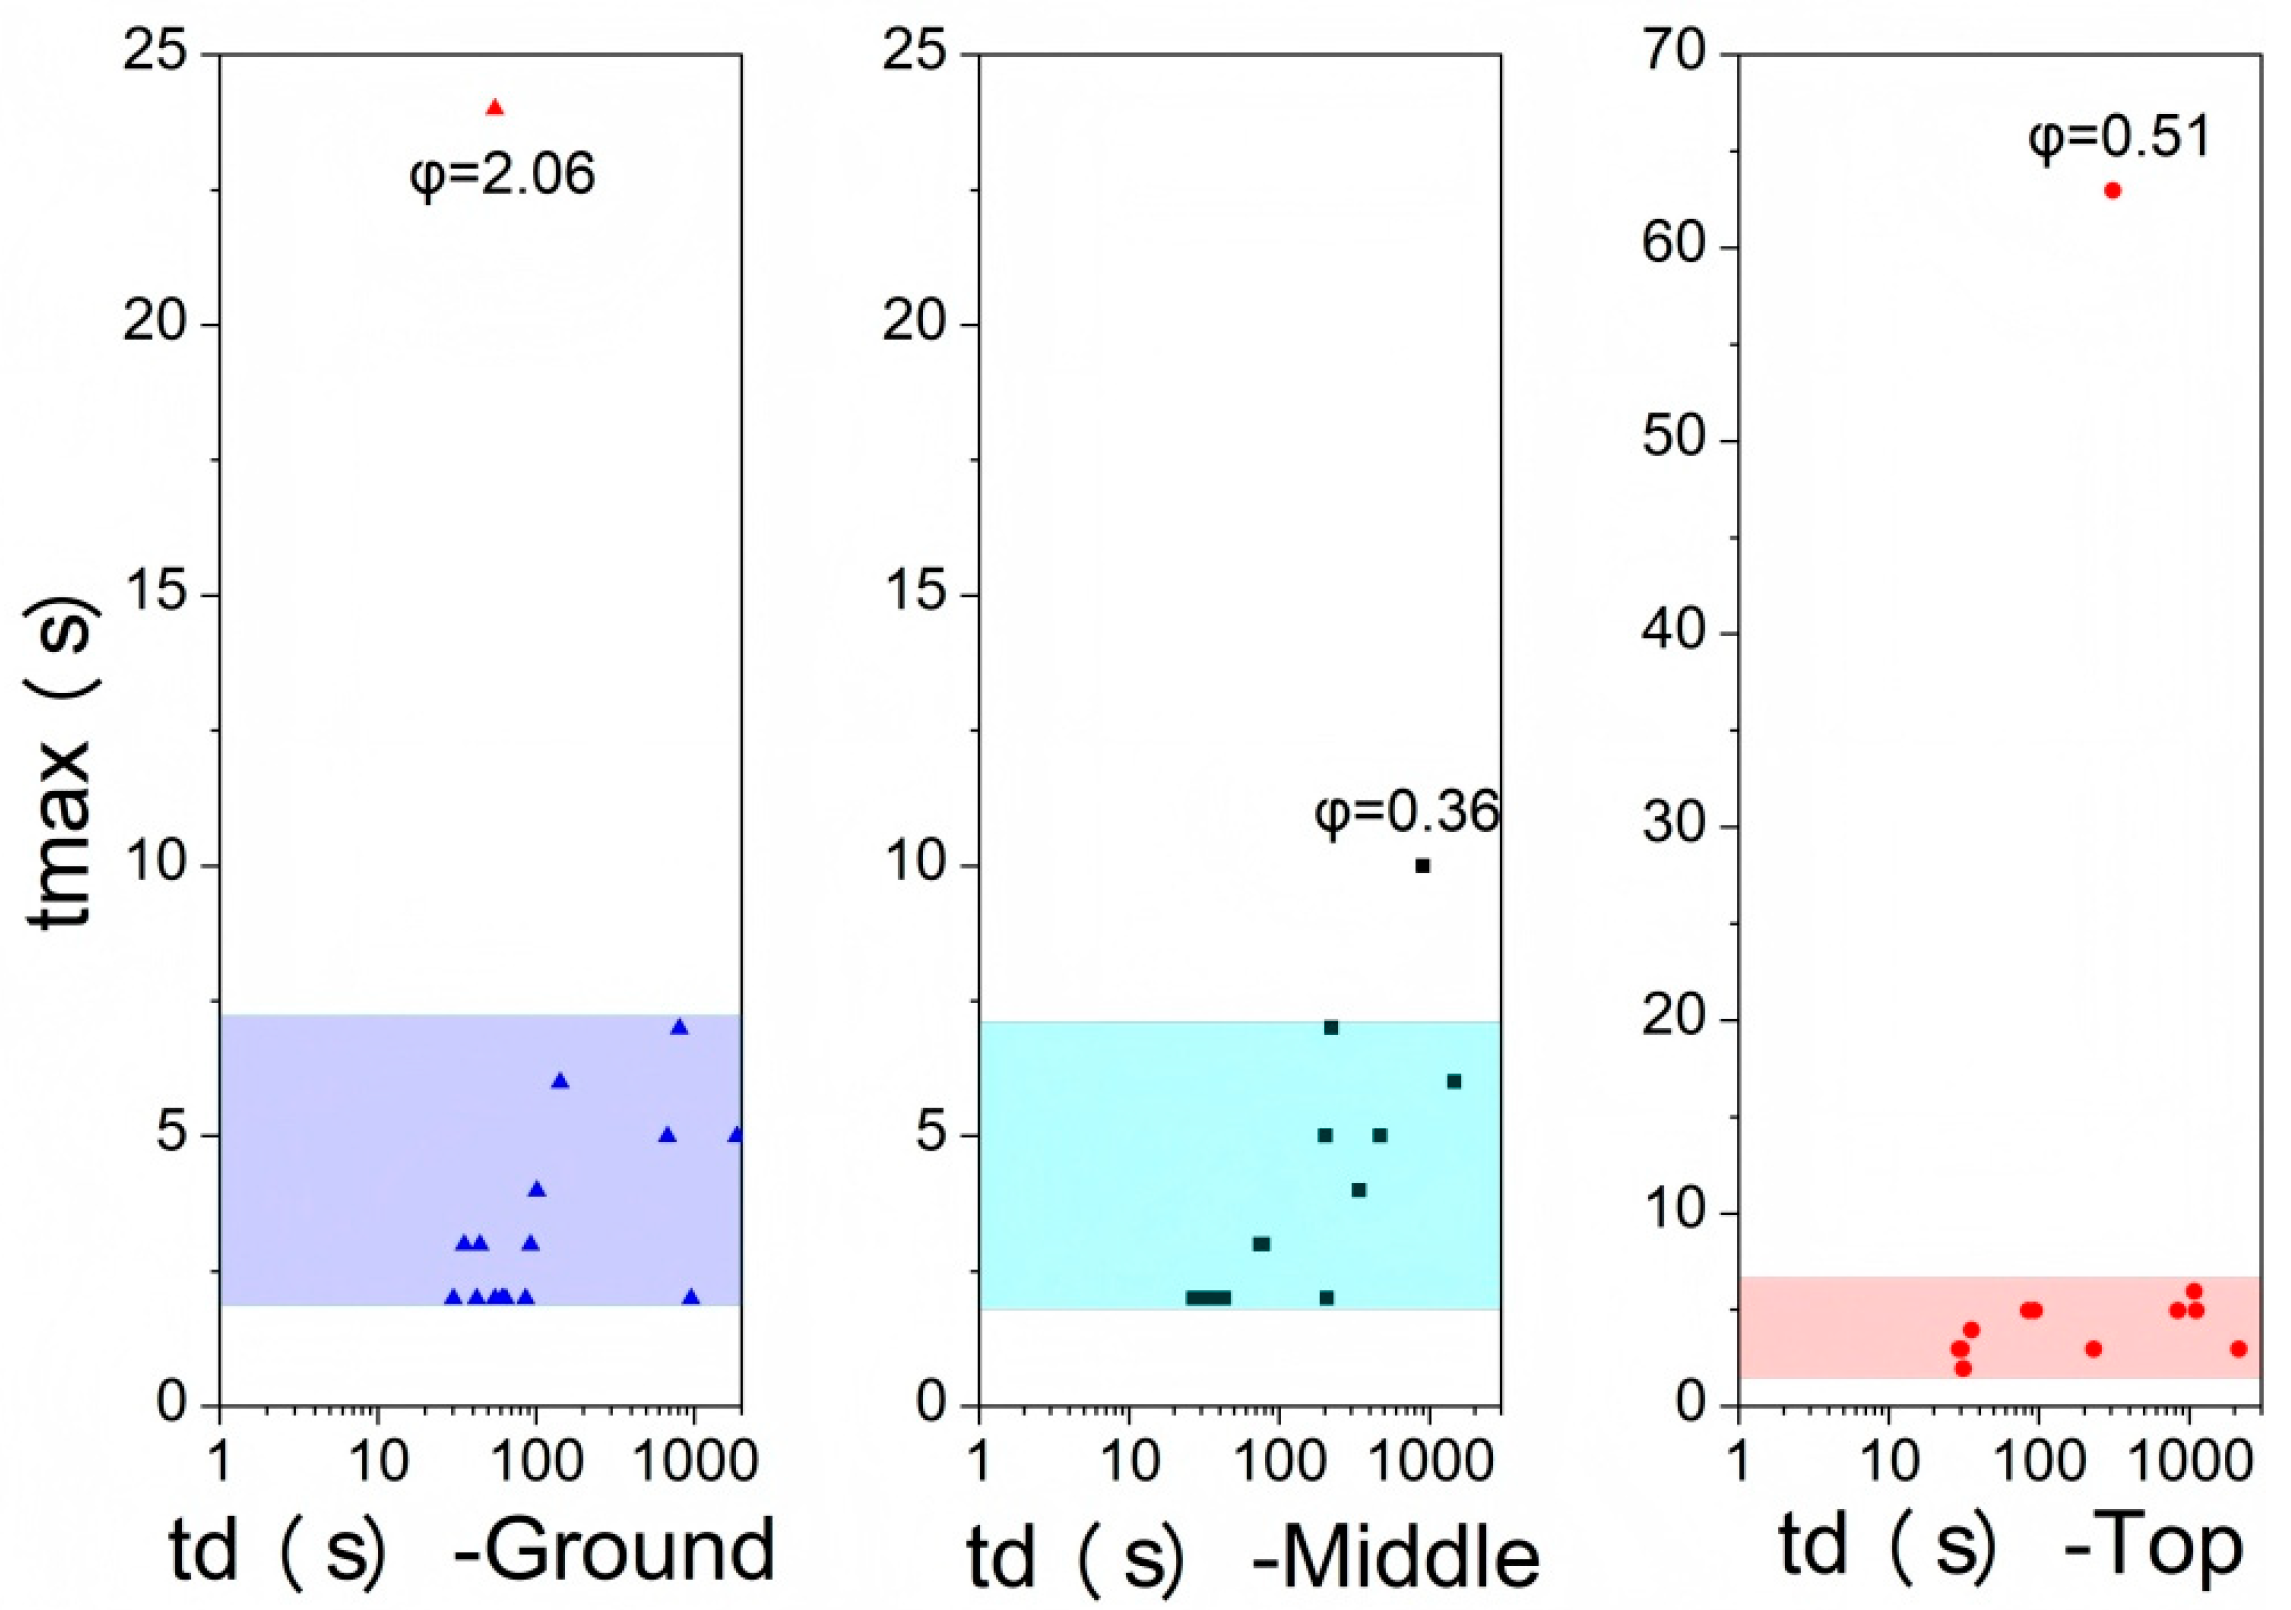
Figure 8 shows the distribution of tmax as a function of td. The 44 experimental cases were divided into four groups according to the ignition-delay ranges defined in Table 2. The median values of tmax in the four groups were 3, 3.5, 5, and 5 s, respectively, showing only a slight increasing trend with increasing td values. Although td increased from 27 s to 5429 s, spanning more than two orders of magnitude, the median of tmax increased by only 2 s. The main bodies of the box plots for all groups were concentrated within 2–7 s, indicating that the thermal response time scale at K2 was similar for most operating conditions.
Figure 8.
Distribution characteristics of the delay time and time to peak temperature.
Three outliers were observed. The ground-level ignition case at φ = 2.06 yielded a tmax of 24 s and was strongly fuel-rich. The top-ignition case at φ = 0.51 reached a tmax of 63 s and was strongly fuel-lean. The mid-height ignition case at φ = 0.36 yielded a tmax of 10 s and was strongly fuel-lean. All outliers occurred under conditions far from stoichiometry, indicating that the anomalous peak temperature times are more likely associated with extreme local mixing states rather than a direct effect of td on the reaction kinetics.
Figure 9 shows the distribution of tmax for the different ignition positions. After excluding the aforementioned extreme outliers, the data for the ground-level, mid-height, and top ignition largely overlapped and converged within 2–7 s. The scatter points show neither a monotonic trend with td nor a clear height-dependent stratification. Thus, after excluding the extreme equivalence ratio outliers, no clear ignition-position-dependent stratification of tmax was observed in the present dataset.
Figure 9.
Distribution of time to peak temperature tmax for different ignition positions.
Together with the findings in Section 3.4, these results indicate that Tmax was more sensitive to ignition-delay-associated cloud redistribution, particularly in the long-delay subset, whereas tmax remained on the order of a few seconds in most cases. This suggests that the ignition-delay period was mainly associated with changes in the peak temperature level through local concentration-field reconfiguration, rather than with a clear change in the characteristic time scale of the local thermal response. Consequently, tmax remains on the order of a few seconds in most cases.
3.6. Vertical Spatial Distribution of Peak Temperature
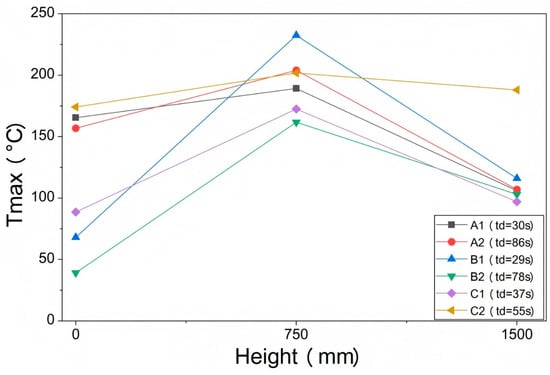
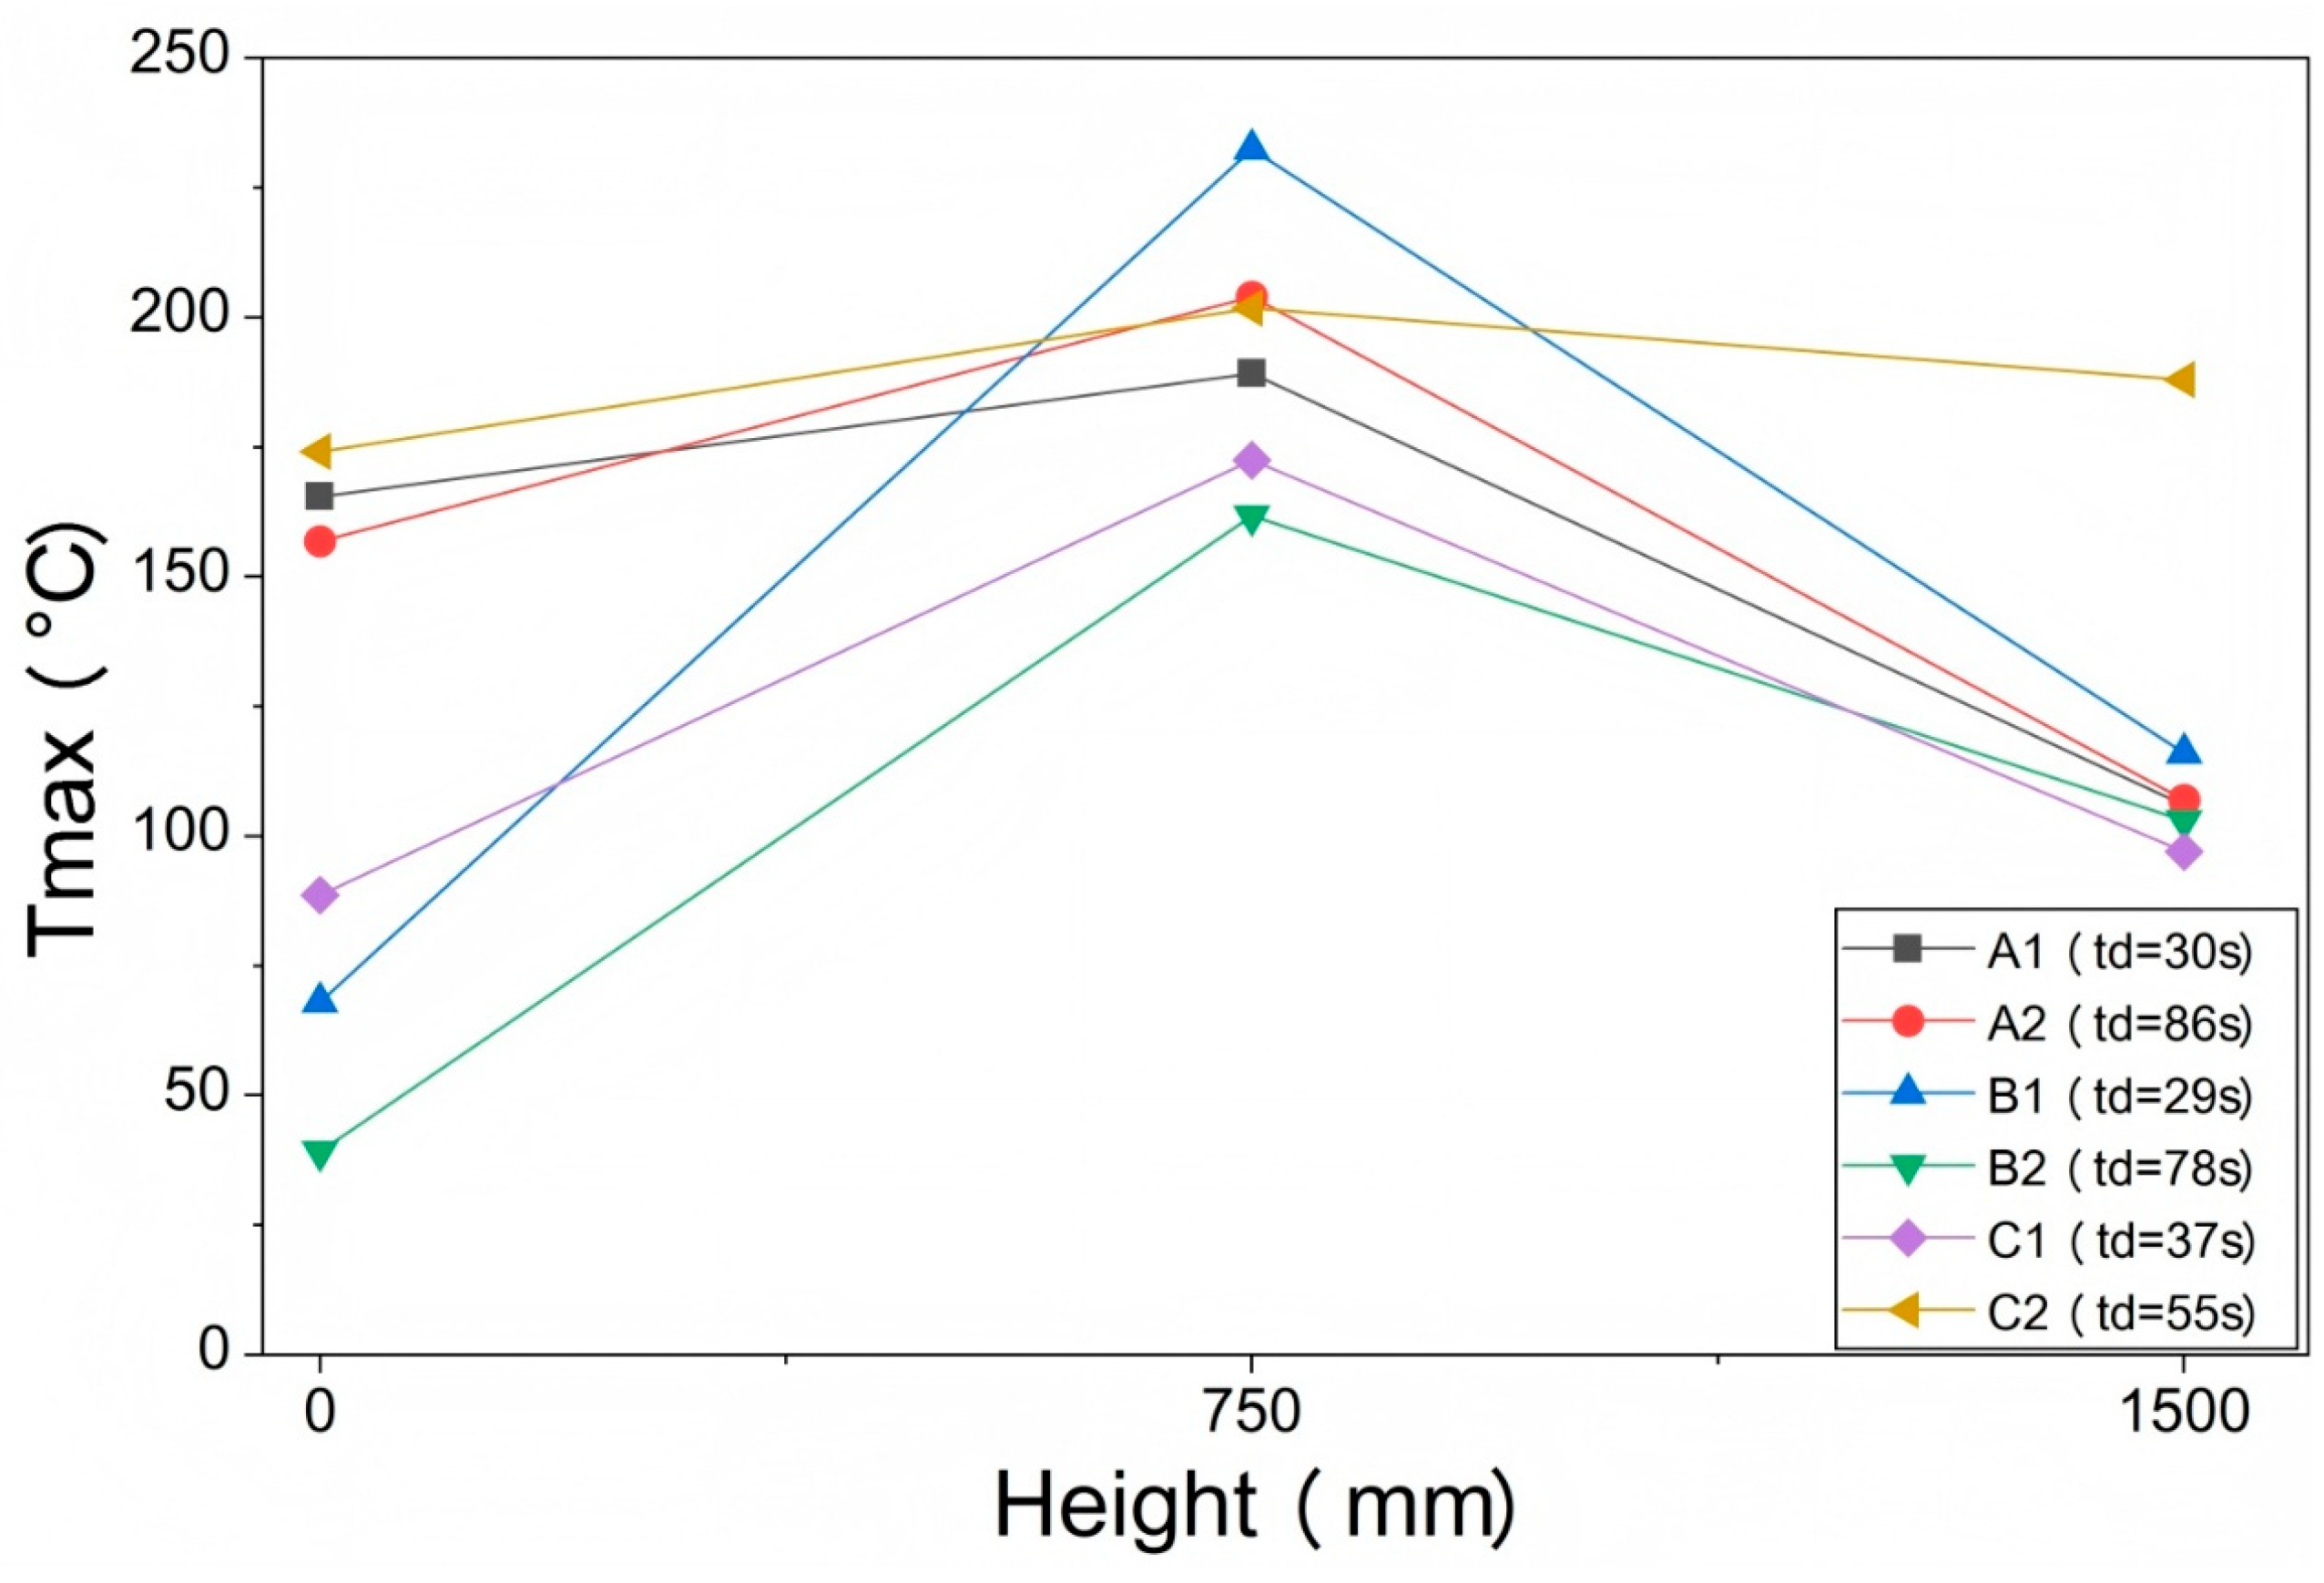
Figure 10 shows the vertical distribution of the peak temperature along the height of the quasi-closed enclosure for the six cases arranged on the central axis. Two representative cases were selected for each HBR. The corresponding case parameters and measured results are presented in Table 6.
Figure 10.
Vertical distribution of the peak temperature.
Table 6.
Experimental conditions and measured results for comparison of vertical temperature distributions.
All six cases exhibited a consistent pattern: the peak temperature at K2 was consistently higher than that at K1 and K3, indicating a vertical distribution characterized by higher values in the middle and lower values in the upper and lower regions. This result shows that, within the range of test conditions examined in this study, the central region of the quasi-closed enclosure exhibited the strongest thermal response, suggesting that this region was more likely to correspond to relatively favorable local combustion conditions at the time of ignition. It should be noted that the peak-temperature distribution mainly reflects the post-combustion thermal response characteristics and cannot be used alone to reconstruct the complete concentration fields.
Both A1 and A2 had an HBR of 10%, and both were ignited at the floor. Their td values were 30 s and 86 s, with global equivalence ratios of 0.96 and 1.33, respectively. Although their global equivalence ratios were not identical, their peak temperature distributions showed clear differences. Compared with A1, A2 exhibits a decrease in peak temperature at K1 from 165.4 °C to 156.8 °C, an increase at K2 from 189.2 °C to 204.0 °C, and little change at K3. This indicates that, between these two cases, the region with a strong thermal response became more pronounced from the lower region to the center. This phenomenon is consistent with the trend of redistribution of combustible components from the lower region to the middle-to-upper region under long-delay conditions, as revealed in Section 3.2.
For Case C2, the peak temperatures at the three measurement points were 174.1 °C, 201.8 °C, and 188.0 °C, respectively, with a maximum difference of only 28 °C, which was significantly smaller than the range of 83 °C to 164 °C observed in the other cases. This indicates that the vertical thermal response in this case was more uniform. One possible explanation is that the relatively high HBR of 30% promoted vertical diffusion and species exchange within the gas mixture, thereby reducing the vertical difference in the peak temperature. However, this result may have been jointly influenced by the ignition position and equivalence ratio.
Table 5 shows that, in each case, the differences in the times to peak temperature among K1, K2, and K3 were generally no more than 1 s, indicating that the thermal response time scales at different heights were similar. Nevertheless, the peak temperatures at the three heights still showed significant differences, further confirming that the vertical distribution of peak temperature was mainly governed by the local pre-ignition combustible conditions and heat release intensity rather than by differences in the thermal response time scale.
4. Discussion
4.1. Comparison with Yang et al. [26]
Yang et al. [26] investigated the non-uniform combustion and explosion characteristics of pure hydrogen leakage clouds in a small-scale horizontal pipe open at both ends, with ignition delay times ranging from 0 ms to 1200 ms. They found that as the ignition delay time increased, the leakage-induced turbulence decayed, whereas the buoyancy-driven stratification intensified. Consequently, the maximum flame speed and overpressure generally decreased, and 800 ms was identified as the critical point for the transition from turbulence-dominated to buoyancy-dominated behavior.
In the present study, the visible flame weakened with increasing delay time, whereas the peak temperature at K2 increased in the long-delay regime. This difference can be attributed to the distinct fluid-dynamic mechanisms and boundary conditions of the two scenarios. Yang et al. focused on the short-time diffusion of a pure-hydrogen momentum jet in a pipe with open boundaries, where unburned gas could continuously escape through open ends [26]. Therefore, the delay-induced concentration attenuation was monotonic and irreversible, and the combustion intensity decreased monotonically. In the present study, however, after HBNG seeped through the porous soil medium and entered the quasi-closed enclosure, the gas was retained inside the space and could not escape through the soil. The delay stage was not simply a process of concentration attenuation but rather involved the dynamic reconstruction of the concentration field under long-duration, multicomponent, closed-boundary conditions over 27 s to 5429 s, during which CH4 and H2 continuously migrated at different rates under buoyancy. This reconstruction process could gradually improve the local combustible conditions in the central region with increasing delay time, leading to the coexistence of weakened overall visible flame development and enhanced local thermal hazards.
Therefore, the conclusion drawn by Yang et al. that increasing ignition delay time leads to decreases in flame speed and overpressure is mainly applicable to the early-stage leakage and diffusion processes of pure hydrogen in open, small-scale pipes [26]. Consequently, this conclusion should be applied with caution when considering non-uniform HBNG clouds induced by soil seepage in enclosed areas.
4.2. Discrepancy Between Macroscopic Flame and Local Thermal Response
The discrepancy between the visible flame morphology and local thermal response indicates that the qualitative flame appearance alone cannot be used to evaluate the combustion intensity in a non-uniform HBNG cloud. The visible flame mainly reflects the optically observable combustion region, whereas the thermocouple signal reflects the local point-measured thermal response at a fixed position. Therefore, a weaker visible flame does not necessarily indicate a lower local point-measured thermal response.
The time to reach the peak temperature further supports this mechanism. In most cases, the time to peak temperature remained on the order of several seconds and did not vary significantly with td, indicating that the delay process altered the local heat release intensity rather than the intrinsic time scale of the combustion dynamics. Therefore, the macroscopic appearance of the visible flame cannot replace local temperature measurements when assessing the thermal exposure associated with a non-uniform cloud.
The weakened visible flame observed under long-delay conditions may indicate a reduction in large-scale optically observable flame propagation, rather than a complete absence of local heat release. Because the thermocouple response is governed by the local mixture state near the measurement point, local thermal exposure may remain significant even when the visible flame is weak or difficult to observe. This indicates that no-visible-flame or weak-visible-flame observations should be interpreted with caution in non-uniform HBNG clouds.
4.3. Limitations of the Global Equivalence Ratio
The global equivalence ratio can only represent the spatially averaged fuel–air ratio based on the total leaked amount and cannot reflect the internal concentration gradients or local combustible states within a non-uniform cloud. The experimental results showed that cases with similar global equivalence ratios exhibited different flame morphologies and thermal responses. The concentration analysis of the long-ignition-delay experiments also showed that before ignition, the methane concentration, hydrogen concentration, local HBR, and local equivalence ratio differed at different heights. The coefficient of determination, R2, for the fit between Tmax and φ was only 0.026, indicating that there was almost no correlation between them.
For non-uniform clouds induced by soil seepage, the assessment of local thermal hazards must jointly consider multidimensional flammability indicators, such as the local total fuel concentration, local HBR, and local equivalence ratio. The global equivalence ratio cannot be used alone as a reliable predictor of the local point-measured thermal response in non-uniform clouds.
4.4. Engineering Implications
The above results have direct implications for accident risk management in buried HBNG pipeline networks. In quasi-closed enclosures, such as underground utility tunnels and valve chambers, an increase in the waiting time after leakage cessation may reduce the outward visible flame development, but it does not necessarily reduce the local thermal exposure in the central region because of the buoyancy-driven redistribution of fuel components. Therefore, risk assessment for such scenarios should not be based solely on the waiting time after leakage or the global equivalence ratio. Instead, the dynamic evolution of the local pre-ignition concentration field and local combustibility should be incorporated as the core evaluation elements. Existing safety criteria based on the assumptions of homogeneous premixing or global parameters should be applied with caution when used for non-uniform leakage scenarios induced by soil seepage.
4.5. Experimental Limitations and Boundary Conditions
Owing to the large-scale and soil-seepage-dependent nature of the experiments, exact repetition of each operating condition was difficult because small variations in soil packing, seepage pathways, and cloud redistribution could not be fully eliminated. Because the particle size distribution, porosity, permeability, and packing density of the sand layer were not independently measured or varied, their effects on flow resistance and gas propagation pathways could not be isolated. Therefore, the conclusions of this study should be interpreted as trend-based evidence from 44 valid experimental cases, rather than as deterministic predictions for individual leakage scenarios.
During the ignition-delay period, the enclosure had no designed ventilation openings and was treated as a quasi-closed space. The observed inflation of the PE film before rupture after ignition indicates that gas was retained before ignition. Therefore, the long-delay stage was mainly interpreted as a quasi-closed redistribution process of CH4 and H2, rather than a ventilation-controlled dilution process.
The measured peak temperatures represent local point-measured thermal responses rather than flame temperatures or the maximum temperature of the entire smoke cloud. The thermocouples recorded transient gas temperatures at fixed positions, and the flame front did not necessarily pass directly through each of the junctions. Heat losses, thermocouple response time, PE film rupture, and post-rupture air entrainment may have also reduced the measured temperature. Therefore, Tmax should not be directly compared with the adiabatic flame temperature of HBNG–air mixtures. In this study, Tmax was used only to compare the local thermal exposure under different ignition-delay conditions. Future studies should combine denser concentration measurements, pressure sensors, full-field temperature diagnostics, and CFD simulations to further clarify the coupling between cloud redistribution, flame propagation, and thermal response. A validated CFD model incorporating porous media seepage, multicomponent diffusion, buoyancy-driven redistribution, and combustion can provide more detailed insights into flammable cloud evolution and flame propagation processes. Because the pressure was not measured in the present study, the results should not be used to infer overpressure or explosion severity.
The nominal electrical ignition energy was calculated from the recorded discharge power and the ignition duration. However, the effective energy deposited in the combustible mixture was not directly measured. Therefore, the ignition energy was treated as a documented ignition condition rather than an independently controlled variable.
In addition, the HBR, global equivalence ratio, ignition position, released volume, and ignition delay time were not fully orthogonalized in this study. Therefore, the observed relationship between the ignition delay and peak temperature should be interpreted as a coupled trend associated with post-leakage cloud redistribution rather than the isolated effect of ignition delay alone.
5. Conclusions
Based on 44 experiments on HBNG leakage through soil into a quasi-closed enclosure, this study investigated the association between the ignition delay, visible flame behavior, local gas concentration measurements, and local thermocouple responses of non-uniform HBNG clouds. The main conclusions are as follows:
- The ignition-delay period was associated with changes in visible flame development. Under short-delay conditions, brighter flames and wider visible propagations were observed. Under long-delay conditions, the visible flame weakened or was barely visible. These observations indicate a reduction in the apparent visible flame development. However, they should not be interpreted as a direct quantitative measure of combustion intensity.
- Long ignition-delay periods allow substantial reconstruction of the local pre-ignition concentration field. Hydrogen preferentially migrated within the transient multicomponent transport process because of its higher diffusivity and buoyant rise behavior, whereas methane was redistributed from the bottom toward the middle and upper regions over a longer timescale. Under long-delay conditions, the central-axis measurements showed that methane concentrations tended to become more uniform, whereas hydrogen still exhibited vertical concentration differences at the measured heights. Before ignition, the local total fuel concentration, local HBR, local equivalence ratio, and combustibility indicators differed at different heights.
- The local peak temperature and visible flame development did not vary synchronously. In the short-delay regime, Tmax exhibited a strong scatter. For the long-delay subset with td > 307 s, the peak temperature at K2 showed a positive association with ignition delay in the present dataset, with R2 = 0.74. This trend suggests that, under the tested non-orthogonal experimental conditions, post-leakage cloud redistribution may improve the local combustible conditions near the central region. In contrast, tmax was mostly concentrated within 2–7 s and showed little dependence on td, indicating that the ignition-delay period mainly changed the peak level rather than the response time scale of the local thermal response. For the six selected central-axis cases, K2 recorded higher peak temperatures than K1 and K3, suggesting a stronger point-measured thermal response in the central region under the selected conditions.
- Unlike the monotonic decay of combustion intensity with diffusion time reported for open-boundary, short-duration pure-hydrogen leakage scenarios, the present results indicate that, under the tested enclosed soil-seepage conditions, a prolonged ignition delay in enclosed soil-seepage scenarios does not necessarily reduce the local point-measured thermal response. No monotonic relationship was observed between the global equivalence ratio and the peak temperature at K2, with R2 = 0.026. This indicates that the global equivalence ratio alone is insufficient for predicting the local thermal response in non-uniform HBNG clouds. As an engineering implication supported by the present experimental trends, accident risk assessment for buried HBNG leakage into quasi-closed spaces should consider local concentration evolution and local combustibility, rather than relying solely on the waiting time after leakage cessation or global equivalence ratio.
Author Contributions
Conceptualization, W.G.; methodology, S.D.; data curation, W.G.; writing—original draft preparation, W.G.; writing—review and editing, J.L.; writing—review and editing, X.L.; supervision, S.D.; project administration, H.W.; funding acquisition, S.D. All authors have read and agreed to the published version of the manuscript.
Funding
This research was funded by the Beijing Association for Science and Technology through the project “Strategic Study on the Safety of Hydrogen Energy Production, Storage, Transportation, and Utilization in Beijing”, grant number ZX20230307.
Institutional Review Board Statement
Not applicable.
Informed Consent Statement
Not applicable.
Data Availability Statement
The raw data supporting the conclusions of this article will be made available by the authors on request.
Acknowledgments
During the preparation of this manuscript, the authors used ChatGPT 5.5 Thinking Extended for English language polishing. The authors reviewed and edited the output and take full responsibility for the content of this publication.
Conflicts of Interest
The authors declare no conflicts of interest.
References
- Zacepins, A.; Kotovs, D.; Komasilovs, V.; Kviesis, A. Economic Modelling of Mixing Hydrogen with Natural Gas. Processes 2024, 12, 262. [Google Scholar] [CrossRef] [Scilit]
- Zheng, Z.; Xiwang, A.; Sun, Y. Optimal Scheduling of Integrated Energy System Considering Hydrogen Blending Gas and Demand Response. Energies 2024, 17, 1902. [Google Scholar] [CrossRef] [Scilit]
- Fetisov, V. Analysis of numerical modeling of steady-state modes of methane–hydrogen mixture transportation through a compressor station to reduce CO2 emissions. Sci. Rep. 2024, 14, 10605. [Google Scholar] [CrossRef] [Scilit]
- Xue, Y.; Li, X.; Liu, Y.; Yuan, J.; Hua, J.; Wu, Y. Adaptability Study of Pressure Regulators in Hydrogen-Blended Natural Gas Pipelines. ACS Omega 2025, 10, 50415–50430. [Google Scholar] [CrossRef] [Scilit]
- Martin, P.; Ocko, I.; Esquivel-Elizondo, S.; Kupers, R.; Cebon, D.; Baxter, T.; Hamburg, S. A review of challenges with using the natural gas system for hydrogen. Energy Sci. Eng. 2024, 12, 3995–4009. [Google Scholar] [CrossRef] [Scilit]
- Raj, A.; Larsson, I.A.S.; Ljung, A.-L.; Forslund, T.; Andersson, R.; Sundström, J.; Lundström, T.S. Evaluating hydrogen gas transport in pipelines: Current state of numerical and experimental methodologies. Int. J. Hydrogen Energy 2024, 67, 136–149. [Google Scholar] [CrossRef] [Scilit]
- Massarweh, O.; Bicer, Y.; Abushaikha, A. Technoeconomic analysis of hydrogen versus natural gas considering safety hazards and energy efficiency indicators. Sci. Rep. 2025, 15, 29601. [Google Scholar] [CrossRef] [Scilit]
- Li, M.; Wang, Z.; Jiang, J.; Lin, W.; Ni, L.; Pan, Y.; Wang, G. Numerical Simulation and Consequence Analysis of Full-Scale Jet Fires for Pipelines Transporting Pure Hydrogen or Hydrogen Blended with Natural Gas. Fire 2024, 7, 180. [Google Scholar] [CrossRef] [Scilit]
- Ban, J.; Wang, X.; Zhou, L.; Yang, W.; Hu, J.; Liu, T.; Liu, G. The Effect of Heterogeneous Backfill Soil on Leakage Behavior of Hydrogen-Blended Natural Gas Pipelines. ACS Omega 2026, 11, 8807–8825. [Google Scholar] [CrossRef] [Scilit]
- Wang, X.; Hou, T.; Ba, X.; Tan, Y. Simulation of Diffusion Characteristics and Risk Analysis of Natural Gas in an Underground Enclosure: A Case Study. ACS Omega 2025, 10, 18910–18923. [Google Scholar]
- Gong, X.; Li, H.; Li, C.; Kou, M.; Kong, L.; Liu, H. Research on leakage and diffusion behavior of hydrogen doped natural gas in integrated pipeline corridors based on data drive. Sci. Rep. 2025, 15, 2860. [Google Scholar] [CrossRef] [Scilit]
- Chang, W.; Wang, W.; Guo, Y.; Wang, L.; Li, Z. Diffusion characterization of hydrogen-blended natural gas leakage for buried pipeline based on simulation. Int. J. Hydrogen Energy 2025, 99, 394–408. [Google Scholar] [CrossRef] [Scilit]
- Chen, S.; Li, M.; Dong, H.; Meng, L.; Guan, B.; Zhou, S.; Wang, S.; Niu, C. Numerical investigation for hazardous gas cloud form and dissipation behaviour of hydrogen-blended natural gas in a enclosed space. R. Soc. Open Sci. 2025, 12, 241671. [Google Scholar] [CrossRef] [Scilit]
- Tian, Y.; Tian, T.; Ren, G.; Zhang, J. Numerical simulation of hydrogen mixing process in T-junction natural gas pipeline. Materials 2025, 18, 1879. [Google Scholar] [CrossRef] [Scilit]
- Wang, Y.; Xu, C.; Zhao, G.; Zeng, Y.; Han, R.; He, T. Numerical simulation study on hydrogen leakage and explosion of hydrogen fuel cell buses. Sci. Rep. 2025, 15, 31976. [Google Scholar] [CrossRef] [Scilit]
- Nosek, R.; Patsch, M.; Pilát, P.; Zvada, B.; Backa, A. Flashback behavior and safety implications of hydrogen–natural gas mixtures. Sci. Rep. 2025, 15, 39592. [Google Scholar] [CrossRef] [Scilit]
- Li, M.; Chen, S.; Jiang, W.; Li, Y.; Xu, Z.; Guan, B.; Wang, X.; Lin, X.; Liu, T. Numerical simulation analysis of the hydrogen-blended natural gas leakage and ventilation processes in a domestic house. ACS Omega 2023, 8, 34610–34628. [Google Scholar] [CrossRef] [Scilit]
- Amer, M.; Hoseyni, S.M.; Cordiner, J. Fuelling the future with safe hydrogen transportation through natural gas pipelines: A quantitative risk assessment approach. Trans. Indian Natl. Acad. Eng. 2024, 9, 763–781. [Google Scholar] [CrossRef] [Scilit]
- Deng, B.; Huang, X.; Lyu, S.; Aimaieraili, D. Numerical Investigation on the Diffusion and Ventilation Characteristics of Hydrogen-Blended Natural Gas Leakage in Indoor Spaces. Buildings 2025, 15, 3833. [Google Scholar] [CrossRef] [Scilit]
- Liu, Q.; Liu, Z.; Peng, S.; Liu, C.; Liu, C.; Liu, L.; Zhou, R.; Zhi, S.; Fan, T.; Li, P. Effects of Hydrogen Blending Ratio and Equivalence Ratio on the Dynamic Characteristics of Deflagration Shock Waves of CH4/H2 Mixtures. ACS Omega 2024, 9, 23853–23863. [Google Scholar] [CrossRef] [Scilit]
- Topolski, K.; Reznicek, E.P.; Cakir Erdener, B.; San Marchi, C.W.; Ronevich, J.A.; Fring, L.; Simmons, K.; Guerra Fernandez, O.J.; Hodge, B.-M.; Chung, M. Hydrogen Blending into Natural Gas Pipeline Infrastructure: Review of the State of Technology; Technical Report NREL/TP-5400-81704; National Renewable Energy Laboratory: Golden, CO, USA, 2022.
- Isaac, T. HyDeploy: The UK’s First Hydrogen Blending Deployment Project. Clean Energy 2019, 3, 114–125. [Google Scholar] [CrossRef] [Scilit]
- Islam, A.; Alam, T.; Sheibley, N.; Edmonson, K.; Burns, D.; Hernandez, M. Hydrogen blending in natural gas pipelines: A comprehensive review of material compatibility and safety considerations. Int. J. Hydrogen Energy 2024, 93, 1429–1461. [Google Scholar] [CrossRef] [Scilit]
- Remacha, P.; Tizné, E.; Pina, A.; Barroso, J.; Muelas, Á.; Ballester, J. Impact of hydrogen blending on the formation of flammable atmospheres in enclosed spaces due to gas leaks. Int. J. Hydrogen Energy 2025, 142, 685–696. [Google Scholar] [CrossRef] [Scilit]
- Kim, W.J.; Park, Y.; Park, D.J. Quantitative risk assessments of hydrogen blending into transmission pipeline of natural gas. J. Loss Prev. Process Ind. 2024, 91, 105412. [Google Scholar] [CrossRef] [Scilit]
- Yang, W.; Zhang, K.; Jiang, B.; Yang, X.; Zhang, Y. Experimental study on the effect of diffusion time on non-uniform hydrogen explosion induced by leakage. Int. J. Hydrogen Energy 2025, 177, 151614. [Google Scholar] [CrossRef] [Scilit]

Disclaimer/Publisher’s Note: The statements, opinions and data contained in all publications are solely those of the individual author(s) and contributor(s) and not of MDPI and/or the editor(s). MDPI and/or the editor(s) disclaim responsibility for any injury to people or property resulting from any ideas, methods, instructions or products referred to in the content. |
© 2026 by the authors. Licensee MDPI, Basel, Switzerland. This article is an open access article distributed under the terms and conditions of the Creative Commons Attribution (CC BY) license.