


Abstract
Large-scale and long-term hydrogen storage is one of the main obstacles to the wider use of hydrogen as a possible substitute for natural gas. A solution could be depleted natural gas fields, which have proven capacity and are already geologically prospected. However, part of this field remains occupied by residual natural gas, meaning that hydrogen is mixed with natural gas during storage and purification after extraction is therefore necessary. The aim of this study was to design and evaluate a hydrogen purification process for separating hydrogen from natural gas after extraction from a depleted natural gas field while maintaining the required hydrogen purity and recovery. Input data provided by Nafta a.s. were used for the mathematical simulation of hydrogen separation throughout a 150-day extraction period. A mathematical model of membrane separation and pressure swing adsorption (PSA) was developed. A single membrane stage was only able to operate effectively during the first 50 days of withdrawal while maintaining at least 80% hydrogen recovery. A two-stage membrane configuration achieved hydrogen purity above 98% with final recoveries above 80–85%, while the hybrid membrane–PSA system enabled hydrogen purity of 99.8% and total recovery of 82.5% on the last day of extraction.
1. Introduction
Fossil fuels, as the primary global energy source, emit greenhouse gases (GHG) during combustion for thermal energy, significantly contributing to climate change [1]. Historically, hydrogen has predominantly been utilized as a feedstock in oil refining and fertilizer production. However, advancements in clean energy technologies have positioned hydrogen as a promising carbon neutral energy carrier, particularly when produced from primary energy sources. This transition can be facilitated by converting surplus electricity into hydrogen via electrolysis (P2G) [2]. Hydrogen also offers potential benefits for the electrical grid, enhancing stability and flexibility by balancing energy production and demand—especially where excess renewable electricity is used for hydrogen generation [3]. Despite these advantages, large-scale and long-term hydrogen storage remains a significant technical challenge. Geological storage in underground reservoirs presents a viable solution, leveraging the buffering capacity of subsurface formations to accommodate fluctuations in hydrogen supply and demand [4]. Among the available geological storage options—salt caverns, aquifers, and depleted hydrocarbon fields—depleted natural gas reservoirs are particularly attractive due to their established infrastructure, well-characterized geology, and proven capacity. It is important to note, however, that operational experience with these reservoirs is primarily based on methane-rich natural gas, which exhibits physical and chemical properties distinct from hydrogen [5].
Depleted natural gas reservoirs inherently retain residual natural gas, which serves as a cushion gas within the formation. When hydrogen is injected into such a reservoir, it inevitably mixes with the cushion gas, resulting in a reduction in the purity of the withdrawn gas mixture—particularly during the initial cycle of injection and withdrawal. Consequently, the extracted hydrogen will be contaminated with residual natural gas, and a portion of the injected hydrogen will remain trapped in the reservoir as it replaces the original cushion gas. This process leads to unavoidable hydrogen losses during storage operations [6]. Consequently, it is essential to implement post-extraction separation processes to isolate hydrogen from natural gas following storage and withdrawal operations.
A variety of methods have been developed for separating hydrogen from mixtures with natural gas, each offering distinct advantages and limitations. Cryogenic separation, one of the more established techniques, utilizes low temperatures to condense other gases and thereby separate hydrogen. Although this approach can achieve satisfactory recovery rates and is well-suited for large-scale operations, it is highly energy-intensive and costly due to the substantial requirements for gas compression and refrigeration. As a result, cryogenic separation is generally less practical for flexible or medium-scale applications [7]. Metal hydride separation utilizes the selective absorption of hydrogen by specific metal alloys, enabling the achievement of extremely high purities (up to 99.999%). However, this method is primarily restricted to small-scale applications because of its high cost and sensitivity to operating conditions, particularly temperature and pressure [8].
Adsorption-based technologies, particularly Pressure Swing Adsorption (PSA), are widely utilized in industrial applications. Due to the small size and relative inertness of the hydrogen molecule, no adsorbent material can efficiently absorb hydrogen itself. As a result, hydrogen purification in PSA processes depends on the selective adsorption of impurities, allowing hydrogen to pass through the column and be collected as the purified product [1,9]. Once the adsorbent material in the PSA unit becomes saturated with impurities, the adsorption process is halted, and the column undergoes regeneration. During regeneration, the impurity gases are desorbed at low pressure, restoring the adsorbent’s capacity for subsequent cycles. A key advantage of PSA technology is its ability to produce hydrogen with a purity exceeding 99.99 vol % while having low energy consumption [10,11]. Traditional adsorbents that are commonly employed in pressure swing adsorption processes include zeolite, activated carbon, alumina, and silica gel.
Membrane separation technologies provide a flexible and energy-efficient solution, particularly for pre-treatment or bulk separation stages. Although polymeric membranes are cost-effective and widely available, their performance is limited by the inherent trade-off between permeability and selectivity, which often results in lower product purity compared to PSA [12]. Using additional membrane stages can mitigate the trade-off between permeability and selectivity in membrane separation technology. There are numerous configurations for chaining membrane modules, with each presenting specific advantages and disadvantages. Multi-stage membrane separation processes are capable of achieving both high product purity and recovery. However, in such systems, recompression represents a significant cost factor, making it essential to optimize membrane processes to balance compression costs, membrane costs, and overall recovery [13]. Polymeric membranes currently dominate the market for large-scale hydrogen separation [14]. However, their gas separation performance is constrained by the intrinsic properties of the polymers used [15]. Gas transport through these membranes is primarily governed by the solution-diffusion mechanism, in which separation occurs due to the differing diffusion rates of gases permeating through the membrane.
To address these limitations, hybrid systems that combine membrane separation with PSA have emerged as a promising alternative. In these systems, membranes are employed for initial separation and reduce the volume load, while PSA is used to achieve high purity in the final product. This synergy leverages the energy efficiency and modularity of membrane technology together with the high selectivity and maturity of PSA [16]. This approach can improve overall hydrogen recovery compared to PSA alone [9]. However, the design of such systems is complex due to the additional degrees of freedom introduced by the PSA unit. Hybrid separation technologies are also well-suited for feeds with varying concentrations and pressures [17].
The focus of this work is the design and evaluation of a hydrogen purification technology suitable for separating hydrogen from a mixture with natural gas after extraction from a depleted natural gas field used for storage. The study considers a wide range of operational conditions for the feed gas, reflecting realistic variations in composition, pressure, and flow rate, as expected during different phases of gas mixture withdrawal. Building on the potential of hybrid technology, this study focuses on the integration of membrane technology with pressure swing adsorption (PSA) to achieve the required hydrogen purity and recovery targets, while maintaining both economic and technical feasibility. The proposed system is designed to balance the advantages of both technologies—membrane modules for efficient bulk separation and PSA for high-purity polishing—while addressing challenges such as fluctuating feed quality and compression requirements. Mathematical models for both technologies are implemented to simulate their performance under variable input conditions. The integrated approach offers a technically robust solution for post-storage hydrogen recovery, adaptable to the dynamic and variable input streams typical of geological storage applications. Rather than evaluating only a few selected mixture compositions, the present work considers the full operating window during the 150-day withdrawal period, defined by variations in feed pressure, flow rate, and hydrogen content. This allows for the identification of a suitable separation sequence and assessment of the role of membrane separation in stabilizing the PSA feed.
2. Materials and Methods
This section outlines the mathematical models employed for the simulation of both the membrane module and the pressure swing adsorption (PSA) unit. The input data utilized for these calculations are also presented, as detailed in Table 1 and Table 2, respectively. These data represent nominal operating data combined with available estimates provided by Nafta a.s.
Table 1.
Parameters of the feedstock.
Table 2.
Composition of natural gas, considered as the remaining fraction of the withdrawn gas besides hydrogen.
2.1. Calculation Range and Purity Requirements
The objective of this study is to achieve the separation of hydrogen from a hydrogen–natural gas mixture during the extraction period from a depleted natural gas reservoir. The key parameters of the gas mixture, namely pressure, volumetric flow rate, and hydrogen content, are summarized in Table 1.
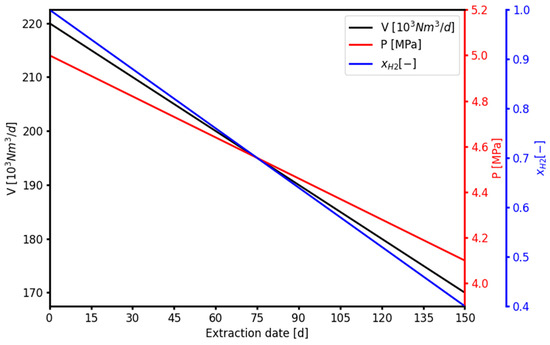
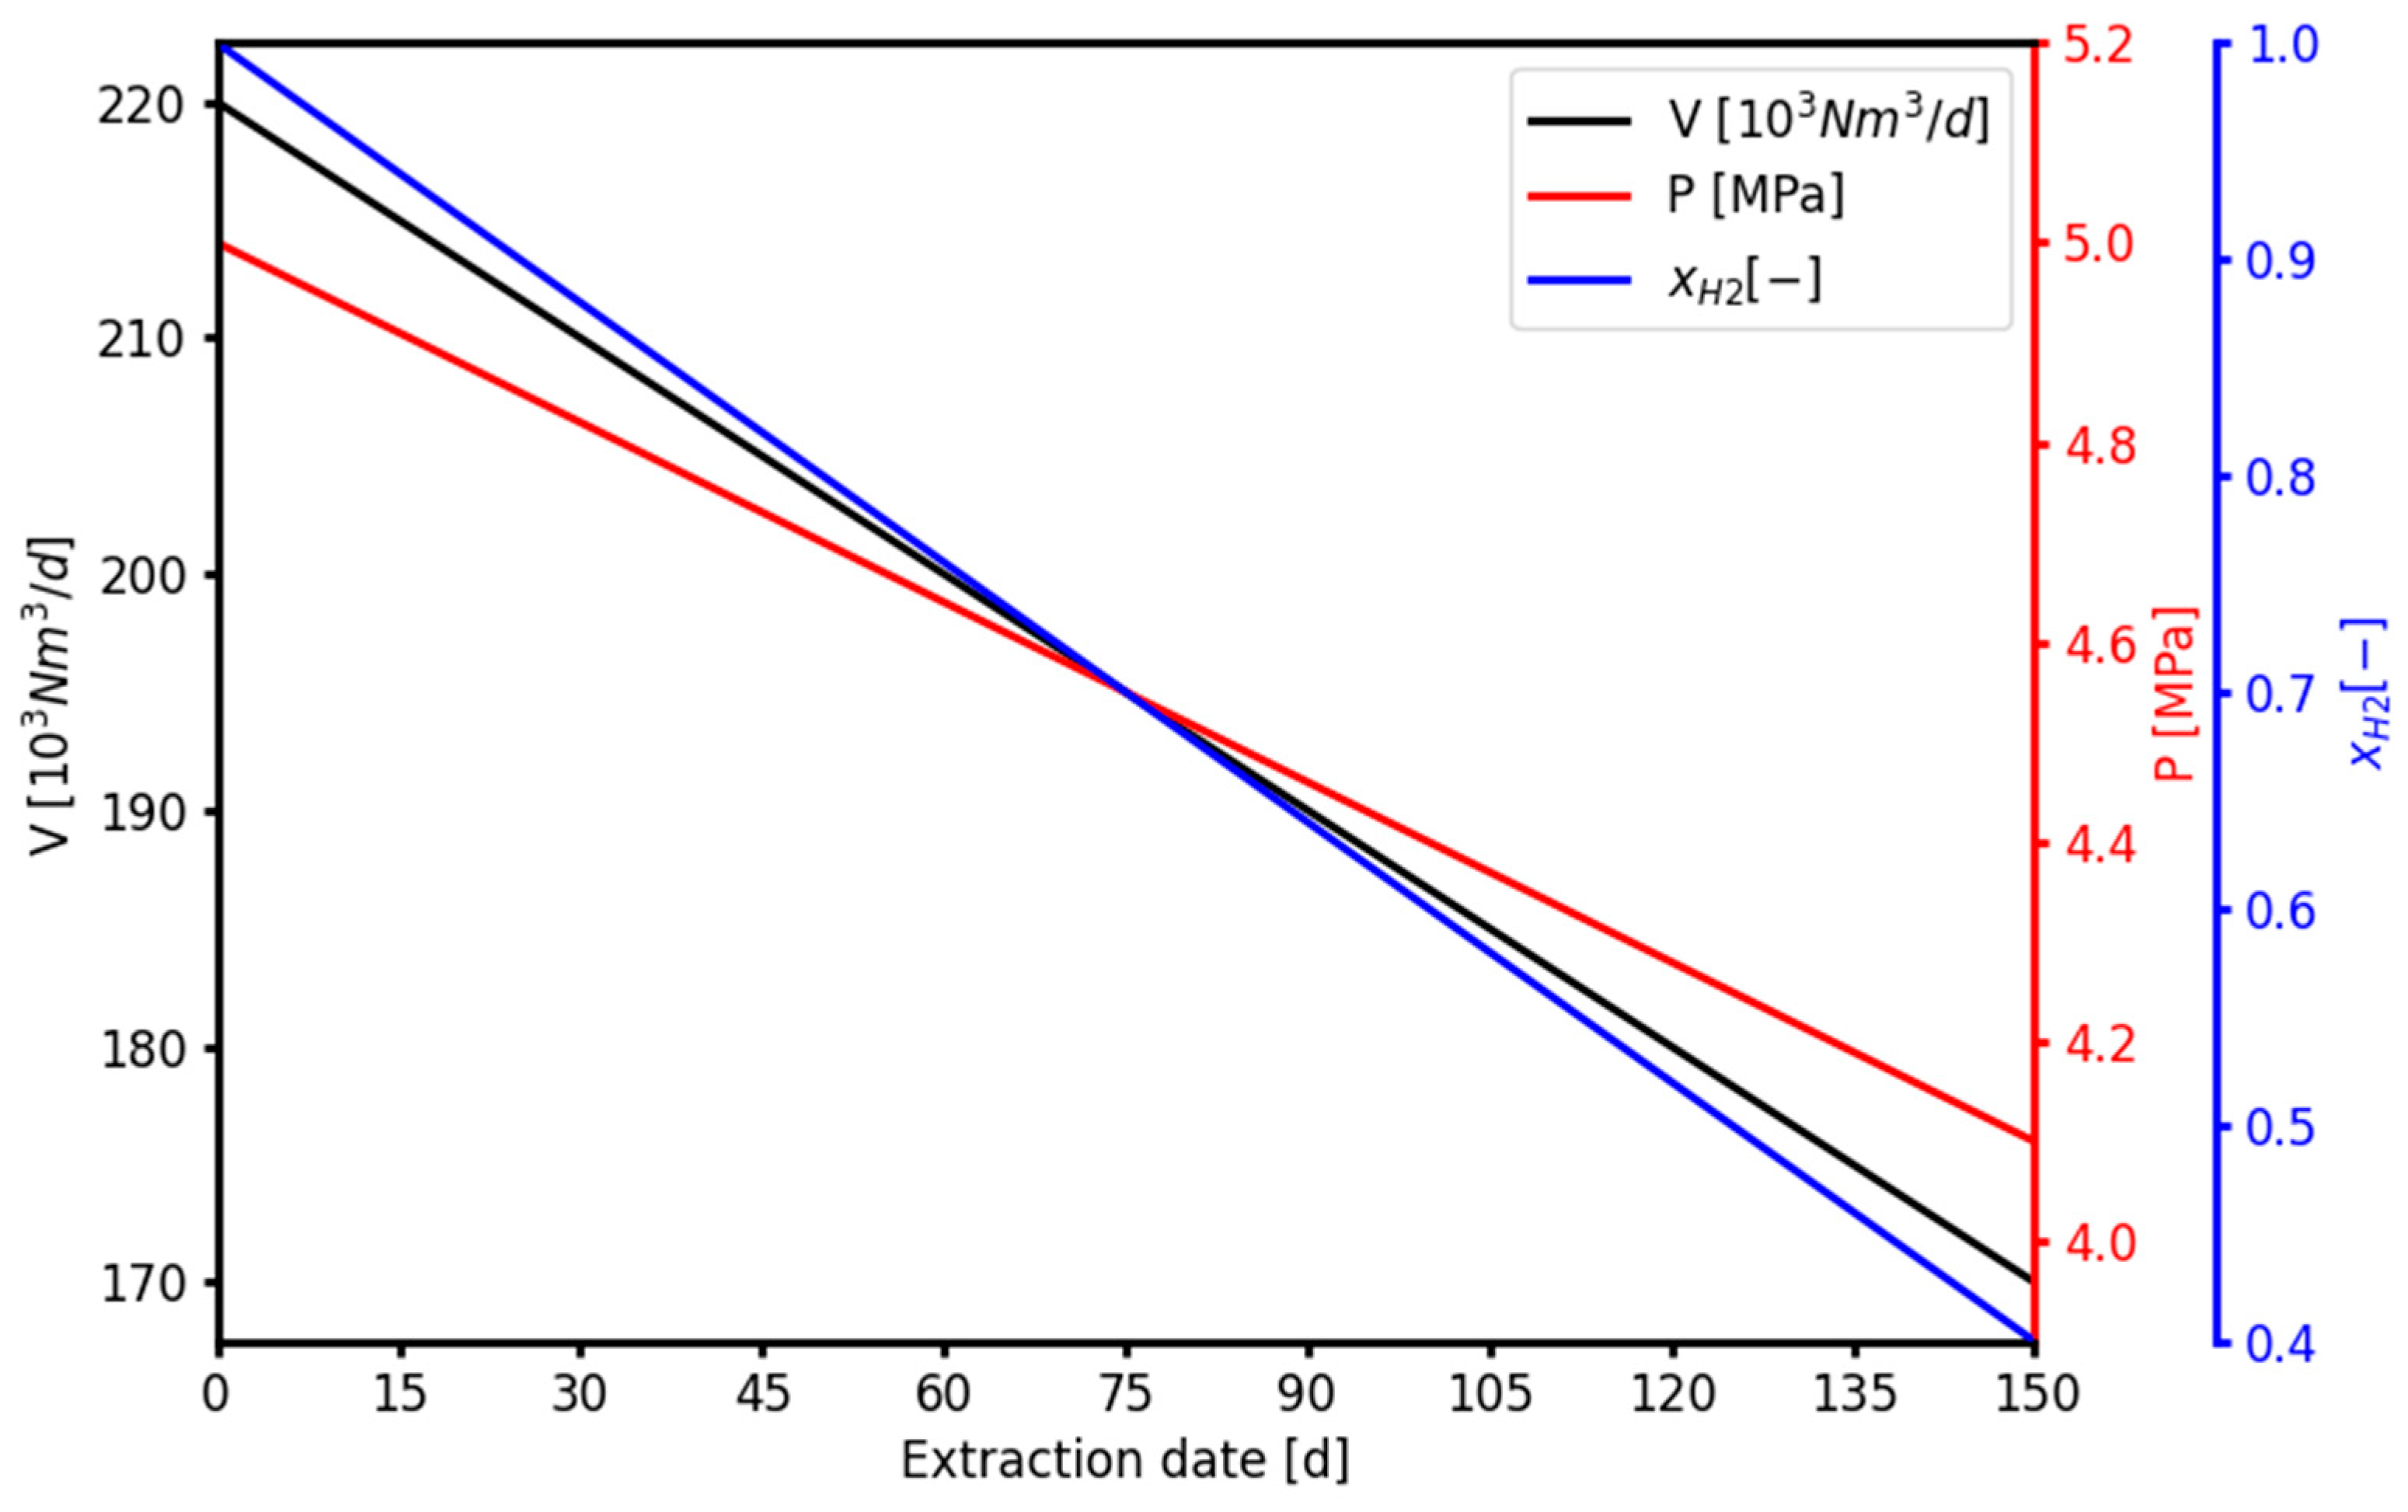
The remaining content of the withdrawn gas mixture consists of natural gas, and its composition is detailed in Table 2. The values in Table 1 and Table 2 are based on the nominal operating data combined with available estimates provided by Nafta a.s. Throughout the withdrawal period, the temperature of the extracted gas is assumed to be constant at 15 °C. The upper and lower limits specified in Table 1 define the boundary conditions for the withdrawal period. It is anticipated that the gas mixture will show similar behavior to natural gas during seasonal storage in depleted natural gas fields, meaning that the upper limit corresponds to the initial stage of withdrawal, with all key parameters expected to decrease throughout the withdrawal period. The process concludes upon reaching the lower limit, with this decline assumed to be linear over a duration of 150 days, as depicted in Figure 1. The trends shown here were constructed from the nominal operating data and available estimates provided by Nafta a.s.
Figure 1.
Linear decrease in the volumetric flow rate, pressure and hydrogen content of the extracted gas during the extraction operation.
Two target hydrogen purities were established for the examined separation process: a low-purity hydrogen with a mole fraction of 98%, and a high-purity hydrogen with a mole fraction of 99.8%.
2.2. Mathematical Model of Membrane Module
The mathematical model of membrane separation utilized in this study is based on the counter-current hollow-fiber membrane model reported by Chu et al. [18], which was adopted here for multicomponent hydrogen–natural gas separation. The following considerations and assumptions were applied in the development of the model:
- Perfect counter-current flow patterns near the ends of hollow fibers, and uniform axial flow to simplify the transport model.
- Gas flows in both, feed and permeate side are in plug flow mode, and the radial velocity distribution is not taken into account.
- Ideal gas assumption was considered and isothermal conditions along the membrane module.
The permeation of a multicomponent gas mixture through a hollow fiber membrane module is modeled under a counter-current flow configuration, with the permeation direction defined as the positive z-axis. The feed stream enters the shell side of the module, while the permeate exits through the fiber side. The mathematical model of the membrane module in the steady state is described by the following equations, adapted from Chu et al. [18].
Feed side molar flow rate:
Permeates side molar flow rate:
Feed side pressure drop:
Permeate side pressure drop:
In Equations (1) and (2) uxi and vyi are the molar flow rates of each component in retentate and permeate respectively; z is a spatial coordinate. D0 is the outer diameter of the hollow fiber; Qi is the permeability of every component. P and p are retentate and permeate pressures; xi and yi are mol fractions in retentate and permeate. The pressure drop for the differential element for the feed side is calculated via Equation (3) and for the permeate side using Equation (4). N represents the number of fibers inside the membrane module. R is the universal gas constant, T is the thermodynamic temperature, µm represents the dynamic viscosity of the gas, and Di is inner diameter of the hollow fiber. The boundary conditions for the counter-current flow configuration were adopted from Chu et al. [18] and are expressed by Equations (5)–(7).
Feed side:
Permeate side:
An important parameter in the calculation of the membrane module is the specific surface area, Φ. This parameter represents the number of square meters of the membrane surface area contained within one cubic meter of the module. This relationship, adopted from Chu et al. [18], is defined by Equation (8).
The mathematical model of the membrane module is formulated as a system of ordinary differential equations, with the total number of equations given by 2NC + 2, where NC denotes the number of components in the gas mixture. Viscosity is a critical parameter within this model and must be determined separately for each side of the membrane module, as it varies with differing compositions and pressures of the gas mixture. The dynamic viscosity μm, shown in Equation (9), was calculated for both the feed and permeate sides using the correlation proposed by Yang et al. [19], with additional thermophysical background taken from Mokhatab et al. [20].
Additionally, the empirical parameters for gas viscosity calculations K, X and Y are determined according to Equations (10), (11) and (12), respectively. The resulting viscosity μm, calculated from Equation (9), is in mPa.s [19,20]. In Equation (9), the gas density of ρg in g/cm3 is calculated using the ideal gas law.
2.3. Mathematical Model of PSA Unit
The mathematical model of the PSA unit is based on the work of Lee J. et al. [21]. The following assumptions were applied in the development of this model:
- The gas phase is treated as an ideal gas mixture.
- Radial concentration and temperature gradients are considered negligible.
- Thermal equilibrium between the adsorbent and the bulk gas phase is assumed.
- The flow pattern is described by an axially dispersed plug flow model.
- Axial heat conduction in the wall is neglected.
The equilibrium behavior of adsorption was described using the Langmuir isotherm (13).
The temperature dependence of parameters qm and B is given by Equations (14) and (15), respectively. Subscriptions i and j denote the individual components within the gas mixture, while parameter NC represents the total number of components present in the separated gas mixture. Coefficients k1 to k4, as utilized in Equations (14) and (15), define the temperature dependence of the Langmuir isotherm parameters for each component in the gas mixture.
The adsorption kinetics were described using the linear driving force model (LDF). In Equation (16), parameter ω represents the single lumped mass transfer coefficient. Additional details regarding this approach can be found in the work of Sircar S. et al. [22].
Parameter qi* represents the amount of adsorbed component in the equilibrium state, while qi denotes the amount adsorbed at a given time and its position within the adsorption column. For the calculation of mass balance, a partial differential equation was formulated for each component (17). An overall mass balance for gas phase was also applied (18).
In this context, DL denotes axial dispersion coefficient, w is the interstitial velocity, ρP represents the particle density, and εb is bed porosity.
The energy balance for the gas phase in the adsorption column is given by the following equation
where CPg is the heat capacity of the gas phase, CPs is the heat capacity of the adsorbent particle, KL is the coefficient of axial heat dispersion, ΔHi, is the adsorption heat of each component, hin is the heat transfer coefficient, Rin is the inner radius of the adsorption column and TW is the temperature of the wall of the adsorption column. Heat radiation from the walls of the adsorption column is given by Equation (20):
where ρW and CPW are the density and heat capacity of the wall, respectively; SW is the cross-sectional area of the adsorption column; RO and hO represent the outer radius of the column and the heat transfer coefficient. Tatm is an ambient temperature. The pressure drop across the bed is determined using Ergun’s equation, as given below (21):
where RP is the particle diameter, w is the interstitial velocity, εb is the bed porosity, μm is the gas viscosity and ρq is the gas density. The boundary and initial conditions for the material and energy balances of the PSA cycle, as well as for the ordinary differential Equation (21), along with its corresponding initial condition, are provided in Table 3.
Table 3.
Initial and boundary conditions for adsorption and desorption steps.
The mathematical model requires a total of 2NC + 4 partial and ordinary differential equations. To solve the partial differential equations, spatial discretization and numerical approximation techniques were employed, effectively converting each PDE into a system of ODEs. Matlab’s built-in ODE solver, ode15s, was utilized for the computation of time derivatives, while the spatial derivatives were addressed using numerical approximation methods, including backward, forward and central difference schemes.
The purity of hydrogen at each point during unit operation is determined from the breakthrough curve of the adsorption step. The yield of hydrogen YH2 in the PSA unit is calculated using Equation (28).
where nadsp is the product rate during adsorption, ndesp is the product rate during the desorption step, nadsf is the feed flow rate for the adsorption step, yH2 is the mole fraction of hydrogen in the product gas, and yH2f is the mole fraction of hydrogen in the feed [1,23]. The average purity of hydrogen yH2avg obtained from the PSA unit is calculated using Equation (29).
where ntot is the total molar flow at each discretization time point, and yH2 is the mole fraction of hydrogen at each discretization time point [24].
2.4. Input Data for the Membrane Module Calculation
The parameters of the membrane module were obtained from the literature review. The specific values used in this work are listed in Table 4. They are used for the description of the internal geometry of the membrane module.
Table 4.
Geometry defining the parameters of the simulated membrane module.
The length of membrane module L was specified to be 1 m and the outside diameter of the membrane module D was 0.3 m [18,27]. The permeabilities Qi of all components through the membrane module were constant and taken from the literature. The specific values applied in this study are presented in Table 5, along with their corresponding references. Due to insufficient data for n-Butane, n-Pentane, i-Pentane, and n-Hexane, these components were excluded from the model. The gas mixture composition was therefore recalculated in a simplified form without these components, as presented in Table 5.
Table 5.
Simplified NG composition and permeabilities of each component of the mixture.
The composition of natural gas (NG) in Table 5 was simplified compared to the natural gas composition presented in Table 2 because of the lack of permeability data for, n-Butane, n-Pentane, i-Pentane and Hexane. All the other calculations in this work were made for the composition of NG, as shown in Table 5. This simplification also reduced the number of equations used in the mathematical models, thus leading to reduced computational times.
2.5. Input Data for Pressure Swing Adsorption Calculations
Two most important steps in the Skarstrom cycle are adsorption and purge. The other two steps, pressurization and blow down, are shorter and predominantly connected to the pressure change, and they are not important for column sizing. The parameters for the temperature dependence k1, k2, k3 and k4, the lumped mass transfer coefficient ω and the heat of adsorption ΔH for every component of the gas mixture are listed in Table 6, together with their respective references. Two different adsorbents were used for the purification of hydrogen; this was necessary due to the nitrogen and carbon dioxide content in the withdrawn gas. Most of the column was filled with activated carbon and only one fifth comprised zeolite. Activated carbon is best-suited for the removal of hydrocarbons. The layer of zeolite is mostly for nitrogen and carbon dioxide removal. Feed gas is first fed to the layer of zeolite and afterwards fed to the layer of activated carbon.
Table 6.
Parameters of isotherm, heat of adsorption and mass transfer coefficient.
The parameters of these two adsorbents were taken from the literature, as well as the geometry of the adsorption column. The specific values used in the calculations are listed in Table 7 and Table 8, along with their corresponding references. Parameter Ψ represents the fraction of the adsorption column volume occupied by the corresponding adsorbent.
Table 7.
Parameters of used adsorbents.
Table 8.
Parameters of adsorption columns.
3. Results and Discussion
3.1. Membrane Sensitivity Analysis
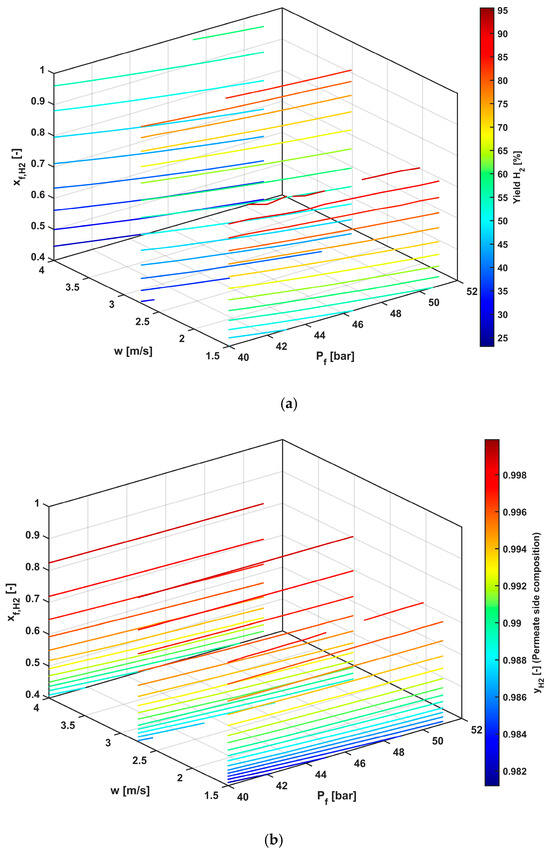
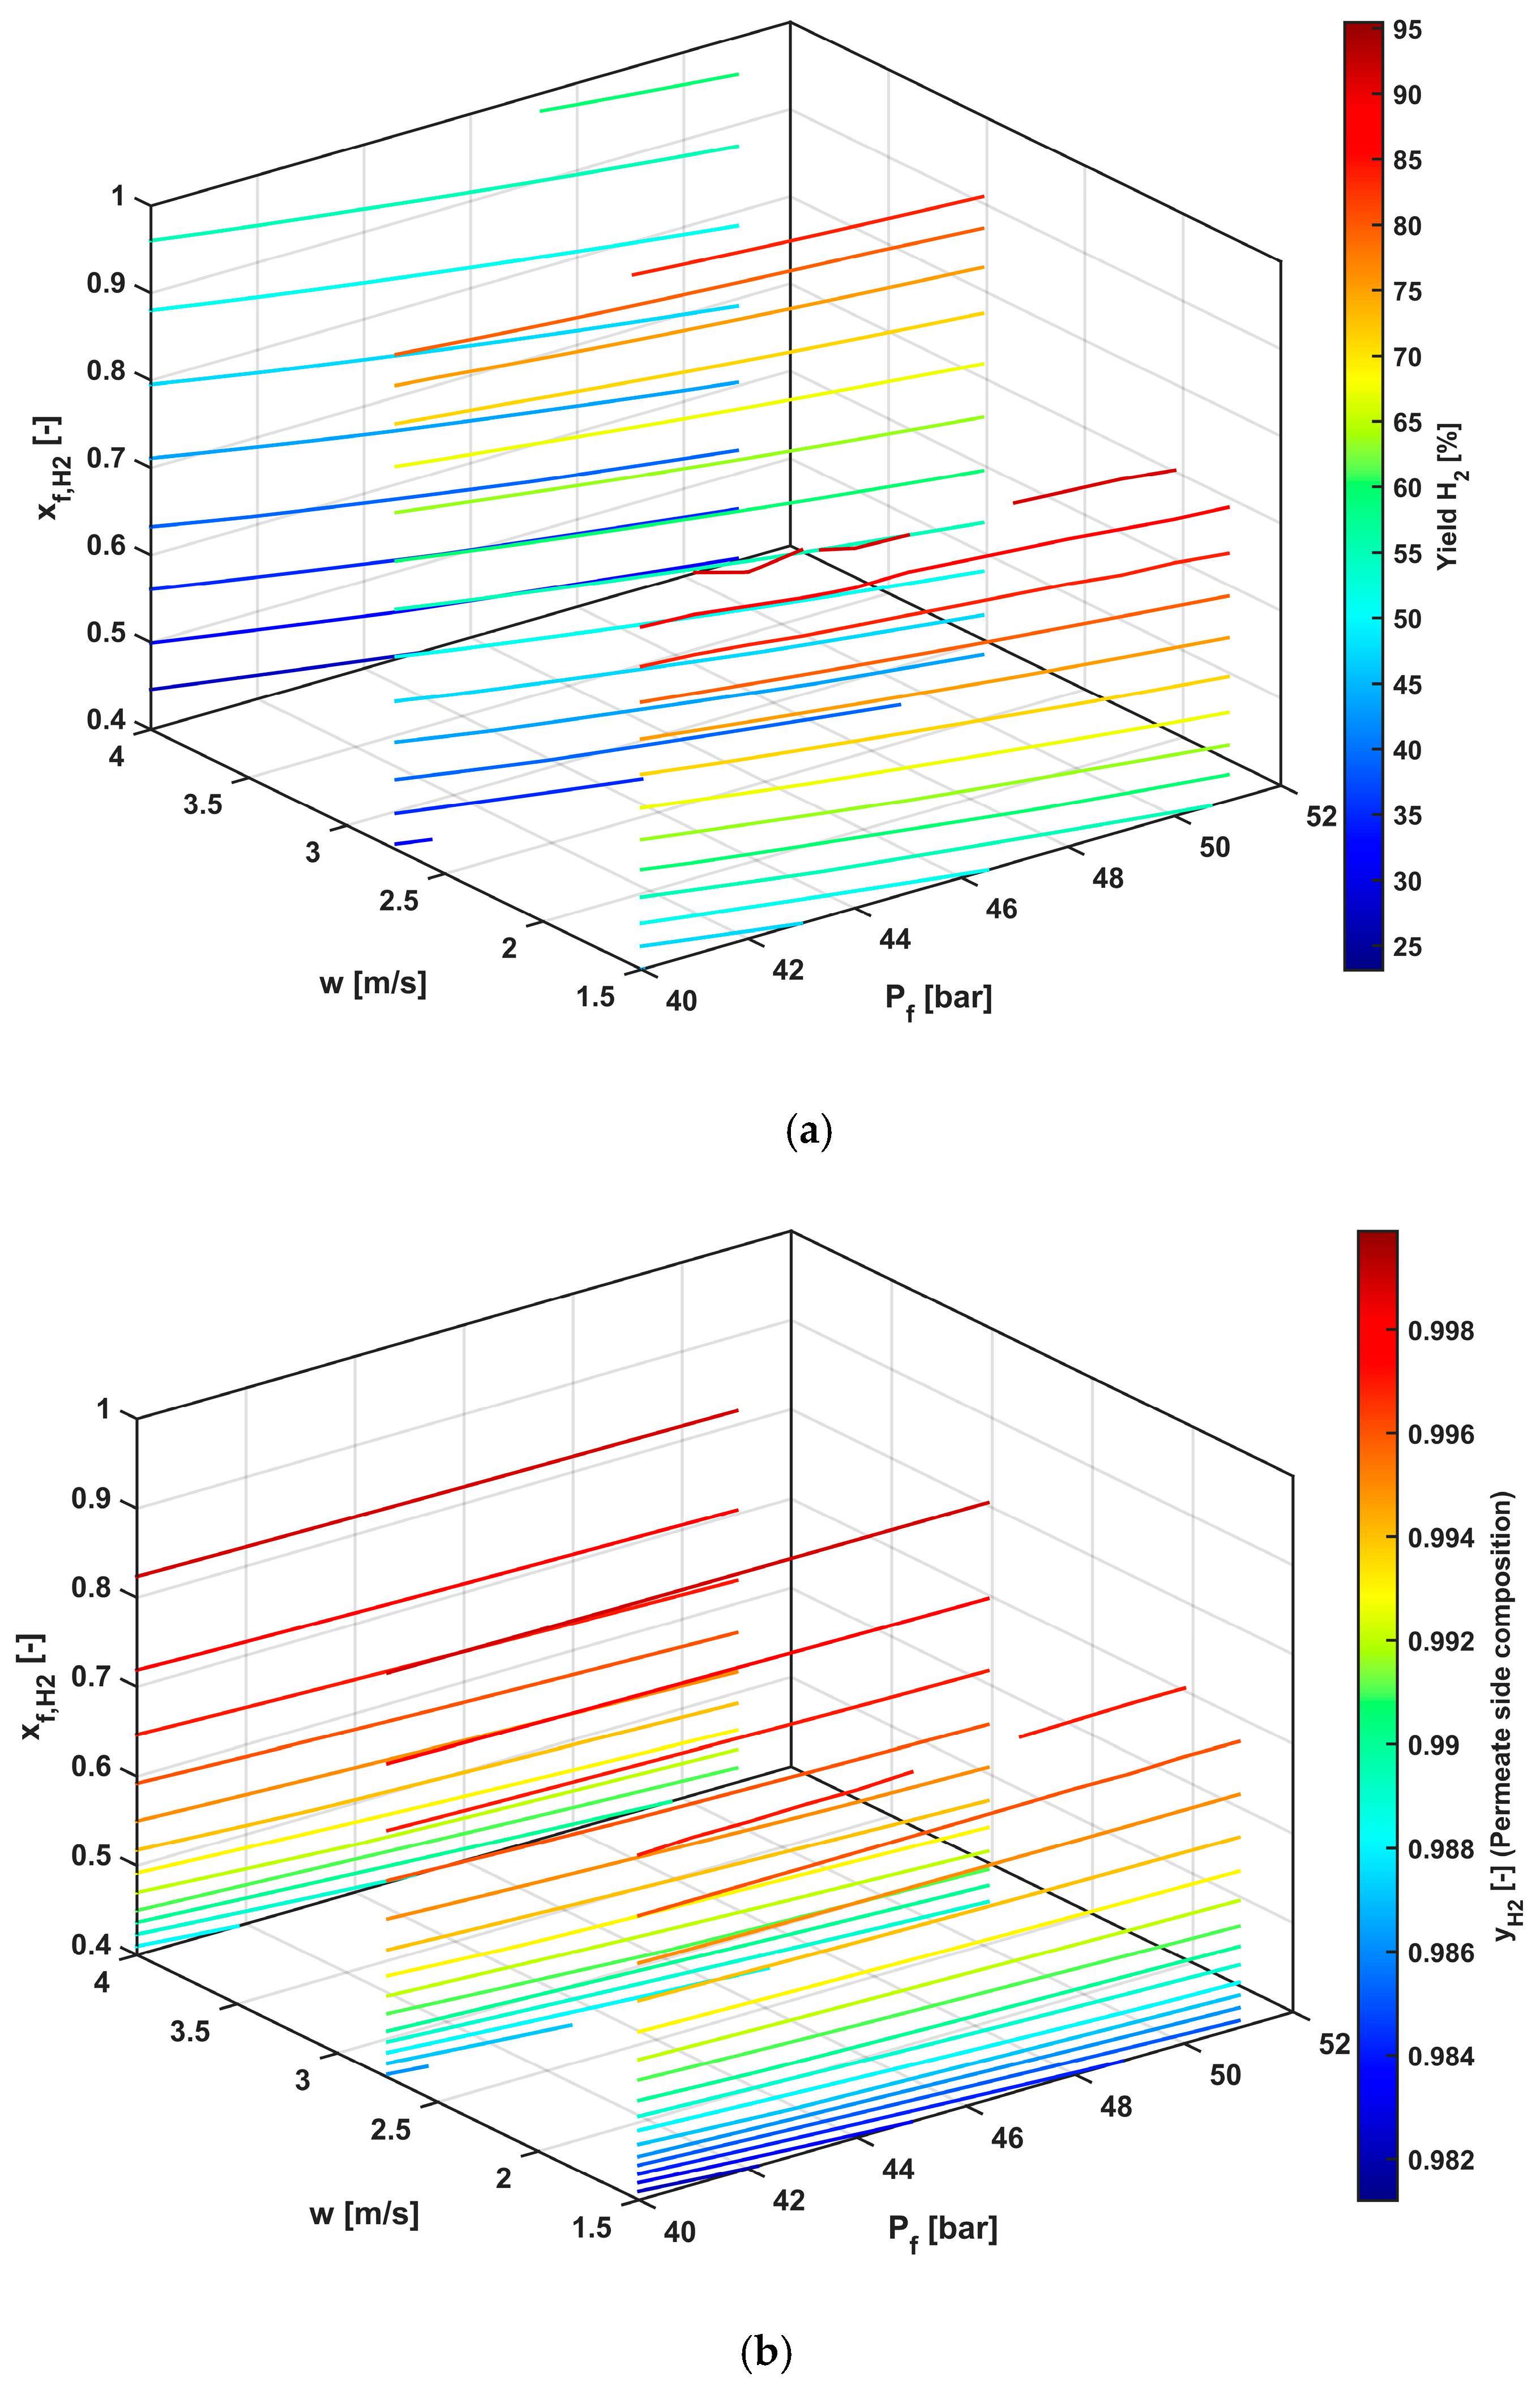
To comprehensively evaluate all possible scenarios during gas withdrawal from the reservoir, the full range of parameters from Table 1 was simulated, which defined a 3D space of input parameters within the specified boundaries. The volumetric flow rate was recalculated to the interstitial velocity of the feed stream for the given membrane module geometry used in the analysis. The pressure and hydrogen content ranges from Table 1 were considered additional specifications of the feed stream. Therefore, all possible combinations of feed velocity (x-axis), pressure (y-axis), and hydrogen content (z-axis) are represented within the 3D domain shown in Figure 2. To visualize the results in terms of hydrogen yield (Figure 2a) and hydrogen content in the permeate stream (Figure 2b), three planes at a fixed velocity were inserted into the domain of the feed parameters. These planes contain isolines connecting identical values of hydrogen yield and purity, encoded by the color scale. All calculations were carried out for a fixed permeate pressure of 10 bar. This analysis was intended to test the full operating window expected during gas withdrawal. Its purpose was to identify how the membrane unit responds to the entire range of relevant feed states and to determine whether membrane separation alone can provide a sufficiently stable and hydrogen-rich stream.
Figure 2.
(a) Purity of H2 in the permeate stream for the specified module internal geometry and the whole withdrawal period; (b) Purity ofH2 in the permeate stream for the specified module internal geometry and the whole withdrawal period.
The results of the simulations show that at the beginning of the extraction period, with the feed pressure of 50 bar and feed hydrogen content close to 100%, interstitial velocity plays an important role in the overall yield of hydrogen. This is caused by the fact that hydrogen is the first to be transported through the membrane and is collected in the permeate side of the membrane. As the flow velocity increases, the residence time of the extracted gas in the module decreases; thus, there is not sufficient time for hydrogen to pass through and a large portion is lost in the retentate. This effect also plays an important role in the purity of the hydrogen in the permeate. The highest purities are obtained in the region of the highest velocities through the membrane module and a decrease can be observed towards slower velocities, while the feed composition and pressure remain constant. In this case, a longer residence time in the module also allows for other molecules to pass through the membrane, decreasing the purity of hydrogen in the permeate stream. It should be noted that at low velocities and high feed hydrogen contents, a complete permeation of hydrogen through the membrane fibers can occur, which can lead to numerical instabilities in the simulation, represented by the missing parts of the isolines in Figure 2.
The results of the simulation also show that a decrease in the feed pressure leads to a decrease in the yield, as this directly affects the driving force of the mass transfer, while at the same time, the purity of the hydrogen is not that significantly affected (the isolines are almost parallel with the y-axis). Lastly, the change in the feed content of hydrogen causes a significant decrease in the yield of hydrogen while the decrease in the purity of hydrogen is much smaller.
This analysis shows that the key factor influencing separation is the velocity of the extracted gas within the membrane module. This velocity can be affected by the internal geometry of the module, as well as by the number of parallel membrane modules employed when large volumes of gas are processed.
3.2. First-Stage Membrane Separation
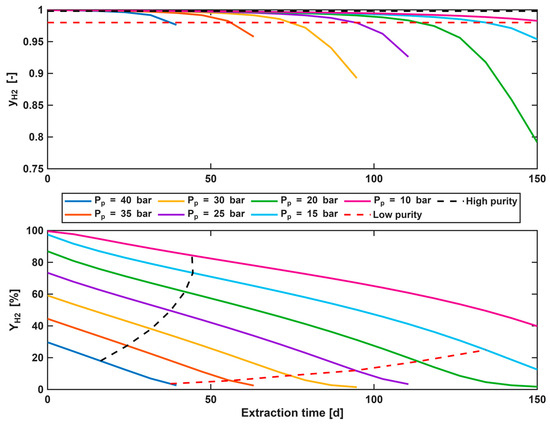
The separation of hydrogen from the mixture of extracted gas during the 150 days of extraction using the membrane module specified in Table 1 is depicted in Figure 1. Different solid lines represent the purity and yield of hydrogen reached at different permeate pressures. The upper part of Figure 3 shows hydrogen purity and the lower part shows the hydrogen yield during the extraction process. Both graphs in Figure 4 have two dashed lines, black and red dashed lines, representing the high- and low-purity requirements specified in Section 2.1, respectively.
Figure 3.
Purity and yield dependence during gas extraction for different permeate pressures in the membrane module.
Figure 4.
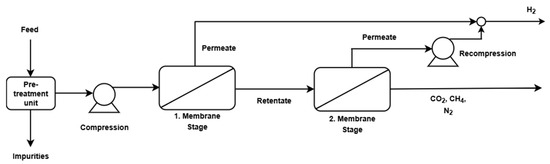
Scheme of two-stage membrane separation.
As the feed hydrogen content, feed pressure, and volumetric flow rate decrease during the extraction period (Figure 1) the hydrogen purity and yield in the permeate also decrease for all considered permeate pressures (Figure 3). High-purity requirements were, for all permeate pressures, only met for about the first 15 to 40 days of operation depending on the given pressure. This graph also shows that as the permeate pressure increases, the hydrogen yield in the permeate stream decreases, which is caused by a lower driving force for mass transfer. Low purity could be reached in wider range of withdrawal period depending on the chosen permeate pressure. To satisfy high-purity requirements for a longer period and to improve overall hydrogen yield we can use a second membrane module and/or PSA unit. Both options were analyzed in this work. In Section 3.3, the second membrane module was used, and in Section 3.5. the PSA unit was used.
Figure 4 shows that multiple permeate pressures are applicable throughout the entire withdrawal period. However, the hydrogen yield at the end of the withdrawal is low. The highest yield in the single-membrane stage would be obtained by using a permeate pressure of 10 bar. After the yield decreases below the specified value, a second membrane stage would be necessary to maintain the desired yield of hydrogen.
3.3. Second-Stage Membrane Separation
To increase overall H2 yield, a simulation of the second membrane stage was performed. Two membranes were connected in series, where retentate from the first stage was fed to the second membrane stage, as depicted in Figure 5. For this calculation, it was assumed that the permeate pressure in the second membrane stage could theoretically be set, at a maximum, as equal to that in the first stage. Setting the operation of the second membrane stage at a higher permeate pressure than that used in the first stage does not make much sense, as the second stage would then operate with a lower driving force for hydrogen mass transfer, leading to low yields and purity.
Figure 5.
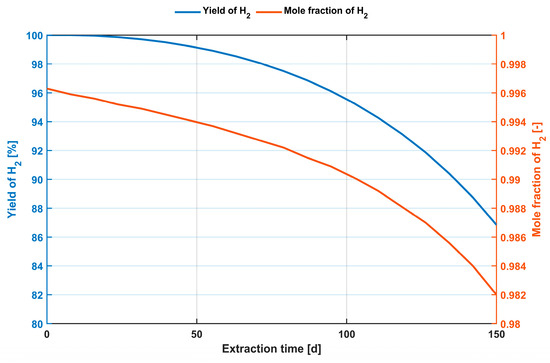
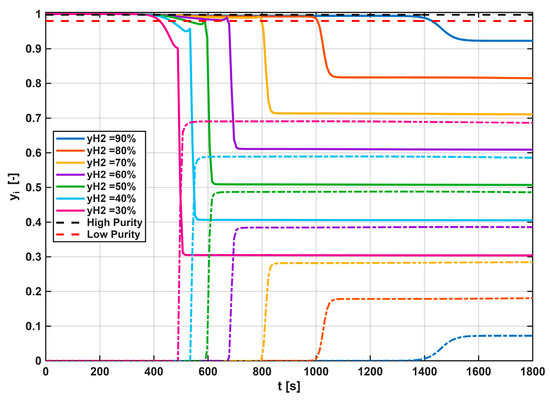
Total yield and mole fraction of hydrogen in the mixed permeate stream for two membrane modules.
For the optimal operation of the two-stage membrane unit, the first membrane stage should be operated at the highest possible permeate pressure in the first days of withdrawal. Afterwards, a permeate pressure reduction is necessary to maintain a sufficiently high hydrogen yield. The second membrane stage will be necessary after the yield reaches specified limit value. Permeation after the second membrane stage will occur at a lower pressure and will require a compression of at least the same pressure as the permeate from the first membrane stage. In Figure 5, the first membrane stage was considered to operate at a constant permeate pressure of 10 bar, and the second membrane stage was considered to operate at a constant permeate pressure of 2 bar. The total yield and hydrogen purity after mixing the permeate streams from both membrane stages during the extraction period are shown in Figure 5. A purity of 98% is achievable throughout the whole withdrawal period with this membrane configuration. If the high purity of 99.8% is required, the PSA unit has to be used. However, this additional purification step will decrease the overall yield of hydrogen.
3.4. Sensitivity Analysis of Adsorption Column
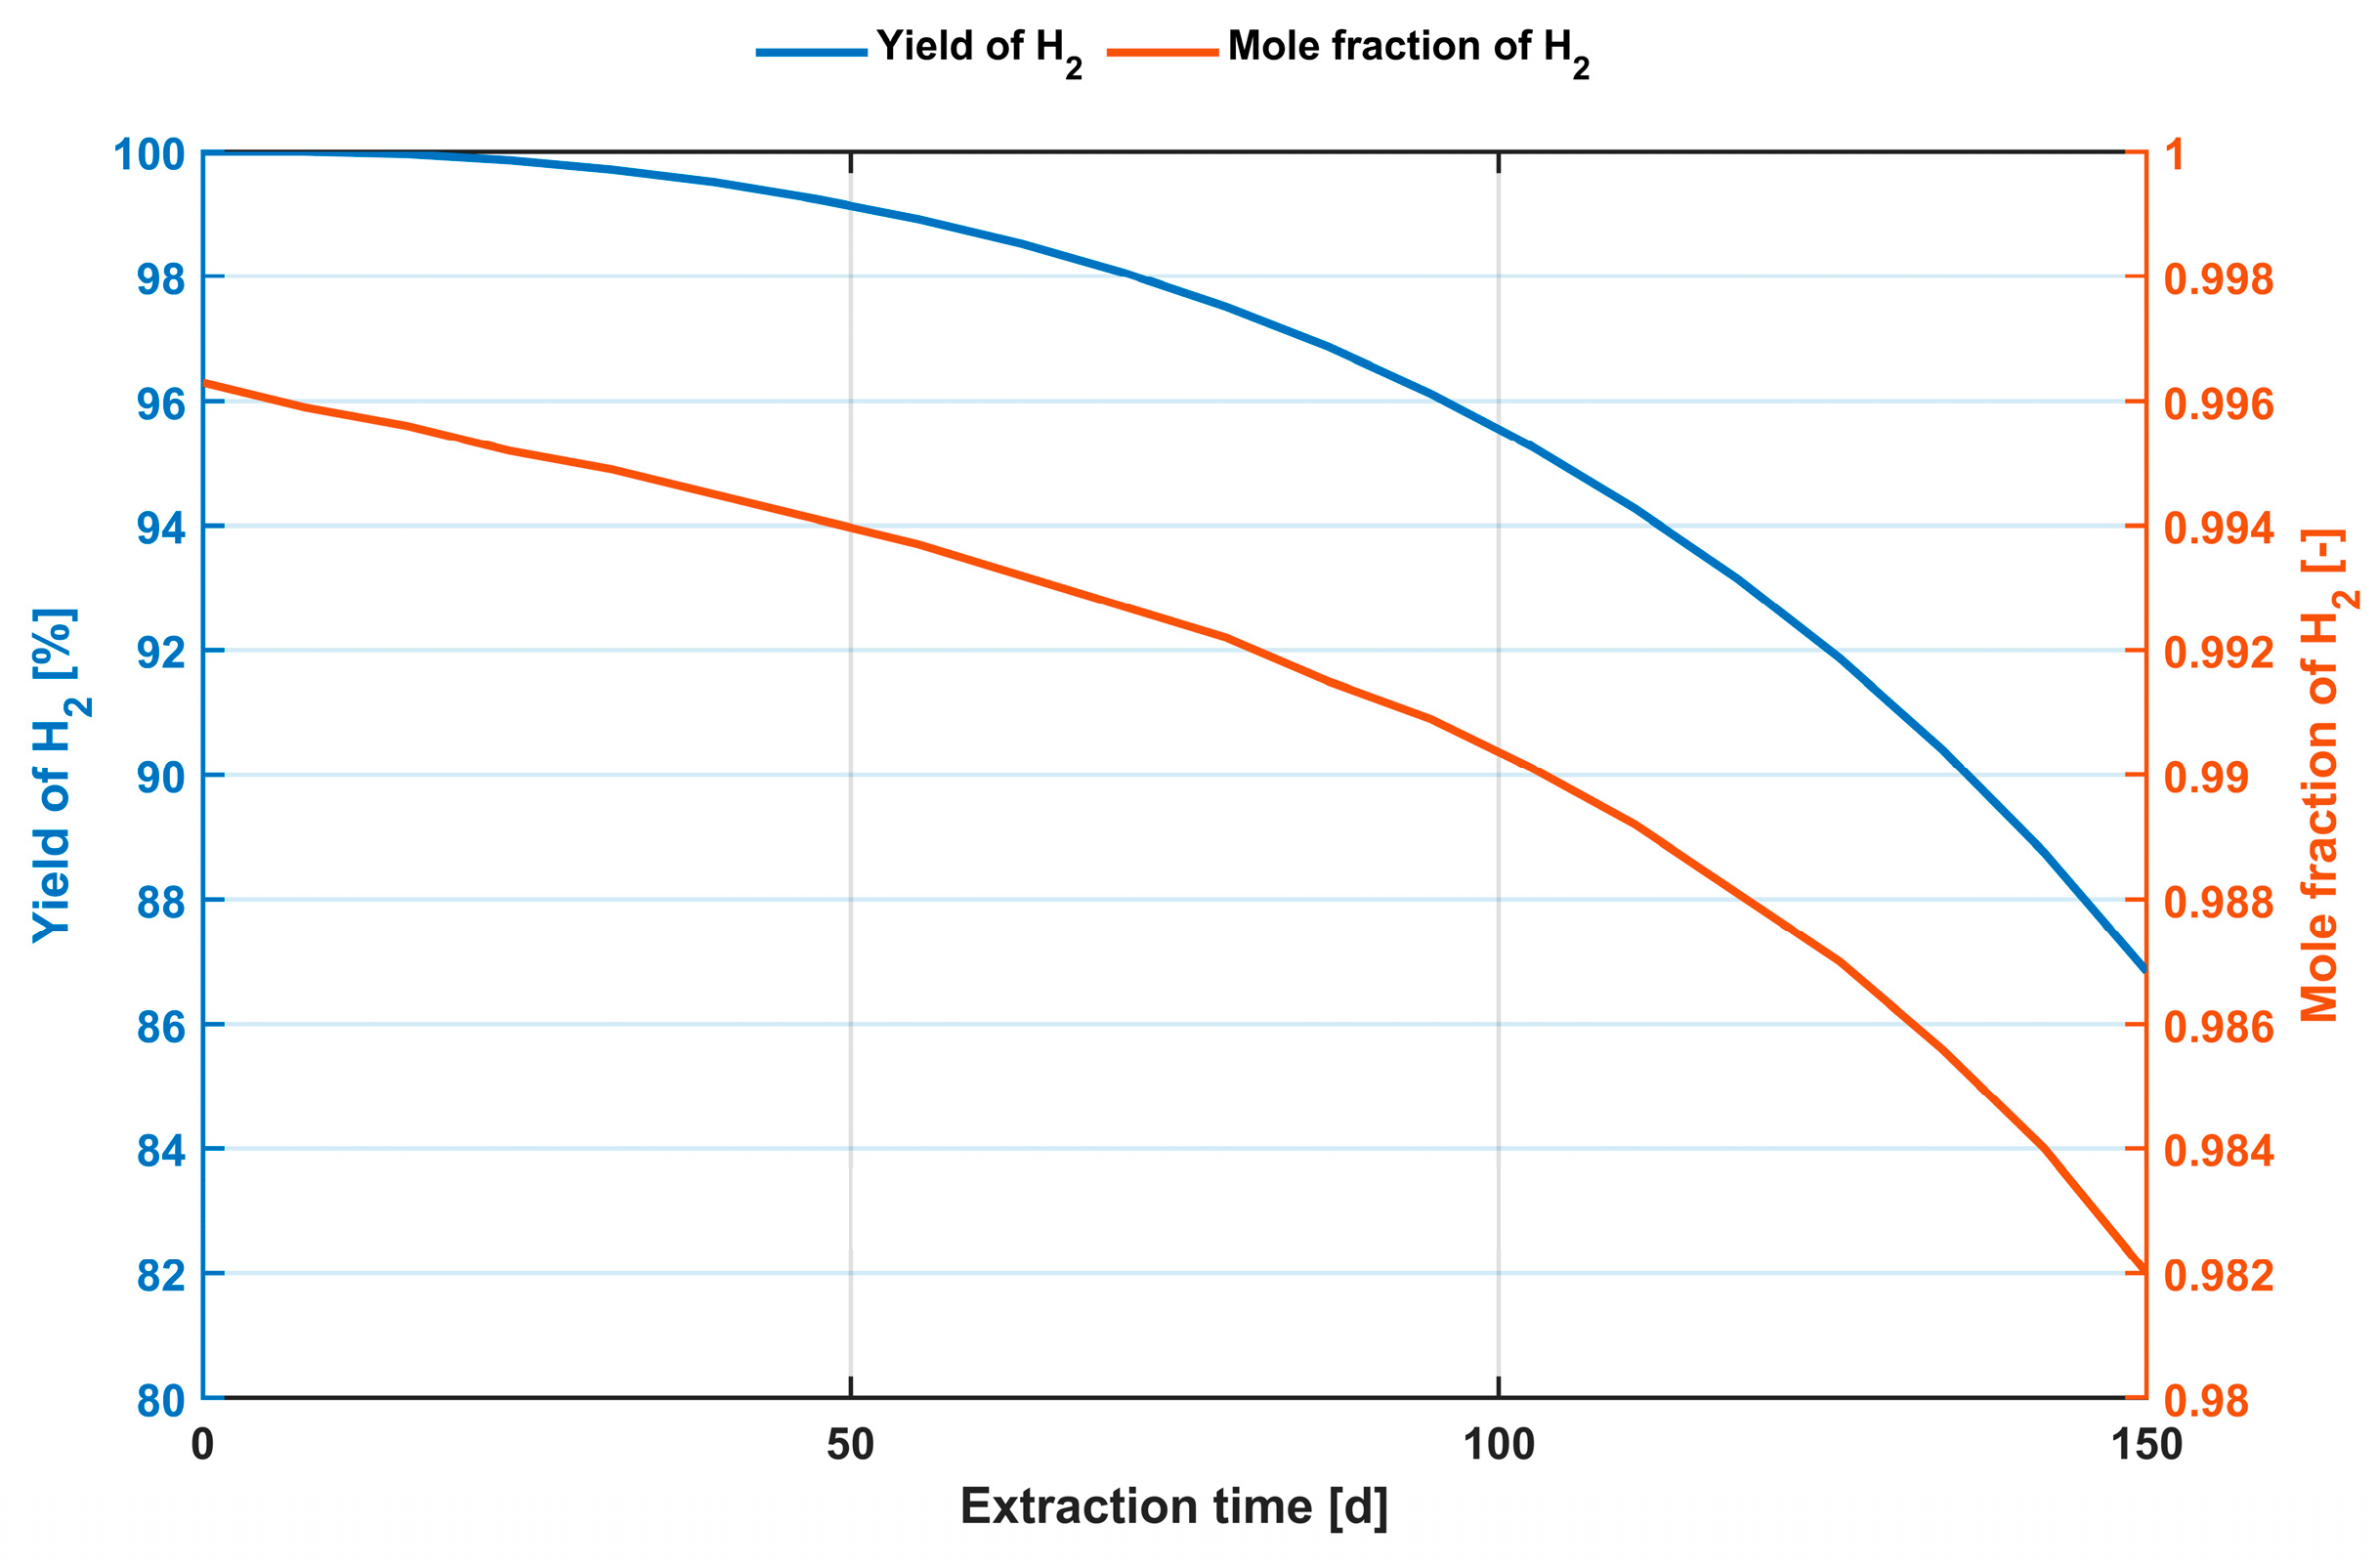
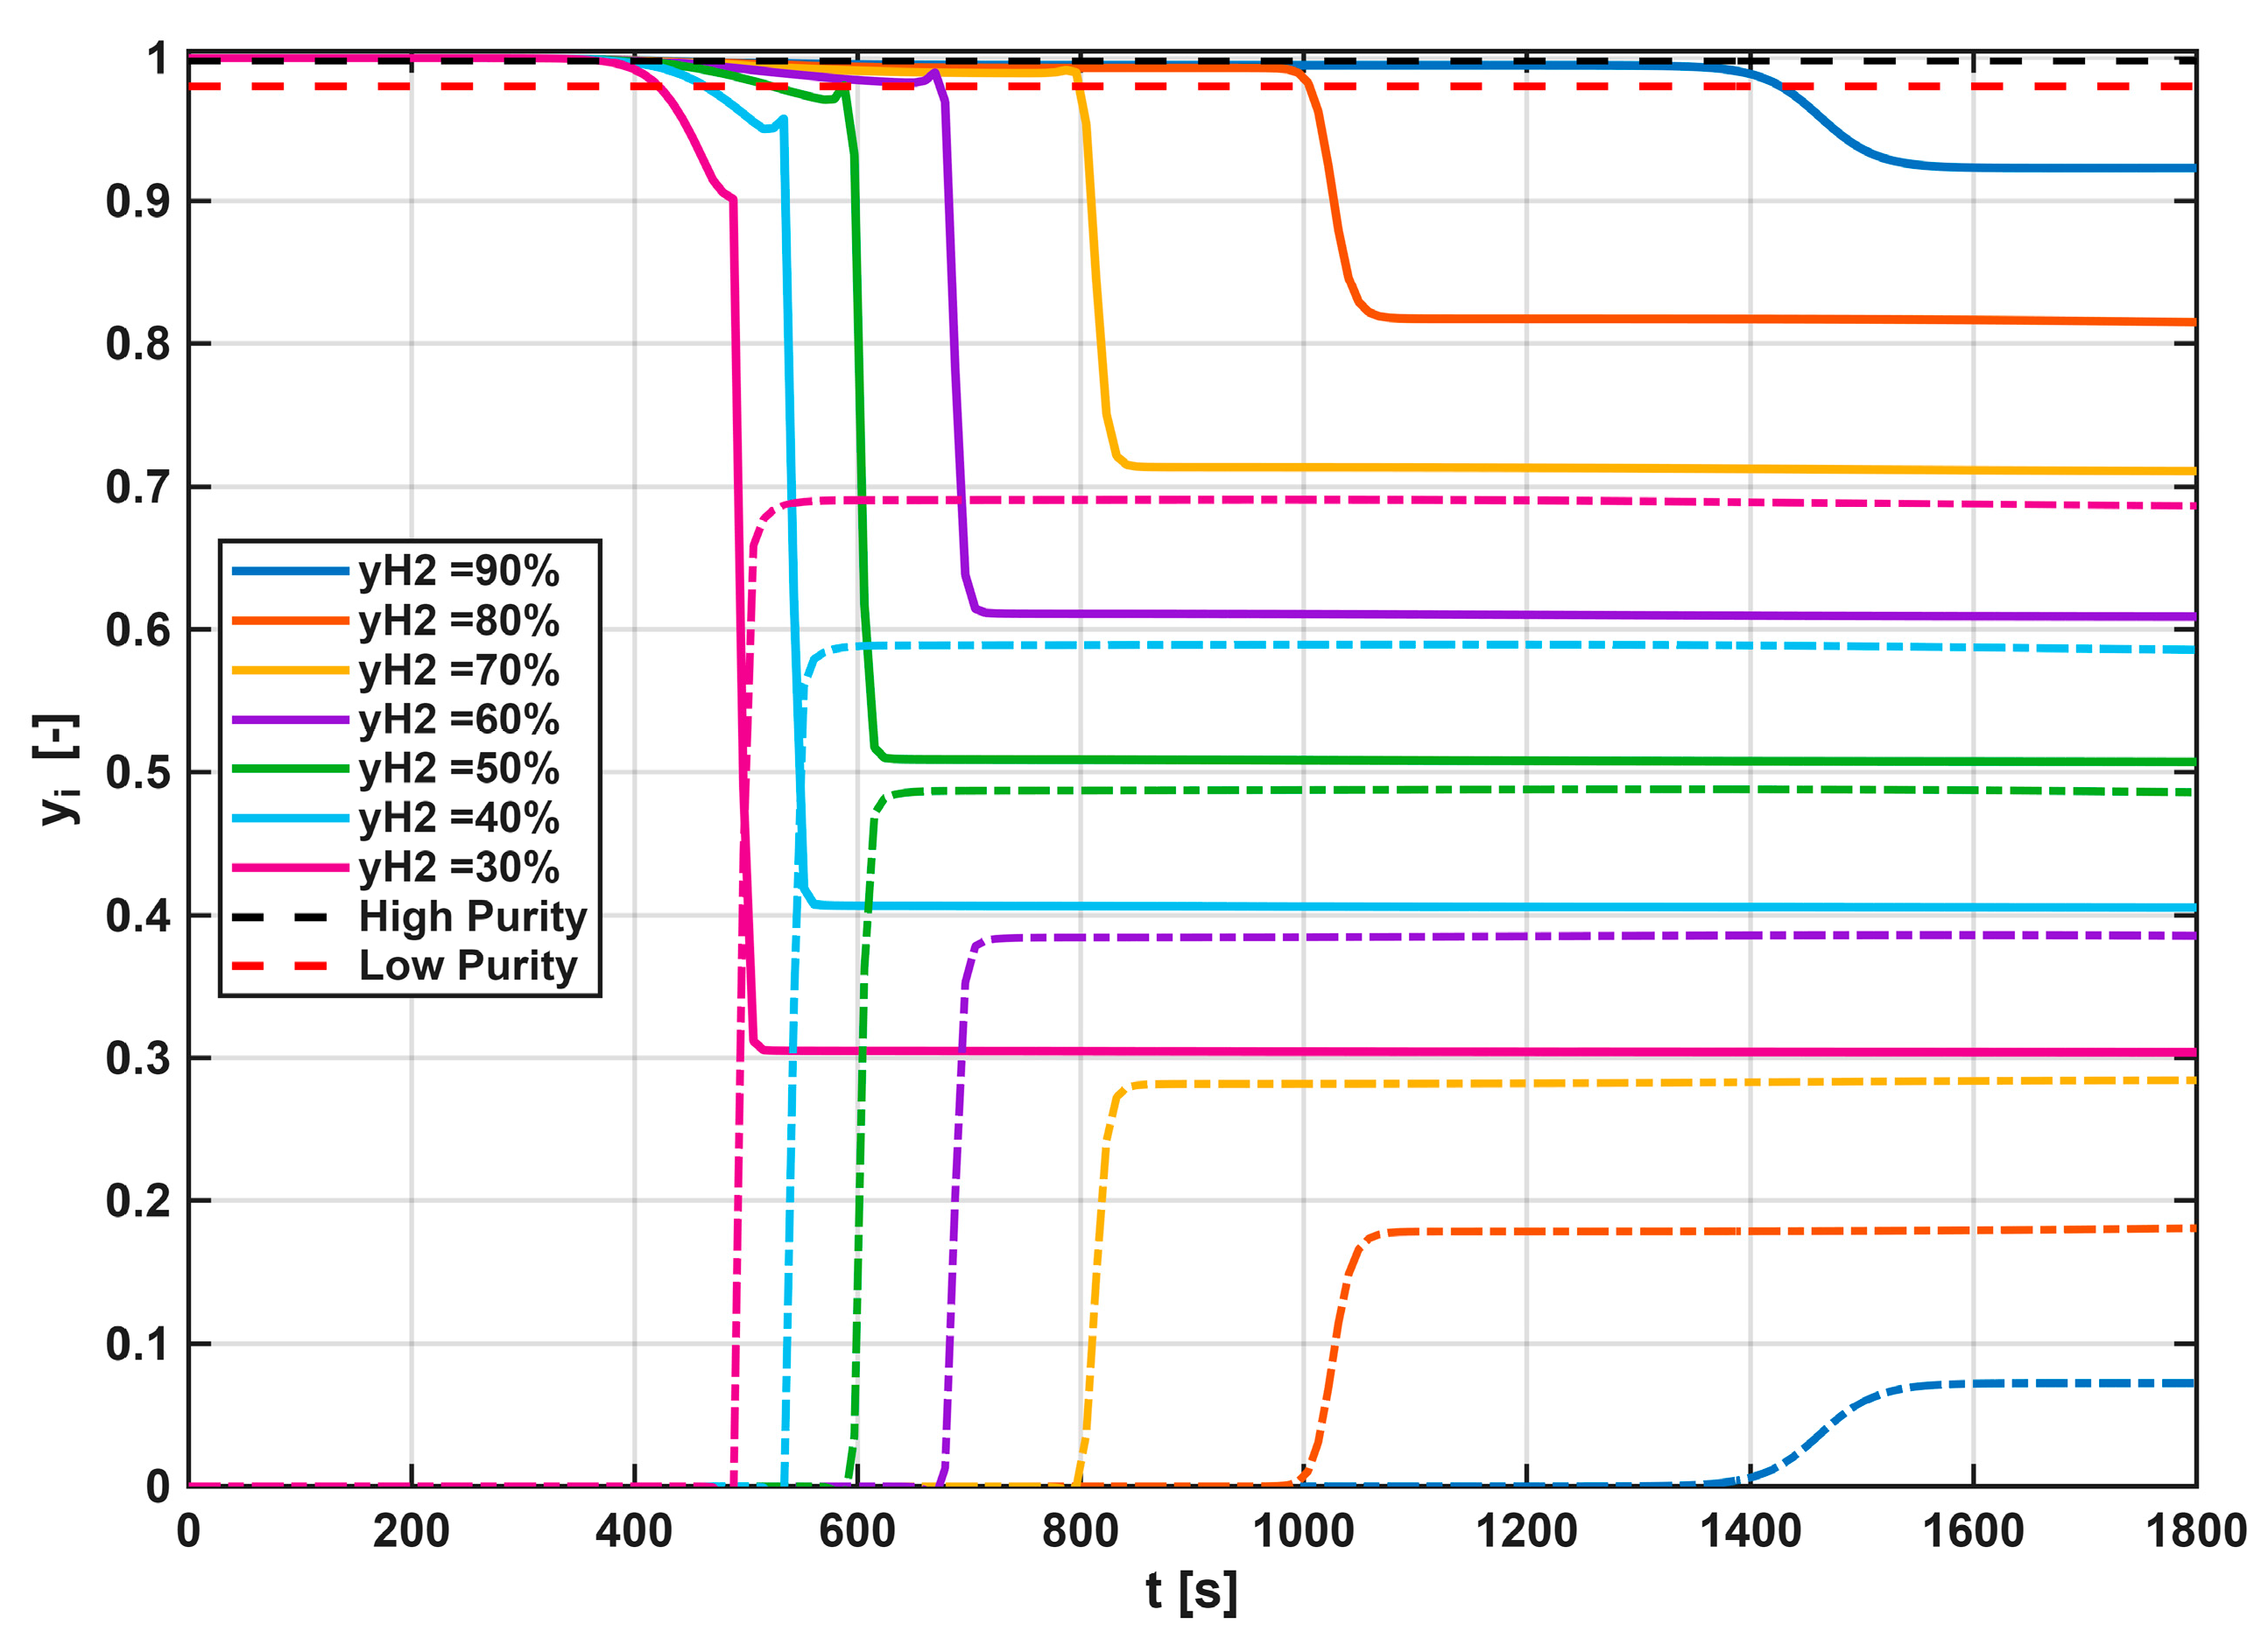
The assembled mathematical model of the adsorption column was first utilized to better understand the behavior of the column under various operating parameters. Since the adsorption column will operate under varying inlet hydrogen compositions, we first examined the effect of different inlet hydrogen contents on the shapes of the breakthrough curves. The results of this analysis are shown in Figure 6 for an adsorption pressure of 45 bar, a molar flow rate of 80 mol/s, and a feed temperature of 288.15 K. Under these conditions, the performance of the adsorption unit can be evaluated if it is used alone, without membrane separation, for hydrogen purification under high- and low-purity requirements.
Figure 6.
Breakthrough curves in adsorption column for different hydrogen content in feed gas with dashed lines representing the high- and low-purity requirements. Solid lines represent the hydrogen mole fraction, while dash–dotted lines represent the methane mole fraction.
Only the breakthrough curves for methane and hydrogen are visualized, as their contents in the extracted gas are the highest. When the feed gas contains 90% hydrogen, the adsorption step can last for more than 20 min. However, when the hydrogen concentration decreases to 30%, the adsorption time must be reduced to approximately 350 s. Under the same volumetric flow rate, a lower hydrogen content in the feed gas requires more frequent cycling of the adsorption columns, which results in increased hydrogen loss and consequently a lower overall hydrogen yield. These results also show that breakthrough curves corresponding to higher hydrogen concentrations in the feed gas mixture exhibit greater axial dispersion compared to those with lower hydrogen concentrations. Hydrogen purification in the adsorption column utilizes the fact that hydrogen does not have a strong affinity toward the adsorbents used, and the column mainly adsorbs all other impurities in the separated gas. Therefore, the focus of the evaluation should be on methane as the main component of the extracted gas and on its breakthrough curve. Higher methane content in the feed produces steeper breakthrough curves, which is commonly explained by the enhanced driving force for mass transfer that increases the saturation rate and shortens the breakthrough time [43]. Thus, an increase in the methane content of the feed produces shorter zones within the column in which the major portion of adsorption takes place (the mass transfer zone), resulting in steeper breakthrough curves and better utilization of the adsorbents [44].
From the perspective of the required hydrogen purity, both purity levels are attainable. However, to reach a high-purity requirement at a high hydrogen content in the feed, the adsorption column is not well utilized, as, for most of its operating time before breakthrough, the high-purity requirement is not met. Therefore, to operate under high-purity requirements, only short adsorption cycles of around 6.5 min would be necessary, followed by pressure swing steps, which would be energy-intensive at the operating pressure of the column. The low-purity requirement could be satisfied for a much longer adsorption period, mainly in cases with higher hydrogen feed content, enhancing adsorbent utilization. However, toward the end of the extraction period, adsorption cycles would inevitably become shorter, making the process, again, more energy-intensive. From this point of view, placing membrane separation before adsorption helps to even out the hydrogen content in the feed stream to the adsorption unit, making the adsorption cycles more stable and predictable while focusing on achieving high purity.
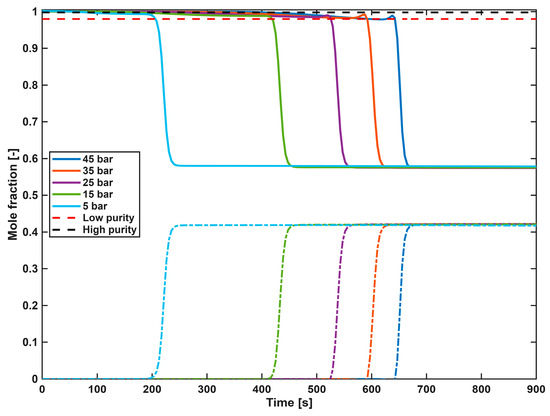
Another sensitivity analysis of the adsorption cycles focused on the effect of the operating pressure, as previous analyses showed that membrane separation is necessary and that the adsorption column would need to treat the permeate collected at a lower pressure from the membrane separation unit in order to reach the high-purity requirement. To observe the more pronounced effects of operating pressure, a lower feed hydrogen content was chosen for the analysis, but the general resulting implications would be the same. The same molar flow rate of 80 mol/s, a feed temperature of 288.15 K and hydrogen content of 56 mole % were used in each simulation. The effect of different column pressures on the breakthrough curves is shown in Figure 7.
Figure 7.
Breakthrough curves in the adsorption column for different column pressures in the feed gas at the same inlet hydrogen mole fraction. Dashed lines indicate the high- and low-purity requirements. Solid lines represent the hydrogen mole fraction, while dash-dotted lines represent the methane mole fraction.
The most visible effect can be observed in the time required for breakthrough. At higher pressures and the same molar feed flow rate, breakthrough occurs after a longer period of time. Higher pressures are directly associated with higher concentrations of adsorbates in the column, allowing higher amounts of the components to be adsorbed. Another factor contributing to shorter breakthrough times at lower column pressures is the higher interstitial velocity in the column, which shortens the residence time of the components and allows them to come into contact with unsaturated adsorbent sooner. Steeper breakthrough curves can be observed at higher column pressures as a result of the lower interstitial velocity, since the prolonged residence time enables a higher degree of adsorbent saturation and thus shortens the mass transfer zone [45].
The required low-hydrogen purity can be obtained before the breakthrough at all studied pressures. In such a scenario the adsorption column could work at higher pressures with longer adsorption cycles. However, the high-purity level can be obtained only at the beginning of the adsorption cycle and not throughout the whole period before the breakthrough which for the given hydrogen feed content again leads to shorter adsorption cycles.
3.5. Adsorption and Purge Steps
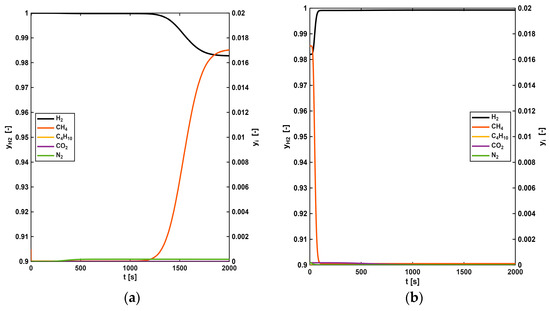
The sensitivity analysis has shown that neither the adsorption column nor the membrane unit alone can reach the required high hydrogen purity for the entire extraction period, and that their combination is necessary. At the same time, the preceding membrane separation step significantly narrows the variability of the feed composition entering the PSA unit compared to the raw withdrawn gas. In this way, the membrane unit acts not only as a bulk separation stage, but also as a conditioning step that stabilizes the PSA feed and enables high-purity hydrogen production with high overall recovery. First, a two-stage membrane unit treats the extracted gas to obtain hydrogen with a content above 98%, which is then fed to the adsorption unit responsible for further purification to meet the high-purity requirement. The mixed permeate stream from the two-stage membrane unit has a pressure of 10 bar, which was also selected as the pressure for the adsorption step of the PSA cycle. A simulation of the adsorption and purge steps was performed for the worst possible inlet conditions from the two-stage membrane separation unit in terms of hydrogen purity (98.2%), which occur at the end of the gas extraction process. Breakthrough curves of all considered components for the adsorption and purge step are shown in Figure 8. Parameters of the feed gas for adsorption and purge steps are in Table 9. At the beginning of the adsorption step, the column is fully saturated with hydrogen. For the purge step calculations, the column state corresponding to the end of the adsorption step was used as the initial condition.
Figure 8.
(a) Breakthrough curves for the adsorption step for the PSA working in at the end of the extraction period; (b) Breakthrough curves for the purge step for the PSA working in at the end of the extraction period.
Table 9.
Adsorption and purge step feed parameters.
The simulation results show that the breakthrough of methane, as the main impurity, occurs at 1200 s, while the hydrogen purity drops below the high-purity requirement after 1360 s. The contents of all other considered impurities do not increase significantly during the adsorption cycle. During the purge cycle (Figure 8b), most hydrogen impurities leave the column shortly after the purge starts. The mole fraction of methane, as the main impurity, drops below 1 × 10⁻⁴ after 140 s, while the mole fraction of other impurities is significantly lower. The purge cycle was considered to last 200 s, and for this case, the recovery, calculated according to Equation (28) is 95%, indicating only a small hydrogen loss in the PSA cycle, as the feed gas already contains a high hydrogen content.
3.6. Purification of Hydrogen Throughout the Extraction Period
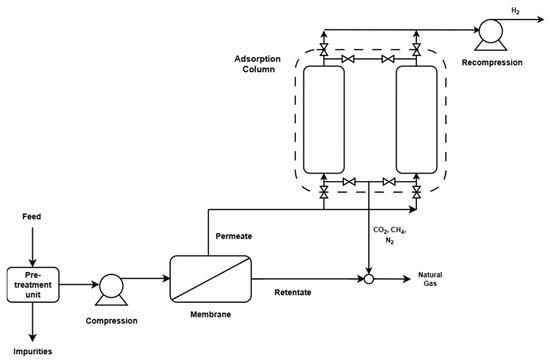
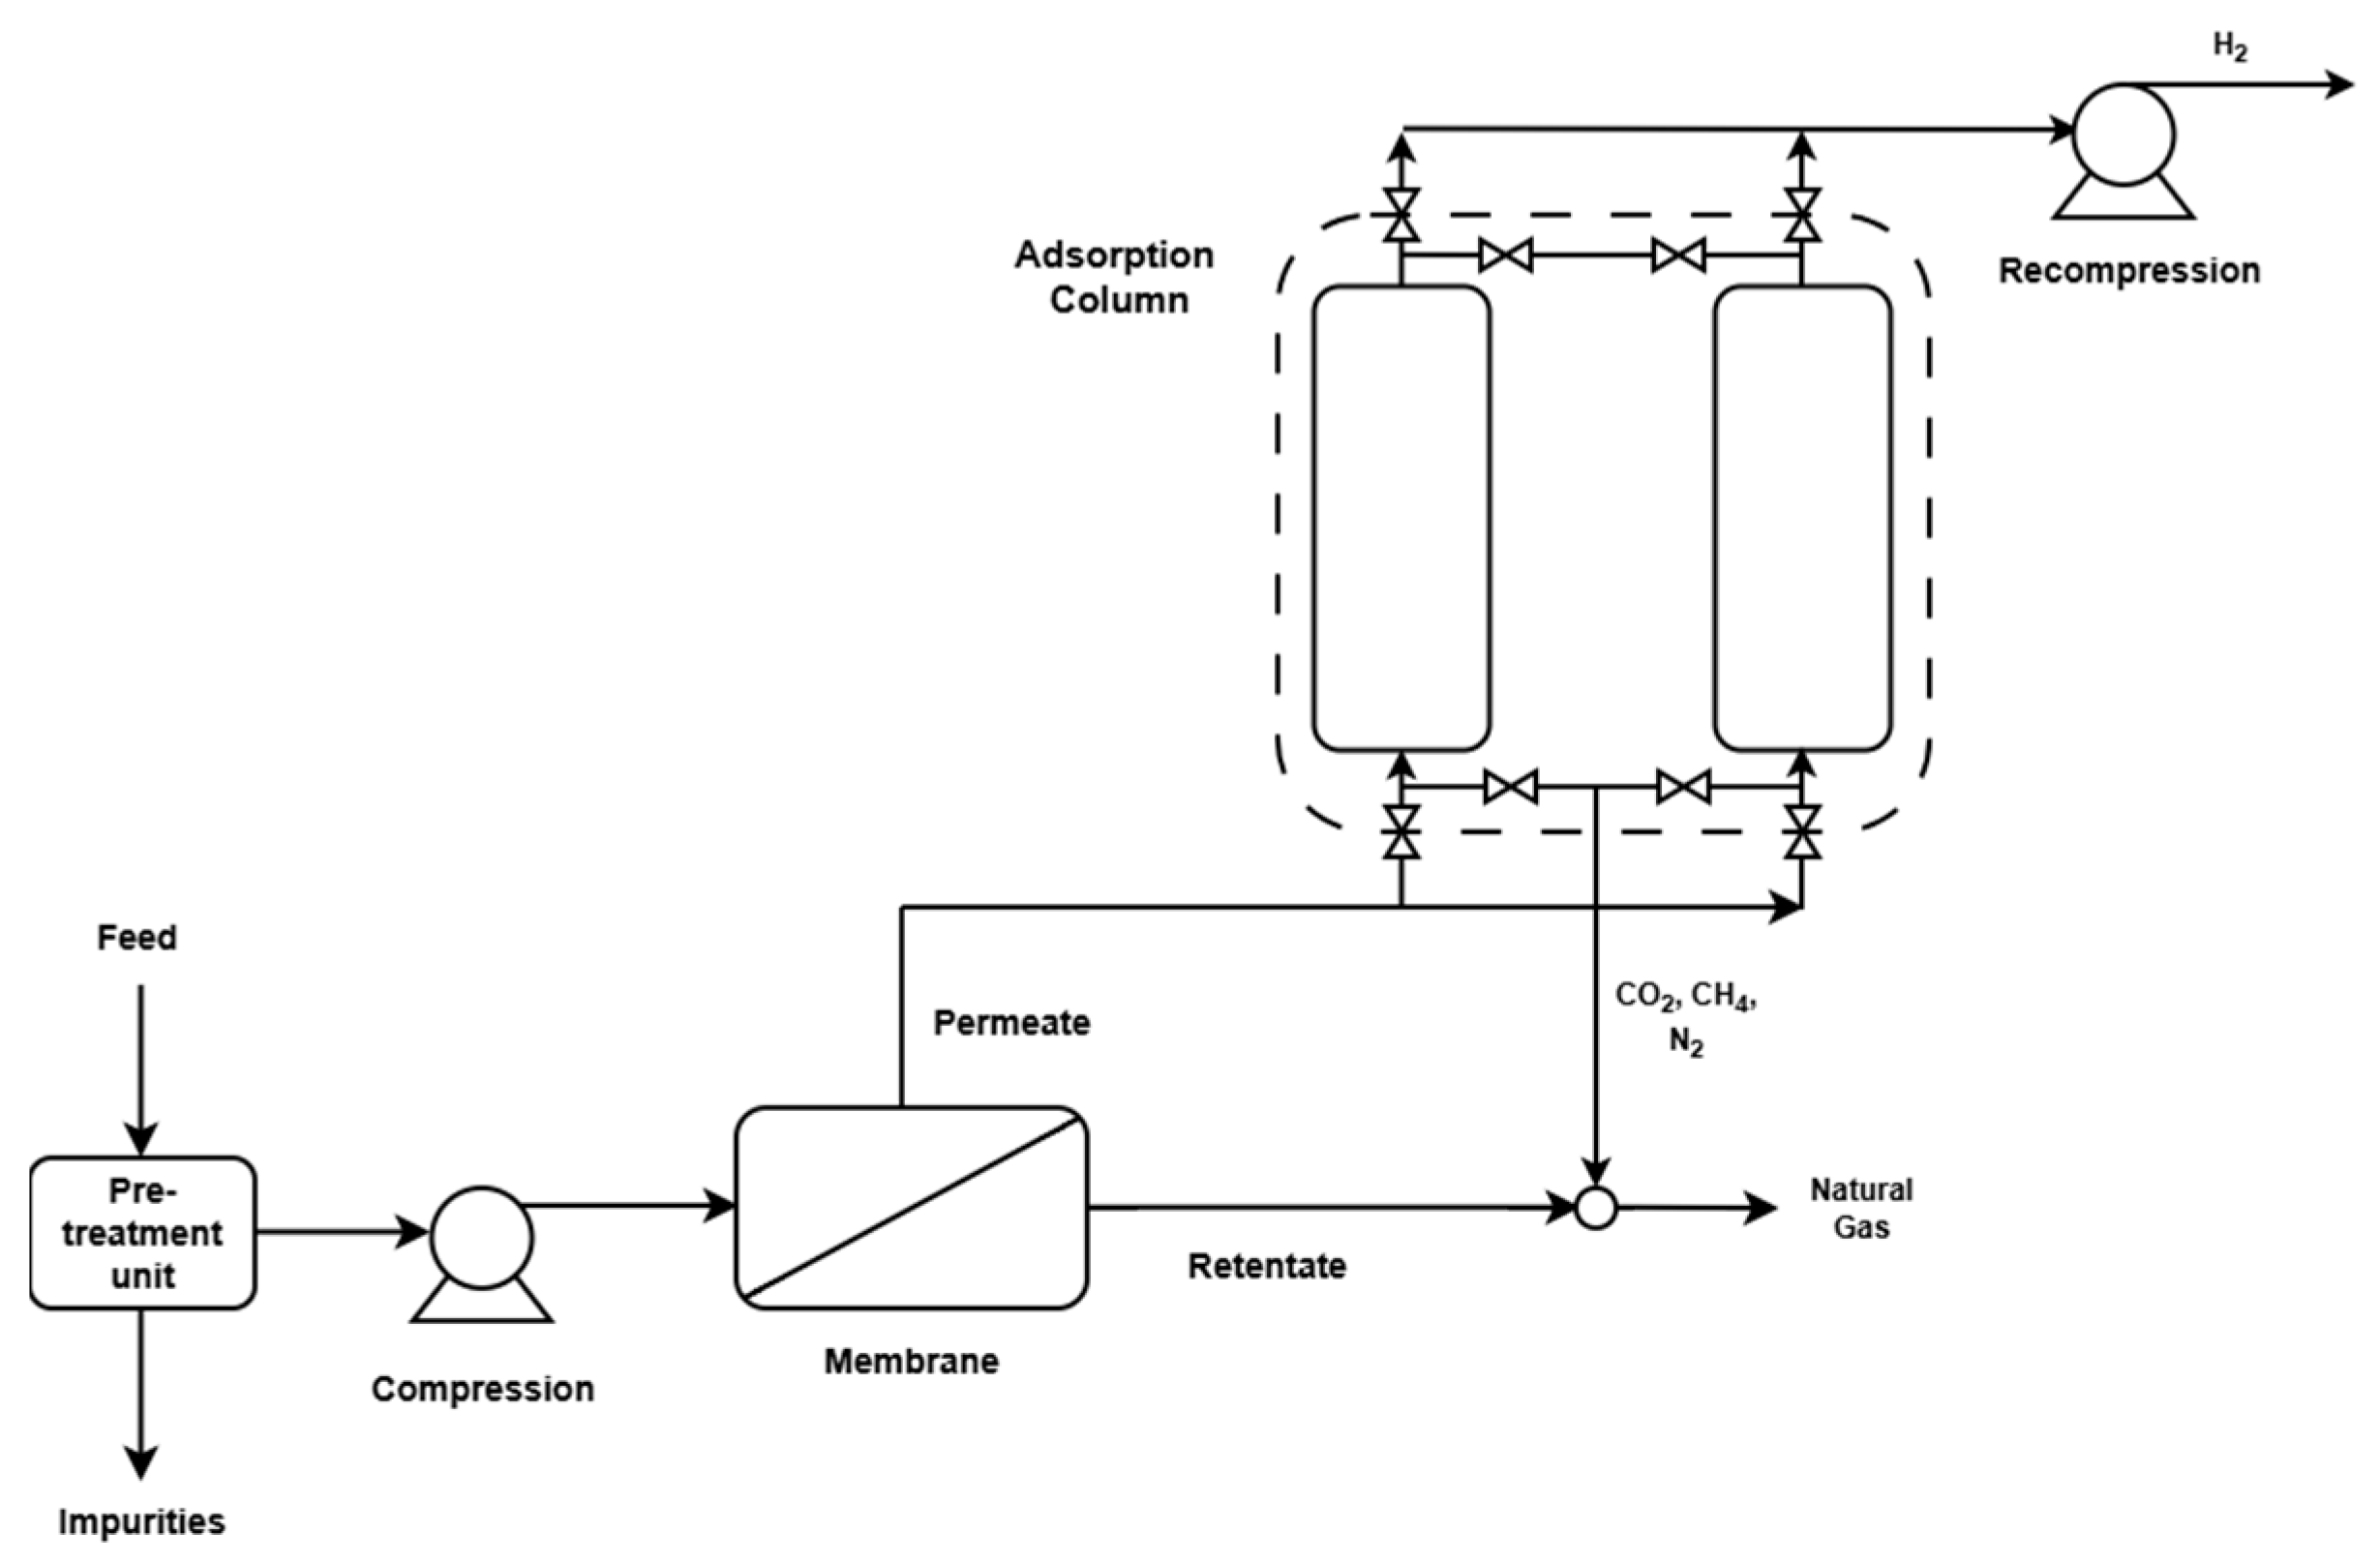
The PSA unit will process the mixed permeate streams from the first and second membrane stages, assuming its adsorption pressure is set to 10 bar and 1.5 bar for the purge step. The principal design of the hybrid system is depicted in Figure 9. The feed gas from the depleted gas field is first conditioned in a pretreatment stage before entering the two-stage membrane unit. Typical post-withdrawal pre-treatment operations in gas storage facilities include free water removal, desulfurization, and gas-drying. In this work, these operations were outside the scope of the study and are therefore collectively represented as a “pre-treatment unit” preceding the hybrid separation technology. Accordingly, constant membrane-separation properties were assumed throughout the simulated operating period. The hydrogen-rich permeate stream produced by the membrane unit is subsequently directed to the PSA unit for final purification, after which the product is compressed to the required delivery pressure. The purge gas from the PSA is combined with the membrane retentate to form a natural gas-rich stream suitable for injection into the gas network or for further blending to ensure that the hydrogen concentration remains below the limits established by the European Union regulations for natural gas transportation in pipeline systems.
Figure 9.
Proposed hybrid separation technology scheme.
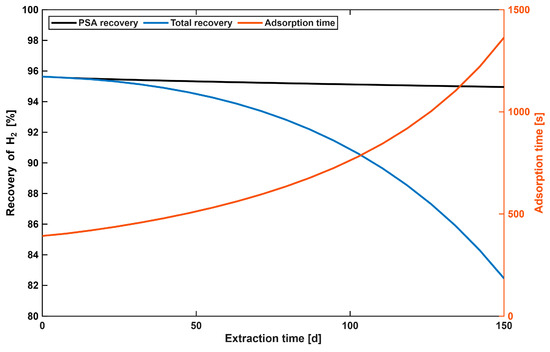
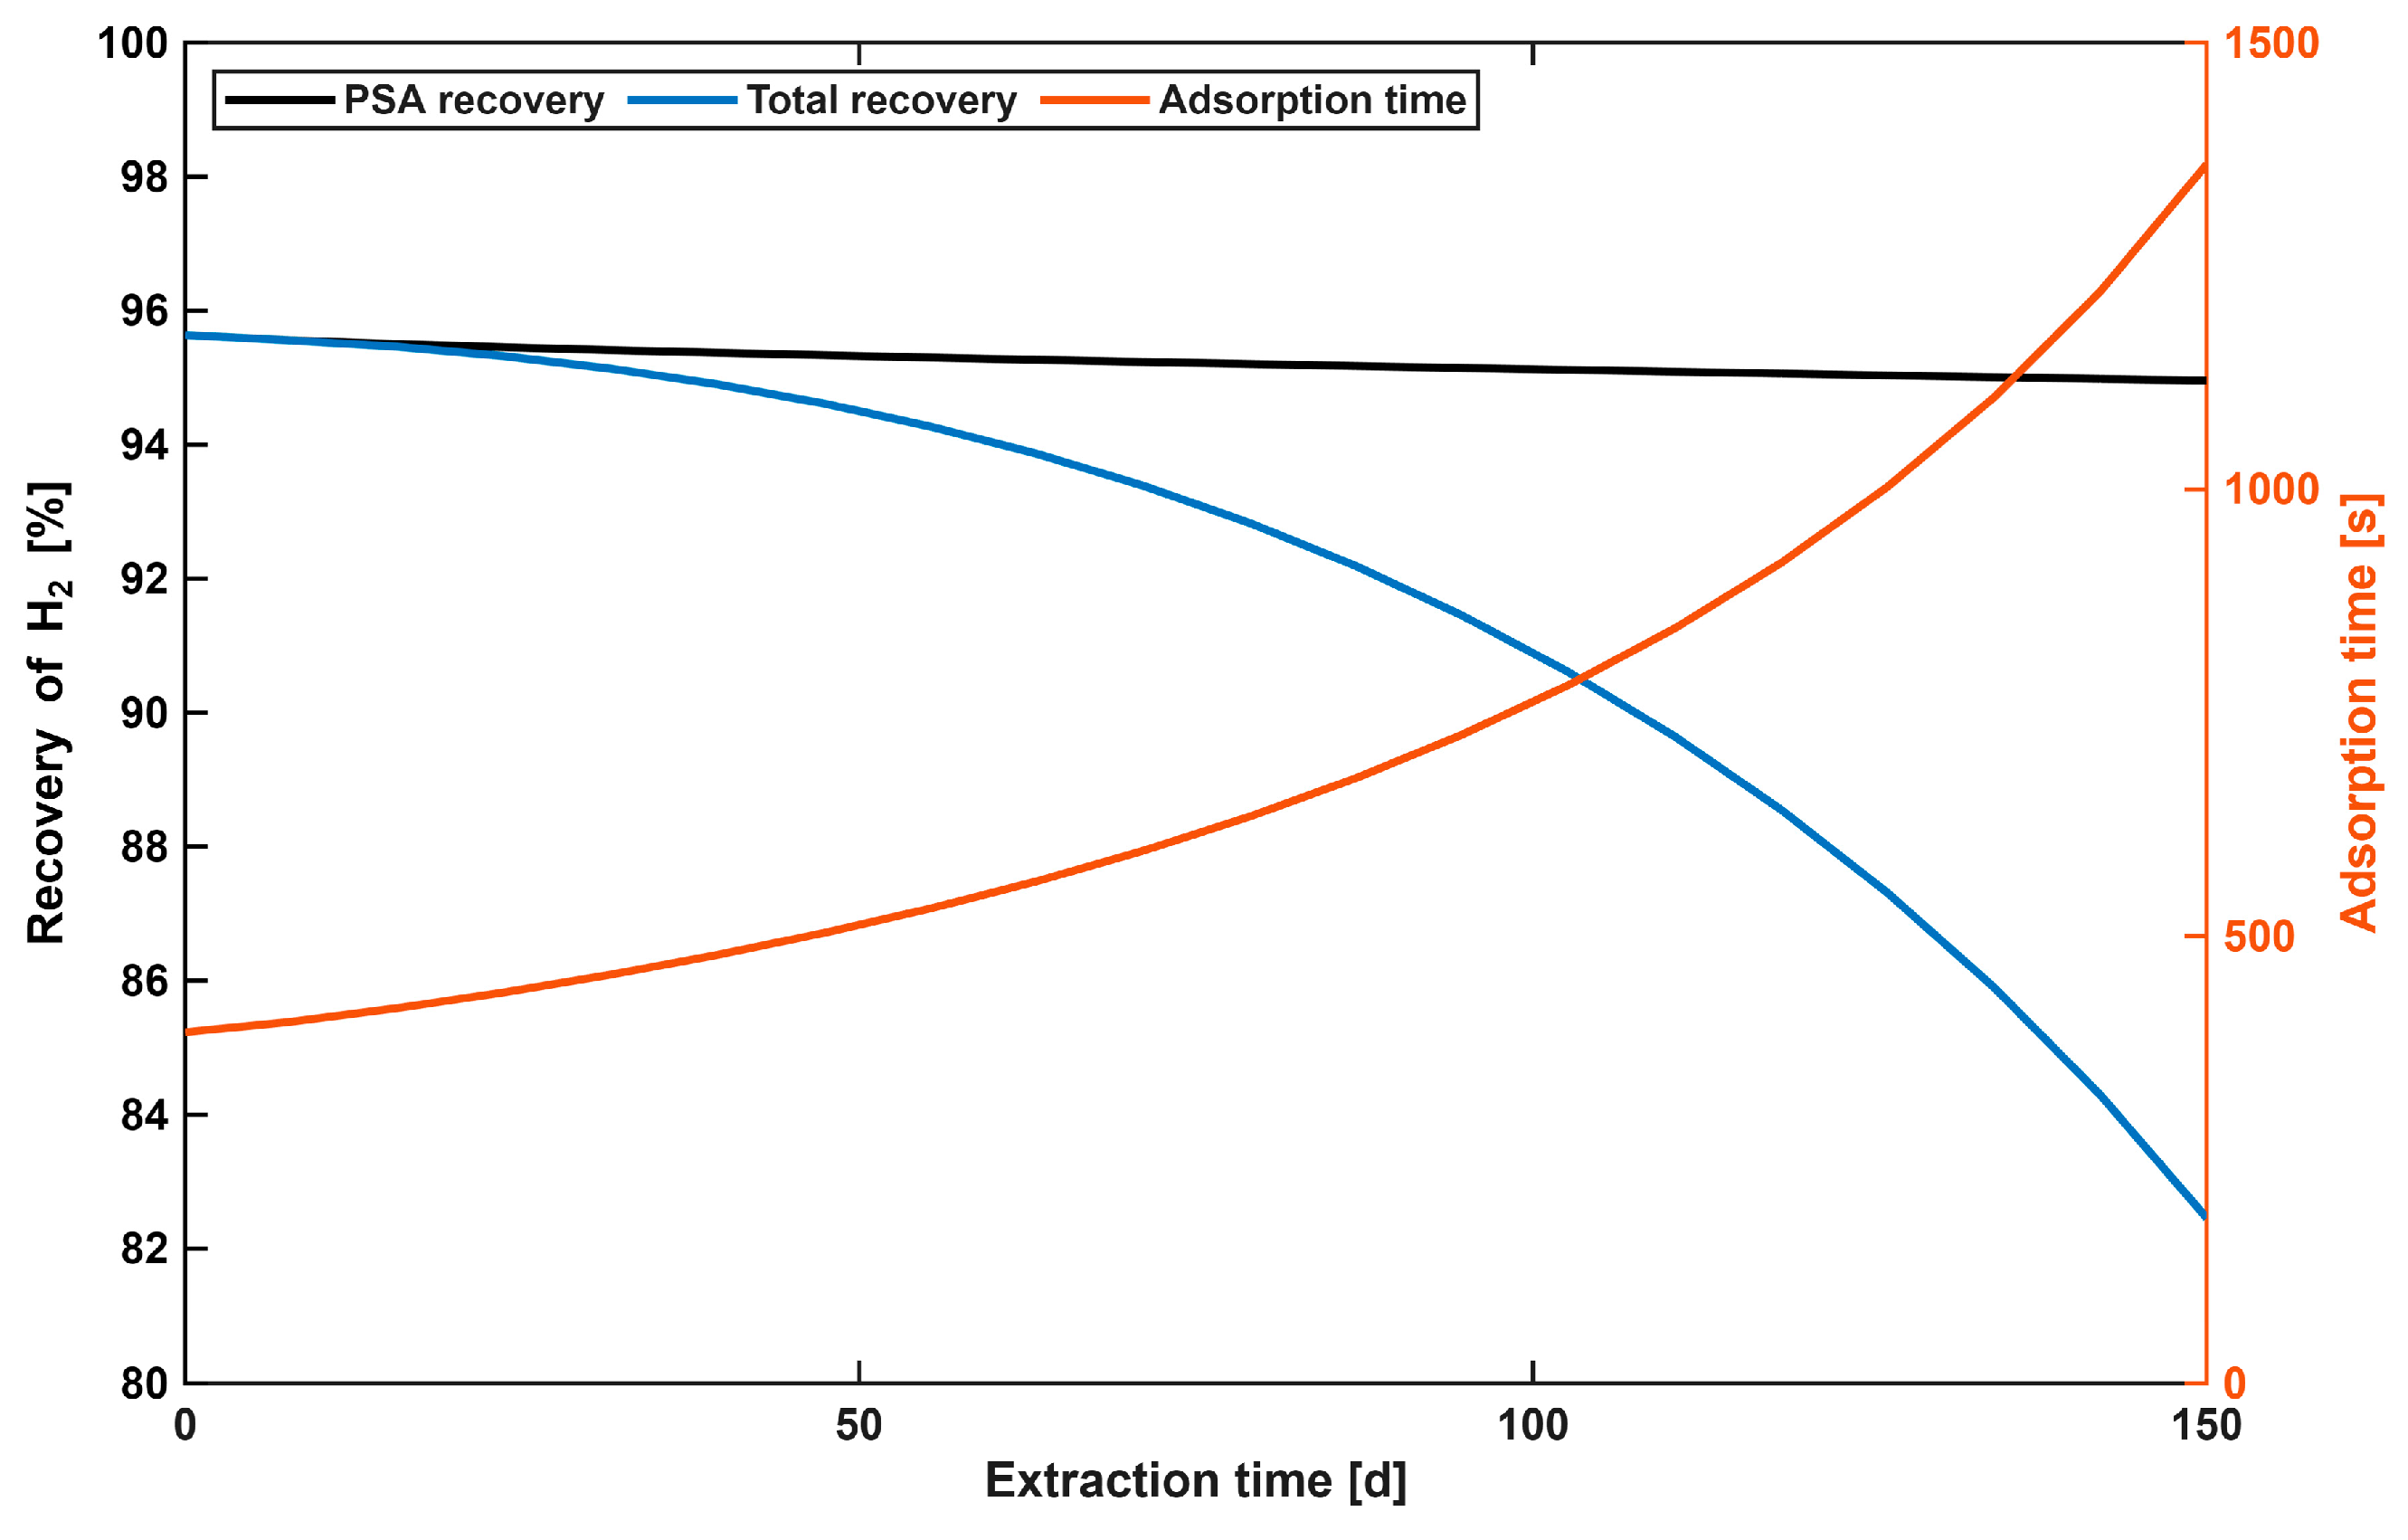
Simulations for multiple states of the mixed permeate streams throughout the extraction period were performed in order to calculate the hydrogen recovery in the adsorption step alone, as well as the total hydrogen recovery from the extracted gas if the gas is first processed by the two-stage membrane unit and then by the PSA unit. The adsorption step was terminated using an ODE event function in MATLAB 2024b, which was set to stop the calculation when the mole fraction of hydrogen in the outlet stream from the PSA reached 0.998. The purge step was fixed and lasted for 200 s. The results of these simulations are shown in Figure 10. It is important to note that throughout the extraction period, both the molar flow rate of the gas and the hydrogen content decrease, which also affects the results shown here.
Figure 10.
Recovery of hydrogen in the PSA step and its total recovery in the whole separation system throughout the extraction period, together with the time of the adsorption step.
The results show that the hydrogen recovery in the adsorption step alone decreases only slightly owing to a slight decrease in the hydrogen mole fraction in the PSA feed stream from the membrane separation. As the extraction operation proceeds, both the volumetric flow rate and the hydrogen mole fraction decrease, which means that there is less mixed permeate to be processed by the PSA, leading to an increase in the duration of the adsorption step. This indicates that the duration of the adsorption step does not significantly influence the recovery in the PSA. The total recovery follows a similar trend to the calculated hydrogen yield in the membrane separation (Figure 5), showing that the total recovery is significantly affected by it. At around day 100 of extraction, a similar hydrogen loss can be attributed to both the membrane separation and the PSA, amounting to about 5% for each step. This means that during the last 50 days of extraction, more hydrogen is lost in the membrane separation than in the PSA. The total hydrogen recovery on the last day of extraction is 82.5%.
4. Conclusions
Hydrogen has the potential to serve as a carbon-free energy carrier; however, several challenges must be addressed before its widespread implementation is feasible. One of the key obstacles is the need for large scale, long-term hydrogen storage. While salt caverns are considered a promising option, their availability is geographically limited. An alternative solution may be the utilization of depleted natural gas reservoirs, which offer known storage capacities and contain residual natural gas that can act as a cushion gas. To obtain high-purity hydrogen, purification of the withdrawn mixture is therefore essential.
Based on the literature review, the hybrid configuration combining a membrane unit with a PSA unit was identified as the most suitable technology for this application. The designed hybrid system was able to purify hydrogen throughout the entire withdrawal period from the depleted natural gas reservoir. The required high-purity level of hydrogen can only be achieved using the membrane unit alone during the initial days of withdrawal. If this purity must be maintained consistently, the use of a PSA unit becomes necessary.
A mathematical model of hydrogen membrane separation was developed and utilized for the design of a system meeting low-purity requirements. According to the internal configuration outlined in Table 4, a single membrane stage can operate effectively only during the first 50 days of withdrawal while still achieving a minimum hydrogen recovery of 80%. After this period, a second membrane stage operating at a lower permeate pressure must be engaged. With the two-stage membrane configuration, final recoveries above 80–85% were achieved, along with a hydrogen purity exceeding the defined low-purity specification.
PSA technology offers a high degree of operational flexibility, as it can be adjusted to achieve the desired hydrogen product purity. This flexibility is particularly advantageous when high-purity hydrogen is required. Such flexibility arises from the possibility of adjusting the duration of the adsorption step, which decreases with the decrease in hydrogen content in the processed stream. The work also shows that, at lower pressures, the duration of the adsorption step is also prolonged. However, due to the decrease in the volumetric and molar flow rate of the processed gas during the extraction process, there is an overall increase in the duration of the adsorption step. All these changes in the process also influence hydrogen recovery in the PSA, which decreases only slightly throughout the extraction period.
The designed hybrid system is able to purify hydrogen at a wide range of volumetric flow rates, pressures and hydrogen contents, as these characteristics of the extracted gas vary significantly during extraction. The resulting hydrogen recovery in the hybrid system decreases towards the end of the extraction period, which is connected to the decreasing content of hydrogen in the extracted gas. Most of the hydrogen is lost in the two-stage membrane separation, but the membrane unit produces a hydrogen-rich permeate stream with high and quite stable hydrogen content. This confirms that the role of the membrane unit is not limited to partial hydrogen recovery, but also includes the conditioning of the feed for the PSA unit over the full range of operating states encountered during gas withdrawal. This initial separation facilitates the design of the PSA unit, which is necessary for producing high-purity hydrogen stream. Membrane separation thus enables more sustained operation of the PSA in terms of recovery, but due to the varying volumetric and molar flow rates of the processed mixed permeate, the duration of the PSA cycle needs to be adjusted accordingly. Another advantage of membrane operation is that retentate (mostly natural gas) is recovered at a higher pressure compared to the off gas from the purge step of the PSA unit, which is beneficial for its further utilization.
Author Contributions
Conceptualization, R.Z. and M.K.; methodology, M.K. and I.Č.; software, M.K. and I.Č.; validation, I.Č., M.K. and R.Z.; formal analysis, I.Č.; investigation, I.Č.; resources, M.K.; data curation, M.K.; writing—original draft preparation, M.K.; writing—review and editing, I.Č.; visualization, M.K.; supervision, I.Č.; project administration, R.Z.; funding acquisition, R.Z. All authors have read and agreed to the published version of the manuscript.
Funding
This work was the part of IPCEI (Important Projects of Common European Interest) project HENRI. Funding number: SK2022146599. More information about the project could be found in the following link: https://projecthenri.eu/en/ (accessed on 20 April 2026).
Data Availability Statement
The original contributions presented in this study are included in the article. Further inquiries can be directed to the corresponding author.
Conflicts of Interest
Maroš Križan and Roman Zavada were employed by the Nafta a.s. The remaining author declares that the research was conducted in the absence of any commercial or financial relationships that could be construed as a potential conflict of interest.
Abbreviations
The following abbreviations are used in this manuscript:
| GHG | Greenhouse gases |
| IPCEI | Important Projects of Common European Interest |
| LDF | Linear driving force model |
| NG | Natural gas |
| P2G | Power to gas |
| PSA | Pressure swing adsorption |
| B | Temperature dependent parameter of Langmuir isotherm |
| Cps | Heat capacity of adsorbent particle |
| CPW | Heat capacity of adsorption column wall |
| D | Outside diameter of membrane module |
| Di | Inner diameter of membrane fiber |
| D0 | Outside diameter of single membrane fiber |
| DL | Parameter of axial dispersion |
| ΔH | Heat of adsorption |
| K | Empirical parameter for viscosity calculation |
| KL | Parameter of axial dispersion of heat |
| k1 | Isotherm parameters of temperature dependence |
| M | Molar mass |
| N | Number of fibers inside membrane module |
| NC | Number of components in the gas mixture |
| n | Molar flow |
| P | Pressure |
| R | Universal gas constant |
| Ri | Internal radius of adsorption column |
| RP | Particle radius |
| Q | Permeability |
| qm | Temperature-dependent parameter of Langmuir isotherm |
| t | Time |
| ux | Molar flow rate of retentate |
| vy | Molar flow rate of permeate |
| w | Interstitial velocity |
| X | Empirical parameter of viscosity calculation |
| Y | Empirical parameter of viscosity calculation |
| YH2 | Yield of hydrogen |
| y | Mole fraction |
| xNG | Mole fraction of natural gas |
| z | Spatial coordinate |
| Greek symbols | |
| εb | Bed porosity |
| δ | Membrane fiber thickness/Adsorption column wall thickness |
| μm | Dynamic viscosity |
| Φ | Membrane module specific surface area |
| Ψ | Adsorbent occupation percentage |
| ω | Lumped mass transfer coefficient |
| Subscripts | |
| ads | Adsorption |
| des | Desorption |
| R | Retentate |
| tot | Total |
| Superscripts | |
| * | Equilibrium |
| f | Feed |
| p | Permeate |
References
- Burgers, I.; Dehdari, L.; Xiao, P.; Li, K.G.; Goetheer, E.; Webley, P. Techno-Economic Analysis of PSA Separation for Hydrogen/Natural Gas Mixtures at Hydrogen Refuelling Stations. Int. J. Hydrogen Energy 2022, 47, 36163–36174. [Google Scholar] [CrossRef] [Scilit]
- Cristello, J.B.; Yang, J.M.; Hugo, R.; Lee, Y.; Park, S.S. Feasibility Analysis of Blending Hydrogen into Natural Gas Networks. Int. J. Hydrogen Energy 2023, 48, 17605–17629. [Google Scholar] [CrossRef] [Scilit]
- Kraviarová, D.; Janošovský, J.; Variny, M. The Feasibility Study of Alternative Fuels Production Following National Hydrogen Strategy in Slovakia. Int. J. Hydrogen Energy 2024, 86, 1386–1400. [Google Scholar] [CrossRef] [Scilit]
- Muhammed, N.S.; Haq, M.B.; Al Shehri, D.A.; Al-Ahmed, A.; Rahman, M.M.; Zaman, E.; Iglauer, S. Hydrogen Storage in Depleted Gas Reservoirs: A Comprehensive Review. Fuel 2023, 337, 127032. [Google Scholar] [CrossRef] [Scilit]
- Perera, M.S.A. A Review of Underground Hydrogen Storage in Depleted Gas Reservoirs: Insights into Various Rock-Fluid Interaction Mechanisms and Their Impact on the Process Integrity. Fuel 2023, 334, 126677. [Google Scholar] [CrossRef] [Scilit]
- Luboń, K.; Tarkowski, R. Hydrogen Storage in Deep Saline Aquifers: Non-Recoverable Cushion Gas after Storage. Energies 2024, 17, 1493. [Google Scholar] [CrossRef] [Scilit]
- Amin, M.; Butt, A.S.; Ahmad, J.; Lee, C.; Azam, S.U.; Mannan, H.A.; Naveed, A.B.; Farooqi, Z.U.R.; Chung, E.; Iqbal, A. Issues and Challenges in Hydrogen Separation Technologies. Energy Rep. 2023, 9, 894–911. [Google Scholar] [CrossRef] [Scilit]
- Muthukumar, P.; Kumar, A.; Raju, N.N.; Malleswararao, K.; Rahman, M.M. A Critical Review on Design Aspects and Developmental Status of Metal Hydride Based Thermal Machines. Int. J. Hydrogen Energy 2018, 43, 17753–17779. [Google Scholar] [CrossRef] [Scilit]
- Li, B.; He, G.; Jiang, X.; Dai, Y.; Ruan, X. Pressure Swing Adsorption/Membrane Hybrid Processes for Hydrogen Purification with a High Recovery. Front. Chem. Sci. Eng. 2016, 10, 255–264. [Google Scholar] [CrossRef] [Scilit]
- Dehdari, L.; Burgers, I.; Xiao, P.; Li, K.G.; Singh, R.; Webley, P.A. Purification of Hydrogen from Natural Gas/Hydrogen Pipeline Mixtures. Sep. Purif. Technol. 2022, 282, 120094. [Google Scholar] [CrossRef] [Scilit]
- Verdade, A.G.A. The Potential of Aspen AdsorptionTM Software Package to Simulate Pressure Swing Adsorption Units. Master’s Thesis, University of Porto, Porto, Portugal, 2020. [Google Scholar]
- Chuah, C.Y.; Jiang, X.; Goh, K.; Wang, R. Recent Progress in Mixed-Matrix Membranes for Hydrogen Separation. Membranes 2021, 11, 666. [Google Scholar] [CrossRef] [Scilit] [PubMed]
- Ohs, B.; Falkenberg, M.; Wessling, M. Optimizing Hybrid Membrane-Pressure Swing Adsorption Processes for Biogenic Hydrogen Recovery. Chem. Eng. J. 2019, 364, 452–461. [Google Scholar] [CrossRef] [Scilit]
- Lu, H.T.; Li, W.; Miandoab, E.S.; Kanehashi, S.; Hu, G. The Opportunity of Membrane Technology for Hydrogen Purification in the Power to Hydrogen (P2H) Roadmap: A Review. Front. Chem. Sci. Eng. 2021, 15, 464–482. [Google Scholar] [CrossRef] [Scilit] [PubMed]
- Yang, J.; Vaidya, M.M.; Duval, S.A.; Hamad, F. Polymer-Based Membranes for C3+ Hydrocarbon Removal from Natural Gas. In Natural Gas—New Perspectives and Future Developments [Working Title]; IntechOpen: London, UK, 2022. [Google Scholar]
- Lider, A.; Kudiiarov, V.; Kurdyumov, N.; Lyu, J.; Koptsev, M.; Travitzky, N.; Hotza, D. Materials and Techniques for Hydrogen Separation from Methane-Containing Gas Mixtures. Int. J. Hydrogen Energy 2023, 48, 28390–28411. [Google Scholar] [CrossRef] [Scilit]
- Castro-Muñoz, R.; Agrawal, K.V.; Lai, Z.; Coronas, J. Towards Large-Scale Application of Nanoporous Materials in Membranes for Separation of Energy-Relevant Gas Mixtures. Sep. Purif. Technol. 2023, 308, 122919. [Google Scholar] [CrossRef] [Scilit]
- Chu, Y.; Lindbråthen, A.; Lei, L.; He, X.; Hillestad, M. Mathematical Modeling and Process Parametric Study of CO2 Removal from Natural Gas by Hollow Fiber Membranes. Chem. Eng. Res. Des. 2019, 148, 45–55. [Google Scholar] [CrossRef] [Scilit]
- Yang, X.; Zhang, S.; Zhu, W. A New Model for the Accurate Calculation of Natural Gas Viscosity. Nat. Gas Ind. B 2017, 4, 100–105. [Google Scholar] [CrossRef] [Scilit]
- Mokhatab, S.; Poe, W.A.; Mak, J.Y. Natural Gas Fundamentals. In Handbook of Natural Gas Transmission and Processing; Elsevier: Amsterdam, The Netherlands, 2019; pp. 1–35. [Google Scholar]
- Lee, J.; Kim, M.; Lee, D.; Ahn, H.; Kim, M.; Lee, C. Heat-exchange Pressure Swing Adsorption Process for Hydrogen Separation. AIChE J. 2008, 54, 2054–2064. [Google Scholar] [CrossRef] [Scilit]
- Sircar, S. Linear-Driving-Force Model for Non-Isothermal Gas Adsorption Kinetics. J. Chem. Soc. Faraday Trans. 1983, 79, 785–796. [Google Scholar] [CrossRef] [Scilit]
- Brizuela-Mendoza, J.A.; Sorcia-Vázquez, F.D.J.; Rumbo-Morales, J.Y.; Ortiz-Torres, G.; Torres-Cantero, C.A.; Juárez, M.A.; Zatarain, O.; Ramos-Martinez, M.; Sarmiento-Bustos, E.; Rodríguez-Cerda, J.C.; et al. Pressure Swing Adsorption Plant for the Recovery and Production of Biohydrogen: Optimization and Control. Processes 2023, 11, 2997. [Google Scholar] [CrossRef] [Scilit]
- Li, H.; Liao, Z.; Sun, J.; Jiang, B.; Wang, J.; Yang, Y. Modelling and Simulation of Two-Bed PSA Process for Separating H2 from Methane Steam Reforming. Chin. J. Chem. Eng. 2019, 27, 1870–1878. [Google Scholar] [CrossRef] [Scilit]
- García-Luna, S.; Ortiz, C.; Chacartegui, R.; Pérez-Maqueda, L.A. Large-Scale Oxygen-Enriched Air (OEA) Production from Polymeric Membranes for Partial Oxycombustion Processes. Energy 2023, 268, 126697. [Google Scholar] [CrossRef] [Scilit]
- Mustaffar, M.I.; Ismail, A.F.; Illias, R.M. Study on the Effect of Polymer Concentration on Hollow Fiber Ultrafiltration Membrane Performance and Morphology. In Proceedings of the Regional Symposium on Membrane Science and Technology, Johor Bahru, Malaysia, 21–25 April 2004. [Google Scholar]
- Air Products Membrane Solutions. PRISM Membrane Separators; Air Products Membrane Solutions: St. Louis, MO, USA, 2016. [Google Scholar]
- Zhmakin, V.V.; Teplyakov, V.V. The Evaluation of the C1–C4 Hydrocarbon Permeability Parameters in the Thin Film Composite Membranes. Sep. Purif. Technol. 2017, 186, 145–155. [Google Scholar] [CrossRef] [Scilit]
- Ahn, S.; You, Y.-W.; Lee, D.-G.; Kim, K.-H.; Oh, M.; Lee, C.-H. Layered Two- and Four-Bed PSA Processes for H2 Recovery from Coal Gas. Chem. Eng. Sci. 2012, 68, 413–423. [Google Scholar] [CrossRef] [Scilit]
- Knight, E.W.; Gillespie, A.K.; Prosniewski, M.J.; Stalla, D.; Dohnke, E.; Rash, T.A.; Pfeifer, P.; Wexler, C. Determination of the Enthalpy of Adsorption of Hydrogen in Activated Carbon at Room Temperature. Int. J. Hydrogen Energy 2020, 45, 15541–15552. [Google Scholar] [CrossRef] [Scilit]
- Malek, A.; Farooq, S. Kinetics of Hydrocarbon Adsorption on Activated Carbon and Silica Gel. AIChE J. 1997, 43, 761–776. [Google Scholar] [CrossRef] [Scilit]
- Saha, B.B.; Chakraborty, A.; Koyama, S.; Yoon, S.-H.; Mochida, I.; Kumja, M.; Yap, C.; Ng, K.C. Isotherms and Thermodynamics for the Adsorption of N-Butane on Pitch Based Activated Carbon. Int. J. Heat Mass Transf. 2008, 51, 1582–1589. [Google Scholar] [CrossRef] [Scilit]
- Zhao, F.; Zhu, L.; Wang, Z.; Hou, Y.; Chen, J.; Wang, C.; Xu, D. Experimental and Numerical Investigation into the Heat- and Mass-Transfer Processes of n -Butane Adsorption on Activated Carbon. ACS Omega 2021, 6, 17162–17172. [Google Scholar] [CrossRef] [Scilit]
- Guo, B.; Chang, L.; Xie, K. Adsorption of Carbon Dioxide on Activated Carbon. J. Nat. Gas Chem. 2006, 15, 223–229. [Google Scholar] [CrossRef] [Scilit]
- Czerny, A.M.; Bénard, P.; Chahine, R. Adsorption of Nitrogen on Granular Activated Carbon: Experiment and Modeling. Langmuir 2005, 21, 2871–2875. [Google Scholar] [CrossRef] [Scilit] [PubMed]
- Sircar, A.; Devi, V.G.; Yadav, D.; Mishra, J.S.; Gangradey, R.; Gayathry, J.; Tomar, R.; Dhorajiya, P.B.; Dave, P. Study and Characterization of Potential Adsorbent Materials for the Design of the Hydrogen Isotopes Extraction and Analysis System. Fusion Eng. Des. 2021, 166, 112308. [Google Scholar] [CrossRef] [Scilit]
- Olivier, M.-G.; Jadot, R. Adsorption of Light Hydrocarbons and Carbon Dioxide on Silica Gel. J. Chem. Eng. Data 1997, 42, 230–233. [Google Scholar] [CrossRef] [Scilit]
- Ferreira, A.F.P.; Mittelmeijer-Hazeleger, M.C.; Bliek, A. Adsorption and Differential Heats of Adsorption of Normal and Iso-Butane on Zeolite MFI. Microporous Mesoporous Mater. 2006, 91, 47–52. [Google Scholar] [CrossRef] [Scilit]
- Boscherini, M.; Miccio, F.; Papa, E.; Medri, V.; Landi, E.; Doghieri, F.; Minelli, M. The Relevance of Thermal Effects during CO2 Adsorption and Regeneration in a Geopolymer-Zeolite Composite: Experimental and Modelling Insights. Chem. Eng. J. 2021, 408, 127315. [Google Scholar] [CrossRef] [Scilit]
- Ertan, A. CO2, N2 and Ar Adsorption on Zeolites. Master’s Thesis, İzmir Institute of Technology, İzmir, Turkey, 2004. [Google Scholar]
- Xiao, J.; Peng, Y.; Bénard, P.; Chahine, R. Thermal Effects on Breakthrough Curves of Pressure Swing Adsorption for Hydrogen Purification. Int. J. Hydrogen Energy 2016, 41, 8236–8245. [Google Scholar] [CrossRef] [Scilit]
- Ahn, H.; Chun, C.; Park, M.; Ahn, I.-S.; Lee, C.-H. Thermal Effects on the Breakthrough Curve of a Hydrogen Ternary System at a Fixed Bed. Sep. Sci. Technol. 2001, 36, 2121–2145. [Google Scholar] [CrossRef] [Scilit]
- Lin, X.; Huang, Q.; Qi, G.; Shi, S.; Xiong, L.; Huang, C.; Chen, X.; Li, H.; Chen, X. Estimation of Fixed-Bed Column Parameters and Mathematical Modeling of Breakthrough Behaviors for Adsorption of Levulinic Acid from Aqueous Solution Using SY-01 Resin. Sep. Purif. Technol. 2017, 174, 222–231. [Google Scholar] [CrossRef] [Scilit]
- Mesfer, M.K.A.; Danish, M.; Khan, M.I.; Ali, I.H.; Hasan, M.; Jery, A.E. Continuous Fixed Bed CO2 Adsorption: Breakthrough, Column Efficiency, Mass Transfer Zone. Processes 2020, 8, 1233. [Google Scholar] [CrossRef] [Scilit]
- Červeňanský, I.; Mihaľ, M.; Markoš, J. Modeling of 2-Phenylethanol Adsorption onto Polymeric Resin from Aqueous Solution: Intraparticle Diffusion Evaluation and Dynamic Fixed Bed Adsorption. Chem. Eng. Res. Des. 2019, 147, 292–304. [Google Scholar] [CrossRef] [Scilit]

Disclaimer/Publisher’s Note: The statements, opinions and data contained in all publications are solely those of the individual author(s) and contributor(s) and not of MDPI and/or the editor(s). MDPI and/or the editor(s) disclaim responsibility for any injury to people or property resulting from any ideas, methods, instructions or products referred to in the content. |
© 2026 by the authors. Licensee MDPI, Basel, Switzerland. This article is an open access article distributed under the terms and conditions of the Creative Commons Attribution (CC BY) license.