


Abstract
Proton Exchange Membrane Fuel Cells (PEMFCs) are highly valued for their zero emissions, low noise, and environmentally friendly characteristics. However, they face substantial difficulties when starting up in low-temperature conditions. Coolant-assisted heating is usually more effective than other methods because of its fast speed, high heat transfer efficiency, and simple structure. This study developed a three-dimensional multiphase non-isothermal PEMFC cold start model with coolant-assisted heating. Key parameters, including heat consumption rate, coolant flow rate, load current slope, initial membrane water content, catalyst layer porosity, and gas diffusion layer porosity, were selected as optimization variables. A Convolutional Neural Network–Attention Mechanism–Bidirectional Long Short-Term Memory Neural Network (CAB-Net) was employed as a surrogate model to predict the ice volume fraction during the cold start process. The CAB-Net model was further integrated with the Lexicographic Ordered Whale Optimization Algorithm (LO-WOA) to identify the optimal combination of parameters. The optimization aimed to minimize the maximum ice volume fraction (MIVF) in the Cathode Catalyst Layer (CCL) and reduce the energy consumption required to reach this fraction. The optimization results revealed that, compared to the baseline model (MIVF = 0.4519, energy consumption = 0.77264 J), the MIVF was reduced to 0.1471, representing a 67.45% decrease, while energy consumption was reduced to 0.70299 J, achieving a 9.01% decrease. The results underscore the efficacy of the proposed strategy in enhancing cold start performance under low-temperature conditions.
1. Introduction
The ongoing large-scale exploitation of fossil fuels has severely harmed the global ecological environment, intensifying both the energy crisis and environmental challenges. These issues have evolved into pressing global concerns that require immediate action [1]. In this context, the advancement and implementation of renewable energy sources have become pivotal in international energy technology research. Among these sources, hydrogen energy has gained recognition as a promising alternative due to its high efficiency and environmental sustainability [2], increasingly establishing itself as a focal point in global energy studies.
PEMFC, as a key application of hydrogen energy, offers significant advantages, including high energy conversion efficiency, zero emissions, low noise, and environmental friendliness. These characteristics have led to their increasing adoption in marine, land, and aviation transportation sectors [3]. However, the widespread application of PEMFC, particularly in mobile settings, still faces several technical challenges. Among these, the cold start issue remains a critical bottleneck, especially in regions with low ambient temperatures [4,5]. The inducing factors for PEMFC cold start failure are diverse. For example, when the ambient temperature is too low, the water generated by the electrochemical reaction tends to freeze and form ice inside the pores of the porous electrode; excessive membrane moisture content further enhances the tendency to freeze, and these factors can all cause material transport to be obstructed [6], leading to cold start failure. In addition, multiple cold starts (i.e., freeze-thaw cycles) in a low-temperature environment are more likely to cause irreversible damage to the membrane components, thereby exacerbating the hydrogen permeation effect—hydrogen permeating to the cathode side will generate waste heat and active radicals under the action of the catalyst, accelerating the degradation of the catalyst layer (CL) [7,8].
Research shows that during the cold start process, water generated by the Oxygen Reduction Reaction (ORR) in the CCL can freeze under low temperatures, blocking the diffusion pathways of reaction gases. At the beginning of cold start-up, the internal temperature of the battery is below 0 °C, and all generated water exists in the form of ice or supercooled liquid water. The driving force for water transport mainly comes from two aspects: electro-osmotic drag (EOD) [9] and back diffusion. The EOD effect: When protons (H+) migrate from the anode through the proton exchange membrane (PEM) to the cathode, they drag water molecules along with them. The amount of water dragged is related to current density, membrane water content state, and temperature. This process results in a net migration of water from the anode to the cathode. Back diffusion: Due to the continuous generation of water by the oxygen reduction reaction (ORR) at the cathode. The water concentration (chemical potential) on the cathode side is much higher than that on the anode side, thus generating a driving force for water concentration diffusion from the cathode to the anode. At low temperatures, the balance between these two mechanisms is disrupted: the diffusion coefficient drops sharply, and the diffusion ability of water strongly depends on temperature. At low temperatures (such as −20 °C), the diffusion coefficient of water in the membrane and porous media can decrease by several orders of magnitude, and the rate of back diffusion is significantly reduced. Electro-osmotic drag is relatively dominant: although the electro-osmotic drag coefficient also decreases with temperature, its reduction is relatively mild compared to diffusion. Under a certain current density drive, the amount of water dragged from the anode to the cathode may exceed the amount of water that can diffuse back from the cathode to the anode. Therefore, net accumulation of water occurs on the cathode side (especially inside the CL). This water, “trapped” in the porous structure of the cathode, provides a source of material for ice formation and blockage of porous electrode pores. The water produced by the ORR tends to freeze rapidly in porous electrodes, which not only covers the electrochemical active sites, severely hinders oxygen transmission, and diminishes the electrode reaction activity, but also leads to cold start failure and even damage to the membrane electrode assembly [5,10,11,12,13]. Reliable cold starts require raising the fuel cell stack’s temperature above freezing before gas transmission pathways are entirely obstructed [14]. Therefore, optimizing cold start strategies is of paramount theoretical and practical importance to advancing the engineering applications of fuel cells in cold climates.
Cold start strategies for PEMFC can be broadly classified into self cold start strategies and auxiliary heating strategies, based on the heating method employed. Self cold start strategies primarily depend on the heat naturally generated by internal electrochemical reactions within the fuel cell to achieve a cold start. Min et al. [15] proposed a novel current cold start mode, demonstrating its effectiveness in balancing heat generation and heat loss during the cold start process, thereby outperforming traditional cross-flow and linear current modes. Lei et al. [16] employed transient numerical simulation methods to evaluate different current loading modes and found that the step current-loading mode significantly enhances cold start performance. Pan et al. [17] introduced an adaptive cold start strategy based on maximum power tracking, dynamically balancing the current load distribution to mitigate ice formation while maximizing heat generation. Du et al. [18] validated the maximum power cold start mode using a multiphase cold start model, increasing the cold start success rate and enhancing operational adaptability. Auxiliary heating strategies involve utilizing external heat sources to accelerate ice melting and increase cell temperature. Common external heat sources include heaters, preheated gases, coolant heating, and heat generated from catalytic reactions. Jiang et al. [19] analyzed various intake air heating methods and found that raising the intake air temperature promotes ice melting, reduces water-ice mixture ratios, and enhances cold start performance. Gießgen et al. [20] proposed a preheating strategy for PEMFC using a thermochemical heater, demonstrating the feasibility of externally heating the cell to −15 °C under −16 °C conditions before transitioning to internal heating. This method enabled rapid cold starts within 22.7 s in a −20 °C environment. Lin et al. [21] employed external electric heating to preheat the fuel cell, significantly reducing ice accumulation and achieving startups in approximately 11 min under −20 °C conditions. Sun et al. [22] introduced a catalytic hydrogen-oxygen reaction, designing a reverse gas supply device to facilitate bidirectional gas flow. This approach improved temperature uniformity during cold starts, thereby enhancing overall performance. Kim et al. [23] developed a heat pump-assisted thermal management system, which demonstrated significant improvements in cold start efficiency. By optimizing key parameters such as compressor speed, air velocity, and coolant volumetric flow rate, the system achieved a 29.9% reduction in cold start time and an 11.3% decrease in total energy consumption compared to the baseline thermal management system. Gebhardt et al. [24] arranged heating wires on the surface of the membrane electrode assembly (MEA). During the cold start phase, with the aid of an external power supply, the heating wires are heated to promote the smaller part of the battery MEA to achieve cold start first.
In addition, machine learning has been widely applied in PEMFCs in recent years. Wang et al. [25] generated data through a Computational Fluid Dynamics model to train a Support Vector Machine (SVM) surrogate model and combined it with a genetic algorithm to optimize the composition of the catalyst layer in PEMFCs, aiming to enhance the maximum power density of PEMFCs. Li et al. [26] screened key variables through variance analysis, trained an ensemble learning surrogate model, and combined it with the Non-dominated Sorting Genetic Algorithm-II (NSGA-II) method to perform multi-objective optimization on the power density, system efficiency, and oxygen distribution uniformity of the cathode catalyst layer in PEMFCs. As a result, a Pareto solution with superior performance to the base model was obtained, and the optimization time was significantly reduced. Zhang et al. [27] proposed a method combining a validated mechanistic model, an Extreme Learning Machine (ELM) data-driven surrogate model, and the NSGA-II multi-objective optimization algorithm to optimize the cold start parameters of PEMFCs at −30 °C, significantly improving the cold start performance. Wu et al. [28] proposed a semi-recursive sliding window combined with a neural network data flow model to study the cold start process of PEMFCs, identify safe critical operating conditions, and propose a real-time adaptive control strategy. This strategy shortened the start-up time by 26.7% at an initial temperature of −20 °C and also accurately predicted ice accumulation.
The self-cooling start strategy has certain advantages in medium- and low-temperature environments, but its effectiveness significantly decreases in extremely low temperature or rapid cooling start scenarios. Therefore, auxiliary heating is an inevitable choice for this condition [29]. In this study, coolant heating is preferred: compared to air heating, it has a larger heat capacity, uniform heat transfer, and small heat loss, which can avoid temperature fluctuations and additional icing induced by airflow; compared to resistance wire and hydrogen-oxygen catalytic combustion heating, it requires no additional components or destructive modifications, has lower cost, and is both economical and feasible [30]. Furthermore, existing research on PEMFC cold start optimization based on fundamental models such as Bidirectional Long Short (BiLSTM), SVM, ELM, and Convolutional Neural Network (CNN) combined with optimization algorithms exhibits certain limitations: these fundamental models struggle to adapt to the spatiotemporal coupling characteristics of heat transfer, mass transfer, and ice phase change during the cold start process, leading to insufficient prediction accuracy and limiting their practicality. To address this issue, this study proposes a multi-objective optimization framework of “CAB-Net surrogate model + LO-WOA”. The core idea lies in CAB-Net, which integrates multiple convolutional layers, a nonlinear activation function (ReLU), and a Squeeze-and-Excitation (SE) attention mechanism, which can accurately extract local temporal features and assign high weights to key parameters, assisting BiLSTM in extracting time-dimensional features and achieving full-dimensional coupled feature mining; LO-WOA introduces dictionary-ordered optimization logic (essentially converting the engineering priority of “reducing ice formation over reducing energy consumption” into an algorithm-embedded sequential coding weight), satisfying the set requirements of prioritizing the reduction of MIVF and secondary energy consumption.
This paper investigates cold start strategies for PEMFC under an environmental temperature of −20 °C, focusing on auxiliary heating as the primary research direction. The core objective is to propose a coolant-heating-based cold start strategy designed to elevate the temperature of the fuel cell (excluding gas flow channels) above the freezing point within a specified timeframe. Additionally, by optimizing operational parameters, state parameters, and structural parameters, this strategy aims to minimize the MIVF in the CCL and reduce energy consumption during the auxiliary heating process, thereby achieving an efficient and reliable low-temperature cold start solution. The primary contributions of this paper are summarized as follows:
- (1)
- Construction of the Numerical Model: A three-dimensional multiphase non-isothermal PEMFC numerical model was developed using the COMSOL Multiphysics 6.1 platform. This model, based on experimentally determined physical parameters, generated a substantial dataset comprising sample component data for subsequent analysis.
- (2)
- Development and Training of the Neural Network: A CAB-Net neural network was trained using the previously mentioned dataset to develop a surrogate model for the PEMFC. This model reliably forecasts system performance across diverse operating conditions, facilitating subsequent optimization efforts.
- (3)
- Application of the Optimization Algorithm: The study integrated the LO-WOA with the CAB-Net neural network to identify the optimal combination of operational parameters and state variables. The parameters include , , , , , .
- (4)
- Analysis of Simulation Results: Simulations were conducted using the optimized parameter combinations to evaluate their effectiveness in reducing the MIVF within the CCL and decreasing energy consumption associated with reaching the MIVF.
2. Model Development
2.1. Optimized Structural Framework for Fuel Cell Cold Start
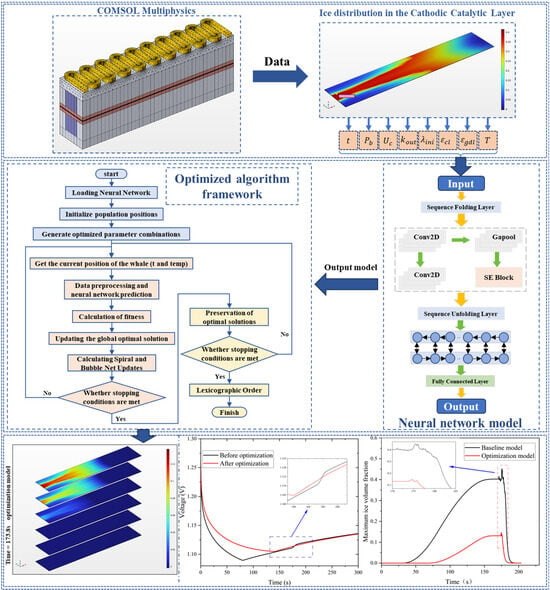
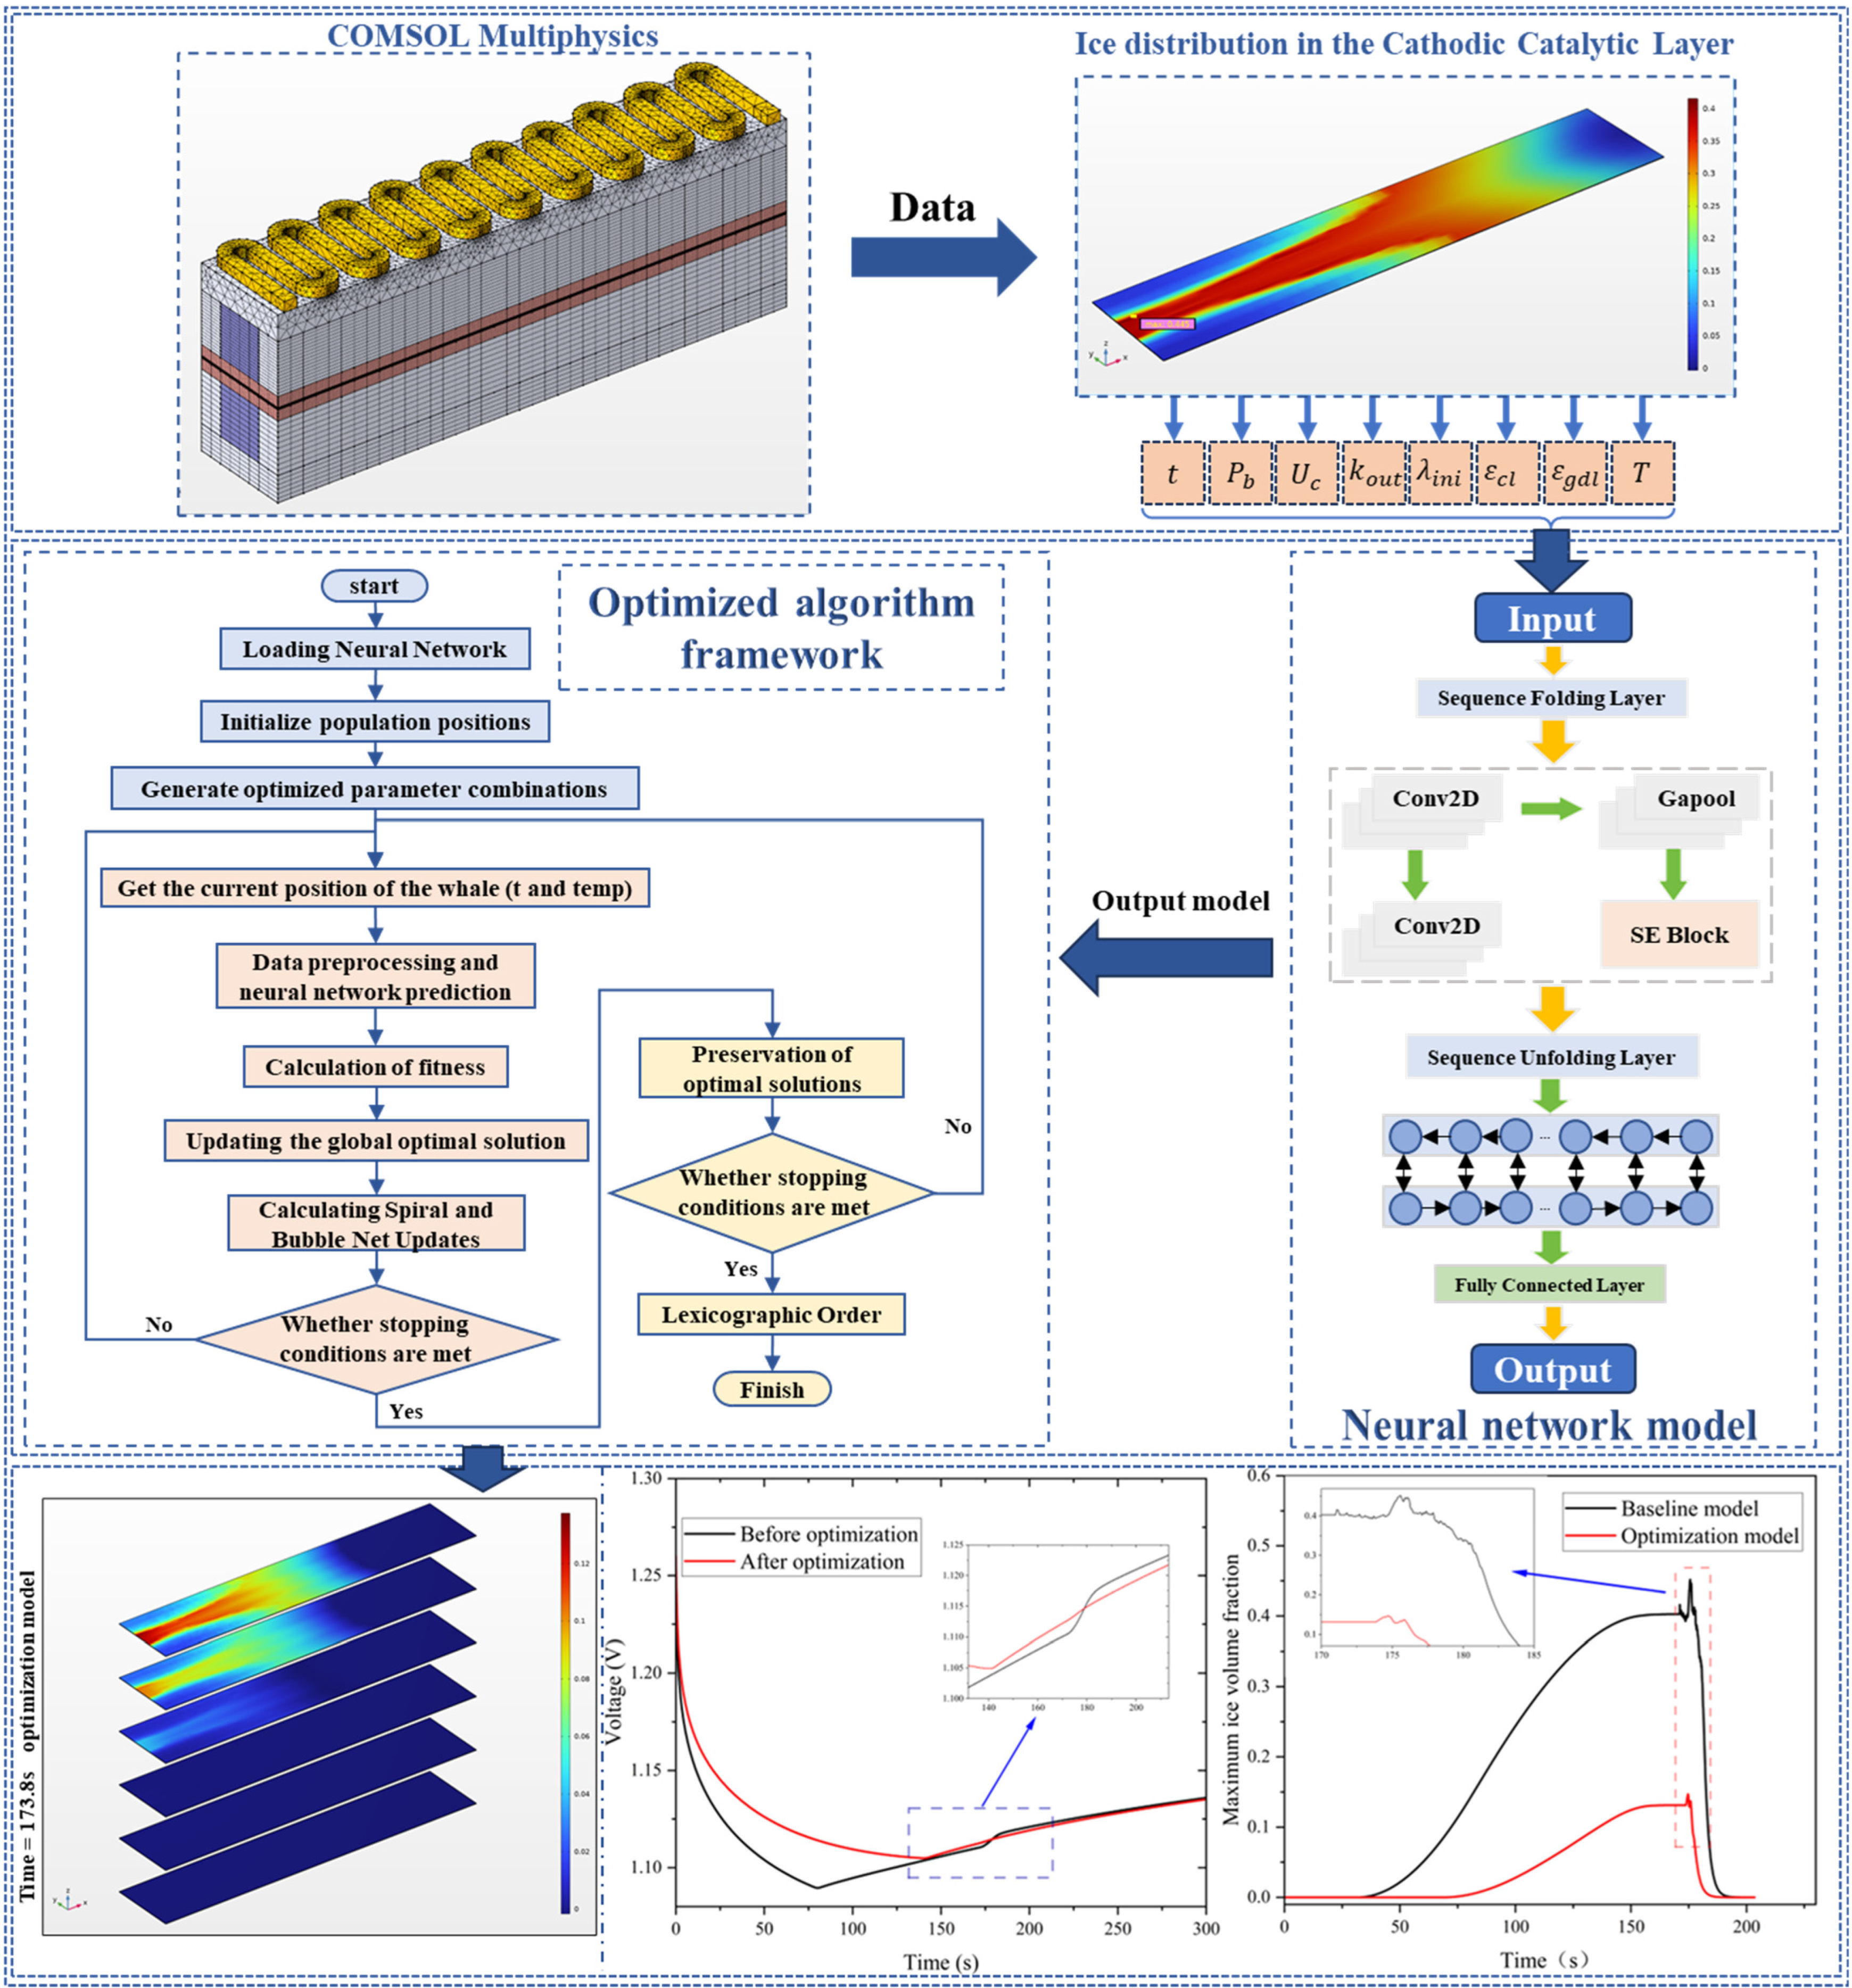
The workflow for the optimization of the PEMFC auxiliary cold start in this study is illustrated in Figure 1. Initially, a three-dimensional multiphase non-isothermal PEMFC numerical model was developed using COMSOL Multiphysics 6.1. This model was employed to generate a comprehensive dataset, serving as the foundation for training the CAB-Net neural network model. Subsequently, the trained CAB-Net model was integrated with the LO-WOA to ascertain the optimal parameter configuration. Finally, these optimized parameters were applied to the COMSOL model for validation, and the results were analyzed in detail.
Figure 1.
Flowchart of the cold start optimization scheme for PEMFC.
2.2. Model Assumptions
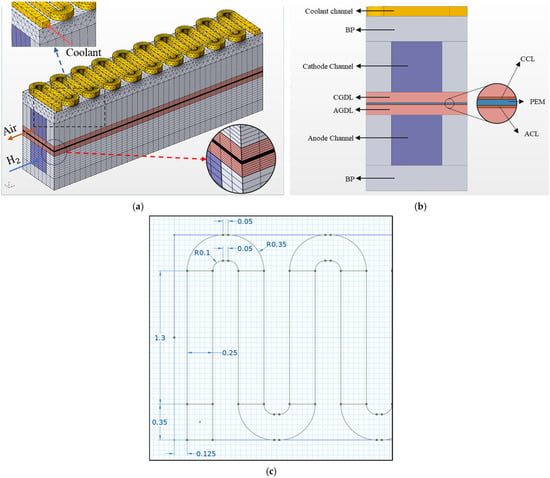
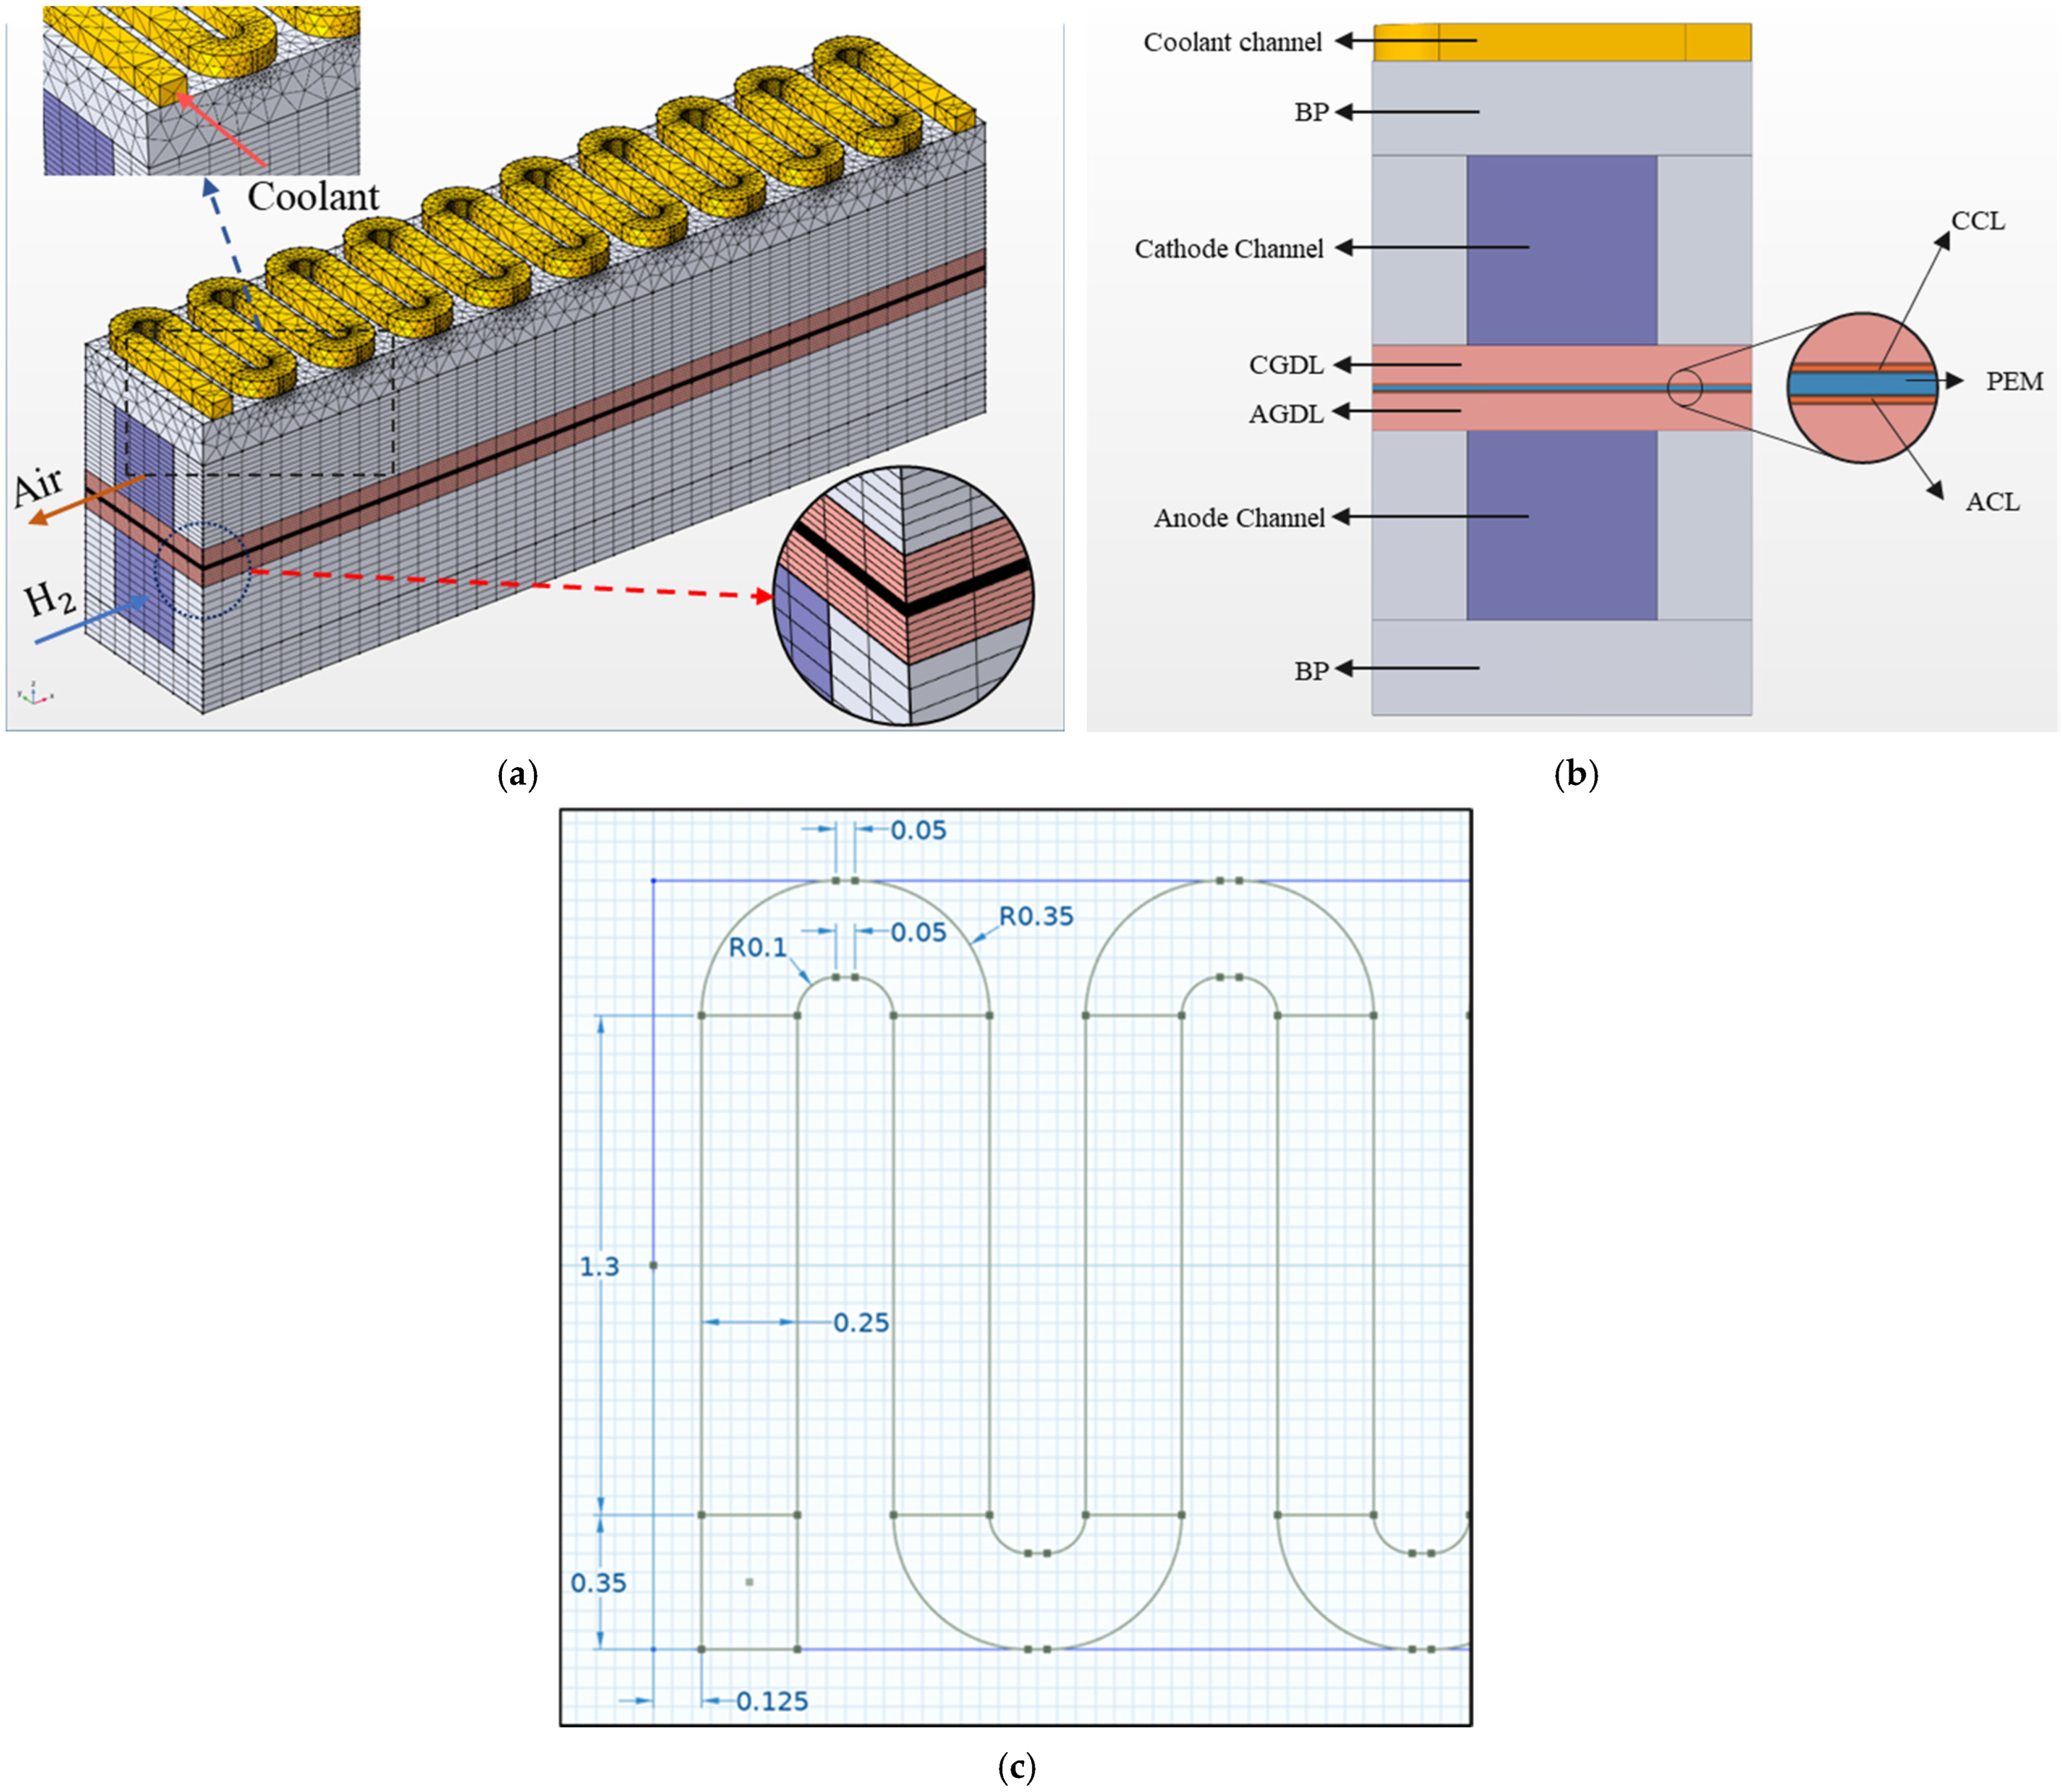
This section presents three-dimensional modeling of a PEMFC with parallel gas flow channels. The model incorporates all key components of a PEMFC, including bipolar plates (BP), gas flow channels, gas diffusion layers (GDL), CL, and the proton exchange membrane (PEM), as illustrated in Figure 2. Figure 2a presents the computational domain and mesh structure utilized for simulating the coolant-assisted heating process during the cold start. Figure 2b provides a detailed depiction of the structural components, including the coolant flow channels, BP, gas flow channels, GDL, CL, and the PEM. In this study, the coolant flow channel design is based on a serpentine flow channel layout [31], which is arranged above the cathode end plate. This layout was selected because, during the cold start process, ice primarily forms at the interface between the CCL and Cathode GDL. This arrangement facilitates the effective conduction of heat from the coolant to the MEA, particularly to CCL, thereby improving the heating efficiency. Furthermore, Figure 2c depicts the planar geometric parameters of the coolant flow channels, with dimensions specified in millimeters (mm). The geometric parameters of each component layer are summarized in Table A1.
Figure 2.
(a) Three-dimensional model and mesh structure. (b) Computational domain. (c) Planar parameters of the coolant flow channel.
The fuel cell model developed in this study thoroughly accounts for the critical variables influencing ice formation, including liquid water, water vapor, frozen membrane water, and unfrozen membrane water. The non-equilibrium phase change theory is employed to accurately describe the phase change process of liquid water in PEMFC. Under this theoretical framework, unfrozen membrane water is considered to be supersaturated with respect to water vapor, and the water generated from the cathode’s electrochemical reactions is classified as unfrozen membrane water. The model is built on the following assumptions:
- (a)
- The reactant gases are presumed to obey the ideal gas law.
- (b)
- The porous medium materials are uniform and isotropic.
- (c)
- Both the reactant gas flow within the PEMFC and the coolant flow in the cooling channels are assumed to be laminar.
- (d)
- Gravity effects are neglected in the simulation.
- (e)
- Water produced by the reaction is instantly converted into ice.
- (f)
- The densities of ice and liquid water remain constant during the reaction.
2.3. Model Conservation Equations
Table A2 provides a detailed list of ten conservation equations. These equations are solved within different solution domains, encompassing the key physical phenomena during the cold start-up process of a PEMFC. The associated source terms for these conservation equations are provided in Table A3.
The gas mixture’s density is determined using the ideal gas law, expressed as:
is the density of the gas mixture, is the gas phase pressure (Pa), is the temperature (K), is the universal gas constant (, K−1∙kmol−1), is the mass fraction of species , is the molecular weight of species (kg∙kmol−1). The dynamic viscosity of an ideal gas mixture, (kg∙m−1s−1), can be calculated based on kinetic theory [32] as follows:
where is the mole fraction of substance , and and represent different substances.
The cold start model developed in this paper is warmed from 253.15 to 273.15 K, accommodating a wide range of temperature variations. Therefore, the effect on different parameters due to temperature variation must be considered. Table A4 presents the relationships between each component’s dynamic viscosity and mass diffusion coefficient with variations in temperature and pressure.
where (m2∙s−1) denotes the mass diffusion coefficient for substance [33], determined using the correlations presented in Table A4.
The chemical reaction rates on the anode and cathode catalyst layers ( and , A∙m−3) [34] are approximately represented using the Butler-Volmer equation:
where (C∙mol−1) is Faraday’s constant, and are the exchange current densities for the anode and cathode, respectively, with their expressions listed in Table A5. A linear relationship is assumed to account for the blockage of reaction sites by ice and liquid water [33,35,36]. Additionally, Table A5 provides parameters associated with the electrochemical reactions. Exchange current densities are significantly influenced by temperature variations due to alterations in the kinetics of electrochemical reactions [37], and the associated relationships are detailed in Table A5.
Reference [38] provides density data for both liquid water and ice, revealing that their densities are largely unaffected by changes in temperature. Consequently, the COMSOL model developed in this study assumes constant density values for liquid water and ice, as shown in Table A1. The interfacial drag coefficient () is defined in reference [33,39] as
Since the dynamic viscosity of liquid water () exhibits a strong positive correlation with temperature, the correlation of liquid water viscosity with temperature, as listed in Table A4, is used instead of assuming a constant value. In the definition of the diffusion coefficient of liquid water in the GDL and CL (, m−2∙s−1), the influence of capillary pressure on the value is considered [9,40].
The capillary pressure (, Pa) [9] is calculated based on the liquid water volume fraction (Leverett function) as follows:
where denotes the contact angle (values are provided in Table A1), and its magnitude is contingent upon the wettability of GDL and CL; (N∙m−1) represents the surface tension between liquid water and gas. Drawing from the experimental data presented in [38], a linear correlation function was established to account for temperature dependence within the range of 273.15 K to 373.15 K. The subsequent linear correlation function is derived from the experimental data in [9].
where is in N∙m−1 and is in K. The liquid-phase pressure (, Pa) was calculated from the capillary pressure (, Pa) and the gas-phase pressure (, Pa) [40].
The liquid-phase velocity [41] (, m∙s−1) can be calculated from the liquid-phase pressure:
The diffusion coefficient for the non-freezing membrane water content (, m2∙s−1) is defined as [9,33]
where and are expressed in units of (m2∙s−1) and K, respectively. The equilibrium membrane water content (hydration number) is calculated based on the correlation coefficients found in [42,43,44].
where [45] is the water activity, defined as
where [33] denotes the vapor saturation pressure at 273.15 K.
The difference between and reflects the direction of water transfer into or out of the membrane. Based on the experimental data presented in [46], the saturated membrane water content () is calculated
Table A6 provides the phase transition function describing the transitions among vapor, liquid water, and ice within the GDL and CL. In parallel, Table A7 outlines the functions that regulate phase changes and water transfer related to membrane water content [47]. The specific rates of phase transitions and water transfers are detailed in Table A4. The calculation of the temperature difference between the freezing point during the fuel cell’s cold start and the standard freezing temperature, , is outlined as follows [33]:
The ionic conductivity of the ionomer (, S∙m−1) [48] is defined by
The effective electronic conductivity in CL and GDL, as well as the ionic conductivity in the CL, are further influenced by the porosity () of the CL and GDL, along with the volume fraction of ionic polymers in the CL (). In accordance with the Bruggeman correlation, an exponent of 1.5 is utilized:
The effective volumetric heat capacity (J∙m−3∙K−1) in the energy conservation equation in Table A2 is determined to be
where (, J∙kg−1∙K−1) is the specific heat capacity of the gas mixture, which is determined from the mass fractions of the components.
where (, J∙kg−1∙K−1) denotes the heat capacity of the electron conductor material (e.g., platinum powder, carbon powder, etc.) in CL as well as all solid materials in GDL and BP. For simplicity, the effective thermal conductivity (, m−1∙K−1) in the energy conservation equation is assumed to represent the volume-averaged value.
where the thermal conductivity of the gas mixture (, W∙m−1∙K−1) is calculated based on kinetic theory, defined as [49].
The latent heat function ( W∙m−3) [33] is defined as
2.4. Boundary Conditions
In this paper, the definitions of the anode and cathode overpotentials () and the reversible potential () are as follows [33]:
The cathode gas flow direction is opposite to the anode, with symmetrical boundaries of the BP and MEA. At the inlet of the cathode and anode flow paths, the mass flow rate (kg∙s−1) is defined as [50]
where and are the stoichiometric ratios for the anode and cathode, respectively (dimensionless), is the reference current density (A∙cm−2). The values of these parameters are listed in Table A1. is the planar active surface area of the CL in square meters (m2).
The auxiliary heating start-up model proposed in this study focuses solely on a small portion of the direct-passage area of the single battery cell. As a result, it is assumed that the inlet gas temperature is equivalent to the ambient temperature. Consequently, at each time step, the cathode inlet temperature (, K) is defined as equal to the volume-averaged cell temperature (, K).
The electron potentials on the anode and cathode BP end faces are defined [33]:
where and are the reversible and operating voltages, and hence denotes the total voltage loss.
The thermal conductivity between the fuel cell surface and its surroundings can be determined using the following equation [51,52]:
where (W) represents the heat transfer rate between the battery and the surrounding environment, with a positive value indicating heat absorption by the battery and vice versa. is the heat transfer coefficient (W∙m−2∙K−1), is the surface area of the unit wall (m2), is the temperature of the surrounding environment (K), and is the temperature of the unit wall (K).
2.5. Numerical Analysis Methods
In this study, COMSOL Multiphysics 6.1 simulation software was employed to analyze the coolant-assisted heating during the cold start process of PEMFC. In the simulation model, physics-controlled meshing was utilized for the cathode-side end plate and coolant flow channel areas, while hexahedral meshes were applied to all other components. Considering that chemical reactions predominantly occur at the MEA, the mesh in the MEA region was refined more densely than in other areas to enhance computational precision, as illustrated in Figure 2a.
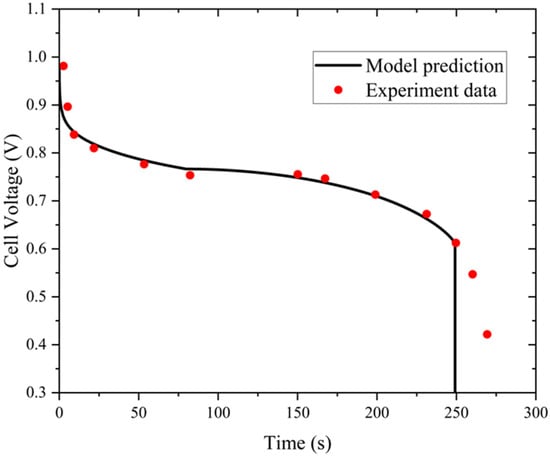
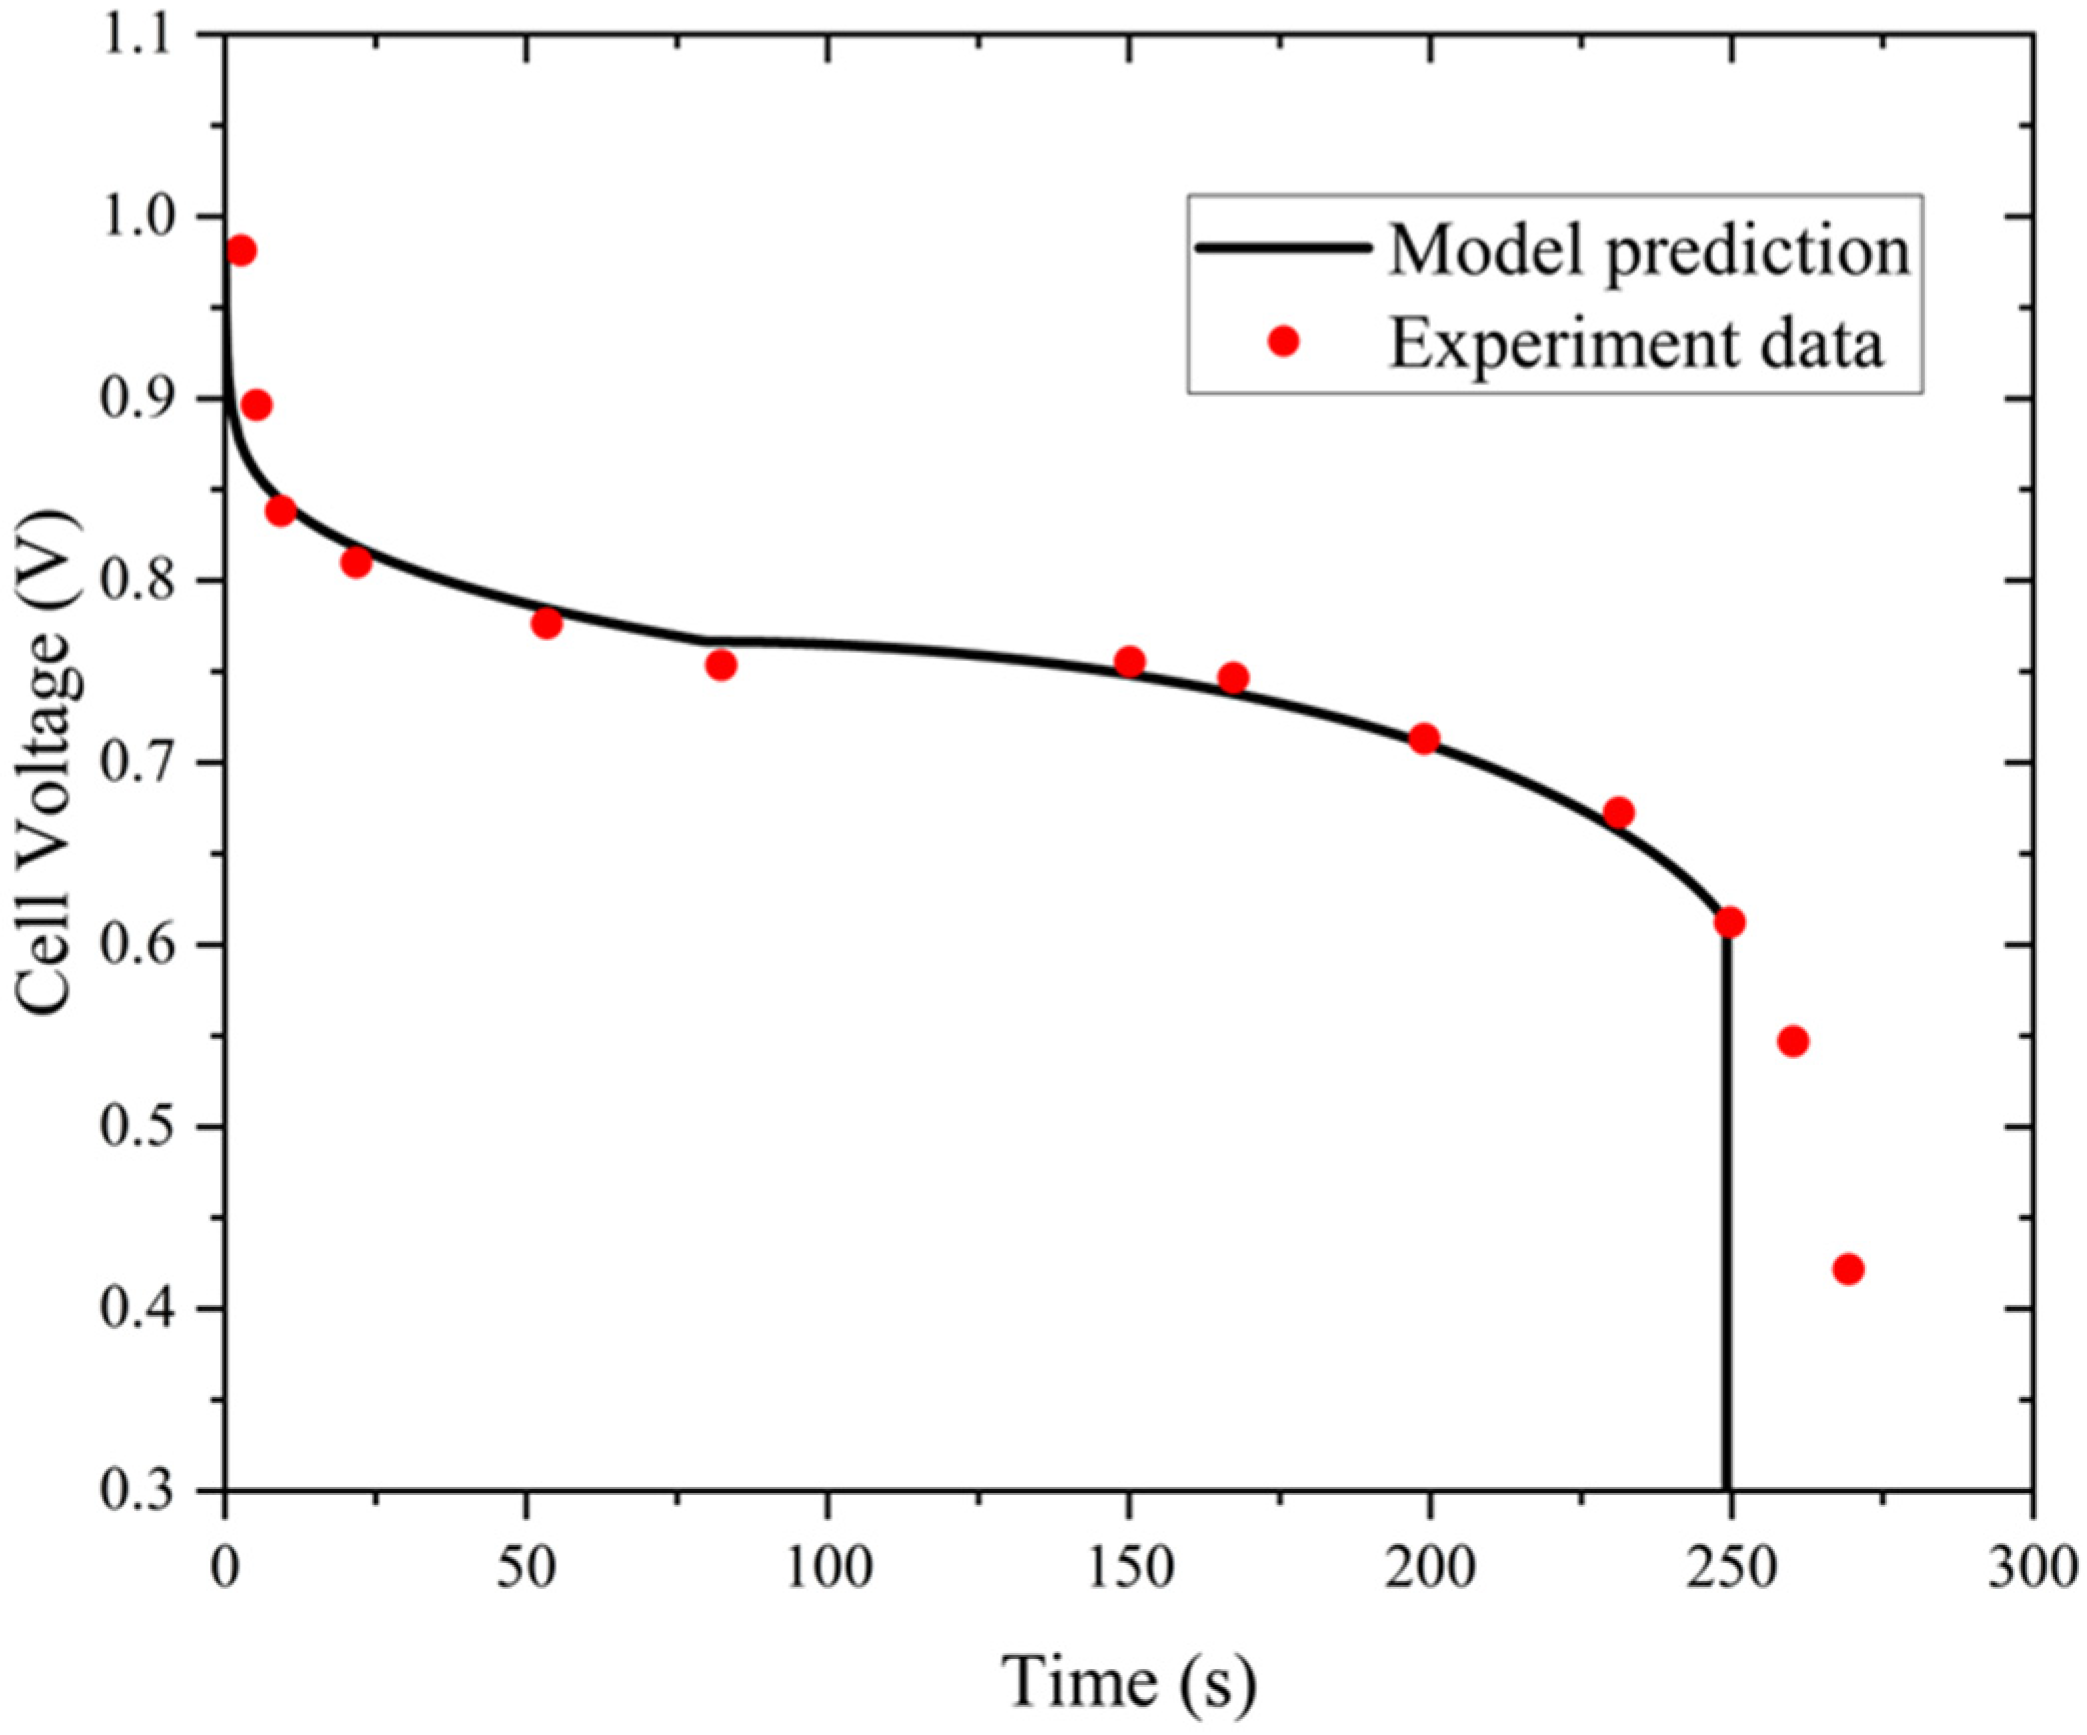
Since the initial current reaches its maximum value after startup and stabilizes after 80 s, the voltage at this time is selected for grid independence verification, as shown in Table 1. The calculation results indicate that, compared to grids 7040 and 19,840, the voltage of grid 14,784 is more suitable for simulation research (with a deviation of less than 2% from experimental values). Further increasing the number of grids has little impact on the results. Therefore, this paper chooses a grid count of 14,784, and the model curve fitted using 14,784 grids is shown in Figure 3.
Table 1.
Grid-independence analysis.
Figure 3.
Comparison between the simulation model predictions and the experimental results.
2.6. Model Validation
As depicted in Figure 3, the model predictions align closely with the experimental data [53]. The water absorption properties of the membrane contribute to a marked improvement in PEMFC performance during the cold start process. Once the membrane reaches its saturation water content, the water generated during the electrochemical reaction begins to accumulate and freeze within CL and GDL. A sharp decline in the polarization curve is observed around 250 s, when the MIVF reaches unity. At this point, the fuel cell reaction in COMSOL ceases abruptly, leading to a significant deviation between the predicted and experimental results. While the ice formation process in a real-world environment is more complex, the ice conservation equation utilized in this study assumes a linear relationship between the ice volume fraction and time, which introduces a discrepancy in the final segment of the polarization curve. Overall, the model predictions remain in strong agreement with the experimental data.
3. Convolutional Neural Network–Attention Mechanism–Bidirectional Long Short-Term Neural Network
The CAB-Net model integrates the strengths of CNN, the Attention Mechanism, and BiLSTM, enabling it to effectively capture both local features and long-range dependencies in sequential data. By leveraging the spatial feature extraction capabilities of CNN and the temporal dependency modeling of BiLSTM, and connecting these components through the Attention Mechanism, the model significantly enhances its ability to focus on critical features, improving overall performance.
3.1. Data Processing
From the COMSOL simulation model, the ice volume fraction of the fuel cell stack and the corresponding temperature data at each time step were exported using a time step of 0.1 s. By concatenating 30 sets of time series, a dataset containing over 60,000 samples was generated. At each time step, the ice volume fraction of the fuel cell stack corresponds to the highest ice volume fraction observed within the CCL, which is referred to in this paper as the CCL ice volume fraction. Its mathematical expression is given by:
where represents the ice volume fraction at various positions within the CCL. In the dataset, the following input features were selected for the neural network model: time (), , , , , , , and temperature (). The ice volume fraction () was chosen as the output feature.
3.2. Neural Network Model Development
3.2.1. CNN
The core concept of a CNN [54] is to extract local features from input data through convolution operations and to progressively extract higher-level features through a hierarchical structure of layers.
In the time series prediction model proposed in this paper, the CNN plays a critical role in feature extraction and optimization. By employing multi-layer convolution operations combined with a ReLU and the SE mechanism, the CNN effectively extracts meaningful local features from the original time series data, providing high-quality inputs for subsequent BiLSTM layers and final prediction tasks.
This model utilizes two convolutional layers with 1 × 1 convolutional kernels, enabling the local combination of data to extract fundamental patterns. The convolutional kernel weights are optimized during training, allowing the model to identify significant local features. After each convolutional layer, the ReLU activation function is applied to truncate negative values to zero, which sparsifies the feature outputs, reduces noise interference, enhances nonlinear representation, and enables the model to capture complex time series relationships. The convolutional output is then processed through global average pooling to generate a comprehensive global feature description.
3.2.2. Attention Mechanism
The Attention Mechanism [55] is a fundamental technique in deep learning, designed to replicate the human ability to selectively concentrate on relevant information when processing extensive datasets. The primary concept of the attention mechanism involves assigning weights or scores to different segments of the input data, thereby effectively emphasizing the most significant features. In this paper, the SE attention mechanism [56] is employed. The SE module enhances the performance of CNN architectures by adaptively recalibrating channel-wise feature responses, achieving notable improvements with minimal additional computational overhead.
3.2.3. BiLSTM
BiLSTM [57] is an enhanced variant of Recurrent Neural Networks specifically engineered to handle and forecast time-varying sequential data. By extending the standard Long Short-Term Neural Network (LSTM) into a bidirectional structure, BiLSTM captures both forward and backward dependencies in a sequence using two LSTM layers—one for forward and the other for backward processing. This bidirectional framework enables the extraction of richer contextual information from the data.
3.2.4. CAB-Net
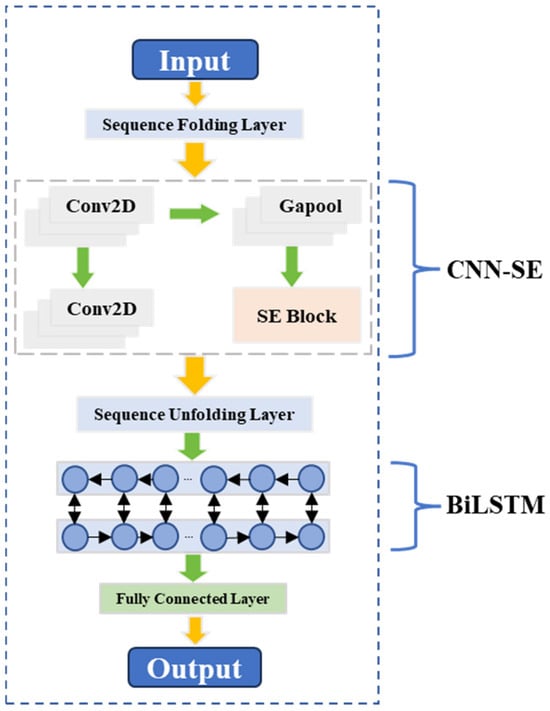
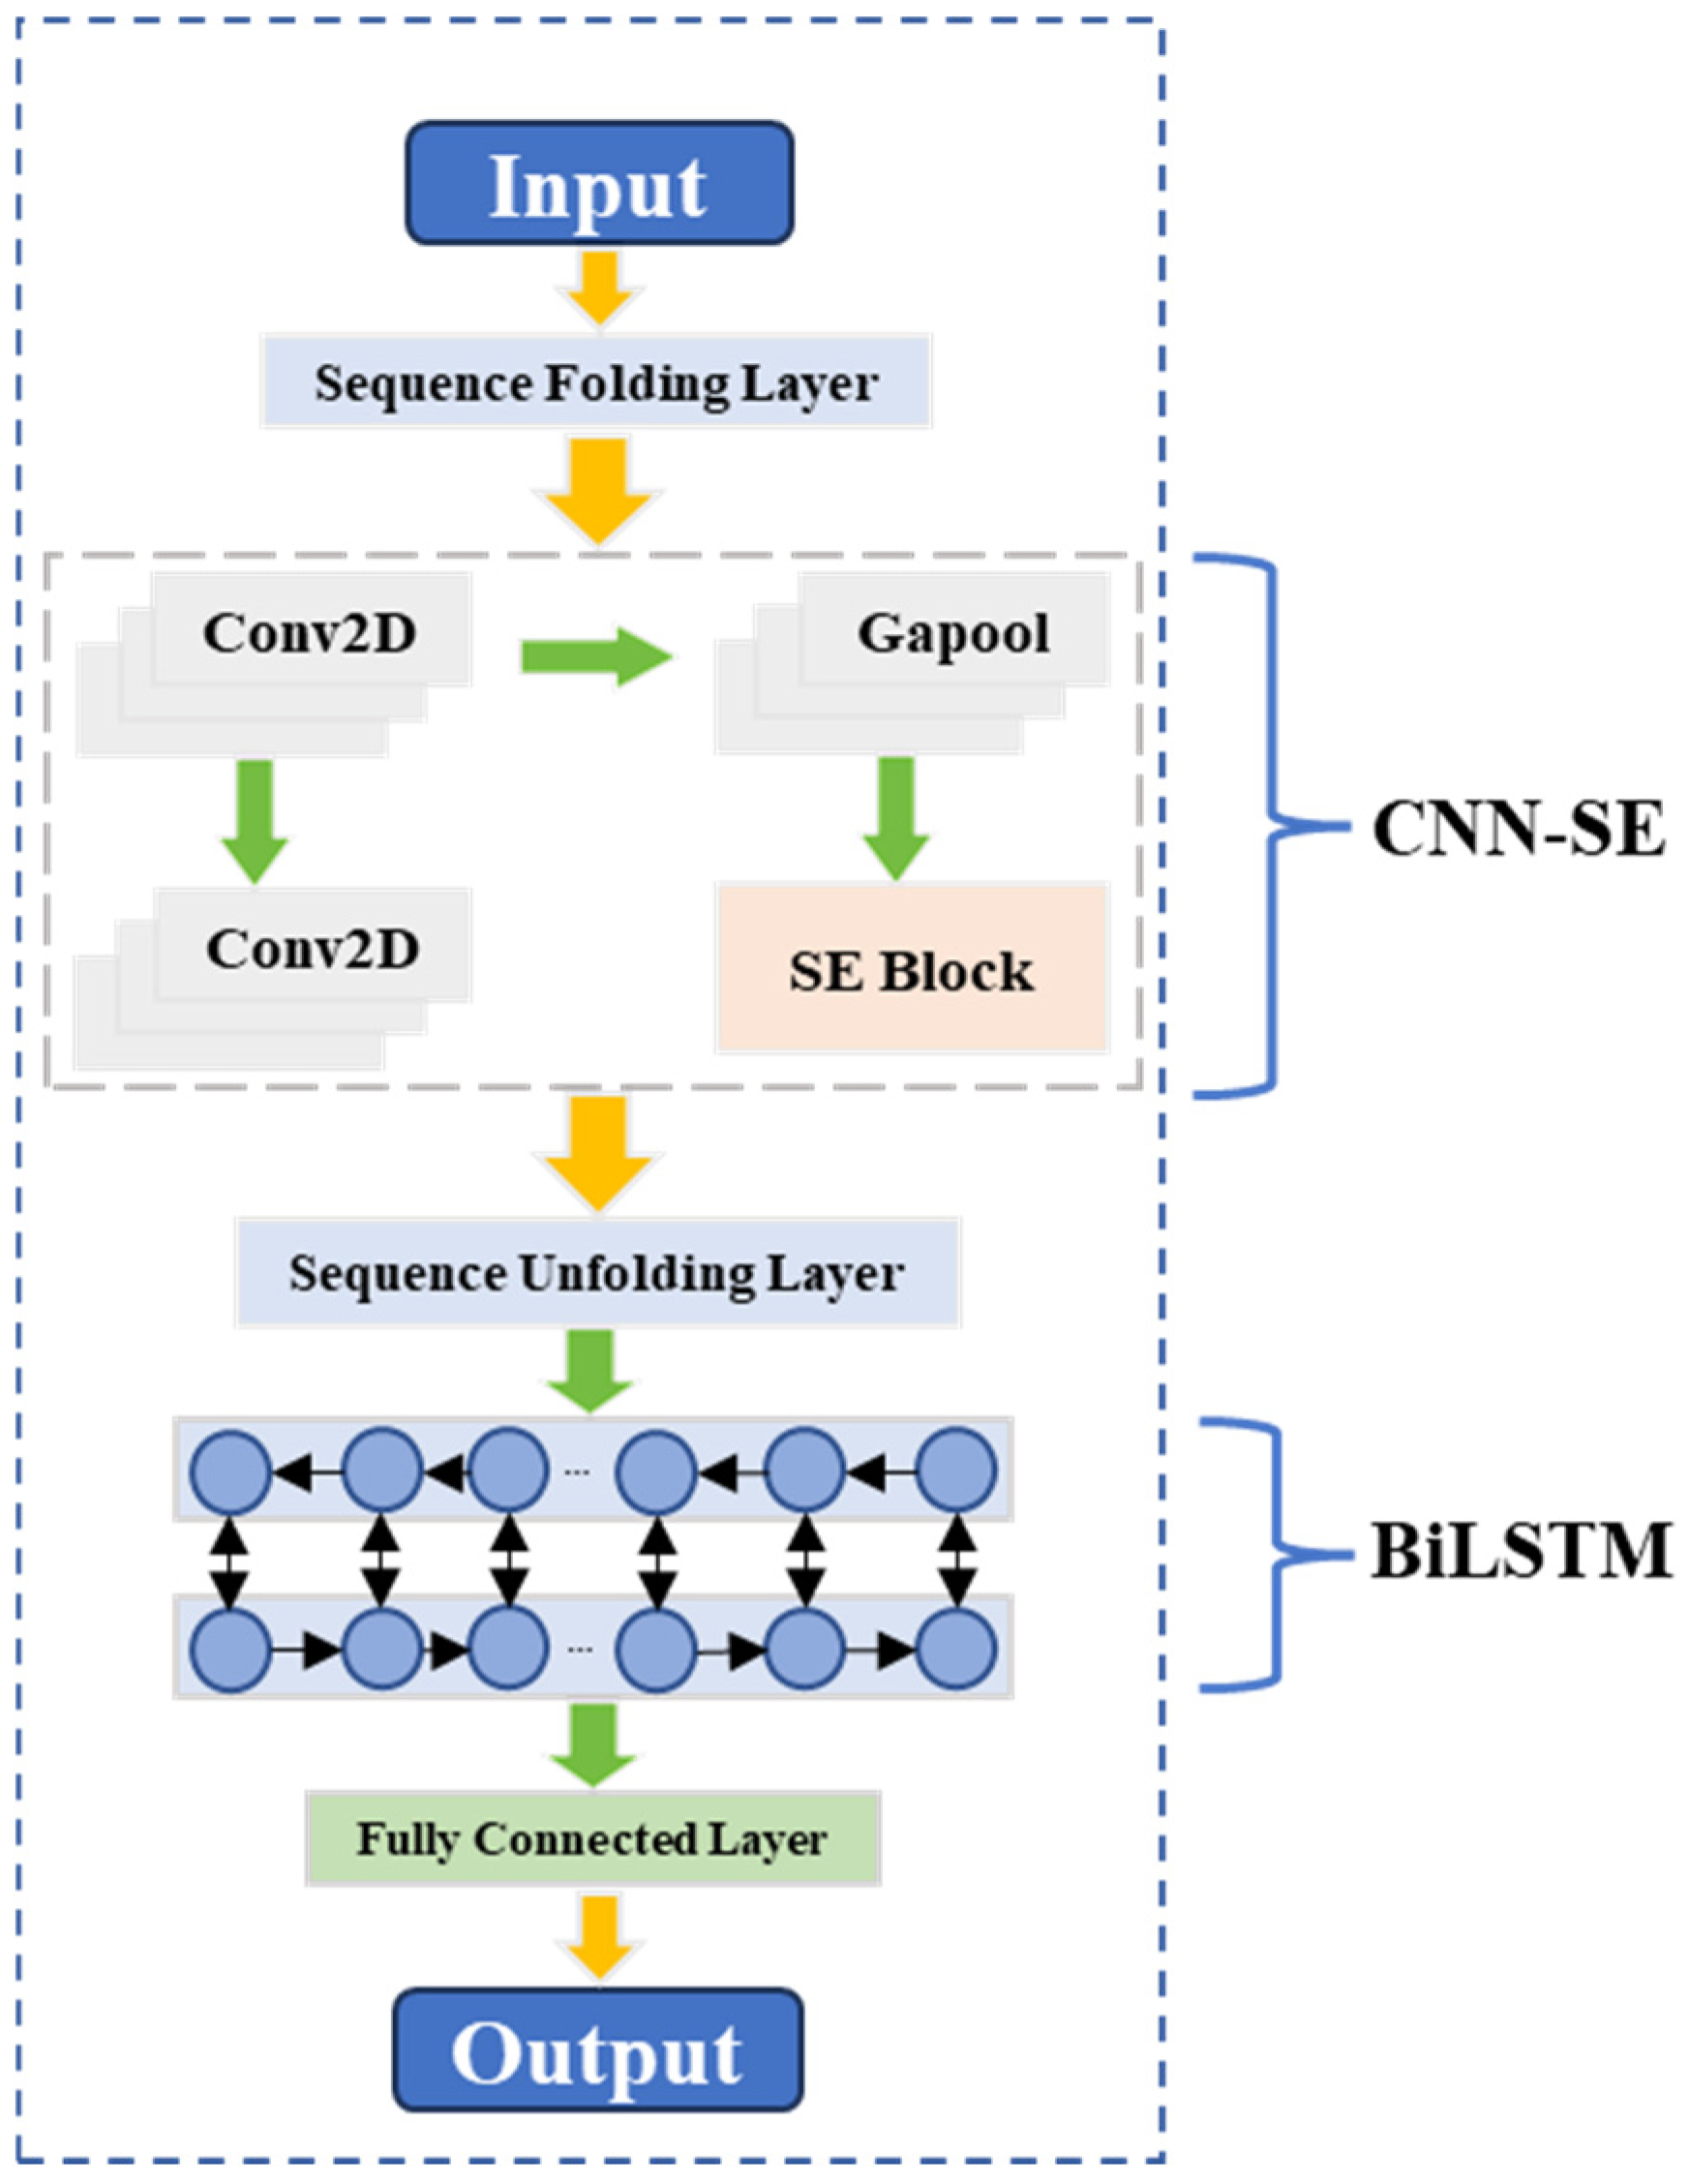
Building on the previously discussed analysis, this study introduces a predictive approach utilizing the CAB-Net model, as shown in Figure 4. The dataset is split into 70% training, 20% validation, and 10% test sets, respectively. These subsets are then normalized and transformed into tuple array formats to enable precise training and validation of the model.
Figure 4.
The foundational architecture of the CAB-Net model.
The neural network model processes sequential input by first converting it into a format suitable for CNN processing through a sequence folding layer. The CNN extracts features using two 1 × 1 convolutional layers and incorporates the ReLU activation function to introduce nonlinearity. Simultaneously, the SE attention mechanism employs global average pooling and a fully connected layer to generate channel-level attention weights. These weights are passed through a sigmoid activation layer and connected to a multiplication layer, which fuses the CNN-extracted features with the attention weights, assigning higher importance to critical feature channels. The fused features are then connected to the input of the sequence back-folding layer, which recovers the data in its original sequential format. Subsequently, a BiLSTM layer captures temporal dependencies in the sequence. The model focuses on extracting features from the final practice phase, producing the ultimate prediction through a fully connected layer, and subsequently processing the results with a custom weighted regression layer.
3.3. Neural Network Model Validation
The CAB-Net neural network, implemented in MATLAB R2024b, was designed to process over 60,000 sets of data exported from COMSOL simulations. These datasets comprised input variables such as time (), heat dissipation rate (), coolant flow velocity (), load current slope (), initial membrane water content (), catalyst layer porosity (), gas diffusion layer porosity (), and temperature ().
represents the heat consumption rate. An increase in the value indicates that the cooling liquid provides more heat to the fuel cell (FC), which means the fuel cell heats up faster. Conversely, a decrease in the value indicates a slower heating rate. denotes the flow rate of the cooling liquid. A higher value indicates faster flow of the cooling liquid within the flow domain, which means that the cooling liquid can remove more heat in the same amount of time, resulting in a more uniform temperature distribution. signifies the current slope. A higher value means the load current will reach the working current density (160 mA∙cm−2) in a shorter time, allowing the fuel cell to enter the full-load state set by the simulation earlier. represents the initial membrane water content. When is below 2.5, the PEM’s resistance increases due to excessive drying, while an increase in makes the ice volume fraction more prone to increase. and represent the percentage of pore volume in the total volume of the material for CL and GDL (both porous media), respectively. These are key parameters that characterize the porous structure. An increase in and values, or a decrease in and values, indicates that the mass transfer channels of CL and GDL are prone to freezing and blockage, which is not conducive to cold start-up. Conversely, if and are too high, it indicates that the structural strength of CL and GDL is insufficient, and the volumetric stress generated by ice formation is more likely to cause irreversible damage to the porous media, reducing the lifespan of the MEA.
In this context, time () represents the duration from the initiation of auxiliary heating to the point where the lowest temperature within the fuel cell model (excluding the gas flow channel) reaches the freezing threshold, recorded at intervals of 0.1 s. Similarly, temperature () was recorded at intervals of 0.1 s throughout the entire duration. The ice volume fraction was employed as the output variable to evaluate the potential risk of freezing during the cold start process.
The key parameters of the neural network model are shown in Table 2. To rigorously evaluate the performance of CAB-Net, this study employed four quantitative error assessment metrics: Mean Squared Error (), Root Mean Squared Error (), Coefficient of Determination (), and -based Predictive Deviation ().
Table 2.
Key Parameters of the Neural Network Model.
The detailed error results are presented in Table 3.
Table 3.
Neural network accuracy comparison.
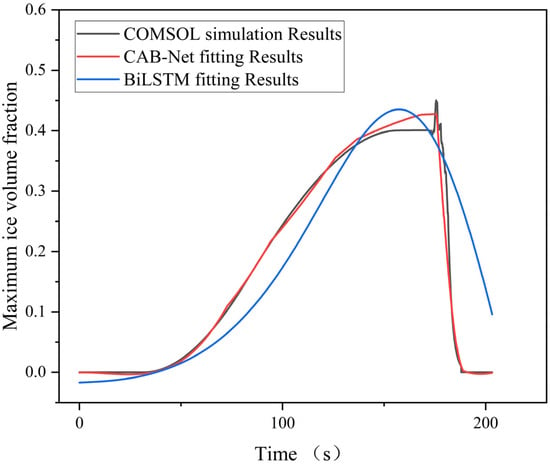
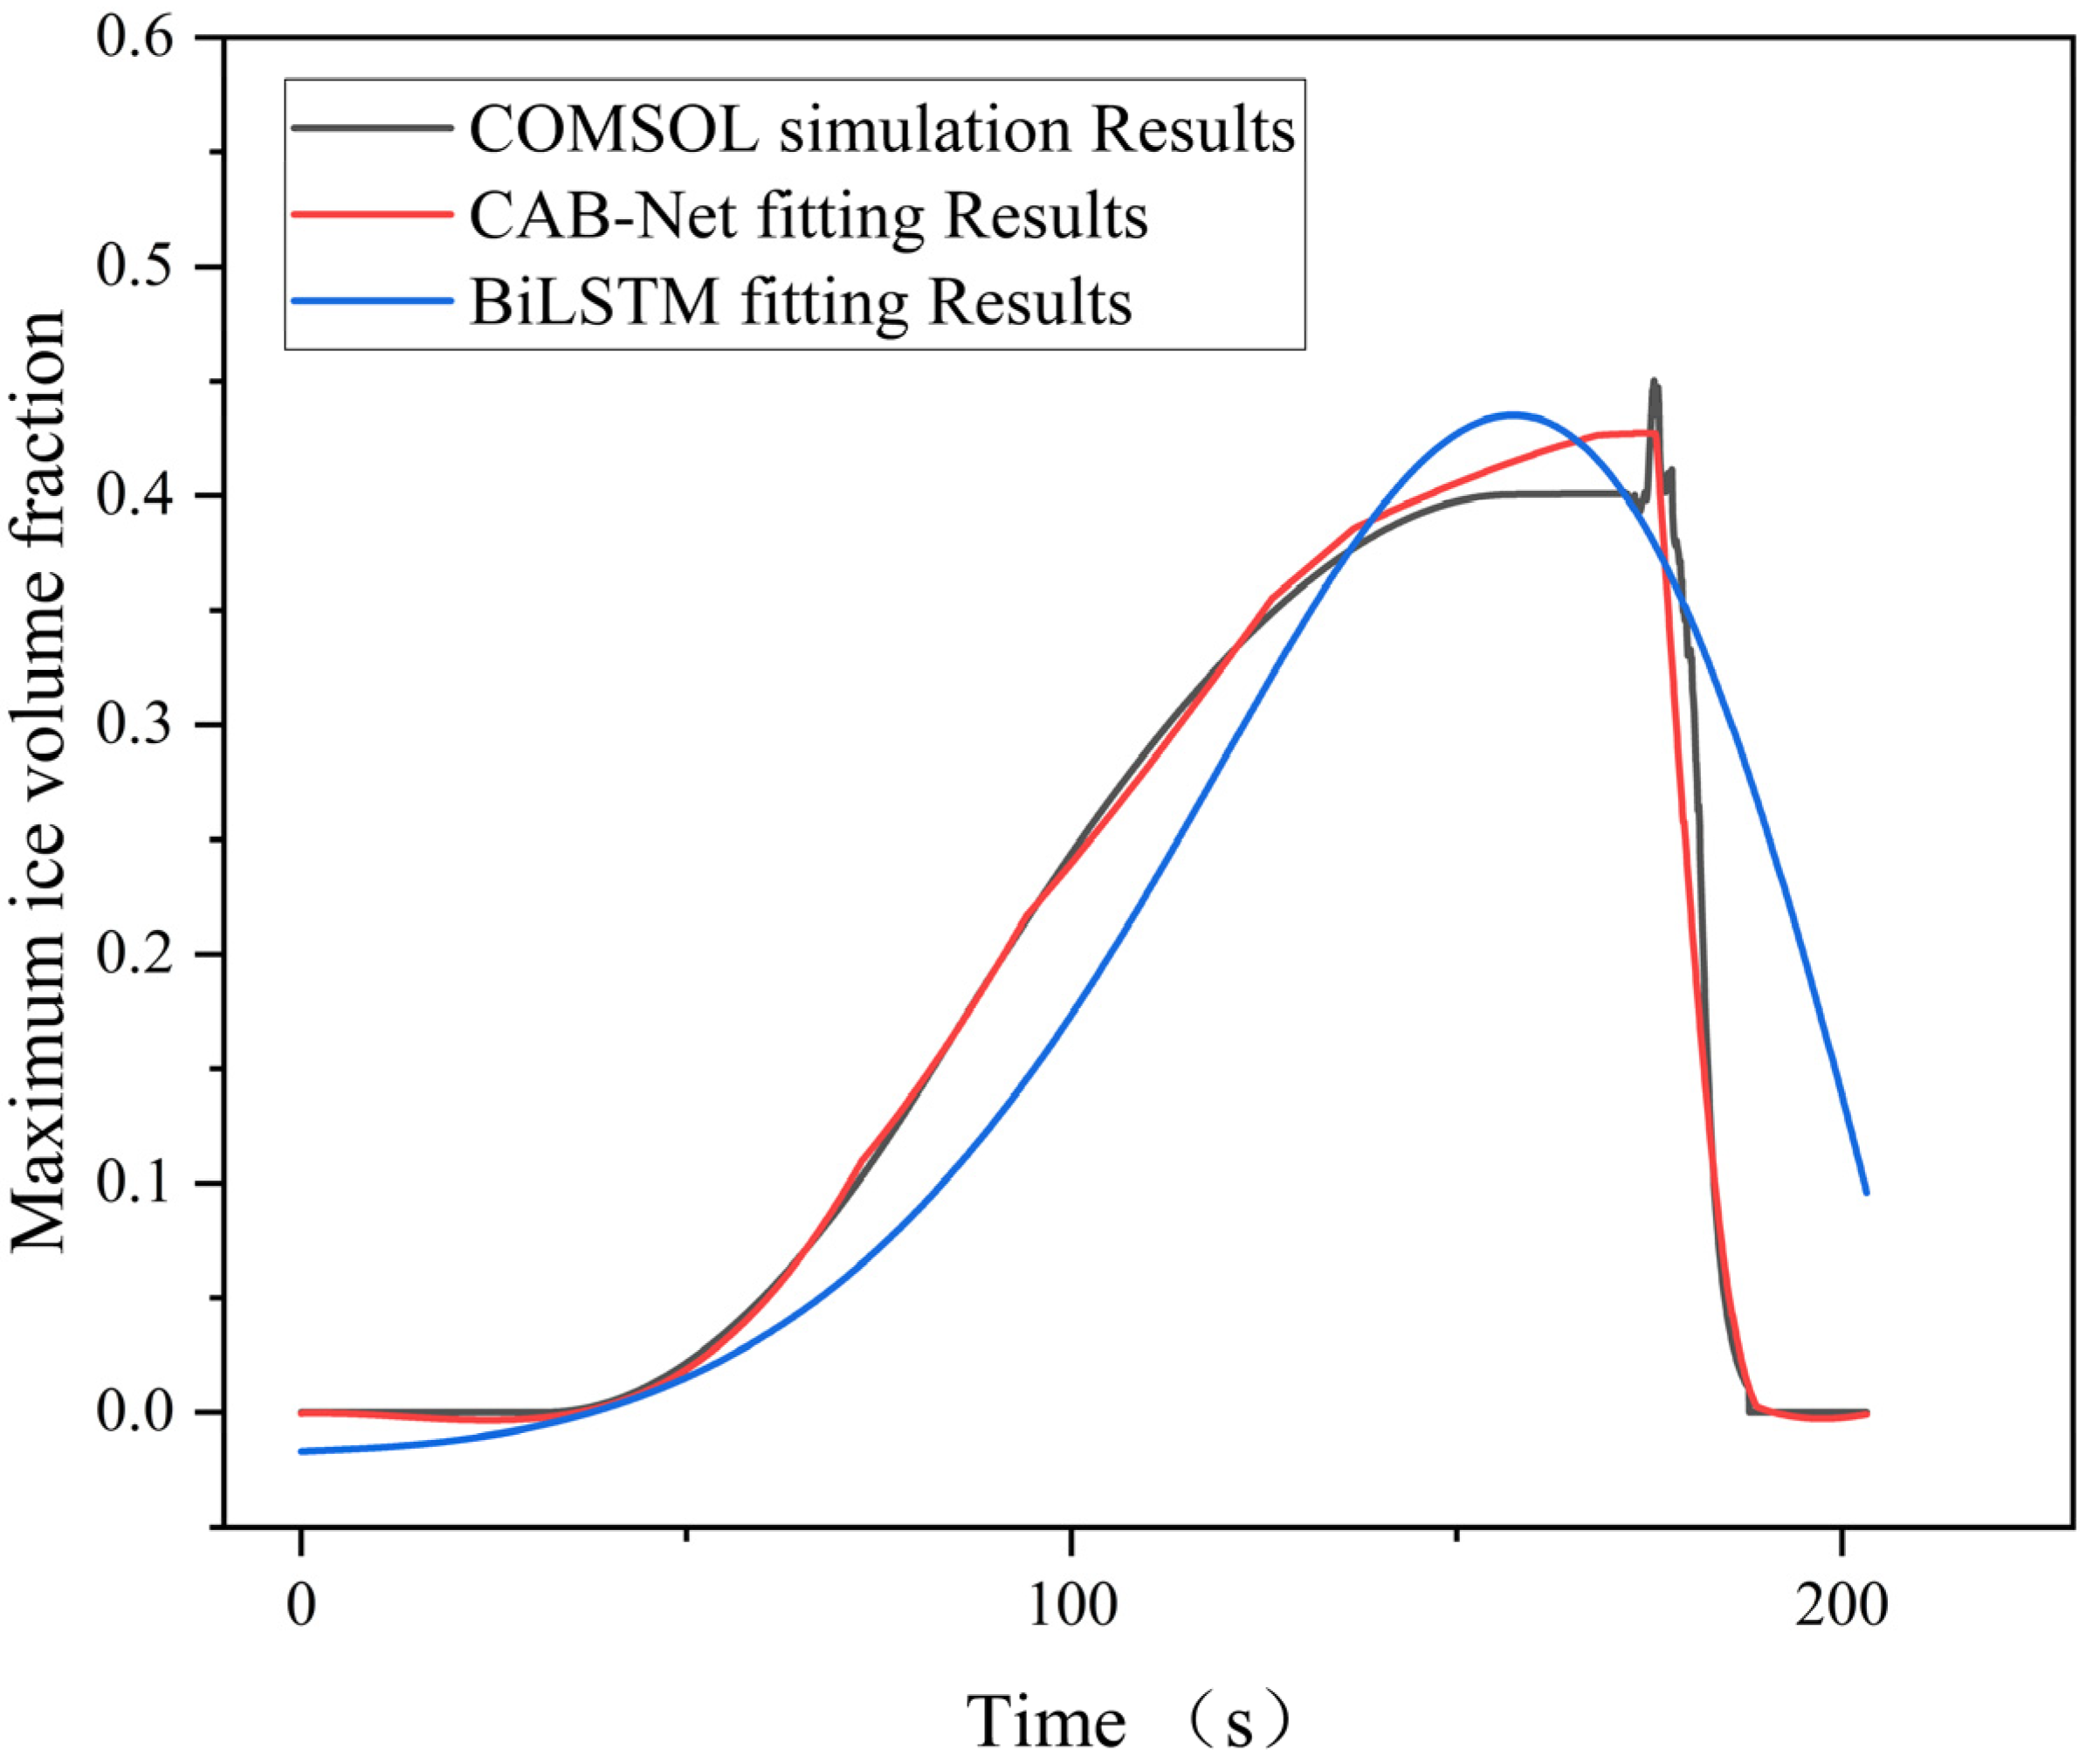
As illustrated in Table 3 and Figure 5, the BiLSTM model exhibited inadequate performance on the test dataset despite thorough training on the training and validation datasets. When compared to the CAB-Net model, its evaluation metrics and curve-fitting accuracy were considerably lower. These findings suggest that the CAB-Net model is better suited to achieve the objectives of this study.
Figure 5.
Comparison of predicted values and actual values for the models.
4. Lexicographic Ordered Whale Optimization Algorithm
In modern optimization problems, global optimization algorithms have gained widespread application due to their capability to identify global optima in complex, high-dimensional solution spaces. The Whale Optimization Algorithm (WOA) [58], a heuristic algorithm inspired by the natural hunting behavior of whales, exhibits robust global search capabilities. However, the traditional WOA may encounter difficulties with local optima when addressing certain multi-objective or complex constrained optimization problems. To overcome this limitation, this paper introduces a novel optimization approach—the Lexicographic Ordered Whale Optimization Algorithm (LO-WOA). This algorithm incorporates a lexicographic ordering strategy [59], which prioritizes solution sorting to enhance global exploration during the search process, thereby mitigating the risk of local optima. By introducing the mechanism of dictionary order sorting on the basis of whale optimization, LO-WOA improves the accuracy and stability of the optimization process when dealing with multi-objective optimization and constrained problems, and ensures that a better quality global optimal solution can be found in high-dimensional and complex optimization problems.
The core principle of WOA is to simulate the cooperative foraging behavior of humpback whale populations as they search for optimal solutions within the search space. WOA incorporates two primary behavioral strategies: the Spiral Update and the Bubble Net Update. The detailed process is outlined as follows:
Spiral Update: Humpback whales utilize a spiral motion to approach their prey, progressively narrowing the range within the hunting area. In the WOA, this spiral motion is employed to update the search path for potential solutions. The spiral update is governed by the following formula:
Here: represents the current position of the solution; denotes the best solution’s position in the current population; and are random variables that control the spiral direction and contraction range.
The variable acts as a contraction factor, starting with a large value and gradually decreasing as iterations progress, effectively reducing the search range. is a random variable within the range , which determines the degree of spiral curvature and influences the whale’s position updates relative to the global optimal solution. Through this mechanism, the whale incrementally converges toward the optimal solution, .
Bubble Net Update: Humpback whales also create bubble nets by swimming in circular motions and releasing bubbles to trap prey. Within the WOA, this behavior is modeled as a localized search mechanism within the solution space, ensuring targeted exploration and preventing the algorithm from becoming confined to local optima. The Bubble Net Update employs a formula analogous to that of the Spiral Update:
While the formula is mathematically similar, the purpose of the Bubble Net Update is distinct—it emphasizes enhancing local searches to improve the algorithm’s capability to locate near-optimal solutions.
Position Update Process: In WOA, each whale alternates between Spiral Update and Bubble Net Update behaviors to iteratively refine its position. The parameters and are pivotal in this process, influencing the movement direction and step size.
Fitness Evaluation: The fitness of each solution is evaluated using the objective function, which determines the quality of a solution. Higher objective function values indicate stronger fitness, signifying that the solution is closer to the global optimum. By assessing fitness, the algorithm identifies which whales should move closer to the optimal solution, guiding the population toward convergence.
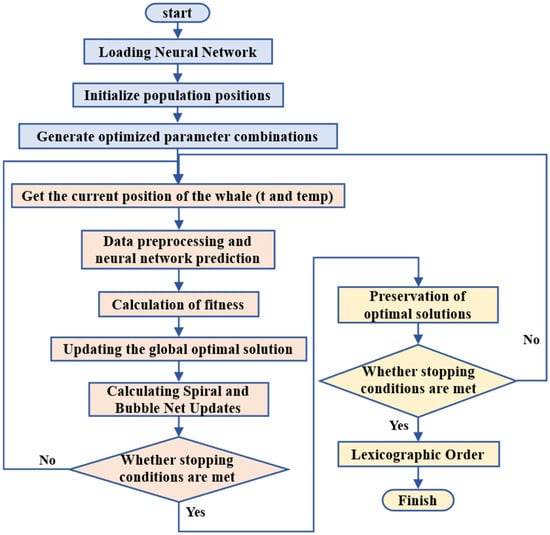
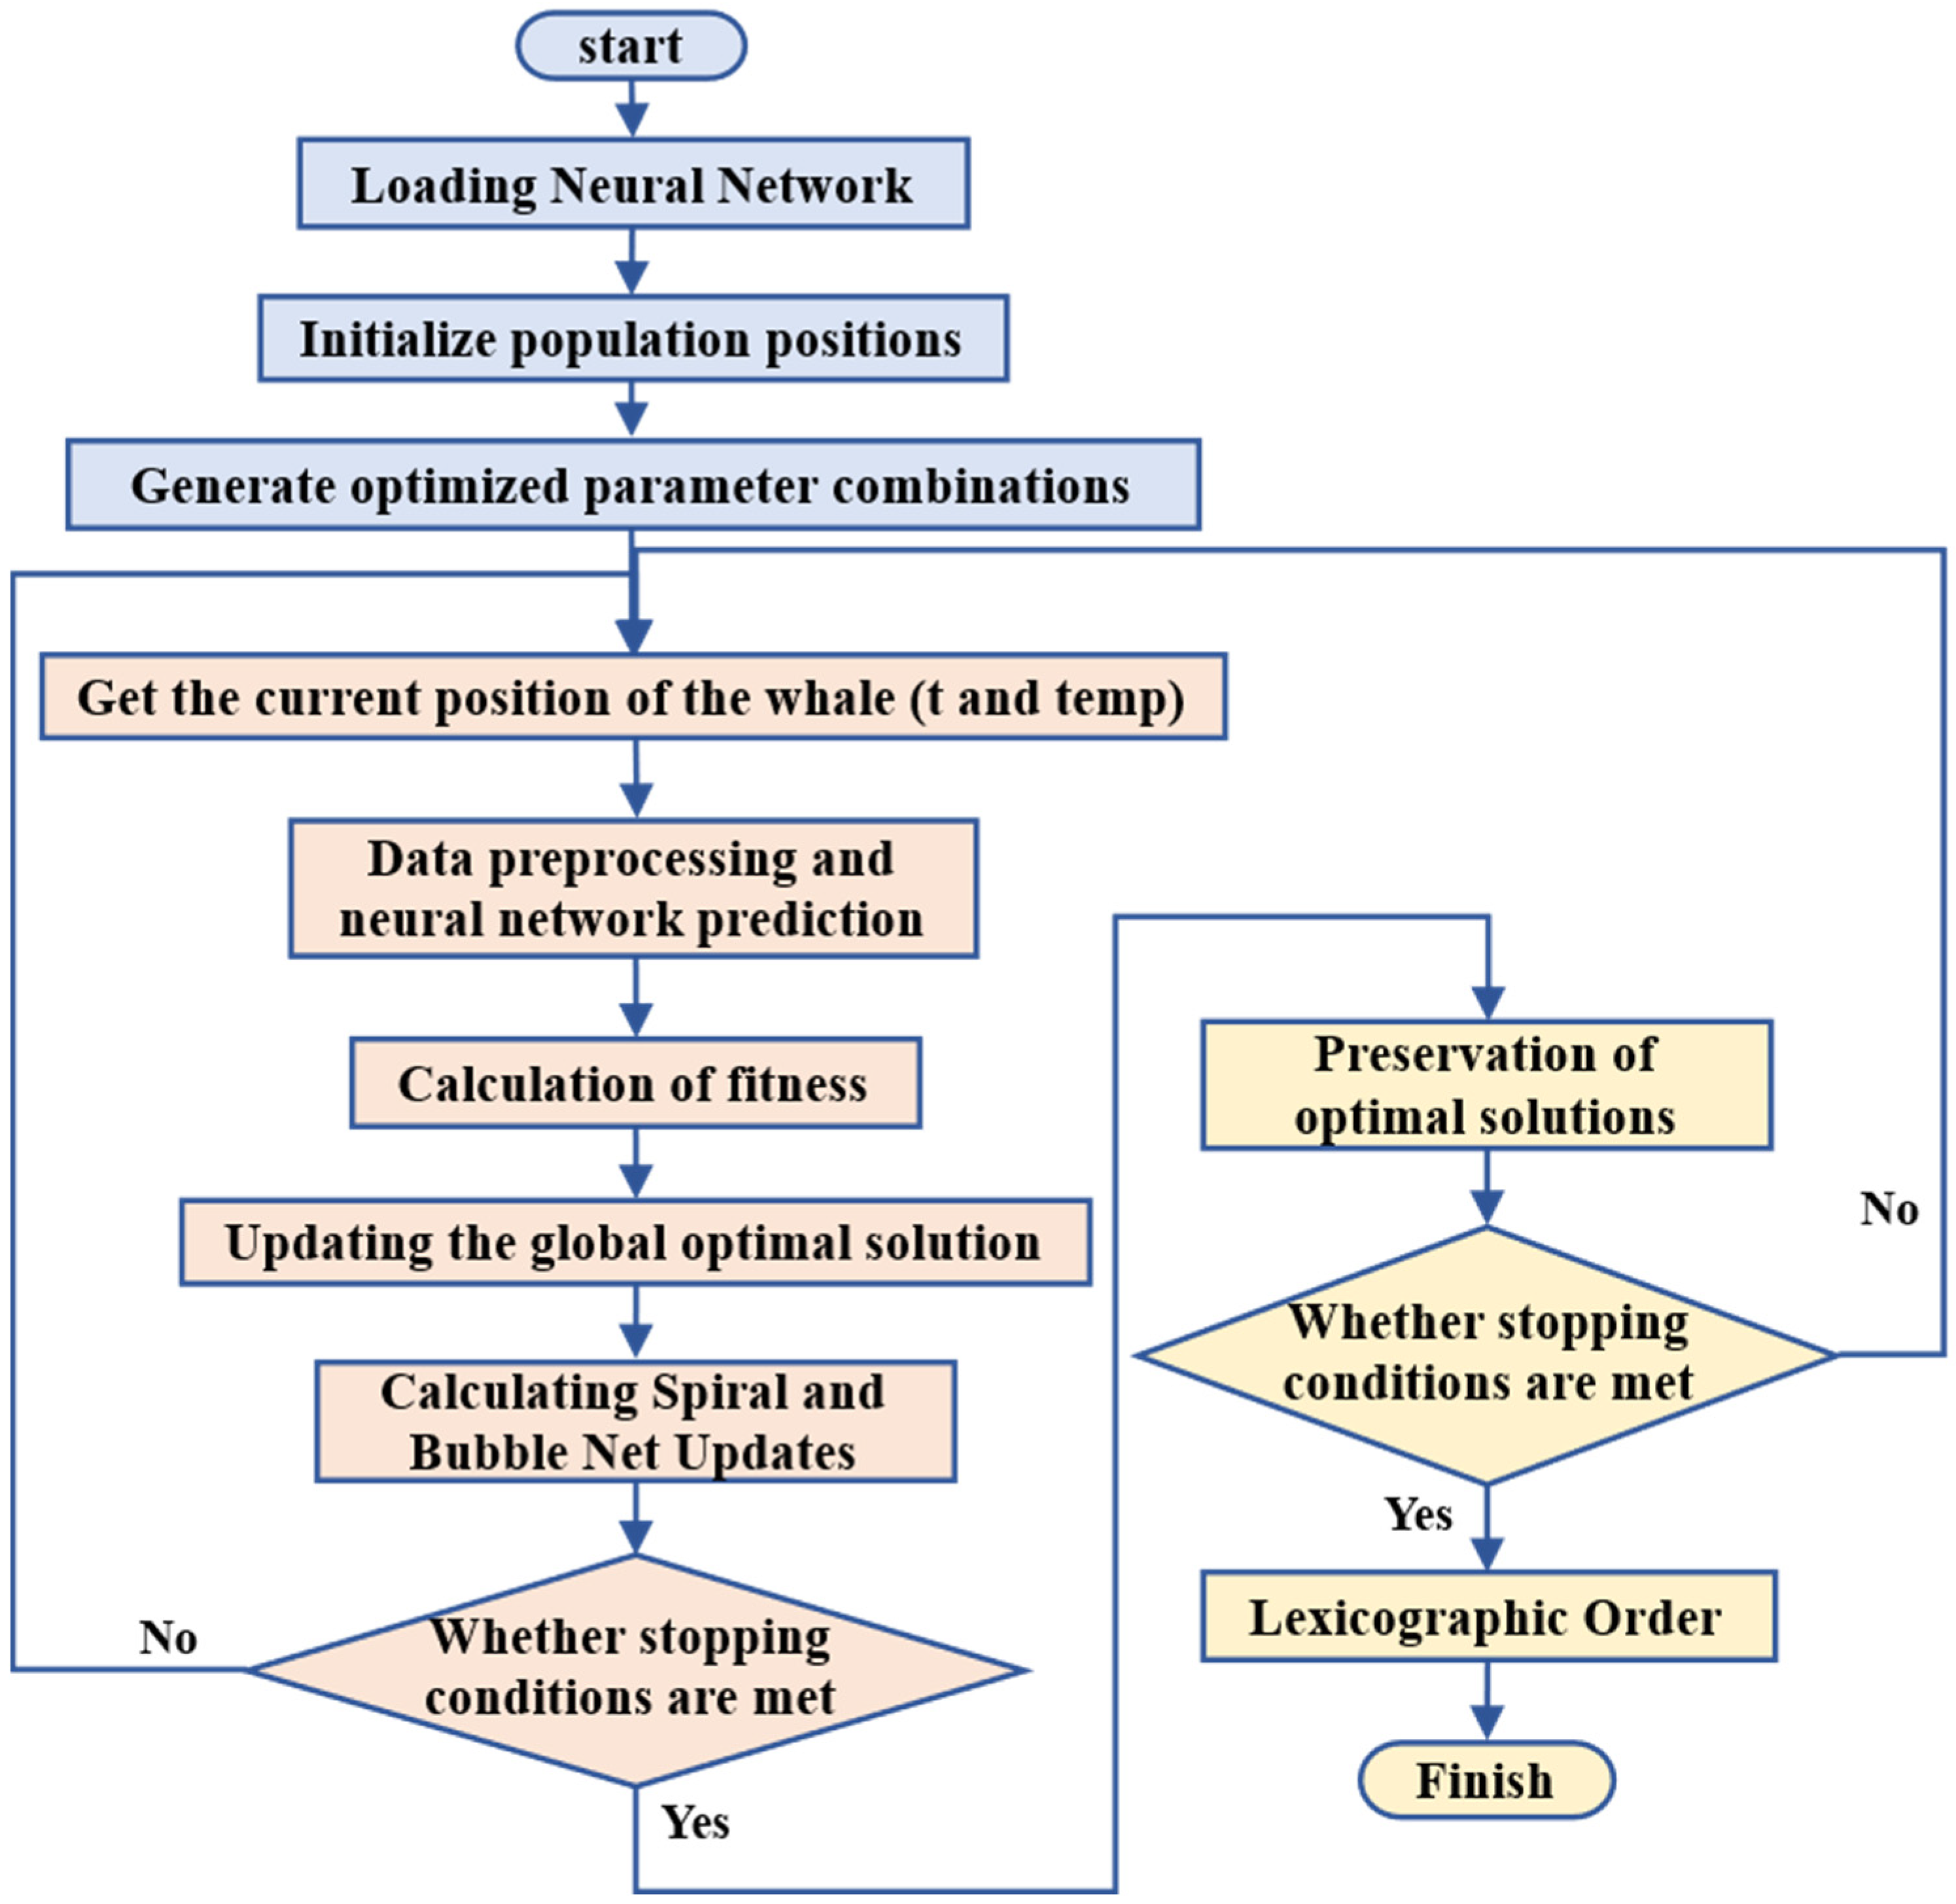
Figure 6 delineates the procedural framework of the LO-WOA. The number of whales is set to 50, the maximum number of iterations for the WOA is set to 100, and the maximum number of iterations for the LO-WOA is set to 200. The specific parameter ranges employed in this study are comprehensively detailed in Table 4. After the WOA is completed, the dictionary order optimization prioritizes ice volume fraction as the primary objective and energy consumption as the secondary objective (when the MIVF values of multiple solutions are consistent, the solution with lower energy consumption is selected as the optimal solution for further screening). The optimization results are sorted, and the parameter combination that achieves both a lower maximum ice volume fraction and energy consumption than the benchmark model is ultimately selected. The core logic behind setting this target priority order is as follows: Ice formation leading to blockage of porous electrodes is the direct cause of PEMFC cold start failure at low temperatures. This can cause physical compression of the MEA due to ice volume expansion, leading to irreversible damage such as pore destruction in the catalytic layer and microcracks in the proton exchange membrane, which directly affects the start-up success rate and stack lifespan. Energy consumption reduction, on the other hand, is a secondary economic optimization. Only by first ensuring successful start-up and component safety by controlling ice volume fraction does energy consumption optimization have practical engineering significance.
Figure 6.
Flowchart of the LO-WOA.
Table 4.
Range of selected parameters.
5. Results
Table 5 presents the optimized parameter combinations obtained through algorithm optimization, consisting of six sets in total. To validate the results, one parameter set (the second set of parameters, as shown in Table 6) was randomly selected and reintroduced into the COMSOL model for simulation verification.
Table 5.
Optimization results.
Table 6.
Comparison of parameters before and after optimization.
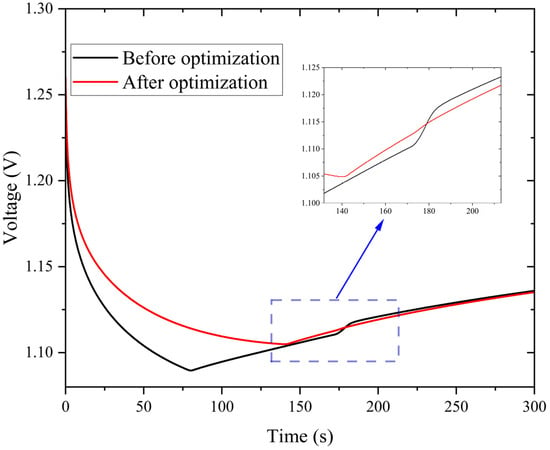
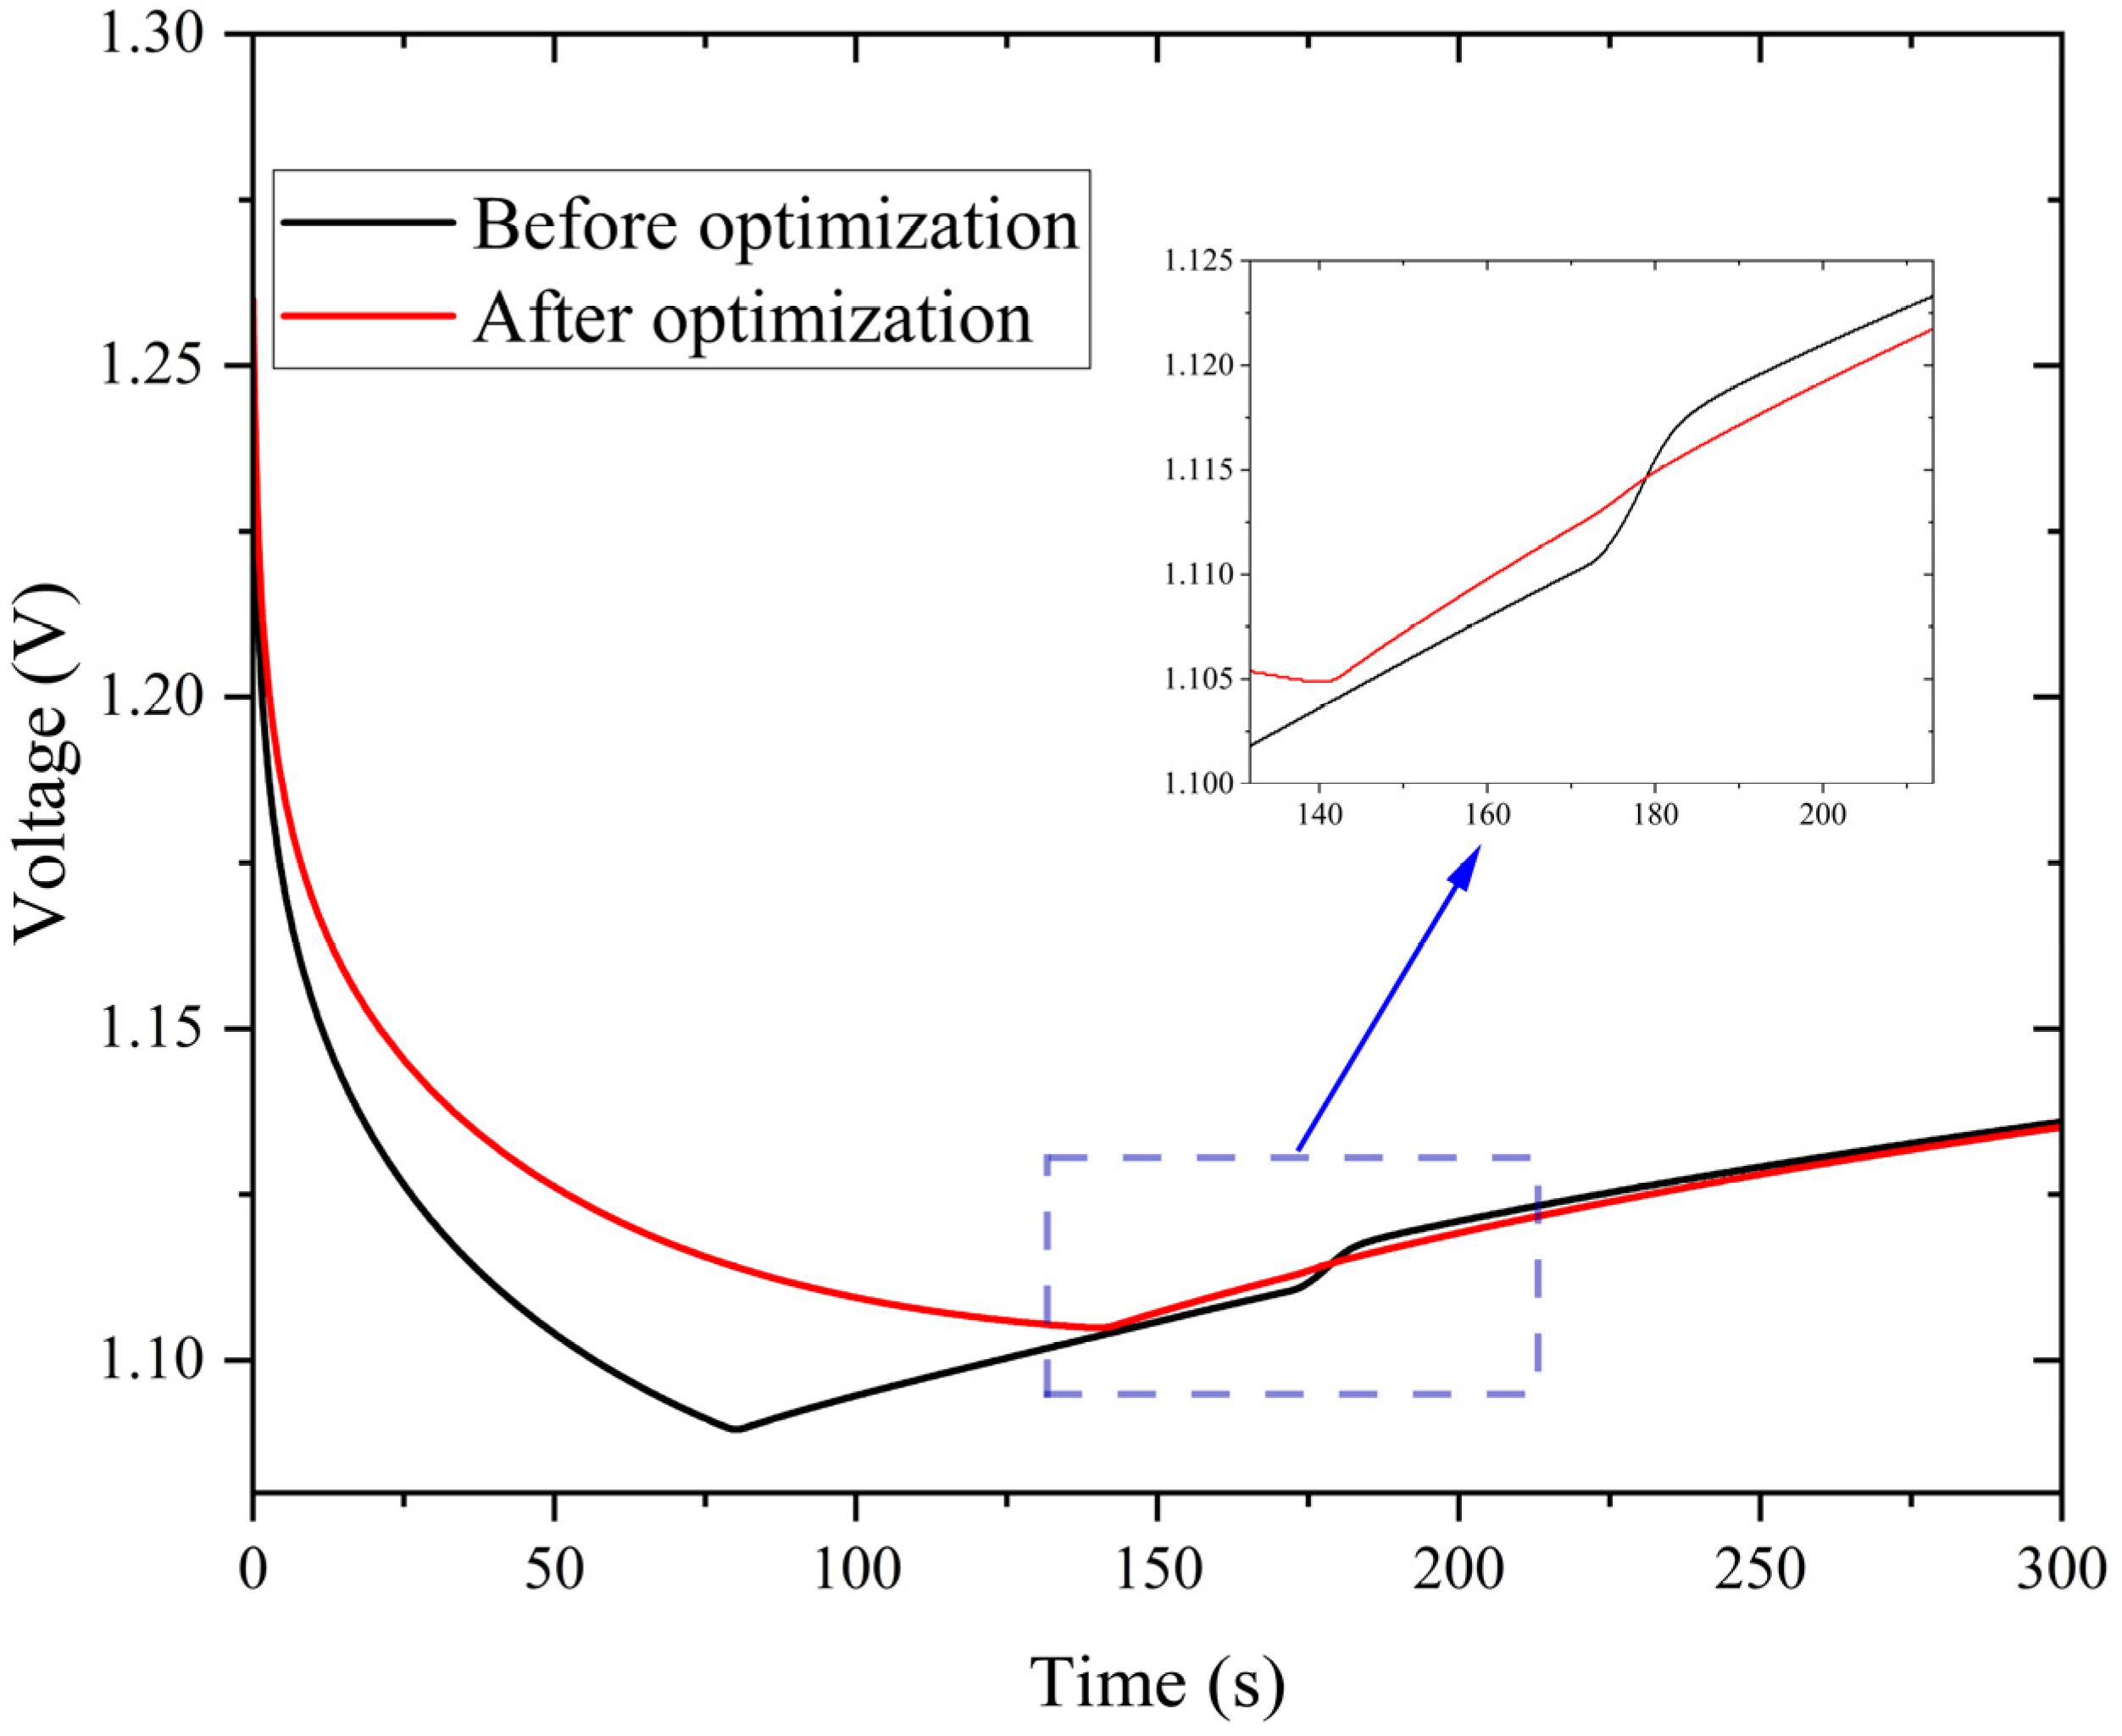
Figure 7 illustrates the voltage curves of the model before and after optimization. During the time period of 0~160 s, the voltage of the optimized model is higher. This discrepancy primarily stems from the changes in the load current slope. In the baseline model, the load current slope is 2, resulting in an increase in current density from 0 to 160 mA·cm−2 over 80 s. In contrast, the optimized model has a load current slope of 1.1338, requiring 141.12 s to reach the same current density. The decelerated rate of current increase in the optimized model reduces the energy required for electron transfer, thereby resulting in a smaller voltage drop.
Figure 7.
Voltage curve of the stack before and after optimization.
Moreover, according to the Tafel equation:
The activation overpotential () is positively correlated with the load current density (). A faster increase in load current density results in greater activation losses. As a result, the baseline model experiences higher activation losses during the rapid current rise phase, further explaining why the optimized model exhibits higher voltage during the 0~160 s period.
Between 160 and 300 s, the voltage profiles of both the baseline and optimized models closely coincide. This alignment occurs because the load current remains steady in both models throughout this interval, resulting in uniform voltage behavior.
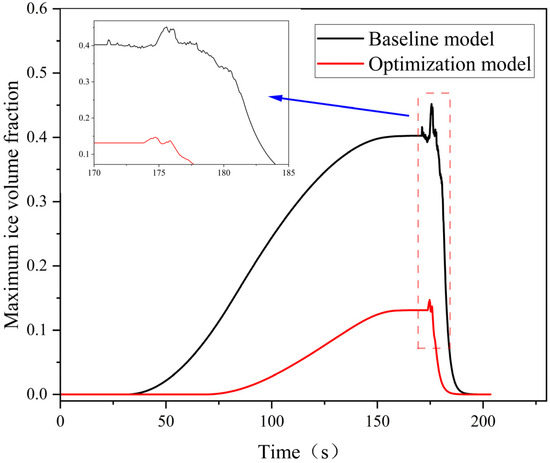
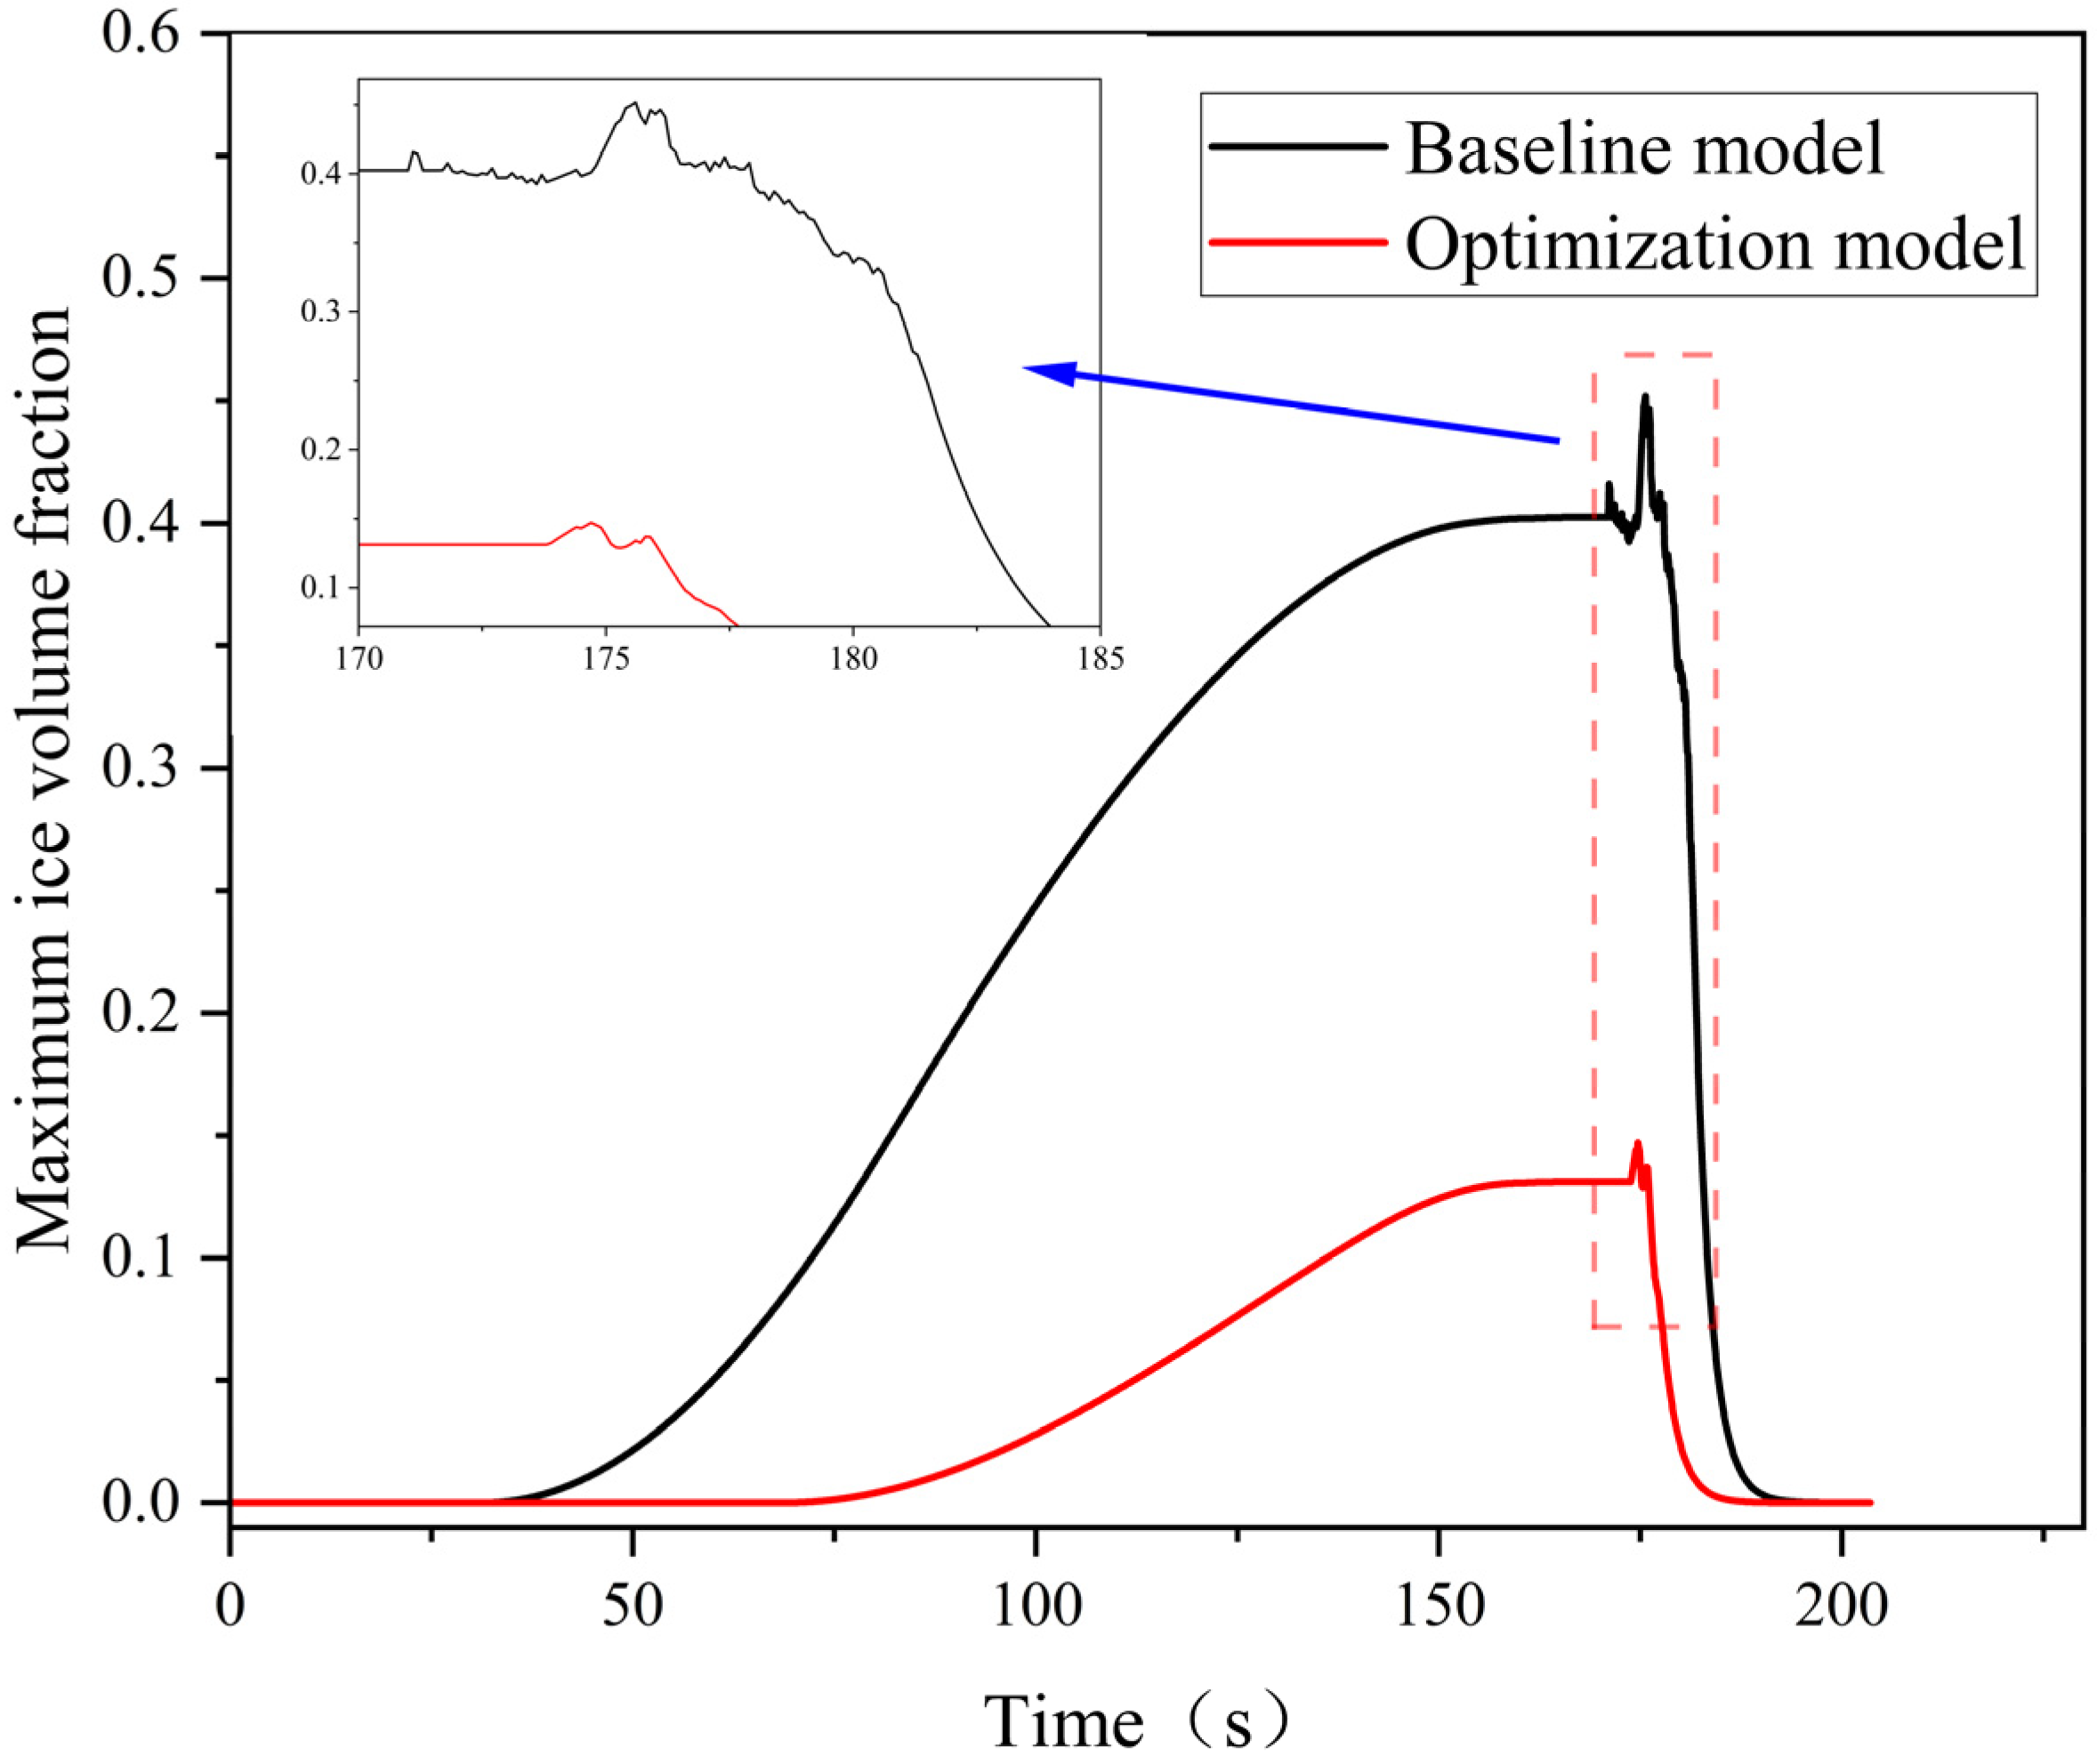
As shown in Figure 8, the black curve represents the variation in ice volume fraction for the baseline model, while the red curve represents that for the optimized model. The optimized model achieves a MIVF of 0.1471, representing a 67.45% reduction compared to the baseline model’s MIVF of 0.4519. This substantial decrease underscores the effectiveness of the optimization strategy. Additionally, the optimized model reaches its MIVF at 173.8 s, slightly earlier than the baseline model, which reaches its peak at 175.6 s. The energy consumption is determined using the following formula:
where (W) represents the heat consumption rate, and (s) denotes the time required to reach the MIVF.
Figure 8.
MIVF curves before and after optimization.
Utilizing the specified formula, the optimized model consumes 0.70299 J (the energy consumption value here refers to the energy required by a part of the direct channel of a single battery) of energy to achieve the MIVF, compared to 0.77264 J required by the baseline model. This corresponds to a 9.01% reduction in energy consumption by the optimized model compared to the baseline model, further demonstrating the efficiency of the proposed optimization strategy.
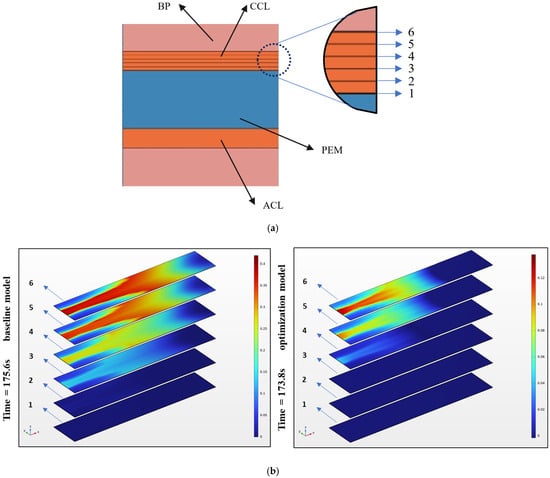
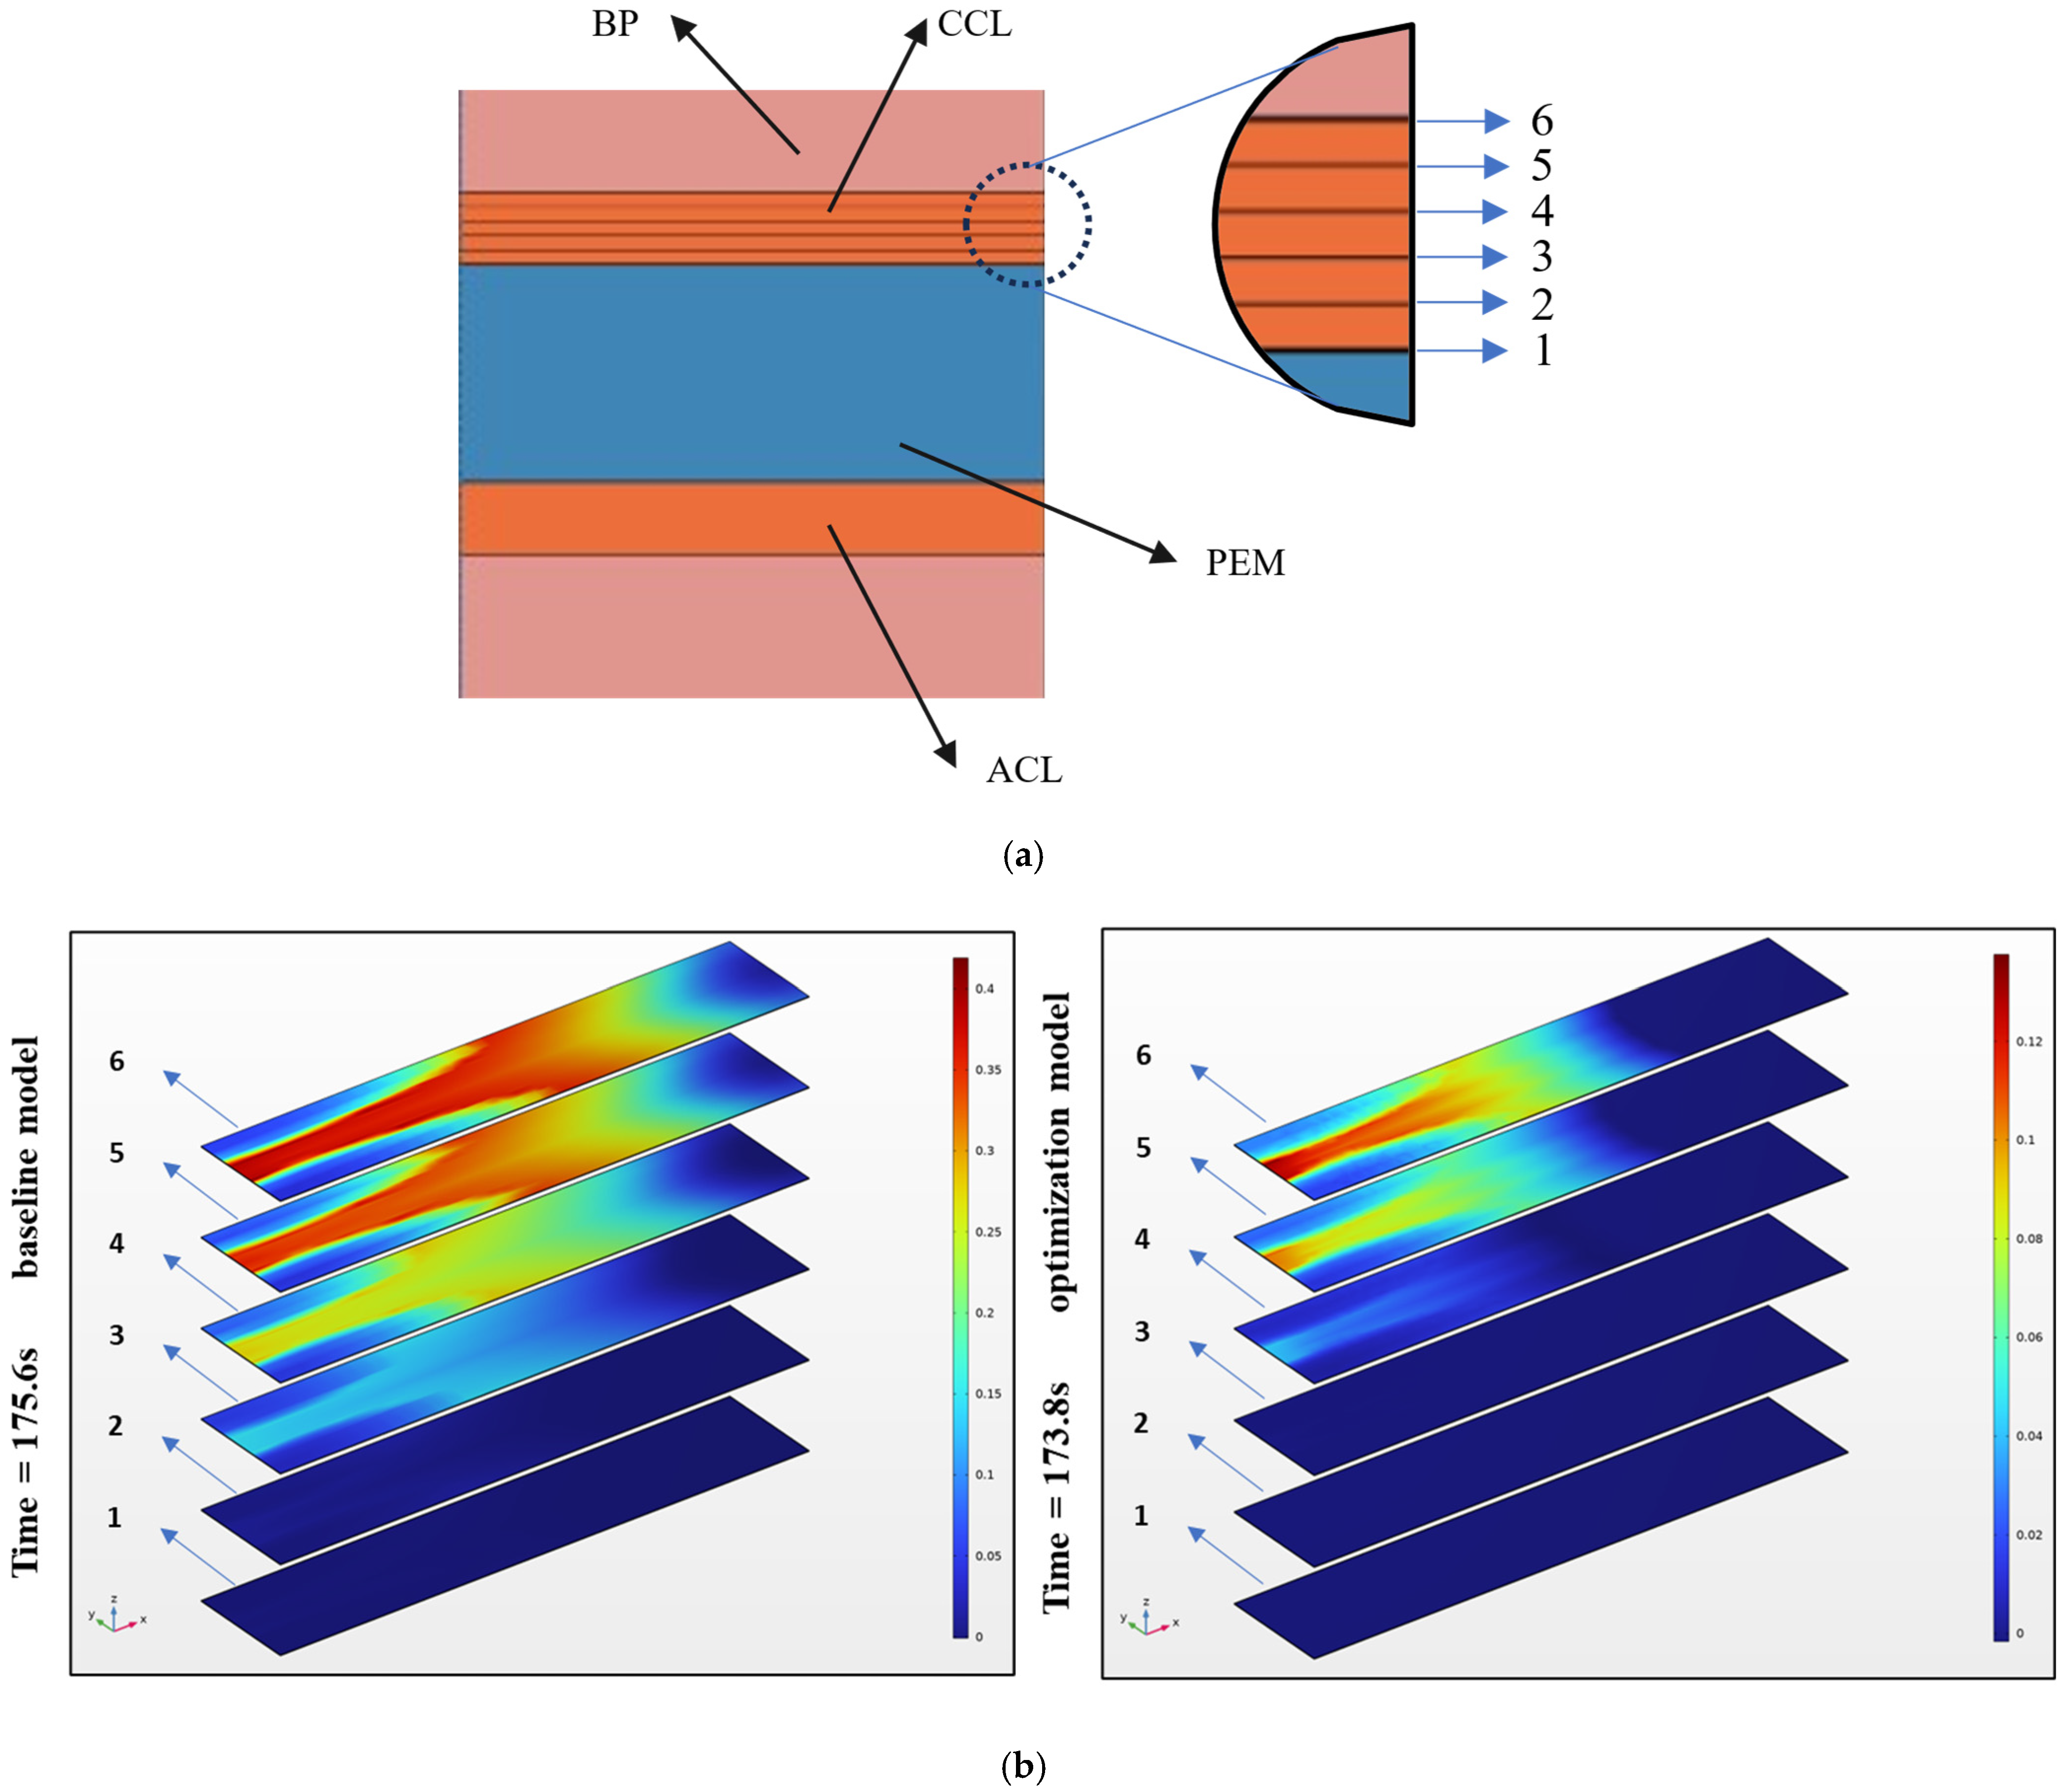
To comprehensively investigate the icing conditions within the CCL regions of the models at the point of MIVF, six cross-sections of the CCL were meticulously selected for in-depth analysis, as illustrated in Figure 9a. Figure 9b presents the ice distribution characteristics across these cross-sections for both the baseline and optimized models.
Figure 9.
(a) Schematic cross-sectional diagram illustrating the ice distribution within the CCL region. (b) Ice distribution within the CCL region of the fuel cell at the point of MIVF. Ice distribution map of the cathode catalytic layer along the X-Y cross-section (six cross-sections in total). (The legend depicts the numerical values of ice volume fraction, with higher values corresponding to redder colors; conversely, values closer to blue).
From Figure 9b, it is evident that icing is more pronounced on the side of the CCL adjacent to the GDL, while minimal icing is observed on the side closer to PEM.
The uneven accumulation of ice on different cross-sections of the CL is primarily concentrated at the interface between the CL and the GDL, which is the result of the coupled effects of the special physicochemical environment in this region and external conditions. From a causal perspective, the interface between the cathode CL and GDL is the core area for water production through electrochemical reactions. The liquid water generated by the reaction tends to preferentially accumulate in the microporous gaps between the two layers, leading to preferential ice formation near this area. However, due to the low water production and relatively stable temperature near the proton exchange membrane, ice formation is not significant. Furthermore, as can be seen from Figure 9b, the ice volume fraction on cross-sections 4, 5, and 6 is significantly reduced in the optimized model compared to the baseline model. This indicates that the optimized model not only significantly reduces the ice volume fraction but also greatly reduces the thickness of thick ice layers. A lower current loading rate directly slows down the water production rate at the top of the CL, reducing the amount of liquid water generated at the reaction interface from the source. Additionally, lower and values imply that the capillary heat storage capacity of the CL and GDL is enhanced, leading to reduced temperature fluctuations.
Under the continuous action of auxiliary heating with coolant, the overall temperature of the fuel cell stack gradually increases, and the ice at the junction of the cathode CL and GDL slowly melts from the edge to the center. After the ice melts, the originally blocked oxygen transmission path becomes unblocked again, and the active sites covered on the CL surface are exposed. The local current density gradually returns to normal levels, ultimately achieving successful cold start.
In the optimized model, the peak ice volume fraction in the CCL is significantly reduced. Furthermore, the ice distribution characteristics reveal that the baseline model exhibits large regions with high ice volume fractions, indicating localized ice formation. In contrast, the optimized model demonstrates a more uniform ice distribution, suggesting that the implemented optimization measures effectively improved the spatial distribution of ice formation. This improvement reduces localized ice blockage and enhances the performance stability of the CL.
6. Conclusions
This research is dedicated to enhancing the auxiliary heating performance of a three-dimensional multiphase PEMFC. To supplant the conventional COMSOL simulation model, a surrogate model utilizing the CAB-Net neural network was developed. Additionally, the LO-WOA was employed as the optimization technique. The study explored the impact of six key parameters—heat consumption rate (), coolant flow rate (), load current slope (), initial membrane water content (), catalyst layer porosity (), and gas diffusion layer porosity ()—on the auxiliary heating performance. The key findings are:
- CAB-Net, as a multi-task neural network model, demonstrated its ability to fully exploit the coupling information between input features. Compared to other models, it showed higher accuracy in load prediction. Results on the test dataset confirmed that CAB-Net outperformed BiLSTM in terms of , , , and , further validating its superior performance.
- The LO-WOA optimization algorithm improved optimization accuracy and stability in multi-objective optimization and constraint handling by incorporating a lexicographic ordering mechanism into the traditional WOA. Simulation results revealed that the optimal parameter combination obtained by integrating the CAB-Net neural network with the LO-WOA was: , , , , , .
- Through COMSOL model simulations, it was found that compared to the baseline model, the optimized model reduced the MIVF to 0.1471, a decrease of 67.45%. Meanwhile, its energy consumption was 0.70299 J, which is a 9.01% reduction compared to the baseline model.
This study provides a theoretical basis for the optimal parameter selection in the fuel cell coolant-assisted cold start process. Future research could further explore parameters that have a more significant impact on cold start performance and, by introducing more efficient neural network models and optimization algorithms, aim to improve the cold start performance of fuel cells over a broader range.
Based on the foundation and limitations of this study, future research will be conducted in the following three directions to further enhance the practicality and integrity of the research in engineering:
- The existing model focuses on the three-dimensional multiphase flow characteristics of a single cell and single channel. In the future, it is planned to expand the research object to single cell/stack-level modeling, considering issues such as uneven flow field distribution, temperature gradient differences, and mutual interference between adjacent cells caused by multiple batteries in series. A multiphysics coupled model that is more suitable for practical application scenarios will be constructed to improve the engineering adaptability of optimization strategies.
- The previous optimization did not consider the degradation effects of components such as the decline in catalytic layer activity and the aging of proton exchange membranes during the long-term operation of PEMFCs. In the future, we will continue to refine the simulation model, establish a coupled degradation-cold start performance model, and develop a dynamic optimization strategy based on degradation state perception to extend the service life of fuel cells during low-temperature operation.
- The existing CAB-Net + LO-WOA optimization framework operates in an offline computing mode, making it difficult to directly apply it to real-time scenarios such as vehicular applications. In the future, lightweight modifications will be made to the proxy model and optimization algorithm, and embedded real-time control algorithms will be developed to achieve dynamic parameter adjustment and closed-loop control during the cold start process, thereby facilitating the engineering implementation of optimization strategies.
Author Contributions
Conceptualization, J.Z. (Jingyi Zhang) and D.X.; methodology, X.Y.; software, X.Y. and J.Z. (Jie Zhang); validation, J.Z. (Jie Zhang) and S.C.; formal analysis, Y.L.; investigation, Y.L.; resources, J.Z. (Jie Zhang); data curation, S.C. and Y.L.; writing—original draft preparation, X.Y.; writing—review and editing, X.Y.; visualization, S.C. and Y.L.; supervision, J.Z. (Jingyi Zhang) and D.X.; project administration, J.Z. (Jingyi Zhang) and D.X.; funding acquisition, D.X. All authors have read and agreed to the published version of the manuscript.
Funding
This research was funded by [Major Science and Technology Projects of Wenzhou, China] grant number [ZG2022024].
Data Availability Statement
The data presented in this study are available on request from the corresponding author due to privacy concerns.
Conflicts of Interest
Jingyi Zhang was employed by Chongqing Jinkang Powertrain New Energy Co., Ltd. The remaining authors declare that the research was conducted in the absence of any commercial or financial relationships that could be construed as a potential conflict of interest.
Nomenclature
| Nomenclature | |
| water activity | |
| cell geometric area (m2) | |
| molar concentration (mol m−3) | |
| specific heat (J kg−1 K−1) | |
| mass diffusivity (m2 s−1) | |
| equivalent weight of membrane (1100 kg kmol−1) | |
| Faraday’s constant (96,487 C mol−1) | |
| latent heat (J kg−1), surrounding heat transfer coefficient (W m−2 K−1) | |
| current density (A cm−2) | |
| reaction rate (A m−3) | |
| volumetric exchange current density (A m−3) | |
| thermal conductivity (W m−1 K−1) | |
| permeability (m2) | |
| mass flow rate (kg s−1) | |
| molecular weight (kg kmol−1) | |
| electro-osmotic drag coefficient (H2O per H+) | |
| pressure (Pa) | |
| heat transfer rate (W) | |
| universal gas constant (8.314 J mol−1 K−1) | |
| relative humidity | |
| volume fraction | |
| source terms, entropy (J kmol−1 K−1) | |
| times (s) | |
| temperature (K) | |
| volume averaged cell temperature | |
| velocity (m s−1) | |
| electrical potential (V) | |
| mole fraction | |
| mass fraction | |
| heat consumption rate | |
| coolant flow rate | |
| load current slope | |
| Greek letters | |
| transfer coefficient | |
| water phase change rate (s−1) | |
| porosity | |
| water transfer rate (s−1) | |
| over potential (V) | |
| contact angle (◦) | |
| interfacial drag coefficient | |
| electrical conductivity (S m−1) | |
| water content in ionomer | |
| dynamic viscosity (kg m−1 s−1) | |
| stoichiometry ratio | |
| density (kg m−3) | |
| surface tension (N m−1) | |
| electrical potential, V | |
| volume fraction of ionomer in catalyst layer | |
| Subscripts/Superscripts | |
| Anode, cathode | |
| activation | |
| bipolar plate | |
| cell characteristic | |
| catalyst layer | |
| condensation | |
| desublimation | |
| effective | |
| electronic | |
| electro-osmotic drag | |
| equilibrium | |
| evaporation | |
| frozen | |
| fluid phase | |
| freezing point depression | |
| frozen membrane water | |
| fusion | |
| gas phase | |
| gas diffusion layer | |
| hydrogen | |
| the ith and jth components | |
| ice | |
| inlet | |
| ionic | |
| liquid water | |
| mass (for source term) | |
| membrane | |
| normal condition | |
| non-frozen | |
| non-frozen membrane water | |
| oxygen | |
| outlet | |
| reference state | |
| reversible | |
| saturation | |
| solid phase including the membrane electrolyte and ice | |
| solid phase excluding the membrane electrolyte and ice | |
| surroundings | |
| energy (for source term) | |
| momentum (for source term) | |
| water vapour | |
| surrounding wall of the cell | |
| intrinsic value | |
| liquid water to ice (vice versa) | |
| non-frozen membrane water to frozen membrane water (vice versa) | |
| non-frozen membrane water to ice | |
| non-frozen membrane water to vapour (vice versa) | |
| vapour to ice | |
| vapour to water liquid (vice versa) | |
Appendix A. Modeling-Related Tables
Table A1.
Model parameters and operating conditions [33,50,51,60].
Table A2.
Conservation equations [33,34,50,51].
Table A3.
Source terms [33,34,47,50,51].
Table A4.
Transport parameters [33,51].
Table A5.
Parameters related to electrochemical reactions [33,51].
Table A6.
Water phase change functions [9,33,51].
Table A7.
Membrane water-related phase change and water transfer functions [9,33,47,51].
References
- Zhong, Q.; Zhang, Z.; Wang, H.; Zhang, X.; Wang, Y.; Wang, P.; Ma, F.; Yue, Q.; Du, T.; Chen, W.-Q.; et al. Incorporating Scarcity into Footprints Reveals Diverse Supply Chain Hotspots for Global Fossil Fuel Management. Appl. Energy 2023, 349, 121692. [Google Scholar] [CrossRef] [Scilit]
- Brahim, T.; Jemni, A. Green Hydrogen Production: A Review of Technologies, Challenges, and Hybrid System Optimization. Renew. Sustain. Energy Rev. 2026, 225, 116194. [Google Scholar] [CrossRef] [Scilit]
- Jiao, K.; Xuan, J.; Du, Q.; Bao, Z.; Xie, B.; Wang, B.; Zhao, Y.; Fan, L.; Wang, H.; Hou, Z.; et al. Designing the next Generation of Proton-Exchange Membrane Fuel Cells. Nature 2021, 595, 361–369. [Google Scholar] [CrossRef] [Scilit]
- Tabe, Y.; Saito, M.; Fukui, K.; Chikahisa, T. Cold Start Characteristics and Freezing Mechanism Dependence on Start-up Temperature in a Polymer Electrolyte Membrane Fuel Cell. J. Power Sources 2012, 208, 366–373. [Google Scholar] [CrossRef] [Scilit]
- Ge, S.; Wang, C.-Y. In Situ Imaging of Liquid Water and Ice Formation in an Operating PEFC during Cold Start. Electrochem. Solid-State Lett. 2006, 9, A499. [Google Scholar] [CrossRef] [Scilit]
- Saidi, S.; Brahim, T.; Rejeb, O.; Jemni, A. Electrochemical and thermodynamic modeling of PEM electrolyzer performance: A comparative study with and without diffusion overpotential. Int. J. Hydrogen Energy 2025, 128, 697–712. [Google Scholar] [CrossRef] [Scilit]
- Holby, E.F.; Sheng, W.; Shao-Horn, Y.; Morgan, D. Pt Nanoparticle Stability in PEM Fuel Cells: Influence of Particle Size Distribution and Crossover Hydrogen. Energy Environ. Sci. 2009, 2, 865. [Google Scholar] [CrossRef] [Scilit]
- Tang, Q.; Li, B.; Yang, D.; Ming, P.; Zhang, C.; Wang, Y. Review of Hydrogen Crossover through the Polymer Electrolyte Membrane. Int. J. Hydrogen Energy 2021, 46, 22040–22061. [Google Scholar] [CrossRef] [Scilit]
- Luo, Y.; Jiao, K. Cold Start of Proton Exchange Membrane Fuel Cell. Prog. Energy Combust. Sci. 2018, 64, 29–61. [Google Scholar] [CrossRef] [Scilit]
- Schmitz, M.; Bahr, M.; Gößling, S.; Pischinger, S. Analysis of Ice Formation during Start-Up of PEM Fuel Cells at Subzero Temperatures Using Experimental and Simulative Methods. Energies 2023, 16, 6534. [Google Scholar] [CrossRef] [Scilit]
- Yang, L.; Cao, C.; Gan, Q.; Pei, H.; Zhang, Q.; Li, P. Revealing Failure Modes and Effect of Catalyst Layer Properties for PEM Fuel Cell Cold Start Using an Agglomerate Model. Appl. Energy 2022, 312, 118792. [Google Scholar] [CrossRef] [Scilit]
- Sabharwal, M.; Büchi, F.N.; Nagashima, S.; Marone, F.; Eller, J. Investigation of the Transient Freeze Start Behavior of Polymer Electrolyte Fuel Cells. J. Power Sources 2021, 489, 229447. [Google Scholar] [CrossRef] [Scilit]
- Ge, S.; Wang, C.-Y. Characteristics of Subzero Startup and Water/Ice Formation on the Catalyst Layer in a Polymer Electrolyte Fuel Cell. Electrochim. Acta 2007, 52, 4825–4835. [Google Scholar] [CrossRef] [Scilit]
- Huo, S.; Cooper, N.J.; Smith, T.L.; Park, J.W.; Jiao, K. Experimental Investigation on PEM Fuel Cell Cold Start Behavior Containing Porous Metal Foam as Cathode Flow Distributor. Appl. Energy 2017, 203, 101–114. [Google Scholar] [CrossRef] [Scilit]
- Min, H.; Cao, Q.; Yu, Y.; Zhang, Z.; Lin, J. A Cold Start Mode of Proton Exchange Membrane Fuel Cell Based on Current Control. Int. J. Hydrogen Energy 2022, 47, 5507–5520. [Google Scholar] [CrossRef] [Scilit]
- Lei, L.; He, P.; He, P.; Tao, W.-Q. A Comparative Study: The Effect of Current Loading Modes on the Cold Start-up Process of PEMFC Stack. Energy Convers. Manag. 2022, 251, 114991. [Google Scholar] [CrossRef] [Scilit]
- Pan, M.; Li, D.; Pan, C.; Liang, L. Maximum Power Tracking-Based Adaptive Cold Start Strategy for Proton Exchange Membrane Fuel Cell. Energy Convers. Manag. 2022, 273, 116387. [Google Scholar] [CrossRef] [Scilit]
- Du, Q.; Jia, B.; Luo, Y.; Chen, J.; Zhou, Y.; Jiao, K. Maximum Power Cold Start Mode of Proton Exchange Membrane Fuel Cell. Int. J. Hydrogen Energy 2014, 39, 8390–8400. [Google Scholar] [CrossRef] [Scilit]
- Jiang, Z.; Yang, G.; Li, S.; Shen, Q.; Liao, J.; Wang, H.; Zhang, G.; Li, Z.; Liu, Z. Pore Scale Study of Heat and Mass Transfer in Ice-Containing Gas Diffusion Layer of Polymer Electrolyte Membrane Fuel Cells. J. Power Sources 2023, 580, 233347. [Google Scholar] [CrossRef] [Scilit]
- Gießgen, T.; Jahnke, T. Assisted Cold Start of a PEMFC with a Thermochemical Preheater: A Numerical Study. Appl. Energy 2023, 331, 120387. [Google Scholar] [CrossRef] [Scilit]
- Lin, R.; Ren, Y.S.; Lin, X.W.; Jiang, Z.H.; Yang, Z.; Chang, Y.T. Investigation of the Internal Behavior in Segmented PEMFCs of Different Flow Fields during Cold Start Process. Energy 2017, 123, 367–377. [Google Scholar] [CrossRef] [Scilit]
- Sun, J.; Yang, X.; Sun, S.; Shao, Z. Investigation on the Temperature Uniformity and Efficiency of Cold Start-up for Proton Exchange Membrane Fuel Cell Stack Based on Catalytic Hydrogen/Oxygen Method. J. Power Sources 2021, 496, 229755. [Google Scholar] [CrossRef] [Scilit]
- Kim, S.; Jeong, H.; Lee, H. Cold-Start Performance Investigation of Fuel Cell Electric Vehicles with Heat Pump-Assisted Thermal Management Systems. Energy 2021, 232, 121001. [Google Scholar] [CrossRef] [Scilit]
- Gebhardt, U.; Luft, G.; Mund, K.; Waidhas, M.; Helmolt, R.V. Fuel Cell Battery with Heating and an Improved Cold-Start Performance, and Method for Cold-Starting of a Fuel Cell Battery. U.S. Patent US2002071972A1, 13 June 2002. [Google Scholar]
- Wang, B.; Xie, B.; Xuan, J.; Jiao, K. AI-Based Optimization of PEM Fuel Cell Catalyst Layers for Maximum Power Density via Data-Driven Surrogate Modeling. Energy Convers. Manag. 2020, 205, 112460. [Google Scholar] [CrossRef] [Scilit]
- Li, H.; Xu, B.; Lu, G.; Du, C.; Huang, N. Multi-Objective Optimization of PEM Fuel Cell by Coupled Significant Variables Recognition, Surrogate Models and a Multi-Objective Genetic Algorithm. Energy Convers. Manag. 2021, 236, 114063. [Google Scholar] [CrossRef] [Scilit]
- Zhang, F.; Zhang, X.; Wang, B.; Zhai, H.; Wu, K.; Wang, Z.; Bao, Z.; Tian, W.; Duan, W.; Zu, B.; et al. −30 °C Cold Start Optimization of PEMFC Based on a Data-Driven Surrogate Model and Multi-Objective Optimization Algorithm. Digit. Chem. Eng. 2024, 10, 100144. [Google Scholar] [CrossRef] [Scilit]
- Wu, K.; Du, Q.; Zu, B.; Wang, Y.; Cai, J.; Gu, X.; Xuan, J.; Jiao, K. Enabling Real-Time Optimization of Dynamic Processes of Proton Exchange Membrane Fuel Cell: Data-Driven Approach with Semi-Recurrent Sliding Window Method. Appl. Energy 2021, 303, 117659. [Google Scholar] [CrossRef] [Scilit]
- Montaner Ríos, G.; Schirmer, J.; Gentner, C.; Kallo, J. Efficient Thermal Management Strategies for Cold Starts of a Proton Exchange Membrane Fuel Cell System. Appl. Energy 2020, 279, 115813. [Google Scholar] [CrossRef] [Scilit]
- Luo, M.; Zhang, J.; Zhang, C.; Chin, C.S.; Ran, H.; Fan, M.; Du, K.; Shuai, Q. Cold Start Investigation of Fuel Cell Vehicles with Coolant Preheating Strategy. Appl. Therm. Eng. 2022, 201, 117816. [Google Scholar] [CrossRef] [Scilit]
- Rahimi-Esbo, M.; Ranjbar, A.A.; Ramiar, A.; Alizadeh, E.; Aghaee, M. Improving PEM Fuel Cell Performance and Effective Water Removal by Using a Novel Gas Flow Field. Int. J. Hydrogen Energy 2016, 41, 3023–3037. [Google Scholar] [CrossRef] [Scilit]
- Warnatz, J.; Maas, U.; Dibble, R.W. Combustion: Physical and Chemical Fundamentals, Modeling and Simulation, Experiments, Pollutant Formation, 4th ed.; Springer: Berlin/Heidelberg, Germany, 2006. [Google Scholar] [CrossRef] [Scilit]
- Jiao, K.; Li, X. Three-dimensional multiphase modeling of cold start processes in polymer electrolyte membrane fuel cells. Electrochim. Acta 2009, 54, 6876–6891. [Google Scholar] [CrossRef] [Scilit]
- Niu, H.; Ji, C.; Wang, S.; Wang, D.; Bai, Y.; Liang, C. Parametric Sensitivity Analysis on the Cold Start Process of a Polymer Electrolyte Membrane Fuel Cell. Int. J. Energy Res. 2021, 45, 5629–5648. [Google Scholar] [CrossRef] [Scilit]
- Meng, H. A PEM Fuel Cell Model for Cold-Start Simulations. J. Power Sources 2008, 178, 141–150. [Google Scholar] [CrossRef] [Scilit]
- Jiang, F.; Fang, W.; Wang, C.-Y. Non-Isothermal Cold Start of Polymer Electrolyte Fuel Cells. Electrochim. Acta 2007, 53, 610–621. [Google Scholar] [CrossRef] [Scilit]
- Ye, Q.; Nguyen, T.V. Three-Dimensional Simulation of Liquid Water Distribution in a PEMFC with Experimentally Measured Capillary Functions. J. Electrochem. Soc. 2007, 154, B1242. [Google Scholar] [CrossRef] [Scilit]
- Haynes, W.M. CRC Handbook of Chemistry and Physics; CRC Press: Boca Raton, FL, USA, 2018. [Google Scholar]
- He, W.; Yi, J.S.; Van Nguyen, T. Two-Phase Flow Model of the Cathode of PEM Fuel Cells Using Interdigitated Flow Fields. AIChE J. 2000, 46, 2053–2064. [Google Scholar] [CrossRef] [Scilit]
- Weber, A.Z.; Newman, J. Modeling Transport in Polymer-Electrolyte Fuel Cells. Chem. Rev. 2004, 104, 4679–4726. [Google Scholar] [CrossRef] [Scilit]
- Wang, Y.; Basu, S.; Wang, C.-Y. Modeling Two-Phase Flow in PEM Fuel Cell Channels. J. Power Sources 2008, 179, 603–617. [Google Scholar] [CrossRef] [Scilit]
- Hendrycks, D.; Gimpel, K. Gaussian Error Linear Units (GELUs). arXiv 2016, arXiv:1606.08415. [Google Scholar]
- Gwak, G.; Ko, J.; Ju, H. Numerical Investigation of Cold-Start Behavior of Polymer-Electrolyte Fuel-Cells from Subzero to Normal Operating Temperatures—Effects of Cell Boundary and Operating Conditions. Int. J. Hydrogen Energy 2014, 39, 21927–21937. [Google Scholar] [CrossRef] [Scilit]
- Huo, S.; Jiao, K.; Park, J.W. On the Water Transport Behavior and Phase Transition Mechanisms in Cold Start Operation of PEM Fuel Cell. Appl. Energy 2019, 233–234, 776–788. [Google Scholar] [CrossRef] [Scilit]
- Springer, T.E.; Zawodzinski, T.A.; Gottesfeld, S. Polymer Electrolyte Fuel Cell Model. J. Electrochem. Soc. 1991, 138, 2334–2342. [Google Scholar] [CrossRef] [Scilit]
- Thompson, E.L.; Capehart, T.W.; Fuller, T.J.; Jorne, J. Investigation of Low-Temperature Proton Transport in Nafion Using Direct Current Conductivity and Differential Scanning Calorimetry. J. Electrochem. Soc. 2006, 153, A2351. [Google Scholar] [CrossRef] [Scilit]
- Wu, H.; Li, X.; Berg, P. On the Modeling of Water Transport in Polymer Electrolyte Membrane Fuel Cells. Electrochim. Acta 2009, 54, 6913–6927. [Google Scholar] [CrossRef] [Scilit]
- Ren, X.; Springer, T.E.; Zawodzinski, T.A.; Gottesfeld, S. Methanol Transport Through Nation Membranes. Electro-Osmotic Drag Effects on Potential Step Measurements. J. Electrochem. Soc. 2000, 147, 466. [Google Scholar] [CrossRef] [Scilit]
- Warnatz, J.; Maas, U.; Dibble, R.W. Transport Phenomena; Springer: Berlin/Heidelberg, Germany, 2001; pp. 49–64. [Google Scholar] [CrossRef] [Scilit]
- Liu, G.Q.; Lv, S.Y.; Chen, L.; Tao, W.Q. Optimization of Self-Cold Start for PEM Fuel Cell with Serpentine Flow Field Based on Three-Dimensional Transient Model: Synergy of Initial Conditions and Start-Up Strategies. Renew. Energy 2026, 256, 124165. [Google Scholar] [CrossRef] [Scilit]
- Jiao, K.; Li, X. Effects of Various Operating and Initial Conditions on Cold Start Performance of Polymer Electrolyte Membrane Fuel Cells. Int. J. Hydrogen Energy 2009, 34, 8171–8184. [Google Scholar] [CrossRef] [Scilit]
- Zabłocka-Malicka, M.; Ciechanowski, B.; Szczepaniak, W.; Gaweł, W. Internal Cation Mobility in Molten LiCl–NdCl3 System. Electrochim. Acta 2008, 53, 2081–2086. [Google Scholar] [CrossRef] [Scilit]
- Tajiri, K.; Tabuchi, Y.; Kagami, F.; Takahashi, S.; Yoshizawa, K.; Wang, C.-Y. Effects of Operating and Design Parameters on PEFC Cold Start. J. Power Sources 2007, 165, 279–286. [Google Scholar] [CrossRef] [Scilit]
- Alzubaidi, L.; Zhang, J.; Humaidi, A.J.; Al-Dujaili, A.; Duan, Y.; Al-Shamma, O.; Santamaría, J.; Fadhel, M.A.; Al-Amidie, M.; Farhan, L. Review of Deep Learning: Concepts, CNN Architectures, Challenges, Applications, Future Directions. J. Big Data 2021, 8, 53. [Google Scholar] [CrossRef] [Scilit]
- Niu, Z.; Zhong, G.; Yu, H. A Review on the Attention Mechanism of Deep Learning. Neurocomputing 2021, 452, 48–62. [Google Scholar] [CrossRef] [Scilit]
- Hu, J.; Shen, L.; Albanie, S.; Sun, G.; Wu, E. Squeeze-and-Excitation Networks. IEEE Trans. Pattern Anal. Mach. Intell. 2020, 42, 2011–2023. [Google Scholar] [CrossRef] [Scilit]
- Zhang, H.; Liu, H.; Liang, L.; Ma, W.; Liu, D. BiLSTM-TANet: An Adaptive Diverse Scenes Model with Context Embeddings for Few-Shot Learning. Appl. Intell. 2024, 54, 5097–5116. [Google Scholar] [CrossRef] [Scilit]
- Shivahare, B.D.; Singh, M.; Gupta, A.; Ranjan, S.; Pareta, D.; Sahu, B.M. Survey Paper: Whale Optimization Algorithm and Its Variant Applications. In Proceedings of the 2021 International Conference on Innovative Practices in Technology and Management (ICIPTM), Noida, India, 17–19 February 2021; pp. 77–82. [Google Scholar]
- Lai, L.; Fiaschi, L.; Cococcioni, M. Solving Mixed Pareto-Lexicographic Multi-Objective Optimization Problems: The Case of Priority Chains. Swarm Evol. Comput. 2020, 55, 100687. [Google Scholar] [CrossRef] [Scilit]
- Dursch, T.J.; Trigub, G.J.; Liu, J.F.; Radke, C.J.; Weber, A.Z. Non-Isothermal Melting of Ice in the Gas-Diffusion Layer of a Proton-Exchange-Membrane Fuel Cell. Int. J. Heat Mass Transf. 2013, 67, 896–901. [Google Scholar] [CrossRef] [Scilit]

Disclaimer/Publisher’s Note: The statements, opinions and data contained in all publications are solely those of the individual author(s) and contributor(s) and not of MDPI and/or the editor(s). MDPI and/or the editor(s) disclaim responsibility for any injury to people or property resulting from any ideas, methods, instructions or products referred to in the content. |
© 2026 by the authors. Licensee MDPI, Basel, Switzerland. This article is an open access article distributed under the terms and conditions of the Creative Commons Attribution (CC BY) license.