


Abstract
Production of ferrochrome alloy is carried out using carbon as a reductant in a Submerged Arc Furnace (SAF). Carbothermic reduction of chromite ore results in high CO2 emissions, and alternative reductants such as H2, wherein H2O is the only by-product, have become attractive potential alternatives. Before utilizing H2 as a reductant, it is crucial to carry out a comprehensive study on the reaction kinetics with the view to aid the design and operation of reactors that facilitate the reduction process. The current study determined the kinetic parameters for isothermal and non-isothermal pre-reduction of chromite with H2 in a thermogravimetric furnace. Results from powder X-ray diffraction and scanning electron microscopy determined the mineralogical variations between the feed and the pre-reduced samples, as well as the variation between isothermally and non-isothermally treated samples. The mass loss data indicates that longer reduction times are required to reach complete reduction. The apparent activation energy for the isothermal and non-isothermal pre-reduction tests was found to be 105 and 124 kJ/mol, respectively. The mineralogical observations for pre-reduced samples at 1300 °C and 1500 °C showed that samples treated at lower temperatures (1300 °C) displayed consistent textures and Fe-Cr droplets along rims of partially altered chromite (PAC), which suggested higher metallization at this temperature. Higher temperatures (1500 °C), on the other hand, resulted in poor metallization, possibly because higher temperatures are often associated with a collapsed pore network, which results in poor diffusion rates, thus hindering complete reduction.
1. Introduction
FeCr production is a high-temperature operation that utilizes carbon-based reductants such as coke, charcoal, and coal [1,2,3]. The process includes production of four grades of FeCr, characterized in terms of their carbon and chromium content [4]. They are high-carbon (Cr: >60%, C: 6–9%), medium-carbon (Cr: 56–70%, C: 1–4%), low-carbon (Cr: 56–70%, C: 0.015–0.5%), and charge-chrome (Cr: 50–60%, C: 6–9%) [4,5,6]. Of the four grades of FeCr, charge-chrome and high-carbon FeCr are the mainly produced and consumed types, in part due to the commercial development of Argon–Oxygen–Decarburization and Vacuum–Oxygen–Decarburization processes, which result in reduced demand for low-carbon and medium-carbon FeCr [7,8]. The production of charge-chrome and high-carbon FeCr is based on reductive smelting of chromite ore with coke in the presence of silica. Carbothermic reduction of chromite is an energy-intensive process that releases large amounts of pollutant gases including greenhouse gases. The energy requirement of the process is 3500–4500 kWh/t of FeCr produced and 1.1 ton of CO2 produced per ton of ore processed [9]. The high energy consumption is attributed to the high reduction temperature of Cr2O3 and the high melting point of Cr-containing melt. Production of ferrochrome alloy is carried out in various configurations that include smelting of lumpy chromite ore in an open/semi-closed SAF, smelting of oxidized pellets or lumpy chromite ore in a closed SAF, smelting of pre-reduced chromite pellets in a closed SAF, and smelting of chromite ore fines in a direct current (DC) furnace [10,11,12]. Another technology is pre-reduction of sintered chromite pellets in a shaft furnace [13]. However, using a shaft furnace as a pellet production unit presents various limitations in terms of capacity and the degree of pre-reduction.
Ferrochrome is utilized in stainless steel production to provide corrosion resistance. Given the crucial role played by FeCr alloy in the production of steel, addressing carbon-emissions, high-energy consumption, and process efficiency needs to be prioritized. H2 constitutes one of potential alternative reductants with regard to addressing the high CO2 footprint. However, H2 reduction of chromite requires low H2O/H2 partial pressure to achieve high degree of metallization; as a result, H2 is used for pre-reduction [14]. The pre-reduction of chromite offers advantages such as reduced carbon consumption and improved production efficiency in the downstream smelting process.
Naturally occurring chromite spinel contains stabilizing Mg2+ and Al3+, and by employing H2 to pre-reduce the chromite ore, the electrical and carbon consumption of a chromite smelter can be reduced. The rate and extent of reduction of chromite ores depend on their chemical composition. It has been demonstrated that under oxidizing environments, the decomposition of FeO-based spinels is thermodynamically favourable when compared to MgO-based spinels [15]. Under reducing atmosphere, the reduction of MgO-rich chromite is more difficult than FeO-rich chromite [16]. Furthermore, in some cases the magnesia in the ore stabilizes the chromite oxide by forming a stable magnesio-chromite spinel (MgO·Cr2O3), and this results in a lower degree of pre-reduction.
The solid-state pre-reduction of chromite prior to smelting is a well-established practice in the production of ferrochromium [16]. The pre-reduction experiments on low and high Cr/Fe ratio ores to reduce the downstream smelting energy requirements have been previously conducted by [17]. In these studies, the carbon-based reductants were used for pre-reduction. The findings from the study revealed that pre-reduction results in a significant decrease in energy requirements for smelting (up to 60%). Despite the savings in energy consumption as found in this study, CO2 emissions remain an issue that require research and development to find sustainable solutions.
Some kinetic studies have been conducted to reduce synthetic iron chromate powder with H2 [18]. Their studies revealed that only the Fe-oxide part of chromate is easily reducible with H2, while the Cr-oxide component showed a low degree of reduction. Some authors investigated H2 as a potential reductant in the pre-reduction of chromite [19]. These authors found that longer residence times are needed to achieve high metallization of Fe in the pre-reduction of chromite with H2. In addition, they found metallization of Cr to be low. Under their experimental conditions (1000 °C and 60 min), the metallization of Cr for the un-oxidized ore was found to be 0.18% and 0.3% for pre-reduction of pre-oxidized chromite ore. On the other hand, Fe metallization for the non-oxidized and oxidized ore was found to be 84% and 92%, respectively.
The reduction mechanisms for the solid-state pre-reduction of chromite with H2 as reported by [20] follows four distinct stages, namely pre-heating, solid-state reduction, softening and consolidation, and over-reduction and weakening. The initial stage is characterized by low temperatures (1000 °C) and a low degree of reduction wherein (Mg, Fe) (Cr, Fe, Al)2O4 undergoes limited reduction to (Mg, Fe) (Cr, Al)2O4. In the second stage, the temperature increases to 1200 °C, leading to an increased rate of reduction and increased Fe metallization. The third stage, under increasing temperature, results in the softening and melting of a pellet binder phase (bentonite) within the chromite pellet which facilitates separation of metallic Fe from the spinel. This separation enhances Fe metallization, and the presence of the melting binder phase helps improve the strength of pellets. Pre-reduced pellets with good mechanical strength allow for charging without crushing the material during the downstream smelting process, enabling storage and transportation [21]. At the last stage, over-reduction can lead to decreased pellet strength. In this case, the iron oxide part of the binder phase is reduced by H2. As the concentration of H2 increases and facilitates high degrees of reduction, the concentration of Fe2+ in the binder phase decreases, resulting in a high melting point binder phase and consequently a decrease in pellet strength. This is because the content of FeO in the CaO-SiO2-Al2O3-FeO binder phase affects melting point and softening. Ref. [21] studied the effect of FeO on the softening and melting temperatures of the CaO-SiO2-MgO-Al2O3 slag system and found that the addition of FeO up to 20 mass% decreased the softening and melting temperatures of the slag systems significantly. Therefore, over-reduction lowers the content of FeO in the CaO-SiO2-Al2O3-FeO ‘binder’ phase, resulting in increased softening and melting temperatures and decreased pellets’ mechanical strength, which is undesirable.
Owing to the reported low degree of Cr metallization when using H2 as a reductant, the current study investigated the pre-reduction of chromite pellets with H2 at high temperatures (1200 °C to 1500 °C) with the aim of improving reducibility and investigating sintering behaviour. In addition, this study aimed to examine the kinetics of chromite pellets pre-reduction with H2 and using the determined kinetic data in future Computational Fluid Dynamic (CFD) models to facilitate the design and optimization of pre-reduction reactors.
2. Materials and Methods
2.1. Raw and Pre-Reduced Material Characterization
A sample of chromite concentrate from Samancor Chrome Ltd. (Middleburg, South Africa) was subjected to chemical analysis, using Inductively Coupled Plasma Optical Emission Spectroscopy (ICP-OES). In addition, mineralogical analysis was carried out on pelletized (with bentonite as a binder) samples of the feed (i.e., chromite concentrate) and four pre-reduced products. The primary objective was to observe the mineralogical variations before and after reduction, as well as to establish the differences between samples produced by isothermal and non-isothermal processes during pre-reduction at 1300 °C and 1500 °C. To make these observations, each sample was lightly crushed to reduce the size of the pellets and split for powder X-ray diffraction (XRD) and scanning electron microscopy (SEM). For the XRD work, a pulverized portion of the sample was run on a Bruker D8 Advance powder diffractometer equipped with a Lynxeye detector and fixed divergence slits (Bruker AXS, Madison, USA). The analysis employed Fe-filtered Co-Kα radiation and covered a range from 3° to 80° 2θ, with a step size of 0.02° 2θ and a counting time of three seconds per step (for the feed sample) and one second per step (for the pre-reduced samples). The identification of mineral species and their relative abundances (for the feed and pre-reduced products) was conducted using the Bruker EVA software, DIFFRAC.EVA V4.2.2. The TOPAS package was used with Rietveld refinement to quantify minerals only in the feed sample. The representative SEM sub-sample from each sample was prepared into polished sections and was subjected to SEM analysis using a Zeiss EVO® MA15 SEM (Zeiss, Berlin, Germany) equipped with a Bruker energy dispersive X-ray analyzer (EDX/EDS; Bruker Nano GmbH, Berlin, Germany). Backscattered electron images were generated to visualize and define the textural characteristics, and energy dispersive spectrometry (EDS) analysis was conducted to identify phase variations between the feed and pre-reduced samples.
2.2. Thermogravimetric Analysis
The as-received chromite concentrate was subjected to crushing using a jaw crusher (FRITSCH GmbH, Idar-Oberstein, Germany) to obtain a top particle size of 1 mm. The crushed concentrate was blended and split into representative samples using the rotary splitter. A sub-sample of 15 kg in mass was subjected to milling using a ball mill to obtain a bulk sample with a top size of 212 µm and a D80 of 75 µm, which is the typical particle size distribution for pelletization test work. It is crucial to ensure that a sample is homogenized prior to pelletization, and this was achieved through pulverization. An amount of 15 kg of chromite concentrate and 464 g of bentonite (this translates to 3% mass fraction of bentonite) was blended using an Eirich Mixer Mixer (Birkenmayer (Pty) Ltd, Kempton Park, South Africa) to produce a homogenous mixture for producing pellets using a 0.6 m diameter pelletizing disc. In pre-reduction experiments, pellets of sizes ranging −12 + 8 mm were used.
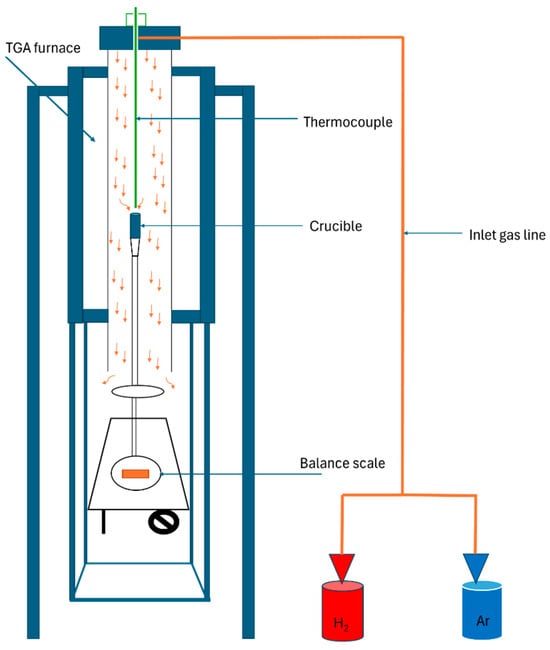
Pre-reduction of chromite pellets was investigated using the thermogravimetric furnace shown in Figure 1. The furnace was designed and fabricated in-house. The isothermal and non-isothermal reduction experiments were conducted with H2 over a temperature range of 1200 °C to 1500 °C. The number of pellets used for each test was limited to four, and the total mass of charge per test was 10 ± 0.5 g. The number of pellets used was chosen to facilitate enhanced mass transfer of H2 to the reaction sites. The objective of the test work was to determine the influence of temperature reduction on the degree of reduction. In the non-isothermal tests, H2 and Ar, each at a flow rate of 1 L/min, were introduced to the charge while the furnace was cold, followed by the furnace heating up at 5 °C/minute to the above-mentioned temperatures. Upon reaching the targeted temperature, the furnace was maintained at a certain temperature for 2 h. At the end of exposure time, Ar flow rate was increased to 2 L/min; the reducing gas flow stopped and was immediately followed by stopping power input to the furnace to facilitate the cooling of the sample in Ar gas. The same methodology was followed for isothermal tests, with the only difference being that the heating rate was 10 °C/ min and the reducing gas was introduced to the charge when the targeted temperature was reached.
Figure 1.
A schematic of a thermogravimetric furnace (the arrows depict the direction of gas flow in the furnace).
3. Results
3.1. Feed Sample Characteristics
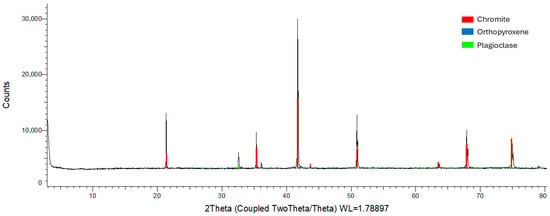
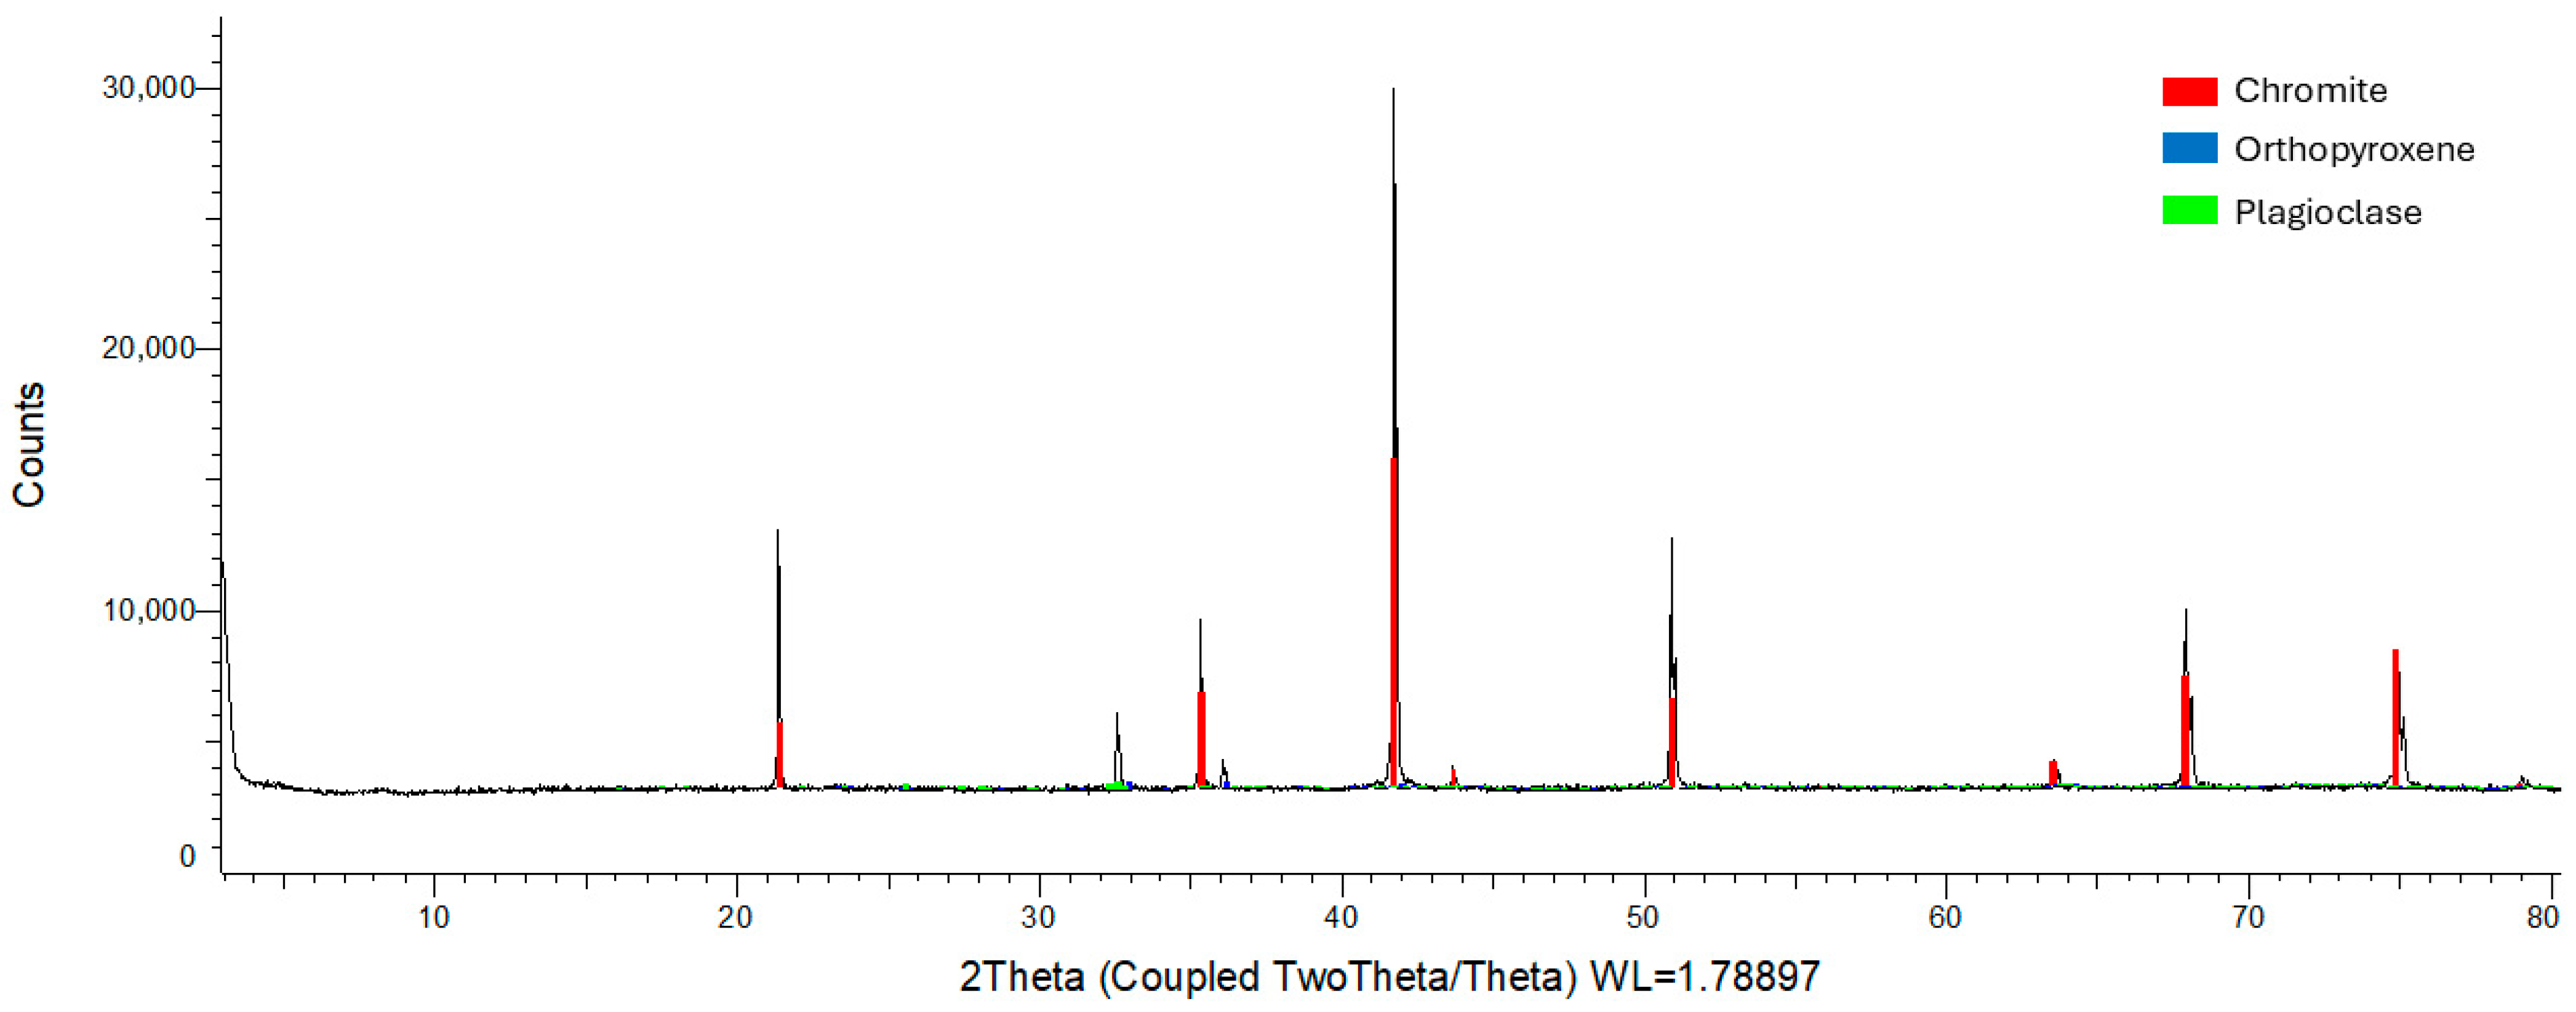
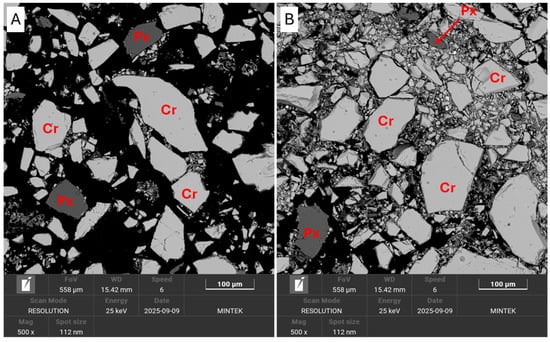
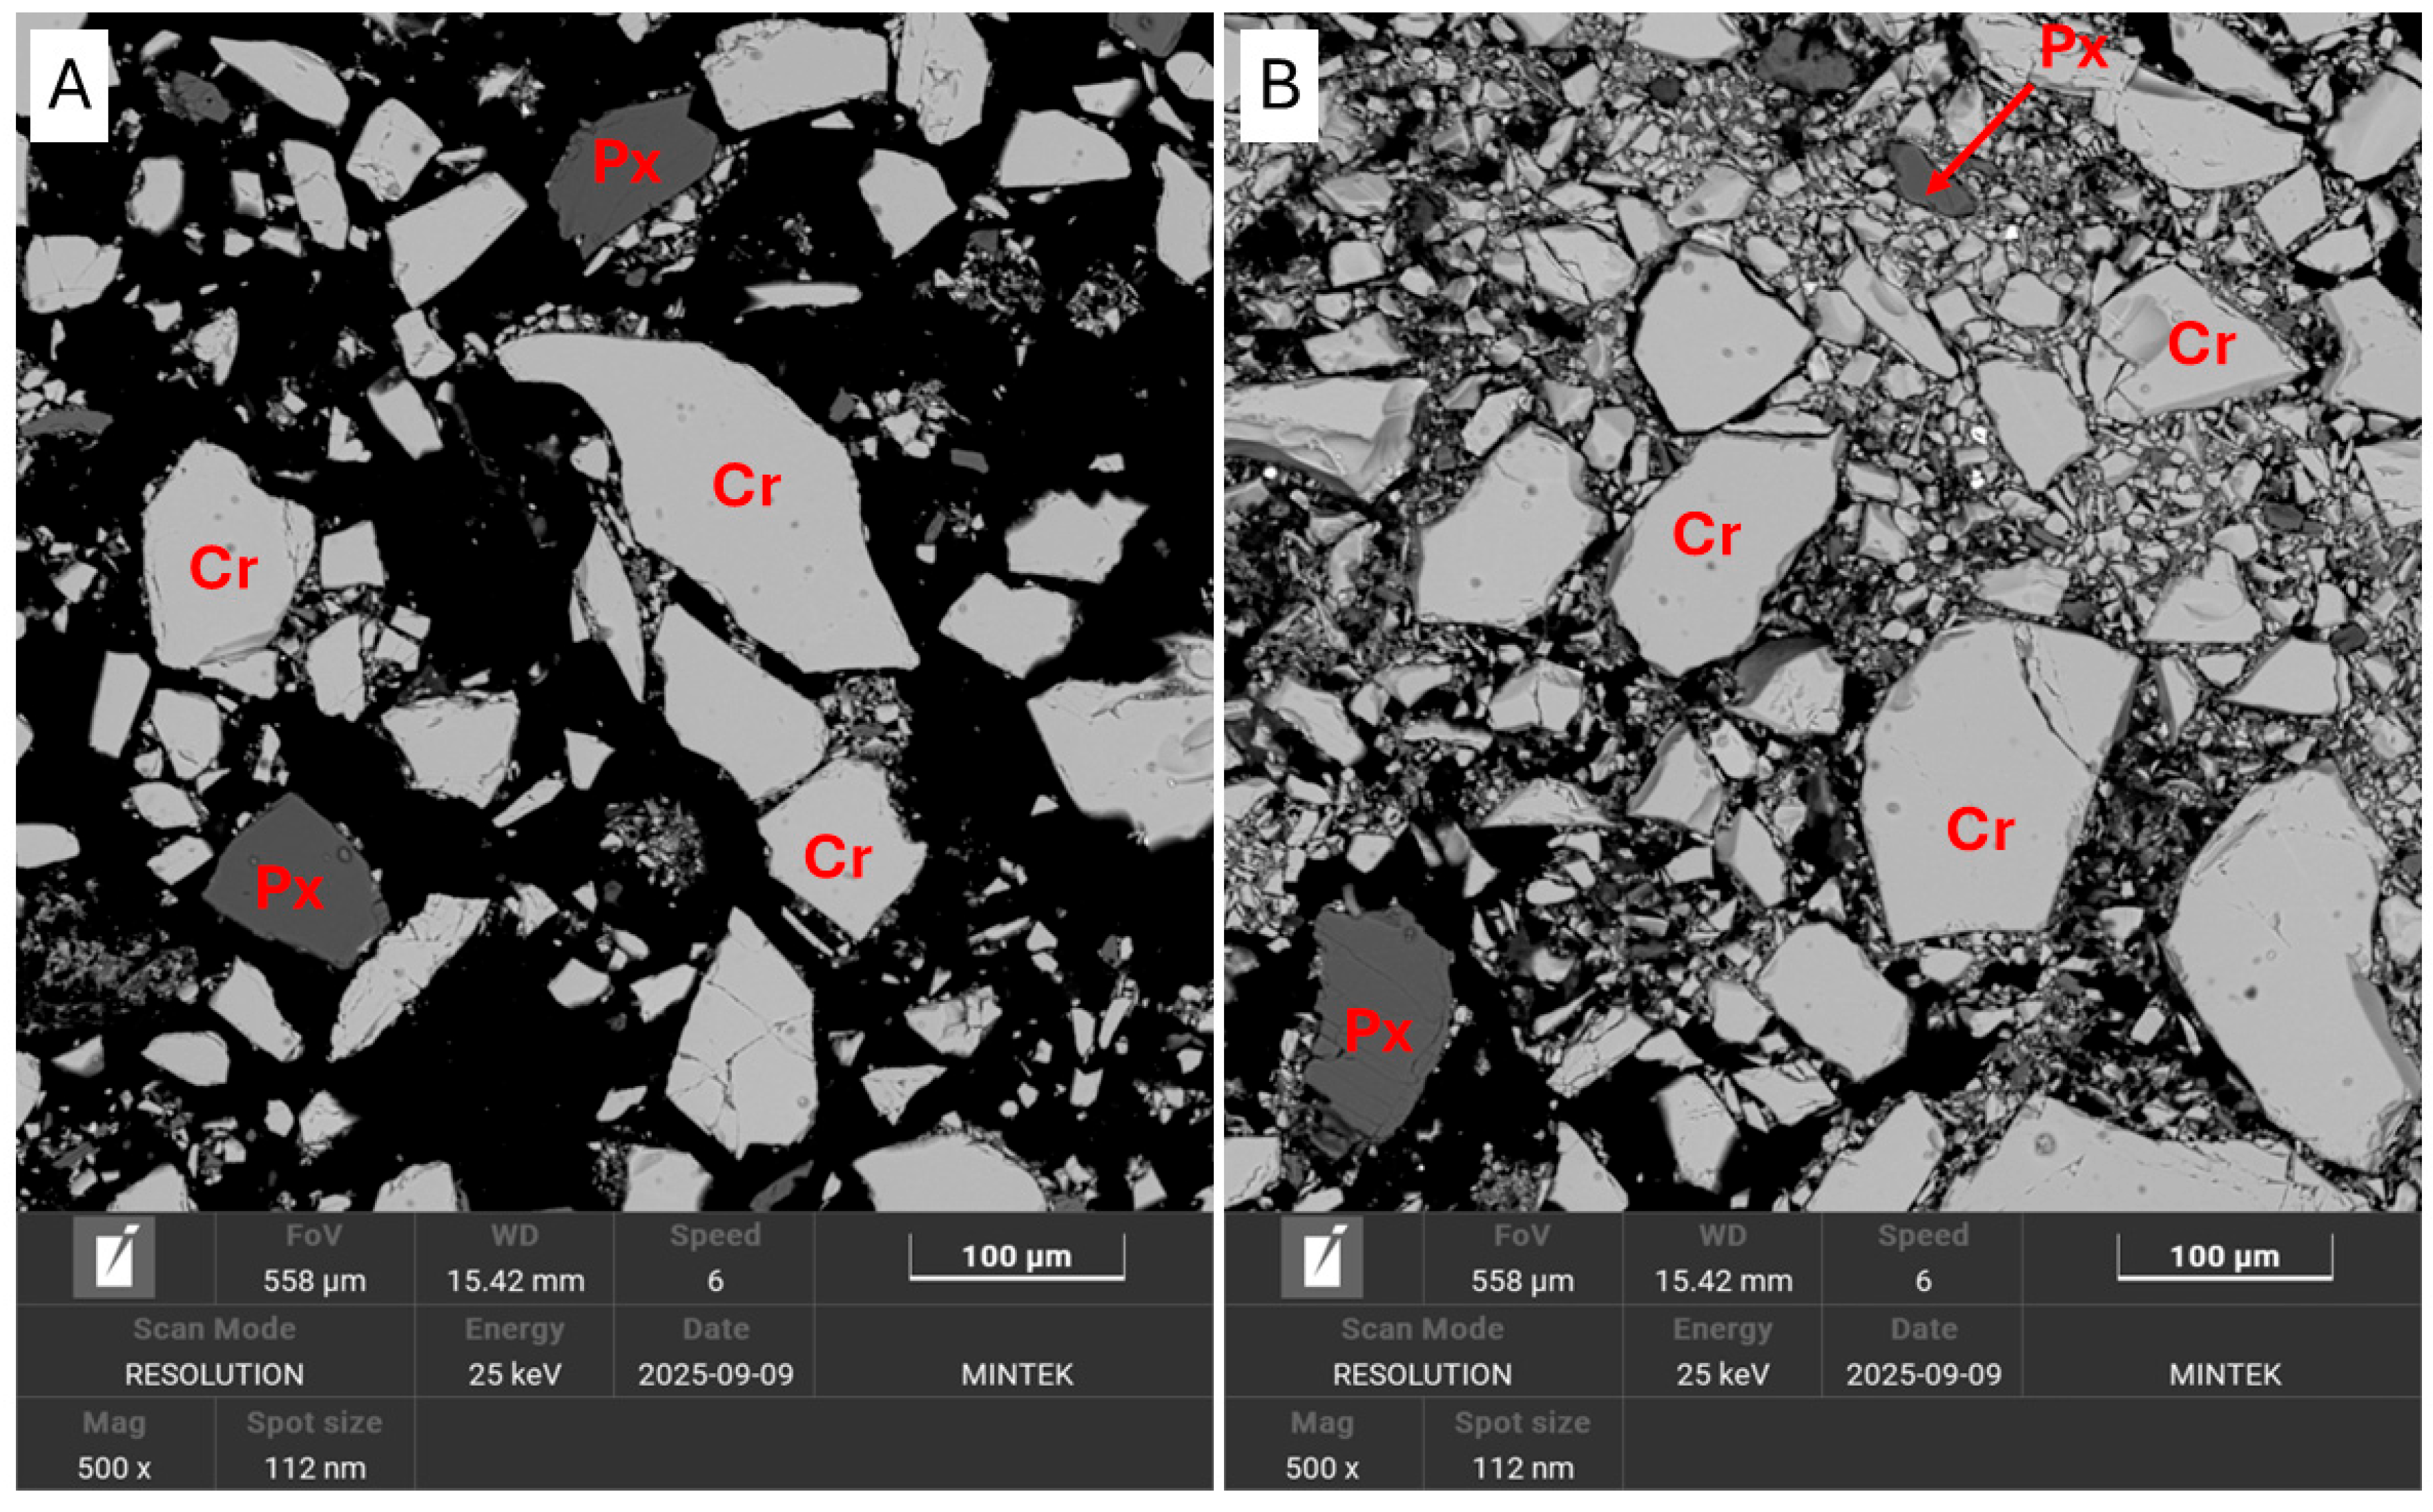
The ore concentrate exhibits bulk chemical (Table 1) and mineralogical abundances (Table 2 and Figure 2), typical of a chromite concentrate sample. The sample is primarily made up of chromite, with abundances greater than 90 mass%, followed by orthopyroxene of approximately 5.7 mass% and plagioclase at 1.3 mass%. In this section, the sample displays particles of chromite grains that range from angular to subangular and coarse to fine, along with some in the binder phase (bentonite) (Figure 3A,B). Subordinate amounts of ore silicates are also present in the broken-up pellets. The chromite phase identified is magnesian-rich, also known as magnesio-chromite, with the ideal chemical formula of (Mg,Fe)(Cr,Fe,Al)2O4. This is supported by the SEM-EDS data collected for the chromite phase, displayed in Table 3. The silicates identified include orthopyroxene, feldspar, and clinopyroxene, in agreement with XRD observations.
Table 1.
Bulk chemical composition (wt%) of the chromite concentrate.
Table 2.
Bulk mineralogy of the feed (chromite concentrate).
Figure 2.
XRD diffractogram providing the phases identified during analysis, showing that chromite occurs in predominant abundances.
Figure 3.
(A,B) Backscattered electron (BSE) images of the pelletized chromite concentrate. Cr—chromite, Px—pyroxene.
Table 3.
Average compositions of key minerals identified in the chromite concentrate sample, determined by SEM-EDS methods.
3.2. Isothermal Pre-Reduction
3.2.1. Mass Loss Calculation for Isothermal Pre-Reduction
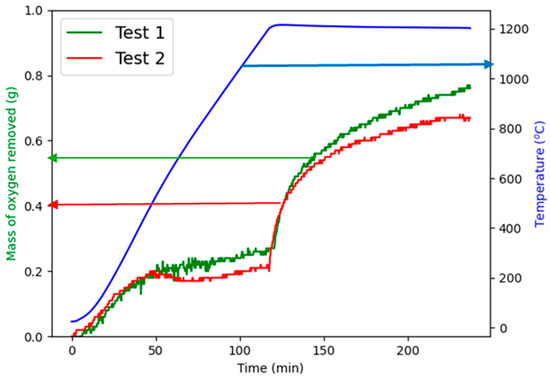
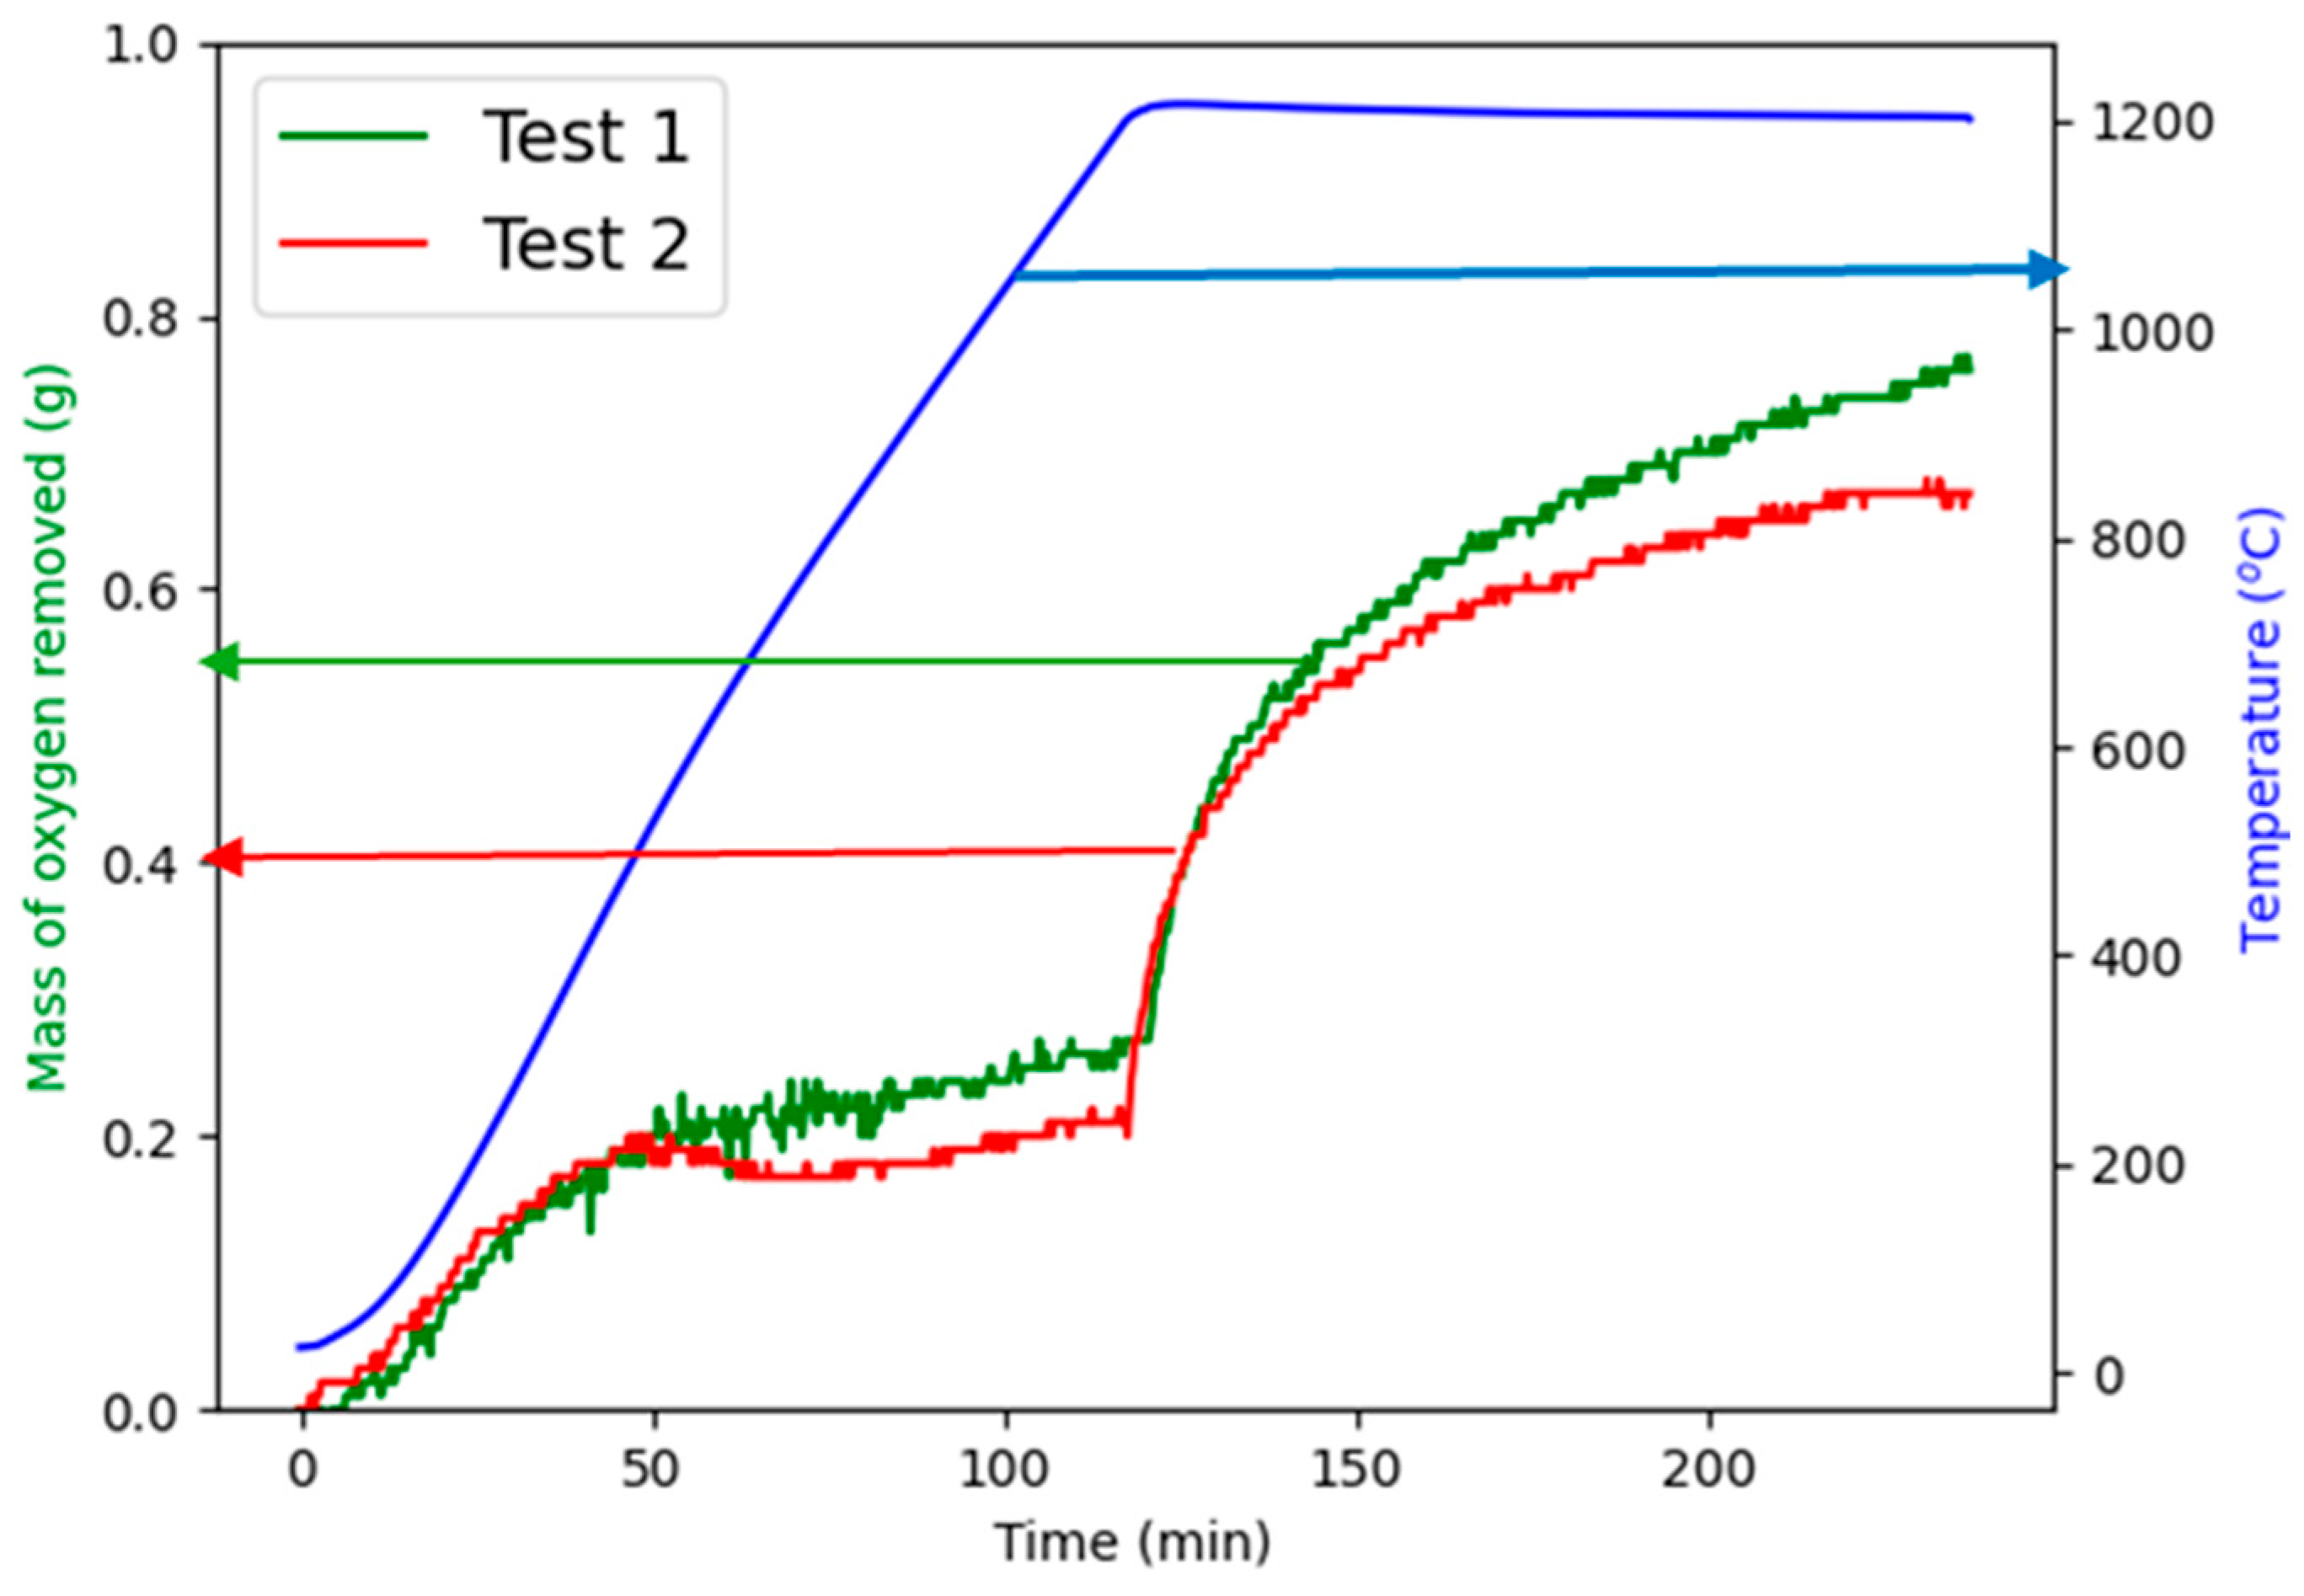
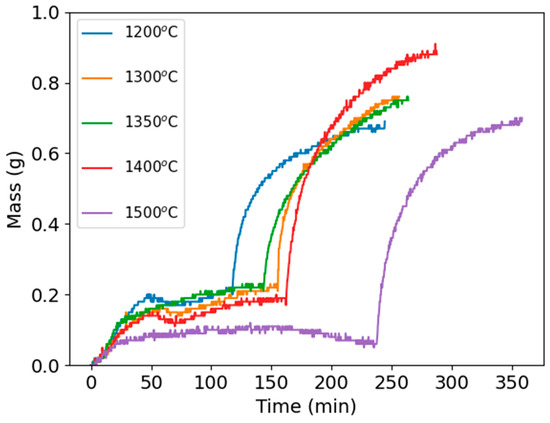
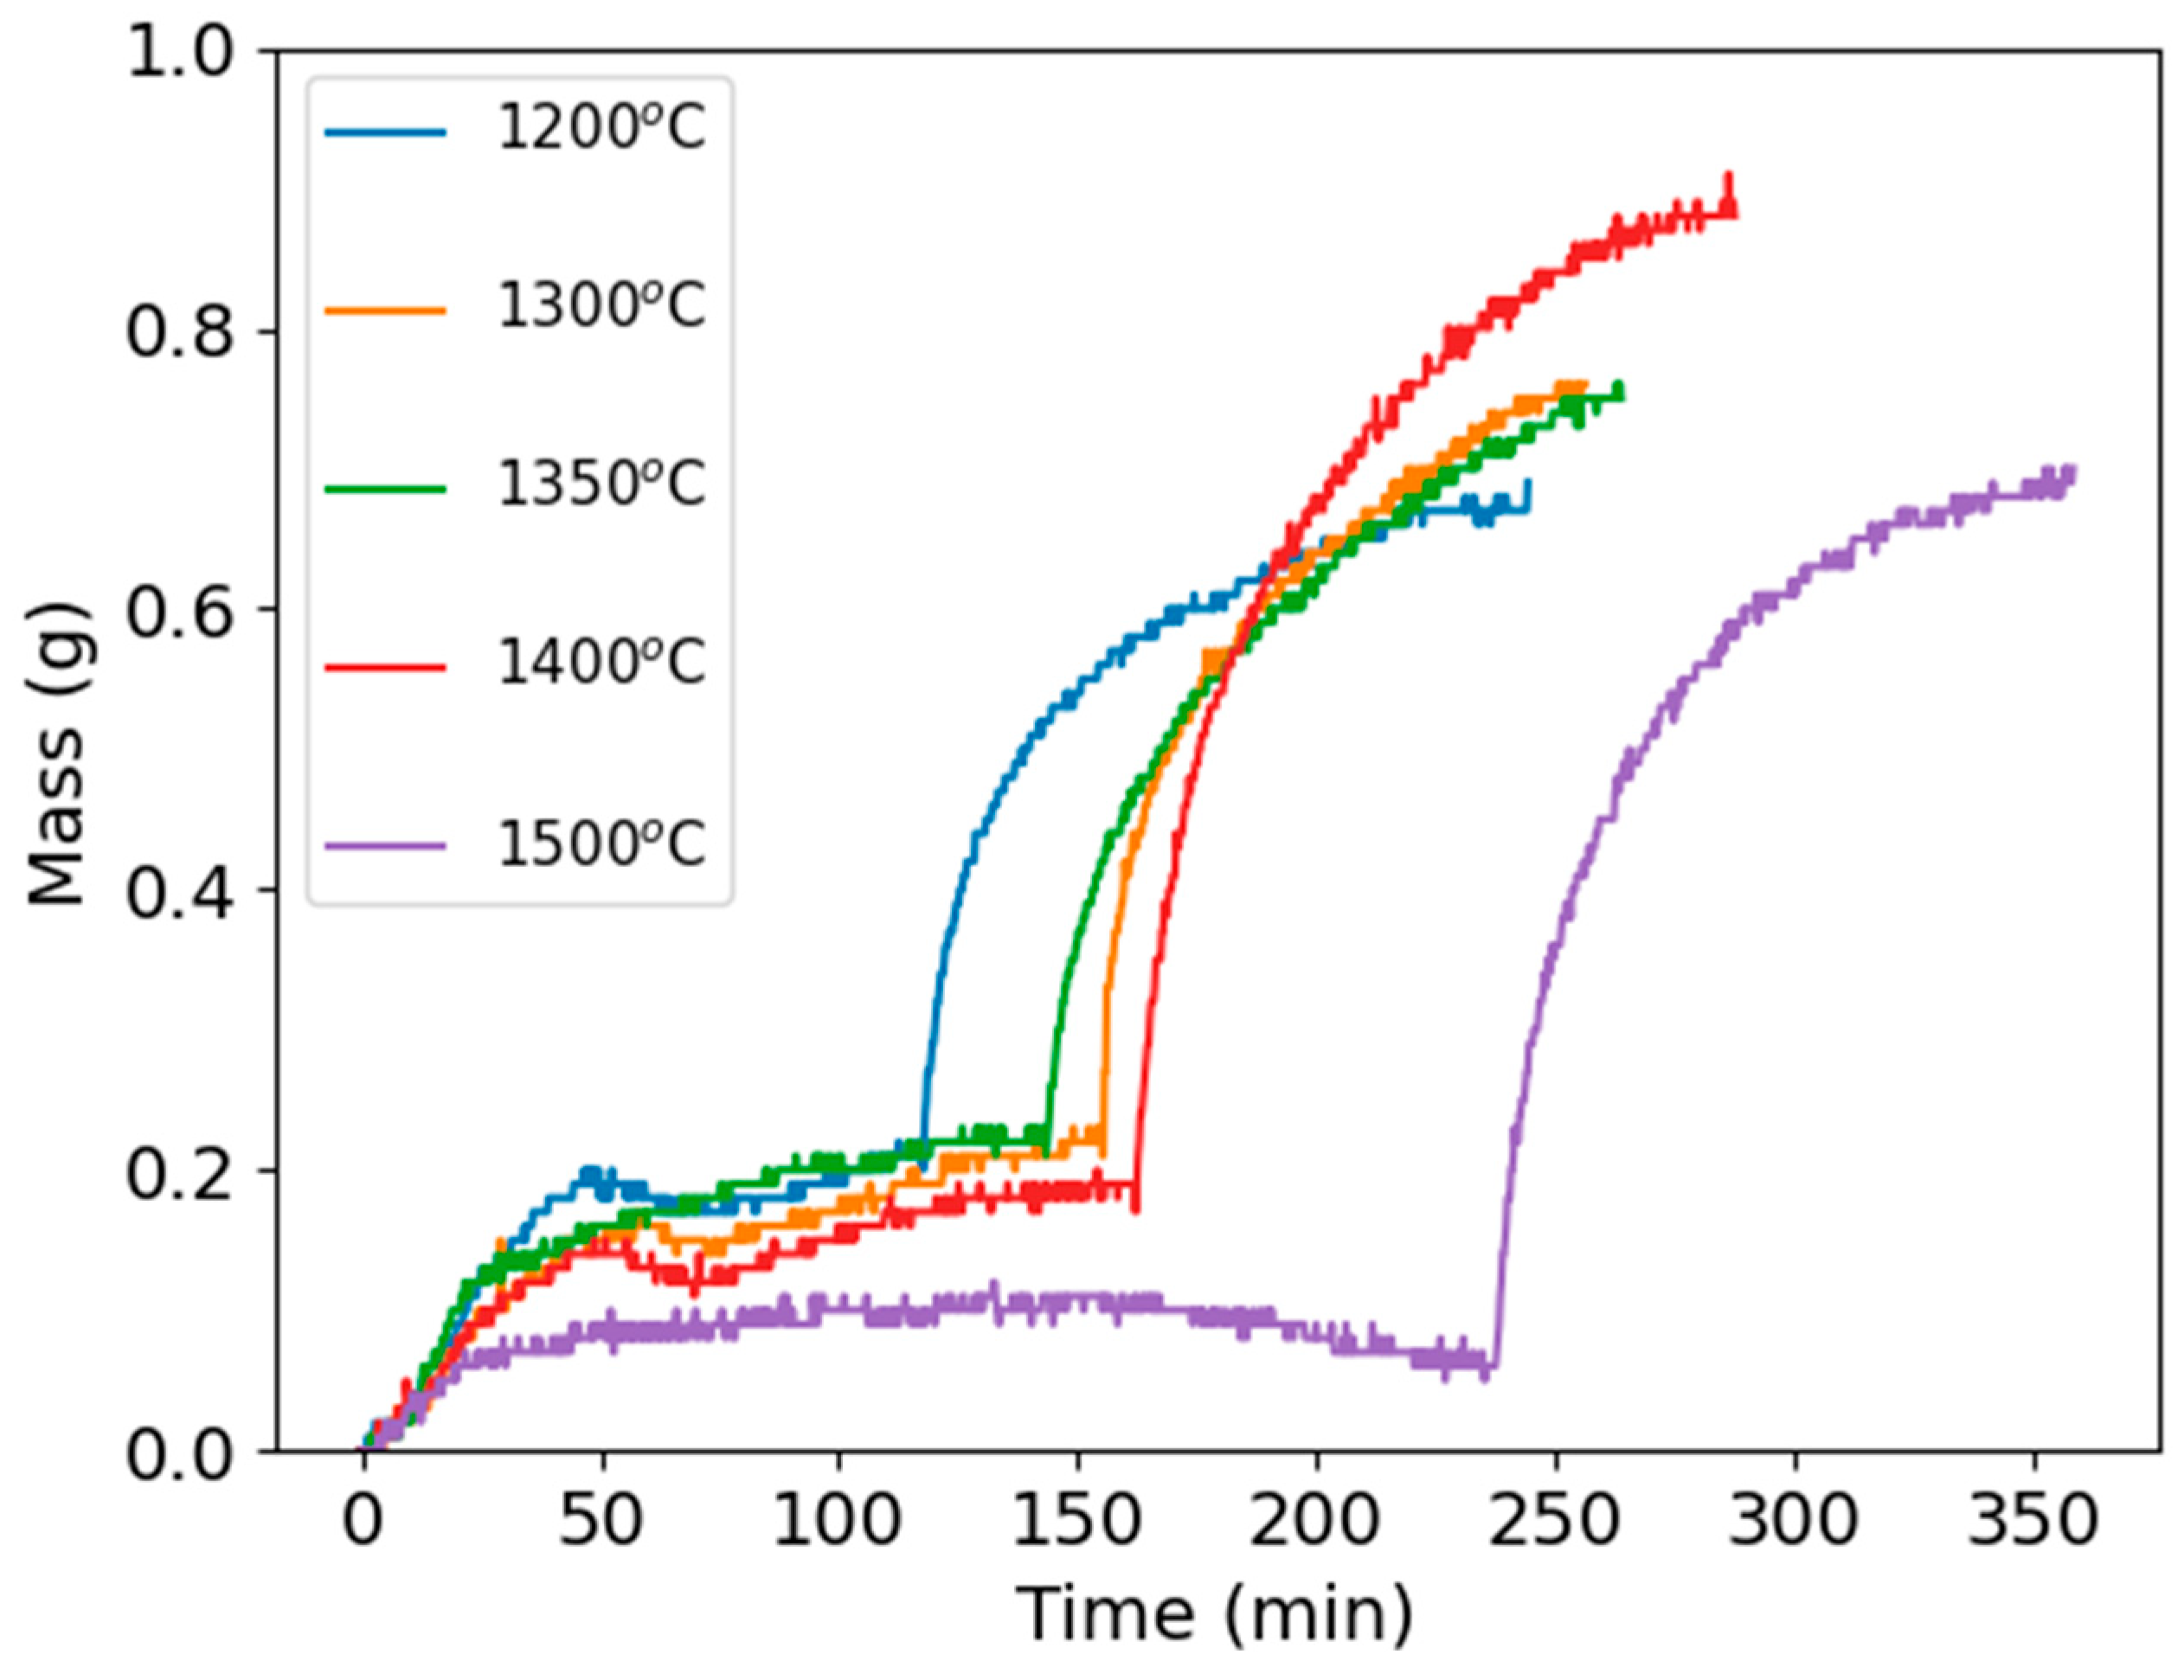
The mass of oxygen removed from the sample during isothermal pre-reduction is presented in Figure 4 and Figure 5. In Figure 4, two tests for isothermal pre-reduction at 1200 °C were performed in order to investigate repeatability. As observed, the profiles for cumulative mass removed from the two tests are similar, and this reveals the repeatability of the method. The targeted temperature was reached after 117 min, and H2 was immediately introduced; this is evidenced by a sharp increase in cumulative mass removed. Prior to introducing H2, the observed mass loss can be attributed to the removal of volatiles and adsorbed moisture. The results in Figure 5 indicate that pre-reduction continued until the 2 h holding time elapsed, highlighting that longer holding times are required to achieve higher degrees of pre-reduction. The results demonstrate that the degree of chromium and iron oxide deoxidation increases with increasing temperature from 1200 °C to 1400 °C whereas a retarding effect is observed at 1500 °C, which can be attributed to sintering. Sintering induces microstructural changes such as the removal of pore interconnections in pellets, resulting in reduced effective diffusivity [22]. The reduced pore interconnections make the reducing gas diffusion and transport paths more tortuous and reduces the rate of oxide deoxidation.
Figure 4.
Mass of oxygen removed for isothermal pre-reduction at 1200 °C (the arrows show the y-axis from which the values were measured).
Figure 5.
Mass of oxygen removed profiles for isothermal pre-reduction at various temperatures (1200 °C to 1500 °C).
The theoretical mass loss from a 10 g sample was calculated from Equation (1), and from the raw material bulk chemistry in Table 1, the theoretical mass loss for a 10 g sample was found to be 1.94 g. The pre-reduction at 1200 °C and 2 h holding time only achieved 34.7% of the total achievable mass loss. The low degree of reduction is supported by the mineralogy of the feed sample, which revealed that the chromite phase identified is magnesia-rich, and magnesia forms a stable magnesio-chromite (MgO.Cr2O3) spinel which is difficult to reduce.
where is molecular weight of oxygen, is the molecular weight of , and is the molecular weight of .
3.2.2. Degree of Metallization for Isothermal Pre-Reduction
The chromium speciation method was not available for the analysis of the pre-reduced sample; therefore, only Fe degree of metallization (DOM) is reported as shown in Table 4. The degree of metallization was calculated according to Equation (2). The DOM increased with increasing temperature from 1200 °C until 1400 °C. DOM at 1500 °C is lower than DOM at 1350 °C and 1400 °C, and this could be due to sintering that blocked access of reducing gas to the reaction sites. Sintering exacerbates mass transfer limitations due to increased H2 diffusion path length, and this results in slower reaction rates. In this case, both external and internal mass transfer effects are stronger, leading to reduced DOM. The DOM results agree with the mass loss data in Figure 5, where the highest mass loss was recorded at 1400 °C followed by 1350 °C.
Table 4.
Fe degree of metallization results for isothermal pre-reduction at various temperatures.
3.2.3. Mineralogy of Isothermal Pre-Reduced Products (1300 °C vs. 1500 °C)
Mineralogical characterization was undertaken to gain insights into phase transformations during pre-reduction. The samples pre-reduced at 1300 °C and 1500 °C were chosen for characterization because 1300 °C is high enough to achieve a pronounced pre-reduction, and at 1500 °C, sintering might occur, and this needed to be confirmed mineralogically.
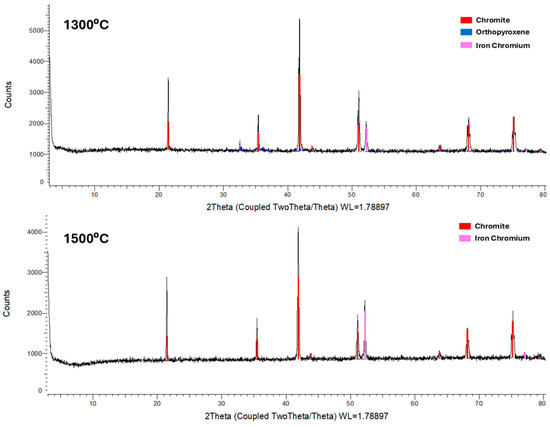
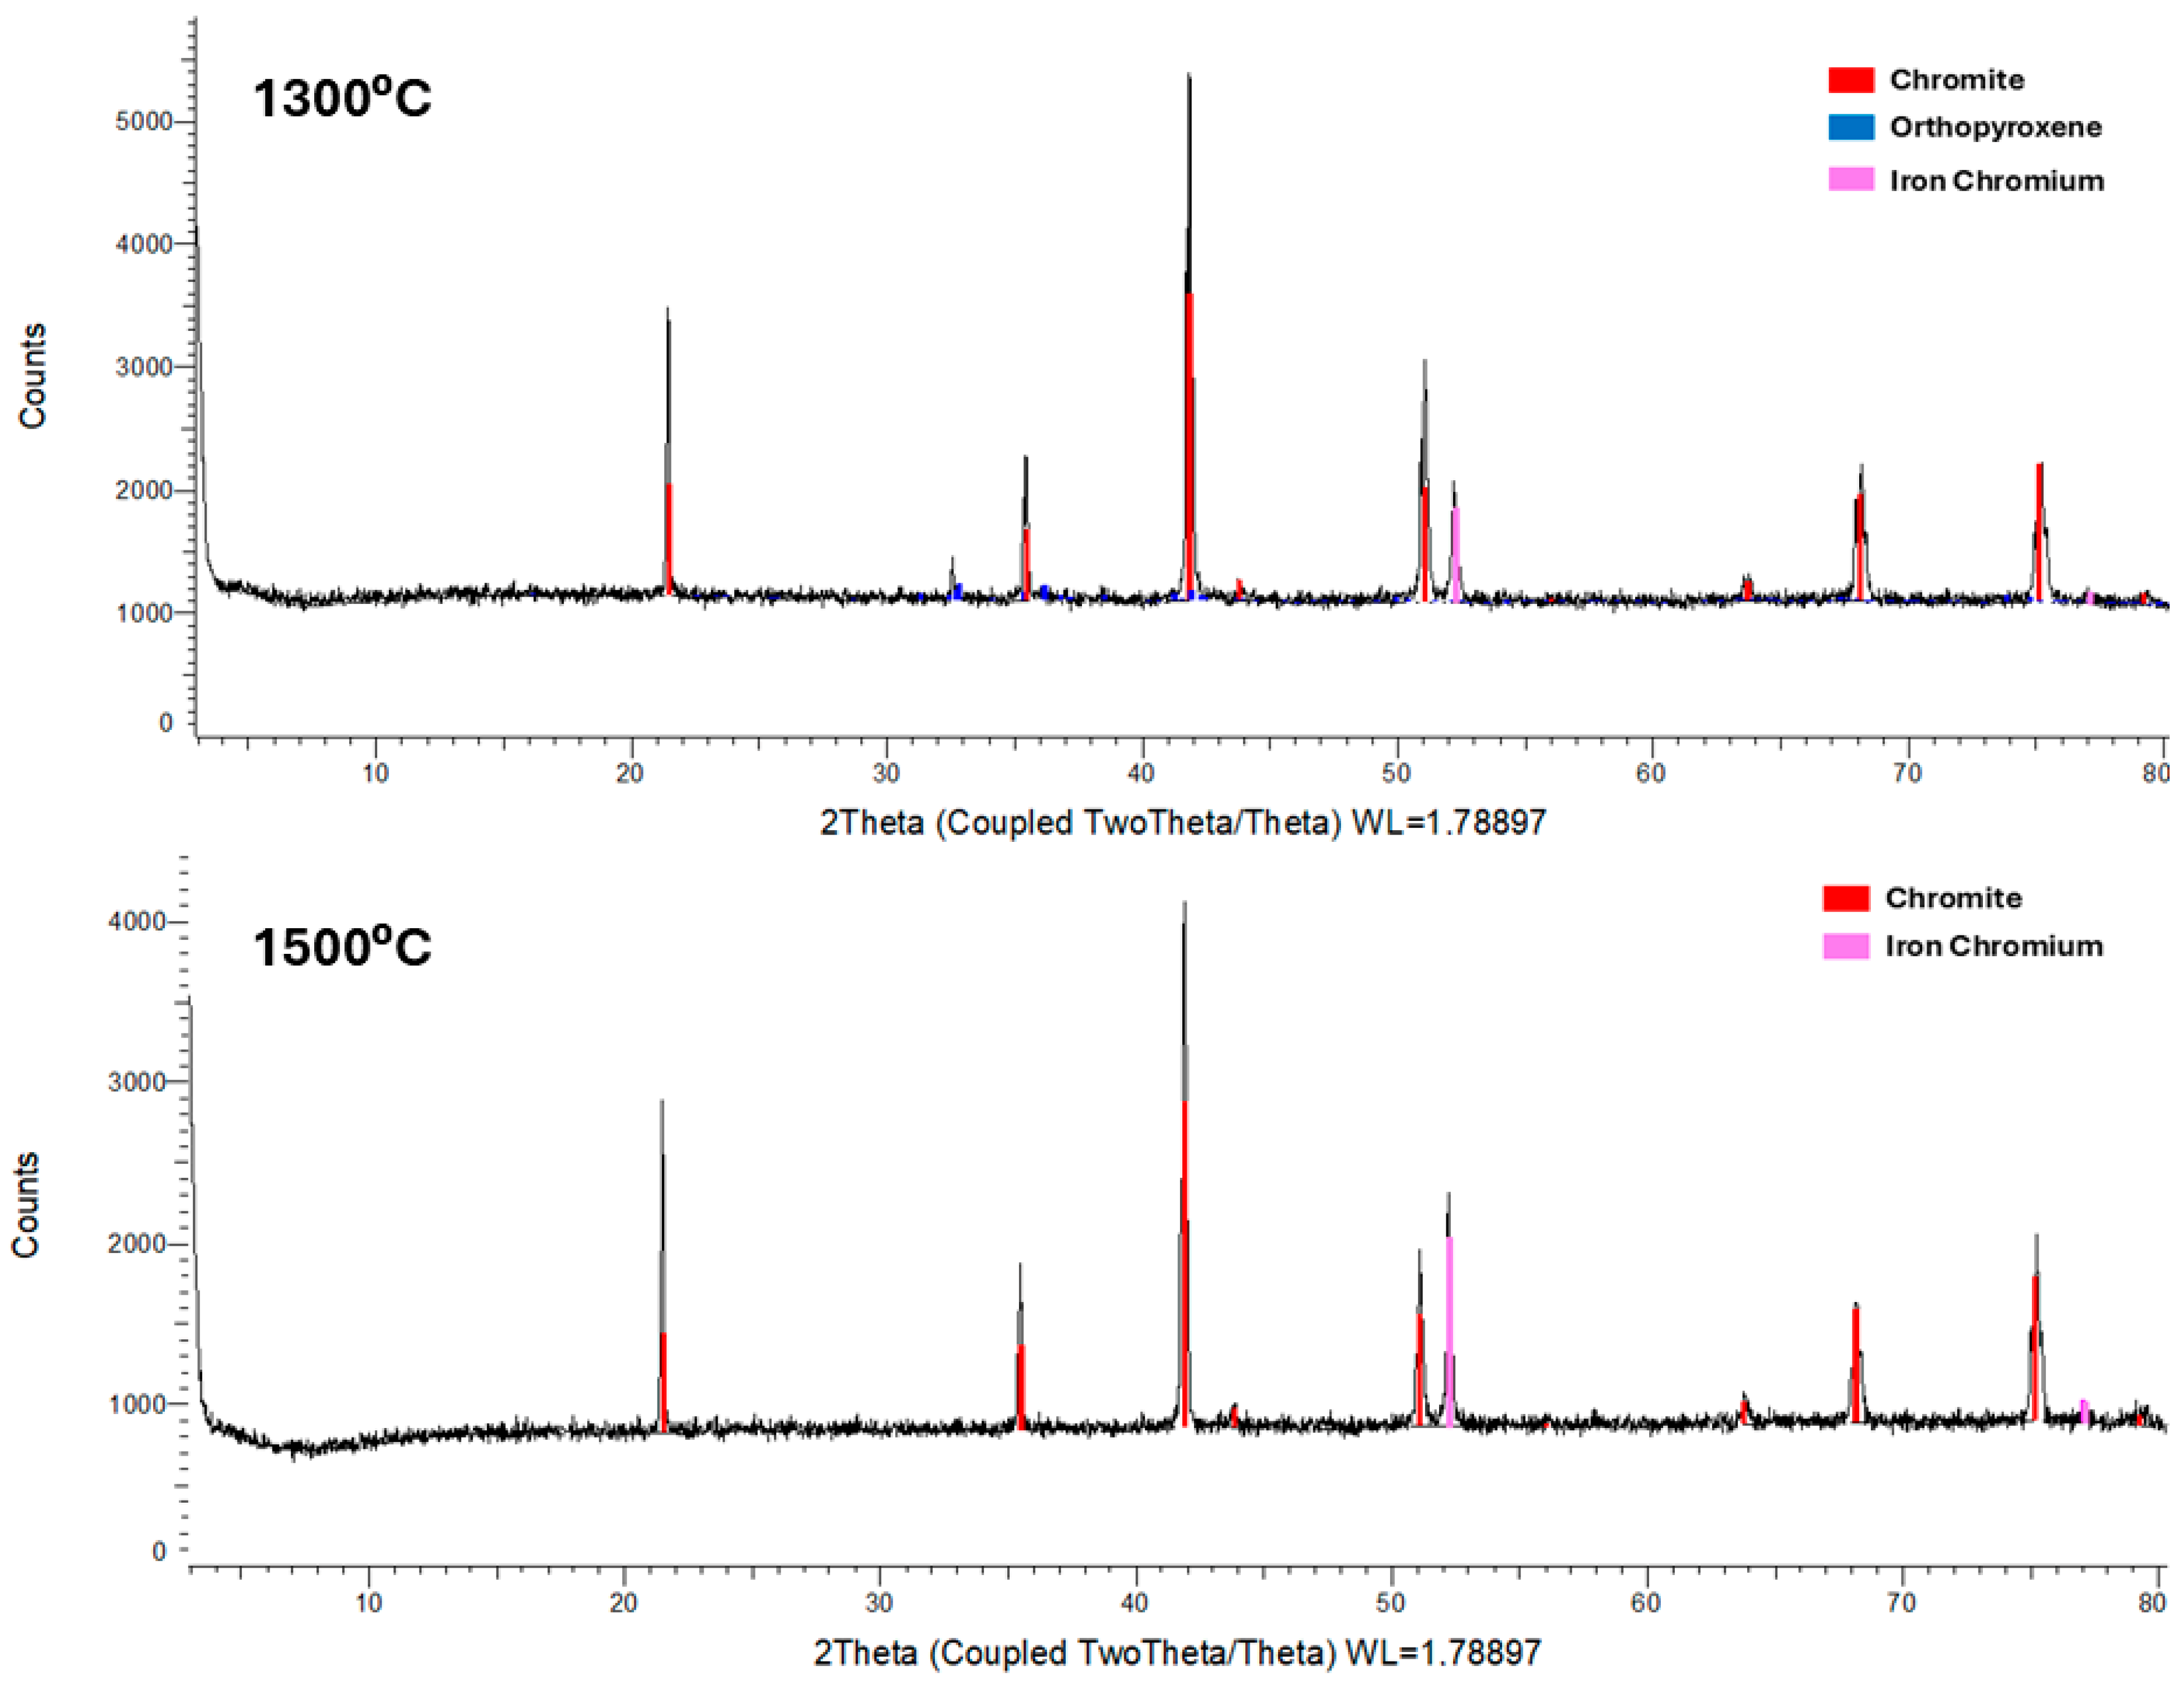
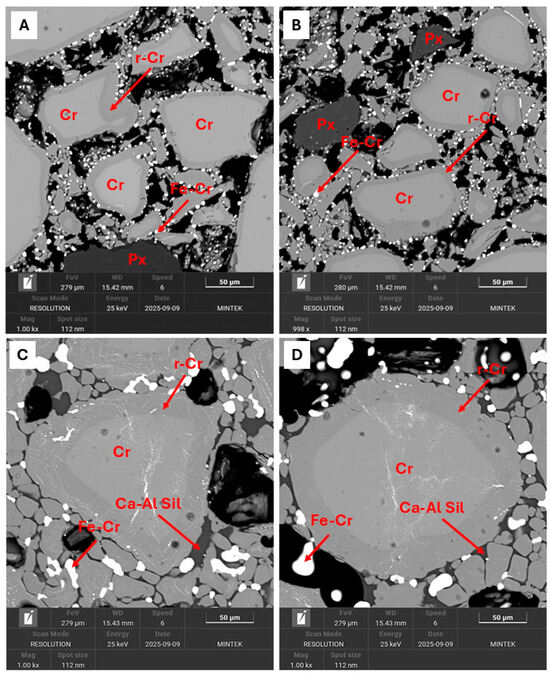
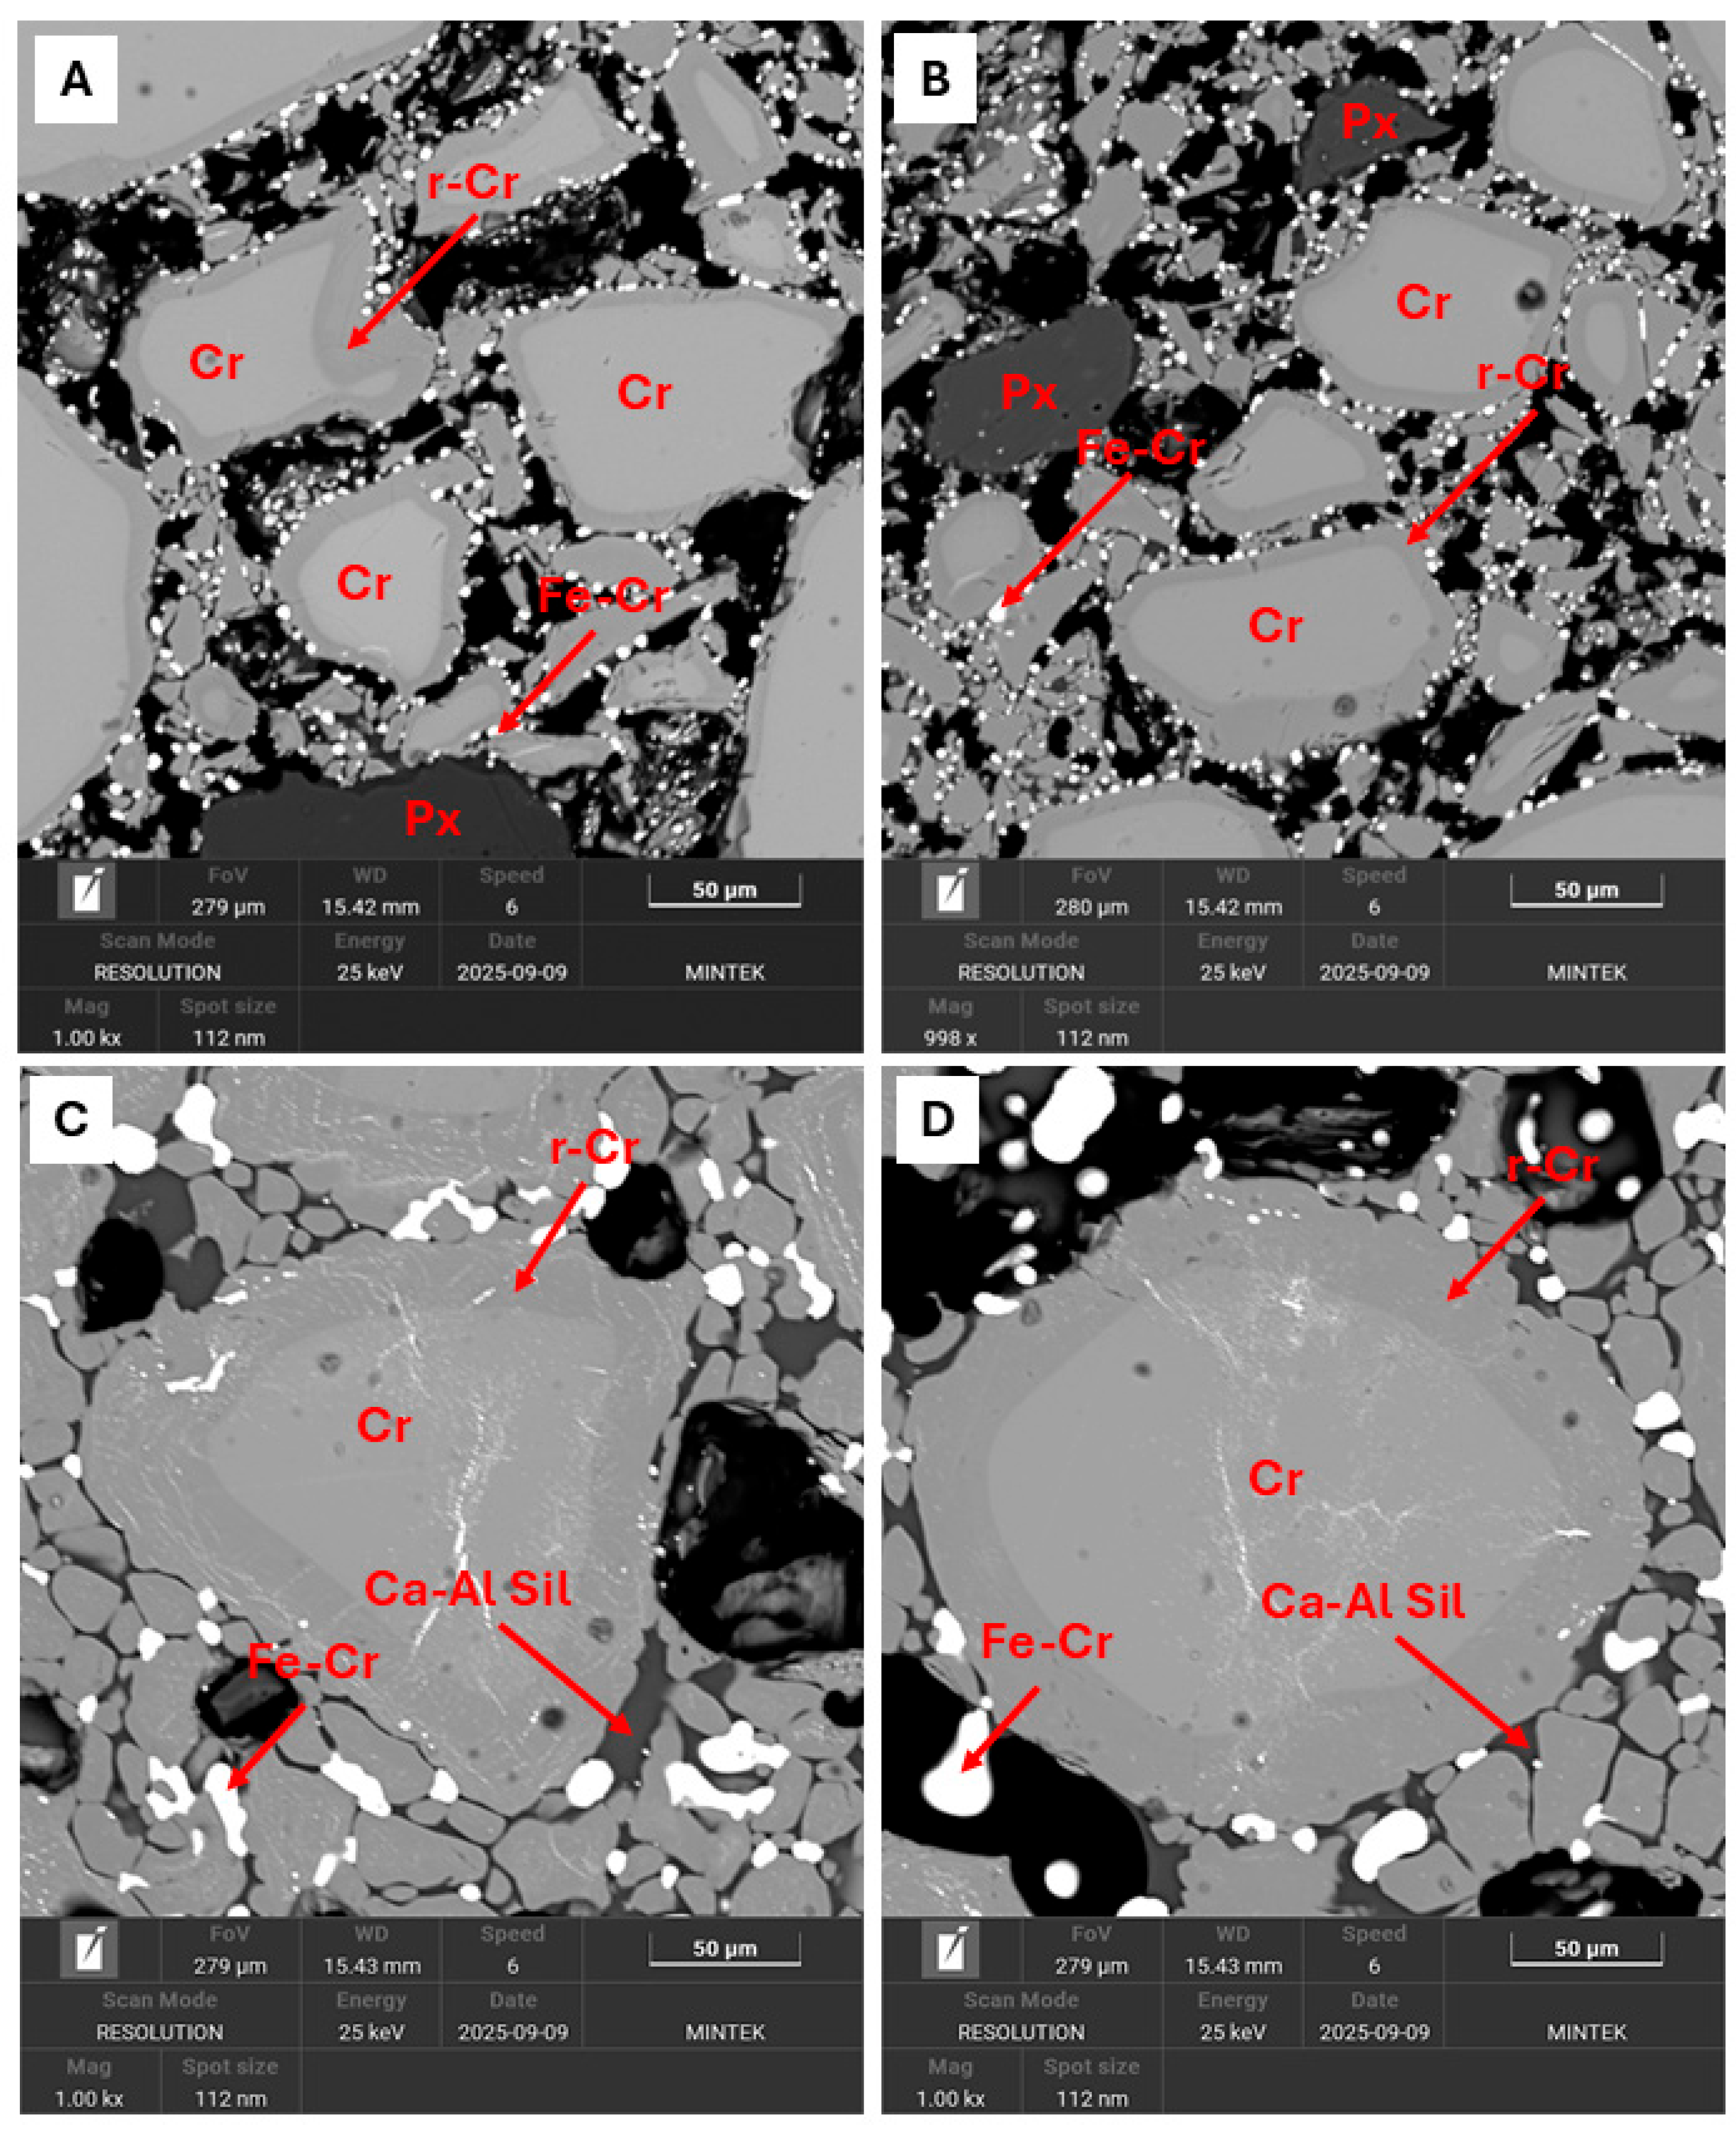
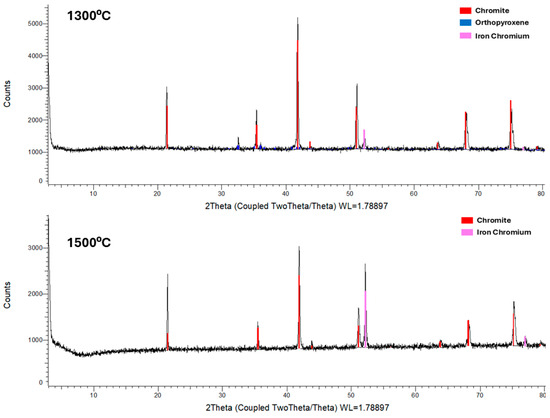
The isothermally treated samples display clear textural and mineralogical differences for the different temperatures (Table 5 and Figure 6). At 1300 °C the pre-reduced product exhibits textures showing the development of partially altered chromites (PACs). The chromite grains are characterized by partially altered regions where the core of the chromite grains is preserved, and rims are partially altered to a higher Cr:Fe ratio (Figure 7A,B). In addition, the edges are characterized by the development of fine metallic Fe-Cr droplets. The extent of chromite reduction appears to be influenced by the size of the grains. Generally, smaller grains are more fully pre-reduced, with no preserved zones, as observed in larger grains. Overall, at this temperature (1300 °C), it should be noted that other phases present in the sample, such as orthopyroxenes (also observed from the XRD analysis in Table 6) and other silicates occurring in trace amounts, are preserved. This preservation indicates no alteration of the silicate structures, as observed with chromite phases. Additional observations at this temperature suggest that the sample is porous and does not exhibit partial melting, as would typically be observed at higher temperatures.
Table 5.
Average elemental compositions of common phases found in isothermally (1300 °C and 1500 °C) treated samples identified during the SEM analysis.
Figure 6.
XRD diffractograms for the isothermally treated samples at 1300 °C and 1500 °C.
Figure 7.
Backscattered electron (BSE) images of pre-reduced chromite concentrate samples under isothermal conditions at 1300 °C (top) and 1500 °C (bottom). (A,B) Partially reduced chromites (PACs) with a preserved chromite in the core, and rims are the reduced sections in the isothermally treated sample. The rims have globules of iron chrome alloy that surround most particles. (C,D) The 1500 °C isothermally treated sample displays PACs that are sintered to one another via a glassy phase, with interstitial occurrence of iron chrome alloys. Cr—chromite, Fe-Cr—iron chromium alloy, Ca-Al Sil—calcium aluminum silicate, r-Cr—reduced chromite (PAC), Cr—chromite, and Px—pyroxene.
Table 6.
Relative abundances of the pre-reduced chromite of the isothermally (1300 °C and 1500 °C) treated samples.
When compared to the 1300 °C sample, the 1500 °C sample under the same isothermal conditions displays variable textures owing to the increased temperatures. The 1500 °C sample appears to be less porous and is characterized by the presence of a Ca-Al silicate glassy phase, which binds most grains together (Figure 7C,D). Like the 1300 °C product, the samples appear to have been successfully pre-reduced, as indicated by the presence of PACs and Fe-Cr droplets in the sample. The Fe-Cr droplets are relatively larger when compared to the finer ones in the 1300 °C sample, primarily associated with the glassy matrix, and occur at random, which is entirely different to the 1300 °C sample.
The densely distributed occurrence of the Fe-Cr droplets around PAC in the 1300 °C sample, even though they are much smaller in size, suggests that the sample has favourable conditions for Fe-Cr alloy formation. At a higher temperature (1500 °C), the more sparsely distributed, though larger, alloys may be linked to the increased collapse of pore networks due to melting (and dissolution of original silicates; Table 6 and Figure 7), which may result in the formation of fewer alloys and a lower degree of metallization (as observed in Figure 5 and Table 4). This is supported by the determined DOM above. In addition, at 1500 °C, Fe-Cr alloy occurrence is observed within PACs, and these occur as internal micro-crack infill in most PAC grains. Mineralogically, the average elemental composition data in Table 5 suggest that the phases identified in both samples are variable due to the different conditions under which they were treated.
3.3. Non-Isothermal Pre-Reduction
3.3.1. Mass Loss Calculation for Non-Isothermal Pre-Reduction
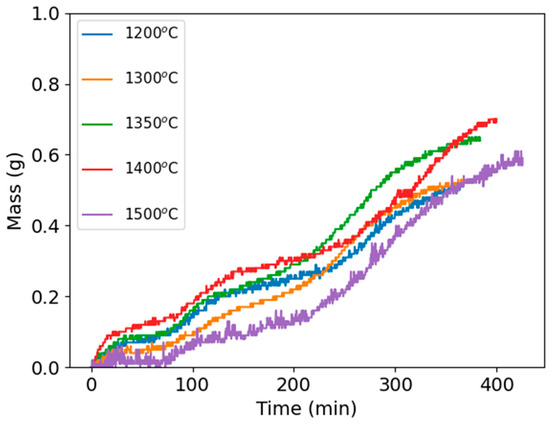
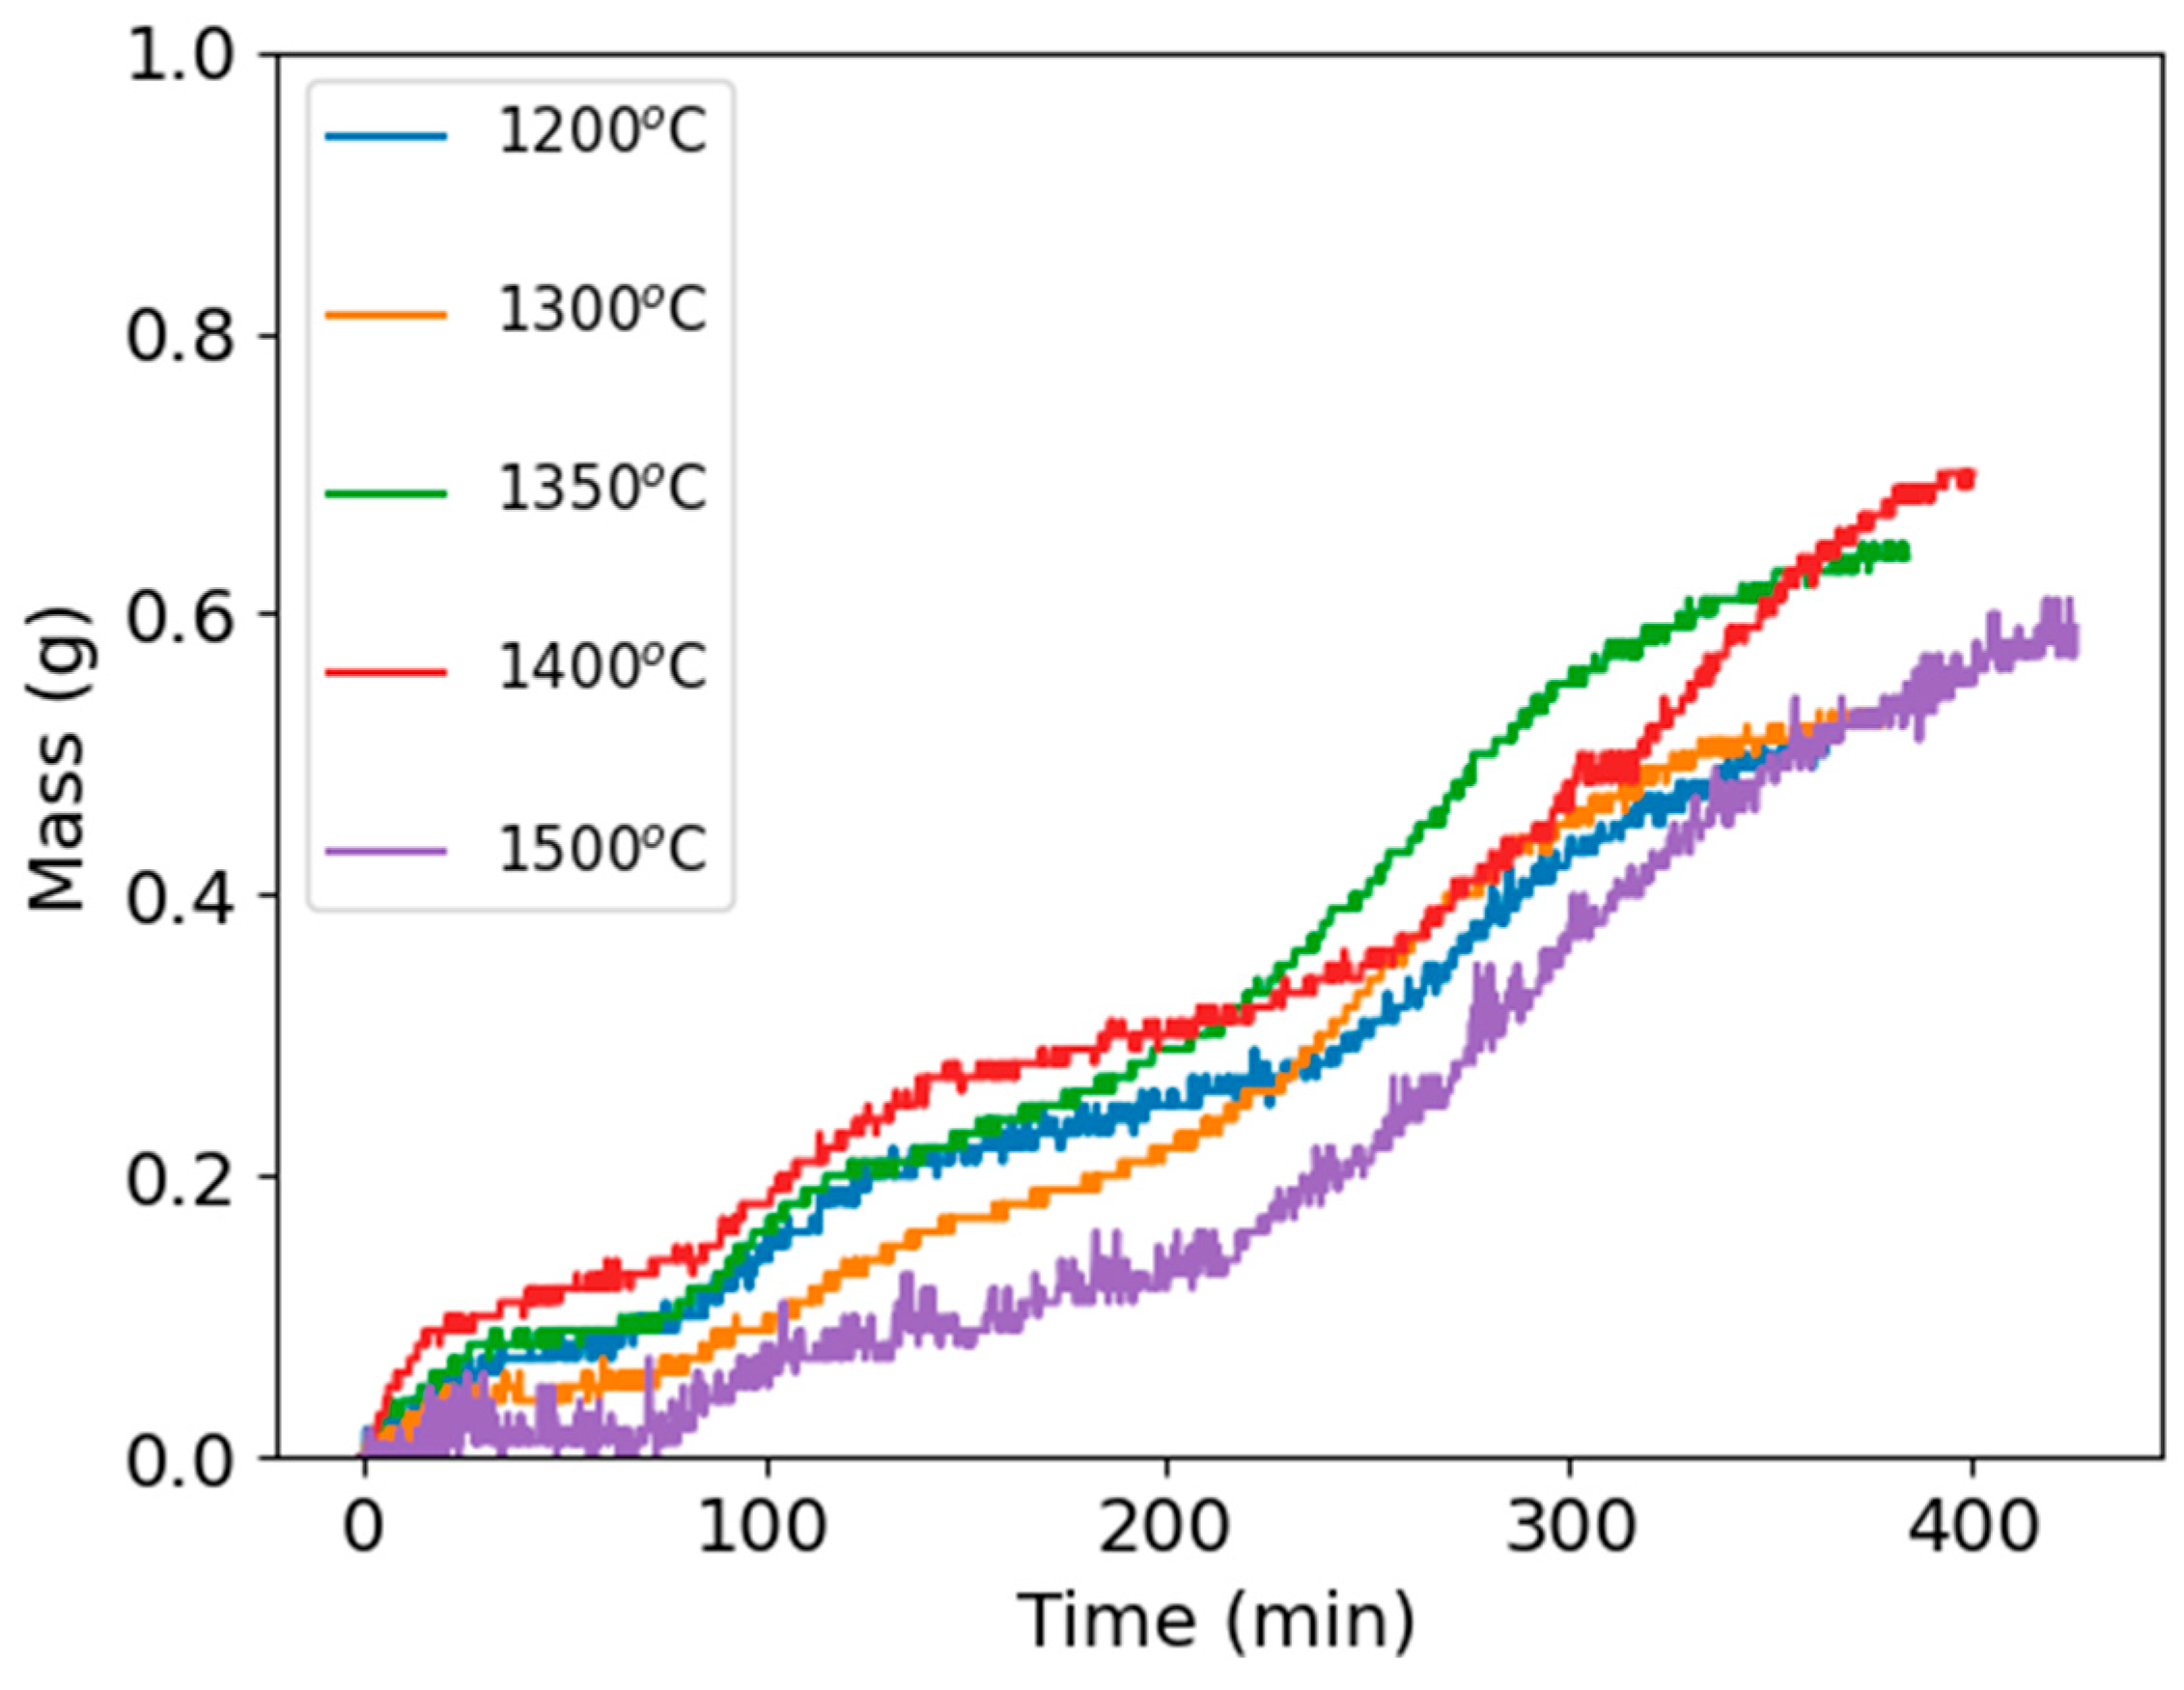
Figure 8 shows mass of oxygen removed from the sample for non-isothermal pre-reduction at various temperatures. At low temperatures, curves depicting mass of oxygen removed show flatter profiles, and upon reaching higher temperatures, the mass removed curves display a sharp increase due to high oxygen removal from reduction reactions. Thus, higher temperatures reduce the effects of kinetic limitations as observed by higher and faster oxygen removal at higher temperatures. Initially, oxygen removal is higher at the beginning of the regions of higher temperatures, and the mass removed curves reach a plateau-type shape as more dense phases are formed. Dense phases like Fe layers hinder the diffusion of H2 to the reaction sites. Like isothermal pre-reduction experiments, mass of oxygen removed increases with temperature until 1400 °C and decreases at 1500 °C, and this is attributed to sintering.
Figure 8.
Mass of oxygen removed for non-isothermal pre-reduction at various temperatures (1200 °C to 1500 °C).
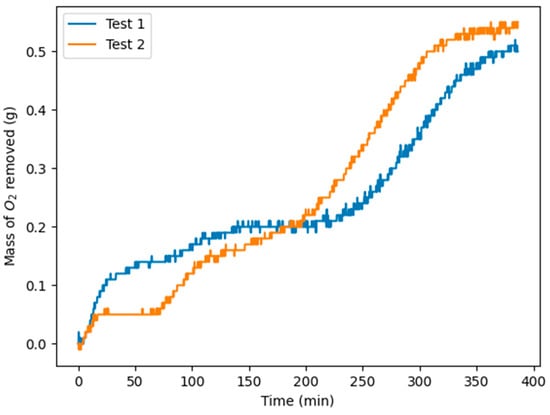
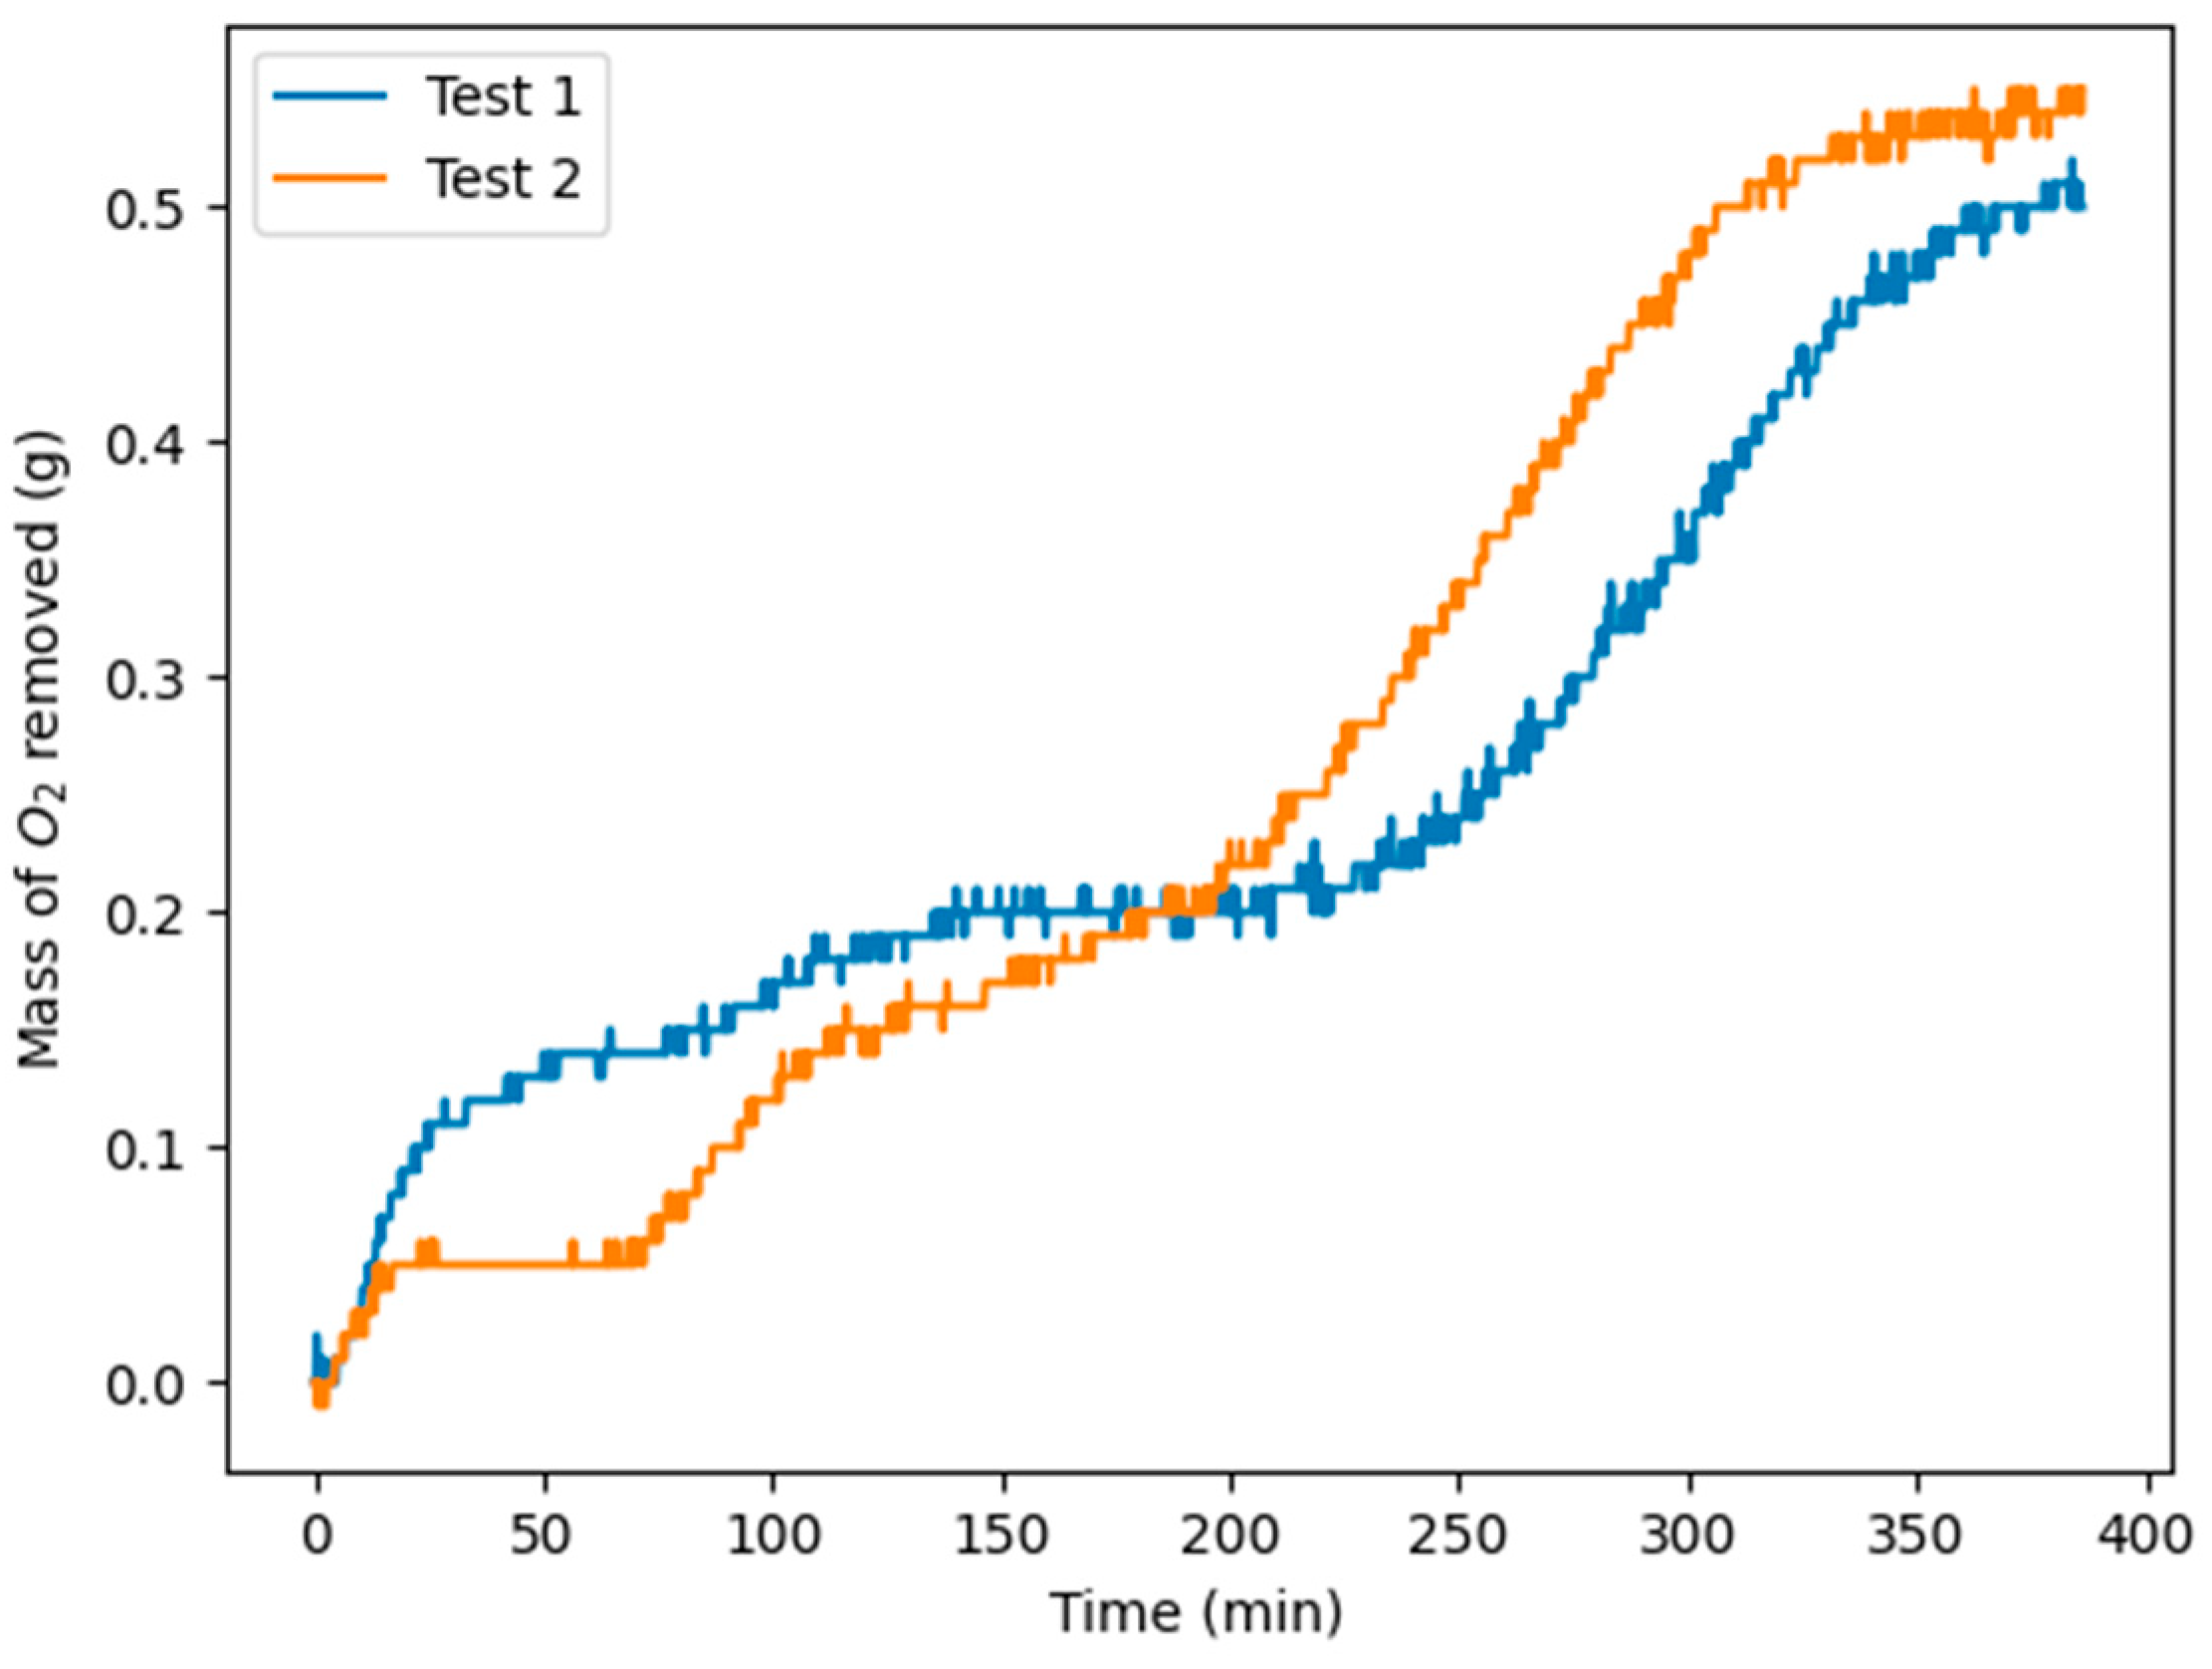
Two non-isothermal pre-reduction experiments were conducted at 1400 °C to determine the repeatability of non-isothermal tests. The results in Figure 9 indicate that the mass of oxygen removed profiles from the two tests are similar with a maximum error of 9% and an error reducing to 0.9% at the end of the pre-reduction experiments. The two curves depict two controlling regimes, namely kinetic-controlled reaction rates and diffusion-controlled reaction rates. At the beginning, mass removed is attributed to surface moisture and is represented by a sharp slope. Thereafter, the flat slope represents O2 removal from the reduction reaction. At these lower temperatures, rates are controlled by kinetics, and with a further increase in temperature, the system enters a diffusion-controlled regime as evidenced by a steep slope indicating faster O2 removal.
Figure 9.
Mass of oxygen removed for non-isothermal pre-reduction at 1400 °C.
3.3.2. Degree of Metallization for Non-Isothermal Pre-Reduction
The results in Table 7 show that the DOM increased with increasing temperature. DOM at 1500 °C is lower than DOM at 1350 °C and 1400 °C, and this could be due to sintering that reduced intra-pellet porosity, resulting in diffusion limitations. The DOM results agree with the mass loss data in Figure 8, where the highest mass loss was recorded at 1400 °C.
Table 7.
Fe degree of metallization results for non-isothermal pre-reduction at various temperatures.
3.3.3. Mineralogy of Non-Isothermal Pre-Reduced Products (1300 °C vs. 1500 °C)
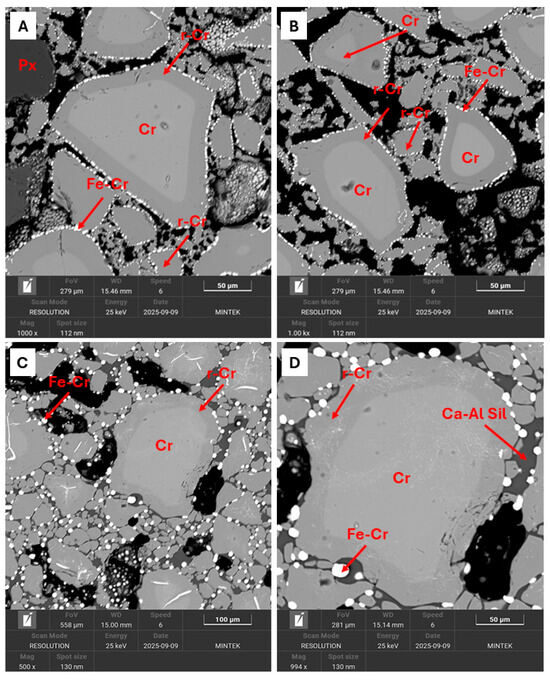
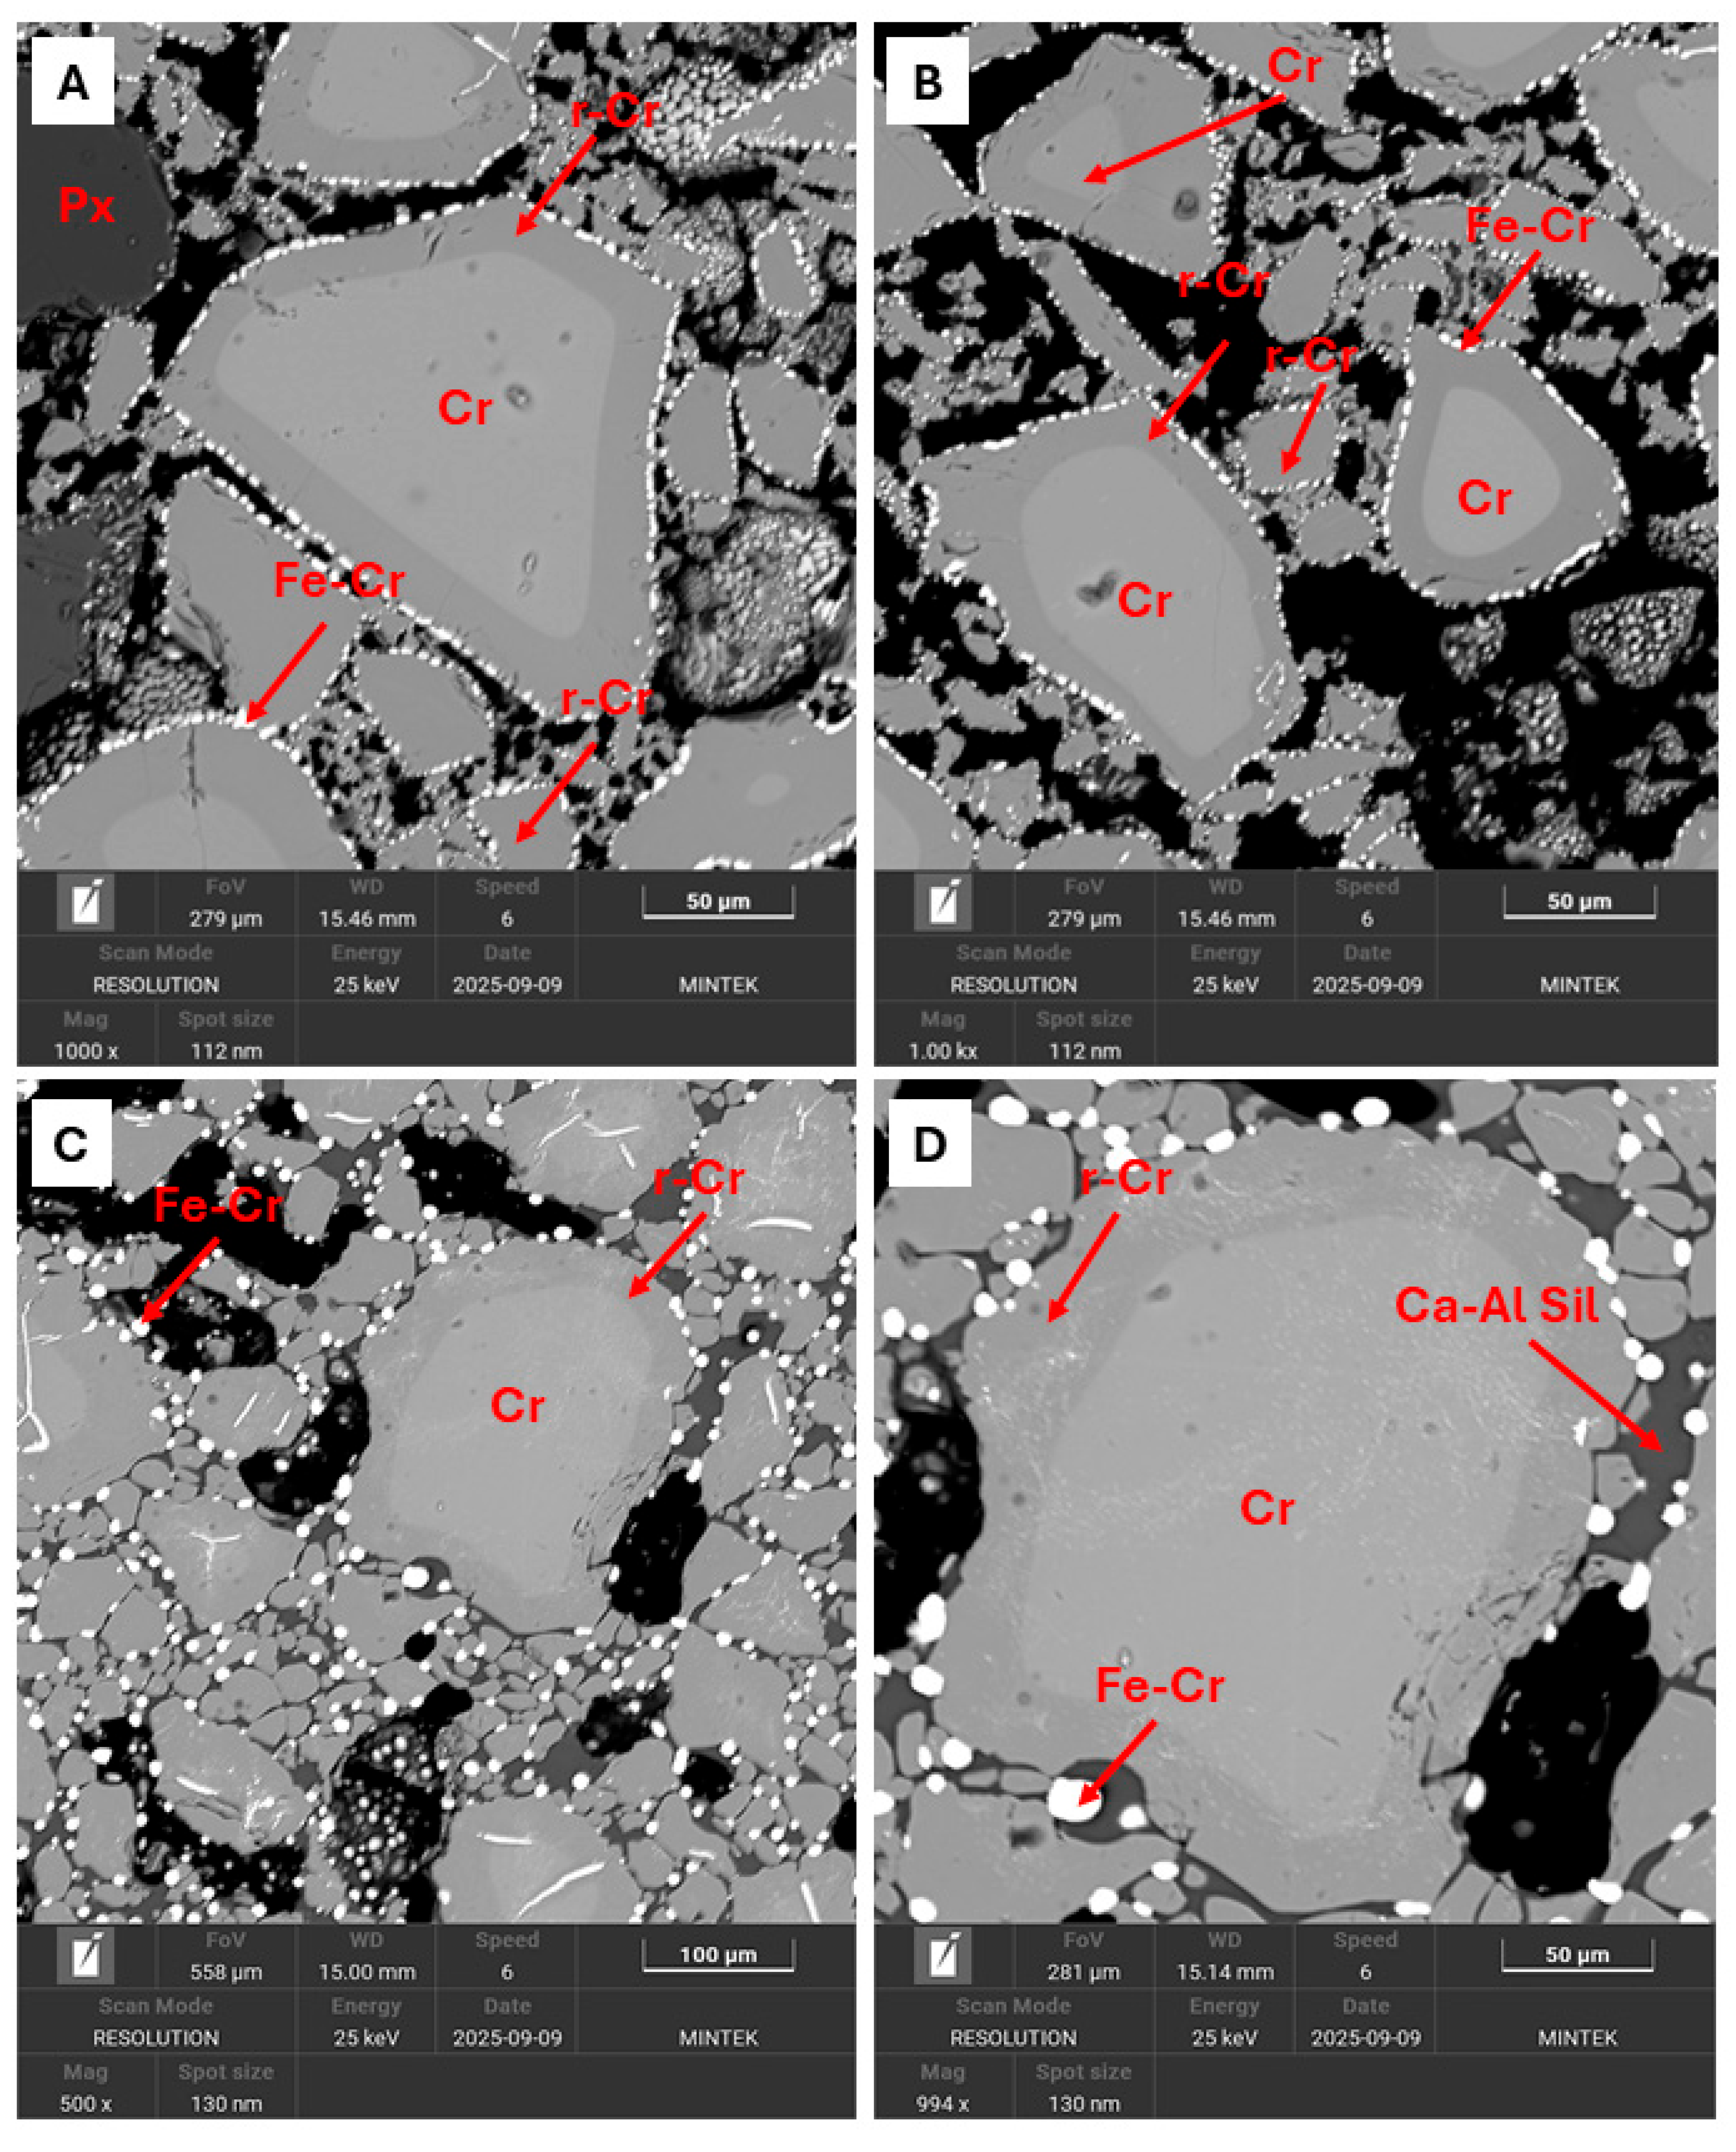
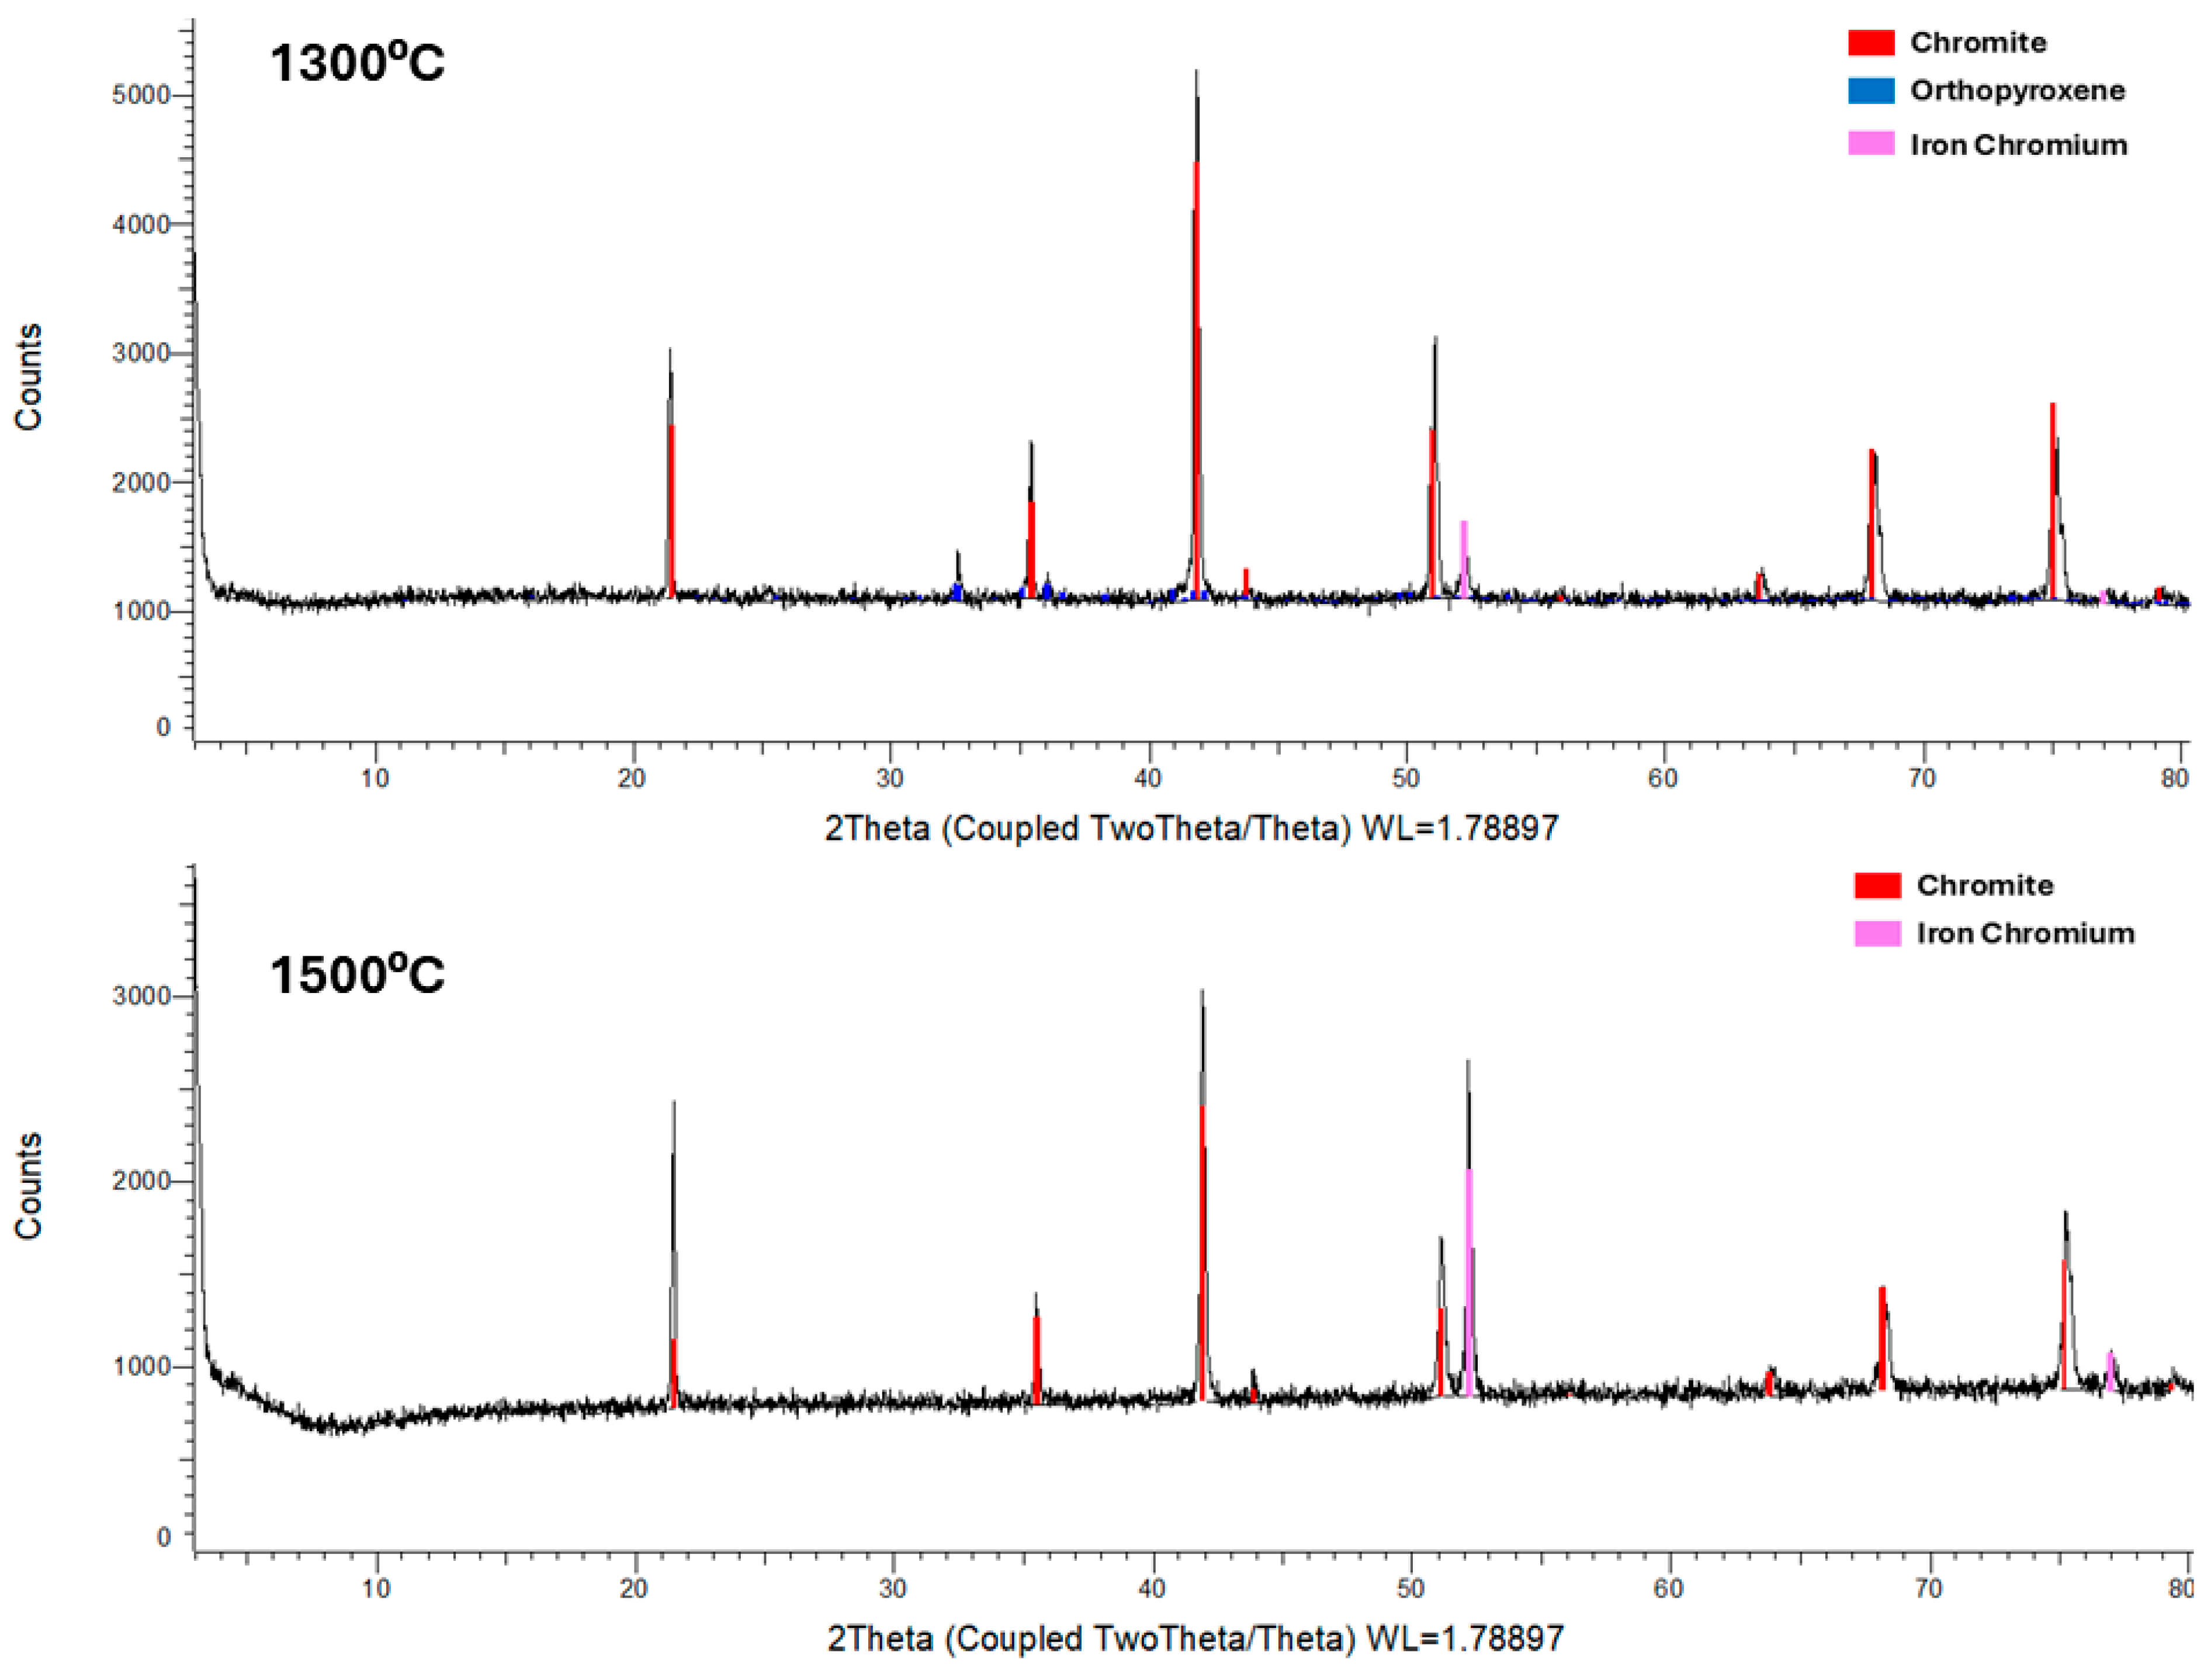
At 1300 °C, the SEM analysis of the non-isothermally treated sample reveals that the chromite has been successfully pre-reduced, as indicated by the presence of Fe-Cr alloy and PACs (Table 8). Where the chromite phases altered to a PAC, the zones are clearly distinct and are characterized by dense Fe-Cr rims that are consistent throughout the sample (Figure 10A,B), with a minor occurrence of intra-grain alloys. In addition, the samples appear to be porous, and the silicate chemistry in the samples appears to be still intact owing to the temperature conditions. At 1500 °C, the sample exhibits textures consistent with those observed at higher temperatures, characterized by the presence of larger Cr-Fe alloys along the rims. This is further shown by the presence of a glassy matrix phase that binds the particles together, which has inherently led to the sample being less porous. The glassy calcium aluminum silicate matrix could have formed because of the higher temperatures, which resulted in the melting of the silicates and bentonite binder used during the pre-reduction stage (Table 9 and Figure 11). In addition, the Fe-Cr alloy occurrence observed in these samples appears to be much lower than that in the 1300 °C sample, and this may be due to the reasons stated in Section 3.2.3, again noting that the Fe-Cr droplets are much coarser in the 1500 °C sample than in the 1300 °C sample. Other textural variations observed only in the 1500 °C sample include the occurrence of Fe-Cr infilling micro-cracks and isolated (needle-like) metallic particles within and outside the chromite grains (Figure 10C,D).
Table 8.
Average elemental compositions of key phases found in non-isothermally (1300 °C and 1500 °C) treated samples identified during the SEM analysis.
Figure 10.
Backscattered electron (BSE) images of pre-reduced chromite concentrate samples under non-isothermal conditions at 1300 °C (A,B) and 1500 °C (C,D). (A,B) Pre-reduced chromites with a pronounced PAC texture and denser chrome alloy distribution observed along the rims of the PACs/pre-reduced chromites. (C,D) PAC in chromite, also entirely replacing the original chromite. Porosity is further reduced by extensive silicate melting and sintering. Fe-Cr occurs as rounded interstitial droplets but also as needle-like exsolutions/crack infill in the centres of the PAC grains and along the rims. Cr—chromite, Fe-Cr—iron chromium alloy, Ca-Al Sil—calcium aluminum silicate, r-Cr—reduced chromite (PAC), Cr—chromite, and Px—pyroxene.
Table 9.
Relative abundances of the pre-reduced chromite of the non-isothermally (1300 °C and 1500 °C) treated samples.
Figure 11.
XRD diffractograms for the non-isothermally treated samples at 1300 °C and 1500 °C.
3.4. Kinetic Parameters Determination
The kinetic data evaluation of thermogravimetric analysis (TGA) results from isothermal and non-isothermal experiments was performed by isoconversional methods, and Equations (3) and (4) describe this. In Equation (3), α is conversion, is the heating rate, and g(α) is a model function that reveals the reaction kinetics mechanism. These methods are referred to as model-free since no assumptions are made regarding the mechanisms of the reactions [23]. In Equation (4), A(α), g(α), and E(α) are empirical functions, where A(α) is the pre-exponential factor and E(α) is activation energy. The criterion for the independence of kinetic parameters on heating rate suggested by [24] was used to evaluate non-isothermal kinetic parameters.
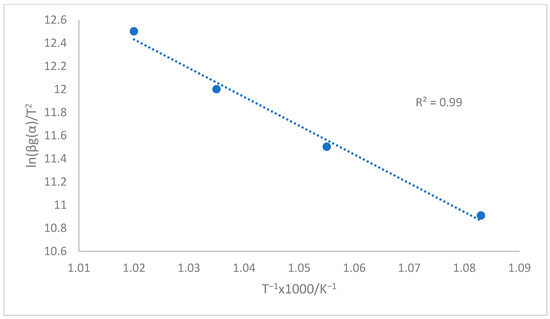
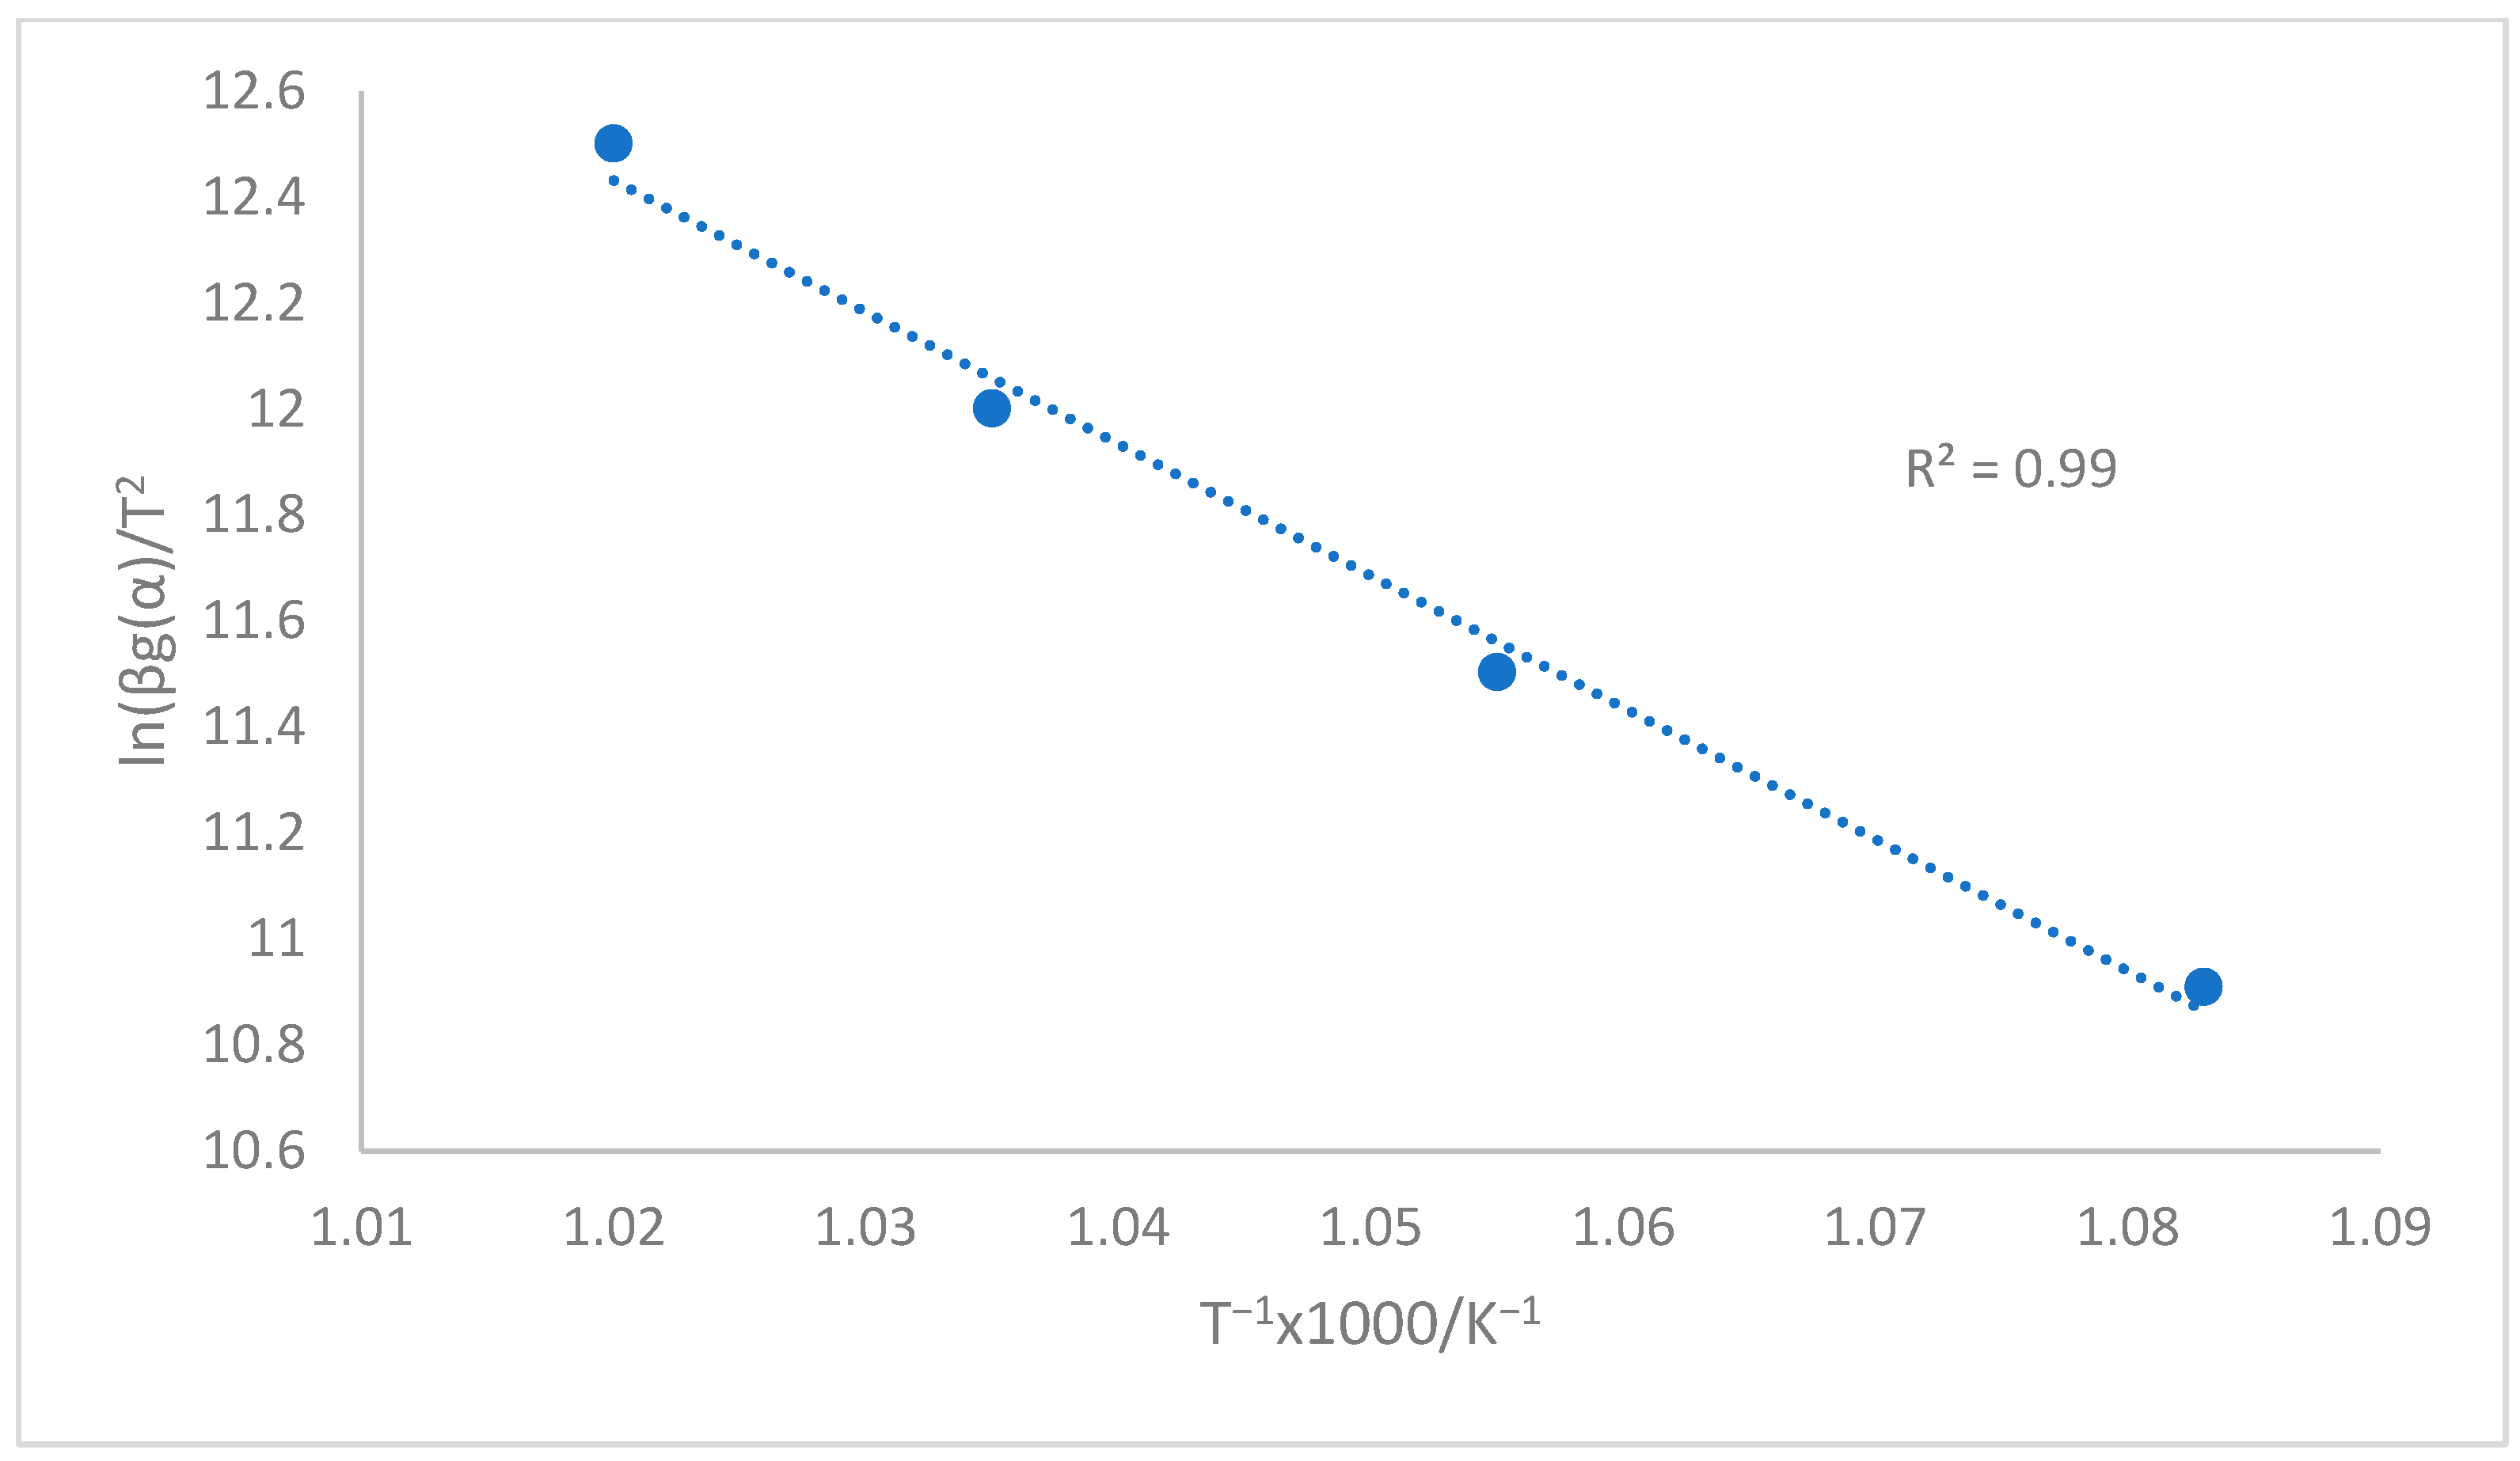
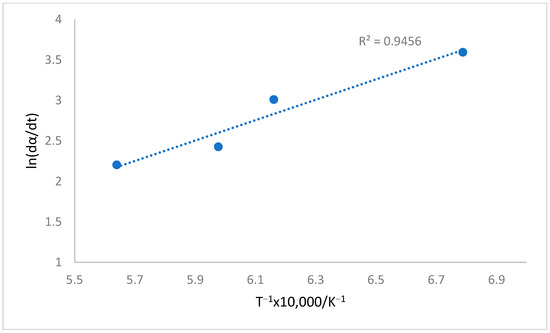
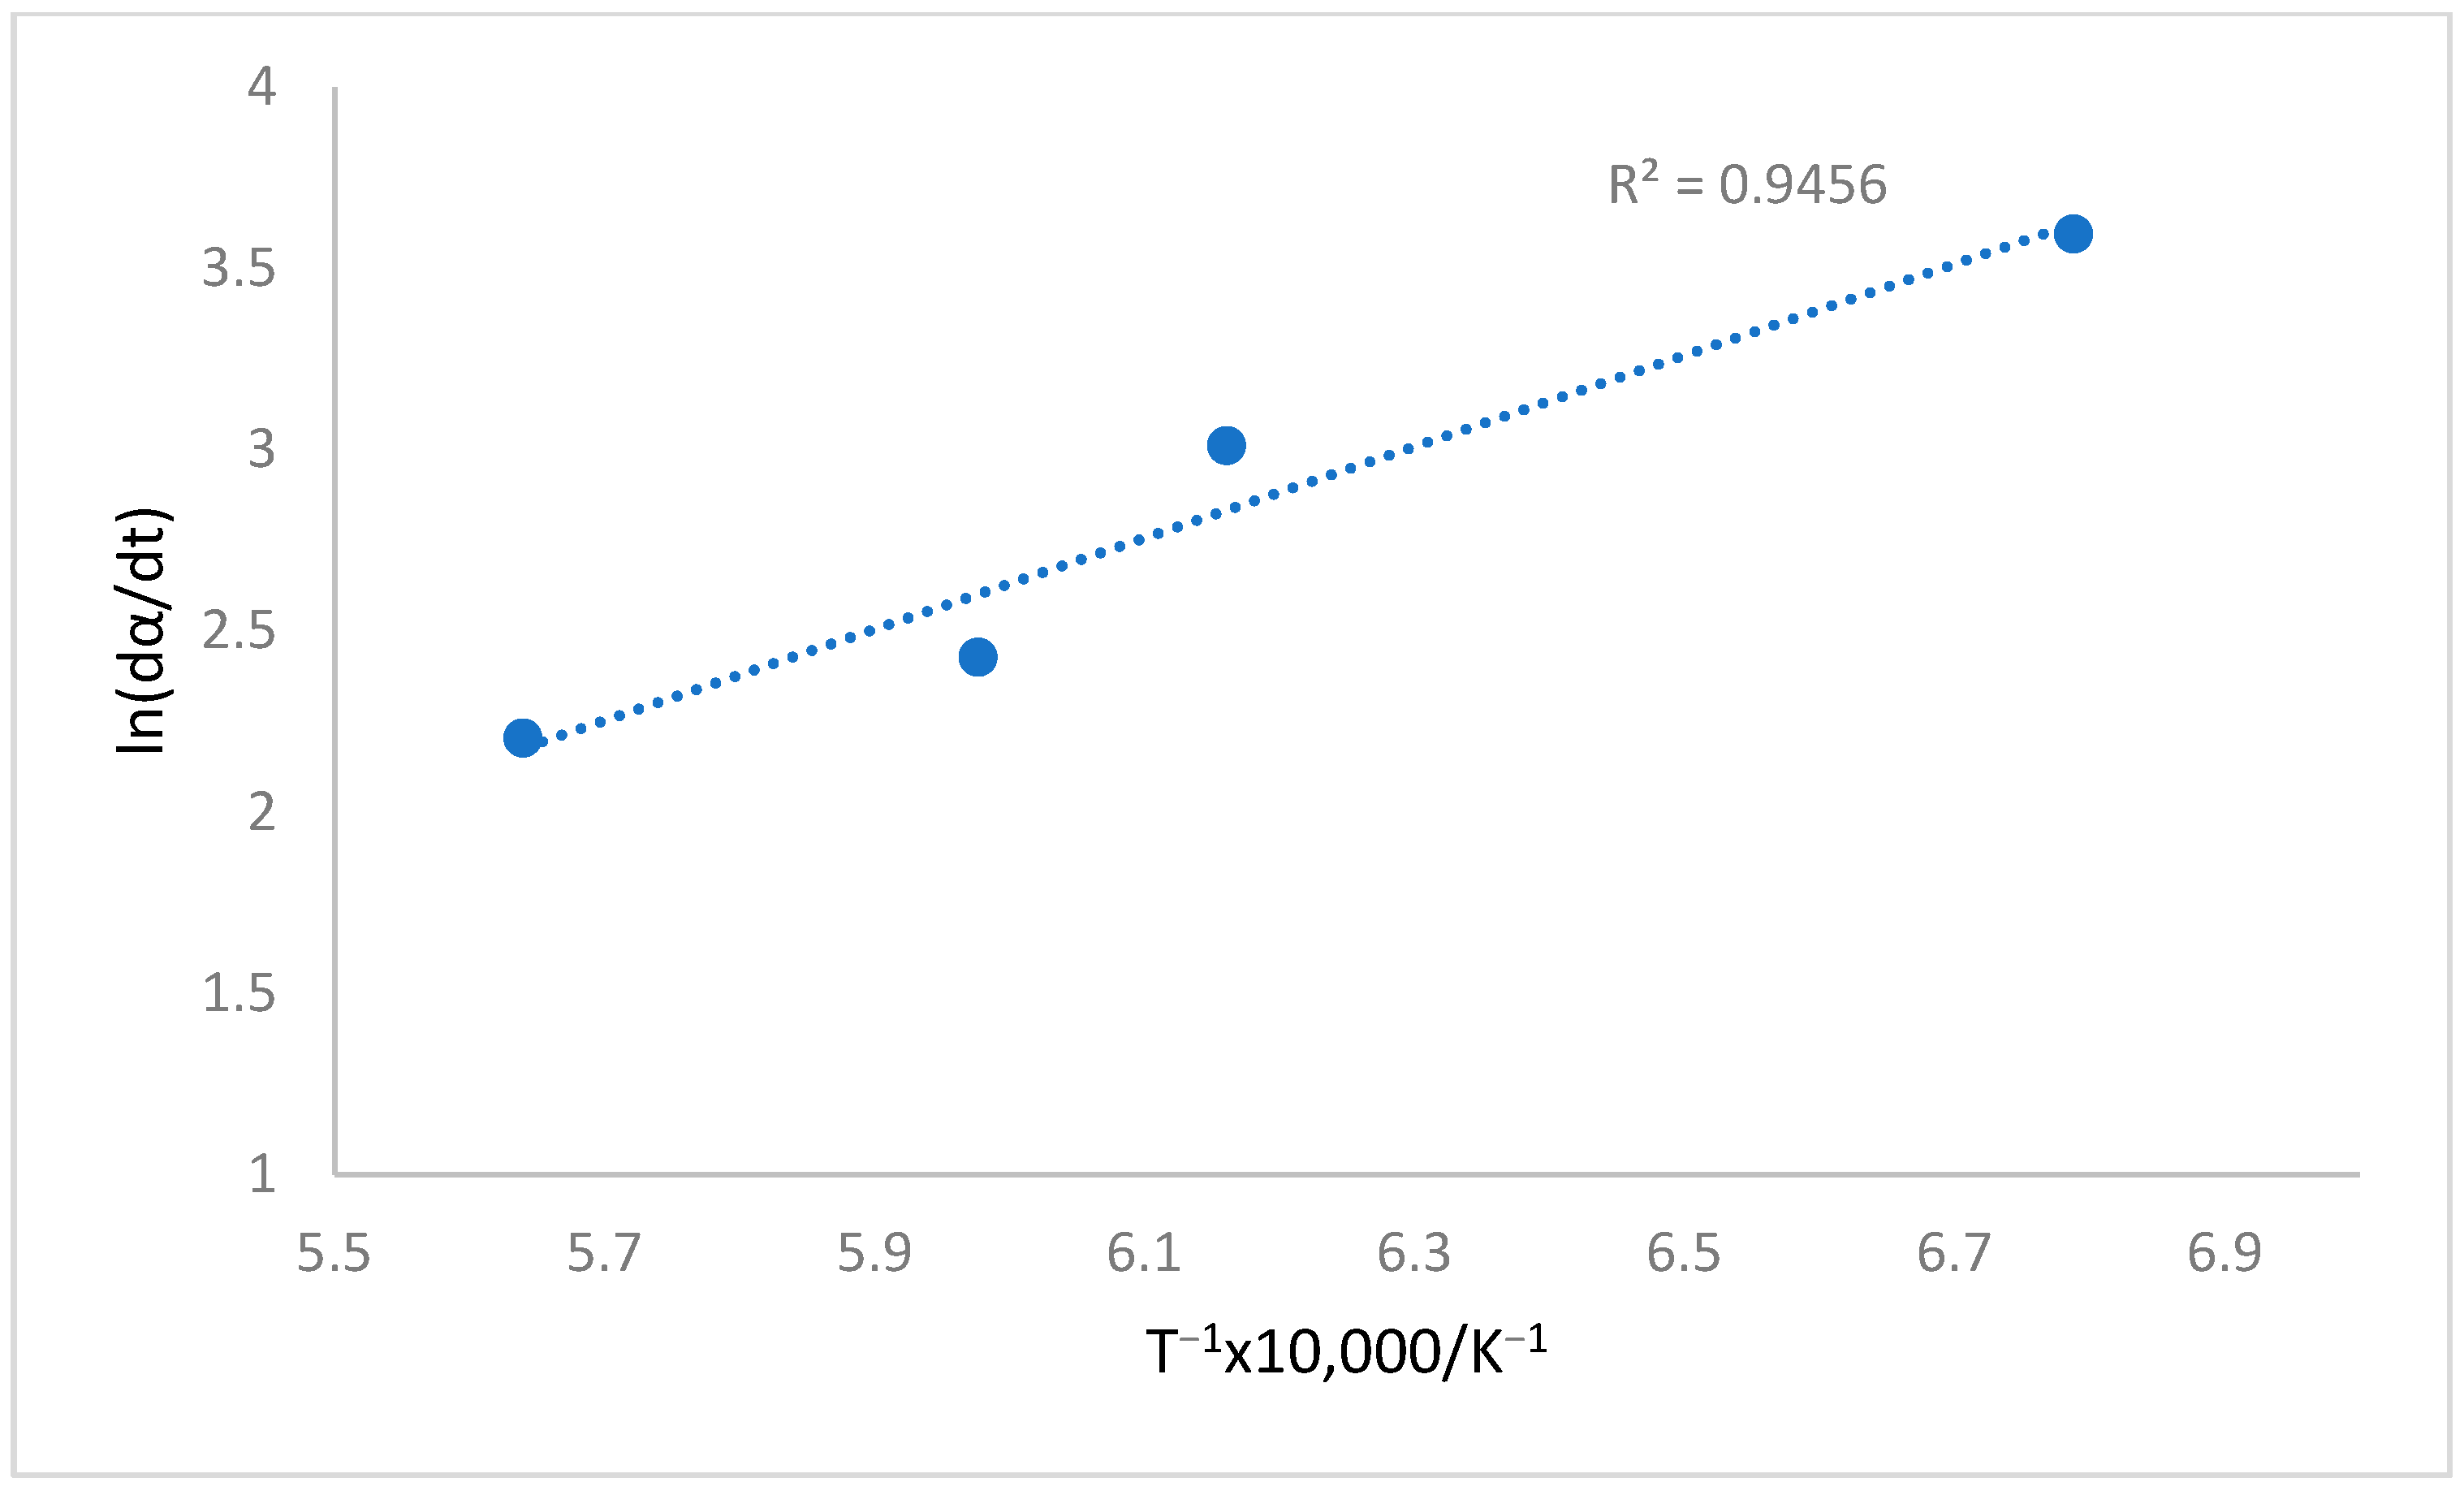
The current work concerns isothermal and non-isothermal reduction, and the mass loss data from the TGA was used for the determination of kinetic data for the pre-reduction of chromite pellets with H2. The determined kinetic data constitute activation energy and pre-exponential factor, and these data will be crucial for determining the reaction rates. For non-isothermal kinetic parameter determination, Equation (3) was used to calculate activation energy and pre-exponential factor by fitting the equation to the mass loss data. The kinetic parameters for isothermal pre-reduction were determined from Equation (4). A plot of ln(g()/T2) vs. 1/T was drawn as shown in Figure 12 and Figure 13. Activation energy was found from the slope of the straight line and the pre-exponential factor from the intercept, and the results are presented in Table 10.
Figure 12.
Determination of kinetic data for non-isothermal pre-reduction at 1400 °C.
Figure 13.
Determination of kinetic data for isothermal pre-reduction.
Table 10.
Kinetic data determined from mass loss data for isothermal and non-isothermal pre-reduction at 1400 °C.
Apparent activation energy was obtained from the slope of the line, which was obtained from the plot of the kinetic data for pre-reduction at isothermal (1200 °C to 1500 °C) and non-isothermal pre-reduction at 1400 °C; this is presented in Table 10, and the results from fitting of Equations (3) and (4) to the TGA mass loss data are shown in Figure 12 and Figure 13. The method used to determine kinetic parameters does not allow for isolation of elementary reactions and provides a global measure of reaction rates. This is the same case with methods like differential scanning calorimetry (DSC) [25]. Therefore, the experimentally determined activation energy and pre-exponential factor in Table 10 are interpreted as effective values.
The results indicate that the kinetic parameters determined from isothermal and non-isothermal pre-reduction do not agree closely as observed in Table 10. The observed difference could be because for non-isothermal cases; fitting data is more prone to errors at high temperatures due to rapid changes in reaction rates and the sensitivity of rate constants. Several studies reported inconsistent values between isothermally and non-isothermally determined kinetic parameters [26,27]. The isothermal and non-isothermal experiments are conducted in different temperature regions, while solid-state processes reveal multi-step kinetics that are influenced by temperature, and this results in an inconsistency in kinetic parameter values [25].
4. Discussions
Comparison between isothermal and non-isothermal pre-reduction at 1300 °C is shown in Table 11. The apparent activation energy from isothermal experiments was found to be lower than activation from non-isothermal experiments. In isothermal experiments, the effect of heat transfer limitations is isolated as thermal equilibrium is reached by the time pre-reduction starts, whereas thermal gradients exist in the non-isothermal pre-reduction, resulting in heat transfer limitations and higher apparent activation energy. Although non-isothermal experiments had higher activation energy, the introduction of H2 to the charge from the warm-up stage resulted in longer reduction time and a higher degree of metallization when compared to isothermal reduction. To optimize the degree of metallization, more studies are required to understand the mechanisms of chromite pre-reduction with H2.
Table 11.
Comparisons between isothermal and non-isothermal pre-reduction (1300 °C).
Mineralogically, the isothermally treated samples display a Fe-Cr alloy occurrence along the rim that is sparsely distributed when compared to the non-isothermally treated sample, in which they are densely distributed at 1300 °C. This variation is only observed under this temperature. At 1500 °C, note that Fe-Cr occurrence appears to occur at random for the isothermally treated sample, compared to the non-isothermally treated sample, in which the rim occurrence is still preserved. These observations are in support of the DOM, which shows higher metallization in non-isothermal products at both temperatures. While these are notable differences, the samples tend to display similar behaviour in terms of other textures observed in both samples. At 1300 °C, both samples display well-developed PACs, and texturally, they are porous and contain some silicates, whereas at 1500 °C the samples are less porous with an occurrence of glassy phase that binds/connects the PACs in the sample. At this temperature, Fe-Cr within PAC is observed, and this could likely be an exsolution/crack infill, as well as fine mosaic-like infill patterns. The presence of these internal microstructures in Fe-Cr samples at 1500 °C suggests that the sample has been successfully pre-reduced, and the internal microstructure could be associated with the collapsed pore networks within each sample through which trapped gases and the build-up of pressure trigger their formation. In terms of the occurrence of PACs, those under isothermal conditions are poorly defined, whereas those under non-isothermal conditions are well-defined. This variation between the PACs is expected because the stepwise increase under isothermal conditions allows for staged reactions and gradual densification to occur, which leads to their well-defined nature. On the other hand, the continuous reduction under isothermal conditions may lead to interdiffusion, which may result in blurred phase boundaries, especially within the PACs.
The results from the current study agree with the findings of [20], who reported that the degree of Fe metallization increases with temperature and reduction duration. Using pure H2 for isothermal pre-reduction of chromite ore at 1300 °C and 3 h, these authors reported Fe metallization of 86.2%; in the current study, at 2 h reduction time, Fe metallization was found to be 78.1% at 1350 °C and 86.2% at 1400 °C. Furthermore, these authors reported similar mineralogical observations, with the exception of the texture variations between isothermal and non-isothermal conditions. While this publication has reported similar findings, it still lacks the fundamental variations of SEM observation from an isothermal and non-isothermal perspective with regard to textures at different temperatures. The mineralogical observations made here are also consistent with the findings made by [28] in which similar PACs development is observed together with the occurrence of Fer-Cr alloys along the rims.
Compared to the results from the current study, some authors found Fe metallization of 88.4% for pre-reduction of chromite with H2 at a lower temperature of 1000 °C [19]. Their reduction experiments were conducted on chromite ore (d90 of 133 to 778 µm), and the smaller particle size eliminated the heat and mass transfer limitations, hence higher Fe metallization at lower temperatures and shorter reduction duration (1 h).
5. Conclusions
- The isothermal and non-isothermal pre-reduction experiments showed that longer reduction times are required to achieve higher degrees of reduction.
- The mass loss data revealed that the reaction rates increased with an increase in temperature, indicating that higher temperatures overcome kinetic barriers that manifest at lower temperatures. However, at 1500 °C the degree of reduction decreased, and this could be attributed to early sintering.
- Mineralogical characterization of samples pre-reduced isothermally and non-isothermally at 1300 °C and 1500 °C suggests that the metallization was greatest at 1300 °C, under each condition, where metallization is defined by densely distributed droplets along PAC rims, observations that support the DOM data (with the exception of non-isothermal DOM at 1300 °C). Furthermore, the isothermally treated sample at 1300 °C and non-isothermally treated sample at 1500 °C appear to have yielded higher Fe-Cr abundances.
- The activation energy determined from isothermal and non-isothermal pre-reduction tests showed some differences, with the non-isothermally determined activation energy found to be higher. To allow for the determination of intrinsic kinetic data in both isothermal and non-isothermal pre-reduction experiments, future studies will consider smaller particle sizes to isolate the effects of heat and mass transfer limitations.
Author Contributions
Conceptualization, M.I.K. and B.M.V.B.; Methodology, M.I.K., B.M.V.B. and D.C.; formal analysis, M.I.K., B.M.V.B. and D.C.; investigation, M.I.K. and B.M.V.B.; data curation, M.I.K. and B.M.V.B.; writing—original draft preparation, M.I.K. and B.M.V.B.; writing—review and editing, M.I.K., B.M.V.B., Q.G.R., B.S.X. and D.C.; supervision, Q.G.R. and D.C.; visualization, Q.G.R., D.C. and B.S.X.; project administration, M.I.K. All authors have read and agreed to the published version of the manuscript.
Funding
The authors are grateful to Mintek for financial support under the project PDR-260010.
Data Availability Statement
The data that support the findings of the current study are available from the corresponding author upon request.
Acknowledgments
This paper is published with the permission of Mintek. The authors are grateful to Markus Erwee from Samancor Chrome Ltd. for providing chromite concentrate for the test work.
Conflicts of Interest
The authors declare no conflicts of interest. Authors Mopeli Ishmael Khama, Beberto Myth Vunene Baloyi, Quinn Gareth Reynolds, Buhle Sinaye Xakalashe and Quinn G. Reynolds were employed by the company MINTEK. The authors declare that the research was conducted in the absence of any commercial or financial relationships that could be construed as a potential conflict of interest.
Abbreviations
The following abbreviations are used in this manuscript:
| DOM | Degree of metallization |
| PAC | Partially altered chromite |
| TGA | Thermogravimetric analysis |
| XRD | X-ray diffraction |
| SEM | Scanning electron microscopy |
| EDS | Energy dispersive spectrometry |
| ICP-OES | Coupled Plasma Optical Emission Spectroscopy |
References
- Riekkola-Vanhanen, M. Finnish Expert Report on Best Available Techniques in Ferrochromium Production; Finnish Environment Institute: Helsinki, Finland, 1999. [Google Scholar]
- Niemelä, P.; Kauppi, M. Production, characteristics and use of ferrochromium slag. In Proceedings of the INFACON XI, New Delhi, India, 18–21 February 2007; pp. 71–179. [Google Scholar]
- Yang, Y.; Xiao, Y.; Reuter, M.A. Analysis of Transport Phenomena in Submerged Arc Furnace for Ferrochrome Production. In Proceedings of the Tenth International Ferroalloys Congress, Cape Town, South Africa, 1–4 February 2004; pp. 15–25. [Google Scholar]
- Eric, R.H. Production of Ferroalloys. In Treatise on Process Metallurgy; Elsevier: Amsterdam, The Netherlands, 2014; pp. 477–532. [Google Scholar] [CrossRef] [Scilit]
- du Preez, S.P.; van Kaam, T.P.M.; Ringdalen, E.; Tangstad, M.; Morita, K.; Bessarabov, D.G.; van Zyl, P.G.; Beukes, J.P. An Overview of Currently Applied Ferrochrome Production Processes and Their Waste Management Practices. Minerals 2023, 13, 809. [Google Scholar] [CrossRef] [Scilit]
- Downing, J.H.; Deeley, P.D.; Fichte, R. Chromium and Chromium Alloys. In Ullmann’s Encyclopedia of Industrial Chemistry; Wiley: Hoboken, NJ, USA, 2000. [Google Scholar] [CrossRef] [Scilit]
- Wei, W.; Samuelsson, P.B.; Jönsson, P.G.; Gyllenram, R.; Glaser, B. Energy Consumption and Greenhouse Gas Emissions of High-Carbon Ferrochrome Production. JOM 2023, 75, 1206–1220. [Google Scholar] [CrossRef] [Scilit]
- Della Rocca, A. A perspective on the decarbonization of the metals industry. Appl. Energy Combust. Sci. 2025, 21, 100312. [Google Scholar] [CrossRef] [Scilit]
- Ringdalen, E.; Rocha, M.; Figueiredo, P. Energy consumption during HCFeCr-production at Ferbasa. In Proceedings of the The Fourteenth International Ferroalloys Congress, Kiev, Ukraine, 31 May–4 June 2015; pp. 668–675. [Google Scholar]
- Kumar, P.; Patra, S.K.; Tripathy, S.K.; Sahu, N. Efficient utilization of nickel rich Chromite Ore Processing Tailings by carbothermic smelting. J. Clean. Prod. 2021, 315, 128046. [Google Scholar] [CrossRef] [Scilit]
- Jones, R.T.; Erwee, M.W. Simulation of ferro-alloy smelting in DC arc furnaces using Pyrosim and FactSage. Calphad 2016, 55, 20–25. [Google Scholar] [CrossRef] [Scilit]
- Beukes, J.P.; Dawson, N.F.; Van Zyl, P.G. Theoretical and practical aspects of Cr(VI) in the Southern African ferrochrome. J. S. Afr. Inst. Min. Metall. 2010, 110, 743–750. [Google Scholar]
- Hamuyuni, J.; Johto, H.; Bunjaku, A.; Vatanen, S.; Pajula, T.; Mäkelä, P.; Lindgren, M. Simulation-based life cycle assessment of ferrochrome smelting technologies to determine environmental impacts. J. Clean. Prod. 2021, 295, 126503. [Google Scholar] [CrossRef] [Scilit]
- Sommerfeld, M.; Friedrich, B. Replacing fossil carbon in the production of ferroalloys with a focus on bio-based carbon: A review. Minerals 2021, 11, 1286. [Google Scholar] [CrossRef] [Scilit]
- Tathavadkar, V.D.; Antony, M.; Jha, A. The Physical Chemistry of Thermal Decomposition of South African Chromite Minerals. Metall. Mater. Trans. B 2005, 36, 75–84. [Google Scholar] [CrossRef] [Scilit]
- Dawson, N.F.; Edwardst, R.I. Factors Affecting the Reduction Rate of Chromite. In Proceedings of the 4th International Ferro-Alloys Congress (INFACON), Rio de Janeiro, Brazil, 31 August–3 September 1986; pp. 105–113. [Google Scholar]
- McCullough, S.; Hockaday, S.; Johnson, C.; Barcza, N.A. Pre-Reduction and Smelting Characteristics of Kazakstan Ore Samples. In Proceedings of the Twelfth International Ferroalloys Congress, Helsinki, Finland, 6–9 June 2010; pp. 249–262. [Google Scholar]
- Arvanitidis, A.; Artin, C.; Claeson, P.; Jacobsson, H.; Johansson, P.; Rassmus, J.; Swartling, D. Study of the kinetics of chromate reduction by hydrogen. Scand. J. Metall. 1996, 25, 141–147. [Google Scholar]
- Davies, J.; Tangstad, M.; Ringdalen, E.; Beukes, J.P.; Bessarabov, D.; Preez, S.P.D. The Effect of Pre-Oxidation on the Reducibility of Chromite Using Hydrogen: A Preliminary Study. Minerals 2022, 12, 911. [Google Scholar] [CrossRef] [Scilit]
- Wu, S.; Zhang, Y.; Li, H.; Zhang, S.; Kasai, E.; Wang, C. Hydrogen-based pre-reduction of chromite: Reduction and consolidation mechanisms. Int. J. Hydrogen Energy 2024, 50, 397–410. [Google Scholar] [CrossRef] [Scilit]
- Chuang, H.-C.; Hwang, W.-S.; Liu, S.-H. Effects of basicity and FeO content on the softening and melting temperatures of the CaO-SiO2-MgO-Al2O3 slag system. Mater. Trans. 2009, 50, 1448–1456. [Google Scholar] [CrossRef] [Scilit]
- Ramachandran, P.A.; Smith, J.M. Effect of Sintering and Porosity Changes on Rates of Gas-Solid Reactions. Chem. Eng. J. 1977, 14, 137–146. [Google Scholar] [CrossRef] [Scilit]
- Várhegyi, G.; Wang, L.; Skreiberg, Ø. Non-isothermal kinetics: Best-fitting empirical models instead of model-free methods. J. Therm. Anal. Calorim. 2020, 142, 1043–1054. [Google Scholar] [CrossRef] [Scilit]
- Pérez-Maqueda, L.A.; Criado, J.M.; Gotor, F.J.; Málek, J. Advantages of combined kinetic analysis of experimental data obtained under any heating profile. J. Phys. Chem. A 2002, 106, 2862–2868. [Google Scholar] [CrossRef] [Scilit]
- Vyazovkin, S.; Wight, C.A. Isothermal and non-isothermal kinetics of thermally stimulated reactions of solids. Int. Rev. Phys. Chem. 1998, 17, 407–433. [Google Scholar] [CrossRef] [Scilit]
- Mccarty, M.; Maycock, J.N.; Verneker, V.R.P. Thermal Decomposition of LiAIH4. J. Phys. Chem. 1968, 72, 4009–4014. [Google Scholar] [CrossRef] [Scilit]
- Maycock, J.N. Thermal Analysis of Explosives and Solid Propellant Ingredients. Thermochim. Acta 1970, 1, 389–407. [Google Scholar] [CrossRef] [Scilit]
- Ernst, M.S.; Tangstad, M.; Beukes, J.P.; Ringdalen, E.; Preez, S.P.D. The effect of hydrogen pre-reduction on the carbon-reducibility of pelletised UG2 chromite. Miner. Eng. 2025, 225, 109221. [Google Scholar] [CrossRef] [Scilit]

Disclaimer/Publisher’s Note: The statements, opinions and data contained in all publications are solely those of the individual author(s) and contributor(s) and not of MDPI and/or the editor(s). MDPI and/or the editor(s) disclaim responsibility for any injury to people or property resulting from any ideas, methods, instructions or products referred to in the content. |
© 2026 by the authors. Licensee MDPI, Basel, Switzerland. This article is an open access article distributed under the terms and conditions of the Creative Commons Attribution (CC BY) license.