


Abstract
In this study, we investigate how lightning-derived electric-field influences nonlinear excitation dynamics in excitable systems. Cloud-to-ground (CG) lightning observations from the National Lightning Detection Network (NLDN), including event time, location, and peak current, were used to reconstruct realistic lightning-derived electric-field inputs. The electric field distribution was estimated from lightning peak current and propagation distance using a physical formulation, and discrete lightning events were converted into continuous time-dependent forcing signals through Gaussian kernel superposition while preserving their spatiotemporal organization. The resulting electric-field signals were then applied to the FitzHugh–Nagumo (FHN) model, where biologically inspired excitation dynamics were simulated and analyzed using normalized external inputs. The simulations demonstrate that temporally accumulated lightning-derived forcing induces nonlinear transitions between excitation regimes. Stronger peak-current inputs more readily exceed excitation thresholds and produce enhanced responses, including repeated excitation events, whereas weaker inputs generate limited or sub-threshold responses. These results show that excitation dynamics depend not only on electric-field amplitude but also on the temporal accumulation and organization of lightning activity. Furthermore, a spatially extended reaction–diffusion FHN model demonstrates that lightning-induced electric-field attenuation coupled with nonlinear dynamics can generate spatially propagating excitation structures. This physics-based framework provides a conceptual approach for linking naturally occurring electric-field environments with nonlinear excitable-system dynamics. Although the present model does not represent direct physiological coupling, it provides a foundation for exploring how structured environmental electric fields may influence threshold-dependent dynamical responses.
1. Introduction
Lightning is a global atmospheric electrical phenomenon associated with intense charge separation in convective storm systems. Although cloud-to-ground (CG) lightning occurs over both land and ocean, its overall occurrence frequency is generally higher over land than over oceanic regions [1,2]. In contrast, oceanic lightning has been reported to exhibit a higher proportion of high peak-current events compared with land-based lightning [3]. Moreover, the high electrical conductivity of seawater reduces electromagnetic attenuation, potentially enhancing field propagation in coastal environments [4]. These characteristics suggest that lightning occurring over or near ocean surfaces may have greater potential to contribute to extreme transient electromagnetic forcing in coastal regions, despite a lower total flash rate. Lightning generates transient electric fields whose magnitude depends on peak current, return-stroke dynamics, and propagation distance [5,6]. Previous studies have mainly focused on macroscopic effects such as electrical damage, electromagnetic interference, and atmospheric ionization [6,7]. However, the response of nonlinear excitable systems to weak and temporally structured environmental electric fields remains insufficiently understood.
Excitable systems exhibit all-or-none responses, refractory behavior, and wave propagation, and are widely observed in neuroscience, chemistry, and plasma physics. A canonical minimal model describing such behavior is the FitzHugh–Nagumo (FHN) system, originally developed as a reduction in the Hodgkin–Huxley (HH) model [7,8]. The FHN model captures essential threshold excitability using only two variables while preserving spike generation and recovery dynamics. A key advantage of this formulation is that it reproduces qualitative excitability without requiring detailed conductance-based parameterization or empirical scaling, making it suitable for systems driven by highly variable external inputs. In addition, its low-dimensional phase-space structure enables robust analysis of weak, transient, and spatially distributed forcing [9,10,11]. A major challenge in connecting atmospheric electric fields to excitable dynamics is the large separation of spatial and temporal scales. Therefore, lightning-derived signals are transformed into normalized external inputs that preserve their temporal structure, allowing us to focus on dynamical excitation mechanisms rather than detailed biophysical coupling.
Motivated by these considerations, this study employs the FHN model as a canonical excitable system to investigate how temporally and spatially structured lightning-derived forcing influences nonlinear excitation dynamics. While the primary focus is on lightning-induced environmental forcing, the framework also provides a general basis for analyzing threshold-based responses in excitable systems as a conceptual extension.
2. Materials and Methods
2.1. Lightning Data Analysis
Lightning data, including occurrence time, geographic location (latitude and longitude), and peak current values, were obtained from the NLDN, which provides location and peak-current information for cloud-to-ground lightning flashes throughout the United States [12]. Previous studies have demonstrated the reliability and performance of the NLDN for quantitative lightning analyses [13,14]. The lightning image was acquired using an iPhone 14 Pro camera (Apple, Orland park, IL, USA) MATLAB (v2025) was used to process the lightning dataset, calculate lightning-derived electric fields, construct time-dependent external forcing signals, and perform numerical simulations of nonlinear excitation dynamics using the FHN model. The electric field, , expressed in V/m, at a distance r from the lightning discharge was calculated as [15,16,17]:
where denotes the peak current (kA), is the return-stroke velocity (), is the permittivity of free space (), and is the speed of light (). The spatial distribution of the electric field was evaluated over distances ranging from 0.1 to 10 km from the discharge channel.
2.2. Construction of Lightning-Derived External Forcing
The time-dependent lightning-derived electric field, , was constructed using Gaussian temporal kernel superposition [18,19]:
where represents the electric-field contribution from the -th lightning event. Since the NLDN dataset contains multiple lightning events with different peak currents and occurrence times, each event was treated individually, and the index denotes a single lightning event. The function represents the temporal influence of each lightning event and is defined as:
where is the occurrence time of the -th lightning event and controls the temporal width of the stimulus. This formulation converts discrete lightning events into a continuous external forcing function, enabling the representation of temporally accumulated lightning activity. Gaussian kernel superposition is employed to transform discrete lightning events into a continuous forcing function while preserving the original temporal structure of the event sequence. This approach provides a smooth and physically consistent representation of temporally distributed impulses and avoids artificial discontinuities that may distort nonlinear dynamical responses. It also enables constructive overlap of temporally adjacent events, allowing the system to capture clustering-induced accumulation effects in a controlled manner.
2.3. FHN Model with Lightning-Derived Forcing
The nonlinear response of an excitable system to lightning-derived external forcing was modeled using the FHN equations [7,8,9,10]. The external input, , was first defined as a normalized forcing function derived from the lightning-induced electric field:
where represents the normalized (dimensionless) envelope of , where denotes the temporally accumulated lightning-derived electric field, and is a dimensionless scaling parameter used only to adjust relative excitation strength within the dynamical system (not to perform any physiological or unit-based conversion). The scaling factor is introduced to systematically vary the input amplitude while preserving the identical temporal structure of . This allows separation of temporal effects (event clustering and ordering) from amplitude effects (intensity of forcing), enabling identification of whether nonlinear excitation dynamics are governed primarily by time-structure dependence or intensity-dependent threshold crossing behavior. The dynamics of the excitable system are governed by the FHN equations:
where is the fast excitation variable and is the recovery variable. The parameters , , and determine the excitability regime of the system. The model parameters were set as , , and . These values place the system in an excitable regime, allowing threshold-dependent nonlinear responses to transient external forcing. Importantly, does not represent a physically measured membrane current or a direct conversion from atmospheric electric field units. Instead, it is a normalized external excitation term used to preserve the temporal structure of lightning activity within a low-dimensional dynamical system framework. This formulation enables the investigation of nonlinear excitability under temporally structured forcing, including clustered and stochastic-like lightning activity. It is important to note that temporal shifts observed between the external forcing and the response variable do not represent a physical propagation delay of atmospheric signals. Instead, they arise from the intrinsic dynamics of the FHN system, including nonlinear integration of past inputs and recovery (refractory) processes governing re-excitability.
2.4. Numerical Implementation and Response Analysis
The coupled FHN system was integrated using a fourth-order Runge–Kutta method with a time step of , which is sufficiently small to resolve both the external forcing and the intrinsic system dynamics. Simulations were performed over the full duration of the lightning-derived input signal. The system was initialized at the resting state , , and parameter values were selected within the excitable regime to ensure threshold-dependent responses under external forcing. It should be noted that the time unit used in the present model is normalized and does not directly correspond to the physical microsecond-scale rise time of lightning return strokes. The aim is to preserve the relative temporal organization of lightning events rather than to reproduce absolute physical timescales. To characterize the system response, we computed the peak excitation , an energy-like measure , and the number of spike events based on threshold crossings. This modeling framework provides a qualitative representation of how temporally structured lightning-derived forcing influences excitable system dynamics. The goal is not to reproduce detailed physiological or atmospheric microphysics, but to identify generic nonlinear response regimes emerging from the interaction between external forcing and intrinsic excitability.
2.5. Spatially Extended Reaction–Diffusion FHN Model
The spatial structure of the forcing was defined as:
where represents the temporally accumulated lightning-derived electric field that provides the temporal forcing, and describes the spatial attenuation of the electric field. To investigate spatial propagation of excitation, the FHN model was extended to a reaction–diffusion system:
where is the diffusion coefficient. The recovery variable follows the FHN kinetics defined in Equation (6).
3. Results
3.1. Spatiotemporal Distribution of Lightning Events
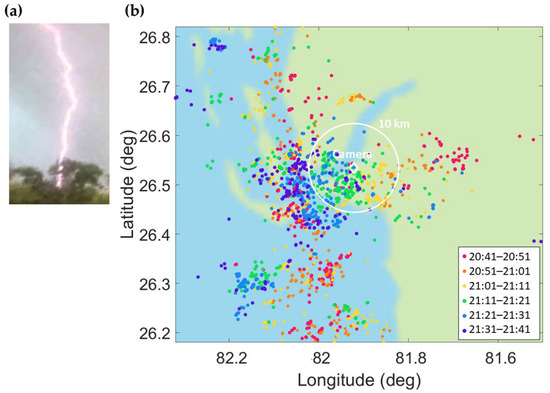
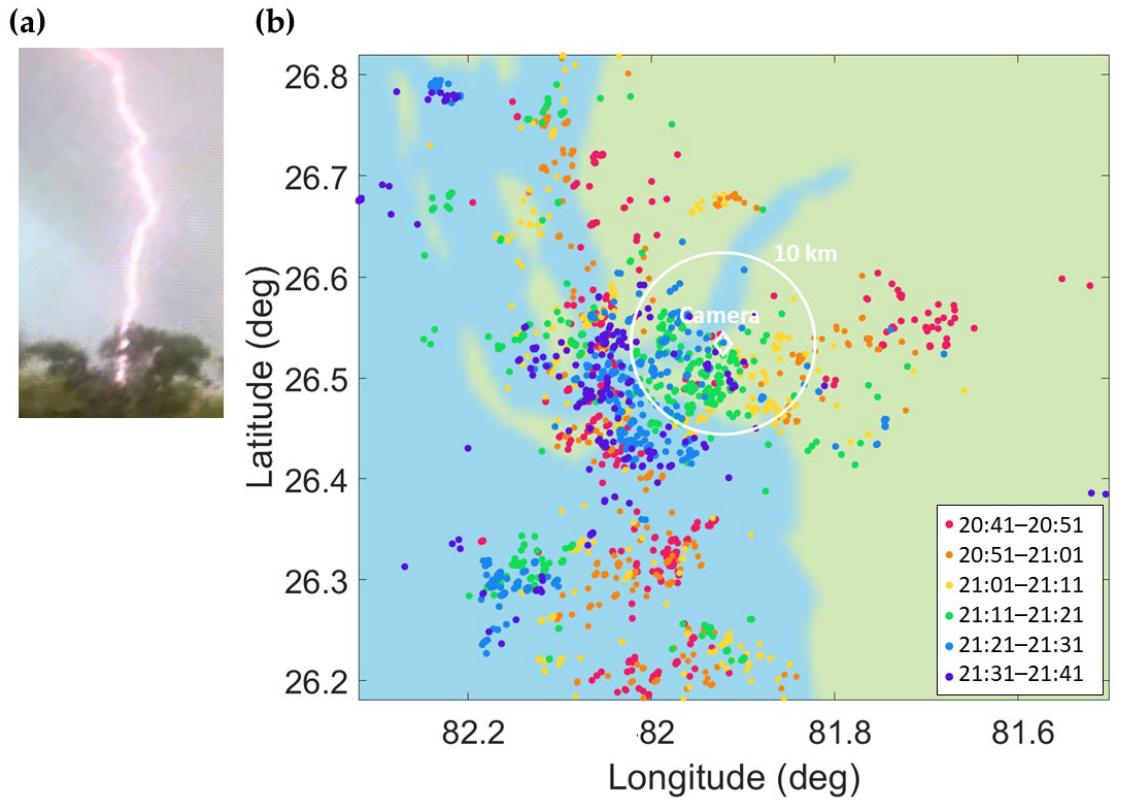
A lightning flash was recorded using a smartphone camera at latitude 26.48° N and longitude 81.95° W on 22 June 2025, at 21:11 UTC. The observation site is located near the coastline, enabling comparison between lightning activity over land and oceanic regions. Figure 1a shows a frame extracted from the recorded lightning video. Based on the observed timing and azimuthal direction, the corresponding lightning event was identified using NLDN data. The lightning event corresponding to the recorded flash was identified as a CG flash with a peak current of 65 kA. Figure 1b presents the locations of CG flashes reported by NLDN within a ±30 min window of the observed flash (20:41–21:41 UTC) and within the region 26.2–26.8° N and 81.5–82.3° W. The camera was located at 26.48° N, 81.95° W, indicated by a diamond marker. A white circle denotes a 10 km radius centered at the camera location. Each lightning event is color-coded according to its occurrence time within 10 min intervals over the time window. Lightning activity is continuously distributed over both land and ocean regions, with events occurring across multiple locations throughout the observation period. In particular, the spatial distribution indicates that lightning activity is not confined to either land or ocean regions; however, it exhibits a mixed spatial structure in the coastal environment, where both types of discharges coexist within a short spatial scale. This mixed distribution provides a natural observational basis for comparing land- and ocean-influenced lightning characteristics under similar atmospheric conditions. Overall, the observed lightning activity exhibits both temporal clustering and spatial dispersion within the selected spatiotemporal window, suggesting that the system is not composed of isolated events but instead shows an inherently organized spatiotemporal structure.
Figure 1.
(a) The captured CG lightning occurring on June 22, 2025, at 21:11 UTC; (b) Locations of CG flashes reported by the NLDN on 22 June 2025 from 20:41:00 UTC to 21:41:00 UTC within the region bounded by 26.2–26.8° N and 81.5–82.3° W. The camera was located at 26.48° N, 81.95° W, represented by a white diamond in the figure. A white circle indicates a 10 km radius centered at the camera location. This coastal observation site enables direct comparison of land and ocean lightning activity under the same meteorological system.
3.2. Peak Current Statistics
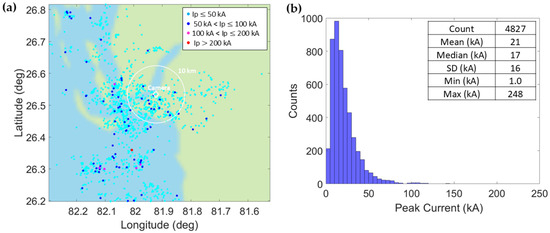
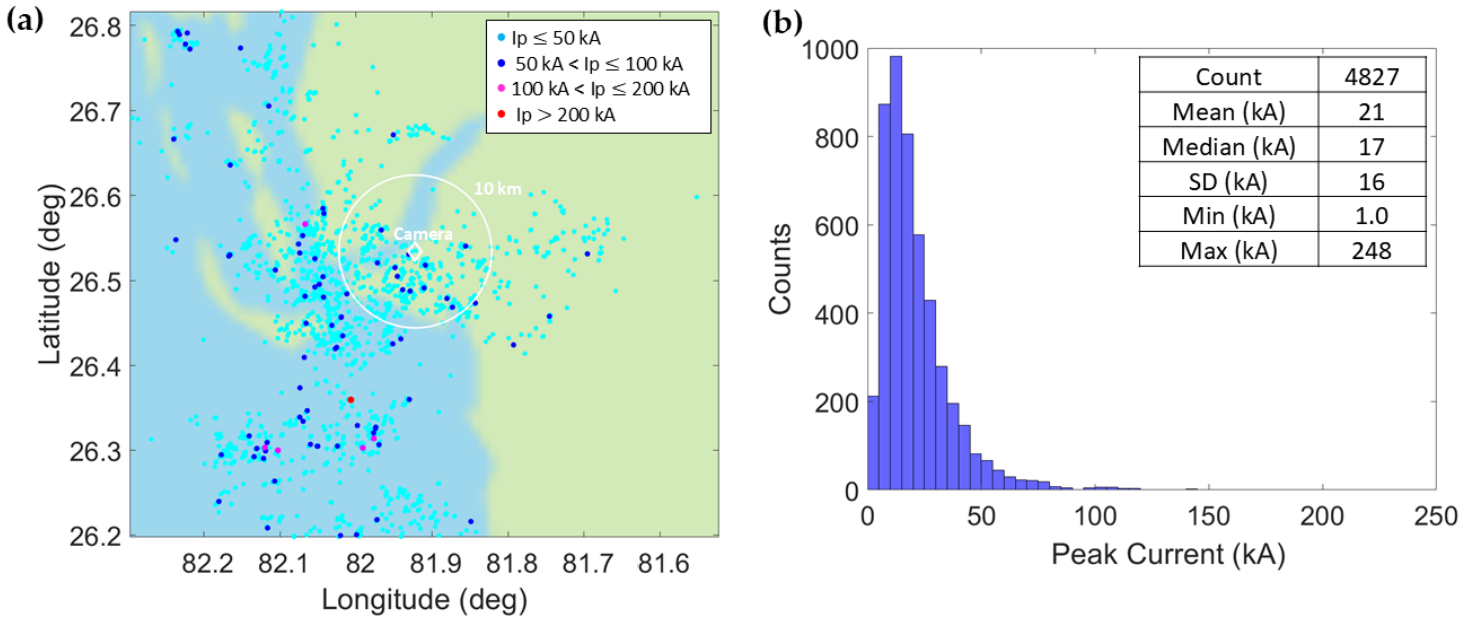
Figure 2a presents the locations of CG flashes reported by NLDN within a ±30 min window of the observed flash (20:41–22:41 UTC) and within the region 26.2–26.8° N and 81.5–82.3° W. Figure 2a corresponds to the same spatial and temporal window as Figure 1a, with color coding representing peak current magnitude instead of time. Each lightning event is color-coded according to peak current magnitude: less than 50 kA, 50–100 kA, 100–200 kA, and exceeding 200 kA. As shown in Figure 2a, higher peak current events tend to occur more frequently over the oceanic region than over land. This tendency is consistent with previous studies reporting enhanced occurrence of high-current lightning over ocean regions [2,3,4]. This spatial tendency suggests that ocean-influenced lightning may contribute disproportionately to extreme electric-field forcing events despite lower overall flash density compared with land regions.
Figure 2.
(a) Locations of CG flashes reported by the NLDN on 22 June 2025 from 20:41:00 UTC to 21:41:00 UTC within the region bounded by 26.2–26.8° N and 81.5–82.3° W. The camera was located at 26.48° N, 81.95° W, represented by a white diamond in the figure. A white circle indicates a 10 km radius centered at the camera location. Colored dots indicate the peak current ranges of the CG flashes; (b) Histogram of peak current values of CG flashes occurring within the same spatial region and time window as in (a).
Figure 2b presents a histogram of peak current values for CG flashes within the same spatial and temporal window as shown in Figure 2a. The peak current ranges from 1.0 kA to 248 kA, with a median value of 17 kA. This statistical distribution provides the basis for selecting representative amplitude levels used in the subsequent electric field calculations and nonlinear excitation simulations.
3.3. Electric Field at Distance
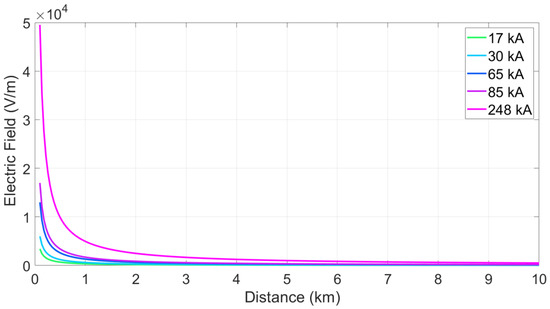
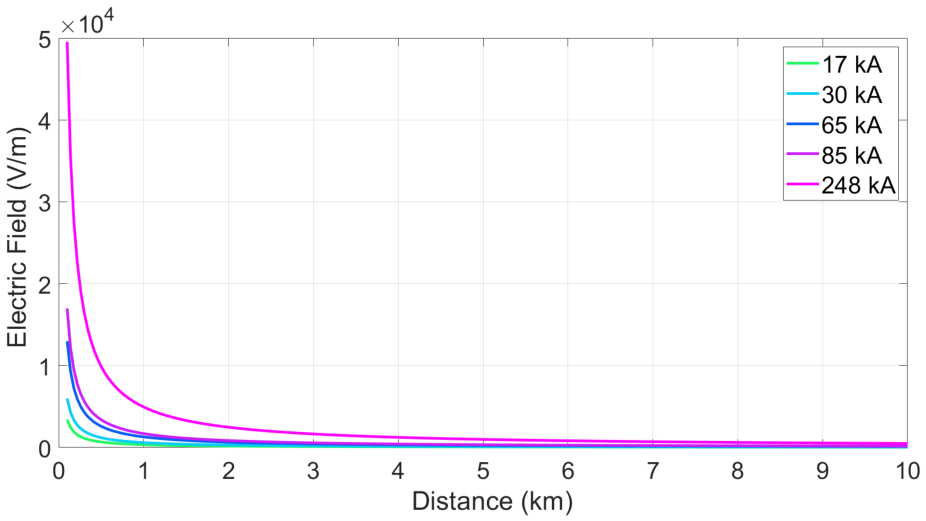
The electric fields generated by CG lightning were calculated using Equation (1) in Section 2.2. Based on the results in Section 3.1 and Section 3.2, five representative peak-current values (17, 30, 65, 85, and 248 kA) were selected to capture both statistical variability and observed extreme events. Section 3.1 reports a directly observed CG lightning event recorded on video with a reconstructed peak current of 65 kA. A temporally close but spatially distinct flash within the same offshore storm system exhibited 85 kA, representing a high-intensity observed event. Section 3.2 shows that the dataset has a median value of 17 kA and a maximum value of 248 kA, while 30 kA is commonly used as a standard CG peak current in previous studies [5,6]. Accordingly, the selected values represent distinct regimes: 17 kA as a median weak-to-moderate event, 30 kA as a literature-based reference, 65 kA and 85 kA as observed high-intensity events, and 248 kA as an extreme case. As shown in Figure 3, the electric field profiles associated with all peak-current cases exhibit rapid spatial attenuation and effectively converge within approximately 10 km from the discharge channel. Beyond this distance, the field strength becomes negligibly small for the present modeling framework. Based on this physically constrained spatial decay, the subsequent analysis is therefore restricted to lightning events occurring within a 10 km radius from the observation point. These spatial electric-field profiles are used as external forcing in the subsequent FHN-based excitable system analysis, linking observed lightning characteristics to nonlinear excitation dynamics.
Figure 3.
Electric field produced by the lightning peak current of 17 kA, 30 kA, 65 kA, 85 kA, and 248 kA, respectively, at distances within 10 km.
3.4. Temporal Accumulation of Lightning-Derived Forcing and Nonlinear Excitation Response
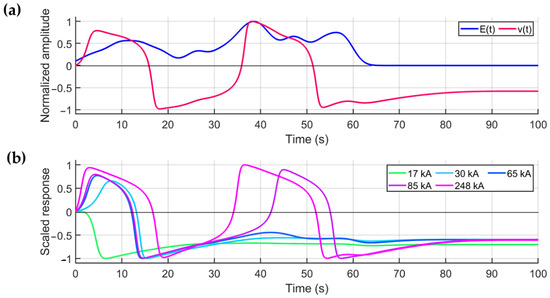
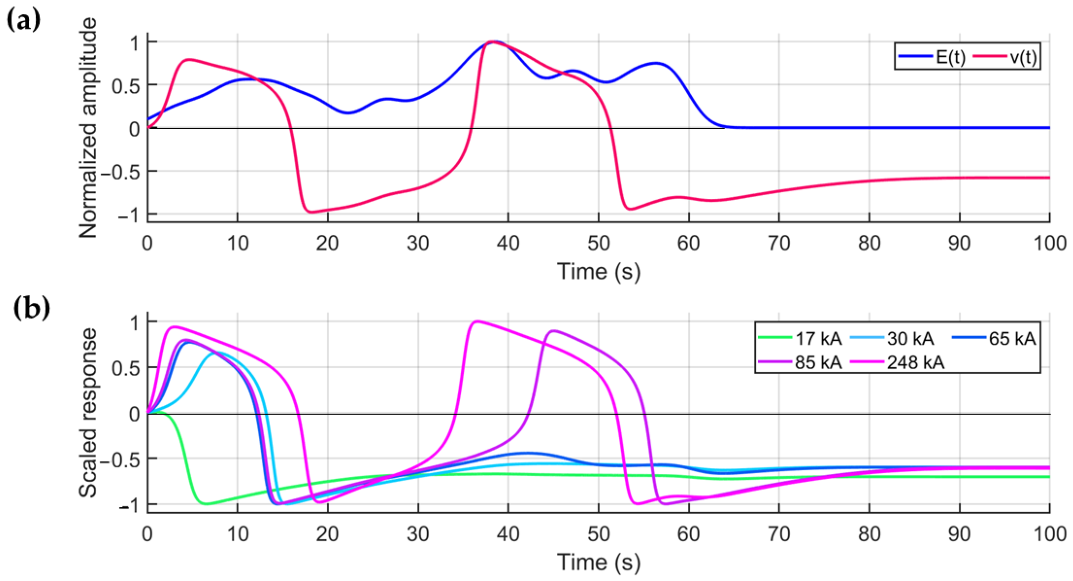
To investigate the effect of temporal lightning clustering on nonlinear excitability, discrete NLDN lightning events were converted into a continuous external forcing function using Gaussian kernel superposition. To quantify the temporal structure of lightning activity, we applied a sliding 100 s window to the full 1 h NLDN dataset. The analysis shows a pronounced clustering behavior, indicating that lightning events are not uniformly distributed in time but instead concentrate within a distinct active period. This dominant 100 s window is used as the physically motivated forcing interval in the FHN model (Figure 4a). The use of a 100 s window reflects the empirically identified high-density clustering interval and is intended to isolate the regime in which temporally overlapping events produce significant accumulation effects in the reconstructed forcing. To ensure consistency in the analysis of clustered lightning activity, the same 100 s high-density interval identified from the sliding-window analysis is used as the representative forcing segment for all simulations in this section. As shown in Figure 4a, the resulting E(t) reflects the temporal clustering structure of lightning activity, where overlapping events generate locally amplified input peaks. While individual lightning discharges contribute isolated perturbations, temporally adjacent events lead to constructive overlap of Gaussian kernels, producing nonlinearly enhanced forcing periods. As a result, the FHN system exhibits a strongly nonlinear response that depends on the temporal organization of the input rather than on isolated event amplitudes. The corresponding excitation variable v(t) follows the temporal structure of the forcing but exhibits transient suppression due to recovery dynamics. It is important to note that temporal differences between E(t) and v(t), including delayed or shifted peaks, do not represent a physical propagation delay of atmospheric signals. Instead, they reflect the intrinsic dynamics of the FHN system, including nonlinear temporal integration of past inputs and recovery (refractory) processes governing re-excitability. This indicates that the system acts not as a simple linear responder but as a history-dependent nonlinear integrator of temporally clustered inputs. In particular, densely clustered lightning periods produce significantly enhanced excitation responses, whereas sparsely distributed events result in near-resting behavior, revealing a clear separation between active and quiescent dynamical states. Importantly, this behavior suggests that the system response is governed by a temporal clustering–induced regime transition, rather than a simple amplitude-response relationship typically observed in periodically driven excitable systems. This highlights that stochastic-like environmental forcing can reorganize excitation dynamics into distinct dynamical states depending on clustering density. To further examine intensity effects in a controlled and physically interpretable manner, the same temporally structured forcing was systematically scaled using five representative peak-current values 17 kA, 30 kA, 65 kA, 85 kA, and 248 kA, selected to span the observed range of NLDN lightning intensities. As shown in Figure 4b, increasing peak current results in a monotonic enhancement of both excitation amplitude and firing frequency in the FHN system, indicating a robust dependence of system excitability on input magnitude under identical temporal organization.
Figure 4.
(a) Temporally accumulated lightning-derived forcing E(t), generated from the observed NLDN lightning event sequence using Gaussian kernel superposition, together with the corresponding FHN excitation variable v(t), both shown in normalized amplitude form. The analysis is performed on a representative 100 s high-density lightning interval selected from the full dataset to capture the strongest clustering behavior; (b) Simulated FHN excitation responses under a fixed temporally clustered lightning-derived forcing E(t), uniformly scaled to represent five representative peak-current regimes (17, 30, 65, 85, and 248 kA), shown in scaled response form. The temporal structure of the forcing is identical in all cases, allowing evaluation of intensity-dependent nonlinear excitation dynamics governed solely by amplitude modulation.
In the low-intensity regime 17 kA, 30 kA, and 65 kA, the system consistently exhibits only a single excitation event followed by relaxation to a stable resting state. In this regime, the second response is strongly suppressed and remains near zero or slightly negative, forming an effectively subthreshold trajectory that does not recover sufficient excitability to trigger a second firing event. This behavior confirms that the system remains below the effective re-excitation threshold during the recovery phase, despite identical temporal forcing structure. In contrast, intermediate and high-intensity cases 85 kA and 248 kA exhibit repeated threshold crossings and sustain multiple excitation events. This indicates that the external forcing amplitude is sufficiently large to overcome the intrinsic recovery-induced inhibition of the FHN dynamics. Notably, both 85 kA and 248 kA cases show a distinct second excitation peak, demonstrating a reproducible transition from single spike to multi-spike firing regimes driven solely by intensity scaling. Importantly, the observed transition is not attributable to changes in temporal forcing structure but arises exclusively from amplitude modulation of identical Gaussian kernel superpositions. This isolates peak current as the governing control parameter for excitability modulation in the system. Furthermore, the persistence of suppressed or near-flat responses in low-intensity cases and the emergence of recurrent firing in high-intensity cases demonstrate a clear regime separation, supporting the interpretation of a threshold-governed nonlinear response rather than a linear scaling behavior.
3.5. Reaction–Diffusion Spatiotemporal Excitation
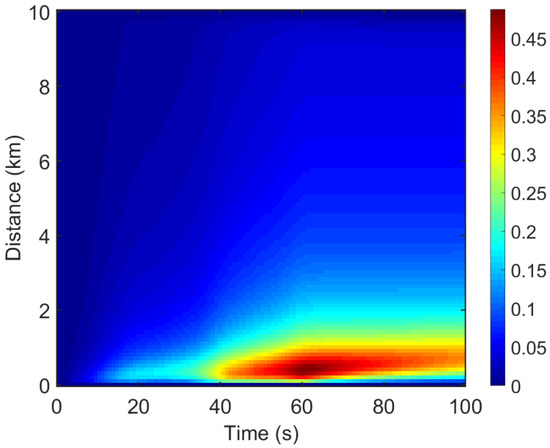
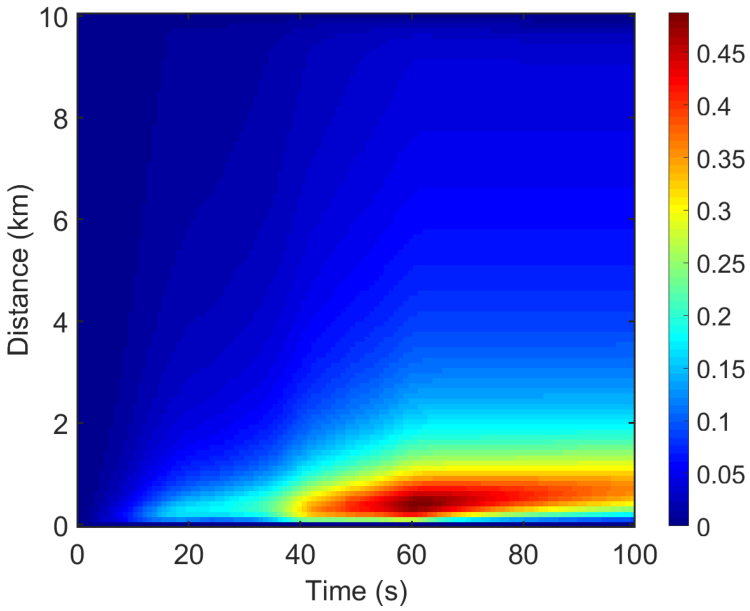
The spatiotemporal response of the reaction–diffusion FHN model was analyzed under external forcing derived from lightning electric field distributions associated with peak currents. Figure 5 illustrates the spatiotemporal evolution of the normalized excitation variable , representing its distance–time dynamics under a spatially attenuated electric field consistent with lightning discharge physics. For consistency with Section 3.4, the same 100 s high-density lightning interval identified from the sliding-window analysis is used as the forcing input in the reaction–diffusion simulations. The results indicate that excitation is maximized near the source region, where the electric field intensity is highest due to the peak lightning current. As distance increases, the excitation amplitude decreases monotonically, reflecting the spatial attenuation of the lightning-induced electric field. This behavior is consistently represented in the heatmap as a gradual reduction in excitation intensity with increasing distance. However, the system response is not purely local. The diffusion term introduces spatial coupling between neighboring regions, resulting in the formation of a continuous excitation front. This is observed in the heatmap as a ridge-like propagation structure, where excitation is first generated near the source and subsequently propagates outward with a finite delay. The propagation pattern arises from the combined effects of electric-field attenuation, nonlinear reaction dynamics, and diffusion-driven transport. At larger distances, where the electric field falls below the excitation threshold, the response becomes significantly weaker and temporally delayed, leading to attenuation of the propagating front. In addition, the response near remains limited despite the highest local forcing intensity. This is attributed to the intrinsic nonlinear saturation and recovery dynamics of the FHN system, governed by the cubic nonlinearity and recovery variable. As a result, the system operates in a subthreshold nonlinear regime in which the excitation amplitude remains bounded below unity.
Figure 5.
Spatiotemporal excitation dynamics of the reaction–diffusion FHN model driven by lightning-derived external forcing. The color map represents the normalized excitation variable v(r,t) as a function of distance and time. The results show strong excitation near the source region, systematic attenuation with distance, and the emergence of a diffusion-driven propagating excitation front ridge structure extending outward over time.
Overall, these results demonstrate that the spatiotemporal excitation structure emerges from the interaction between lightning-induced electric field attenuation, diffusion-mediated spatial coupling, and intrinsic nonlinear recovery dynamics of the FHN model.
4. Discussion
This study examines lightning activity as a temporally and spatially structured source of electric field forcing acting on nonlinear excitable dynamics. Rather than treating lightning as a collection of independent stochastic events, the present framework shows that its spatiotemporal organization can be represented as continuous external forcing with embedded correlations in both time and space. This provides a physically grounded representation of lightning activity as an input capable of influencing threshold-dependent dynamics in excitable systems. Using the NLDN dataset, we reconstructed electric-field forcing functions that preserve the temporal sequence, spatial distribution, and peak-current variability of cloud-to-ground lightning events. The analysis reveals pronounced clustering and spatial heterogeneity, with higher peak-current events preferentially occurring over oceanic regions. These results indicate that atmospheric electric environments inherently contain structured variability, suggesting that lightning-derived forcing can be interpreted as a continuous field with both temporal and spatial organization. Simulation results show that excitation behavior depends not only on instantaneous input amplitude but also on temporal structure. In particular, temporally clustered lightning events generate cumulative effects that drive nonlinear transitions across excitation thresholds, indicating that system response reflects integration over input history. This introduces history-dependent dynamics into the excitable system. Reaction–diffusion analysis further demonstrates that spatial gradients in electric-field input interact with nonlinear reaction kinetics to produce propagating excitation structures. The FHN model was selected because it captures the essential properties of excitable media, including threshold behavior, refractoriness, and recovery, within a minimal mathematical framework [7,8,9]. In this formulation, lightning-derived electric fields are treated as normalized external perturbations, enabling the study of general nonlinear response mechanisms independent of system-specific details. These findings suggest that natural atmospheric electric environments can act as structured external inputs that shape excitation dynamics through amplitude modulation, temporal accumulation, and spatial attenuation.
Peripheral nociceptive systems such as dental pulp provide a representative example of biologically excitable media characterized by strong threshold dependence and temporal integration. In particular, dental pulp C-fibers exhibit threshold-dependent activation and temporal summation properties, slow conduction properties, and pronounced temporal summation, making them sensitive to weak but temporally structured stimuli [20,21]. Under inflammatory conditions, excitability is further enhanced through chemical mediators and cytokine-related modulation [22,23], while tetrodotoxin-resistant sodium channels (Nav1.8 and Nav1.9) contribute to persistent excitability and altered threshold dynamics [24,25]. These properties are consistent with systems in which temporally accumulated inputs modulate excitability through history-dependent integration. Dental pulp inflammation involves complex neuroimmune interactions that lead to peripheral sensitization and altered nociceptor function [26,27]. However, it is essential to clearly define the scope of this comparison. The present model does not include ion-channel kinetics, intracellular biochemical signaling, membrane biophysics, or tissue-specific anatomical structure. Moreover, no quantitative correspondence is established between the FHN framework and experimentally measured dental pulp electrophysiological responses; therefore, no physiological prediction should be inferred. Accordingly, dental pulp nociception is discussed strictly as a qualitative structural analogy rather than a biophysically grounded representation of pain physiology. The inclusion of dental pulp C-fiber dynamics is motivated by their role as a canonical example of highly sensitive excitable media exhibiting threshold-dependent firing and history-dependent integration, rather than implying any mechanistic link to atmospheric electric phenomena. Their nonlinear response properties provide a conceptual reference for interpreting how temporally structured external forcing can reorganize excitation dynamics in generic nonlinear systems. From a modeling perspective, the present framework is intentionally abstract and is not designed to reproduce biological time scales, spatial scales, or physiological current magnitudes. Therefore, any correspondence between lightning-derived forcing and nociceptive dynamics should be interpreted as a qualitative analogy of dynamical structure rather than a quantitative mapping between systems.
Future work may incorporate more detailed electrodynamic coupling, spatial heterogeneity, and adaptive threshold mechanisms, enabling potential multiscale comparisons across atmospheric and biological excitable media. However, such extensions would require explicit biophysical modeling beyond the scope of the present minimal framework. From a broader perspective, these results suggest that lightning-generated electric-field environments act as structured dynamical inputs that influence nonlinear excitation behavior through the combined effects of spatial organization, temporal accumulation, and amplitude variability.
5. Conclusions
In this study, we developed a lightning-driven FHN framework to investigate how physically derived lightning-electric-field inputs influence nonlinear excitation dynamics. CG lightning flash data obtained from the NLDN, including actual event time, geographic location, and peak current values, were used to construct external forcing signals with preserved temporal and spatial characteristics of lightning activity. The results demonstrate that lightning-derived electric field can generate distinct excitation responses depending on the combination of input intensity and temporal organization. By incorporating lightning-event accumulation through Gaussian kernel superposition, the model revealed that clustered lightning activity can produce nonlinear transitions in excitation behavior that are not predicted by isolated-event analysis. The use of representative peak-current values of 17 kA, 30 kA, 65 kA, 85 kA, and 248 kA further demonstrated different response regimes associated with variations in lightning intensity. Furthermore, the reaction–diffusion analysis demonstrated that lightning-derived external forcing, represented by the calculated electric-field input, can generate spatially structured excitation patterns through the interaction between spatial electric-field variation and nonlinear system dynamics. Overall, this study provides a general modeling framework for examining nonlinear responses of excitable systems under complex external forcing. The approach may be extended in future studies by incorporating additional atmospheric and environmental parameters to further investigate the relationship between lightning activity and nonlinear response dynamics.
Author Contributions
Conceptualization, N.D. and N.W.; methodology, N.D.; validation, N.D. and N.W.; formal analysis, N.D.; investigation, N.D.; resources, N.D.; writing—original draft preparation, N.D.; writing—review and editing, N.W.; visualization, N.D. and N.W.; supervision, N.W. All authors have read and agreed to the published version of the manuscript.
Funding
This research was in part of supported by Florida Gulf Coast University.
Institutional Review Board Statement
Not applicable.
Informed Consent Statement
Not applicable.
Data Availability Statement
The original contributions presented in this study are included in the article. Further inquiries can be directed to the corresponding author.
Acknowledgments
We thank Florida Gulf Coast University (USA) for supporting this research. We thank the Professional Development Fund (PDF) Grant for covering the publication cost. We thank the WiSER Research Assistant Program, administered by the Scholarly Foundation Student Research Office at FGCU and Whitaker Grant, administrated by the Whitaker Institute for STEM Education for supporting our research activities. We thank Amitabh Nag and Vaisala for providing excellent NLDN datasets.
Conflicts of Interest
The authors declare no conflicts of interest.
References
- Orville, R.E.; Huffines, G. Cloud-to-ground lightning in the United States: NLDN results in the first decade, 1989–1998. Mon. Weather Rev. 2001, 129, 1179–1193. [Google Scholar]
- Hutchins, M.L.; Holzworth, R.H.; Rodger, C.J. Worldwide distributions of cloud-to-ground lightning. J. Geophys. Res. 2012, 117, D10105. [Google Scholar]
- Lyons, W.A.; Uliasz, M.; Nelson, T.E. The intracloud lightning environment in coastal thunderstorms. J. Geophys. Res. 1998, 103, 14069–14076. [Google Scholar]
- Cooray, V.; Jayaratne, R.; Cummins, K.L. On the peak amplitude of lightning return stroke currents striking the sea. Atmos. Res. 2014, 149, 372–376. [Google Scholar] [CrossRef] [Scilit]
- Rakov, V.A.; Uman, M.A. Lightning: Physics and Effects; Cambridge University Press: Cambridge, UK, 2003. [Google Scholar]
- MacGorman, D.R.; Rust, W.D. The Electrical Nature of Storms; Oxford University Press: Oxford, UK, 1998. [Google Scholar]
- FitzHugh, R. Impulses and physiological states in theoretical models of nerve membrane. Biophys. J. 1961, 1, 445–466. [Google Scholar] [CrossRef] [Scilit] [PubMed]
- Nagumo, J.; Arimoto, S.; Yoshizawa, S. An active pulse transmission line simulating nerve axon. Proc. IRE 1962, 50, 2061–2070. [Google Scholar] [CrossRef] [Scilit]
- Keener, J.; Sneyd, J. Mathematical Physiology; Springer: Berlin/Heidelberg, Germany, 2002. [Google Scholar]
- Murray, J.D. Mathematical Biology I: An Introduction; Springer: Berlin/Heidelberg, Germany.
- Dayan, P.; Abbott, L.F. Theoretical Neuroscience: Computational and Mathematical Modeling of Neural Systems; MIT Press: Cambridge, MA, USA, 2001. [Google Scholar]
- Cummins, K.L.; Krider, E.P.; Malone, M.D. The U.S. National Lightning Detection Network and applications of cloud-to-ground lightning data. J. Geophys. Res. 2005, 110, D11105. [Google Scholar]
- Nag, A.; Cummins, K.L. Evaluating performance characteristics of the U.S. National Lightning Detection Network. Electr. Power Syst. Res. 2017, 143, 256–268. [Google Scholar]
- Orville, R.E.; Defer, E.; Cummins, K.; Kusterer, B.; Boccippio, D.J.; Goodman, S.J.; Christian, H.J. The performance of the National Lightning Detection Network. Bull. Am. Meteorol. Soc. 2011, 92, 1805–1820. [Google Scholar]
- Rakov, V.A. Fundamentals of Lightning; Cambridge University Press: Cambridge, UK, 2016. [Google Scholar]
- Uman, M.A.; McLain, D.K. Lightning return stroke current and electromagnetic fields. J. Geophys. Res. 1969, 74, 6899–6909. [Google Scholar]
- Chen, Y.; Wang, X.; Rakov, V.A. Approximate expressions for lightning electromagnetic fields. J. Geophys. Res. Atmos. 2015, 120, 9553–9571. [Google Scholar] [CrossRef] [Scilit]
- Silverman, B.W. Density Estimation for Statistics and Data Analysis; Chapman & Hall: London, UK, 1986. [Google Scholar]
- Cressie, N.; Wikle, C.K. Statistics for Spatio-Temporal Data; Wiley: Hoboken, NJ, USA, 2011. [Google Scholar]
- Byers, M.R.; Närhi, M.V. Dental pulp pain: Peripheral mechanisms and sensory neurobiology. Crit. Rev. Oral Biol. Med. 1999, 10, 68–70. [Google Scholar]
- Ahlquist, M.L.; Franzén, O.G. Inflammation and dental pain in man. Scand. J. Dent. Res. 1994, 102, 287–292. [Google Scholar] [CrossRef] [Scilit] [PubMed]
- Ji, R.R.; Xu, Z.Z.; Gao, Y.J. Neuroinflammation and pain sensitization. Nat. Rev. Neurosci. 2016, 17, 1–14. [Google Scholar]
- Ji, R.R.; Xu, Z.Z.; Gao, Y.J. Emerging targets in neuroinflammation and pain sensitization. Nat. Rev. Drug Discov. 2014, 13, 533–548. [Google Scholar] [CrossRef] [Scilit] [PubMed]
- Rush, A.M.; Cummins, T.R.; Waxman, S.G. Multiple sodium channels and their roles in electrogenesis within dorsal root ganglion neurons. J. Physiol. 2007, 579, 1–14. [Google Scholar] [CrossRef] [Scilit]
- Akopian, A.N.; Sivilotti, L.; Wood, J.N. A tetrodotoxin-resistant voltage-gated sodium channel expressed in sensory neurons. Nature 1996, 379, 257–262. [Google Scholar] [CrossRef] [Scilit] [PubMed]
- Basbaum, A.I.; Bautista, D.M.; Scherrer, G.; Julius, D. Cellular and molecular mechanisms of pain. Nat. Rev. Neurosci. 2009, 139, 267–284. [Google Scholar] [CrossRef] [Scilit]
- Yu, C.; Abbott, P.V. Dental nerves: A neglected mediator of pulpitis. Int. Endod. J. 2021, 54, 85–99. [Google Scholar] [CrossRef] [Scilit] [PubMed]
Disclaimer/Publisher’s Note: The statements, opinions and data contained in all publications are solely those of the individual author(s) and contributor(s) and not of MDPI and/or the editor(s). MDPI and/or the editor(s) disclaim responsibility for any injury to people or property resulting from any ideas, methods, instructions or products referred to in the content. |
© 2026 by the authors. Licensee MDPI, Basel, Switzerland. This article is an open access article distributed under the terms and conditions of the Creative Commons Attribution (CC BY) license.