


Abstract
Lactose is widely used as a pharmaceutical excipient, yet little is known about how its physicochemical behavior may be influenced by pretreatment history and weak environmental magnetic conditions. In this pilot study, we investigated oxidation–reduction potential (ORP) and UV absorbance of 0.2% aqueous lactose solutions prepared from lactose powders with different pretreatment histories: Active water, Native water, and untreated control. Samples were exposed for 30 min to three static magnetic field conditions: weak geomagnetic field (~4 µT), ambient geomagnetic field (~30 µT), and elevated static field (~750 µT). UV/VIS spectroscopy was performed in the 200–400 nm range, with particular focus on the deep-UV absorption maximum near 200 nm. The strongest differentiation between pretreated samples and control occurred under weak geomagnetic conditions. In this weak-field regime, pretreated lactose solutions showed higher ORP values and a same-direction trend toward increased UV absorbance near 200 nm relative to untreated lactose. Across all samples, both ORP and UV absorbance decreased with increasing magnetic field strength, indicating a consistent field-dependent shift in the overall physicochemical state of the lactose solutions, particularly in redox balance and deep-UV optical response. The same-direction changes in ORP and increased 200 nm absorbance at the group level suggests that weak-field conditions may influence oxidation-related processes, potentially including the formation or stabilization of lactose oxidation products such as lactobionic acid. These findings indicate that lactose-containing aqueous systems may be sensitive to both pretreatment history and low-intensity magnetic environments, with potential implications for pharmaceutical formulation stability, quality control, and biotechnological reproducibility.
1. Introduction
Water and aqueous solutions are highly responsive systems whose measurable properties are dictated not only by their primary chemical composition but also by a complex “processing history”. This history includes factors such as prior physical treatment, dissolved gas dynamics, interfacial effects, and exposure to external physical fields. Among these, static magnetic fields (SMFs) have attracted recurring interest because even low-intensity fields can alter transport processes, redox balance, and the organization of water at molecular and supramolecular levels [1,2,3]. Research by Konovalov, Ryzhkina, and Novikov has demonstrated that SMFs can also influence the formation of “nanoassociates”—complex supramolecular structures that modify the physicochemical profile of aqueous systems even at high dilutions [4,5,6].
Since these effects are often subtle, they raise fundamental questions regarding the reproducibility of aqueous responses to varying field strengths. Most studies focus either on high-intensity fields or specialized industrial systems [7]. Few studies have directly compared aqueous samples across a gradient of low-to-moderate intensities—specifically comparing weak geomagnetic conditions, the geomagnetic background, and moderately elevated static fields within a single experimental design [8]. Such comparisons are crucial for gaining a deeper understanding of the interaction between various electromagnetic fields and water; a weak field reduces the ubiquitous environmental background, while comparing it to stronger fields reveals whether the system’s response is monotonic or non-monotonic. These regimes may reveal if a solution’s sensitivity is heightened near ambient background conditions, a phenomenon often observed in the study of weak physical factors [9,10,11].
In this study, we utilized a 0.2% aqueous lactose solution as a model system. Lactose provides a ubiquitous excipient and a key component in numerous biological media. Although it lacks a strong chromophore in the 200–400 nm range, UV spectrophotometry was employed as an integral “optical fingerprint” of the solution state. Absorbance shifts in this range are interpreted as indicators of the physicochemical environment rather than changes in lactose concentration or configuration. Specifically, low-UV regions are sensitive to electronic transitions of secondary species, such as oxidation products and peroxides, as well as changes in light scattering and supramolecular organization [12,13,14].
To complement the optical data, oxidation-reduction potential (ORP) was recorded as an electrochemical readout. The electrode potential is theoretically governed by the Nernst equation [15]:
where E is the electrode potential (V), EO is the standard electrode potential (V), R is the universal gas constant (8.314 J·mol−1·K−1), T is the absolute temperature (K), n is the number of electrons transferred, F is the Faraday constant (96,485 C·mol−1), and Q is the reaction quotient.
In practice, ORP serves as an integrated measure of the balance between oxidizing and reducing species, influenced by pH, ionic environment, and dissolved oxygen dynamics [16]. If magnetic exposure alters the formation of reactive oxygen species (ROS) or hydrogen peroxide (H2O2), ORP should shift accordingly. Since H2O2 also possesses measurable UV absorptivity in the 200–300 nm range [17], a parallel directional changes in ORP and UV responses would suggest a common underlying perturbation of the solution state.
A distinctive feature of this work is also the “pretreatment history” of the lactose powder before dissolution. The powder was either left untreated or subjected to liquid-spray treatments involving physically processed waters—operationally designated as Active and Native. These designations follow nomenclature established in the works of [6,18,19,20], whose research suggests that the solid state may retain some form of imprints of physical treatments that subsequently influence the behavior of the reconstituted solution [19].
The objective of this work was to determine whether lactose solutions prepared from these differently pretreated powders display distinct ORP and UV responses across three magnetic regimes: weak geomagnetic conditions (~4 µT), the geomagnetic background (~30 µT), and moderately elevated field (~750 µT). By evaluating the parallel behavior between these shifts, we aimed to establish an empirical phenomenology for how the interaction of processing history and magnetic environment dictates the redox status of aqueous systems.
Beyond providing insight into the fundamental physical chemistry of water-solute interactions, this research carries significant implications for applied sciences, particularly in the pharmaceutical and biotechnological sectors. Given the aforementioned biological and pharmaceutical significance of lactose, understanding how its physicochemical properties are modulated by processing history and environmental magnetic fields is crucial for ensuring the long-term stability of pharmaceutical formulations. Furthermore, identifying these subtle redox and nanostructural shifts offers a pathway toward optimizing biotechnological processing and quality control, where the “memory” of pretreatment conditions—for instance, in changed hydration shells of lactose—could influence the final efficacy and safety of sensitive biochemical systems. Ultimately, this study aims to develop a reliable empirical model that demonstrates the influence of drug-sample and solvent pretreatment on the physicochemical behavior of lactose-based products. This study serves as a step toward understanding and predicting the behavior of water solution model systems in complex industrial and clinical applications.
2. Materials and Methods
2.1. Chemicals and Materials
Lactose monohydrate powder was supplied by OOO “NPF “Materia Medica Holding” (Moscow, Russia) in 30 mL polyethylene containers. The following samples were used:
- Lactose monohydrate powder pretreated with Active water.
- Lactose monohydrate powder pretreated with Native water.
- Untreated lactose monohydrate powder (Control sample).
- Distilled water (dH2O) with electrical conductivity χ ≈ 2 µS/cm was used for all solution preparations. The water was obtained from the distiller located at the BION Institute laboratory (Kambič laboratory equipment d.o.o., Semič, Slovenia). In addition, a separate distilled-water sample was measured together with the lactose samples on each experimental day and served as the internal water reference for normalization of both UV/VIS and physicochemical measurements. This internal water reference was distinct from the untreated lactose Control sample, which was used as the experimental control group in Section 3.
The experimental procedure was adapted from the methodologies described in Phenomenon of Post-Vibration Interactions [19]. The procedure consisted of the following stages:
- (1)
- Preparation of liquid media: Two liquid systems were used: deionized water subjected to controlled mechanical agitation to obtain the “Active water” fraction, and untreated deionized water serving as the “Native water” reference [19].
- (2)
- Powder pretreatment: The respective liquid media were applied to lactose powder to obtain the corresponding treated samples (Active and Native).
- (3)
- Solution preparation: Aqueous lactose solutions (0.2%) were subsequently prepared from the treated powders.
2.2. Preparation Technique of Lactose Saturated with Aqueous Solutions of Samples
Solutions used for saturation of lactose monohydrate were prepared using the crossing technology described by Petrova et al. [19]. Briefly, type 1 ultrapure water (resistivity of 18.2 MOhm × cm, SEC~0.06 μS/cm) obtained using a Milli-Q Integral 5 system (Merck Millipore, Sigma Aldrich Chimie S.a.r.l, St. Quentin Fallavier Cedex, France) was incubated for at least 1 h under ambient conditions. Thereafter, 480 mL of MilliQ in a 500 mL glass bottle (Simax, KAVALIERGLASS, a.s., Sázava, Czech Republic) was placed in direct contact with a sealed 60 mL borosilicate glass vial (Glastechnik Gräfenroda GmbH, Geratal, Germany) containing 50 mL of ultrapure water. Both vials were vortexed using an IKA MS 3 basic vortex mixer (with MS 1.21 platform, IKA-Werke GmbH & Co. KG, Staufen, Germany) at 3000 rpm for 10 s, followed by a 1 min incubation in close proximity at room temperature (22 ± 3 °C). The treated water was then designated as zero vibrational iteration (“I0”), and the source vial was removed. Sample “I1” (vibrational iteration #1) was subsequently obtained by placing the 500 mL glass bottle containing 480 mL of “I0” next to another 500 mL glass bottle containing 480 mL of fresh ultrapure water, repeating the same 10 s vortexing and 1 min co-incubation protocol. This sequential sample preparation process was continued to prepare the remaining water samples (I2–I7), with each subsequent sample being prepared using the previous iteration as the source.
The samples were classified into Active and Native fractions by a combination of the analytical methods (conductometry, radiometry, and THz spectroscopy), as described by Petrova et al. [19]. If the analysis results showed no statistically significant deviation from the initial Milli-Q water, the sample was designated as “Native water”. Conversely, if significant differences were demonstrated across all methods (exceeding 5% for conductometry and THz spectroscopy; 10% for radiometry), it was considered “Active water”.
The prepared aqueous sample was mixed with 95% ethyl alcohol to obtain a 36.7% aqueous-alcoholic solution. This mixture was applied to lactose monohydrate (SuperTab 30 GR, DFE Pharma GmbH & Co. KG, Nörten-Hardenberg, Germany) at a ratio of 1 kg of solution per 5 kg of lactose using a fluidized bed processor. During this process, the solution was sprayed onto lactose particles suspended in a stream of heated air under controlled parameters (powder temperature ≤ 40 °C, standard atmospheric pressure). This technique ensured that finely dispersed droplets of the liquid were uniformly deposited onto the lactose carrier particles and subsequently dried under a gentle thermal regime. The production of all solutions and powders was conducted in a Class D cleanroom environment (ISO 14644-1:2015 standard [21]).
2.3. Preparation of Lactose Solutions
A 0.2% (w/v) lactose solution was prepared by dissolving lactose powder in distilled water (dH2O BionLab) under identical conditions for all samples. Solutions were freshly prepared before each experiment and allowed to dissolve completely without the use of magnetic stirring.
2.4. Magnetic Field Exposure
Before the main experiments, the thermal effects of the Helmholtz coil system were tested. Preliminary measurements showed that operation at 900 µT produced an approximately 1 °C increase in the air temperature adjacent to the coils after 30 min of exposure. In contrast, no measurable temperature increase was observed at 750 µT during a 30 min exposure period. Therefore, the exposure conditions for the present study were set to 750 µT for 30 min to avoid thermal artifacts and ensure that the measured effects were attributable to magnetic field exposure rather than heating.
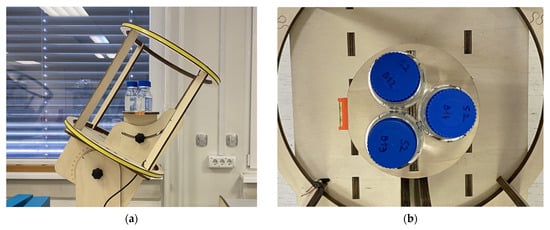
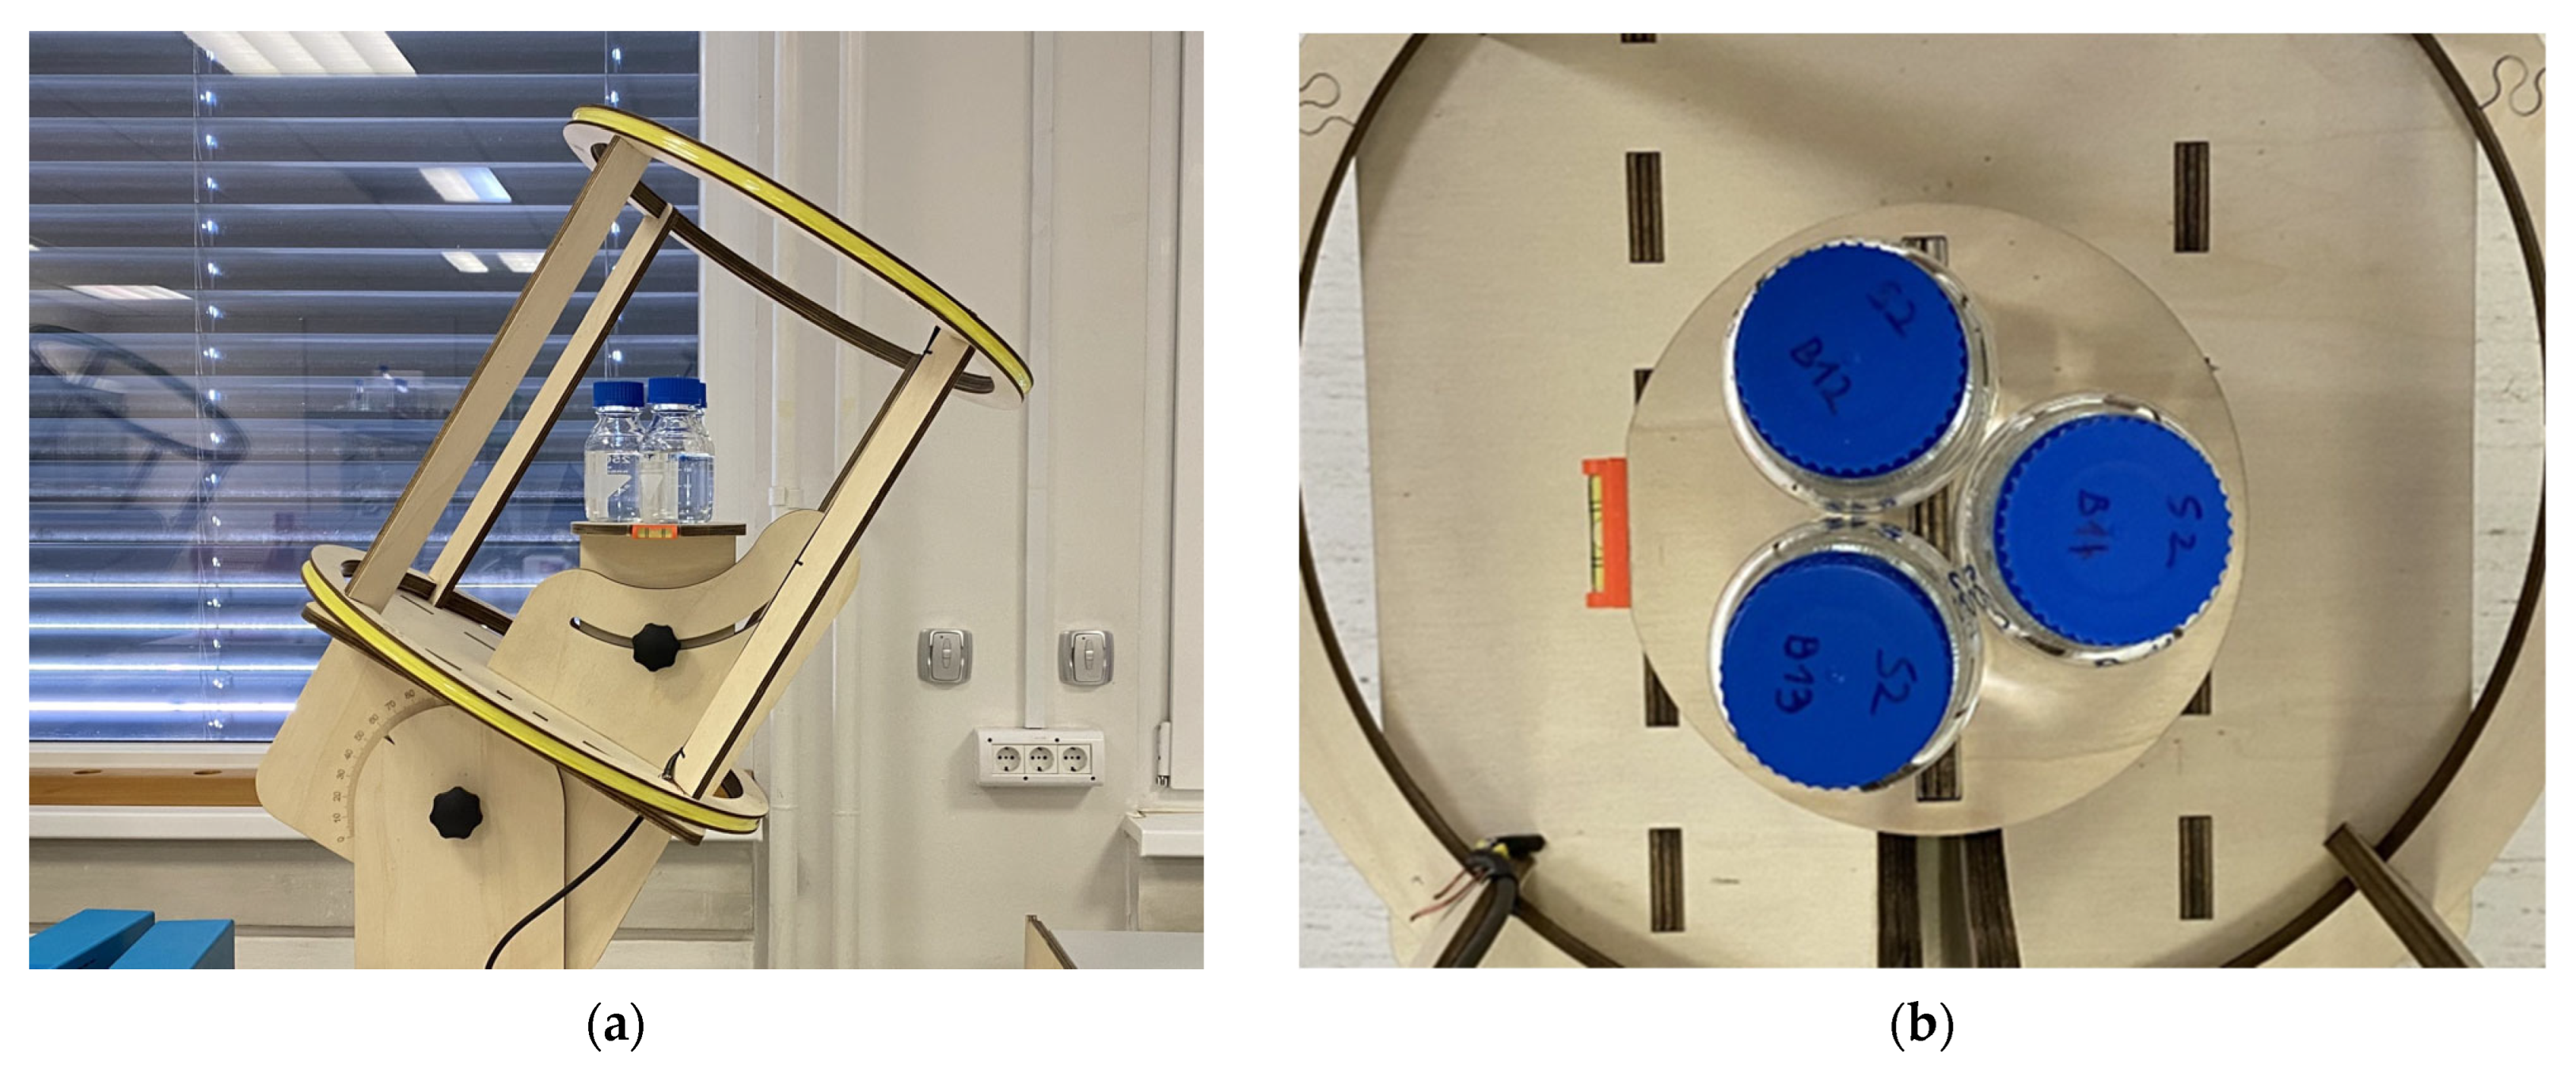
Three static magnetic field conditions were applied: weak, geomagnetic, and elevated (strong) field strength. The weak and strong fields were generated using a pair of Helmholtz coils (Figure 1a,b), ensuring a high degree of field homogeneity. For geomagnetic conditions, the same setup was used with the coils switched off. To achieve the weak-field (~4 µT) condition, the Helmholtz coils were used to compensate (nullify) most of the ambient geomagnetic field. Conversely, the strong field (~750 µT) was achieved by augmenting (amplifying) the geomagnetic field along the same vector.
Figure 1.
(a) Schematic illustration of sample placement within the Helmholtz coil system, aligned with the geomagnetic field vector. (b) Arrangement of three sample bottles positioned equidistantly to ensure a homogeneous field distribution.
Magnetic field strength was measured using a Vernier Magnetic Field Sensor (Vernier Software & Technology, Beaverton, OR, USA), with a typical resolution of 0.0002 mT in the ±0.32 mT range and 0.004 mT in the ±6.4 mT range.
Samples were exposed to the magnetic fields for 30 min under the following conditions:
- Weak field (4 µT ± 1 µT).
- Geomagnetic field (~30 µT).
- Strong field (750 µT ± 1 µT).
2.5. Experimental Design
Measurement Protocol
On each experimental day, fresh 0.2% solutions of each lactose sample type were prepared separately in distilled water (dH2O BionLab) and transferred into separate identical bottles. For each sample type and magnetic-field condition, six separate bottles containing the same freshly prepared solution were used. Because three bottles could be positioned in the exposure system at once, the bottles were processed in two sets of three. Each set of three bottles was exposed simultaneously for 30 min under the selected magnetic-field condition.
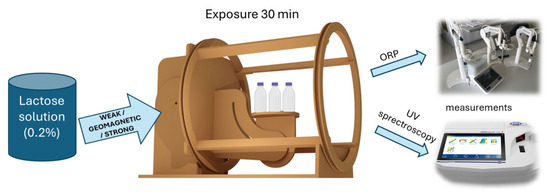
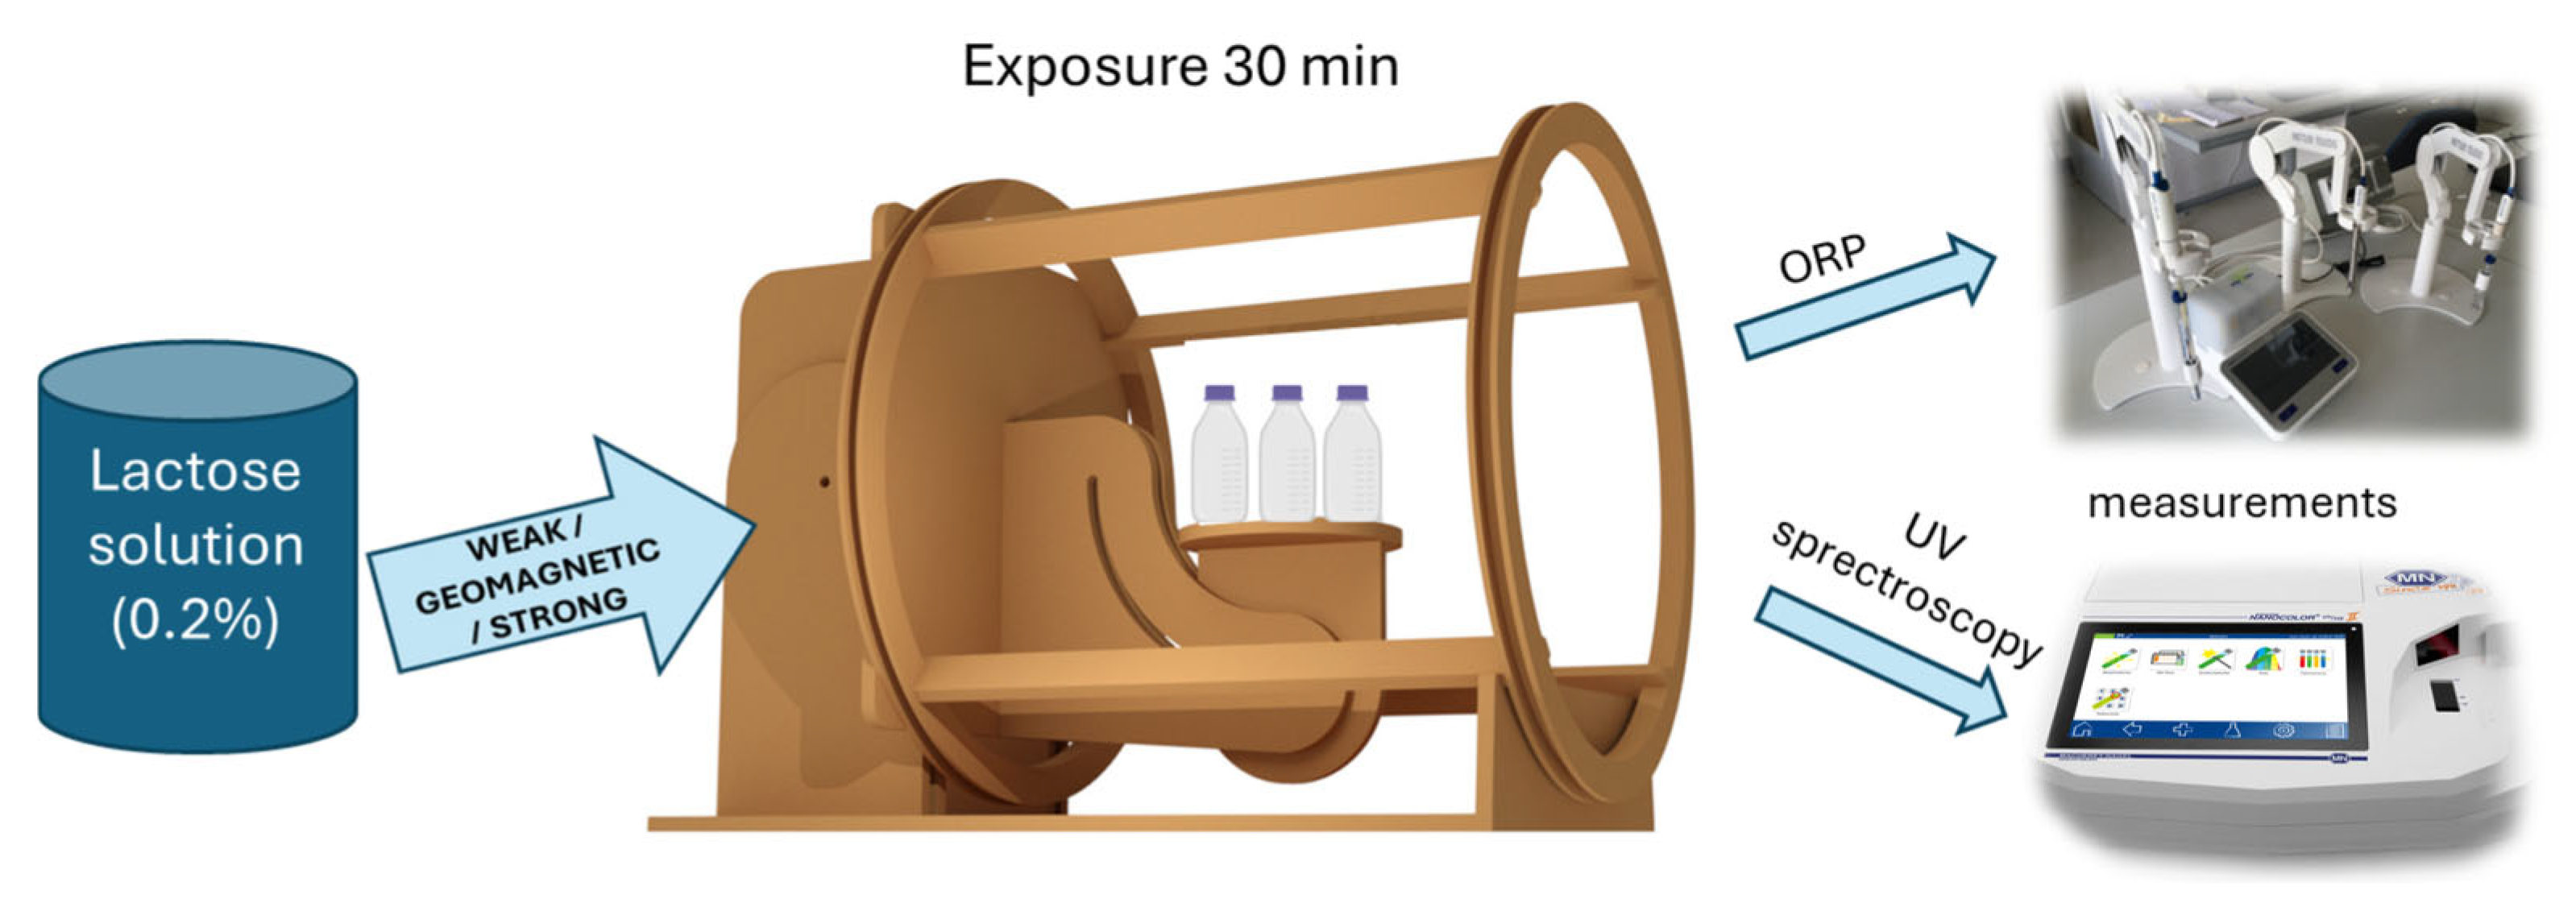
During each 30 min exposure, the magnetic-field strength was monitored and maintained at the target value by adjusting the coil current through the Programmable DC Power Supply ((0–30 V 0–10 A) 110 V Input High Precision 4-Digit Multiple Protection). After exposure, the samples were transferred immediately for ORP and UV/VIS measurements; measurements were initiated with minimum delay, typically within a few minutes after removal from the magnetic-field exposure system (see Figure 2).
Figure 2.
Schematic representation of experimental workflow. The Helmholtz coil and sample bottles are shown to indicate their role in the experimental sequence (sample exposure between coils), not their actual physical positioning.
The bottles were measured according to a standardized interleaved sequence: three bottles of one sample type were measured sequentially, followed by another sample type, and then the remaining three bottles of the first sample type. Thus, the six measurements obtained on the same experimental day represented separate bottle-level within-day replicates, not repeated readings from a single bottle. Independent experimental replicates were defined as separate fresh sample preparations performed on different experimental days. Therefore, n = 18 per sample, and the magnetic-field condition refers to six bottle-level measurements obtained on each of three independent experimental days.
2.6. Physicochemical Measurements
We employed the physicochemical properties of Lactose Solutions by measuring ORP and UV spectroscopy at 200–400 nm.
2.6.1. ORP
ORP was measured using Mettler-Toledo SevenExcellence™ S470 (Greifensee, Switzerland), with an InLab Redox electrode. ORP values were recorded using the instrument’s automatic endpoint detection feature, which ensures that data is captured only after the signal reaches a predefined stability criterion. Temperature was monitored simultaneously to ensure measurement validity. Each measurement was performed in a separate beaker. Measurement accuracy was ±0.1 mV.
2.6.2. UV Spectroscopy
UV absorption spectroscopy was performed using a Nanocolor® UV/VIS II spectrophotometer (Macherey-Nagel, Düren, Germany), wavelength range 190–1100 nm, with a 50 mm quartz cuvette. Accuracy was ±1 nm (wavelength) and 0.003 relative absorption.
The data presented here focus on the 200–400 nm range, which encompasses the bands of UV absorption of interest.
2.7. Sample Handling Before UV Analysis
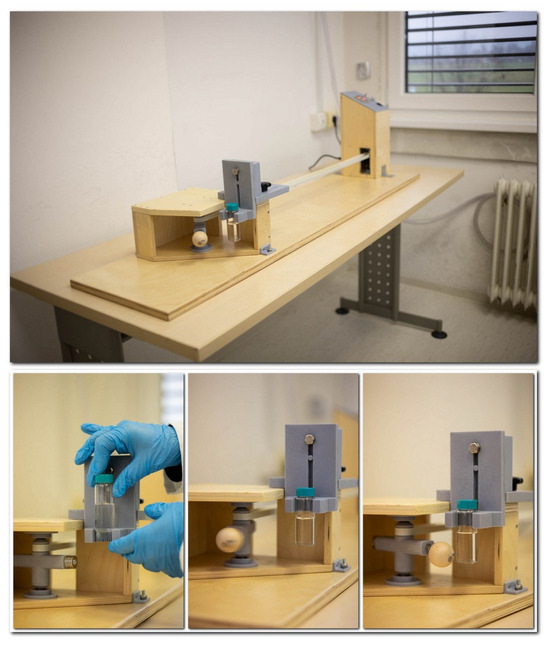
Before UV measurement, all solutions were diluted 1:1 with 96% ethanol (final lactose concentration 0.1%) to obtain a ~50% ethanol solution, selected based on its favorable UV absorption properties reported in the literature [22]. All measurements were performed in dedicated cuvettes. A reference solution consisting of deionized water and 96% ethanol in a 1:1 ratio was used to zero the instrument and correct for background. The samples were then subjected to 15 taps on the 40 mL vial using an automated tapping device at ~4 Hz (Figure 3). The reference solution was deliberately not subjected to the tapping procedure to avoid introducing any tapping-induced change in the reference baseline used for blank correction.
Figure 3.
Automated tapping device (knocker) used for sample preparation before UV measurement. The vial is shown inserted into the holder during operation.
Additionally, standardized mechanical agitation was performed on glass bottles prior to measurement by striking 15 times with a mallet shaker at the center from the side. Estimated force: ~0.04 N at 2 Hz. This method has been previously described in references [23,24,25].
2.8. Blinding Procedure
The experiment was conducted under blind conditions with regard to the identity of the samples. Samples were randomly labeled (A–D), and the lab technician responsible for exposing them to the magnetic field handled the vials exclusively in accordance with these labels. However, the lab technician could not be blinded to the magnetic field conditions, as active adjustment and monitoring of the Helmholtz coil settings were required. To minimize potential bias, the exposure duration, target magnetic field strength, sample position, transfer procedure, and measurement sequence were predetermined and standardized. ORP and UV/VIS measurements, as well as data analysis, were performed without knowledge of the samples’ identities. The sample labels were not revealed until after the statistical analysis was completed.
2.9. Statistical Analysis of the Results
Statistical significance was evaluated using the Wilcoxon signed-rank test. Where appropriate, normality was assessed and parametric tests applied. Effect sizes were estimated using Cohen’s d, and all analyses were performed via pairwise comparisons. The resulting p-values were subsequently corrected for multiple comparisons using the False Discovery Rate (FDR) approach via the Benjamini–Hochberg procedure, with the target false discovery rate set to q = 0.05. Statistical significance was defined as an FDR-adjusted p-value < 0.05, while FDR-adjusted p-values between 0.05 and 0.10 were interpreted as statistical trends. Variability between samples was assessed using the median-centered Levene’s test, corresponding to the Brown–Forsythe variant of Levene’s test. For these variability analyses, statistical significance was defined as p < 0.05, while p-values between 0.05 and 0.10 were interpreted as statistical trends.
Normalization was applied to reduce day-to-day baseline variation. A separately measured distilled-water sample served as the internal water reference for normalization in both UV/VIS and ORP measurements. This internal water reference was measured together with the lactose samples on each experimental day and was distinct from both the UV/VIS instrument blank and the untreated lactose Control sample used for statistical comparisons. Because of the two different types of data (in UV/VIS, the difference from the reference can yield a result of 0, or positive or negative values; whereas in ORP, only positive values occur), we had to use two different approaches to normalization. In the first UV/VIS case, we selected the average value from the control of the first experiment (labeled C1). We then calculated the difference between this value (C1) and the average value of the subsequent series (C2, C3, etc.) and added this difference to all values within those series.
In the second case (ORP measurements), we normalized the values within each data set by dividing them by the average control value of the parallel measurements.
3. Results
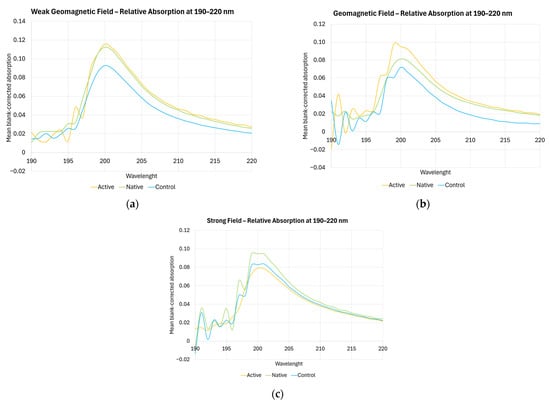
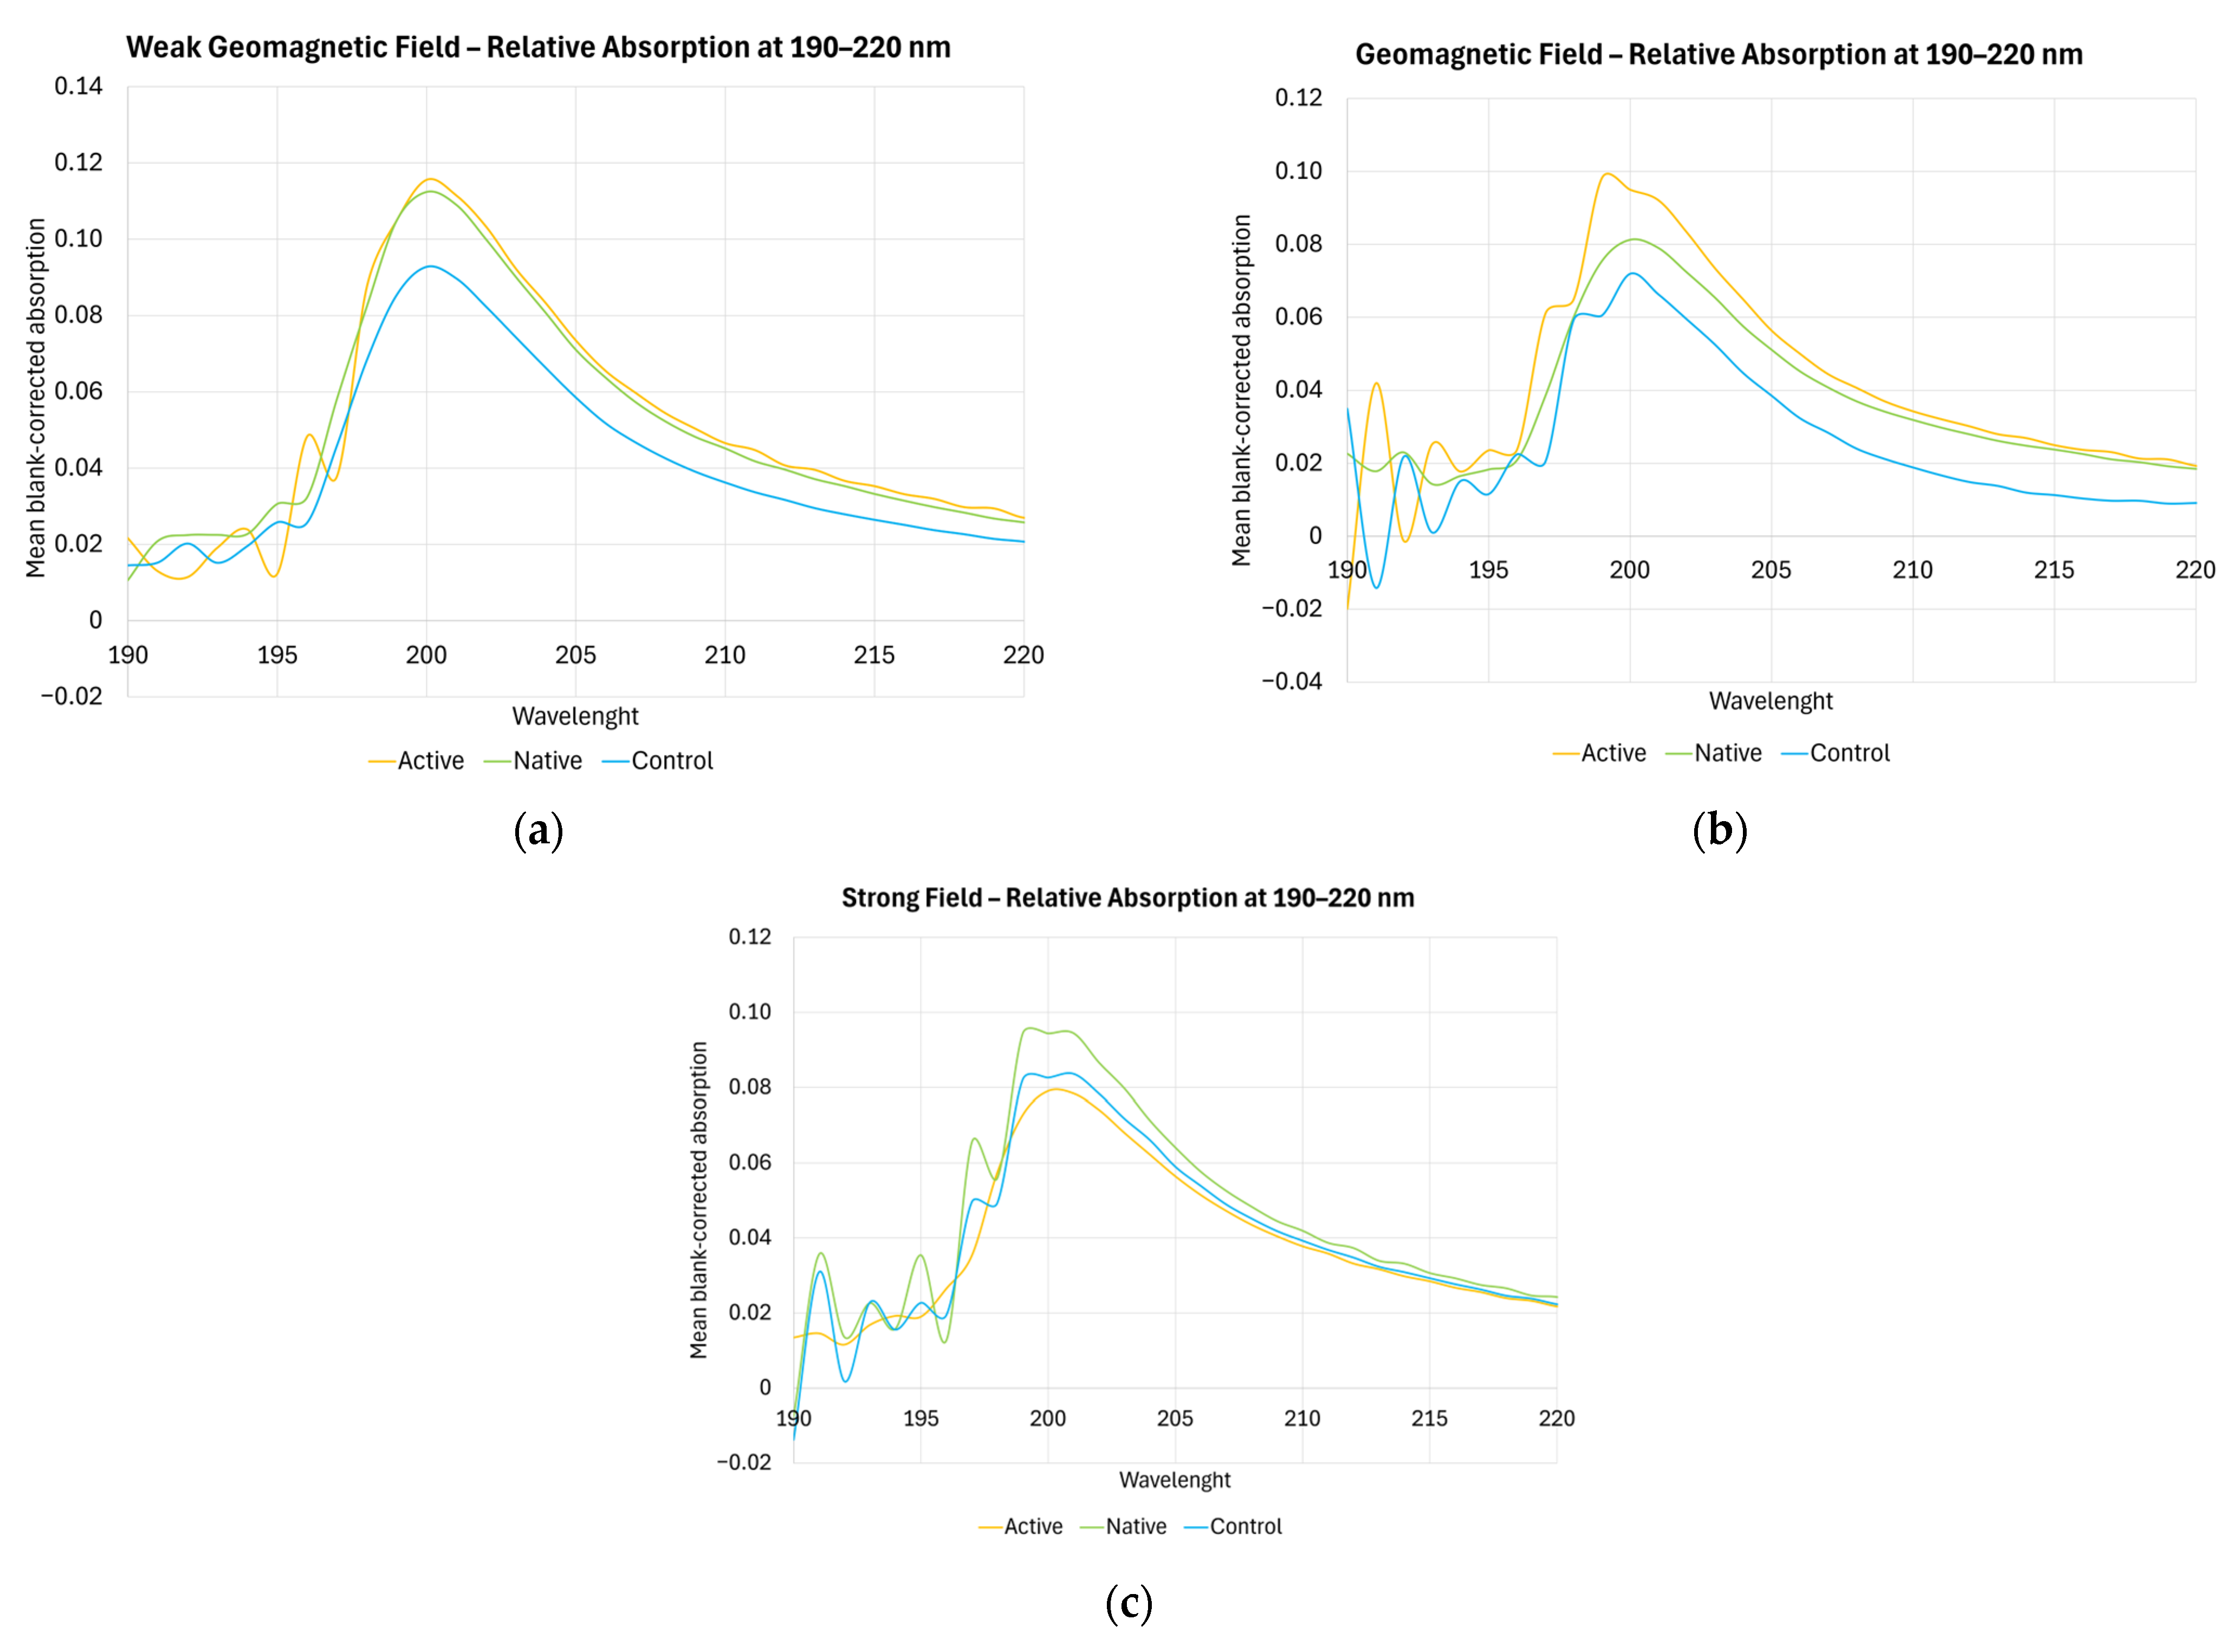
The general optical characteristics of lactose solutions are shown in Figure 4. The UV absorption spectra for all samples are characterized by a dominant deep-UV absorption maximum near 200 nm. In the weak-field condition (~4 µT, Figure 4a), both pretreated lactose preparations (Active and Native) showed numerically higher absorbance at this maximum than the untreated Control. This finding pattern was consistent with a trend toward enhanced deep-UV absorption under weak-field conditions, although the corresponding UV differences did not reach statistical significance after FDR correction. It is noteworthy that in the strong-field condition (~750 µT, Figure 4c), this ordering was no longer observed; the curves showed a different separation pattern, and the control was no longer minimal. In the geomagnetic field (Figure 4b), the situation was somewhat intermediary.
Figure 4.
UV absorbance spectra of lactose samples—Active water (orange), Native water (green), and Control (blue)—under three static magnetic field conditions: weak (a), geomagnetic (b), and strong (c). The y-axis shows mean blank-corrected absorbance values after instrument zeroing with a reference solution consisting of deionized water and 96% ethanol in a 1:1 ratio. For each sample and magnetic-field condition, each spectral line was calculated by averaging 18 individual spectra at each wavelength; these 18 measurements consisted of six bottle-level measurements on each of three independent experimental days. The spectra illustrate the reduction in absorbance near 200 nm with increasing magnetic-field strength. Statistical significance between groups was first evaluated using standard inferential methods, including the Wilcoxon signed-rank test where applicable. Correction for multiple testing was then performed using the Benjamini–Hochberg procedure to control the false discovery rate (FDR).
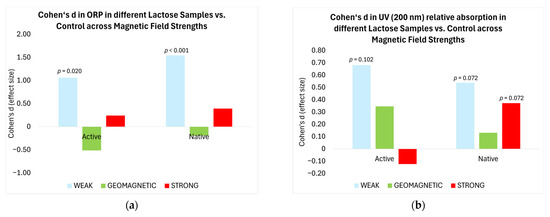
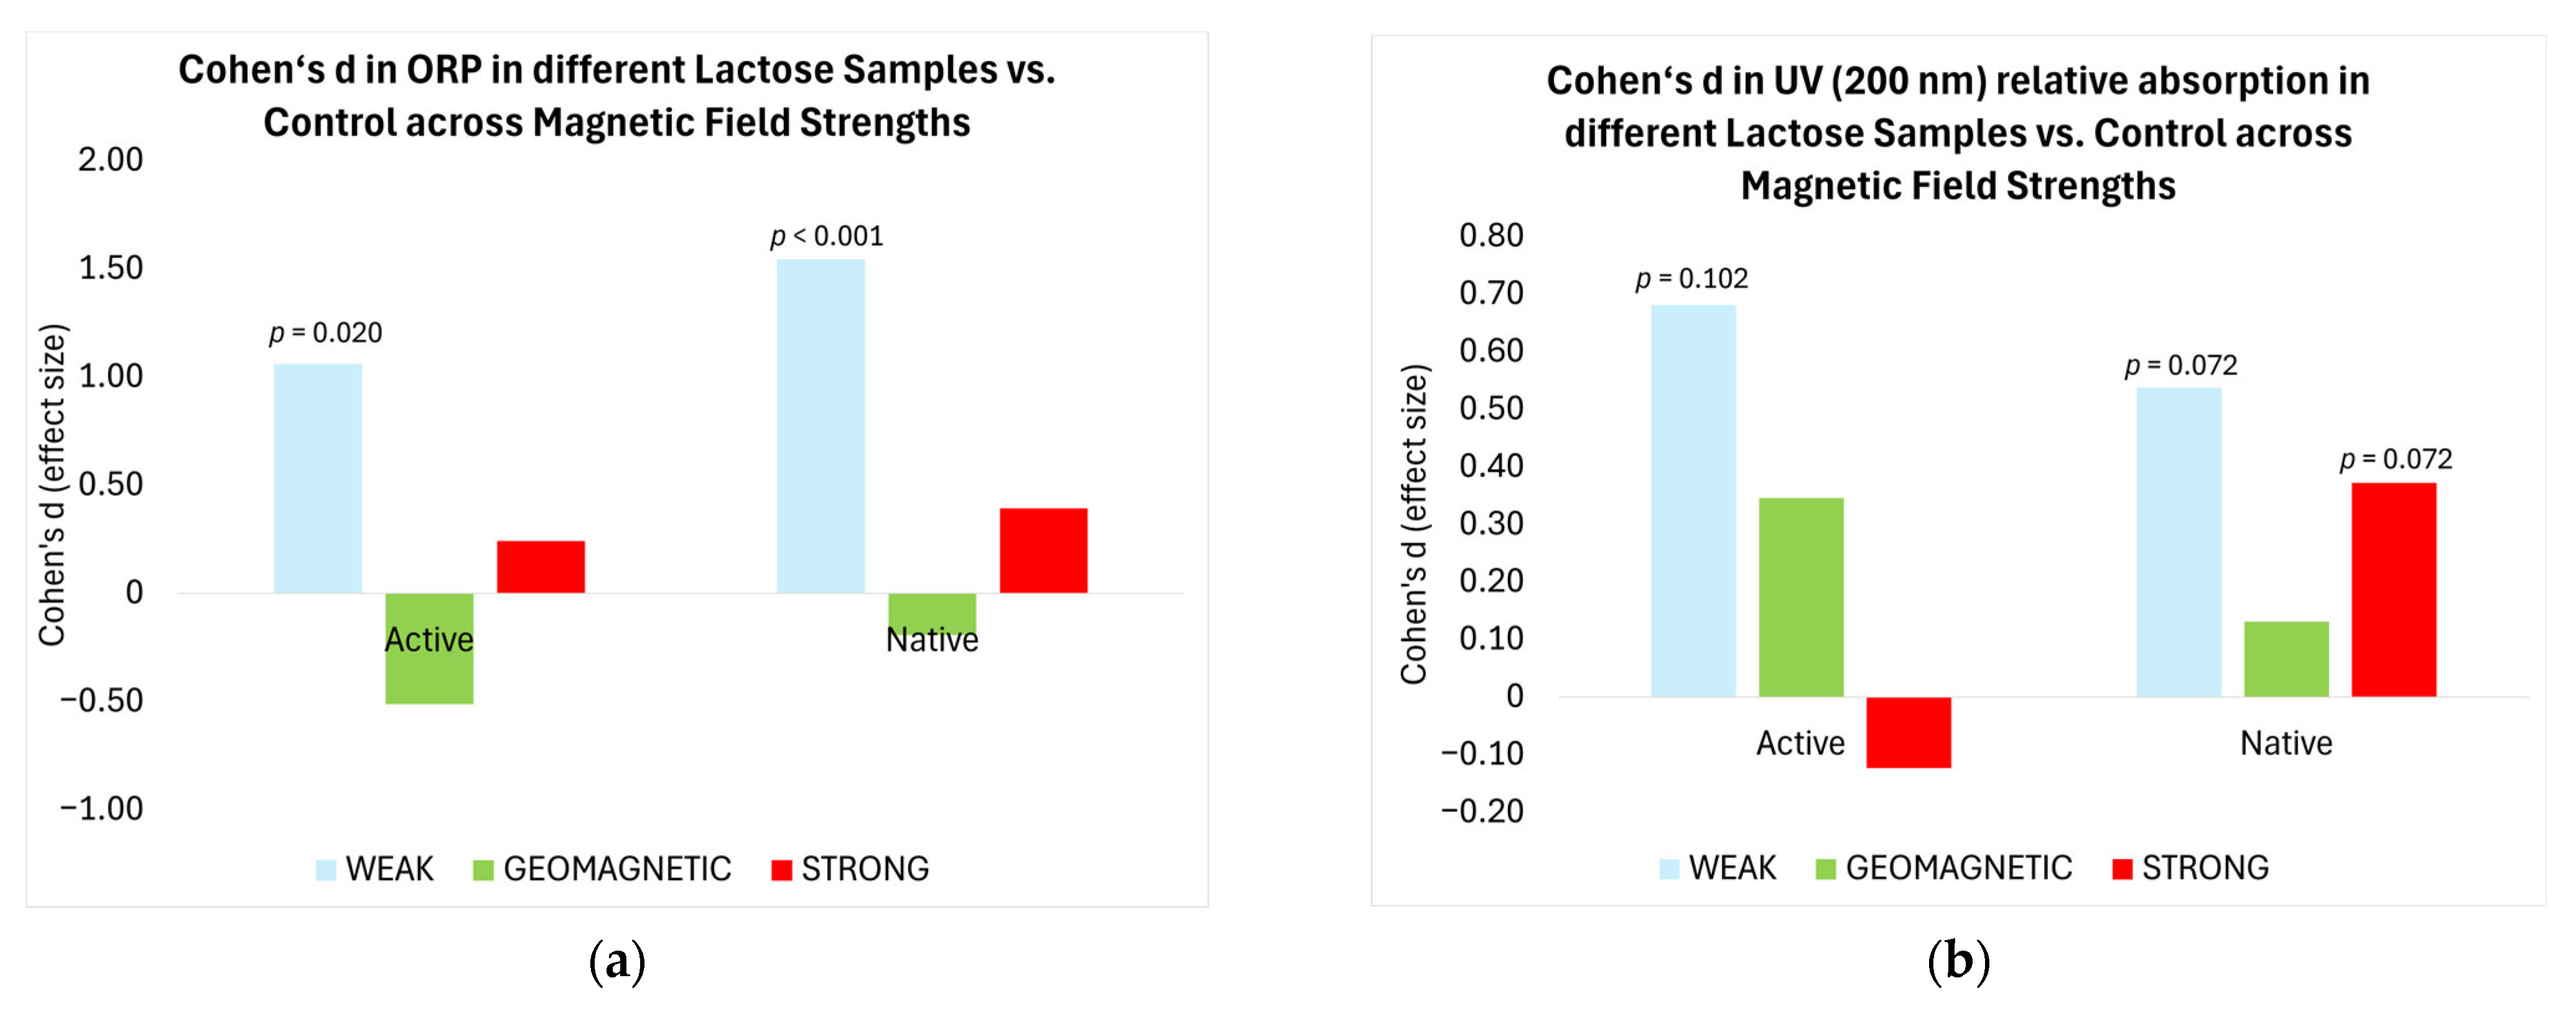
Significant differences between the treated samples and the untreated lactose Control are also evident in the ORP measurements, as shown in Figure 5a. Effect sizes are expressed relative to the untreated lactose Control. The horizontal zero line represents Cohen’s d = 0, corresponding to no difference relative to the untreated lactose Control; it does not represent an absolute zero value of ORP or UV absorbance. Positive Cohen’s d values indicate higher ORP values relative to the untreated lactose Control, whereas negative values indicate lower ORP values. Figure 5a presents the effect size values and FDR-adjusted statistical significances in ORP for the Active and Native lactose samples under the three magnetic field conditions. Figure 5b shows the same parameters for the mean relative UV absorption at 200 nm relative to the untreated lactose Control.
Figure 5.
Effect size (Cohen’s d) for ORP and UV measurements of Active and Native samples relative to the untreated lactose Control (n = 18). Statistical significance is indicated by FDR-adjusted p-values (Benjamini–Hochberg procedure). (a) ORP effect sizes under weak, geomagnetic, and strong static field conditions. (b) UV absorbance (200 nm) effect sizes under the same conditions. Values represent the magnitude and direction difference from the untreated lactose Control. The horizontal zero line represents Cohen’s d = 0, corresponding to no difference relative to the untreated lactose Control; it does not represent an absolute zero value of ORP or UV absorbance.
As shown in Figure 5a, the largest and statistically significant differences are observed under weak-field conditions, showing a directionally consistent pattern with the UV absorbance response at 200 nm, although the magnitude and statistical strength of the UV effects varied between samples. In contrast to this field-dependent pattern, the results obtained under geomagnetic and strong-field conditions show reduced or even reversed effects, and they are not statistically significant. Effect size analysis of UV absorbance demonstrated that the magnitude and direction of effects under geomagnetic and strong-field conditions varied between samples and magnetic-field strengths, indicating a non-uniform interaction between magnetic fields and sample treatments (see Figure 5b).
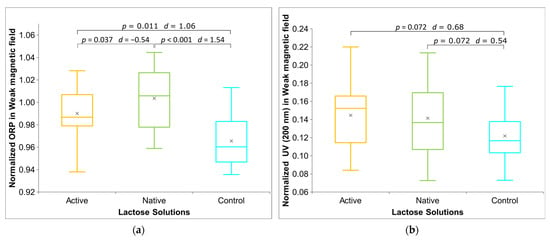
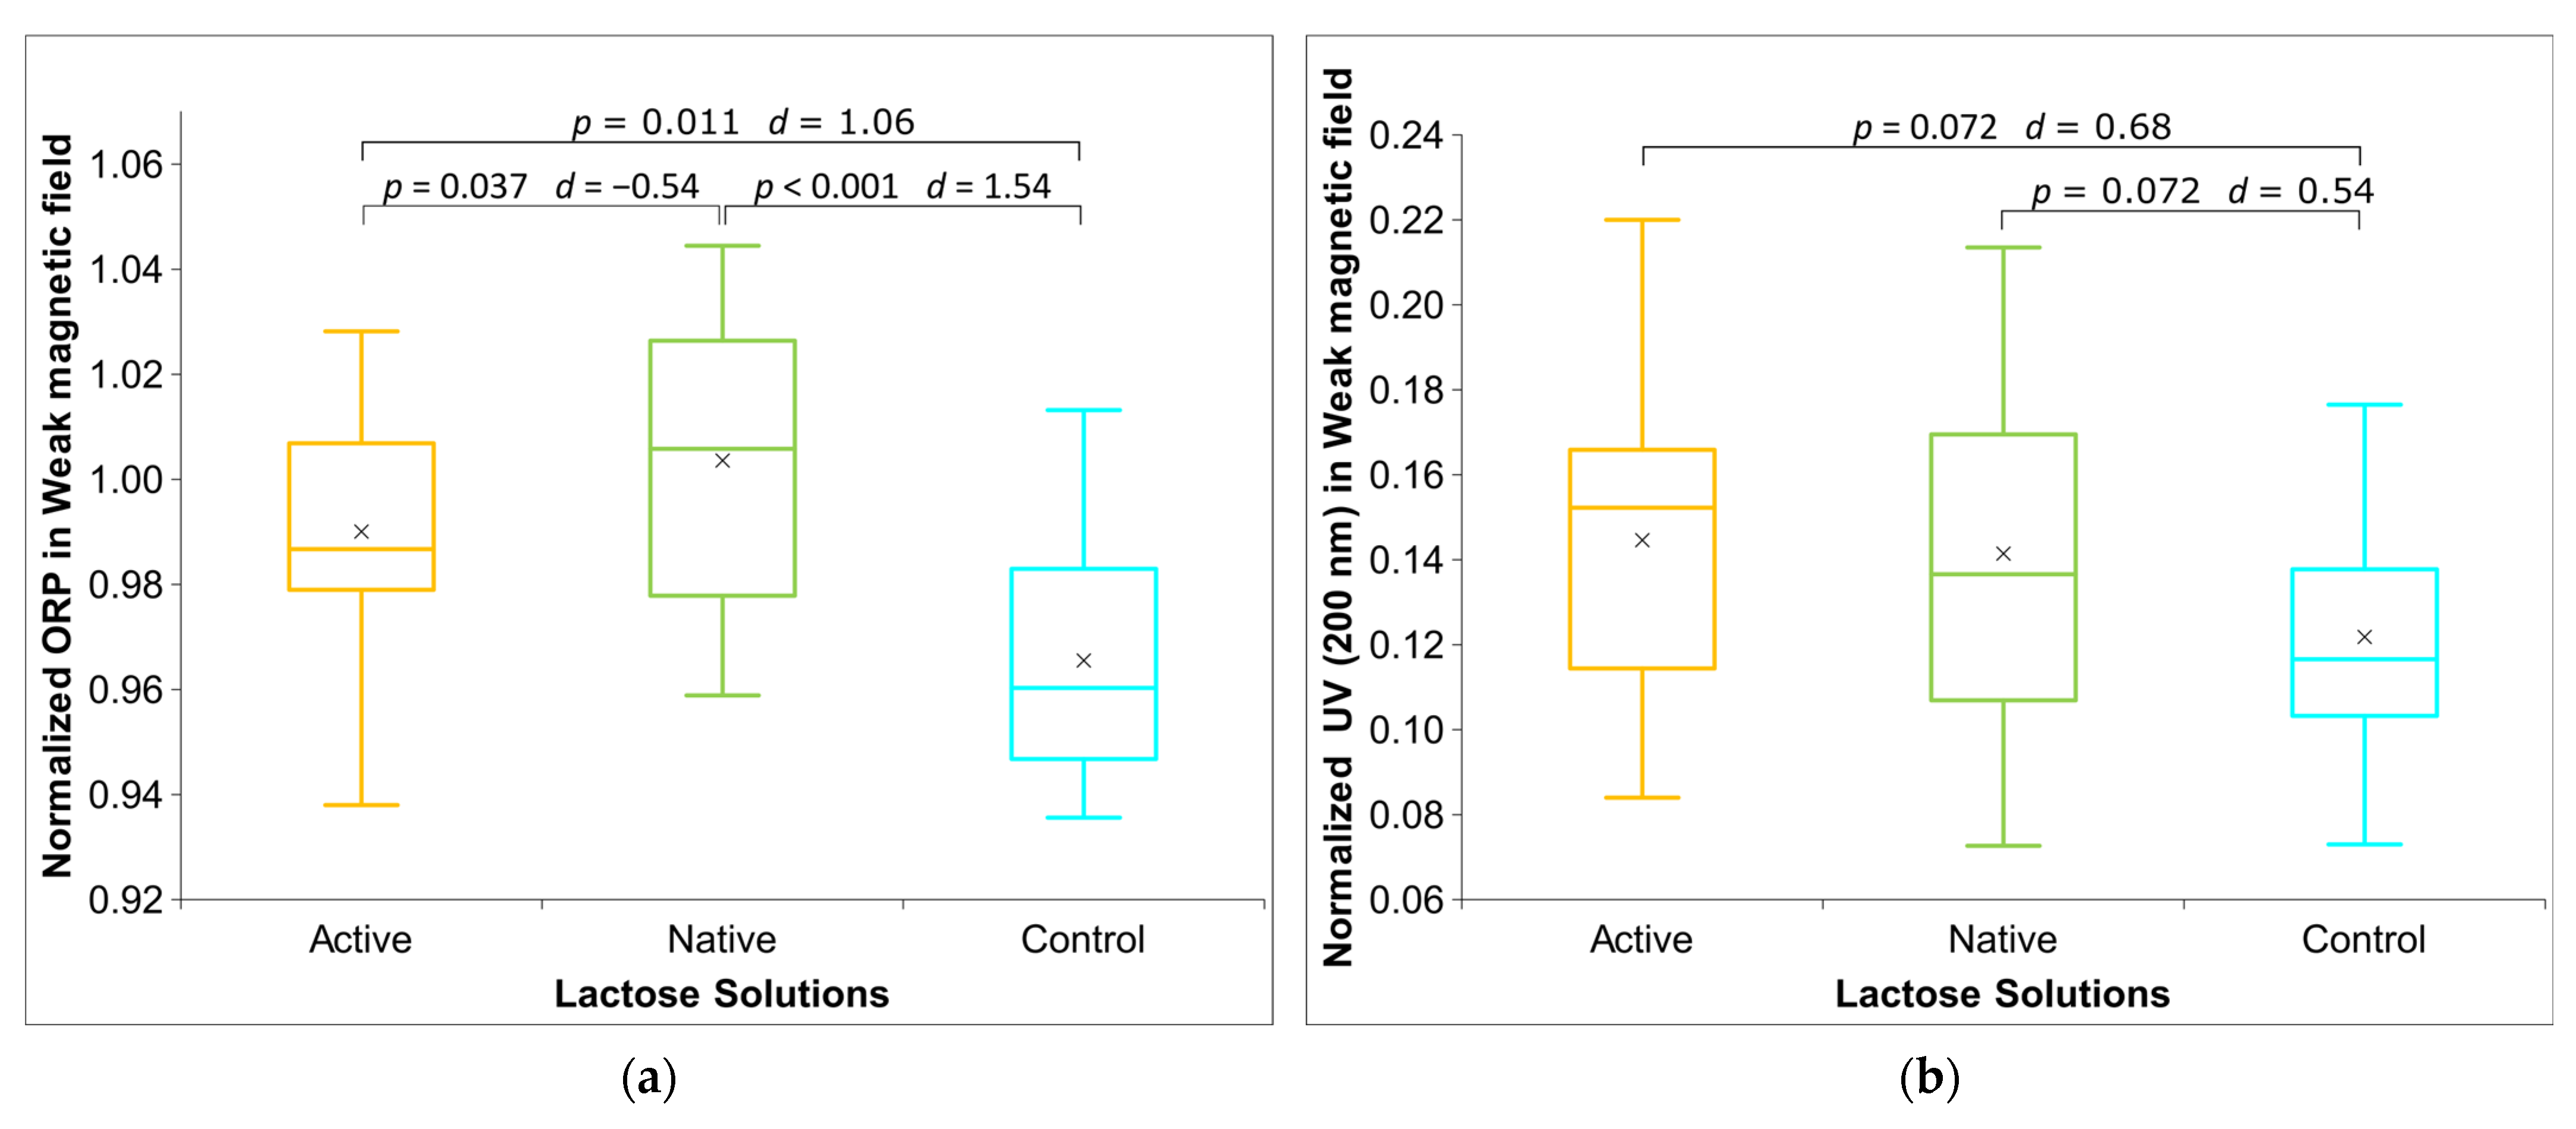
Since the effects in the weak field were very consistent, as shown in Figure 5, let’s take a closer look at them (Figure 6). Both ORP results and UV absorption (200 nm) are shown as normalized values. Focusing on ORP, among the three lactose solutions examined, the Native sample exhibits the highest average ORP value, followed by the Active sample, which shows comparable values. Control sample displays the lowest ORP response under weak-field conditions. Notably, the comparison between Native and Control samples reveals the largest effect size (Cohen’s d = 1.54, p < 0.001), indicating a pronounced difference in oxidation–reduction potential between these two samples, one of them being control (i.e., a non-pretreated lactose solution). The observed difference in ORP responses suggests that, due to their pretreatment history, the physicochemical properties of different lactose solutions modulate their electrochemical behavior in the weak geomagnetic field. Parallel to the electrochemical measurements, the optical properties of the lactose solutions were assessed via UV absorbance in the 200 nm range under identical weak-field conditions (Figure 6b). In contrast to the ORP data, the Active sample shows the highest average UV absorbance, whereas the Control sample again showed the lowest. However, in the case of UV absorbance, these differences did not reach statistical significance after FDR correction and were therefore interpreted as statistical trends. The largest effect is observed in the Active sample vs. Control, yielding a medium effect size (p = 0.072, Cohen’s d = 0.68), while the Native sample also showed the same-direction trend relative to Control (p = 0.072, Cohen’s d = 0.54).
Figure 6.
Box plots of ORP and UV measurements for sample groups Active, Native, and Control in the weak field. (a) ORP measurements (n = 18). (b) UV absorbance (200 nm, n = 18). Statistical significance is indicated by p-values and effect sizes (Cohen’s d). The box plots display the median and interquartile range, with crosses indicating the mean values.
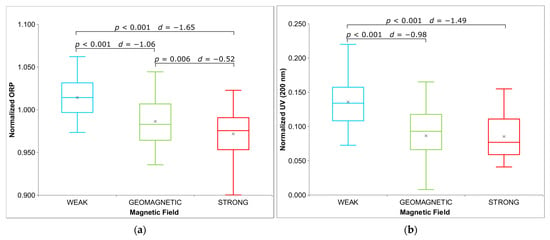
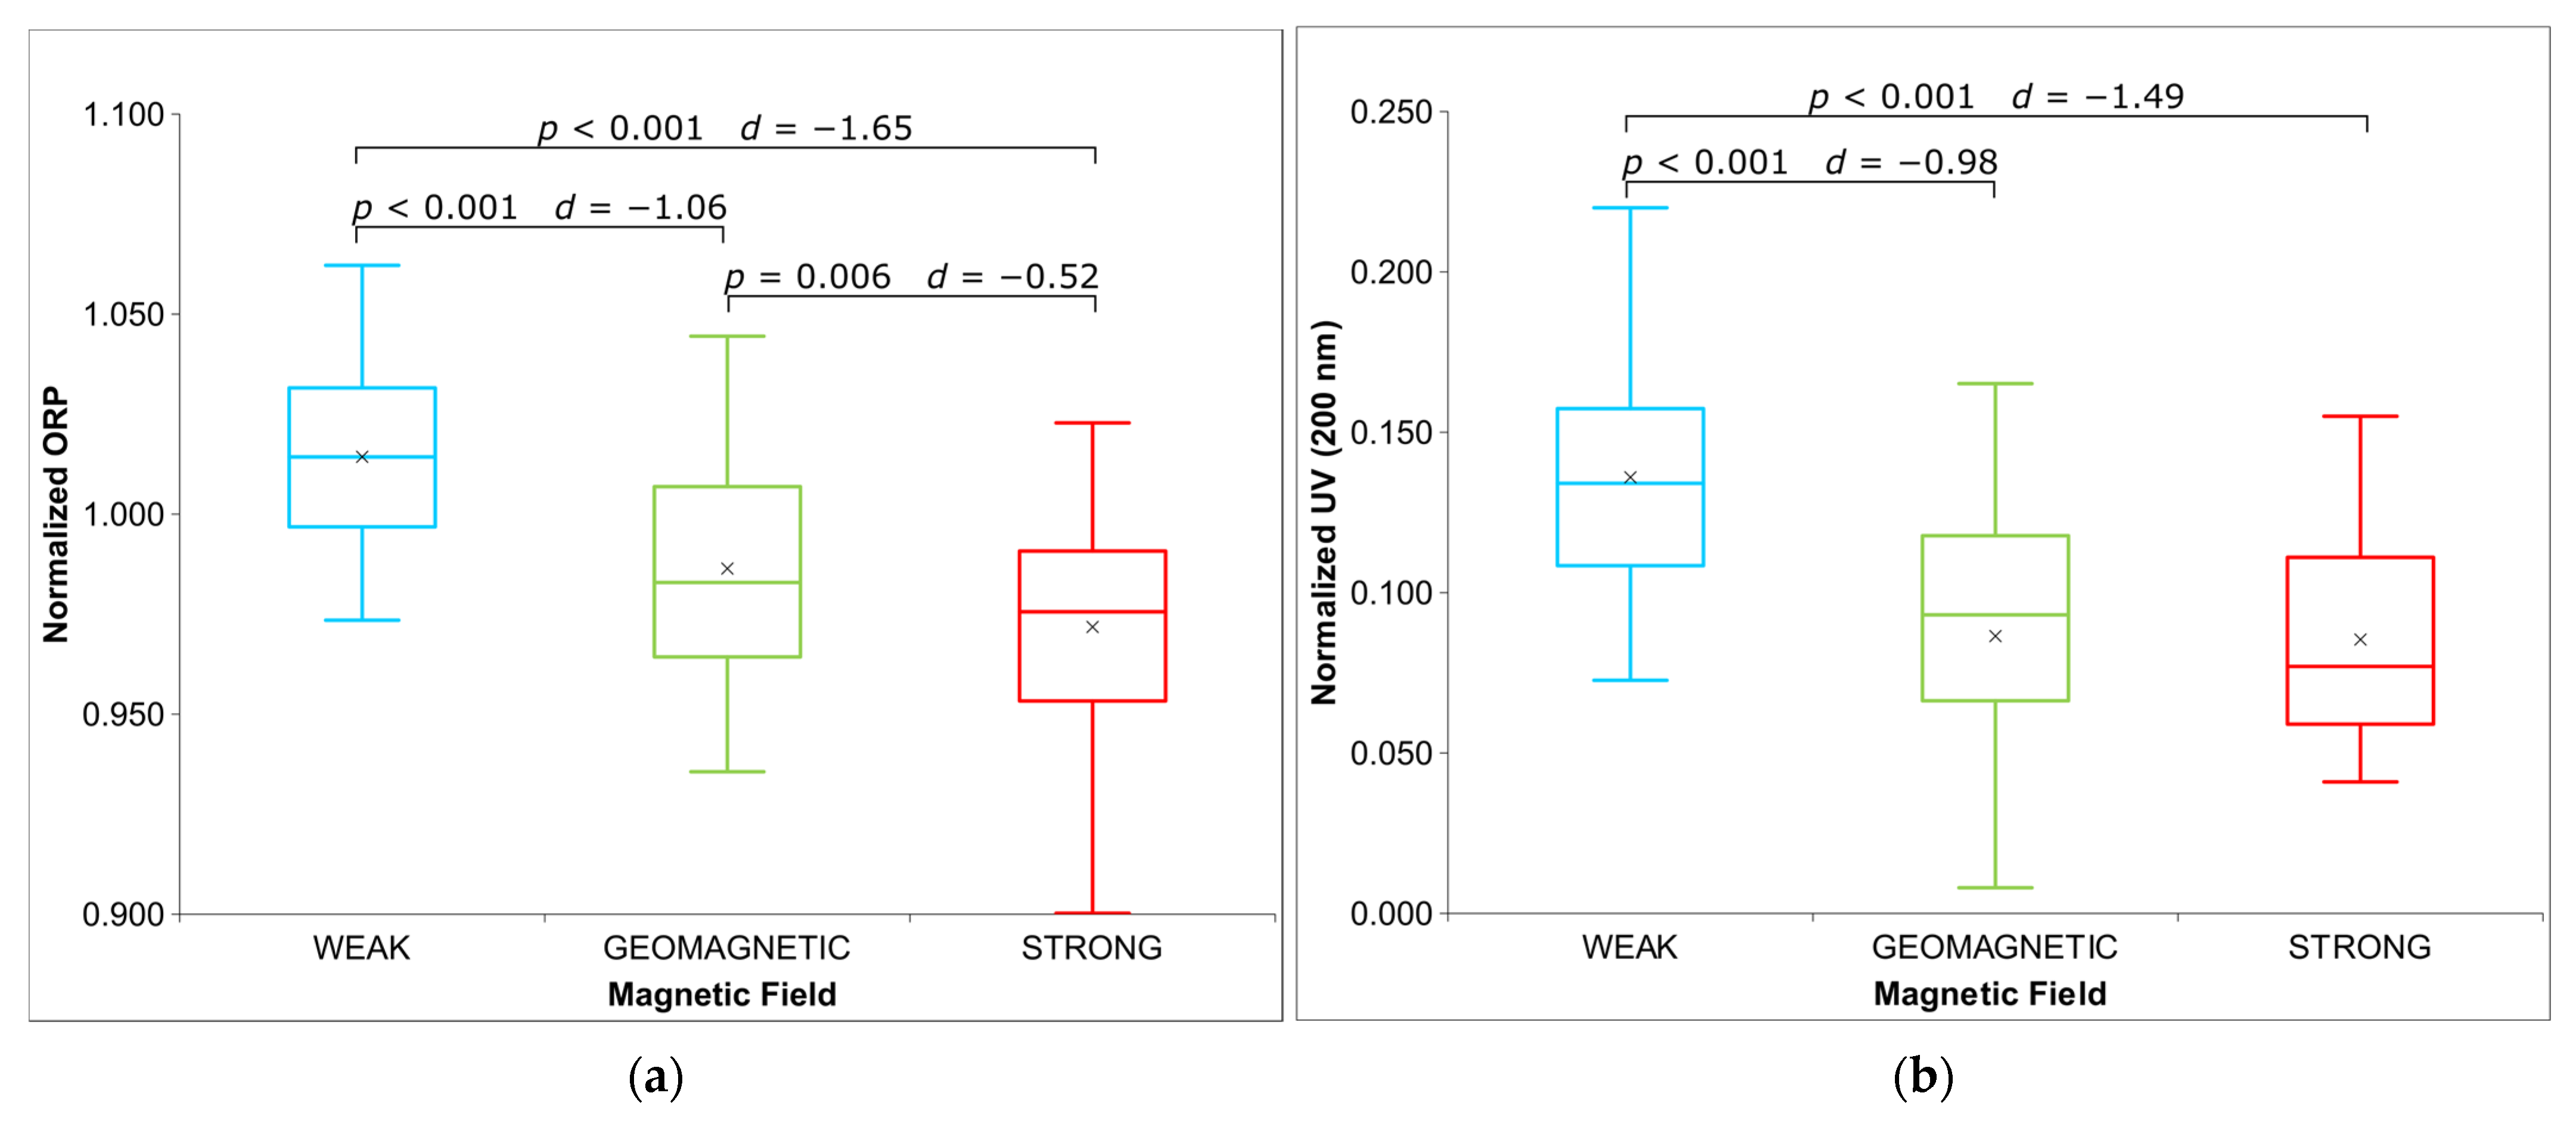
It is also worth examining the effect of magnetic fields themselves, regardless of the samples’ pretreatment history. Effect sizes (Cohen’s d) were calculated for pairwise comparisons between magnetic field conditions, always defined as the difference between lower and higher field strength (i.e., weak → geomagnetic → strong). Negative d values, therefore, indicate lower measured values at higher magnetic field strengths. As seen in Figure 7a, ORP decreases significantly with increasing static magnetic field strength. Samples subjected to the weak static magnetic field exhibit the highest oxidizing potential, while exposure to the ambient geomagnetic field and the stronger field results in progressively lower values. It can be understood as if a stronger field acts in a reducing direction. Statistical significance is observed between all three magnetic field conditions. FDR-adjusted p-values (Benjamini–Hochberg procedure) indicate significant differences between geomagnetic and weak (p < 0.001, d = −1.06), strong and weak (p < 0.001, d = −1.65), and strong and geomagnetic fields (p = 0.006, d = −0.52).
Figure 7.
Box plots of ORP and UV measurements for all samples together, Active, Native, and Control in different magnetic fields (weak, geomagnetic, and strong). (a) ORP measurements (n = 54). (b) UV absorbance (200 nm, n = 54). Statistical significance is indicated by p-values and effect sizes (Cohen’s d). The box plots display the median and interquartile range, with crosses indicating the mean values.
Similarly, relative UV absorbance decreases as static magnetic field strength increases (Figure 7b). The highest absorbance is shown in weak-field samples, with reduced values observed under geomagnetic and strong-field conditions. Statistical significance is observed between all three magnetic fields. FDR-adjusted p-values indicate differences between geomagnetic and weak (p < 0.001, d = −0.98), strong and weak (p < 0.001, d = −1.49).
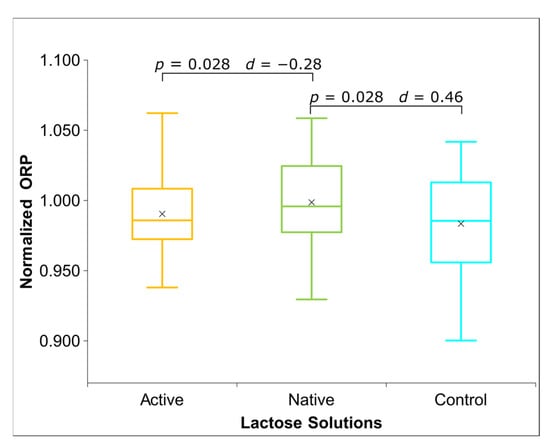
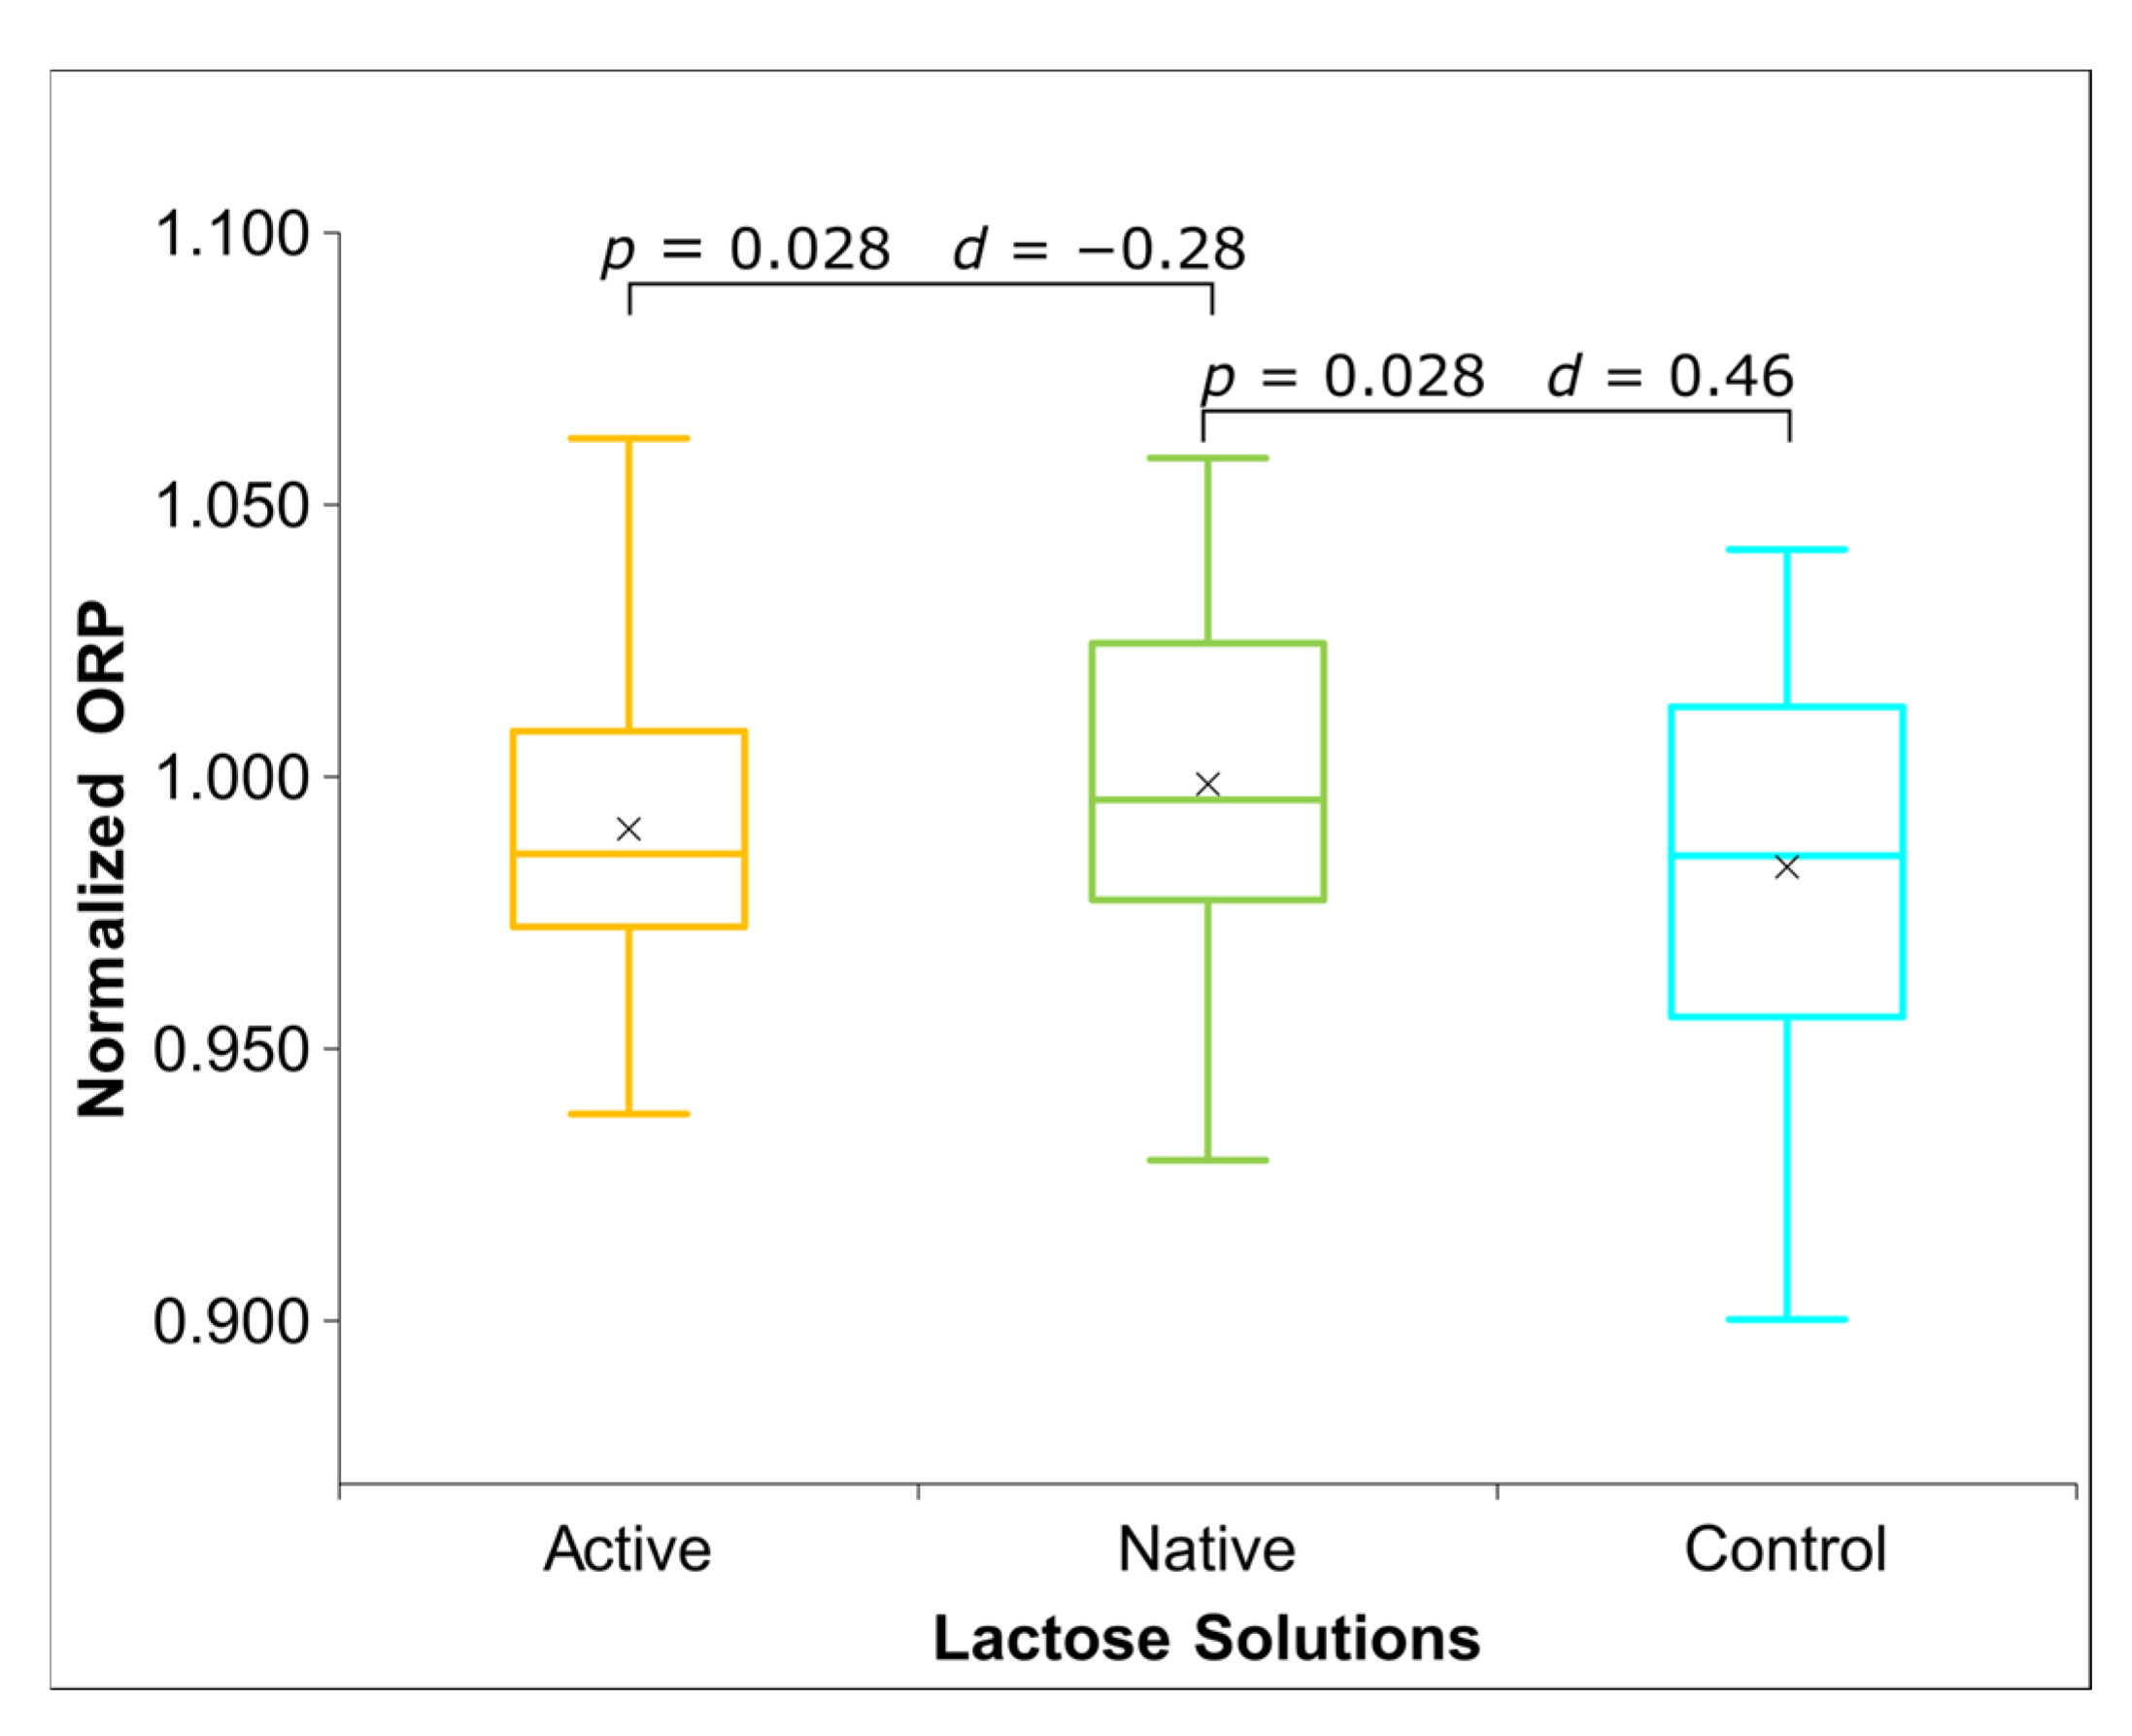
If we now turn our view to the results of the ORP and UV results across all three samples, while summarizing all three magnetic fields, the observed differences are generally smaller and less pronounced. ORP values show only limited differences between lactose solution groups and the Control (Figure 8). The Native sample shows the highest ORP values, whereas lower values are observed for the Active and control samples. Following FDR adjustment, statistically significant differences were maintained between the Native and Control samples (p = 0.028, d = 0.46), and between the Active and Native (p = 0.028, d = −0.28). Here, UV absorbance shows no statistically significant differences between groups after FDR adjustments.
Figure 8.
Box plots of ORP measurements under different magnetic field conditions (weak, geomagnetic, and strong). ORP measurements (n = 54). Statistical significance is indicated by p-values and effect sizes (Cohen’s d). The box plots display the median and interquartile range, with crosses indicating the mean values.
A noteworthy insight into the interaction between magnetic fields and sample treatments can also be obtained by analyzing the variability of the measurements (Table 1).
Table 1.
Variability of ORP and UV absorbance (200 nm) for lactose solutions under weak, geomagnetic, and strong static magnetic field conditions. Values for Active, Native, and Control represent standard deviations. Levene’s test was used to compare variability between each treated sample and the corresponding Control.
The ORP measurements show an interesting reversal: while the standard deviation values are higher for the Active and Native samples in the weak and geomagnetic field than for Control, the opposite occurs in the strong field; here, the variability for Active and Native is significantly lower than for Control. Given the variability of the UV spectroscopy results, the Control sample in the geomagnetic field showed the highest value. Also noteworthy is the relatively lowest variability (for all three fields) in the Active sample.
4. Discussion
The present results indicate that the response of lactose solutions to static magnetic fields is strongly dependent on both the magnetic regime and the pretreatment history of the lactose powder. The clearest finding is that the weak-field condition (~4 µT) produced the strongest differentiation between pretreated samples and the untreated control, whereas the geomagnetic background and the stronger field yielded smaller, inconsistent, or reversed between-sample effects. This pattern is fully consistent with the study rationale outlined in the Introduction, namely that comparison across weak, ambient, and elevated static fields may reveal non-monotonic sensitivity of water solution systems rather than a simple dose-dependent response [1,11]. The results therefore support the view that the physicochemical state of the lactose solutions is especially labile under a weak geomagnetic background, where subtle differences introduced by pretreatment become most readily detectable.
A particularly important aspect of the dataset is the same-direction, field-dependent pattern observed for ORP and UV behavior at the group level. In the weak-field condition, both pretreated samples showed the same-direction, non-significant trend toward higher absorbance near 200 nm than the untreated Control (Figure 4a and Figure 6b), and the same field condition also produced the largest ORP differences relative to the Control (Figure 6a). Across all samples combined, both ORP and 200 nm absorbance decreased progressively from weak to geomagnetic to strong field conditions (Figure 7). This parallel behavior suggests that the two readouts may reflect related aspects of a field-dependent perturbation of the solution state. Because ORP integrates the balance between oxidizing and reducing species [15,16], while the deep-UV region is sensitive to multiple non-specific contributors, including low-molecular-weight oxidation products, peroxide-related species, solvent-background effects, and changes in supramolecular organization or scattering [17], the same-direction, field-dependent changes in ORP and UV absorbance are compatible with a field-dependent perturbation of the solution state. However, these measurements do not identify the chemical species responsible for the observed changes.
The weak-field results are especially noteworthy because they point to a condition in which pretreatment history is amplified rather than masked. The Native sample showed the highest ORP under weak-field conditions and the largest ORP effect size relative to the control, whereas the Active sample showed the highest mean UV absorbance at 200 nm (Figure 5). Although the rank order was not identical for the two methods, both methods separated pretreated samples from the untreated Control in the same general direction. This partial concordance may indicate that the pretreatments do not act on a single analyte only, but on a broader oxidation–hydration ensemble in which redox-active species, low-UV-absorbing products, and water structuring change together but not necessarily to the same extent. Such a pattern is plausible for lactose solutions, where modest oxidative conversion, dissolved oxygen dynamics, and hydration-shell reorganization can all contribute simultaneously to the measured signal [12,13].
One possible, but unconfirmed, interpretation is that oxidation-related species may contribute to the observed ORP and UV changes. However, the chemical origin of the 200 nm UV signal cannot be assigned from the present data alone, because no direct chemical identification was performed in this study. The deep-UV region is sensitive to multiple contributors, including low-molecular-weight oxidation products, peroxide-related species, solvent-matrix effects associated with ethanol dilution, baseline effects, scattering, and changes in supramolecular organization. Lactobionic acid [26,27] and peroxide-related species [17] are examples of compounds that could be relevant in future targeted analyses, but their presence was not directly demonstrated here. Therefore, the enhanced absorbance near 200 nm observed in the pretreated samples under weak-field conditions should be interpreted as a non-specific optical response compatible with a field-dependent change in the physicochemical state of the lactose solutions, rather than as evidence for a specific oxidation product. The simultaneous elevation of ORP and absorbance at 200 nm under weak-field conditions is therefore informative at the phenomenological level, but it cannot distinguish between lactose oxidation products, peroxide-related species, aggregation/scattering effects, solvent-matrix effects, or broader supramolecular changes.
Another noteworthy observation is that increasing static magnetic field strength shifted both ORP and UV absorbance downward across the dataset. In ORP terms, this can be read as a progressive movement toward a less oxidizing—or relatively more reducing—solution state as field strength increases from weak to ambient to elevated conditions. Because the same directional trend was found for 200 nm absorbance, the higher fields appear not merely to erase pretreatment-specific signatures, but to move the entire system toward a different physicochemical equilibrium. The fact that the strongest field did not enhance the measured ORP/UV response argues against a simple “more field, more effect” model and instead supports a field-window or non-monotonic response [7,28], as is often discussed for weak magnetic influences on aqueous and biological systems. In such a framework, the weak field may represent a regime in which solution organization is especially susceptible to small historical differences introduced during lactose pretreatment.
The variability data (Table 1) provide an additional indication that sample pretreatment history and magnetic-field condition jointly influenced not only the mean values but also the dispersion of the measurements. In ORP, variability under the weak-field condition was similar between Active, Native, and Control samples, with no statistically significant differences in Levene’s test. The most pronounced variability differences were observed under geomagnetic-field conditions, where both Active and Native samples showed higher standard deviations than the untreated Control, and these differences were statistically significant. Under the strong-field condition, the untreated Control showed the highest ORP variability, whereas Active and Native samples showed lower variability; however, these differences did not reach statistical significance.
For UV absorbance, the clearest variability difference was also observed under geomagnetic-field conditions. In this case, the untreated Control showed the highest variability, while the Active sample showed significantly lower variability, and the Native sample showed a trend toward lower variability relative to Control. Under weak- and strong-field conditions, UV variability differences were not statistically significant. Overall, these findings suggest that the effect of pretreatment history on measurement variability was field-dependent, with the most evident variability differences appearing under geomagnetic-field conditions. This interpretation remains tentative, but it supports the broader conclusion that magnetic-field conditions can influence both the magnitude and reproducibility of the measured physicochemical response.
The study also has important limitations that should be acknowledged explicitly. First, the UV analysis was performed after dilution with ethanol and after standardized tapping (Figure 3) and agitation, whereas ORP was measured directly in the aqueous solutions. Accordingly, the same-direction behavior of ORP and UV trends is particularly interesting because it suggests that the field-dependent state induced in the original lactose solutions survives at least partly through subsequent sample handling. At the same time, this difference in preparation means that ORP and UV cannot be interpreted as two direct measurements of the same final matrix. Second, the deep-UV maximum near 200 nm (Figure 4) is chemically informative but not specific; it can reflect oxidation products, peroxide-related species, solvent-matrix effects related to ethanol dilution, aggregation or scattering effects, and changes in supramolecular organization or scattering. Third, the present design establishes phenomenology, not mechanism. Direct quantification of dissolved oxygen, hydrogen peroxide, and lactose oxidation products such as lactobionic acid will be necessary to determine whether these species contribute to the observed signal. Additional measurements addressing electrode response stability, aggregation state, and light scattering would also be required to separate chemical from physical or measurement-interface contributions. Although the observed changes may be associated with redox-related processes, alternative explanations cannot be excluded. For ORP measurements, the observed shifts may partly reflect changes in electrode–solution interfacial equilibration, dissolved-gas dynamics, ionic microenvironment, or electrode response behavior during measurement, rather than solely changes in the redox state of the sample. Similarly, changes in the UV/VIS spectra may arise from aggregation or supramolecular microheterogeneity, light scattering, solvent-matrix effects after ethanol dilution, or sample-handling effects, all of which can influence absorbance near 200 nm independently of chemical oxidation. Further studies will be needed to distinguish between these possible mechanisms.
Taken together, the data support a model in which the response of lactose solutions to static magnetic fields emerges from an interaction between pretreatment-induced solution history and field-dependent physicochemical processes. The weak field condition appears to unmask or amplify this history most strongly, yielding both elevated ORP and increased absorbance at 200 nm in pretreated samples relative to the Control. The same-direction behavior of these two observables is compatible with a field-dependent change in the physicochemical state of the lactose solutions [1,11], which may involve redox-related processes, changes in supramolecular organization, aggregation or scattering effects, solvent-matrix effects, or a combination of these factors. Future work should therefore combine the present ORP/UV approach with direct chemical assays for peroxide species and lactose oxidation products, as well as complementary measurements of dissolved oxygen, electrode response stability, aggregation state, and light scattering, to clarify which mechanisms contribute most strongly to the observed weak-field response.
5. Conclusions
This study demonstrates that both the pretreatment history of lactose powder and the strength of the static magnetic field can significantly influence the physicochemical behavior of the resulting aqueous solutions. The most pronounced differences among samples were observed under weak geomagnetic conditions (~4 µT), where pretreated lactose solutions showed higher ORP values and a same-direction, non-significant trend toward increased UV absorbance at 200 nm relative to the untreated control. In contrast, these differences were reduced or lost under geomagnetic and stronger static field conditions. Across all samples, both ORP and UV absorbance decreased with increasing magnetic field strength, indicating a consistent field-dependent shift in the overall physicochemical state of the lactose solutions, particularly in their redox balance and deep-UV optical response. The same-direction, field-dependent behavior of ORP and deep-UV responses, particularly in the weak field, suggests that magnetic exposure may affect oxidation-related processes and possibly the formation or stabilization of lactose oxidation products, such as lactobionic acid, together with changes in supramolecular water organization.
These findings are relevant not only for fundamental studies of aqueous systems but also for pharmaceutical and biotechnological applications, where lactose is widely used as a primary excipient. Even subtle changes in its physicochemical properties may influence formulation stability, processing behavior, and product quality. A better understanding of how pretreatment history and environmental magnetic conditions affect lactose-containing systems could therefore contribute to improved quality control, storage protocols, and manufacturing reproducibility in sensitive pharmaceutical and biotechnological products.
Author Contributions
All coauthors contributed to the text. However, the Introduction, Discussion, and Conclusion were mostly composed by I.J. Material and Methods, and Results were mostly composed by L.O. and J.P. All authors have read and agreed to the published version of the manuscript.
Funding
Mainly self-funded, partially funded by OOO “NPF “Materia Medica Holding” (Contract No. 50/24/HAK) and anonymous donors.
Institutional Review Board Statement
Not applicable.
Informed Consent Statement
Not applicable.
Data Availability Statement
Research data are available from the BION Institute upon special request.
Acknowledgments
We would like to express our gratitude and thanks to OOO “NPF “Materia Medica Holding”, which provided lactose samples.
Conflicts of Interest
The authors declare no conflicts of interest. The authors declare that this study received funding from OOO “NPF Materia Medica Holding” (Contract No. 50/24/HAK). The funder was not involved in the study design, collection, analysis, interpretation of data, the writing of this article, or the decision to submit it for publication.
References
- Cai, R.; Yang, H.; He, J.; Zhu, W. The Effects of Magnetic Fields on Water Molecular Hydrogen Bonds. J. Mol. Struct. 2009, 938, 15–19. [Google Scholar] [CrossRef] [Scilit]
- Burton, N.A.; Grant, J.C. The Effects of Magnetic Fields on the Electrochemical and Molecular Dynamics during Water Electrolysis. Int. J. Hydrogen Energy 2025, 137, 710–724. [Google Scholar] [CrossRef] [Scilit]
- Montoya, R.D. Magnetic Fields, Radicals and Cellular Activity. Electromagn. Biol. Med. 2016, 36, 102–113. [Google Scholar] [CrossRef] [Scilit] [PubMed]
- Konovalov, A.; Ryzhkina, I.; Maltzeva, E.; Murtazina, L.; Kiseleva, Y.; Kasparov, V.; Palmina, N. Nanoassociate Formation in Highly Diluted Water Solutions of Potassium Phenosan with and without Permalloy Shielding. Electromagn. Biol. Med. 2015, 34, 141–146. [Google Scholar] [CrossRef] [Scilit] [PubMed]
- Ryzhkina, I.S.; Murtazina, L.I.; Konovalov, A.I. Action of the External Electromagnetic Field Is the Condition of Nanoassociate Formation in Highly Diluted Aqueous Solutions. Dokl. Phys. Chem. 2011, 440, 201–204. [Google Scholar] [CrossRef] [Scilit]
- Novikov, V.V. Effect of Vibrational Iterations of Magnetized Water on the Physico-Chemical Properties of Intact Water. Russ. Phys. J. 2024, 67, 1718–1727. [Google Scholar] [CrossRef] [Scilit]
- ElMassalami, M.; Teixeira, M.S.; Elzubair, A. Investigating the Antiscale Magnetic Treatment Controversy: Insights from the Model Calcium Carbonate Scalant. Sci. Rep. 2025, 15, 3441. [Google Scholar] [CrossRef] [Scilit] [PubMed]
- Novikov, V.V.; Yablokova, E.V.; Shaev, I.A.; Fesenko, E.E. The Effect of a Weak Static Magnetic Field in the Range of Magnitudes from a “Zero” Field (0.01 μT) to 100 μT on the Production of Reactive Oxygen Species in Nonactivated Neutrophils. Biophysics 2020, 65, 443–447. [Google Scholar] [CrossRef] [Scilit]
- Novikov, V.V.; Yablokova, E.V.; Shaev, I.A.; Fesenko, E.E. Decreased Production of the Superoxide Anion Radical in Neutrophils Exposed to a Near-Null Magnetic Field. Biophysics 2020, 65, 625–630. [Google Scholar] [CrossRef] [Scilit]
- Novikov, V.V.; Yablokova, E.V.; Valeeva, E.R.; Fesenko, E.E. On the Molecular Mechanisms of the Effect of a Zero Magnetic Field on the Production of Reactive Oxygen Species in Inactivated Neutrophils. Biophysics 2019, 64, 571–575. [Google Scholar] [CrossRef] [Scilit]
- Binhi, V.N.; Prato, F.S. Biological Effects of the Hypomagnetic Field: An Analytical Review of Experiments and Theories. PLoS ONE 2017, 12, e0179340. [Google Scholar] [CrossRef] [Scilit] [PubMed]
- Penkov, N.V. Relationships between Molecular Structure of Carbohydrates and Their Dynamic Hydration Shells Revealed by Terahertz Time-Domain Spectroscopy. Int. J. Mol. Sci. 2021, 22, 11969. [Google Scholar] [CrossRef] [Scilit] [PubMed]
- Penkov, N.; Yashin, V.; Fesenko, E., Jr.; Manokhin, A.; Fesenko, E. A Study of the Effect of a Protein on the Structure of Water in Solution Using Terahertz Time-Domain Spectroscopy. Appl. Spectrosc. 2018, 72, 257–267. [Google Scholar] [CrossRef] [Scilit] [PubMed]
- Skulachev, V.P.; Vyssokikh, M.Y.; Chernyak, B.V.; Mulkidjanian, A.Y.; Skulachev, M.V.; Shilovsky, G.A.; Lyamzaev, K.G.; Borisov, V.B.; Severin, F.F.; Sadovnichii, V.A. Six Functions of Respiration: Isn’t It Time to Take Control over ROS Production in Mitochondria, and Aging Along with It? Int. J. Mol. Sci. 2023, 24, 12540. [Google Scholar] [CrossRef] [Scilit] [PubMed]
- Archer, M.D. Genesis of the Nernst Equation. In Electrochemistry, Past and Present; Orna, M.V., Ed.; ACS Symposium Series; American Chemical Society: Washington, DC, USA, 1989; Volume 390, pp. 115–126. [Google Scholar]
- Copeland, A.; Lytle, D.A. Measuring the Oxidation–Reduction Potential of Important Oxidants in Drinking Water. J. AWWA 2014, 106, E10–E20. [Google Scholar] [CrossRef] [Scilit]
- Stefan, M.I. UV/Hydrogen Peroxide Process. Water Intell. Online 2017, 16, 7–122. [Google Scholar] [CrossRef] [Scilit] [PubMed]
- Slatinskaia, O.V.; Stepanov, G.O.; Fartushnaya, O.V.; Zubkov, E.V.; Zatykina, A.D.; Gizitdinova, O.M.; Karpov, N.S.; Smirnov, A.V.; Boriskin, V.S.; Rodionova, N.N.; et al. Post-Vibration Activity of Electrochemically Activated Water. Fine Chem. Technol. 2025, 20, 167–184. [Google Scholar] [CrossRef] [Scilit]
- Petrova, A.; Tarasov, S.; Gorbunov, E.; Stepanov, G.; Fartushnaya, O.; Zubkov, E.; Molodtsova, I.; Boriskin, V.; Zatykina, A.; Smirnov, A.; et al. Phenomenon of Post-Vibration Interactions. Symmetry 2024, 16, 958. [Google Scholar] [CrossRef] [Scilit]
- Stepanov, G.O.; Boriskin, V.S.; Rodionova, N.N.; Fedorova, M.M.; Petrova, A.O.; Novikov, V.V.; Yablokova, E.V.; Chernikov, D.Y.; Minakov, A.V.; Tarasov, S.A. The Effect of Aqueous Solutions Processed Using Gradual Technology on the Emission of a Carbohydrate (Lactose) in the RF Range. Phys. Wave Phenom. 2024, 32, 43–47. [Google Scholar] [CrossRef] [Scilit]
- ISO 14644-1:2015; Cleanrooms and Associated Controlled Environments—Part 1: Classification of Air Cleanli-ness by Particle Concentration. International Organization for Standardization: Geneva, Switzerland, 2015. Available online: https://www.iso.org/obp/ui/en/#iso:std:iso:14644:-1:ed-2:v1:en (accessed on 16 June 2026).
- Saad, H.; Rahman, M.K.A.; Yassin, I.; Muad, A.M. Characterization of Ethanol Concentrations at Ultraviolet Wavelength Region. J. Fundam. Appl. Sci. 2018, 9, 384. [Google Scholar] [CrossRef] [Scilit]
- Jerman, I.; Ogrizek, L.; Pihir, J.; Senica, M. Interactions of Highly Diluted Arnica Montana Extract with Water Across Glass Interfaces. Int. J. Mol. Sci. 2025, 26, 1115. [Google Scholar] [CrossRef] [Scilit]
- Jerman, I.; Ogrizek, L.; Krapež, V.P.; Jan, L. Molecular Signal Transfer of Highly Diluted Antibodies to Interferon-Gamma Regarding Kind, Time, and Distance of Exposition. Int. J. Mol. Sci. 2024, 25, 656. [Google Scholar] [CrossRef] [Scilit] [PubMed]
- Jerman, I.; Ogrizek, L.; Periček Krapež, V.; Jan, L. Physicochemical Study of the Molecular Signal Transfer of Ultra-High Diluted Antibodies to Interferon-Gamma. Int. J. Mol. Sci. 2023, 24, 11961. [Google Scholar] [CrossRef] [Scilit] [PubMed]
- Gutiérrez, L.-F.; Hamoudi, S.; Belkacemi, K. Lactobionic Acid: A High Value-Added Lactose Derivative for Food and Pharmaceutical Applications. Int. Dairy J. 2012, 26, 103–111. [Google Scholar] [CrossRef] [Scilit]
- Alonso, S.; Rendueles, M.; Díaz, M. Bio-Production of Lactobionic Acid: Current Status, Applications and Future Prospects. Biotechnol. Adv. 2013, 31, 1275–1291. [Google Scholar] [CrossRef] [Scilit]
- Binhi, V.N. Magnetobiology: Underlying Physical Problems; Academic Press: San Diego, CA, USA, 2002. [Google Scholar]


Disclaimer/Publisher’s Note: The statements, opinions and data contained in all publications are solely those of the individual author(s) and contributor(s) and not of MDPI and/or the editor(s). MDPI and/or the editor(s) disclaim responsibility for any injury to people or property resulting from any ideas, methods, instructions or products referred to in the content. |
© 2026 by the authors. Licensee MDPI, Basel, Switzerland. This article is an open access article distributed under the terms and conditions of the Creative Commons Attribution (CC BY) license.