


Abstract
A Fixed-dose combination (FDC) therapy of ezetimibe (EZT) and atorvastatin (ATV) is increasingly prescribed for high-risk hyperlipidemic patients with cardiovascular disease. However, the pharmaceutical production of FDC EZT/ATV tablets often results in poor ATV dissolution under acidic conditions, failing to meet regulatory requirements. This study aimed to improve ATV dissolution in acidic media through nanosuspension (NS) technology and microenvironmental pH modification. The experimental stages included preparation and characterization of ATV-NS, optimization of FDC EZT/ATV-nanocrystal tablets with pH modifiers, and evaluation of dissolution similarity (f2) against the innovator product Atozet®. ATV-NS was prepared via sonication and high-pressure homogenization using different stabilizers. Poloxamer 188-stabilized ATV-NS demonstrated optimal stability (particle size: 466.6 ± 8.9 nm; polydispersity index: 0.12 ± 0.10; zeta potential: −44.20 ± 0.06 mV) and significantly enhanced solubility (p < 0.05) compared with pure ATV. FDC EZT/ATV-nanocrystal tablets incorporating pH modifiers achieved f2 values for ATV of 52.36, 51.31, and 51.09 in NaCl/HCl pH 1.2, acetate buffer pH 4.5, and phosphate buffer pH 6.8, respectively. In contrast, EZT exhibited f2 values of 18.18, 16.72, and 14.66 (acceptable range: 50–100). Although complete profile similarity was not obtained for EZT, ATV dissolution in acidic media improved significantly (p < 0.05), supporting the feasibility of developing a bioequivalent generic FDC EZT/ATV tablet.
1. Introduction
FDCs offer therapeutic advantages, including enhanced efficacy, reduced treatment costs, and improved patient compliance. FDC EZT/ATV is widely recommended for high-risk hyperlipidemic patients with cardiovascular disease [1], significantly reducing low-density lipoprotein cholesterol (LDL-C) compared to monotherapy or separate pill combinations (SPC). EZT lowers intestinal cholesterol absorption by inhibiting the Niemann–Pick C1-like 1 (NPC1L1) transporter, whereas ATV reduces hepatic cholesterol synthesis through HMG-CoA reductase inhibition. These complementary mechanisms provide additive LDL-C reductions and higher goal-attainment rates than either agent alone, while allowing lower statin doses, which may improve tolerability and adherence in dyslipidemic patients [2,3].
ATV, classified as BCS Class II, exhibits pH-dependent solubility and chemical instability in acidic environments [4,5]; converting from its active hydroxy acid form to a poorly soluble lactone [6], resulting in inadequate gastric dissolution (pH 1.2) versus the innovator tablet, Atozet® (BPOM-approved, 10 mg EZT/10–80 mg ATV). EZT, also a BCS Class II, exhibits acceptable bioavailability in monotherapy but limited dissolution in FDCs due to microenvironmental pH alterations caused by co-formulated weak acids such as ATV [7,8].
Formulation strategies to overcome solubility and dissolution challenges include nanosuspension technology and microenvironmental pH modification. Nanosuspensions, composed of drug nanocrystals stabilized in colloidal systems, improve dissolution and bioavailability by increasing surface area and dissolution rate [9,10]. Several studies have demonstrated that ATV nanosuspensions prepared via high-pressure homogenization (HPH) or ultrasonication, using stabilizers such as TPGS, Tween 80, or PVP, exhibit significantly enhanced dissolution [11,12]. For EZT, recent formulation strategies include solid-state modification, nanonization (nanoparticle, nanocrystal), and lipid/surfactant formulation to enhance dissolution and bioavailability [13]. Another effective approach is microenvironmental pH modification, in which excipients such as sodium bicarbonate or calcium carbonate enhance solubility under unfavorable gastrointestinal conditions [14,15]. This strategy is particularly beneficial for pH-dependent APIs (such as ATV), as weak acids or bases (pH modifiers) adjust the local microenvironment surrounding API particles, thereby stabilizing ionization and preventing pH-dependent degradation [16]. Importantly, small amounts of pH modifiers are sufficient to improve in vivo solubility and bioavailability without altering the bulk dissolution medium [14].
While nanosuspension approaches and microenvironmental pH modification have each been extensively investigated to improve the dissolution of poorly soluble drugs, their combined application within an FDC system has received limited attention. In particular, few studies have addressed the integration of these two strategies in ATV-containing formulations, especially in combination with EZT.
Although the primary objective of this study was to enhance ATV dissolution, EZT was included in the final formulation to create an FDC that mimics the innovator Atozet® tablet. EZT was added to the most optimized ATV tablet formulation to ensure it was added to the most representative FDC tablet matrix, which had been previously evaluated. This study prepared ATV-NS, developed FDC EZT/ATV-nanocrystal tablets optimized with a microenvironmental pH modifier, and assessed the similarity factor (f2) between the FDC and Atozet® dissolution profiles.
2. Materials and Methods
2.1. Materials
EZT was kindly supplied as a gift sample by PT Dexa Medica (Palembang, Indonesia). Atorvastatin calcium trihydrate was purchased from PT Kimia Farma Sungwun Pharmacopia (Bandung, Indonesia). Poloxamer 188 was obtained from Taian Biotechnology (Shaanxi, China). Polyvinyl alcohol (PVA), Tween 80, hydroxypropyl methylcellulose (HPMC), sodium lauryl sulfate (SLS), Avicel PH 101®, magnesium stearate, talc, and sodium bicarbonate were obtained from the Department of Pharmaceutics, Institut Teknologi Bandung (Bandung, Indonesia). Ac-Di-Sol® was procured through a local distributor. Acetonitrile, methanol, and other HPLC-grade solvents were purchased from CV Clorogreen Gemilang (Bandung, Indonesia). Lipitor® and Atozet® tablets were obtained from local pharmacies and are commercially manufactured by Pfizer Inc. (New York, NY, USA) and PT Organon Pharma (Jakarta, Indonesia), respectively.
2.2. Preparation of ATV-NS
2.2.1. Pre-Milling (Screening Stage)
Pre-milling experiments were conducted only for ATV, as the nanosuspension optimization was focused on the poorly soluble, pH-dependent statin component. EZT was used as a conventional micronized powder and was added later to the optimized ATV tablet formulation to obtain the final FDC EZT/ATV tablets mimicking the innovator product.
Nanosuspensions are prepared using various stabilizers, including polymers, surfactants, or mixtures of polymers and surfactants. The concentration used should be as small as possible to avoid the use of unnecessary excipients in the formulation [17]. In this study, five types of stabilizers were used: polymers (HPMC and PVA), surfactants (Tween 80 and SLS), and poloxamer 188, a block copolymer at 0.1–0.4% (w/v). For SLS, a lower concentration was used to reduce foam formation (Table 1). Nanosuspensions were prepared using ultrasonication as a pre-milling step to identify the most suitable stabilizer, using an ultrasonic homogenizer (IvyMen CY-500, Optic System, Barcelona, Spain). The stabilizer was dissolved in water until a clear solution formed. ATV pure drug (PD) (1% w/v) was dispersed in water containing the stabilizer, then homogenized using an Ultra-Turrax at 9000 rpm for 1 min. Based on previous optimizations, sonication conditions were set at 24 °C, with an amplitude of 60%, a pulse ratio of 60:10, and a pre-milling time of 30 min.
Table 1.
Composition of ATV-NS formulations prepared with different types and concentrations of stabilizers.
2.2.2. High-Pressure Homogenization (HPH)
The most effective stabilizer from the screening stage was selected for HPH using Emulsiflex®-C3 (Avestin, Ottawa, ON, Canada). The coarse dispersion was processed at pressures of 300 bar, 700 bar, and 1000 bar for 10 homogenization cycles until particle size reduction reached a plateau.
2.3. Particle Characterization Methods
2.3.1. Particle Size and Polydispersity Index (PDI)
Dynamic light scattering (DLS) was performed using a Delsa Nano C Particle Analyzer (Beckman Coulter, Brea, CA, USA) to determine particle size and PDI of ATV NS. Each reported value represents the mean of three independent measurements.
2.3.2. Zeta Potential
Electrophoretic mobility was measured to predict physical stability. Zeta potential values exceeding ±30 mV indicate good colloidal stability due to electrostatic repulsion. Measurements were conducted using a Nano Particle Analyzer (Horiba SZ-100, Kyoto, Japan) at 25 °C. Each reported value represents the mean of three independent measurements.
2.3.3. Morphological Characterization
Transmission electron microscopy (TEM; HT7700, Hitachi, Tokyo, Japan) was employed to examine morphological differences between ATV-PD and ATV-NS. Particle shape, surface features, and size- distribution uniformity were visually compared to support the DLS data.
2.4. Lyophilization and Redispersibility Evaluation Methods
The optimized NS was frozen at −90 °C and subsequently freeze-dried using a Lyovapor L-300 freeze dryer (Buchi, Flawil, Switzerland) for 24 h at 2.5 bar to obtain a solid nanocrystal (NC). To assess the stability of the dried NC, redispersibility was evaluated by dispersing the NC powder in distilled water and gently shaking for 10 s. Particle size and PDI were measured using DLS with a Delsa Nano C Particle Analyzer (Beckman Coulter, USA), while zeta potential was determined at 25 °C using a Nano Particle Analyzer (Horiba SZ-100, Japan). Each value represents the mean of three independent measurements.
2.5. Saturation Solubility Study
The saturation solubility before and after lyophilization was determined using the shake-flask method with an orbital shaker (IKA KS 4000i, Breisgau, Germany) [18]. Solutions of ATV-PD, ATV-NS, and ATV-NC (10% w/v) in different media: distilled water, 0.1 N HCl (simulated gastric pH 1.2), and phosphate buffer (simulated intestinal pH 6.8) were prepared and shaken at 37 ± 0.5 °C (100 rpm) for 24 h. Aliquots were centrifuged at 5000 rpm for 20 min using a DLAB DM0506 centrifuge (Beijing, China), filtered through a 0.45 µm membrane, and analyzed by a validated HPLC method. All experiments were conducted in triplicate (n = 3).
2.6. Solid-State Characterization Methods
Several analytical techniques were employed to investigate whether nanosizing altered the structural properties of ATV. Fourier transform infrared spectroscopy (FTIR) was used to assess chemical compatibility between ATV and poloxamer 188 with an Agilent 630 spectrometer (Santa Clara, CA, USA). Characteristic absorption bands of ATV, poloxamer 188, and ATV-NC were compared to detect any possible chemical interactions.
Powder X-Ray Diffractometer (PXRD) Bruker D8 Advanced was used to evaluate crystallinity changes and identify potential phase transformations. Diffractograms of ATV, poloxamer 188, and ATV-NC were compared to detect reductions in peak intensity or changes in diffraction patterns indicative of partial amorphization or polymorphic transitions.
Differential scanning calorimetry (DSC) was conducted using a DSC-60 Plus (Shimadzu, Kyoto, Japan) from 20 °C to 300 °C at a heating rate of 10 °C/min under nitrogen flow (40 mL/min) to assess melting behavior, thermal stability, and the degree of amorphization. These analyses confirmed whether nanosizing introduced polymorphic modifications or retained the crystalline state favorable for long-term storage.
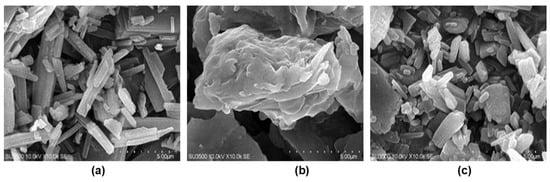
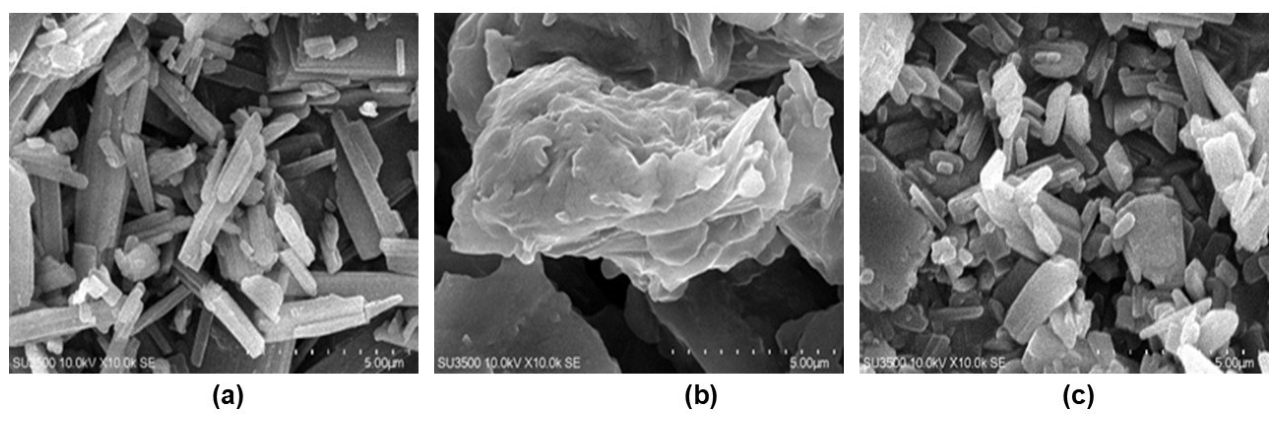
Scanning electron microscopy (SEM; SU3500, Hitachi, Tokyo, Japan) was used to examine morphological differences among the ATV-PD, poloxamer 188, and ATV-NC. Particle shape, surface features, and size-distribution uniformity were visually compared to support the DLS data.
2.7. Tablet Preparation and Evaluation Methods
2.7.1. Tablet Preparation
Two sets of formulations were developed: (i) Single ATV tablets (FA-FF), and (ii) FDC EZT/ATV tablets (FG). The composition of the single ATV tablet is adjusted to the weight of the innovator tablet, Lipitor® (400 mg), while the FDC EZT/ATV tablet is adjusted to the weight of the Atozet® (600 mg). The amount of ATV per tablet used is equivalent to 40 mg of ATV base, while EZT is 10 mg. ATV-PD, ATV-NC 725.5 nm (ATV-NC HPH 700 bar), and ATV-NC 466.6 nm (ATV-NC HPH 1000 bar) were blended with directly compressible excipients, including Avicel PH 101® and Ac-Di-Sol® (filler, binder, and superdisintegrant), magnesium stearate, and talc (lubricant and anti-adherent). Two ATV-NC nanoparticle size levels (725.50 nm and 466.60 nm) were intentionally used to evaluate how nanoscale particle size differences influence dissolution behavior and to define a size range compatible with large-scale manufacturing. SB was included as a pH modifier in several formulations to assess its effect on ATV dissolution in acidic media (Table 2).
Table 2.
Tablet Formulations.
The blending process was performed manually in sequential steps: sieving through a 40-mesh screen, geometric dilution of the active pharmaceutical ingredient (API) with partial Avicel, incorporation of the remaining excipients, and final lubrication to ensure uniformity and prevent disintegration defects. The powder mixtures were compressed into tablets using an AUTOTAB-200TR automatic tablet press via direct compression, a method chosen to minimize ATV-NC aggregation [12].
2.7.2. Tablet Evaluation
Tablet evaluation included disintegration time, hardness, friability, and uniformity of dosage units, as defined by the United States Pharmacopoeia (USP).
Disintegration time was assessed using an Erweka ZT 122 tester (Langen, Germany), with one tablet placed in each tube of the six-station basket assembly. The apparatus operated with distilled water maintained at 37 ± 2 °C. All tablets were required to disintegrate completely. If one or two tablets failed, the test was repeated with 12 additional tablets, and the criterion was met if not fewer than 16 of the total 18 tablets disintegrated completely.
Tablet hardness was determined on 10 tablets per batch using an Erweka TBH 125 hardness tester (Langen, Germany), with an acceptance criteria of 4–10 kp adopted for this formulation.
Friability was evaluated using an Erweka TAR II tester (Langen, Germany). Approximately 6.5 g of tablets were dedusted, weighed (w1), placed in the friability drum, and rotated 100 times. The tablets were then removed, dedusted again, and reweighed (w2). Tablets exhibiting cracks, splits, or breaks after tumbling were considered failures. If results were difficult to interpret or if weight loss exceeded the target value, the test was repeated twice, and the mean weight loss of three runs was calculated. An average weight loss of not more than 1.0% was considered acceptable, calculated according to the following equation:
w1 is the initial weight, and w2 is the final weight after tumbling.
Uniformity of dosage units was evaluated in accordance with USP <905> using the content uniformity method for EZT and the weight variation method for ATV. For content uniformity, not fewer than 30 tablets were randomly selected, and 10 individual tablets were assayed using a validated HPLC method. Each tablet was finely powdered, quantitatively transferred into a 50 mL volumetric flask, dissolved in the mobile phase (acetonitrile: acetate buffer, pH 6.1, 55:45 v/v), sonicated for 30 min, filtered through a 0.45 µm membrane filter, and analyzed by HPLC to determine the individual EZT content. The acceptance value (AV) was calculated according to USP criteria. For weight variation, not fewer than 30 tablets were selected, and 10 tablets were weighed individually. The ATV content was estimated based on the individual tablet mass relative to the nominal drug load, and the acceptance value for weight variation was calculated following USP requirements.
Drug content evaluation (assay) was performed by taking 10 powdered tablets from each formulation and placing them in a 100 mL volumetric flask. Add a solvent mixture (mobile phase) of acetonitrile and acetate buffer, pH 6.1 (55:45), to approximately 50% of the final flask volume, then sonicate for 15 min. Dilute with solvent to the desired volume. Filter using a 0.45 µm pore-size filter and analyze by validated HPLC.
2.8. HPLC Method Validation
Quantification of ATV and EZT in dissolution samples was performed using validated HPLC methods. Chromatographic separation was achieved on a C18 reversed-phase column (250 × 4.6 mm, 5 µm) maintained at 25 °C on a Waters Alliance HPLC system with Breeze 2 software, Waters Corp., Milford, MA, USA. The mobile phase was filtered through a 0.45 µm membrane and degassed prior to use. The flow rate was set at 1.0 mL/min, detection was carried out at 245 nm using a UV detector, and the injection volume was 50 µL. Samples were filtered through a 0.45 µm syringe filter before injection.
The method was validated for linearity, accuracy, precision, limit of detection (LOD), limit of quantification (LOQ), and system suitability, in accordance with ICH guidelines.
2.9. In Vitro Dissolution Studies
In vitro dissolution testing was conducted using a USP Type II dissolution apparatus (paddle method). Six tablets of each formulation FA-FF were randomly selected and placed in 900 mL of NaCl/HCl buffer (pH 1.2), maintained at 37 ± 0.5 °C, and stirred at 50 rpm. Aliquots of 10 mL were withdrawn at predetermined intervals (10, 15, 20, 30, 45, and 60 min) and replaced with equal volumes of fresh medium at the same temperature. Aliquots were filtered through a 0.45 µm filter and analyzed by a validated HPLC method.
Comparative dissolution studies were performed on six tablets of each formulation, FG and the reference product Atozet®. Dissolution was carried out in 900 mL of three different media: NaCl/HCl buffer (pH 1.2), acetate buffer (pH 4.5), and phosphate buffer (pH 6.8), each supplemented with 0.2% Tween 80, maintained at 37 ± 0.5 °C. A USP Type II dissolution apparatus (Agilent 708-DS, Agilent Technologies, Santa Clara, CA, USA) operated at 50 rpm was used. Aliquots of 10 mL were collected at 10, 15, 20, 30, 45, and 60 min, and replaced with equal volumes of fresh medium at the same temperature. Aliquots were filtered through a 0.45 µm filter and analyzed by a validated HPLC method. The comparative dissolution profiles were evaluated using the similarity factor (f2), calculated according to the following equation:
f2 represented the similarity factor, Rt denoted the cumulative amount of drug dissolved at each sampling time from the reference product, and Tt was the cumulative amount of drug dissolved at each sampling time from the test product. A product was considered equivalent or exhibited a similar dissolution profile to the innovator/reference product when the similarity factor was between 50 and 100 [19].
2.10. Data Analysis
Data were analyzed using one-way analysis of variance (ANOVA) to identify overall significant differences at a confidence level of p < 0.05. When significant differences were observed, pairwise comparisons were performed using the Student–Newman–Keuls (SNK) post-hoc test.
3. Results
3.1. Particle Size and Morphology Results
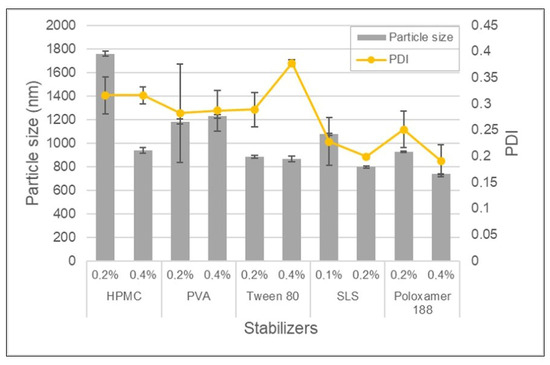
The choice of stabilizer had a marked influence on nanosuspension preparation, particularly in reducing particle size and maintaining colloidal stability. Particle size, PDI, and zeta potential of the screening nanosuspensions were summarized in Table 3, and the trends across stabilizer systems were illustrated in Figure 1. Among the excipients tested, F10 (1% ATV-PD + 0.4% poloxamer 188) produced the smallest particle size (738.3 ± 0.50 nm), PDI (0.191 ± 0.031), and zeta potential (−47.80 ± 0.01 mV) after 30 min of ultrasonication. This effect can be attributed to the amphiphilic structure of poly (ethylene oxide)–poly (propylene oxide)–poly (ethylene oxide) (PEO–PPO–PEO), which provides dual stabilization via steric hindrance and reduction of surface tension [20].
Table 3.
Particle size, PDI, and zeta potential of ATV-NS prepared by ultrasonication (pre-milling) using various types and concentrations of stabilizers.
Figure 1.
Effect of stabilizer type and concentration on particle size and PDI of ATV-NS prepared by ultrasonication.
However, HPMC and PVA increased the dispersion’s viscosity and reduced cavitation efficiency during sonication. Tween 80 and SLS reduced surface tension but formed micelles that trapped drug molecules, thereby limiting nanoparticle formation [10,21].
Nanosuspensions processed at HPH 1000 bar showed the smallest particle size (466.60 ± 8.89 nm) and lowest PDI (0.12 ± 0.10), indicating a homogeneous and potentially stable system. However, 300 bar produced a heterogeneous system (898.90 ± 16.90 nm and PDI 0.27 ± 0.08), and 700 bar generated intermediate results (725.50 ± 7.39 nm and PDI 0.19 ± 0.04), as shown in Table 4. These proved that both stabilizer selection and mechanical energy input significantly influenced particle characteristics [21]. All nanosuspensions were lyophilized without cryoprotectants. Under these conditions, the formulations prepared at 300 and 1000 bar showed only minor changes in zeta potential before and after lyophilization (approximately −42 to −44 mV), whereas the absolute zeta potential of the 700-bar formulation decreased markedly (from −40.1 ± 0.07 mV to −17.97 ± 0.04 mV; Table 4). This behavior suggests a higher sensitivity of the 700-bar system to freeze-drying–induced changes in particle–particle interactions and stabilizer adsorption in the absence of cryoprotectants, consistent with previous reports on the impact of lyophilization on nanoparticle surface charge and colloidal stability [22].
Table 4.
Particle size, PDI, and zeta potential of ATV-NS before and after lyophilization using Poloxamer 188 as stabilizer.
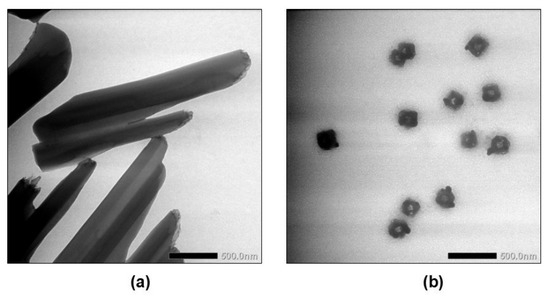
TEM micrographs confirmed a decrease in ATV particle size and also a change in shape when formulated into a nanosuspension (Figure 2).
Figure 2.
TEM micrographs of (a) ATV-PD and (b) ATV-NS by HPH at 1000 bar, at a magnification of 5000–8000×. ATV-PD shows elongated, rod-like crystalline structures with micrometer-scale dimensions, whereas ATV-NS displays discrete, near-spherical nanocrystals with reduced particle size.
3.2. Lyophilization and Redispersibility Results
Lyophilization was performed to convert ATV-NS to ATV nanocrystal (NC). After redispersion in aqueous media, all formulations showed an increase in particle size, indicating partial aggregation [21,23]. The formulation prepared using HPH at 1000 bar showed the smallest particle size, 685.20 ± 24.70 nm, reflecting excellent redispersibility, as shown in Table 4. Furthermore, the zeta potential value of −42.50 ± 0.28 mV exceeded the threshold of ±30 mV generally associated with strong electrostatic stabilization [23,24]. The highly negative surface charge and steric stabilization of Poloxamer 188 indicate stable electrostatic repulsion between particles, consistent with previously reported HPH nanocrystal systems [25,26].
In this study, lyophilization performed without a cryoprotectant resulted in particles still in the nanometer range, so the procedure continued to the tablet preparation stage. Without the addition of cryoprotectants, potential interference with the manufacturing process and subsequent tablet characteristics can be avoided [25]. Further optimization of lyophilization is carried out by adding cryoprotectants (e.g., mannitol, trehalose) to avoid the formation of nanoparticle aggregation [21].
3.3. Saturation Solubility Results
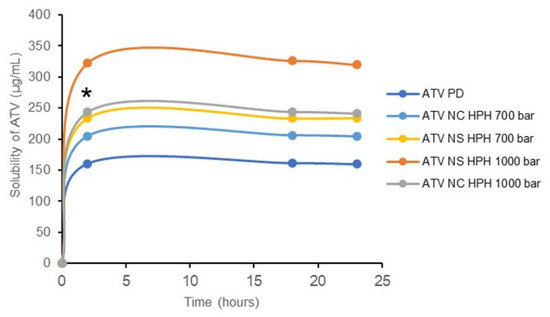
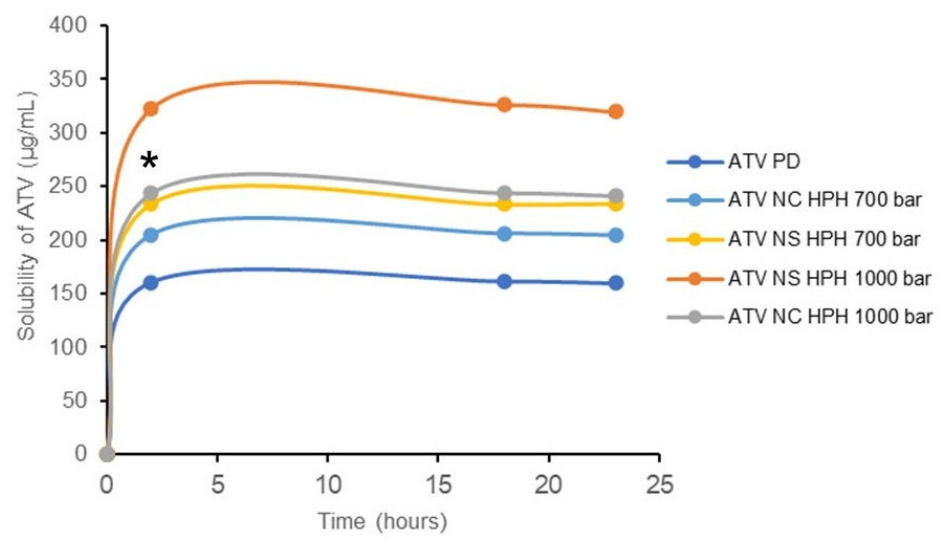
The saturation solubility of ATV in distilled water, determined by the shake-flask method described in Section 2.5, is shown in Figure 3 and summarized in Table 5.
Figure 3.
Time-dependent approach to equilibrium solubility of ATV from different formulations in distilled water at 25 °C using a shake-flask experiment (up to 23 h). Equilibrium saturation solubility was considered reached at the plateau region of each curve, and the corresponding values are summarized in Table 5. * indicates statistically significant difference (p < 0.05) was observed between ATV-NC processed at 700 bar and ATV-NC at 1000 bar. Each data point represents the mean ± SD (n = 3); error bars were smaller than the symbols and therefore not visible.
Table 5.
Saturation solubility of ATV from different formulations in distilled water at 25 °C (shake-flask method).
Among the formulations, ATV-NS prepared at 1000 bar exhibited the highest equilibrium saturation solubility (322.43 ± 3.28 µg/mL, approximately two-fold higher than ATV-PD), followed by ATV-NC prepared at 1000 bar (243.68 ± 1.43 µg/mL), whereas ATV-PD showed the lowest value (160.46 ± 0.87 µg/mL), consistent with its larger particle size (≈14.40 µm). Lyophilized ATV-NC processed at 1000 bar maintained its nanostructure and equilibrium solubility, indicating that freeze-drying did not induce significant aggregation under the conditions used. The dissolved ATV concentration increased rapidly during the initial phase of the experiment and then remained essentially constant up to 23 h (Figure 3), confirming that equilibrium had been reached and suggesting physical stability with a low tendency to recrystallize [27,28]. These results demonstrate that the ATV-NC prepared at 1000 bar is the most promising candidate for further development.
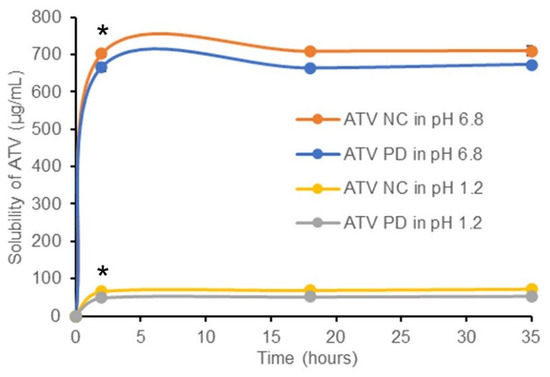
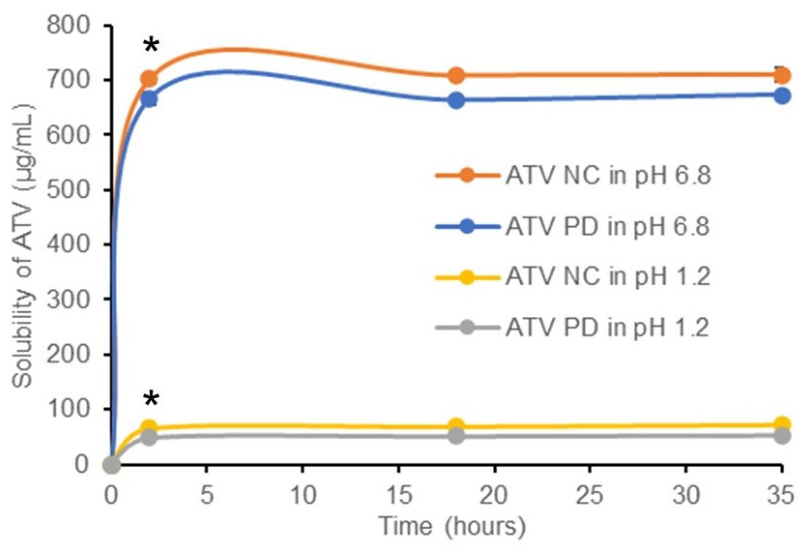
A statistically significant difference (p < 0.05) in solubility in 0.1 N HCl, pH 1.2, and phosphate buffer, pH 6.8, was observed between ATV-PD and ATV-NC (HPH 1000 bar) (48.31 µg/mL and 66.01 µg/mL in pH 1.2) and (665.88 µg/mL and 701.56 µg/mL in pH 6.8) at all sampling time points (2, 18, and 35 h), with ATV-NC showing consistently higher solubility. This improvement was attributed to the smaller particle size and larger surface area, which was further supported by the solubility profiles at several time points (Figure 4). Nanocrystals enhanced ATV solubility through: (i) larger surface area and wettability, allowing for faster hydration, and (ii) lower lattice energy, resulting in greater solubility. This synergistic effect contributed to the development of a rapid concentration gradient across the gastrointestinal tract, which was crucial for the dissolution-limited absorption of ATV [9,29].
Figure 4.
Solubility profiles of ATV-PD and ATV-NC in 0.1 N HCl, pH 1.2, and phosphate buffer, pH 6.8, at 2, 18, and 35 h. * p < 0.05 indicates a statistically significant difference between ATV-PD and ATV-NC. Data are expressed as mean ± SD (n = 3). The error bars are smaller than the symbols and therefore not clearly visible, reflecting low variability in the solubility measurements.
3.4. Solid-State Properties Results
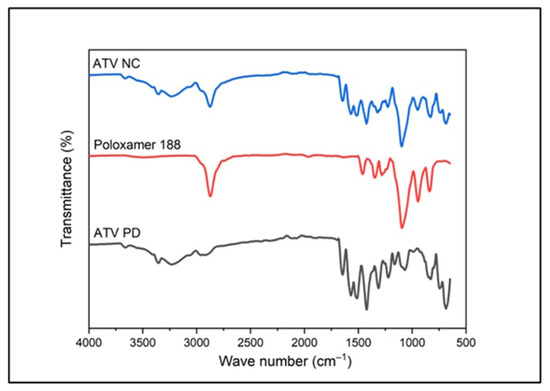
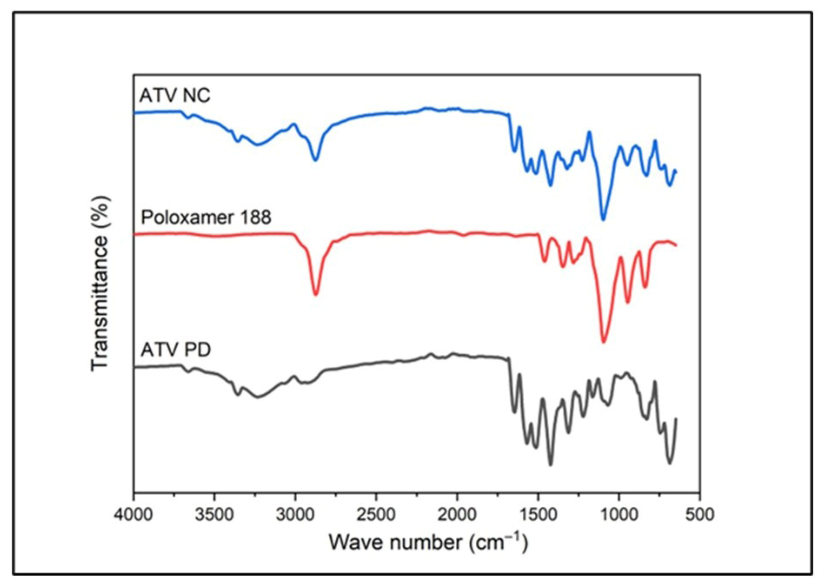
FTIR analysis (Figure 5) revealed characteristic peaks of ATV at 800 cm−1 (Ar-H), 1527 (C=O), 2815 cm−1 (C-H), and 3214 cm−1 (N-H). Poloxamer 188 showed peaks at 949 cm−1 (C=C-H), and 2731 cm−1 (C-H). The main peaks of ATV-NC are at 800 cm−1 (Ar-H), 1080 cm−1 (C=C-H), 1515 cm−1 (C=O), 2874 cm−1 (C-H), and 3333 cm−1 (N-H). The ATV-NC peaks originating from ATV-PD and poloxamer 188 are not new peaks, as they arise from the formation of new bonds. This shows that no chemical interactions occur in the ATV-NC.
Figure 5.
FTIR spectra of ATV-PD, Poloxamer 188, and ATV-NC, confirming no chemical interactions between ATV and the stabilizer, as evidenced by the unchanged characteristic peaks.
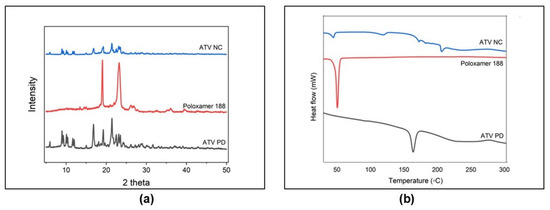
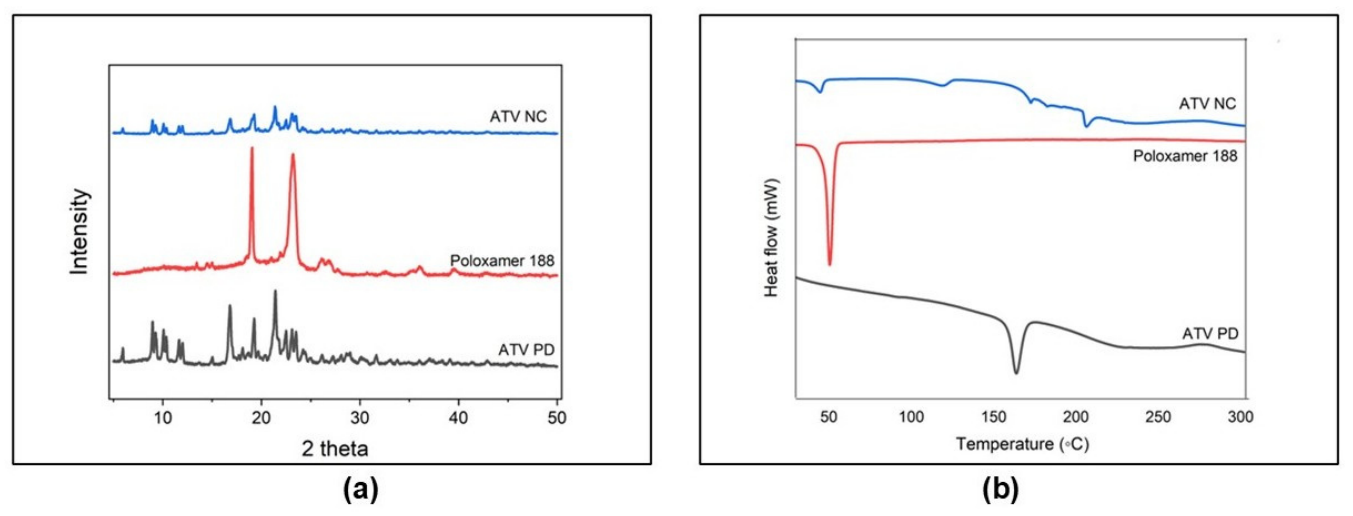
The XRD test results showed that the highest peaks of ATV-PD were at 2θ 8.96°; 16.8°; 19.24°; 21.38°, matching polymorphic Form VIII trihydrate from reference patent WO2002043732 [30]. ATV-NC retained these peaks with reduced intensity, indicating preserved polymorph but partial amorphization due to HPH milling (Figure 6a) [12].
Figure 6.
(a) PXRD patterns and (b) DSC thermograms of ATV-PD, Poloxamer 188, and ATV NC, demonstrating reduced crystallinity and partial amorphization in ATV-NC.
The DSC thermogram of ATV-PD (Figure 6b) shows a sharp endotherm at 163.73 °C, attributed to decomposition/melting rather than pure melting owing to prior dehydration. In ATV-NC, the new peak of ATV at 214.11 °C and the new peak of poloxamer 188 at 44.70 °C indicate reduced crystallinity (melting point depression due to nanoscale size), not the disappearance of the melting peak, in accordance with previous NC studies where the ATV peak shifted without full amorphization [31].
SEM micrographs (Figure 7) confirmed distinct, non-agglomerated morphologies suitable for rapid rehydration, supporting manufacturability as an oral solid dosage form [32,33].
Figure 7.
SEM micrographs showing (a) ATV-PD; (b) poloxamer 188; and (c) ATV-NC. The images clearly demonstrate a significant reduction in particle size of ATV-NC compared to ATV-PD crystals.
3.5. Tablet Preparation and Evaluation Results
The tablet formulation incorporated excipients such as Avicel PH 101® (microcrystalline cellulose) and Ac-Di-Sol® (croscarmellose sodium) to enhance compressibility and disintegration, and to reduce segregation during mixing. The direct compression method was chosen to minimize potential changes in nanocrystal morphology and crystallinity that could occur during wet granulation [12]. Further optimization may be achieved through dry granulation or roller compaction to improve mix uniformity and manufacturability. The final tablets exhibited hardness values in the range of 5.39–8.65 kp, friability below 1%, and disintegration times of less than 15 min. Drug content evaluation results were 99.9% (EZT) and 99.6% (ATV) of the label claim, and all formulations complied with pharmacopoeial specifications for uniformity of dosage units and mechanical strength (Table 6). These findings demonstrate that the selected formulation is suitable for laboratory-scale production and early development.
Table 6.
The Results of Tablet Evaluation.
3.6. HPLC Method Validation Results
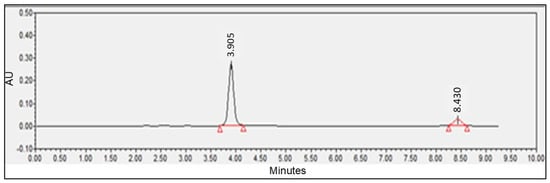
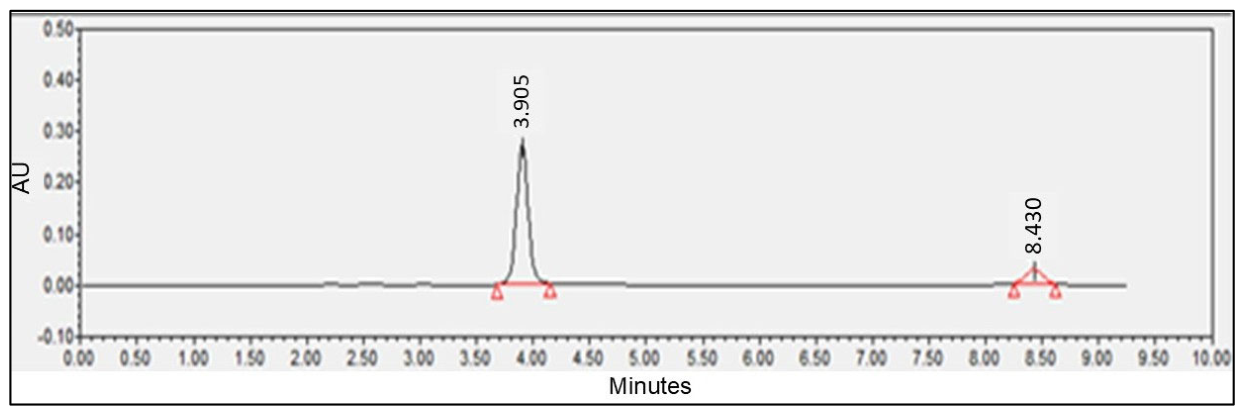
All validation parameters of the developed HPLC method met the acceptance criteria specified in the ICH Q2(R1) guidelines. The calibration curves for both atorvastatin and ezetimibe were highly linear (R2 > 0.999) over the tested concentration ranges. Accuracy results, expressed as percentage recovery, were in 98.0–102.0%, while intra-day and inter-day precision values (%RSD) were below 2.0%. The calculated LOD and LOQ values showed sufficient sensitivity for the intended analysis. System suitability parameters, including theoretical plates, tailing factor, and retention time reproducibility, were within the recommended limits, confirming the method’s reliability for routine analysis, as detailed in Table 7 and illustrated in the representative chromatogram in Figure 8.
Table 7.
HPLC method validation data, including linearity, accuracy, precision, LOD, LOQ, and system suitability.
Figure 8.
HPLC chromatogram of ATV and EZT at a retention time of 3.905 and 8.430 min, respectively, for 40 µg/mL and 10 µg/mL. Conditions: a C18 reversed-phase column (250 × 4.6 mm, 5 µm) and acetonitrile: acetate buffer (pH 6.1, 55:45) were used as the mobile phase, and detected at 245 nm. The horizontal lines and triangle symbols at the bottom of the chromatographic peaks indicate the retention times and areas under the curve (AUC) of ATV and EZT, as automatically generated by the HPLC software (Breeze 2 software, Waters Corp., Milford, MA, USA).
3.7. In Vitro Dissolution Results
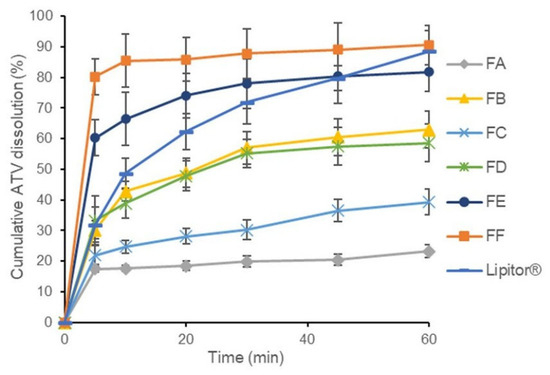
Studies have shown that NC formulations improve ATV dissolution by reducing particle size. For example, reducing the particle size of ATV from ≈14.40 µm (FA) to 725.50 nm (FC) improved dissolution, but its performance remained below that of the innovator product (Lipitor®). Further reduction of particle size to 466.60 ± 8.89 nm (FE) improved dissolution above that of Lipitor®, but the dissolution curve intersected with that of Lipitor® in the final minutes of the test (45–60 min). If the test curve intersects the reference curve, it means the dissolution rate differs significantly at that particular time point—for example, the test is faster at the beginning but slower at the end. This can alter Cmax (maximum concentration) or Tmax (time to maximum concentration), potentially impacting clinical efficacy and safety [34]. The addition of a pH modifier (2% SB) to the tablet formulation changes the pH of the microenvironment in the diffusion zone around the tablet, thereby further increasing the dissolution rate of FB and FF [16], as shown in Figure 9. Interestingly, FB, containing ATV-PD with SB, had a higher dissolution rate than FC, containing ATV-NC 725.50 ± 7.39 nm, both with and without SB, but remained below that of Lipitor®. FF exhibited significantly higher dissolution than Lipitor® (p < 0.05), attributed to NC and microenvironment pH modification.
Figure 9.
In vitro cumulative ATV dissolution profiles from FA-FF compared with Lipitor®, in NaCl/HCl buffer pH 1.2 at 37 °C ± 0.5 °C using the USP paddle method (n = 6).
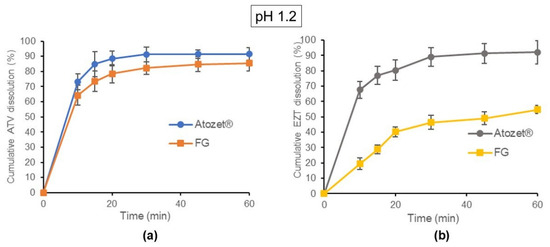
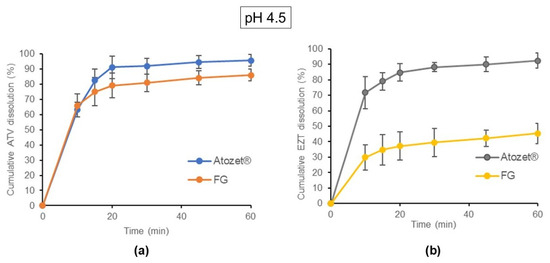
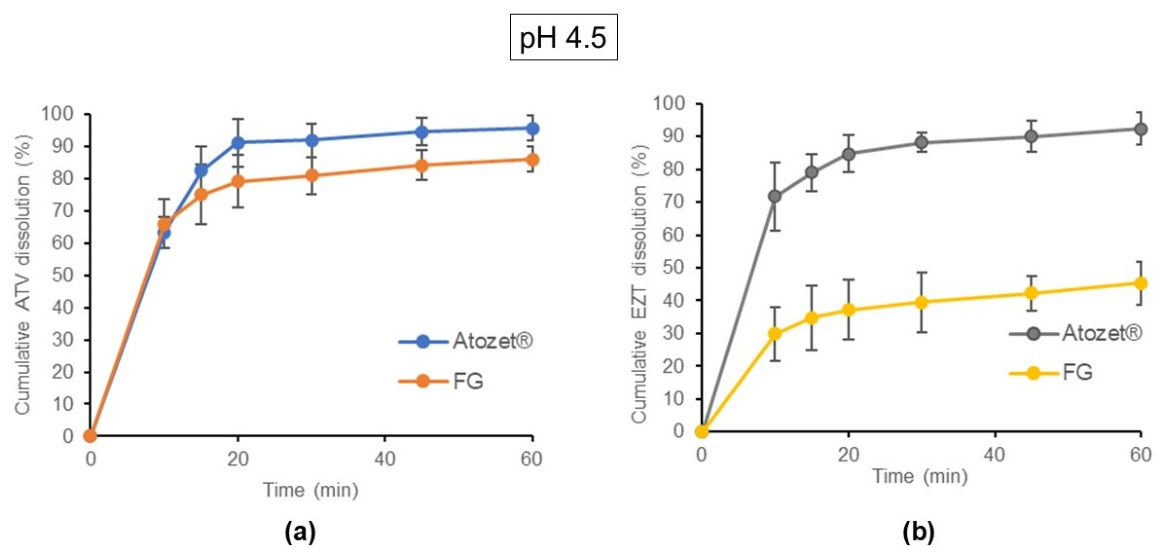
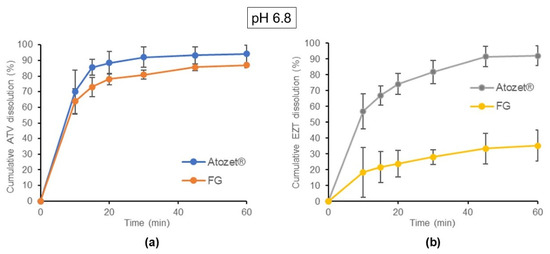
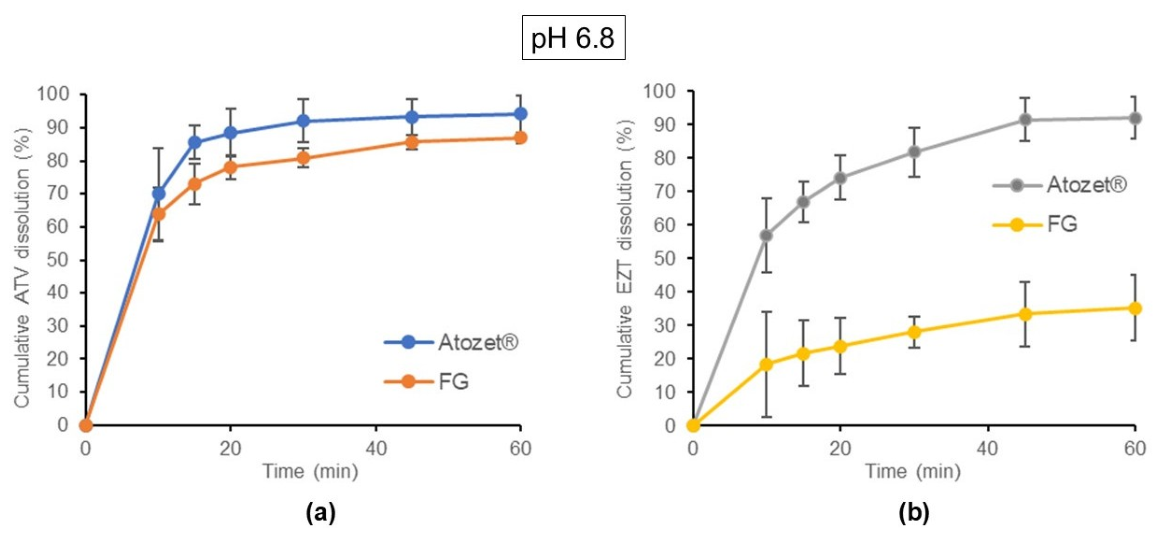
The best formulation (FF) was then added with EZT to form FDC EZT/ATV-NC tablets (FG). A comparative in vitro dissolution test was performed on FG tablets as a preliminary assessment of bioequivalence, comparing them with the reference drug Atozet® at the same dosage of 10 mg EZT and 40 mg ATV. The dissolution test was performed at three different pH levels (1.2, 4.5, and 6.8) to simulate gastrointestinal conditions. The similarity between the dissolution profiles of the FG and Atozet® was evaluated using a similarity factor (f2), and the values obtained were within the acceptable range of 50–100 [19]. The f2 values of ATV in all media (pH 1.2, 4.5, and 6.8) were within the acceptable range of 52.36, 51.31, and 51.09, respectively. Meanwhile, the f2 EZT values for all media did not meet the acceptance criteria of 50–100, with values of 18.18, 16.72, and 14.66, as shown in Table 8; Figure 10, Figure 11 and Figure 12.
Table 8.
Similarity factor (f2) values for ATV and EZT dissolution profiles of the test formulation (FG) versus the reference product (Atozet®) in different media.
Figure 10.
Dissolution profiles of (a) ATV, and (b) EZT from the Atozet® and FG in NaCl/HCl buffer pH 1.2, 0.2% Tween 80.
Figure 11.
Dissolution profiles of (a) ATV, and (b) EZT from the Atozet® and FG in acetate buffer pH 4.5, 0.2% Tween 80.
Figure 12.
Dissolution profiles of (a) ATV, and (b) EZT from Atozet® and FG in phosphate buffer pH 6.8, 0.2% Tween 80.
4. Discussion
ATV-NC in a single-tablet formulation exhibited a rapid cumulative drug dissolution (~80%) within the first 10 min, followed by sustained dissolution up to 60 min (Figure 9). This rapid dissolution was attributed to particle size reduction, decreased crystallinity, and partial amorphization induced during the milling process [12]. The optimized nanosized formulation demonstrated minimal nanocrystal agglomeration and favorable dispersibility (Table 4). Moreover, the presence of poloxamer 188 at the drug–aqueous interface reduced interfacial tension via hydrogen bonding between the ether oxygen of its polyethylene oxide block and water molecules [20,21]. The incorporation of SB as a pH modifier elevated the microenvironmental pH in acidic media, thereby maintaining ATV (pKa ~4.6) in its soluble ionic form, consistent with the Henderson–Hasselbalch equation.
In vitro dissolution studies provide practical insight into the expected in vivo performance of the developed FDC EZT/ATV tablets [29]. ATV-NC incorporated into the FDC EZT/ATV tablet matrix showed a dissolution profile comparable to the Atozet® reference product (f2 > 50) in all media (NaCl/HCl buffer pH 1.2, acetate buffer pH 4.5, and phosphate buffer pH 6.8). This similarity is driven by the increased solubility of ATV through reduced particle size, decreased crystallinity, and partial amorphization during the grinding process [28]. Increasing the NC solid surface area further accelerated ATV solubility, as evidenced by particle size and solubility data in distilled water, HCl (pH 1.2), and phosphate buffer (pH 6.8) (Figure 3 and Figure 4). The addition of SB as a pH modifier in the tablet matrix increases the pH of the microenvironment, thereby optimizing the pH-dependent solubility of ATV (solubility: (48.71 µg/mL) at pH 1.2 < ((665.88 µg/mL) at pH 6.8) (Figure 4). This mechanism reduces the negative impact of acidic conditions on the solubilization of BCS Class II drugs such as ATV, mimicking the buffering effect commonly used in oral formulations [20].
In contrast, the solubilization of EZT is mainly governed by its slow diffusion and low intrinsic solubility (pKa 9.5, highly hydrophobic). The SB concentration was insufficient to raise the microenvironment pH above 7, which is necessary for a significant increase in solubilization [35]. Furthermore, adsorption competition on the NC surface favors ATV (more polar and sensitive to pH) over the highly hydrophobic EZT, resulting in an f2 value for EZT < 50 relative to Atozet®, indicating a lack of dissolution similarity according to regulatory expectations. These physicochemical properties of EZT inhibit equivalent bioavailability, even when ATV solubilization is optimized, consistent with prior reports that emphasize the persistent challenges in enhancing EZT dissolution despite nanonization strategies [36].
These findings confirmed that the nanosuspension and microenvironmental pH modification were effective for improving ATV dissolution in the FDC EZT/ATV tablet formulation. However, EZT has limitations, necessitating additional strategies such as incorporating surfactants (e.g., Tween 80) to improve wetting and dissolution. Long-term stability studies are required to confirm the persistence of amorphization under ICH Q1A(R2) storage conditions. Additionally, further research is needed to validate the feasibility of different strength variants (e.g., 10/10 mg, 10/20 mg, 10/40 mg) to support industrial application and cost competitiveness.
5. Conclusions
In conclusion, nanosuspension and microenvironmental pH modification successfully enhanced ATV solubility/dissolution in pH 1.2. In FDC EZT/ATV tablets, ATV achieved f2 > 50 vs. Atozet® (52.36, 51.31, and 51.09 in NaCl/HCl pH 1.2, acetate buffer pH 4.5, and phosphate buffer pH 6.8, respectively), whereas EZT showed slower dissolution due to its hydrophobic nature and adsorption competition. This dual strategy confirms feasibility for hyperlipidemia therapy. Future studies should focus on optimizing EZT dissolution and stability to support generic development.
Author Contributions
Conceptualization, R.M. and Y.P.N.; methodology, R.M. and Y.P.N.; software, D.P.A.; validation, R.M. and Y.P.N.; formal analysis, R.M. and Y.P.N.; investigation, D.P.A.; resources, R.M.; data curation, R.M.; Y.P.N. and D.P.A.; writing—original draft preparation, D.P.A.; writing—review and editing, D.P.A.; visualization, D.P.A.; supervision, R.M. and Y.P.N.; project administration, D.P.A.; funding acquisition, R.M. and D.P.A. All authors have read and agreed to the published version of the manuscript.
Funding
This research was funded by the Indonesian Education Scholarship, the Center for Higher Education Funding and Assessment, and the Indonesia Endowment Fund for Education Agency, grant number 202209092364.
Institutional Review Board Statement
Not applicable.
Informed Consent Statement
Not applicable.
Data Availability Statement
The original contributions presented in this study are included in the article. Further inquiries can be directed to the corresponding author.
Acknowledgments
The authors are grateful to the Department of Pharmaceutics, School of Pharmacy ITB, and Universitas Bhakti Kencana for their unlimited support and extended facilities.
Conflicts of Interest
The authors declare no conflicts of interest.
Abbreviations
The following abbreviations are used in this manuscript:
| FDC | Fixed-Dose Combination |
| ATV | Atorvastatin |
| EZT | Ezetimibe |
| NS | Nanosuspension |
| LDL-C | Low-Density Lipoprotein Cholesterol |
| SPC | Separate Pill Combinations |
| BCS | Biopharmaceutics Classification System |
| BPOM | Badan Pengawas Obat dan Makanan |
| HPH | High-Pressure Homogenization |
| API | Active Pharmaceutical Ingredient |
| PVA | Polyvinyl alcohol |
| HPMC | Hydroxypropyl Methylcellulose |
| SLS | Sodium Lauryl Sulfate |
| SB | Sodium Bicarbonate |
| PD | Pure Drug |
| PDI | Polydispersity Index |
| DLS | Dynamic Light Scattering |
| TEM | Transmission Electron Microscopy |
| NC | Nanocrystal |
| HPLC | High Performance Liquid Chromatography |
| FTIR | Fourier transform infrared spectroscopy |
| PXRD | Powder X-Ray Diffraction |
| DSC | Differential Scanning Calorimetry |
| SEM | Scanning Electron Microscopy |
| LOD | Limit of Detection |
| LOQ | Limit of Quantification |
References
- Lewek, J.; Niedziela, J.; Desperak, P.; Dyrbuś, K.; Osadnik, T.; Jankowski, P.; Witkowski, A.; Bielecka-Dąbrowa, A.; Dudek, D.; Gierlotka, M.; et al. Intensive Statin Therapy Versus Upfront Combination Therapy of Statin and Ezetimibe in Patients With Acute Coronary Syndrome: A Propensity Score Matching Analysis Based on the PL-ACS Data. J. Am. Heart Assoc. 2023, 12, e030414. [Google Scholar] [CrossRef] [Scilit] [PubMed]
- Katzmann, J.L.; Sorio-Vilela, F.; Dornstauder, E.; Fraas, U.; Smieszek, T.; Zappacosta, S.; Laufs, U. Non-Statin Lipid-Lowering Therapy over Time in Very-High-Risk Patients: Effectiveness of Fixed-Dose Statin/Ezetimibe Compared to Separate Pill Combination on LDL-C. Clin. Res. Cardiol. 2022, 111, 243–252. [Google Scholar] [CrossRef] [Scilit]
- Song, J.; Bae, S.; Yu, K.S.; Lee, S. Comparison of Pharmacokinetics of a Fixed-Dose Combination of Atorvastatin/Ezetimibe 5 Mg/10 Mg versus Separate Tablets in Healthy Subjects. Transl. Clin. Pharmacol. 2025, 33, 40–49. [Google Scholar] [CrossRef] [Scilit]
- Shaker, M.A.; Elbadawy, H.M.; Shaker, M.A. Improved Solubility, Dissolution, and Oral Bioavailability for Atorvastatin-Pluronic ® Solid Dispersions. Int. J. Pharm. 2020, 574, 118891. [Google Scholar] [CrossRef] [Scilit] [PubMed]
- Eita, A.S.; Makky, A.M.A.; Anter, A.; Khalil, I.A.; Eita, A.S.; Makky, A.M.A.; Anter, A.; Khalil, I.A. Repurposing of Atorvastatin Emulsomes as a Topical Antifungal Agent. Drug Deliv. 2022, 29, 3414–3431. [Google Scholar] [CrossRef] [Scilit]
- Khan, F.N.; Dehghan, M.H.G. Enhanced Bioavailability of Atorvastatin Calcium from Stabilized Gastric Resident Formulation. AAPS PharmSciTech 2011, 12, 1077–1086. [Google Scholar] [CrossRef] [Scilit]
- Bhadoriya, A.; Sanyal, M.; Shah, P.A.; Shrivastav, P.S. Simultaneous Quantitation of Rosuvastatin and Ezetimibe in Human Plasma by LC–MS/MS: Pharmacokinetic Study of Fixed-Dose Formulation and Separate Tablets. Biomed. Chromatogr. 2018, 32, e4291. [Google Scholar] [CrossRef] [Scilit]
- Filip, K.; Bańkowski, K.; Sidoryk, K.; Zagrodzka, J.; Łaszcz, M.; Trzcińska, K.; Szyprowska, A.; Cmoch, P.; Maruszak, W. Physicochemical Characterization of Ezetimibe and Its Impurities. J. Mol. Struct. 2011, 991, 162–170. [Google Scholar] [CrossRef] [Scilit]
- Shaker, M.A.; Elbadawy, H.M.; Al Thagfan, S.S.; Shaker, M.A. Enhancement of Atorvastatin Oral Bioavailability via Encapsulation in Polymeric Nanoparticles. Int. J. Pharm. 2021, 592, 120077. [Google Scholar] [CrossRef] [Scilit] [PubMed]
- Jacob, S.; Kather, F.S.; Boddu, S.H.S.; Attimarad, M.; Nair, A.B. Nanosuspension Innovations: Expanding Horizons in Drug Delivery Techniques. Pharmaceutics 2025, 17, 136. [Google Scholar] [CrossRef] [Scilit]
- Kurakula, M.; El-Helw, A.M.; Sobahi, T.R.; Abdelaal, M.Y. Chitosan Based Atorvastatin Nanocrystals: Effect of Cationic Charge on Particle Size, Formulation Stability, and in-Vivo Efficacy. Int. J. Nanomed. 2015, 10, 321–334. [Google Scholar] [CrossRef] [Scilit]
- Sharma, M.; Mehta, I. Surface Stabilized Atorvastatin Nanocrystals with Improved Bioavailability, Safety and Antihyperlipidemic Potential. Sci. Rep. 2019, 9, 16105. [Google Scholar] [CrossRef] [Scilit]
- Priani, S.E. Formulation Strategies for Ezetimibe and Its Combinations: Advancing Biopharmaceutical and Therapeutic Potential. Drug Des. Dev. Ther. 2025, 19, 8555–8580. [Google Scholar] [CrossRef] [Scilit]
- Hou, H.H.; Jia, W.; Liu, L.; Cheeti, S.; Li, J.; Nauka, E.; Nagapudi, K. Effect of Microenvironmental PH Modulation on the Dissolution Rate and Oral Absorption of the Salt of a Weak Acid—Case Study of GDC-0810. Pharm. Res. 2018, 35, 37. [Google Scholar] [CrossRef] [Scilit]
- Younes, N.F.; El Assasy, A.E.H.I.; Makhlouf, A.I.A. Microenvironmental PH-Modified Amisulpride-Labrasol Matrix Tablets: Development, Optimization and in Vivo Pharmacokinetic Study. Drug Deliv. Transl. Res. 2021, 11, 103–117. [Google Scholar] [CrossRef] [Scilit] [PubMed]
- Taniguchi, C.; Kawabata, Y.; Wada, K.; Yamada, S. Microenvironmental PH-Modification to Improve Dissolution Behavior and Oral Absorption for Drugs with PH-Dependent Solubility. Expert Opin. Drug Deliv. 2014, 11, 505–516. [Google Scholar] [CrossRef] [Scilit] [PubMed]
- Liu, P.; Rong, X.; Laru, J.; Van Veen, B.; Kiesvaara, J.; Hirvonen, J.; Laaksonen, T.; Peltonen, L. Nanosuspensions of Poorly Soluble Drugs: Preparation and Development by Wet Milling. Int. J. Pharm. 2011, 411, 215–222. [Google Scholar] [CrossRef] [Scilit]
- Baka, E.; Comer, J.E.A.; Takács-Novák, K. Study of Equilibrium Solubility Measurement by Saturation Shake-Flask Method Using Hydrochlorothiazide as Model Compound. J. Pharm. Biomed. Anal. 2008, 46, 335–341. [Google Scholar] [CrossRef] [Scilit] [PubMed]
- BPOM RI. Peraturan Badan Pengawas Obat Dan Makanan (BPOM) Nomor 11 Tentang Tata Laksana Uji Bioekivalensi; BPOM RI: Jakarta, Indonesia, 2022; pp. 1–16. [Google Scholar]
- Bodratti, A.M.; Alexandridis, P. Formulation of Poloxamers for Drug Delivery. J. Funct. Biomater. 2018, 9, 11. [Google Scholar] [CrossRef] [Scilit]
- Tuomela, A.; Hirvonen, J.; Peltonen, L. Stabilizing Agents for Drug Nanocrystals: Effect on Bioavailability. Pharmaceutics 2016, 8, 16. [Google Scholar] [CrossRef] [Scilit]
- Trenkenschuh, E.; Friess, W. Freeze-Drying of Nanoparticles: How to Overcome Colloidal Instability by Formulation and Process Optimization. Eur. J. Pharm. Biopharm. 2021, 165, 345–360. [Google Scholar] [CrossRef] [Scilit]
- Zhang, X.; Guan, J.; Ni, R.; Li, L.C.; Mao, S. Preparation and Solidification of Redispersible Nanosuspensions. J. Pharm. Sci. 2014, 103, 2166–2176. [Google Scholar] [CrossRef] [Scilit]
- Shrestha, S.; Wang, B.; Dutta, P. Nanoparticle Processing: Understanding and Controlling Aggregation. Adv. Colloid Interface Sci. 2020, 279, 102162. [Google Scholar] [CrossRef] [Scilit]
- Yan, F.; Zhang, C.; Zheng, Y.; Mei, L.; Tang, L.; Song, C.; Sun, H.; Huang, L. The Effect of Poloxamer 188 on Nanoparticle Morphology, Size, Cancer Cell Uptake, and Cytotoxicity. Nanomed. Nanotechnol. Biol. Med. 2010, 6, 170–178. [Google Scholar] [CrossRef] [Scilit] [PubMed]
- Möschwitzer, J.P. Drug Nanocrystals in the Commercial Pharmaceutical Development Process. Int. J. Pharm. 2013, 453, 142–156. [Google Scholar] [CrossRef] [Scilit]
- Shegokar, R.; Müller, R.H. Nanocrystals: Industrially Feasible Multifunctional Formulation Technology for Poorly Soluble Actives. Int. J. Pharm. 2010, 399, 129–139. [Google Scholar] [CrossRef] [Scilit]
- Savjani, K.T.; Gajjar, A.K.; Savjani, J.K. Drug Solubility: Importance and Enhancement Techniques. ISRN Pharm. 2012, 2012, 195727. [Google Scholar] [CrossRef] [Scilit]
- Hodkinson, A.; Tsimpida, D.; Kontopantelis, E.; Rutter, M.K.; Mamas, M.A.; Panagioti, M. Comparative Effectiveness of Statins on Non-High Density Lipoprotein Cholesterol in People with Diabetes and at Risk of Cardiovascular Disease: Systematic Review and Network meta-analysis. BMJ 2022, 376, e067731. [Google Scholar] [CrossRef] [Scilit] [PubMed]
- Skorda, D.; Kontoyannis, C.G. Identification and Quantitative Determination of Atorvastatin Calcium Polymorph in Tablets Using FT-Raman Spectroscopy. Talanta 2008, 74, 1066–1070. [Google Scholar] [CrossRef] [Scilit] [PubMed]
- Galai, H.; Barrio, M.; Clevers, S.; Couvrat, N. European Journal of Pharmaceutical Sciences Does the Trihydrate of Atorvastatin Calcium Possess a Melting Point ? Eur. J. Pharm. Sci. 2020, 148, 105334. [Google Scholar] [CrossRef] [Scilit]
- Schönfeld, B.; Sundermann, J.; Keller, B.; Westedt, U.; Heinzerling, O. Transformation of ABT-199 Nanocrystal Suspensions into a Redispersible Drug Product—Impact of Vacuum Drum Drying, Spray Drying and Tableting on Re-Nanodispersibility. Pharmaceutics 2024, 16, 782. [Google Scholar] [CrossRef] [Scilit]
- Mutylo, E.; Navrátil, O.; Waněk, A.; Šembera, F.; Štěpánek, F. Formulation of Minitablets with Personalised Dissolution Profile by Fluid-Bed Granulation of drug Nanosuspensions. Int. J. Pharm. 2025, 669, 125013. [Google Scholar] [CrossRef] [Scilit] [PubMed]
- Food and Drug Administration. Bioequivalence Studies with Pharmacokinetic Endpoints for Drugs Submitted Under an ANDA; FDA Guidance Document; Food and Drug Administration: Rockville, MD, USA, 2021; p. 24. [Google Scholar]
- He, S.; Mu, H. Microenvironmental pH Modification in Buccal/Sublingual Dosage Forms for Systemic Drug Delivery. Pharmaceutics 2023, 15, 637. [Google Scholar] [CrossRef] [Scilit]
- Srivalli, K.M.R.; Mishra, B. Preparation and Pharmacodynamic Assessment of Ezetimibe Nanocrystals: Effect of P-Gp Inhibitory Stabilizer on Particle Size and Oral Absorption. Colloids Surf. B Biointerfaces 2015, 135, 756–764. [Google Scholar] [CrossRef] [Scilit]

Disclaimer/Publisher’s Note: The statements, opinions and data contained in all publications are solely those of the individual author(s) and contributor(s) and not of MDPI and/or the editor(s). MDPI and/or the editor(s) disclaim responsibility for any injury to people or property resulting from any ideas, methods, instructions or products referred to in the content. |
© 2026 by the authors. Licensee MDPI, Basel, Switzerland. This article is an open access article distributed under the terms and conditions of the Creative Commons Attribution (CC BY) license.