


Abstract
This article shows an analysis of interarea oscillations between the Iberian Peninsula and the rest of Europe using three reduced academic models of Red Eléctrica de España (REE). The original model has 10 nodes in 400 kV for REE, the other two models have 61 nodes in 400 kV for REE (with different meshing levels), and two 400 kV nodes represent Portugal and the rest of Europe in these models. The obtained frequency for interarea oscillations with these models is in the order of 0.22 Hz, which is very similar to the officially reported values during a recent real event, shortly before a general blackout, which were also in the order of 0.21 Hz. Thus, these reduced models are suitable for representing this phenomenon to some extent, and this fact is a contribution of this article. Two theoretical cases with extreme reductions in tie impedances with the rest of Europe were also simulated, and the results showed moderate increases in the frequency of interarea oscillations. Furthermore, the transient stability was also analyzed. Although the obtained critical clearing times and dynamic behaviors are relatively similar using the different analyzed models, the results confirm that a reduced dynamic model could be more suitable for the study of one phenomenon than for the study of another phenomenon. A novel simplified explanation of the frequency of the found interarea oscillations was developed and verified with results from numerical simulations; this is the main novelty of this article and it is very useful for an illustrative and conceptual description of this phenomenon since it is based on the well-known academic example of a single machine connected to an infinite bus.
1. Introduction
The reliable, safe and efficient operation of the electric power system has been traditionally supported by different types of system studies, such as load flow, short circuit, and stability analyses. Load flow analysis is applied to determine power flows, voltages, and losses of electric power systems under normal operation; short circuit analysis is applied to calculate fault currents in order to design and/or verify the protection system; and stability analysis is often referred to dynamic studies to assess the system’s ability to recover from disturbances. Fundamentals of electric power system dynamics and interarea oscillations have been described for a long time (e.g., [1,2]). Power system perturbations can cause local mode oscillations (from 1 to 2 Hz, approx.), or interarea oscillations (from 0.1 to 1 Hz, approx.), which are related to small-disturbance stability. Local mode oscillations typically correspond to an individual plant against the rest of the system, whereas interarea oscillations are typically between relatively large areas of interconnected power systems. In general, these natural oscillation modes can be explained from the set of system differential equations; their frequencies do not depend on the perturbation itself, and they are often analyzed by linearization of differential equations around an equilibrium point (and computing the corresponding eigenvalues, which are strongly related to the oscillation modes). On the other hand, there are critical clearing times for short circuits, and the analysis of these large perturbations is in the field of transient stability. In contrast, transient stability cannot be analyzed by linearization of differential equations (i.e., nonlinearities between voltage angular differences and generators’ transmitted power must be considered). Formally, small-disturbance stability and transient stability are grouped in the field of rotor angle stability [3] and this article deals to some extent with both subtopics of rotor angle stability.
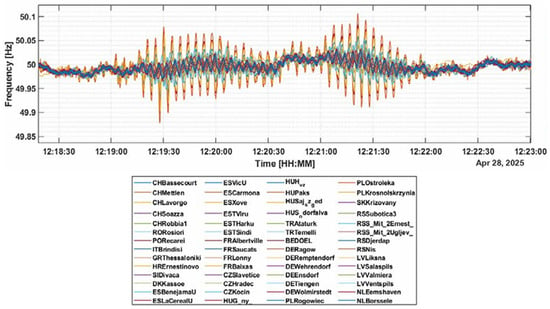
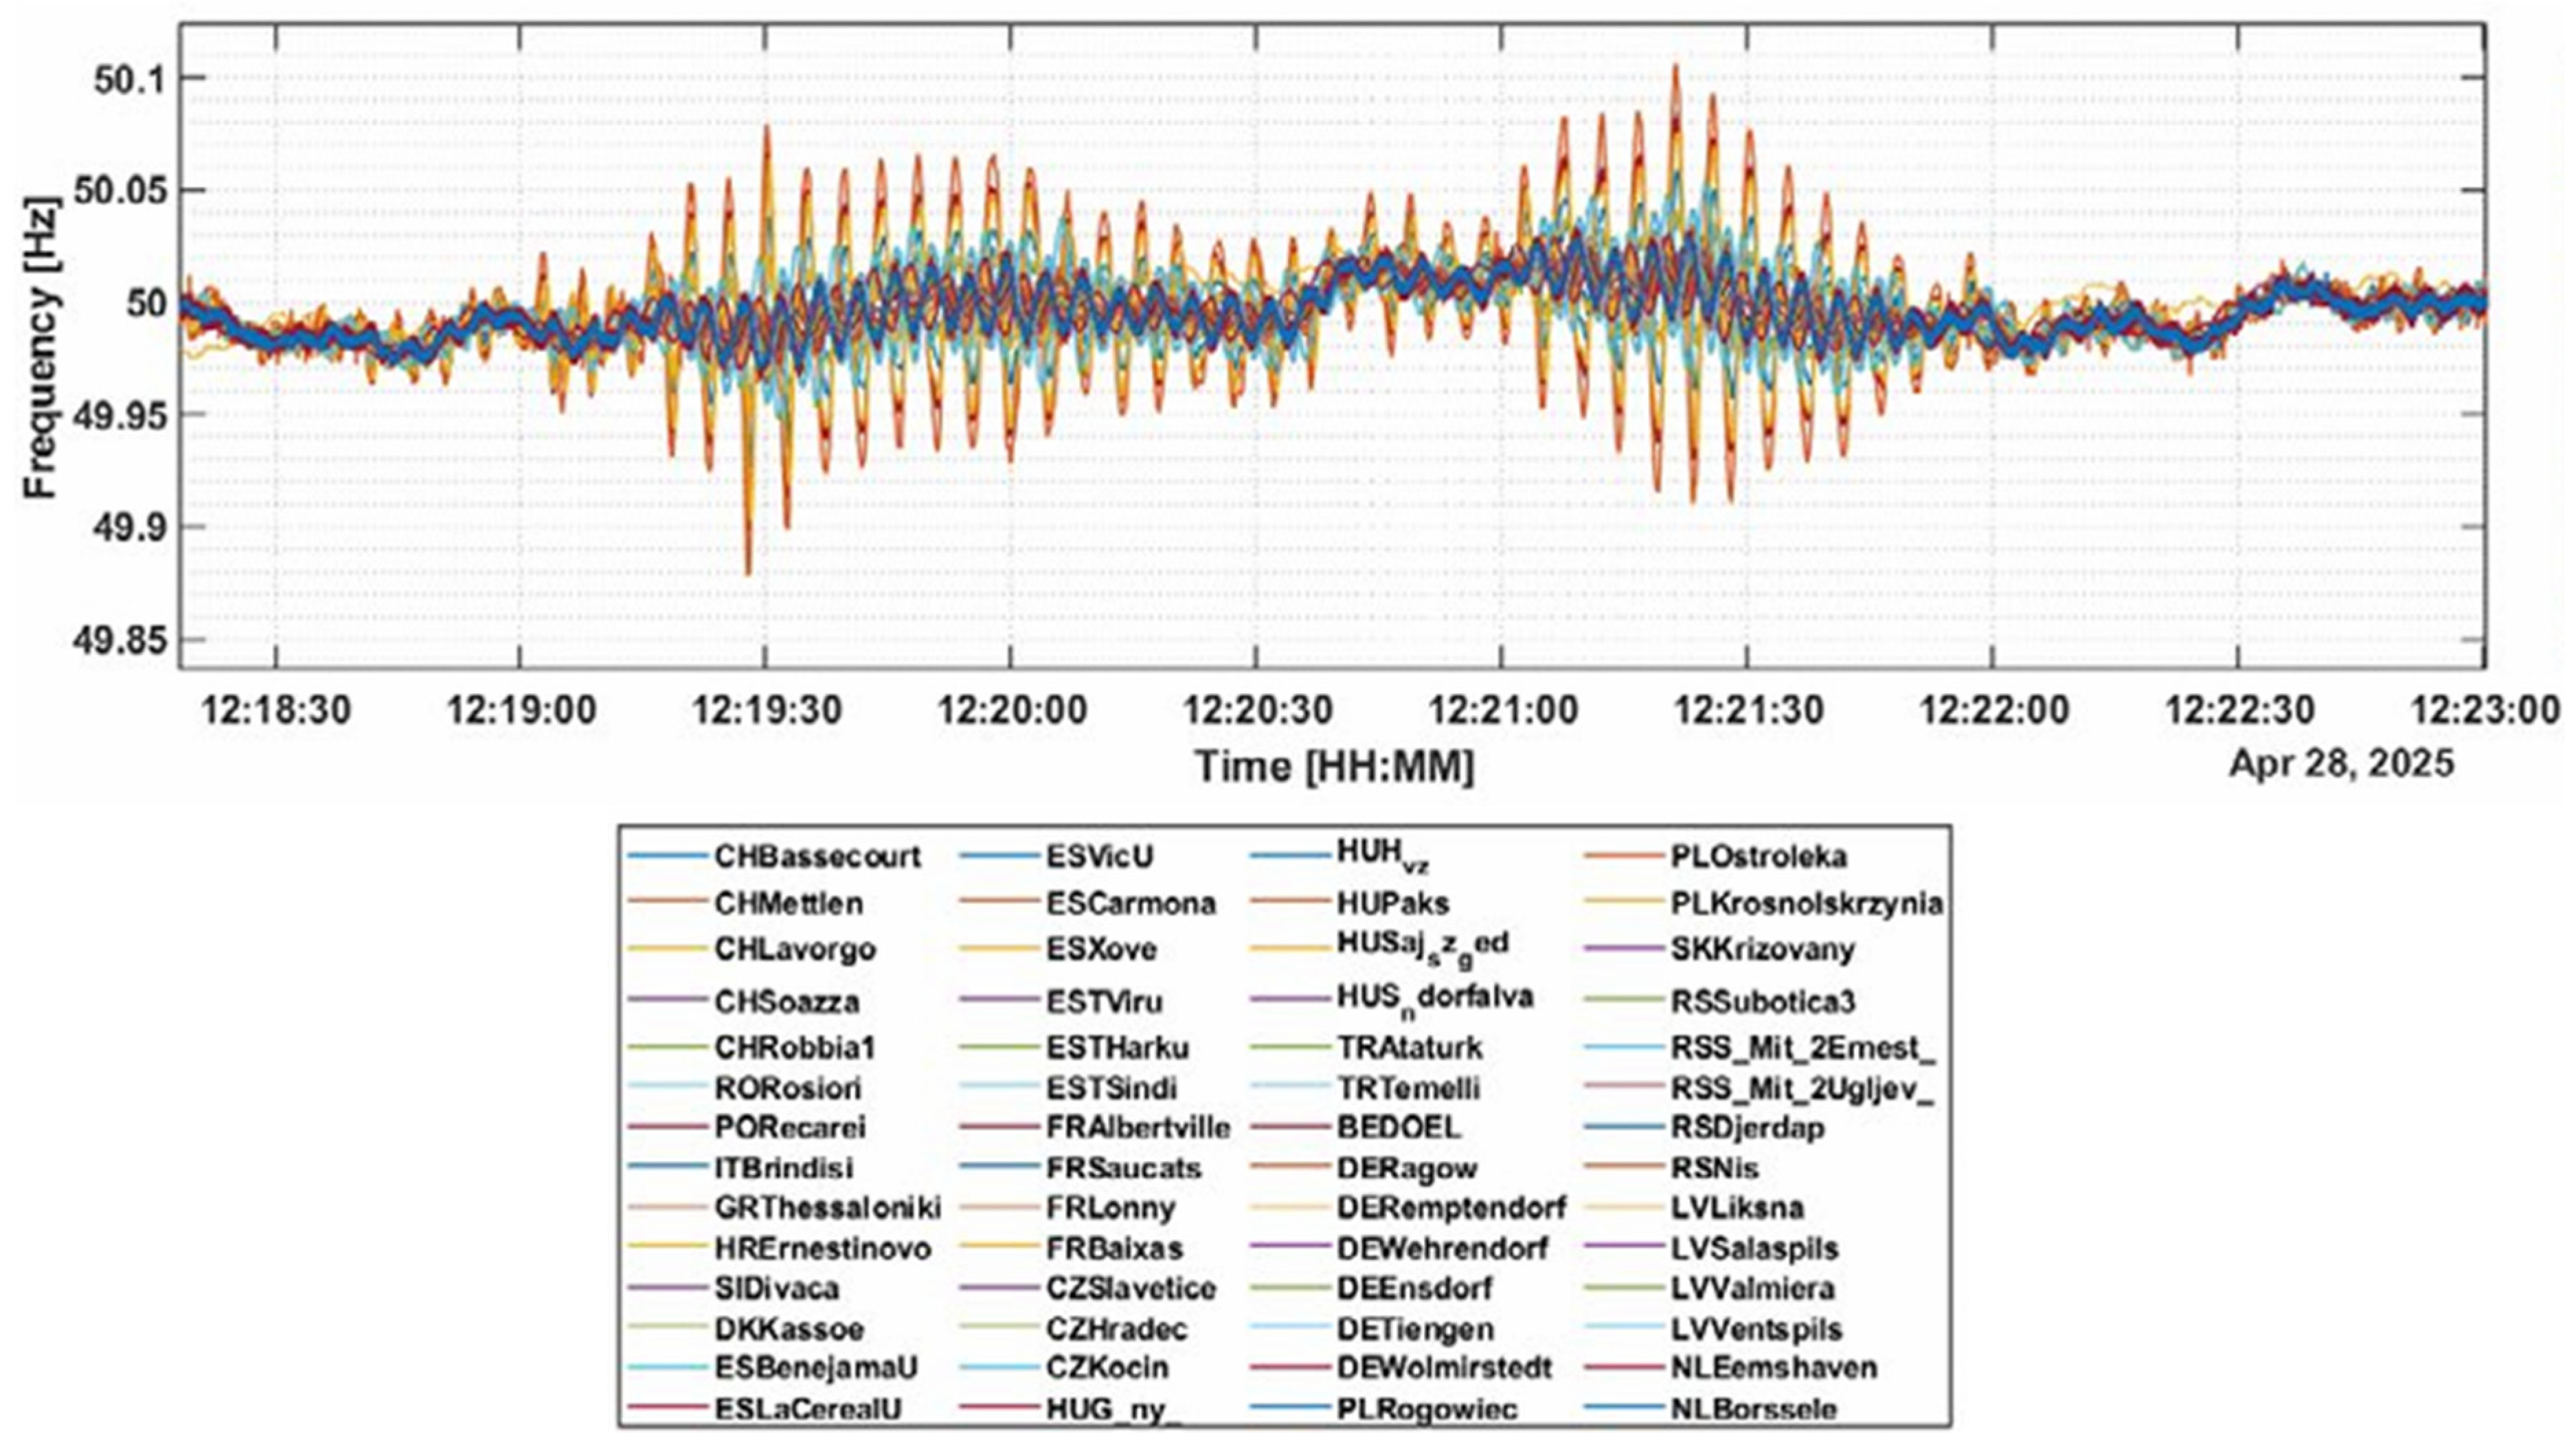
Unlike transient stability, which can be considered a well-known topic and is usually taught in the academic subjects on electric power systems, the knowledge about interarea oscillations is not so widely spread. Interarea oscillations are phenomena that can occur in large power grids, as in the case of the European synchronous area. Figure 1 shows an example of measured frequencies during interarea oscillations some minutes before a recent general blackout of the Iberian Peninsula [4,5], whose estimated frequency of oscillation has been reported in the order of 0.21 Hz [4] and 0.2 Hz [5]. An approximated value can be easily estimated by counting the number of peaks between instants 12:19:30 and 12:20:00 of Figure 1, since these 6.5 cycles in 30 s mean 0.217 Hz. This phenomenon was identified as “a classic inter-area oscillation of the East-Centre-West mode in the Continental European Synchronous Area” by ENTSO-E (the European pool of grid operators) [5]. The existence of these interarea oscillations only was known by many electric power system engineers after reading the detailed news about that recent general blackout of the Iberian Peninsula. However, certainly these interarea oscillations are usual since: (a) there is at least one report [6] that shows similar interarea oscillations after a 900 MW power plant outage in Spain (occurred on 17 January 1997), whose estimated frequency of oscillation was to some extent similar (0.26 Hz); (b) the transmission system operators of Spain and France have developed action guidelines to mitigate the effects of these usual interarea oscillations [4,5].
Figure 1.
Example of measured frequencies during interarea oscillations that occurred a few minutes before the general blackout of the Iberian Peninsula on 28 April 2025 [5].
On the other hand, an academic reduced model of Red Eléctrica de España (REE) was developed [7,8,9] at Universidad Carlos III de Madrid (UC3M) as a teaching tool, mainly related to a master’s course on power system dynamics and control. That original model has 10 nodes for REE in 400 kV and has been successfully applied to develop academic examples related to primary frequency control [7], secondary frequency control (also known as Automatic Generation Control, AGC) [8], and transient stability [9]. Interarea oscillations were first identified during the transient stability analysis of that original system with 10 nodes in 400 kV for REE. That is, regardless of the analyzed large disturbance (transient stability), that system is characterized by damped oscillations in the order of 0.2 Hz, after the first oscillation, and this frequency of oscillation is in the order of interarea oscillations. In order to gain insight into this phenomenon, two more detailed models were developed, with 61 nodes in 400 kV for REE instead of 10, and different meshing levels. In general, these reduced models are academic simplifications of the real REE system, characterized by having nearly 200 nodes in 400 kV and nearly 500 nodes in 220 kV. As interarea oscillations and transient stability are two different dynamic phenomena, each reduced model with 61 nodes in 400 kV for REE can behave more similarly to the original model (with 10 nodes in 400 kV for REE) for each of these phenomena. The problem of obtaining a reduced dynamic representation of electric power systems has also been analyzed for a long time [10,11,12,13,14], and it has been clearly highlighted that “reduced model of a power system that is suitable for the study of one phenomenon in that system is not necessarily suitable for the study of another phenomenon” [11]. Regarding the rotor angle stability, an IEEE Task Force on dynamic system equivalents [13] grouped the available techniques in modal methods (e.g., [10]), coherency methods (e.g., [12]), and measurement- or simulation-based methods (e.g., [14]). Therefore, from this perspective, the three reduced models of REE herein analyzed should not be considered “equivalent” models of the real REE system, which changes continuously due to system operation needs; they are simply academic representations that were developed in order to be relatively realistic.
There have been years of studies on reduced dynamic models for power systems, and this research topic is still very active (e.g., [15,16,17,18]). Nowadays, the influence of Inverter-Based Resources (IBR) on the power system dynamics is usually the main concern, and a recent review paper [15] on equivalent models for simulation of systems with IBR highlights that the proper simulation of IBR dynamics needs high-order models that demand substantial computational resources and mean significant simulation challenges, in comparison with traditional synchronous machine dynamics. Due to this, traditional measurement- and simulation-based methods have been complemented by hybrid models, and all of them have garnered considerable attention [15]. Furthermore, the diversity of equivalent modelling techniques means that the proper selection of appropriate models under different scenarios is not obvious [15]. Current challenges related to simulation credibility and equivalent models’ adaptability are also highlighted in [15]. Different IBR can share a common point of connection to the grid, and they have been simulated as a virtual power plant (e.g., [16]), but the difficulties for obtaining a reliable reduced model for these complex cases have been highlighted in [15]. On the other hand, the high penetration of IBR in distribution networks means a significant change in the dynamic interactions between distribution and transmission systems [17]. This means that reduction methods are necessary for the dynamic representation of distribution networks in transmission system simulations [17], but the corresponding reduced models must be used cautiously because diverse dynamic details can affect the results of the study [17]. Although the research on reduced dynamic models for systems with IBR is obviously important, the analysis of equivalent dynamic models for traditional power systems is still a research topic; for example, a method based on the bus impedance matrix was recently applied to compute the system equivalent impedances and inertias [18].
Nowadays, Phasor Measurement Units (PMUs) can be very useful for the obtaining and/or verification of power system dynamic models. The research on this topic has been really abundant; herein, only some very recent documents [19,20,21,22] are cited to illustrate some current trends in this field. An important effort for PMU deployment across the US has been complemented with an intensive data analysis of measured frequencies [19], and the conclusions about interarea oscillations were reported. They found that the dominant frequencies for interarea oscillations between 2010 and 2015 were around two values (0.2 and 0.4 Hz), but the corresponding frequency values have become less distinct for the period 2017–2023 [19]. Efforts for PMU deployment have been made by different countries; for instance, a recent document [20] describes the challenge to manage the information in the Colombian transmission system, using high-speed big data analytics for that purpose and highlighting the need to analyze the real-time measurements of the rate-of-change of frequency. On the other hand, there are also current efforts to develop reduced models based on PMU measurements; for instance, for the online estimation of area-level inertia considering interarea equivalent frequency dynamics [21], in a research based on simulations rather than on real PMU measurements. In general, results from simulations traditionally show the oscillation modes regardless of specific conditions that activate such oscillation modes in real-life; in order to deal with this problem, some current efforts are under way to predict interarea oscillations; for instance, machine learning techniques were applied in [22] to make predictions of interarea oscillations from PMU measurements.
This article shows an analysis of interarea oscillations between the Iberian Peninsula and the rest of Europe using three reduced academic models of REE. With the three models, the obtained frequency for the interarea oscillations is similar to the value measured for a recent real event, shortly before the general blackout occurred on 28 April 2025. On the other hand, with the three models, the critical clearing times for the analyzed short circuits (transient stability) are relatively similar from each other. Furthermore, two theoretical cases with extreme reductions in tie impedances with the rest of Europe were also simulated to obtain a wider perspective on these phenomena, and the results show the following: (a) the computed critical clearing times from the most meshed grid with 61 nodes are more similar to those from the model with 10 nodes; (b) the obtained frequencies of interarea oscillations from the less meshed grid with 61 nodes are more similar to those from the model with 10 nodes. That is, the similarity between dynamic models with different numbers of nodes depends on the analyzed phenomenon. Additionally, a simplified qualitative explanation of the frequency of these interarea oscillations is included in this article, and it is supported by the numerical results from the original system and the theoretical cases with extreme reductions in the tie impedances with the rest of Europe. Thus, the main contributions of this article are: (a) interarea oscillations between the Iberian Peninsula and the rest of Europe were analyzed with the help of reduced academic models of REE; (b) results for the frequency of interarea oscillations with the three reduced academic models of REE are similar to the value reported during a recent real event; (c) a novel explanation of the frequency of these interarea oscillations, based on a simple equation from the well-known example of a single machine connected to an infinite bus, is shown.
The main novelty of this article is related to the simplified way of explaining the nature of this phenomenon, and this simplicity is important from a pedagogical perspective (e.g., for students, or for those professionals who are not directly in charge of dealing with these problems); there is no precedent, in the reviewed literature, with similar explanations. Although this article is to some extent related to reduced models of electric power systems, which is a traditional research field that looks for relatively accurate reduced models (e.g., [10,11,12,13,14,15,16,17,18]), the goal of this article is not obtaining accurate models but qualitative representations (useful for a basic understanding of the phenomenon). On the other hand, although this article is to some extent related to the research on using PMUs to analyze the dynamics of power systems (e.g., [19,20,21,22]), because the analyzed reports [4,5] about the real event were based on PMU data (and their frequencies of interarea oscillations were taken as reference), the results of this article are only based on simulations with reduced academic models.
2. Brief Description of the Reduced Academic Models Under Study
Power system models under study are characterized by being reduced. As mentioned in the Introduction, the real REE system has several hundreds of nodes. Power system models under study have been developed for basic teaching purposes, and the decision of using reduced models was taken because considering a large number of nodes would play against the basic understanding of the topics. Furthermore, the reduced models under study also are characterized by being academic because they were built using the best general knowledge of academic persons in charge of their development, but without a direct comparison with results from more complete models (such as those that REE has, to run detailed simulations of the REE system); such a comparison has not been made yet. Furthermore, the real REE system topology is permanently changing, according to the real-time needs (e.g., scheduled generation changes every 15 min, to follow the electricity market results). Thus, these reduced academic models were built to be realistic to some extent, but they cannot be considered equivalent models of the real system.
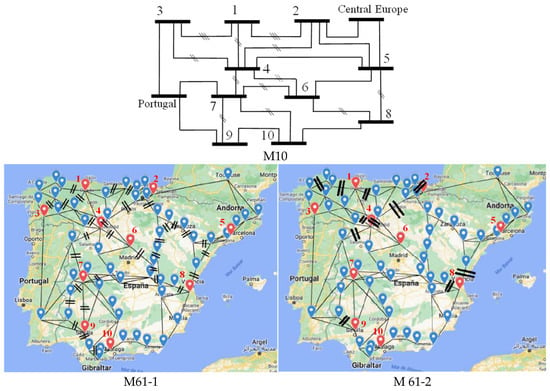
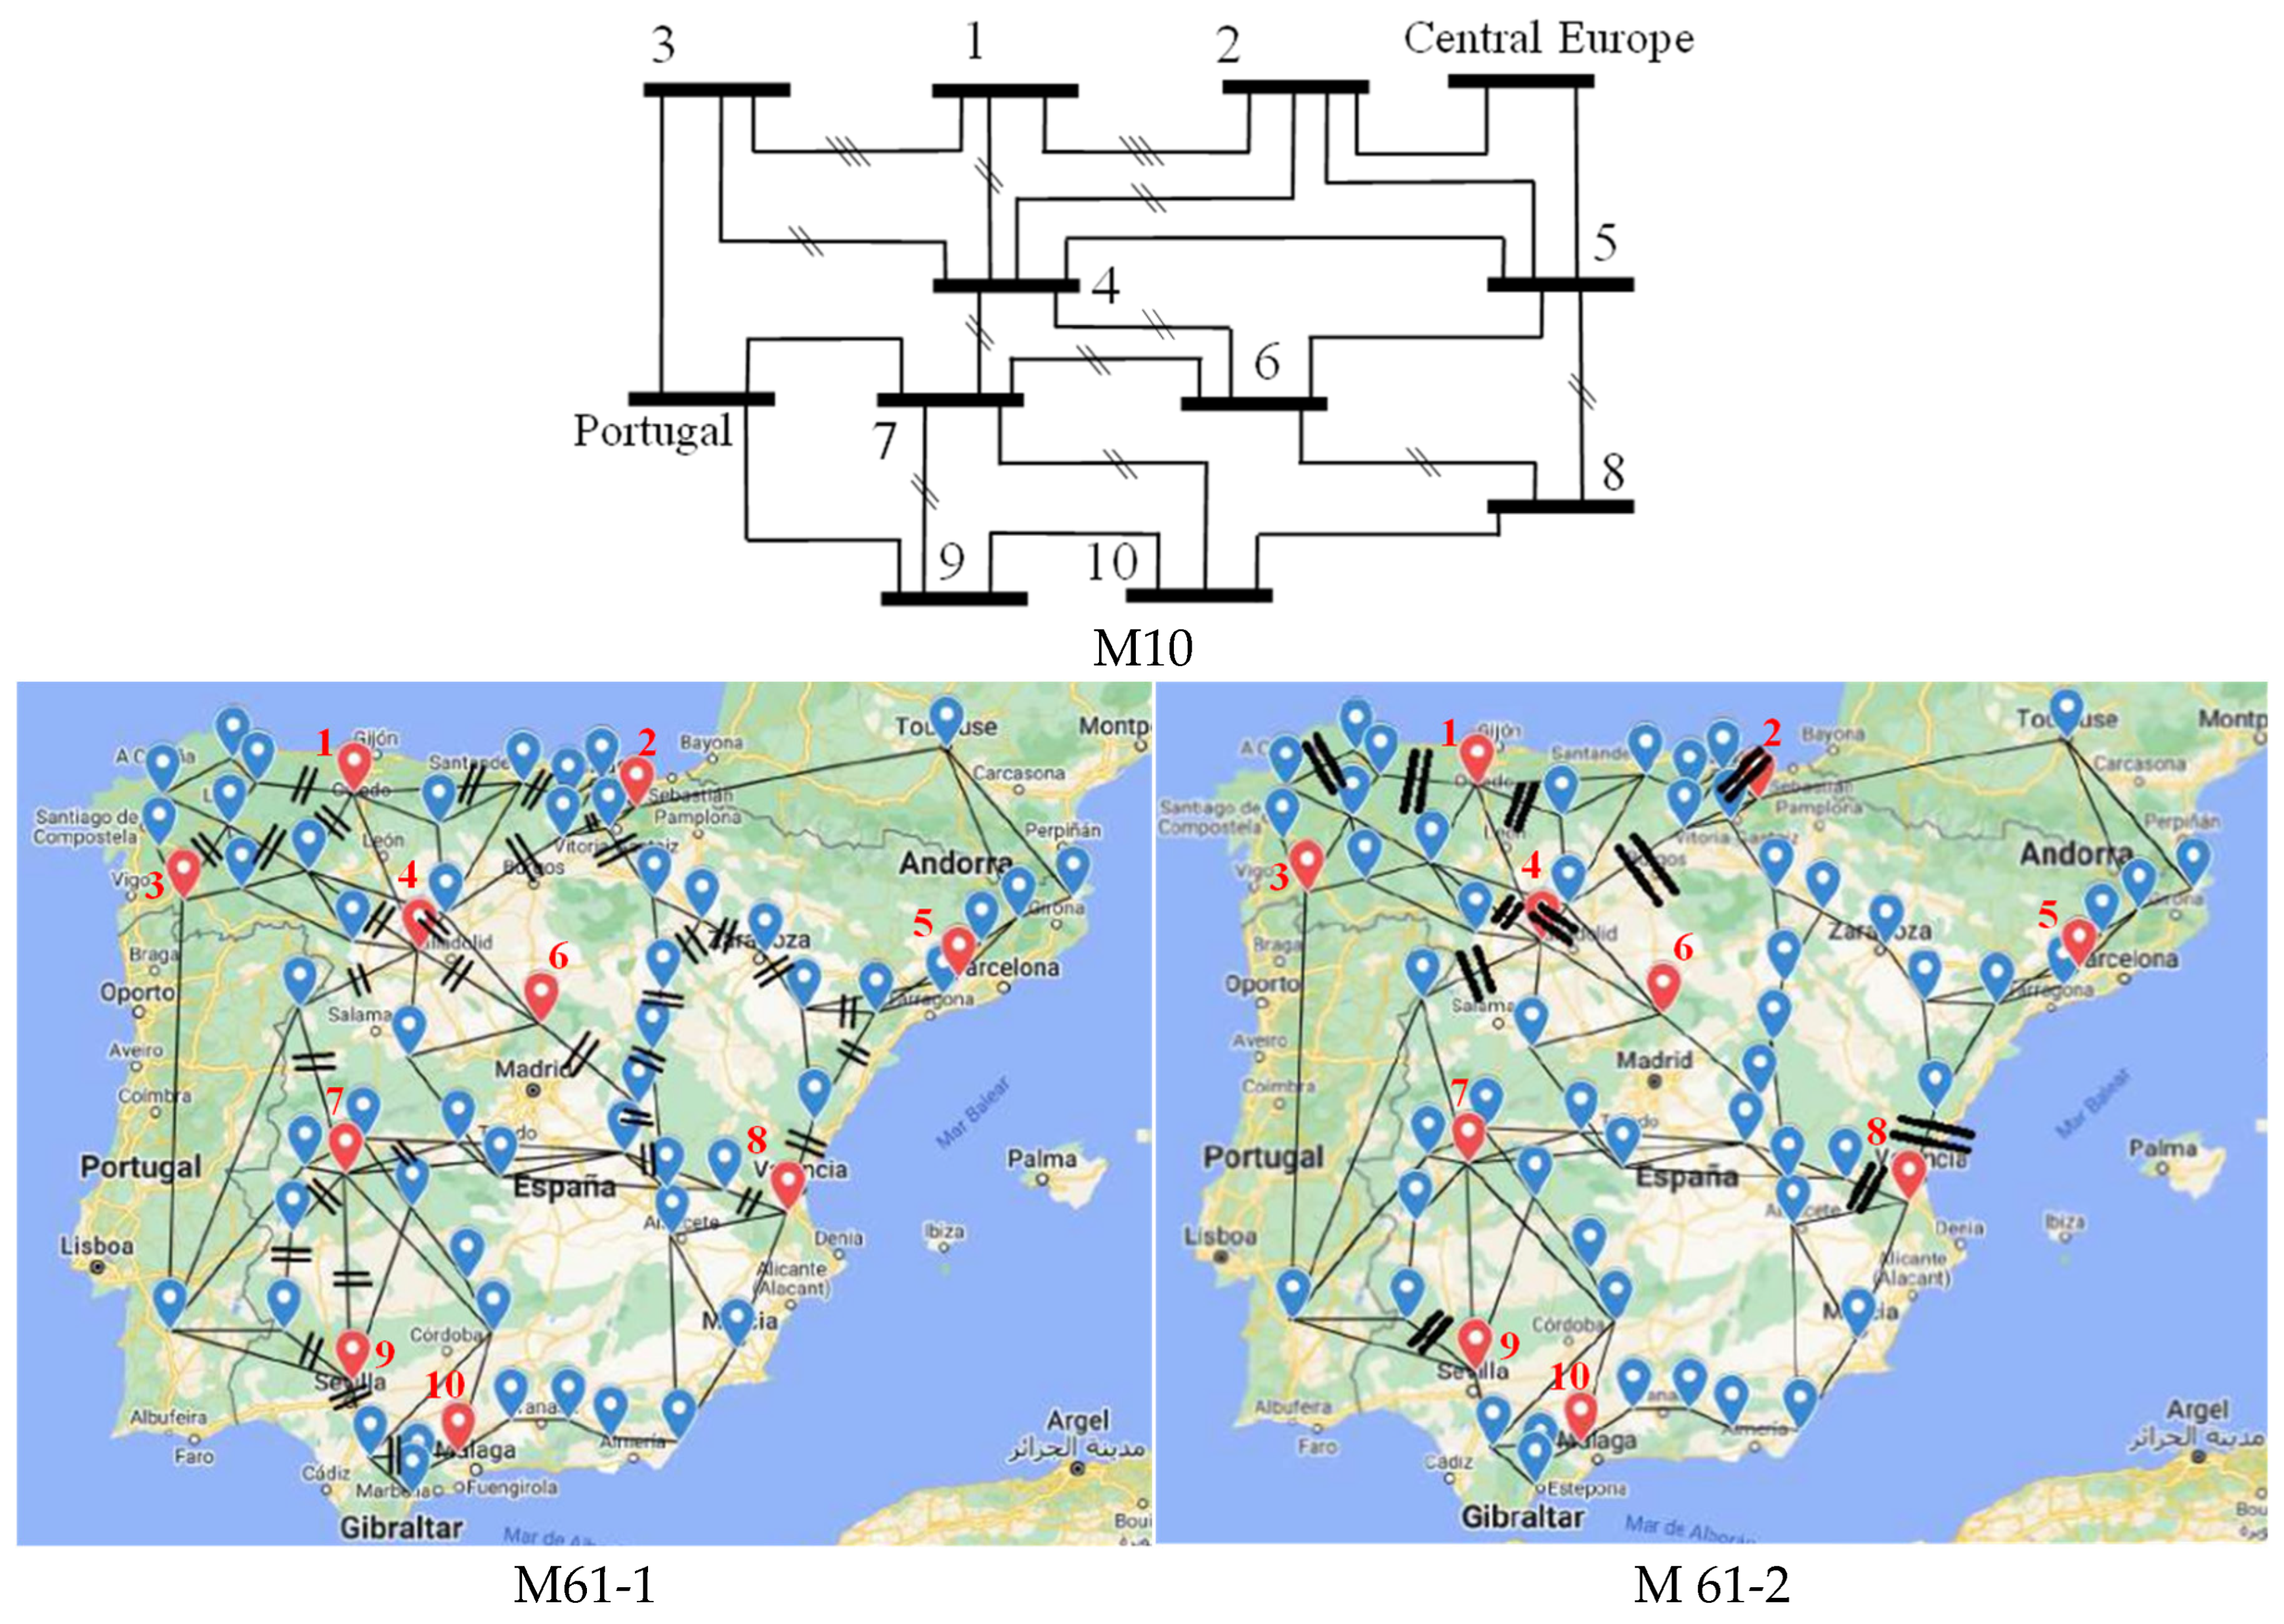
Figure 2 illustrates the analyzed system models. Each model is identified by the number of nodes in 400 kV for REE (M10 or M61, with 10 or 61 nodes, respectively), and two additional nodes in 400 kV represent the external grids (Portugal and Central Europe). The difference between M61-1 and M61-2 is the meshing level. M61-2 only has the evident parallel paths from a preliminary inspection of REE grid information, whereas M61-1 also considers additional parallel paths, due to a more detailed inspection of all the interconnections, at different voltage levels (a map with the transmission lines of the European grid can be seen at the ENTSO-E website [23]). Firstly, M61-2 was developed but the resulting short-circuit levels were relatively low, in comparison with those from M10, and this fact determined the need of building M61-1; however, although short-circuit levels from M61-1 were more similar to those from M10, it was not evident at all that M61-1 should be preferred (due to this fact, a brief analysis of both options is herein described, and a summary of a comparison among the three models is shown in Section 4.4).
Figure 2.
Sketches of analyzed models. M61-1 has more 400 kV lines in parallel than M61-2.
In Figure 2, the nodes of M61-1 and M61-2 corresponding to nodes of M10 are colored in red (only these node numbers are shown for the sake of figure clearness). A node of M10 is split into several subnodes for the M61 models, and the node numbering of M10 was kept in M61 for the sake of simplicity. Thus, in general, the correspondence between generators and transmission lines of models with different numbers of nodes is not direct. The largest units in the M61 subnodes (between parenthesis) of corresponding M10 nodes (without parenthesis) were selected for the comparison of results: 1 (1), 2 (12), 3 (16), 4 (22), 5 (33), 6 (42), 7 (7), 8 (8), 9 (9), 10 (10).
Each 400 kV node has a 400 kV/220 kV transformer [7]; loads and generators are located in the 220 kV nodes, but the transmission lines at 220 kV are not included in these models. Each 220 kV node has thermal and hydro units, except in Central Europe and Portugal, which are only represented with thermal units. In general, three options were considered for the dynamics of wind and photovoltaic generation [7]: without dynamics (option A), or with a behavior similar to synchronous thermal units, considering inertia emulation or not (options B or C, respectively). Only option A was herein considered for the sake of brevity. Demand scenarios can be varied, using the REE website data [24], and data for Portugal and Central Europe were estimated from ENTSO-E statistical reports; only the summer-peak demand scenario is herein analyzed. Generation and load in REE nodes were obtained applying distribution factors, estimated from REE statistical reports. Models for speed governors and Automatic Voltage Regulators (AVR) are included, but not for Power System Stabilizers (PSSs). More details about dynamic models are described in [7,8,9] for M10; in general, the main data of M61 are identical to those of M10, for the sake of coherency and simplicity.
All the simulations were performed in PSS/E [25]. Load flow analysis was necessary to: (a) refine the rated MVA values for REE transformers in M61 models, considering the different demand scenarios (2 values were set in 3000 MVA, 4 values in 2400 MVA, 16 values in 1200 MVA, and 39 values in 600 MVA); (b) refine generation conditions for the summer-peak demand scenario (12 buses were set with power factor of 0.95, and the voltage was specified as 1 pu in 9 buses, 0.99 pu in 6 buses, and 0.97 pu in the remaining buses). Short circuit levels were computed, and the results for model M61-1 are the most similar to those of M10 (e.g., in Almaraz and Ascó, two nuclear plants, the results are in the order of 29 kA for M61-1, in the order of 32 kA for M10, and in the order of 29 kA for the REE report taken as reference [26]). All the dynamic simulations consider three-phase solid faults in transmission lines, very near to one line-end, cleared simultaneously at both line-ends.
3. Analysis of Found Interarea Oscillations
This section shows results obtained by dynamic simulations in PSSE, which means that the set of differential equations describing the power system behavior are solved by the applied software. For the sake of clearness and conciseness, only rotor angles of thermal units are herein shown in the graphs of results. Rotor angles were selected as variables to be drawn because they are natural variables for the analysis of rotor angle stability (i.e., transient stability and small-disturbance stability). In case of oscillation modes, the frequency of oscillations can be observed in different variables, such as rotor angles, active powers, frequencies, etc. Software results of rotor angles are with respect to a synchronous reference; as it was considered preferable to show the rotor angles with respect to one specific machine taken as reference, those software results were simply exported in order to perform the corresponding subtraction in a spreadsheet (and to show the corresponding graphs from the spreadsheet).
The found interarea oscillations are similar for all the analyzed cases, corresponding to different fault locations and clearing times. For the sake of brevity, only the base case is herein shown, which corresponds to a fault in line 7–9 of M10, very near to bus 7, cleared in 0.1 s. This line also exists in the M61 models. There is a nuclear plant (Almaraz) in bus 7, and the generation amount in bus 7 is similar in M10 and M61 models.
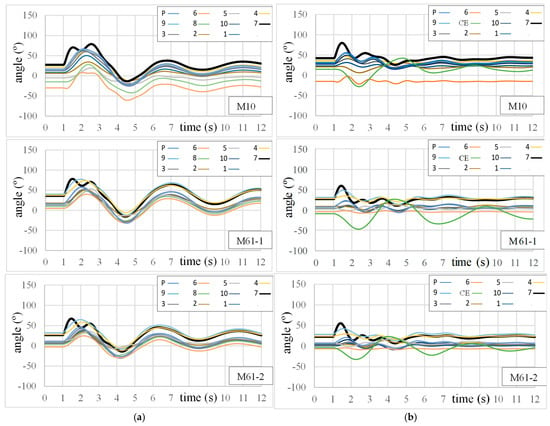
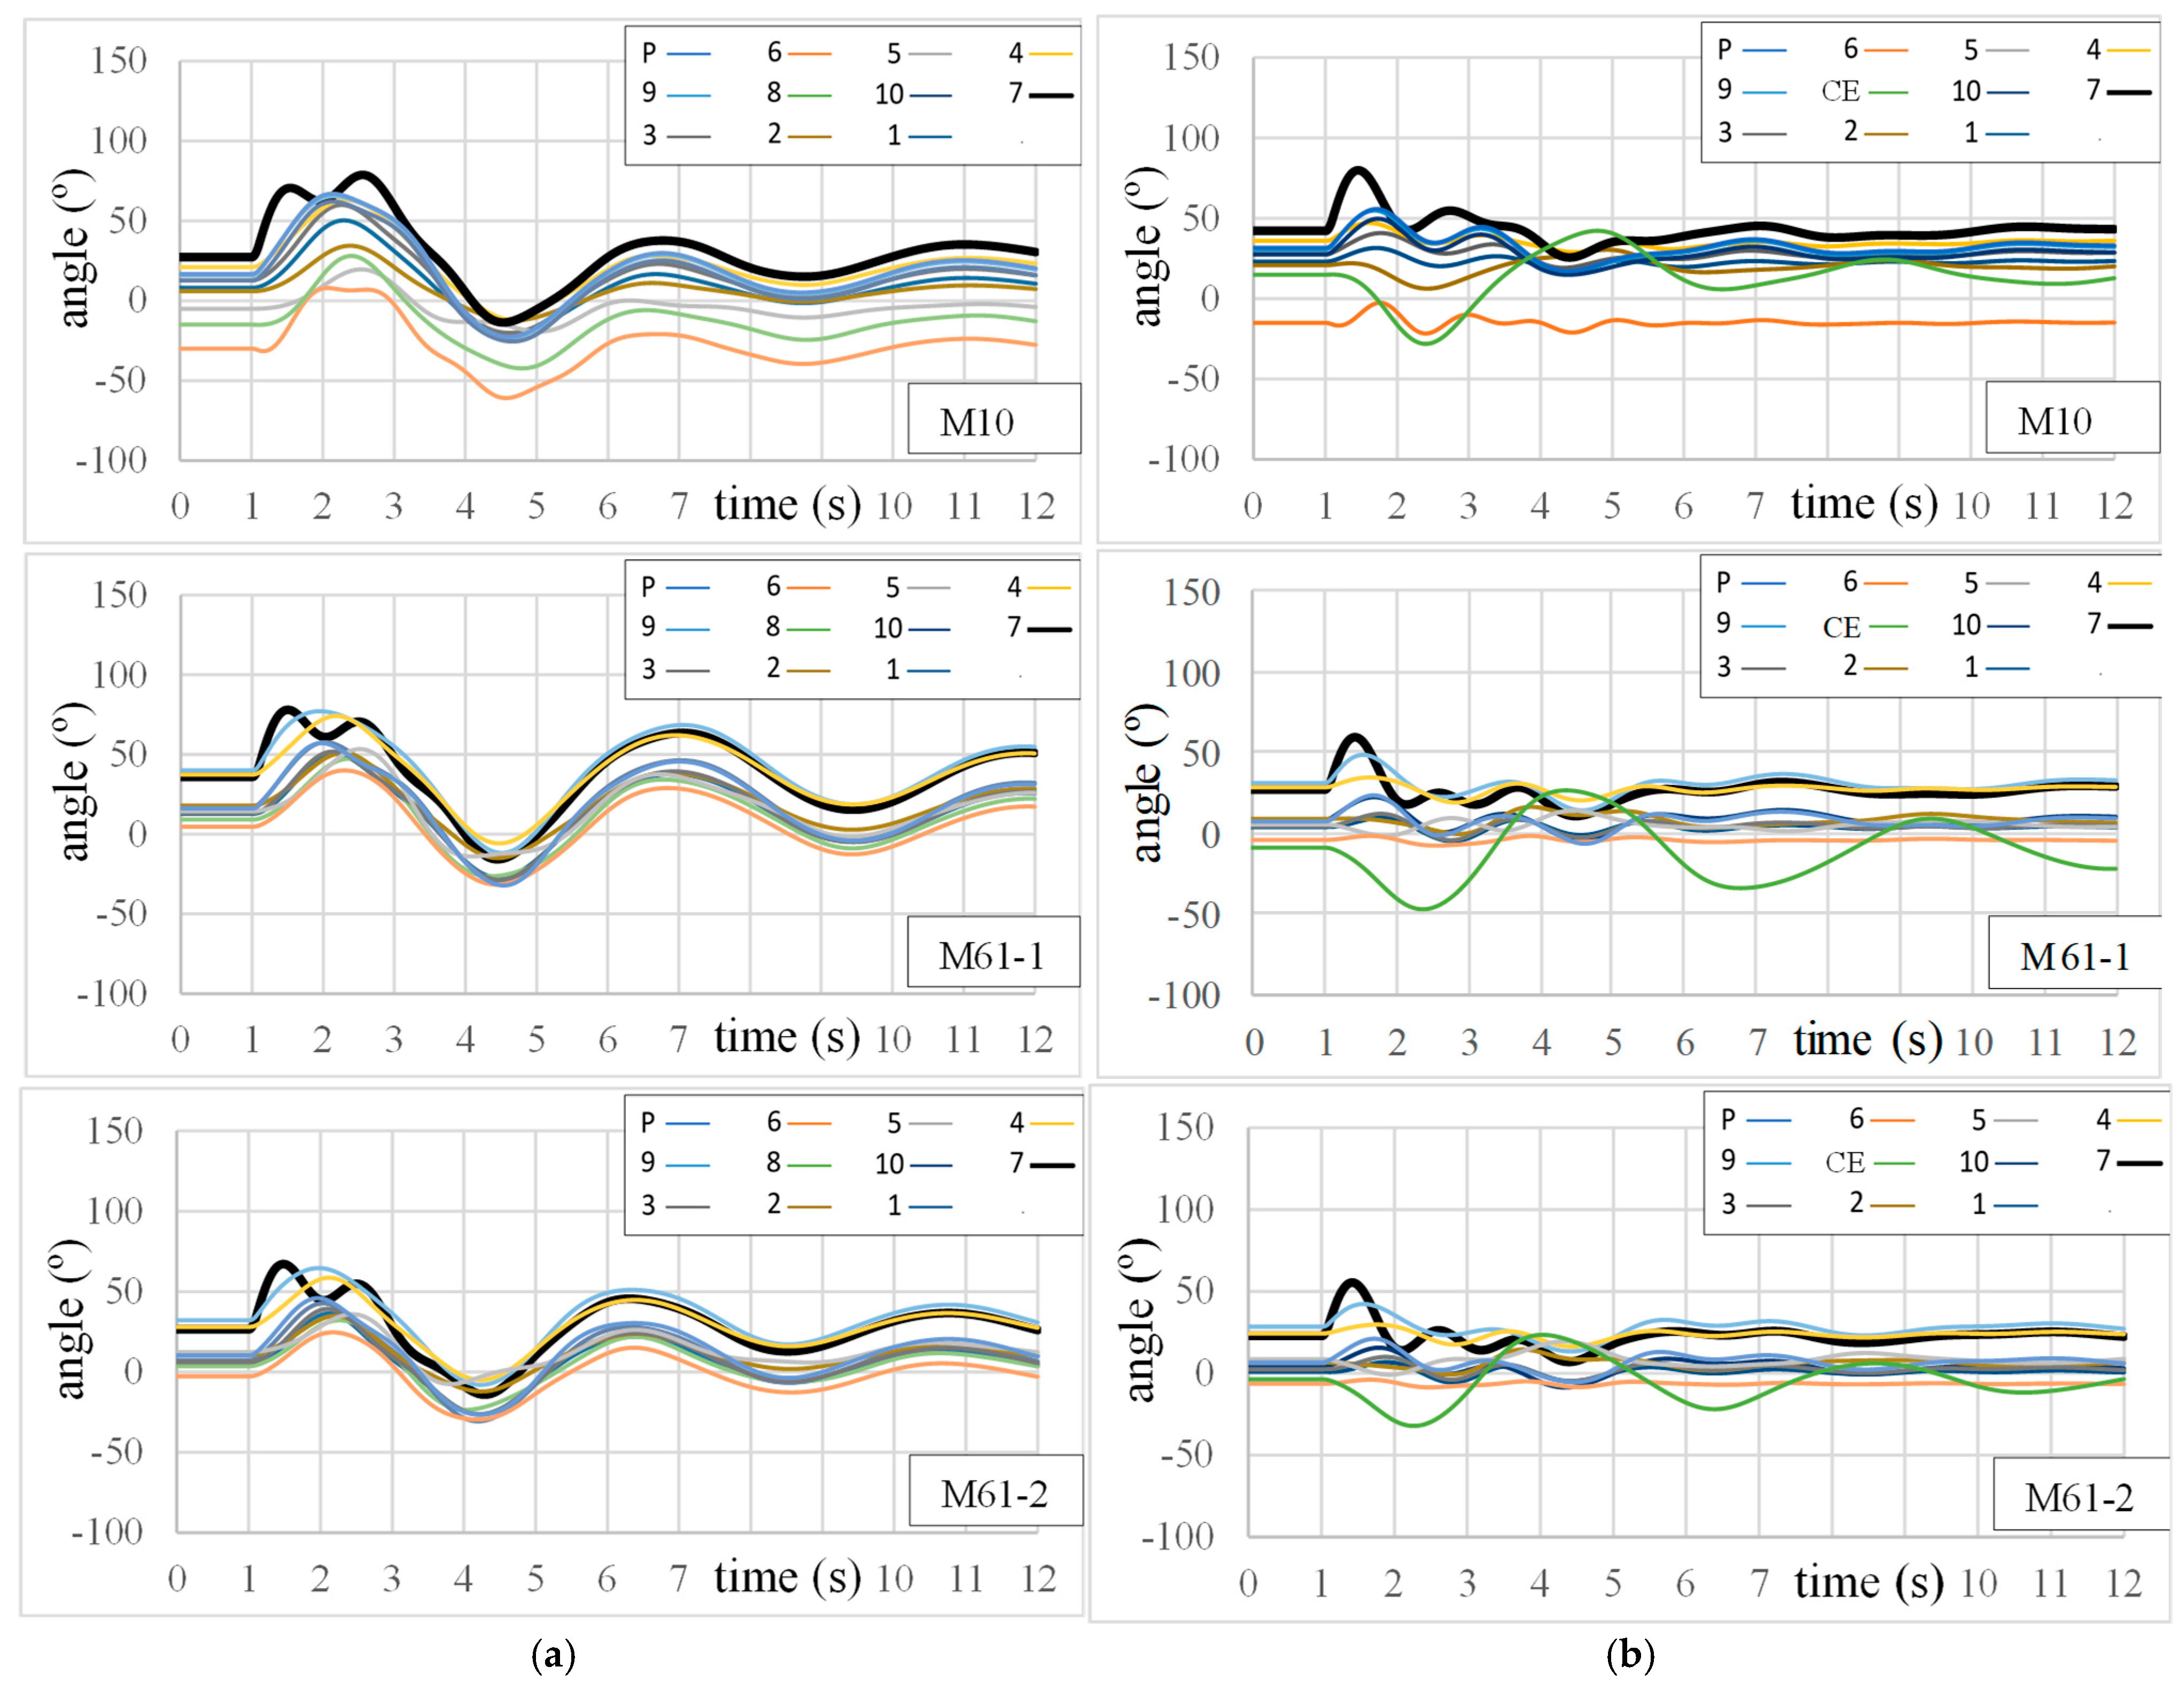
The rotor angles are shown taking Central Europe as reference in Figure 3a, and taking node 8 as reference in Figure 3b. Generators are numbered according to M10 nodes, and P is Portugal and CE is Central Europe. The result for unit 7 was highlighted simply because a faster local mode can be easily seen in that case.
Figure 3.
Dynamics of rotor angles for the base case. (a) Central Europe was taken as the reference; (b) the thermal unit at bus 8 was taken as the reference.
In Figure 3a, it is easy to see that all the generators of the Iberian Peninsula tend to oscillate synchronously, and the frequencies of the main oscillations are in the order of 0.23 Hz, 0.21 Hz and 0.23 Hz for models M10, M61-1 and M61-2, respectively. These frequencies were estimated by a simple average of time intervals between peaks. On the other hand, it is not so easy to notice the interarea oscillations in Figure 3b because their frequencies are mainly found in the angles of Central Europe (but the faster local modes are easier to be identified in Figure 3b than in Figure 3a).
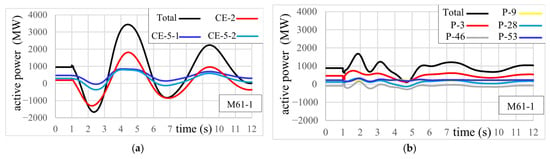
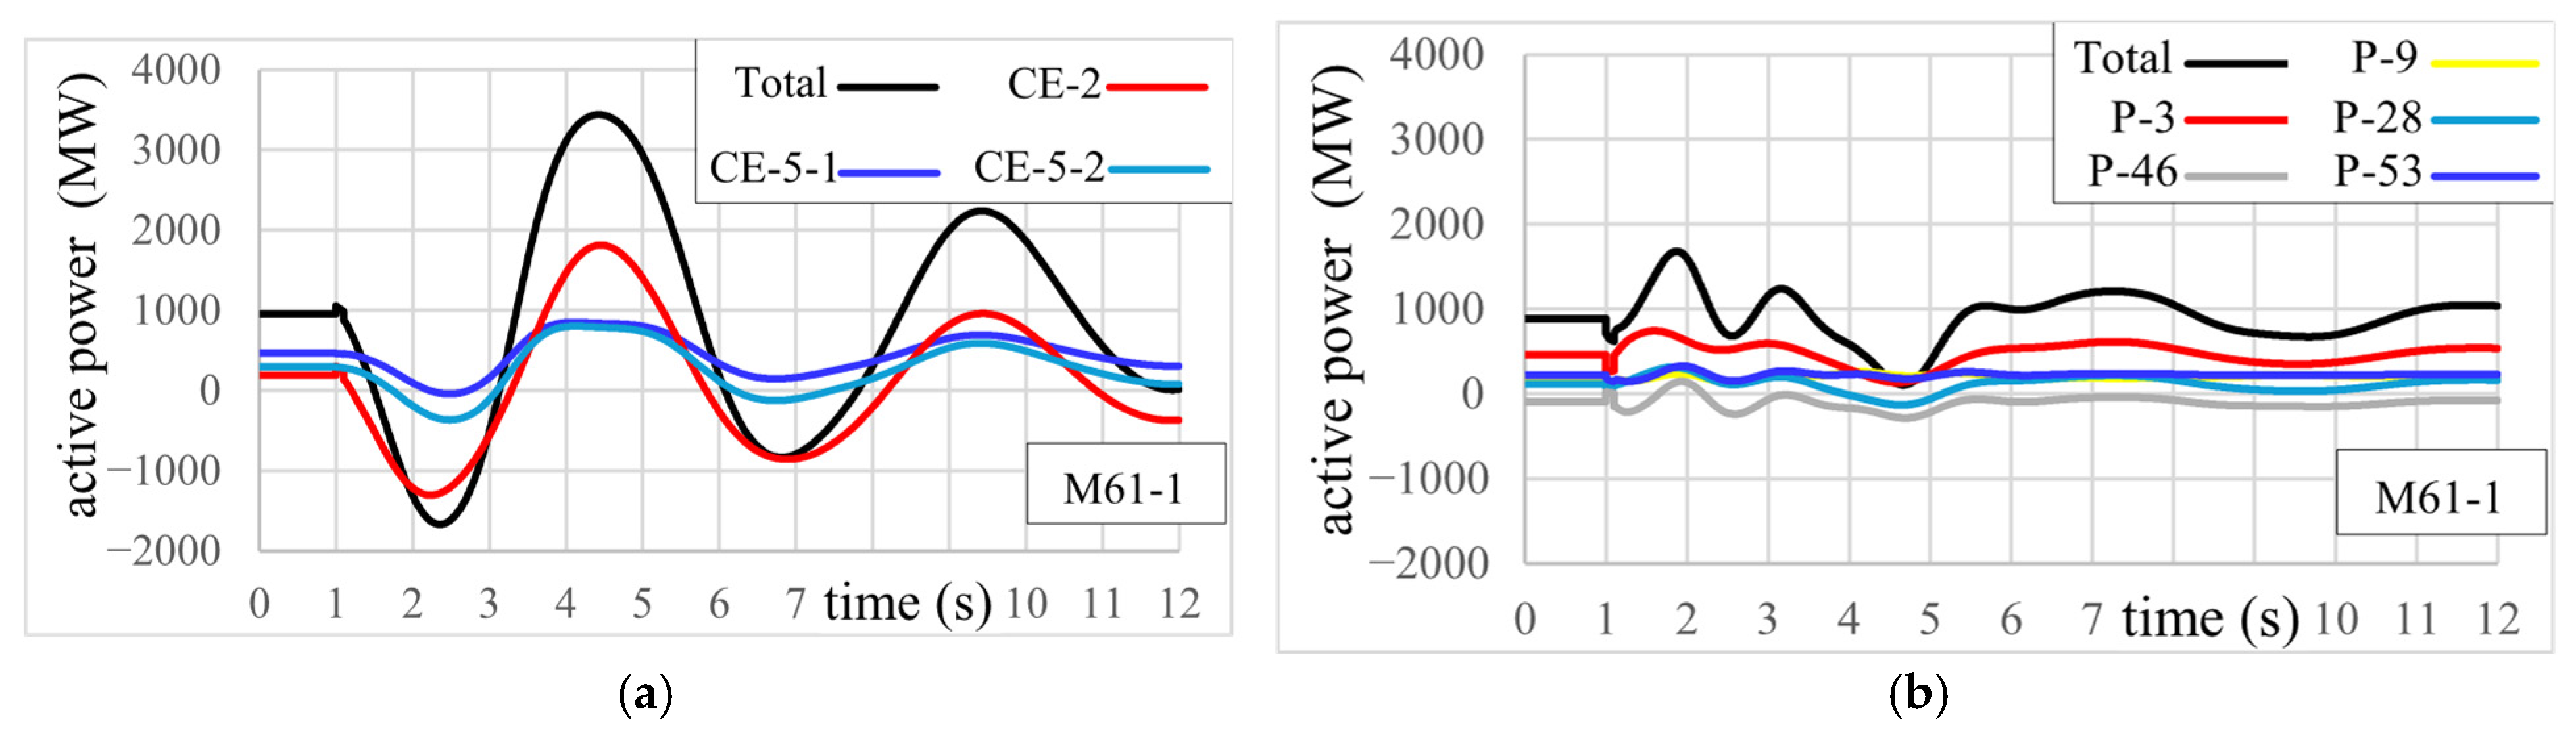
Figure 4 shows the active power from Central Europe and from Portugal towards REE (through each tie line, and the net sums), computed from model M61-2. In the case of Central Europe (Figure 4a), the tie line CE-2 is directly connected to node 2, and the tie lines CE-5-1 and CE-5-2 are connected to two subnodes of node 5, as shown in Figure 2. It is easy to identify that the frequency of oscillations corresponds to that of the graphs shown in Figure 3a. In the case of Portugal (Figure 4b), the contribution to local-mode oscillations is evident at the beginning; later, those oscillations are damped and the contribution to interarea oscillations is predominant. At t = 9.4 s (approx.), the faster local-mode oscillations have been damped and: (a) a peak of power from Central Europe can be seen in Figure 4a; (b) Figure 4b shows that a part of that power goes to Portugal. Thus, at this instant of the interarea oscillation (t = 9.4 s, approx.), the sign of the deviation of the net power injected to 400 kV nodes is positive in the case of Central Europe, and negative in the case of Spain and Portugal. These results are helpful to confirm that these interarea oscillations are between Central Europe and the Iberian Peninsula (Spain and Portugal).
Figure 4.
Active power from external grids for M61-1 in the base case. (a) from Central Europe; (b) from Portugal.
4. Additional Comparisons Among Results from Analyzed Models
In order to perform additional comparisons among the analyzed models, two theoretical cases of extreme reductions for the tie impedances with Central Europe were analyzed. These cases are named R1 and R2; the impedance of the 400 kV/220 kV transformer for Central Europe is set to zero for both cases. In the case of R2, the impedances of tie lines with Central Europe are also set to zero. R0 is the case without these reductions in the tie impedances with Central Europe. The results of this section were also obtained from dynamic simulations in PSSE.
Notice that comparisons among different dynamic models of a given power system can be performed by considering the behavior of different variables, such as critical clearing times for some faults, main frequencies of oscillation (small-signal analysis), voltage dynamics, etc. Herein, the objective is not to show all the possible differences among the analyzed models, but only to show the behavior of some representative selected topics: critical clearing times (for a subset of possible faults, for the sake of brevity), frequency of interarea oscillations, and dynamics of stable and unstable limit cases.
On the other hand, as highlighted in the Introduction, a reduced model that is suitable for analyzing a phenomenon in a given system is not necessarily suitable for analyzing another phenomenon [11]. That is, Section 2 indicates that results from M61-1 are more similar to those from M10 in terms of short-circuit levels, and Section 3 shows that the opposite occurs in terms of the frequency of interarea oscillations. Additional comparisons are shown in this section, but it is necessary to keep in mind that one model is not necessarily better than another in all the features being compared.
Notice that the frequency of interarea oscillations from the three reduced models is similar, to some extent, to the reported values during the real event mentioned in the Introduction. However, that concordance in the frequency of oscillation cannot be considered sufficient to establish the accuracy of a dynamic model. That is, these three reduced academic models should not be considered an equivalent representation of the REE system (and cannot be intended to be considered as such).
4.1. Influence of Reductions in Tie Impedances on Critical Clearing Times
The way to obtain critical clearing times is by increasing the simulated clearing time until the system reaches instability, characterized by an uncontrolled divergence of rotor angles (loss-of-synchronism). The resolution used to obtain critical clearing times was 0.01 s for all the cases herein shown. Table 1 shows the critical clearing times for a fault in line 7–9, very near bus 7, with the 3 reduced models, for cases R0, R1 and R2. In general, results with model M61-1 are closer to those of M10.
Table 1.
Critical clearing times for a fault in line 7–9, very near bus 7.
Table 2 shows the critical clearing times for other fault locations, only for model M10. Only the case R2 for fault very near to bus 2 is considerably different from the case R0. In this set of fault locations, only faults very near to bus 2 are near to Central Europe (and such faults are very near to Central Europe only in case R2).
Table 2.
Critical clearing times for other fault locations, using model M10.
4.2. Influence of Reductions in Tie Impedances on Frequency of Interarea Oscillations
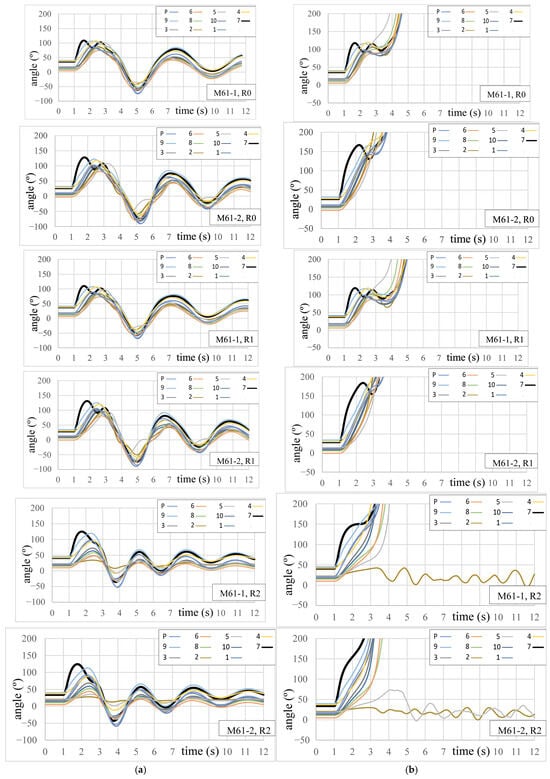
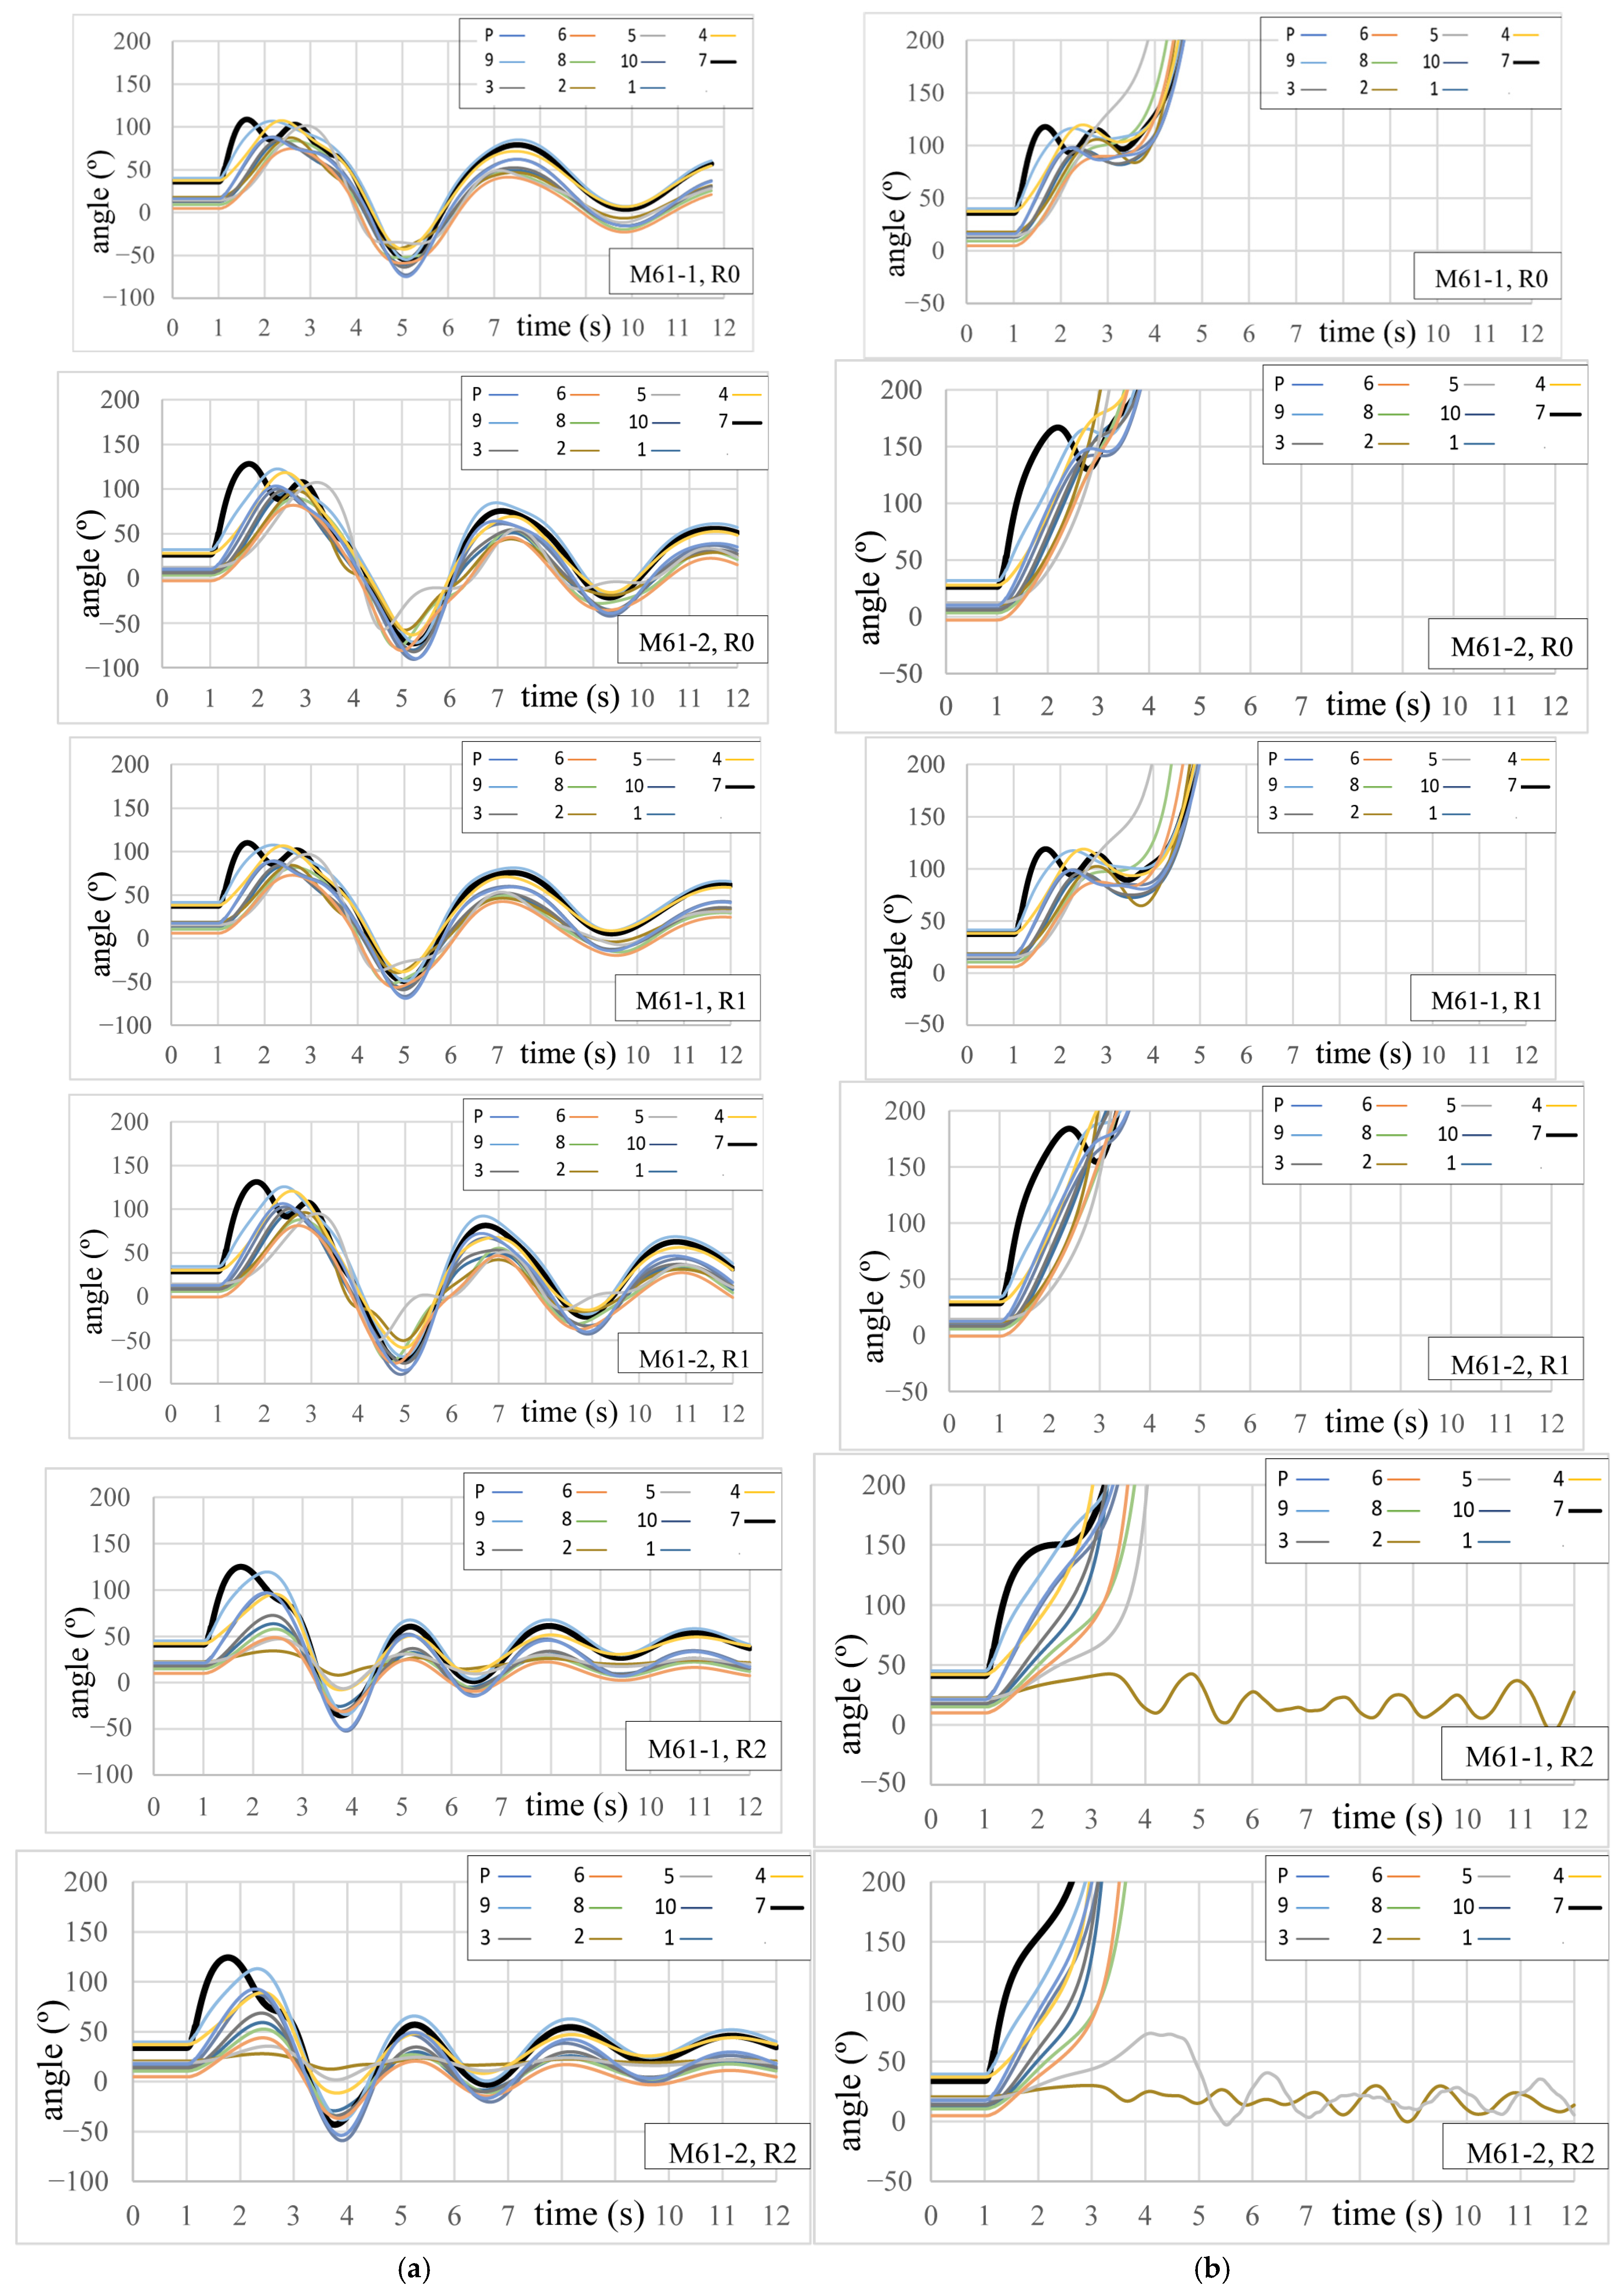
Figure 5a shows the rotor angles with respect to Central Europe for the fault in line 7–9, very near to bus 7, cleared in the critical clearing times shown in Table 1, in cases R0, R1 and R2 of models M61-1 and M61-2. Estimated frequencies of interarea oscillations are shown in Table 3. A reduction of tie impedances with Central Europe implies an increase in the frequency of interarea oscillations in all the analyzed cases. A detailed explanation of this fact is shown in Section 5.
Figure 5.
Rotor angles with respect to Central Europe, for a fault in line 7–9, near bus 7, in the limit cases of models M61-1 and M61-2. (a) Stable limit cases; (b) unstable limit cases.
Table 3.
Frequencies of interarea oscillations shown in Figure 5a.
4.3. Influence of Reductions in Tie Impedances on the Dynamics of Unstable Cases
Figure 5b shows the rotor angles with respect to Central Europe for the fault in line 7–9, very near to bus 7, cleared 0.01 s later than the critical clearing times shown in Table 1, in cases R0, R1 and R2 of models M61-1 and M61-2. Effect of reduction R1 is relatively low for both models. Reduction R2 is really extreme; due to this fact, some units remain synchronized to Central Europe instead of the Iberian Peninsula in this case.
4.4. Summary of Comparisons and Analysis of Results
Model M61-1 is more similar to model M10 in terms of short circuit levels (as described in Section 2) and critical clearing times (as described in Section 4.1), but model M61-2 is more similar to model M10 with respect to the frequency of interarea oscillations (as described in Section 3). This result means that the similarity between dynamic models with different numbers of nodes depends on the analyzed phenomenon. The differences in meshing levels of both M61 models were obtained by addition of 400 kV transmission lines in parallel, which reduces short circuit net impedances but also increases their capacitive effects at pre-perturbation stage (with the corresponding influence on the excitation of synchronous generators). These phenomena have an important effect on the similarities and differences in the obtained results. Furthermore, a reduction of tie impedances with Central Europe implies an increase in the frequency of interarea oscillations, and this fact is further analyzed in Section 5.
5. Simplified Qualitative Explanation of the Frequency of These Interarea Oscillations
5.1. Description of the Proposed Simplified Explanation
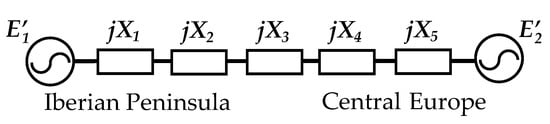
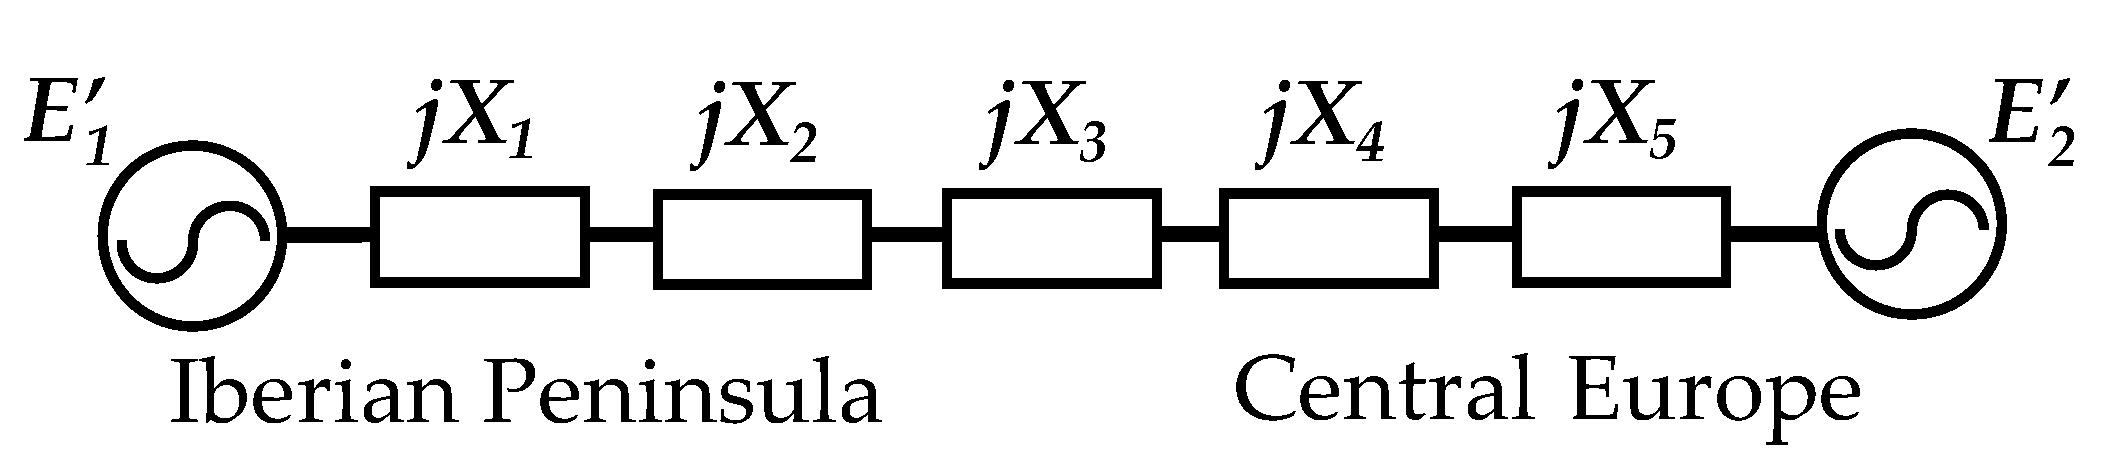
Traditional and rigorous academic explanation of interarea oscillations is usually based on eigenvalues and participation factors [1], corresponding to the set of differential equations that describe the power system dynamics. As each generator is described by several state variables, and the number of generators is relatively high, the problem dimension is usually considerably large, and it is usually solved by numerical simulation (as in the case of the results of the previous sections, which were obtained with the help of PSSE). A simplified conceptual explanation is herein shown, taking advantage of the particularities of the analyzed case, characterized by a part of the system (the Iberian Peninsula) connected to a strong power system (the rest of the European grid) through relatively weak tie lines. Results from this simplified explanation will be qualitatively compared with those from the previous sections, in order to verify their validity. This conceptual explanation is based on the well-known example of a single machine connected to an infinite bus (Figure 6), whose angular frequency of oscillations ωn is [1]:
ωn = [KS ω0/(2H)]1/2
Figure 6.
Simplified example: a single machine connected to an infinite bus.
E1′ and E2′ are voltages of simplified sources in transient state for the single machine and the infinite bus, respectively. X1, X2, X3, X4 and X5 are the equivalent system reactances of the analyzed case. ω0 is the system angular frequency, and H is the inertia constant of the single machine. The synchronizing torque coefficient KS is [1]:
KS = [E1′ E2′/XT] cos δ0
XT is the total reactance (X1 + X2 + X3 + X4 + X5), and δ0 is the angle between E1′ and E2′. For the sake of simplicity, this simplified explanation is based on data from the M10 model. For the analyzed case, the sum of the Iberian Peninsula generators’ rated power is 45.64 GVA and it was selected as the base for the following per-unit calculations because it is considered the equivalent value for the single machine (E1’) of this explanation. Some data can be easily estimated because the original reduced model (M10) was designed using homogeneous data (e.g., H is 5 s for all the units [7]). In their own base, the total transient reactance in thermal power plants is 0.65 pu and the impedance of the 400 kV/220 kV transformer is 0.12 pu; thus, X1 was simply estimated as the sum of both values (0.77 pu). The tie lines between Spain and Central Europe were considered in parallel for this simplified explanation and the corresponding value (X3) is 3.99 pu. The 400 kV/220 kV transformer impedance is also 0.12 pu for the case of Central Europe, but the rated MVA is 4 GVA; thus, the value at 45.64 GVA base (X4) is 1.37 pu. The total transient reactance also is 0.65 pu for the case of Central Europe, but the rated MVA is 530.55 GVA; thus, the value at 45.64 GVA base (X5) is 0.056 pu.
Only the equivalent impedance of 400 kV transmission system for the Iberian Peninsula (X2) cannot be estimated a priori; thus, this value was simply estimated to obtain 0.23 Hz, applying Equation (1). In this way, the result for X2 is 8.84 pu, and the corresponding values of δ0 and KS are 14.45° and 0.0668 pu.
After this estimation of X2, it is easy to apply Equation (1) to compute the frequency of oscillations for the analyzed cases of reduction of interconnection impedances. The result is 0.24 Hz with X4 = 0, and 0.29 Hz with X4 = X3 = 0. Section 3 shows that interarea oscillations for model M61-2 are similar to those of model M10; due to this fact, these computed frequencies are compared with those of model M61-2, in Table 4. Accurate results should not be expected from these simplified calculations (which do not consider many important details), but the tendency of an increase in the frequency of interarea oscillations with a decrease in tie impedances is clear. That is, this qualitative explanation could be useful to facilitate the understanding of these phenomena in the analyzed system.
Table 4.
Frequencies of interarea oscillations.
5.2. Natural Limits of This Simplified Explanation
This explanation of these interarea oscillations is characterized by being conceptual and extremely simple, which is an advantage of paramount importance in this topic. However, the main natural limits of this simplified explanation should be highlighted and can be summarized as: (a) this explanation is valid for this particular case, where a smaller system is connected to a much stronger power system through relatively weak tie lines; (b) the natural frequency of oscillation, described in Equation (1), depends on inertia H and total reactance XT, and some approximations about them must be assumed; (c) effect of system primary controls, such as AVRs and speed governors, is not included in this conceptual explanation but the analyzed phenomenon is relatively slow and these controls should have an influence on results.
On the other hand, there are additional details which were not included in the more detailed models (M10 and M61), such as: (a) realistic detailed load models, the lack of knowledge of which is a typical concern in power system modeling; (b) the France–Spain HVDC link, whose control mode is changed according to operators’ criteria; (c) the dynamic behavior of inverter-based generation; (d) other system controls (e.g., PSSs). That is, the more detailed models herein applied do not consider these details and, consequently, the simplified explanation (which is based on a much simpler model) cannot consider those details either.
Nowadays, the main countermeasures to deal with these interarea oscillations between the Iberian Peninsula and the rest of Europe, in real-life, are [4,5]: (a) change the HDVC link control mode; (b) increase the active power through the HVDC link; (c) increase the power grid meshing in Spain; (d) reduce the total active power exchange between Spain and France. Furthermore, the need for improvements in the PSSs of generators, as well as in Power Oscillation Damping (POD) functions of power electronics converters, has been highlighted [5]. Maybe, the reduced models herein described (M10 or M61) could be useful for an approximated and basic conceptual analysis of some of these topics in the future, but something similar should not be expected from the simplified explanation based on Equation (1) since it is only useful to deal in a qualitative way with much more elementary topics.
From this perspective, a simplified explanation based on Equation (1) could be probably also possible for other power systems, characterized by a smaller system connected to a much stronger power system through relatively weak tie lines. In order to do that, the afore-mentioned natural (or physical) limits of this simplified explanation must be considered, and some approximations about the inertia H and the total reactance XT must be assumed to apply Equation (1), as was done herein. That is, the possible application of this simplified explanation to other cases of interarea oscillations seems evident, but should be supported by further research on this topic.
Last but not least, a key point about these interarea oscillations is the knowing of the specific conditions that really cause the activation of these oscillations. That is, these natural oscillation modes appear in the simulations, but they are really triggered under certain specific circumstances in practice, and properly forecasting their activation is still a challenging task [5], even for the specialists who deal with the most detailed and realistic models of these power systems. From this perspective, users of reduced academic models should keep in mind this point, in order to try to contribute to the search for possible answers.
6. Conclusions
A novel analysis of interarea oscillations between the Iberian Peninsula and the rest of Europe, using three reduced academic models of REE, was herein shown. Models M10 and M61 have 10 and 61 nodes in 400 kV for REE, respectively, and model M61-1 is more meshed than model M61-2. The obtained frequency for the interarea oscillations is in the order of 0.22 Hz with these models, which is very similar to the officially reported values for a real event in the power system, which are also in the order of 0.21 Hz. Therefore, these reduced models can represent this phenomenon to some extent. Theoretical extreme reductions in tie impedances with Central Europe were also analyzed, and the frequency of interarea oscillations increased moderately. Transient stability was also analyzed, and the results are relatively similar for the three analyzed models. The results also show that model M61-1 is more similar to model M10 in terms of short circuit levels and critical clearing times, but model M61-2 is more similar to model M10 with respect to the frequency of interarea oscillations. These results confirm that a reduced dynamic model could be more suitable for the study of one phenomenon than for the study of another phenomenon.
Furthermore, a novel qualitative simplified explanation of the frequency of these interarea oscillations, based on a simple equation from the well-known example of a single machine connected to an infinite bus, was shown and successfully verified. An increase in the frequency of interarea oscillations for the analyzed extreme reductions in tie impedances with Central Europe was also obtained using this simple equation, in correspondence with the results obtained from the numerical dynamic simulations of the academic reduced models. This qualitative simplified explanation is important from a conceptual and illustrative perspective and cannot be used to perform accurate detailed calculations.
Author Contributions
E.S. conceptualized the research, supervised the examples’ formulation and their detailed solutions, proposed the simplified equation and wrote the document, and G.H. built and solved the cases in PSS/E. All authors have read and agreed to the published version of the manuscript.
Funding
This work was supported in part by the National Research Agency of Spain (Agencia Estatal de Investigación, AEI, in Spanish) under the Grant PID2022-140327OB-I00: “Mejora de la estabilidad de los sistemas eléctricos mediante generadores síncronos virtuales basados en convertidores grid-forming. Aplicación al sistema eléctrico Balear.—VSG-GFM”.
Institutional Review Board Statement
Not applicable.
Informed Consent Statement
Not applicable.
Data Availability Statement
Data are included in the article and in cited references.
Acknowledgments
Authors are grateful for the valuable help received from José Antonio Mori y Alejandro Castañón (Siemens, Madrid), Paulo De Oliveira (Universidad de Los Andes, Colombia), Héctor Altuve (SEL), Sergio Martínez (REE), Mario Herrerías, Pablo Munguira, Pablo Cagiao and Pablo Ledesma (UC3M), Celso Fortoul (Universidad Central de Venezuela), and Jorge Martínez (Siemens, Nuremberg).
Conflicts of Interest
The authors declare no conflicts of interest. Gracia Hernández participated in this research when she was studying at Universidad Carlos III de Madrid; she is currently with Persán, which is a company whose activities are not related with the topic of this article.
Correction Statement
This article has been republished with a minor correction to Figure 3. This change does not affect the scientific content of the article.
Abbreviations
The following abbreviations are used in this manuscript:
| AVR | Automatic Voltage Regulator |
| ENTSO-E | European Network of Transmission System Operators for Electricity |
| HVDC | High Voltage Direct Current |
| PSS | Power System Stabilizer |
| PSSE | Software for electric power system simulations |
| REE | Red Eléctrica de España |
| UC3M | Universidad Carlos III de Madrid |
References
- Kundur, P. Power System Stability and Control; McGraw-Hill Inc.: Columbus, OH, USA, 1994. [Google Scholar]
- Klein, M.; Rogers, G.; Kundur, P. A fundamental study of inter-area oscillations in power systems. IEEE Trans. Power Syst. 1991, 6, 914–921. [Google Scholar] [CrossRef] [Scilit]
- Hatziargyriou, N.; Milanovic, J.; Rahmann, C.; Ajjarapu, V.; Canizares, C.; Erlich, I.; Hill, D.; Hiskens, I.; Kamwa, I.; Pal, B.; et al. Definition and classification of power system stability—Revisited & extended. IEEE Trans. Power Syst. 2021, 36, 3271–3281. [Google Scholar] [CrossRef] [Scilit]
- ENTSO-E. Grid Incident in Spain and Portugal on 28 April 2025. ICS Investigation Expert Panel Factual Report; ENTSO-E: Cortenbergh, Brussels, 2025. [Google Scholar]
- ENTSO-E. Grid Incident in Spain and Portugal on 28 April 2025. ICS Investigation Expert Panel Final Report; ENTSO-E: Cortenbergh, Brussels, 2026. [Google Scholar]
- Union for the Coordination of Transmission of Electricity (UCTE). UCTE Annual Report 2002; Union for the Coordination of Transmission of Electricity (UCTE): Brussels, Belgium, 2002. [Google Scholar]
- Sorrentino, E.; Cagiao, P.; Montilla, M. A reduced model of the electric power system of Spain for teaching primary frequency control. In Proceedings of the IEEE Andescon, Barranquilla, Colombia, 16–19 November 2022; p. 6. [Google Scholar]
- Sorrentino, E.; Alonso, A. Inclusion of AGC models in a reduced model of the Spanish electric power system. In Proceedings of the IEEE Andescon, Barranquilla, Colombia, 16–19 November 2022; p. 6. [Google Scholar]
- Sorrentino, E.; Munguira, P.; Herrerías, M. Interesting examples to teach transient stability using an academic model of the Spanish national grid. In Proceedings of the IEEE Ecuador Technical Chapters Meeting, Quito, Ecuador, 21–24 October 2025; p. 4. [Google Scholar]
- Undrill, J.; Turner, A. Construction of power system electromechanical equivalents by modal analysis. IEEE Trans. Power Appar. Syst. 1971, PAS-90, 2049–2059. [Google Scholar] [CrossRef] [Scilit]
- Wang, L.; Klein, M.; Yirga, S.; Kundur, P. Dynamic reduction of large power systems for stability studies. IEEE Trans. Power Syst. 1997, 12, 889–895. [Google Scholar] [CrossRef] [Scilit]
- Joo, S.; Liu, C.; Jones, L.; Choe, J. Coherency and aggregation techniques incorporating rotor and voltage dynamics. IEEE Trans. Power Syst. 2004, 19, 1068–1075. [Google Scholar] [CrossRef]
- IEEE PES General Systems Subcommittee-Task Force on Dynamic System Equivalents. Dynamic system equivalents: A survey of available techniques. IEEE Trans. Power Deliv. 2012, 27, 411–420.
- Transtrum, M.; Sarić, A.; Stanković, A. Measurement-directed reduction of dynamic models in power systems. IEEE Trans. Power Syst. 2017, 32, 2243–2253. [Google Scholar] [CrossRef] [Scilit]
- Wang, K.; Cao, Y.; Gu, W. Progress and application of equivalent models for power system simulation with renewable penetration: A review. IET Smart Grid 2025, 8, 70042. [Google Scholar] [CrossRef] [Scilit]
- Avendaño-Caiza, M.; Roldán-Pérez, J.; Jankovic, N.; Rodríguez-Amenedo, J.; Rios-Peñaloza, J.; Prodanović, M. Application of model order reduction in evaluation of small-signal stability of power systems with virtual power plants. IEEE Access 2026, 14, 44227–44292. [Google Scholar] [CrossRef] [Scilit]
- Murillo, N.; Schindler, J.; Alican, O.; Girona-Badia, J.; Cheah, M.; Gomis-Bellmunt, O. Dynamic similarity analysis for active distribution grid equivalents. Electr. Power Syst. Res. 2027, 262, 113628. [Google Scholar] [CrossRef] [Scilit]
- Rathnayake, M.; Wijeweera, G.; Archer, B.; Annakkage, U. Dynamic equivalencing of power systems using bus impedance matrix. Electr. Power Syst. Res. 2026, 251, 112214. [Google Scholar] [CrossRef] [Scilit]
- Fu, H.; Yu, W.; Olama, M.; Bhusal, N.; Pratap, A.; Stenvig, N. Statistical analysis of inter-area oscillations in the U.S. Eastern interconnection: A 2017-2023 perspective. IEEE Access 2026, 14, 5374–5388. [Google Scholar] [CrossRef] [Scilit]
- Bustamante, S.; Pinzón, J.; Giraldo-Gómez, D. Evolution of real-time dynamics monitoring of Colombian power grid using wide-area monitoring system and high-speed big data analytics. Sustainability 2025, 17, 3848. [Google Scholar] [CrossRef] [Scilit]
- Bi, T.; Liu, J.; Wang, C. Online estimation of area-level inertia considering inter-area equivalent frequency dynamics. IEEE Trans. Power Syst. 2025, 40, 57–72. [Google Scholar] [CrossRef] [Scilit]
- Olivieri, C.; de Paulis, F.; Di Leonardo, L.; Orlandi, A.; Pisani, C.; Giannuzzi, G. Enhancement of short-term prediction capabilities of inter-area grid oscillations with a multi-variate ensemble-based method. Sustain. Energy Grids Netw. 2025, 41, 101604. [Google Scholar] [CrossRef] [Scilit]
- Available online: https://www.entsoe.eu/data/map/ (accessed on 9 June 2026).
- Available online: https://www.esios.ree.es/es (accessed on 9 June 2026).
- Siemens. Model Library. PSS®E 34.7.0; Siemens: Munich, Germany, 2019. [Google Scholar]
- Red Eléctrica de España. Informe Anual de la Corriente de Cortocircuito en la Red de Transporte del Sistema Eléctrico Peninsular en el año 2019; Red Eléctrica de España: Madrid, Spain, 2020. (In Spanish) [Google Scholar]

Disclaimer/Publisher’s Note: The statements, opinions and data contained in all publications are solely those of the individual author(s) and contributor(s) and not of MDPI and/or the editor(s). MDPI and/or the editor(s) disclaim responsibility for any injury to people or property resulting from any ideas, methods, instructions or products referred to in the content. |
© 2026 by the authors. Licensee MDPI, Basel, Switzerland. This article is an open access article distributed under the terms and conditions of the Creative Commons Attribution (CC BY) license.