


Abstract
Earthquake-induced soil liquefaction poses a severe threat to the structural safety of underground infrastructure. This paper presents a shaking table model test conducted on sand sites, where two site models—namely, uniform saturated sand and layered dry–saturated sand—are designed to systematically analyze the influences of seismic wave amplitude, seismic wave frequency, and structure burial depth on the development of pore water pressure. The research findings indicate the following: (1) As the input peak ground acceleration (PGA) increases, the output surface peak ground acceleration rises, while the acceleration amplification factor decreases. Under high-intensity earthquakes, sand boiling and water gushing are observed in the uniform saturated sand site, and the overlying unsaturated layer can effectively inhibit the liquefaction development of the underlying saturated sand layer. (2) When the predominant frequency of the input seismic wave is close to the natural vibration frequency of the test site, the surface acceleration response is significantly enhanced, while the resonance effect of low-frequency seismic components is relatively weak. (3) The pore pressure ratio is higher in shallow soil layers, indicating that shallow strata are more prone to liquefaction. Both the pore pressure accumulation rate and the peak pore pressure ratio under uniform saturated sand conditions are higher than those measured in the layered dry–saturated sand site. (4) The sensitivity ranking of the three influencing factors is input PGA > burial depth > seismic wave frequency, where the input PGA is the dominant influencing factor, and the effect of the seismic wave frequency is not statistically significant. The conclusions of this study can provide a reference for seismic response assessment and anti-liquefaction design of shallow-buried structures in liquefiable sites.
1. Introduction
The issue of earthquake-induced soil liquefaction leading to damage and failure of buildings and lifeline structures is particularly severe, with ground deformation caused by liquefaction being a significant factor in earthquake disasters [1,2]. There have been numerous instances of seismic disasters caused by liquefaction, such as the 1964 Alaska earthquake in the United States [3,4], the 1964 Niigata earthquake in Japan [5], the 2008 Wenchuan earthquake in China [6,7], and the 2011 East Japan earthquake [8,9]. These events have all demonstrated damage to both above-ground and underground structures due to liquefaction. Statistical analyses indicate that seismic liquefaction can induce substantial economic losses [10,11]. The development process of site liquefaction under seismic activity is influenced by various complex factors and requires further research.
Soil liquefaction refers to the phenomenon where, under dynamic loading, the pore water pressure in saturated sand increases sharply, while effective stress decreases drastically, driving a phase transition of the soil from a solid to a liquid state [12,13]. Extensive academic research on this topic has been conducted through shaking table tests, dynamic simple shear tests, dynamic triaxial tests, and resonance column tests [14,15]. Early research focused primarily on seismic damage investigation and empirical formula development. Based on cases of building and utility tunnel damage induced by seismic liquefaction, Hamada statistically derived an empirical formula to estimate ground displacement at liquefied sites [16]; Tokimatsu subsequently validated this formula using standard penetration tests [17]. Elgamal adopted numerical simulation to construct a foundational model for liquefied sites, enabling refined evaluation of soil layer displacement [18]. Via shaking table tests, Yasuda demonstrated that flow deformation induced by sand liquefaction is strongly correlated with the burial depth of soil layers [19]. Subsequent research has gradually deepened insight into liquefaction mechanisms and constitutive soil models. Starting from the strain mechanism, Zhang Jianmin derived the quantitative relationship between shear strain and effective stress and established a soil constitutive model [20]. By integrating shaking table test data and field measurement data, Moss et al. systematically revealed the evolution law of soil properties across the pre-liquefaction, liquefaction, and post-liquefaction stages, and summarized the large deformation mechanism and distribution characteristics of pore water pressure [21].
Numerous scholars have conducted extensive research on the influencing factors and re-liquefaction behavior of geomaterials. Ye et al. investigated the re-liquefaction characteristics of sand via shaking table tests with variable duration [22]; Sonmezer analyzed the effects of the particle size ratio and silt content on liquefaction potential through cyclic shear tests [23]; Ko evaluated the seismic response of liquefied sites based on shaking table tests [24]; Varghese R. M. investigated multiple factors affecting liquefaction resistance [25]; Zhang analyzed the influences of relative density, cyclic stress ratio, fiber content, and fiber length on pore water pressure accumulation through cyclic triaxial compression tests [26]; Ye B. revealed the intrinsic influence of complex seismic history on the liquefaction resistance of saturated sand deposits via centrifuge shaking table tests [27]; Pelin conducted comparative shaking table tests on layered sand and found that relative density, input acceleration, and silt layer significantly affect the development of pore water pressure under dynamic loading [28]; Xin Huang developed a new model for pore pressure and stress of tailings sand based on dynamic triaxial tests [29]; and Feng reproduced the large deformation process of liquefaction from the solid state to the liquid state via shaking table tests, and analyzed the influence of acceleration amplitude, frequency, and relative density on slope liquefaction [30].
In previous studies, the mechanical properties of soil layers and their liquefaction behavior before and after liquefaction were mainly studied through shaking table tests, and the influence of different soil properties and seismic input conditions on soil layer liquefaction behavior was compared and analyzed. Although numerous prior studies have examined soil stratification, systematic shake-table experiments remain lacking in two key areas: the mechanisms through which overlying unsaturated layers suppress pore pressure dissipation and liquefaction development in underlying saturated layers, and the variations in dynamic ground responses across different saturation distribution conditions. Based on the existing research, this study refined the soil layer and seismic wave input conditions and designed and conducted scaled shaking table tests of saturated sandy soil and layered sandy soil sites. Two types of seismic waves were considered: the original seismic wave and the time-scaled seismic wave to simulate the seismic action. Based on the experimental results, the seismic response laws of acceleration and pore water pressure in different soil layer depths were studied, and the influencing factors and sensitivity of soil liquefaction were analyzed. The liquefaction characteristics of saturated sandy soil sites and layered sandy soil sites under different frequency and amplitude seismic input were studied.
2. Shaking Table Test Scheme
2.1. Experimental Setup
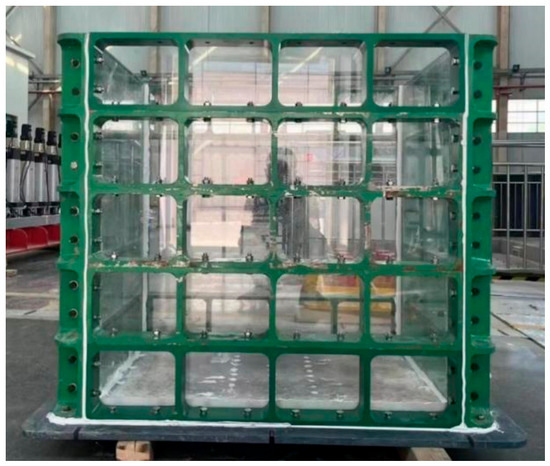
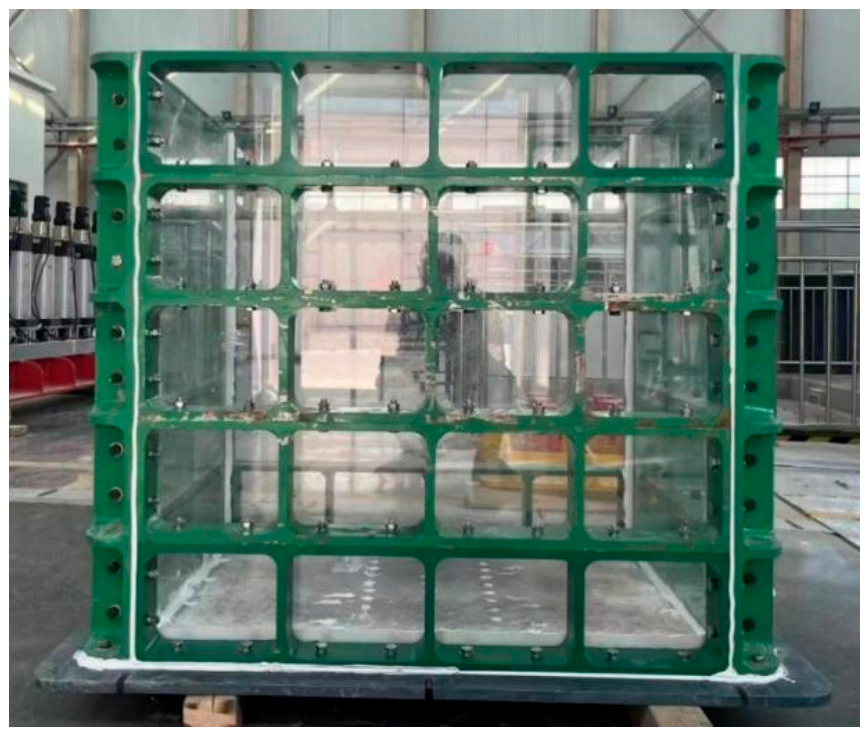
The experiments were conducted at State Key Laboratory of Water Resource Protection and Utilization in Coal Mining. The experimental equipment consisted of an XY two-way three-degree-of-freedom vibration table system. The maximum acceleration was 1.5 g, the maximum load was 3000 kg, and the operating frequency was 0–50 Hz. This experiment focused on the dynamic response of the model under one-dimensional vibration input conditions, so only the X-directional vibration input was considered during the experimental loading process. The shaking table test model box was a rigid box, as shown in Figure 1. The model box consisted of a layer of 20 mm thick acrylic plates, with internal dimensions of a length of 1 m, a width of 0.6 m, a height of 1 m, and an external structure formed by independent rectangular steel frames to fix the acrylic plates. Additionally, to prevent leakage of water and sand, a layer of waterproof glue was applied at the joints of the inner walls of the model box. A 5 mm foam pad was affixed to the inner walls at both ends of the vibration direction to reduce the boundary effects of the box. The selected 5 mm thick foam layer had an elastic modulus and damping characteristic that matched the equivalent shear modulus of the surrounding soil. Its matching performance was verified via boundary acceleration consistency (see Section 3.1), which demonstrated its effectiveness in absorbing scattered waves and reducing reflections from rigid boundaries. Even with the installation of foam cushioning, rigid box boundaries, unidirectional excitation, and low confining pressure remain inherent limitations of 1 g shaking table tests.
Figure 1.
Shaking table test model box.
2.2. Model Soil Similarity Ratio Design and Preparation
The design requirements for this experimental model necessitated physical similarity (including geometric and boundary similarity) between it and its prototype counterpart so as to accurately reflect their resemblance. Considering engineering practice characteristics and site constraints, this paper adopted a geometric similarity ratio of 1:50 for scaling down dimensions while maintaining proportional relationships between various components involved; specific details regarding these similarity design ratios are provided in Table 1. In this study, the density and moisture content of the model soil were controlled to achieve a 1:1 scale match with the bulk density of the prototype soil. For dynamic loading tests, the input acceleration amplitude (1:1 scale) and the compressed time axis (1:7.07 scale) were adjusted to realize dual-similarity matching that satisfied both the Froude criterion and the Cauchy criterion.
Table 1.
Model soil similarity ratios.
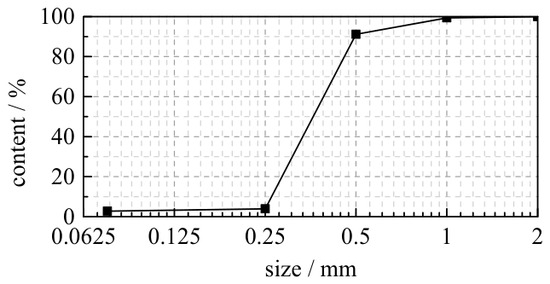
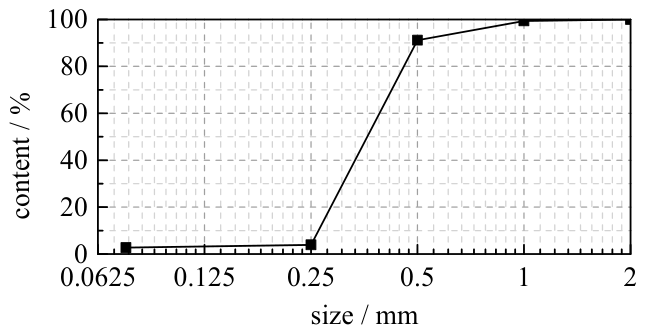
The test sand used in the experiment was obtained from a river sand deposit in Beijing, which belongs to medium sand. The particle size distribution curve of the sand is shown in Figure 2. From the particle size distribution curve, it can be observed that the proportion of medium sand with particle sizes ranging from 0.25 mm to 0.5 mm was 87.1%, and the content of fine sand with particle sizes smaller than 0.075 mm was 2.7%. The maximum dry density of the test sand was 1.61 g/cm3, and the minimum dry density was 1.43 g/cm3.
Figure 2.
Particle size distribution of the soil.
In order to study the liquefaction of the soil layer in different sites under ground motion, a shaking table test was carried out in a sandy soil field. The model soil profile was composed of three distinct layers: a 2 cm thick top clay layer, a 5 cm thick bottom gravel layer, and a 73 cm thick intermediate sand layer, yielding a total thickness of 80 cm. The model soil preparation adopted the layered compaction method, where the soil was filled in eight successive lifts with each sand lift compacted to a 10 cm thickness, and the dry density of each layer was strictly controlled. For experiments involving saturated sand soil layers in the model, water was poured into the model box after placing each sand layer to ensure complete saturation. Once the design height for the soil layers was achieved, filling stopped, and consolidation occurred over a period of 48 h.
In 1 g shaking table tests, it is impossible to strictly satisfy all similarity criteria because the gravitational field cannot be scaled. This study adopted a simplified similarity design based on the “gravity neglect” principle. The similarity ratio of the shear modulus was set to 1:1, which means the shear modulus of the model material was identical to that of the prototype. However, this design introduced stress inconsistency between the model and the prototype: the stress level of the model was only 1/50 of that of the prototype. Accordingly, the test results obtained in this study are primarily intended to identify qualitative and semi-quantitative patterns, rather than to produce quantitative predictions of the prototype’s response.
2.3. Monitoring Point Arrangement
The main monitoring objects of this experiment included the acceleration of the soil layers and the pore water pressure. The relevant parameters of the sensors are shown in Table 2.
Table 2.
Sensor parameters.
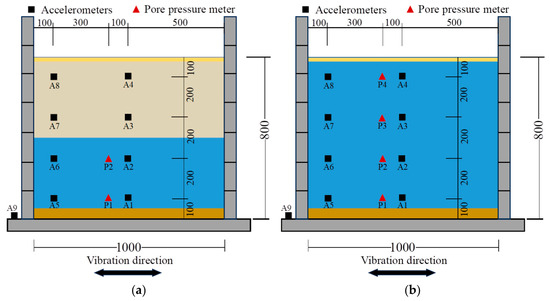
The arrangement of various sensors in the soil model shaking table test is shown in Figure 3. The X-direction is the direction of vibration during the test, and the sensors are placed on the center cross-section of the Y-direction, at heights of 10 cm, 30 cm, 50 cm, and 70 cm respectively. To facilitate work and check the condition of the sensors, a letter + number naming and numbering system is used for each sensor, with capital letters representing the type of sensor, where A stands for accelerometer, and P stands for pore water pressure gauge. The number represents its identification number. For example, A1 and P1 represent the first accelerometer and first pore water pressure gauge, respectively.
Figure 3.
Schematic diagram of sensor placements in the shaking table test (unit: mm). (a) Dry–saturated sand layered field model. (b) Saturated sand field model.
2.4. Test Loading Scheme
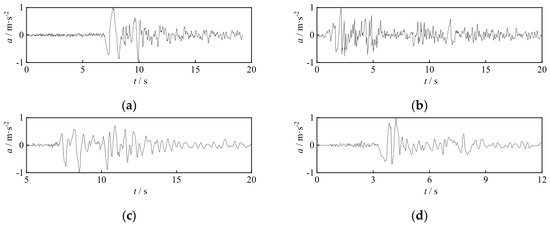
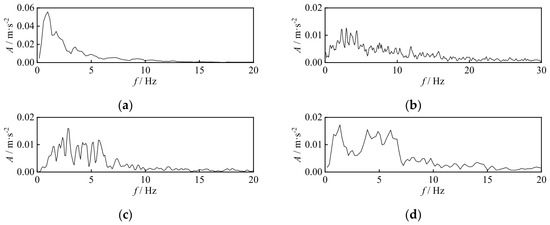
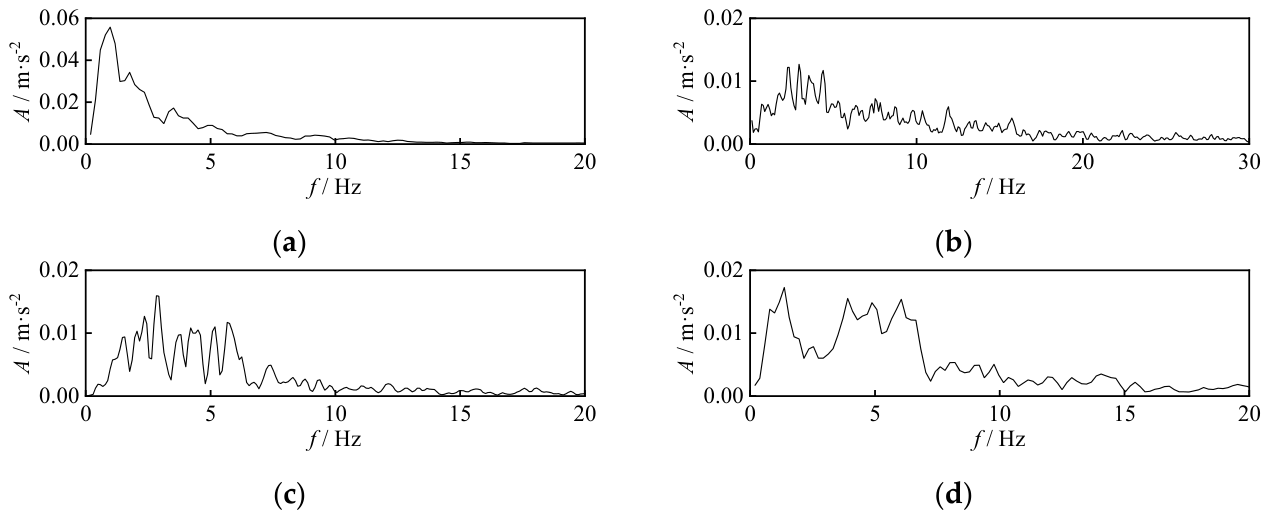
To investigate the dynamic response of soil under seismic action, the selection of the loading scheme considered key factors such as earthquake intensity, seismic spectrum characteristics, and earthquake duration. In this analysis, four original earthquake waves (Tianjin wave (TJ), El Centro wave (EL), Kobe wave (KB), and Northridge wave (NOR)) were utilized as input waves along with four compressed seismic waves obtained by compressing the original ones based on the similarity ratio. Figure 4 and Figure 5 depict the acceleration time history and Fourier spectra of these eight input waves respectively. The predominant frequencies for TJ, EL, KB, and NOR were 0.977 Hz, 2.929 Hz, 2.832 Hz, and 1.367 Hz respectively. The scaled earthquake waveform maintained consistency with its corresponding original waveform while having a duration that was one-seventh of the original waveform’s duration and a predominant frequency seven times higher than that of the original waveform. The input prototype seismic wave had a relatively low fundamental frequency. Following the similarity scaling law, the dominant frequencies of the scaled model ground motions—TJ, EL, KB, and NOR—were 6.839 Hz, 20.503 Hz, 19.824 Hz, and 9.569 Hz, respectively. All these values were closer to the fundamental frequency of the test model (32 Hz).
Figure 4.
Acceleration time history of input waves. (a) TJ, (b) EL, (c) KB, and (d) NOR.
Figure 5.
Fourier spectra of input waves. (a) TJ, (b) EL, (c) KB, and (d) NOR.
Each seismic wave was selected based on peak ground acceleration (PGA) values of 0.2 g, 0.4 g, and 0.6 g, representing three distinct seismic intensity levels. For each PGA value, the vibration table experiment consisted of eight loading conditions that were applied sequentially. Prior to loading each set of seismic waves, a white noise signal with an amplitude of 0.1 g was introduced to determine the fundamental frequency of the test site. When a 0.1 g white noise sweep, which introduces a small-strain disturbance and can be classified as a non-destructive test that does not alter the original soil structure, is employed, the obtained measurement results can be regarded as representative of the initial stiffness of the soil in its in situ condition. The detailed loading test scheme is presented in Table 3. After each loading stage, the specimen was held under constant load until the pore pressure sensor reading returned to the initial hydrostatic pressure value (with a dissipation rate exceeding 95%), confirming that full pore pressure dissipation had been achieved.
Table 3.
Seismic wave loading scheme.
3. Experimental Results Analysis
3.1. Boundary Effects of the Model Box
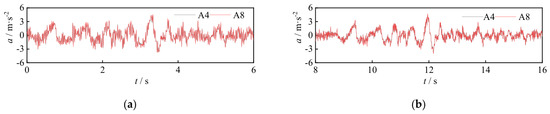
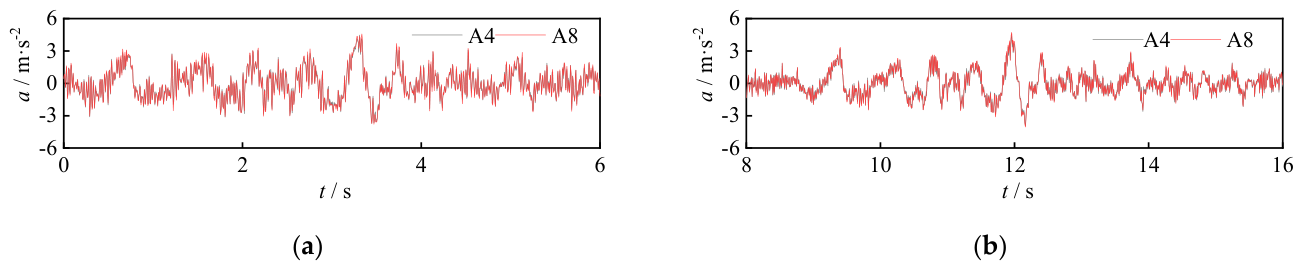
To validate the boundary conditions of the model container adopted in this study, a comparative analysis was conducted on the acceleration time-history responses of soil measurement points A4 (located at the mid-depth of the soil layer) and A8 (located near the container sidewall) under the excitation of the 0.4 g scaled Tianjin seismic wave. The results indicate that the time-history curves of the two measurement points exhibit high consistency in waveform shape, amplitude, and phase characteristics, with the curves being nearly overlapping. Consistent patterns were also observed under other seismic input conditions and working conditions with different peak accelerations. This demonstrates that the foam energy-absorbing cushion installed on the inner sidewall of the test container can effectively absorb and dissipate scattered wave energy and significantly attenuate the lateral boundary reflection effect. As a result, the layered shear model container adopted in this test can accurately reproduce the real dynamic response characteristics of a free-field foundation under external seismic excitation.
3.2. Liquefaction Phenomenon
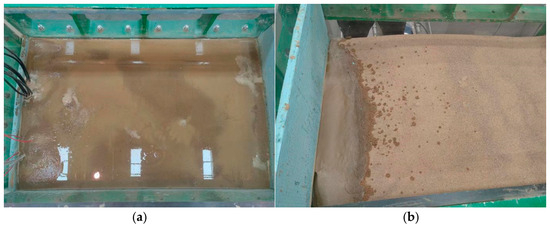
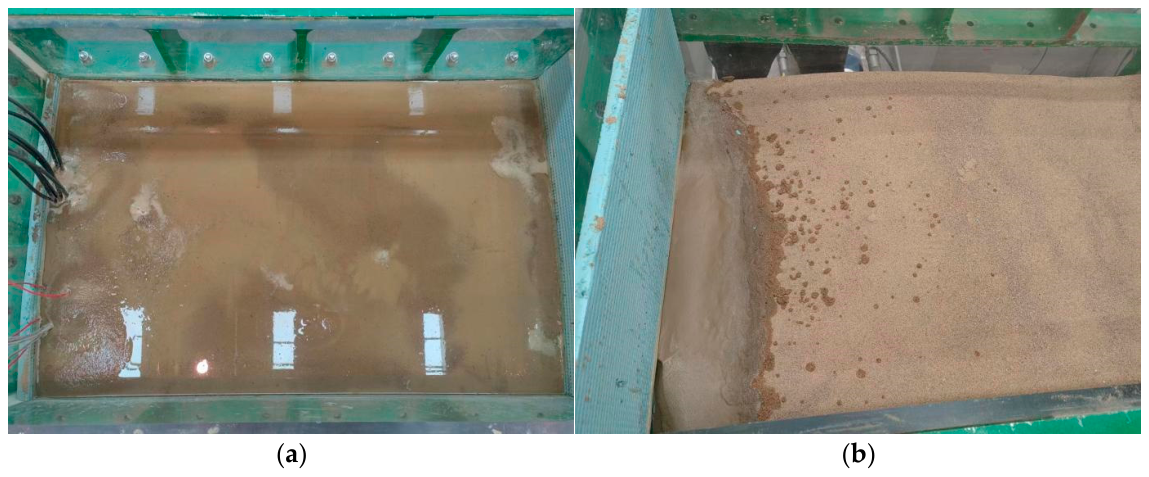
Both the layered dry–saturated sand site and saturated sand site showed no significant changes when subjected to seismic waves with amplitudes of 0.2 g and 0.4 g; however, when exposed to an amplitude of 0.6 g (case 23), water and sand ejection phenomena occurred only in the saturated sand layer model, as shown in Figure 6a. The severe damage observed in Case 23 (Figure 7a) is attributed to accumulated soil damage induced by prior repeated loading, which resulted in the early termination of the subsequent testing phases (Cases 24–27). This observation confirms that loading history effects are inherently incorporated in the experimental results, and such effects must be explicitly accounted for during result interpretation. As the experiment progressed, accumulation of water on the model surface gradually increased, leading to irreversible structural damage, prompting termination of the experiment, while the surface of the layered dry–saturated sand site model did not exhibit significant water or sand ejection phenomena, even when subjected to seismic waves with an amplitude of up to 0.6 g. After completing the test conditions outlined in Table 3, higher-magnitude seismic waves were input, ultimately resulting in water and sand ejection phenomena even at the edges of the test box depicted in Figure 7b. Edge sanding indicates that the pore pressure at these locations has approached the level that offsets the total effective stress. This development arises because the edges are simultaneously subjected to both shear stress and pore pressure gradients, rendering them preferential flow pathways for pore fluid drainage and potential failure planes. The absence of sanding at the specimen center suggests that although pore pressure in this region has increased, overall drainage conditions are less favorable than at the edges, causing liquefaction to initiate more readily from the weaker edge zones.
Figure 6.
Acceleration time history at monitoring points A4 and A8 during the 0.4 g Tianjin wave. (a) Dry–saturated layered sand soil site model; (b) saturated sand soil site model.
Figure 7.
Liquefaction phenomena. (a) Test 1; (b) Test 2.
3.3. Saturated Sand Soil Dynamic Response
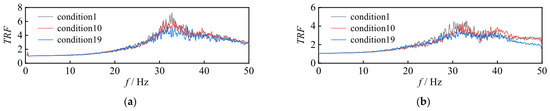
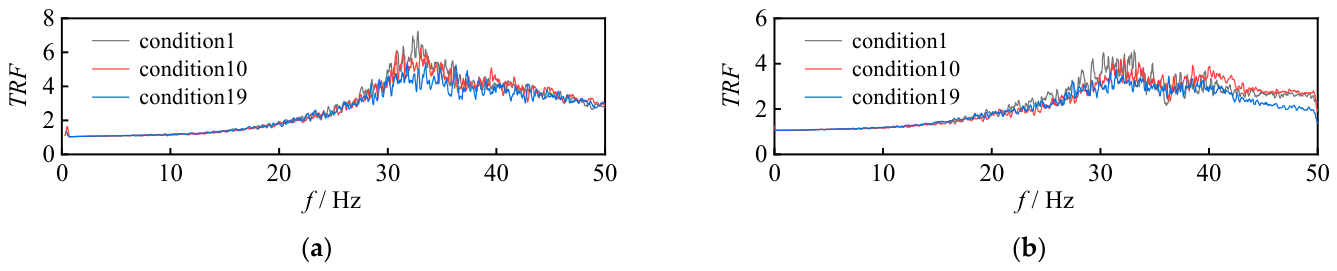
Based on the Fourier spectral transfer function (TRF) obtained from measurement point A4 at a burial depth of 10 cm and the basement input, the transfer function curves of the two site types under different white noise operating conditions (Condition 1, Condition 10 and Condition 19) were derived following eight-point smoothing processing (Figure 8). The results show that the first-order natural frequencies of layered sand are 32.76 Hz, 32.32 Hz, and 31.79 Hz in sequential order, while those of saturated sand are 33.30 Hz, 32.74 Hz, and 32.12 Hz in sequential order. The first-order natural frequency of both sand types decreases gradually as the loading process progresses, with a reduction amplitude of less than 5%. This indicates that large soil deformation induced by strong earthquakes causes the accumulation of local plastic strain, which leads to a slight reduction in soil stiffness, while the overall dynamic characteristics of the soil remain largely unchanged.
Figure 8.
Transfer functions for white noise excitation condition. (a) Dry–saturated layered site; (b) saturated sandy soil site.
To more intuitively and effectively reflect the distribution patterns of acceleration under various factors, such as the peak acceleration of input seismic waves, different burial depths, and types of input seismic waves, the acceleration amplification factor at each monitoring point is defined as the ratio of the peak acceleration at that monitoring point to the peak acceleration at monitoring point A9 on the shaking table surface. This relationship can be expressed as
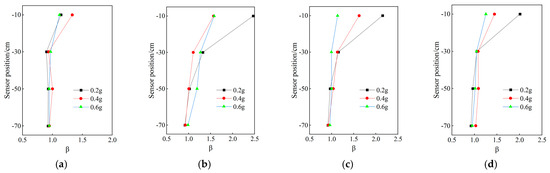
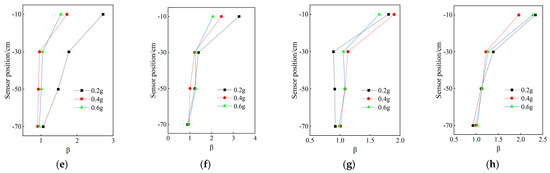
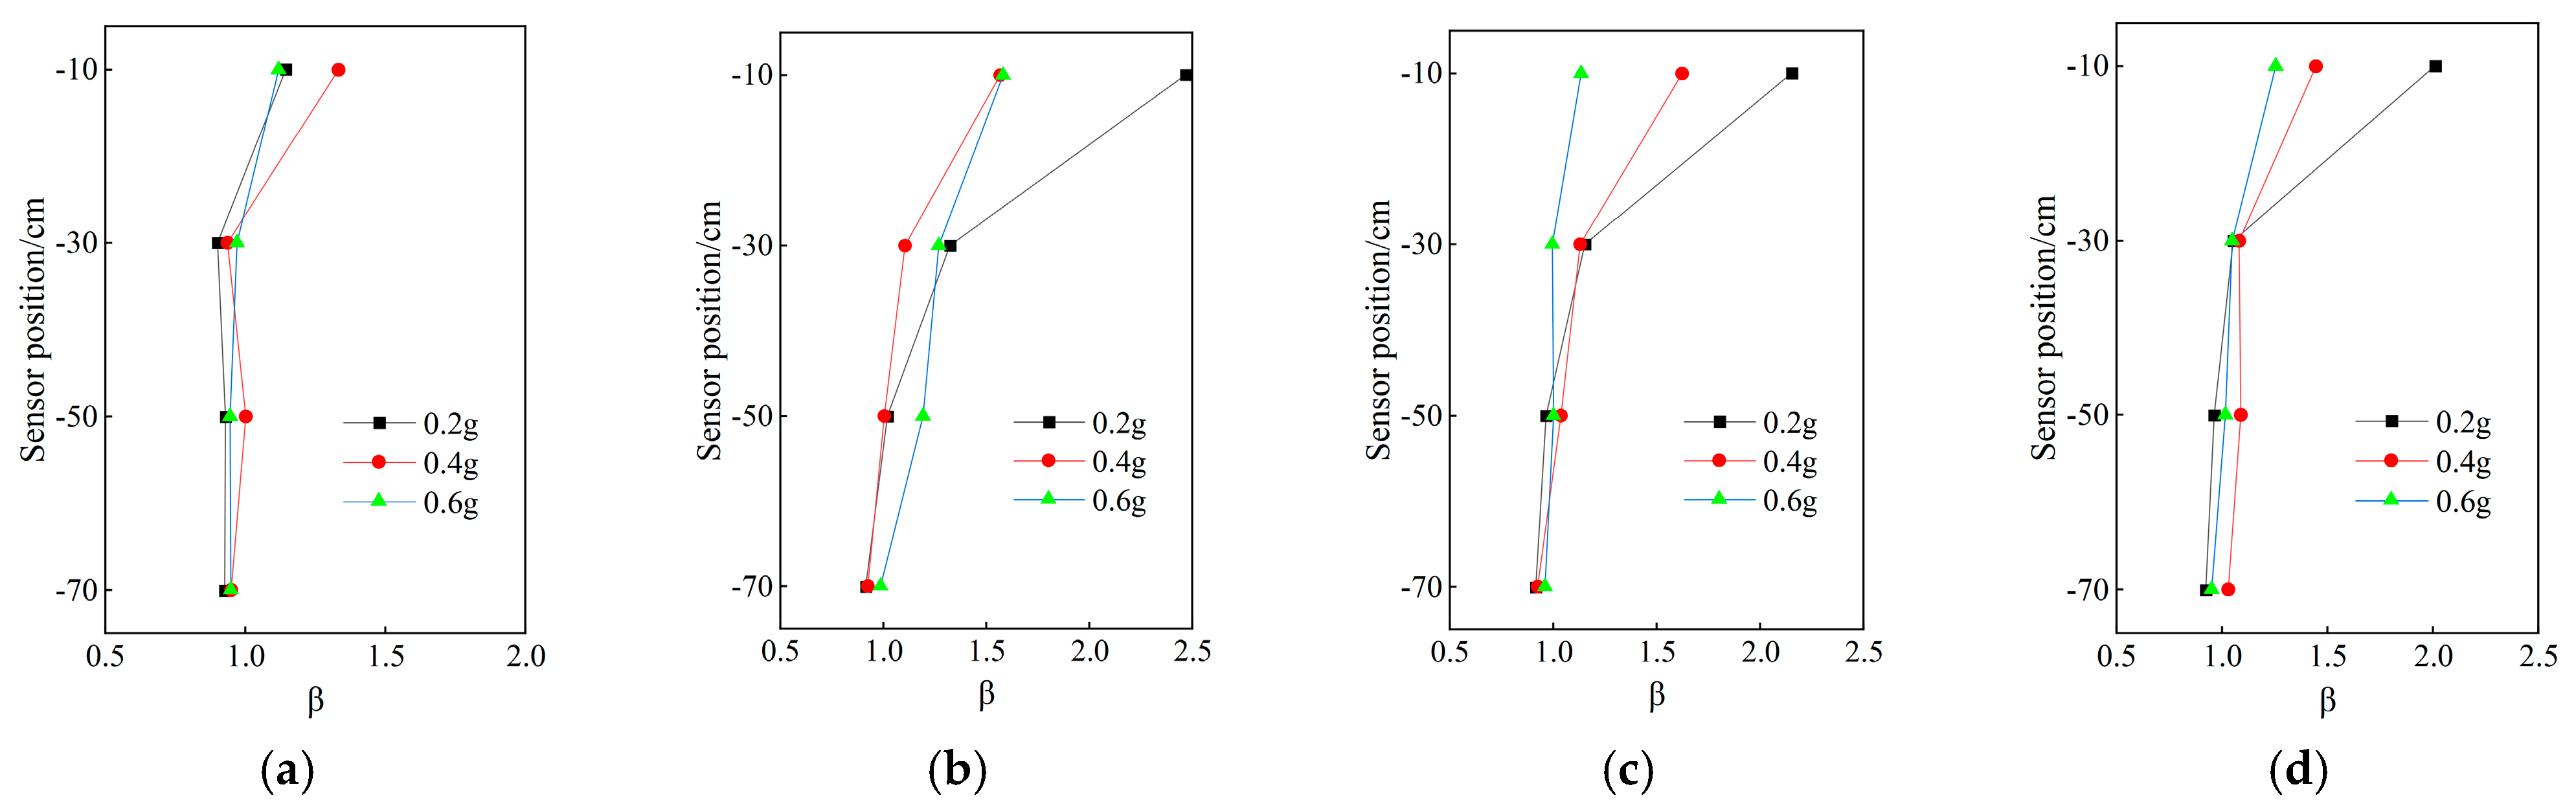
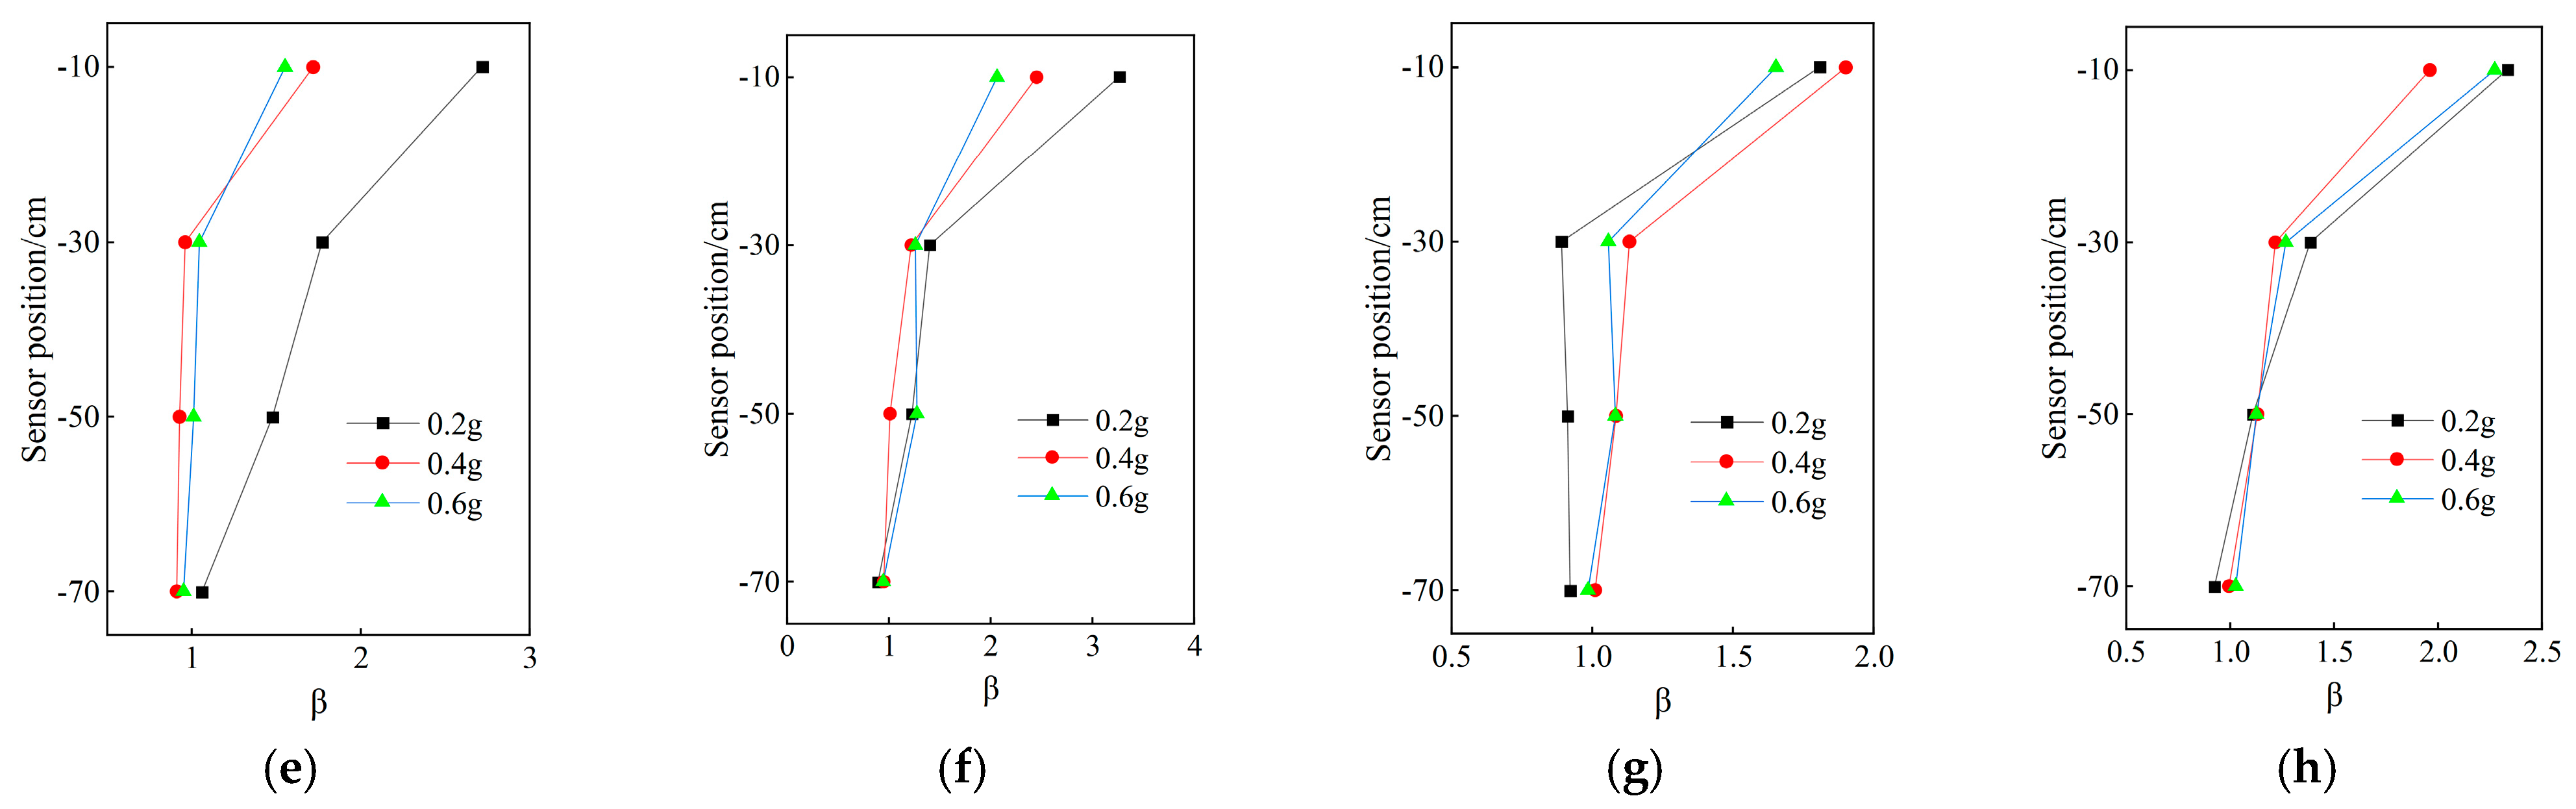
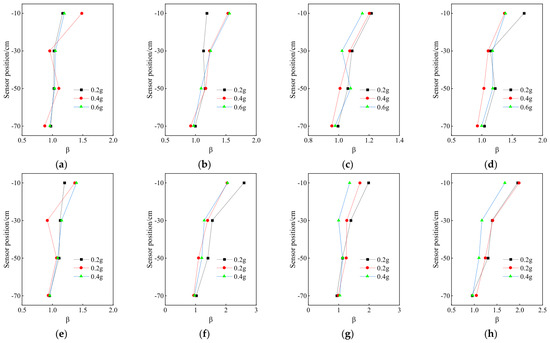
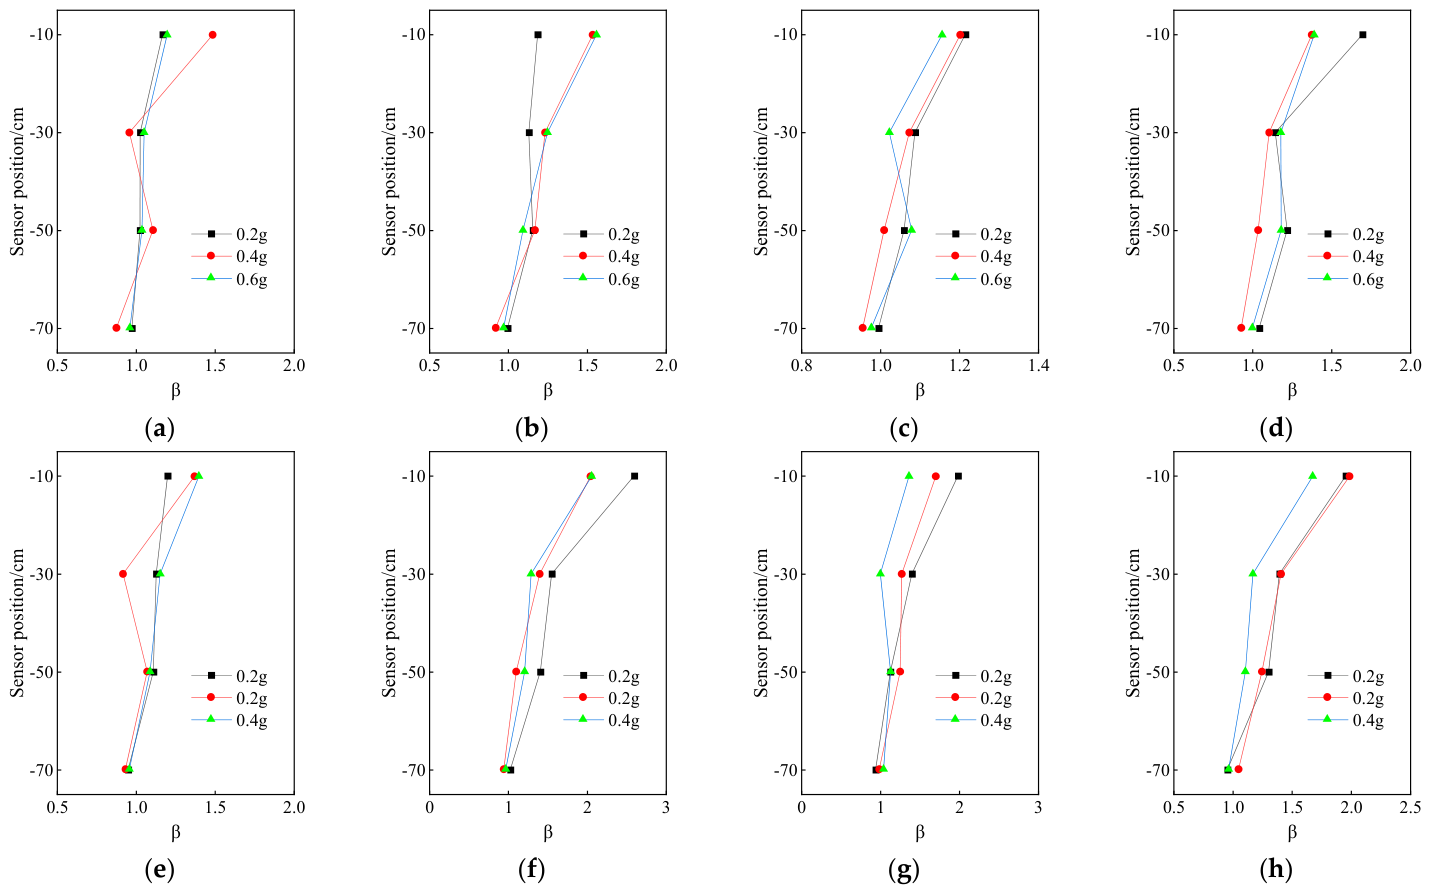
As illustrated in Figure 9 and Figure 10, the acceleration amplification factors at all measurement points across both site types exhibited an increasing trend as burial depth decreased. Between the base surface and a burial depth of 30 cm, the amplification factor increased at a relatively gradual rate; from a 30 cm to 10 cm burial depth, the amplification factor rose significantly, indicating that the amplification effect near the ground surface intensified sharply. Accordingly, the seismic response of shallow-buried underground structures in liquefied sites was more pronounced, corresponding to a higher failure risk. For surface structures with shallow foundation depths, if seismic design directly adopts bedrock ground motion input, the actual ground surface seismic action will be substantially underestimated, which, in turn, increases the risk of structural failure.
Figure 9.
Relation curves between acceleration amplification factor and sensor position in dry–saturated sandy soil field. (a) TJ, (b) EL, (c) KB, (d) NOR, (e) 1/7 Duration TJ, (f) 1/7 Duration EL, (g) 1/7 Duration KB, and (h) 1/7 Duration NOR.
Figure 10.
Relation curves of acceleration amplification factor and sensor position in saturated sandy soil field. (a) TJ, (b) EL, (c) KB, (d) NOR, (e) 1/7 Duration TJ, (f) 1/7 Duration EL, (g) 1/7 Duration KB, and (h) 1/7 Duration NOR.
Figure 11 displays variations in the acceleration amplification factor for measuring point A4 on the surface of the soil layer under different loading conditions. The peak acceleration value at measuring point A4 increased with an escalation in the input peak ground acceleration (PGA) caused by earthquake waves; however, as the PGA increased further, a decrease was observed in the acceleration amplification factor. Based on the Hardin–Drnevich hyperbolic model, the G/Gmax ratio decreases more significantly with increasing shear strain. In the present test, the PGA was increased from 0.4 g to 0.6 g, which led to a considerable increase in the shear strain amplitude and a marked decline in soil stiffness. This constitutes the fundamental physical mechanism underlying the observed reduction in the macroscopic acceleration amplification factor. By comparing the acceleration test results between a dry–saturated layered sandy soil site and a saturated sandy soil site, it can be observed that under 0.6 g loading conditions, the saturation state significantly contributed to a greater reduction in the acceleration amplification factor within the soil layer. This suggests that stiffness degradation within saturated sandy soils is more pronounced under high seismic intensities.
Figure 11.
Variation curves of acceleration amplification coefficient with PGA under two soil layers. (a) Dry–saturated layered sandy soil site; (b) saturated sandy soil site.
Figure 12 illustrates the variations in acceleration amplification factors at measuring point A4 on the surface of the soil layer for different types of seismic waves. As shown, for equal peak ground acceleration (PGA) values, when subjected to an earthquake wave with a duration reduced to one-seventh of the original, measuring point A4 exhibited higher acceleration amplification factors compared with those obtained from the original seismic wave inputs. This suggests that the dynamic characteristics of the input seismic waves significantly influence the seismic response characteristics of the model soils. Consequently, surface accelerations were amplified when the predominant frequencies of the seismic waves closely matched the fundamental frequencies of the specific site.
Figure 12.
Acceleration amplification factor variation curves of seismic wave type under two soil layers. (a) Test 1; (b) test 2.
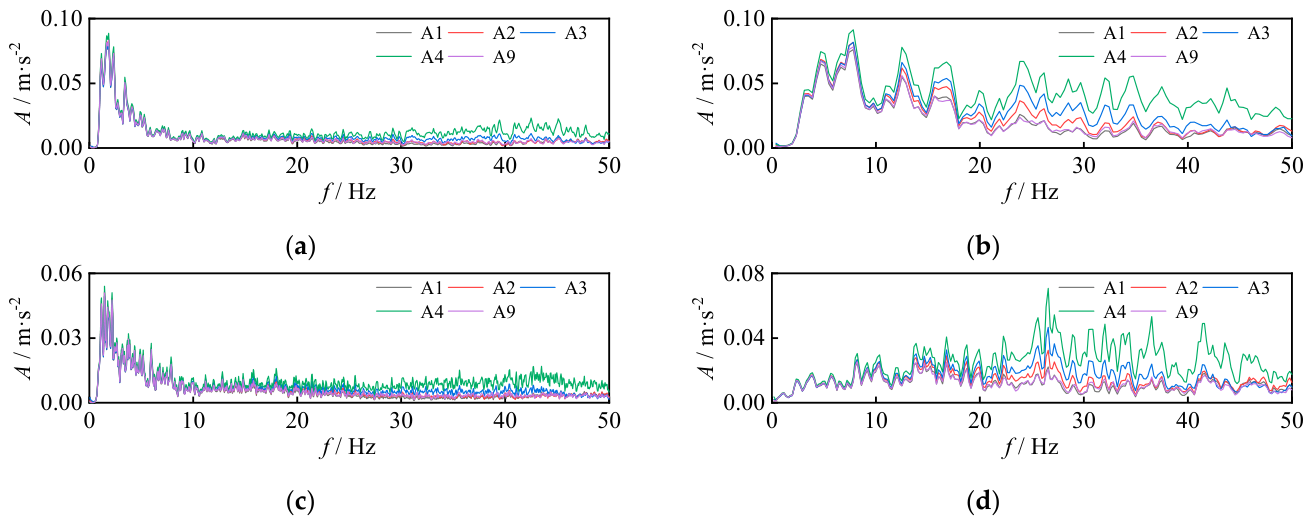
Figure 13 presents the acceleration Fourier spectra (PGA = 0.4 g) distributed along the depth at the saturated sand site under different loading conditions. The spectral curves of measuring point A1 (located within the soil layer) and tabletop measuring point A9 exhibited a high degree of consistency. This consistency indicates that the transmission path of the input seismic wave is valid, and the influence of boundary reflection can be neglected. From the base of the soil layer to the ground surface, the spectral amplitudes of all frequency components generally showed an increasing trend, and significant peak amplification occurred in the frequency band near the site’s first-order natural frequency (approximately 32 Hz), which was induced by the resonance effect of the site soil layer. When the predominant frequency of the input wave approached the fundamental frequency of the site, wave energy underwent coherent superposition within the soil layer, leading to strong amplification of energy in this frequency band. In contrast, low-frequency components below 10 Hz did not exhibit obvious amplification at any measuring point. The reasons for this observation are as follows: first, the wavelength of low-frequency waves was much larger than the thickness of the soil layer, making it difficult to form a standing wave mode that satisfied the resonance condition; second, although the damping dissipation of low-frequency components in the soil layer was relatively weak, no energy-focusing effect occurred, so the amplitude propagated approximately linearly with depth without amplification. The above results indicate that the seismic response of the site has significant frequency selectivity, and the amplification effect of ground motion near the fundamental frequency is substantially stronger than that in the low-frequency band. In practical geotechnical engineering, attention should be paid to the influence of site characteristic frequency on the spectral characteristics of surface ground motion.
Figure 13.
Fourier spectra of seismic waves with input PGA = 0.4 g for (a) 0.4 g TJ, (b) 0.4 g 1/7 duration TJ, (c) 0.4 g EL, and (d) 0.4 g 1/7 duration EL.
The study site functioned as a filter for seismic motions. Its fundamental frequency was approximately 32 Hz, which was significantly higher than the dominant frequency of the input seismic wave. For low-frequency components, the wavelengths propagating within the overlying soil were sufficiently long, enabling the soil layer to be approximated as a rigid body moving in unison. This motion pattern resulted in minimal seismic amplification. In contrast, for components with frequencies close to 32 Hz, their wavelengths were comparable to the thickness of the soil layer, making resonance more likely to occur and leading to significant amplification effects.
3.4. Development Law of Pore Water Pressure
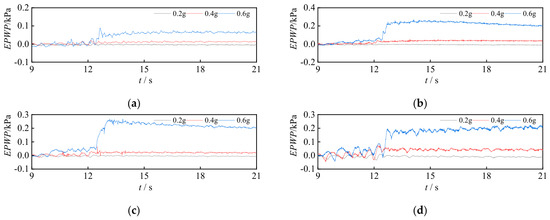
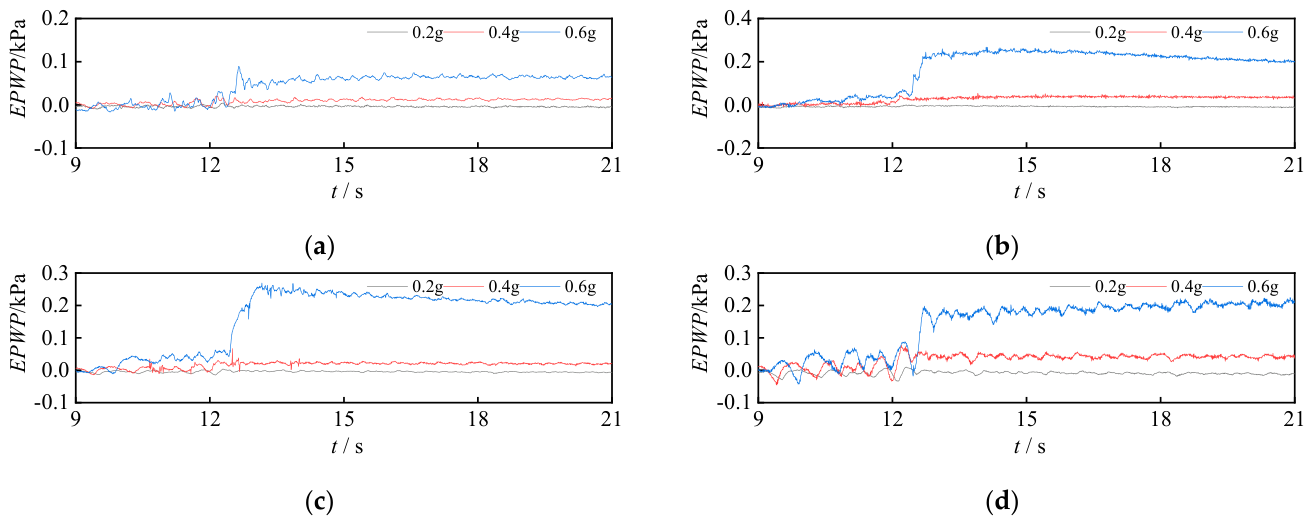
As illustrated in Figure 13, when subjected to excitation by Tianjin seismic waves with peak accelerations of 0.2 g, 0.4 g and 0.6 g, the pore water pressure time-history curves at all measuring points of the saturated sand model consistently exhibited three distinct stages: rising, stable, and dissipating. The peak pore water pressure increased significantly with the increase in the input peak acceleration, and particularly prominent amplification was observed at measuring points with a burial depth exceeding 10 cm. This observation indicates that strong earthquakes trigger more intense soil-layer responses and accelerate pore pressure accumulation. The variation in the pore water pressure at the measuring point with a burial depth of 10 cm was negligible, which was primarily attributed to the pore pressure dissipation rate of the topsoil being far higher than its accumulation rate, making it difficult to sustain effective pore pressure growth.
The ratio of the pore water pressure at different burial depths in the soil layer to the initial effective stress at that location is defined as the pore pressure ratio . Mathematically, it can be expressed as
where EPWP represents the pore water pressure; denotes the initial effective stress of the soil layer; signifies the buoyant density of saturated sandy soil; and h indicates the burial depth of saturated sandy soil.
In the conventional definition of the pore pressure ratio , the denominator adopts the initial static effective stress. However, under strong seismic loading, soil experiences volume contraction and stress redistribution, resulting in the actual effective stress at local locations being substantially lower than the initial value. This discrepancy can ultimately lead to an underestimation of the true .
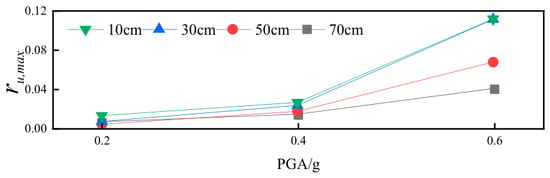
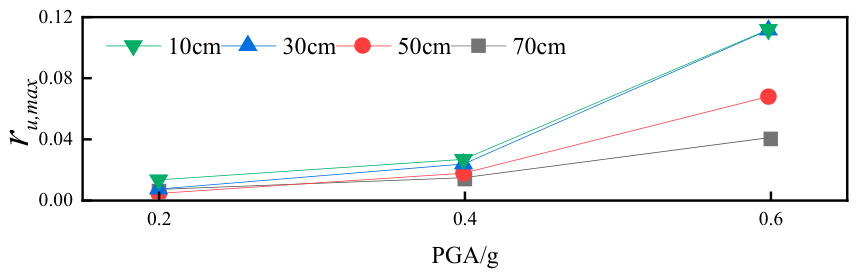
The time-history curves and peak distribution of the pore pressure ratio at different burial depths for each condition depicted in Figure 14 are calculated and summarized in Figure 15. From the figures, it can be observed that under low-seismic-intensity conditions, the pore pressure ratio ru in the saturated sandy soil was higher in the near-surface layer. As the peak acceleration of the input seismic waves increased, the peak values of ru also increased at different locations, with a more significant increase observed at shallow burial depths. This indicates that increasing the intensity of ground motion input promotes liquefaction of the soil mass. Under high-seismic-intensity conditions, shallowly buried soil layers are more prone to liquefaction.
Figure 14.
Time-history curves of pore water pressure under different seismic intensity conditions at (a) 10 cm, (b) 30 cm, (c) 50 cm, and (d) 70 cm.
Figure 15.
Peak distribution of the pore pressure ratio.
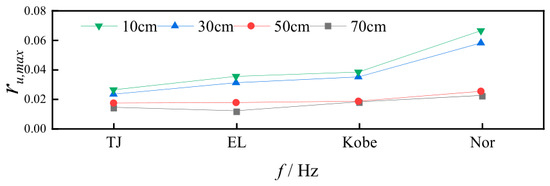
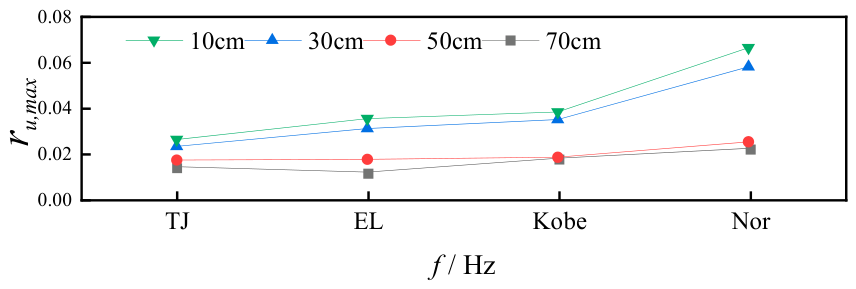
Figure 16 illustrates the distribution of at measurement points across different burial depths under PGA = 0.4 g. The results indicate that the at all burial depths showed an increasing trend as the input dominant frequency rose. The fundamental frequency of the test site was approximately 32 Hz, and all input dominant frequencies used in the analysis were lower than this value. Accordingly, the closer the input dominant frequency was to the site fundamental frequency, the more prominent the pore pressure accumulation became, corresponding to a higher soil liquefaction potential.
Figure 16.
Peak pore pressure ratios under different seismic wave inputs.
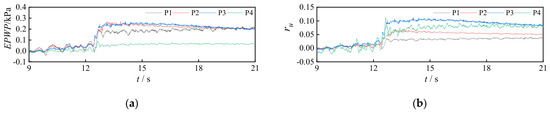
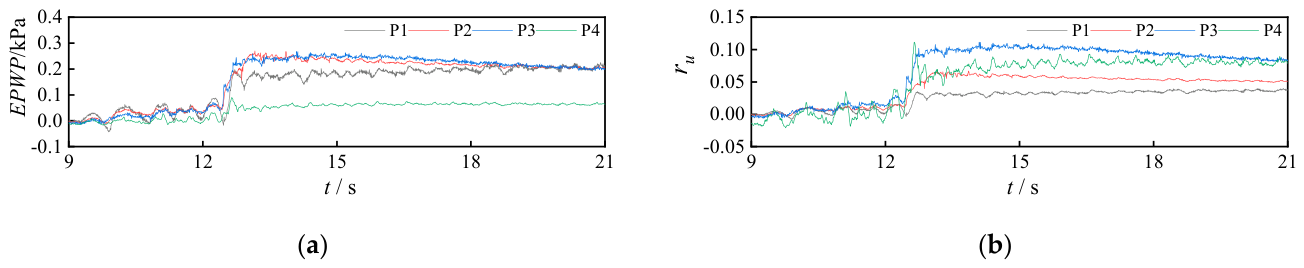
The pore water pressure time-history curves and pore pressure ratio time-history curves at various measurement points under the excitation of a Tianjin wave with a ground acceleration of 0.6 g on a saturated sandy soil site are shown in Figure 17. It can be observed from the figure that due to the increase in effective stress with depth, the distribution pattern of pore water pressure along the depth did not align precisely with that of the pore pressure ratio. Specifically, higher pore water pressures were evident in the middle portion of the soil layer, whereas higher pore pressure ratios were observed at shallower depths within the soil layer. This suggests that liquefaction is more likely to occur at shallower depths within the saturated sandy soil site.
Figure 17.
Time-history curve of pore pressure and pore pressure ratio at 0.6 g Tianjin wave input. (a) Pore pressure; (b) pore pressure ratio.
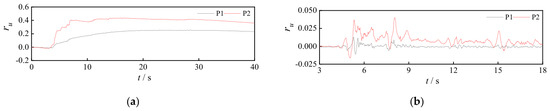
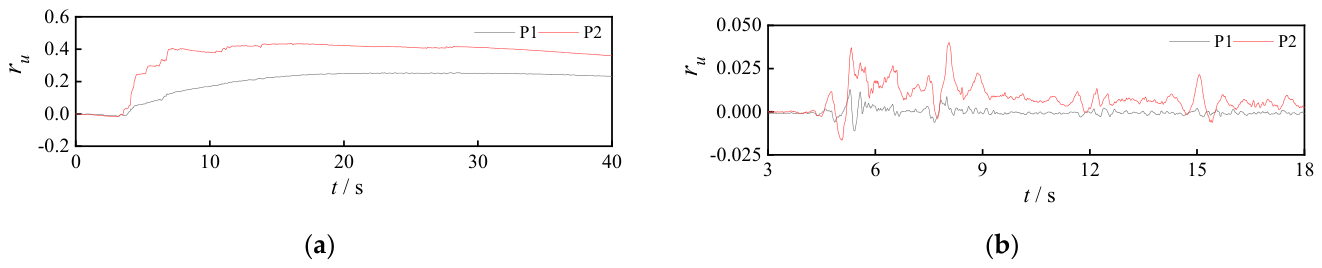
Figure 18 shows the time-history curves of the pore water pressure and pore pressure ratio under the input of the 0.6 g El Centro wave for both saturated sandy soil conditions and dry–saturated layered sandy soil conditions. From the figure, it is evident that under saturated sandy soil conditions, both the accumulation rate of pore water pressure and the pore pressure ratio were larger compared with those under layered sandy soil conditions, with higher peak values as well. This indicates that under the same seismic wave input, saturated sandy soil conditions are more conducive to the accumulation of pore water pressure compared with layered sandy soil conditions, making the soil layer more prone to liquefaction. Effective stress increases linearly with depth. Therefore, although deeper soil layers experience a greater absolute increase in pore water pressure (due to the higher driving potential imparted by cyclic shear stress), their initial effective stress (the denominator in the pore pressure ratio calculation) is also larger. In contrast, shallow soil layers have lower initial effective stress and are, thus, more susceptible to soil liquefaction. This constitutes the fundamental mechanism underlying the “shallow liquefaction” phenomenon.
Figure 18.
Time-history curves of pore pressure ratio. (a) Test 1 (case 0.6 g El Centro wave); (b) test 2 (case 0.6 g El Centro wave).
4. Sensitivity Analysis of Liquefaction Influencing Factors
An orthogonal experimental analysis was conducted with seismic wave peak acceleration, frequency, and soil layer depth as influencing factors at three levels each. The range analysis method quantifies the relative importance of experimental factors by calculating the average values (k1j, k2j, k3j, …) and range values (Rj) of the response variable corresponding to each level of each factor. In general, a larger Rj indicates that the corresponding factor exerts a more significant influence on the experimental response. The experimental indicator chosen was the pore pressure ratio under saturated sandy soil conditions. The range analysis results are presented in Table 4. Range analysis revealed that seismic wave peak acceleration had the highest sensitivity, followed by frequency and depth, in terms of their impact on the liquefaction effect in saturated sandy soils.
Table 4.
Range analysis table.
The factors influencing liquefaction were normalized, and in conjunction with the pore pressure ratio from relevant experimental results, the impact levels of peak ground acceleration, frequency, and soil depth on the liquefaction susceptibility of saturated sandy soil were further analyzed using multiple linear regression. The multivariate linear fitting form is
where x1, x2, and x3 correspond to the peak ground acceleration, depth, and frequency of seismic waves, respectively, and y represents the pore pressure ratio of saturated soil.
The higher the absolute values of the coefficients for each parameter, the greater the influence of the independent variables on the dependent variable. Therefore, comparing the values of coefficients a, b, and c enables the determination of the impact levels of the three factors on the liquefaction susceptibility of saturated sandy soil. The F-test results of the regression equation, which represent the overall significance test for the relationship between the independent and dependent variables, are presented in Table 5. It can be observed that the test statistic F is 24.530, with a corresponding p-value of less than 0.05, indicating that the multiple linear regression model passes the overall significance test and is meaningful.
Table 5.
Analysis of variance.
The significance test results of the regression coefficients are shown in Table 6 and Table 7. From Table 6, it can be inferred that the result R2 is relatively large, indicating a good model fit. By comparing the coefficients in Table 7, it is evident that the absolute value of coefficient a, corresponding to the peak ground acceleration, is the highest, differing from coefficient c, corresponding to depth, by one order of magnitude, and differing from coefficient b, corresponding to frequency, by two orders of magnitude. The results of the multiple linear regression analysis indicate that the influence of various factors on the liquefaction of saturated sandy soil follows the order peak ground acceleration (PGA) > burial depth > seismic wave frequency. These findings demonstrate that PGA is the most significant controlling factor for the liquefaction of saturated sandy soils, while the sensitivity of liquefaction to burial depth and seismic wave frequency differs from the results presented in Table 4. The regression coefficient for seismic wave frequency is 0.002, with a corresponding p-value of 0.834, indicating that frequency is not an independent significant factor affecting pore pressure development under the experimental conditions of this study. The apparent correlation of frequency with liquefaction shown in Table 4 may result from interactions between frequency and PGA or burial depth. The final results are derived from multiple linear regression, which enables assessment of statistical significance, while range analysis reveals that burial depth and loading frequency exhibit comparable sensitivity to liquefaction in saturated sand.
Table 6.
Correlation statistics.
Table 7.
Parameter effects.
5. Conclusions
This study systematically investigated the dynamic response characteristics of sand under varying seismic wave inputs and site conditions via shake table model tests, as well as the effects of ground motion amplitude, frequency, and burial depth on the development of pore water pressure. The main conclusions are summarized as follows:
- (1)
- Soil liquefaction is closely correlated with site conditions. Under strong seismic excitation, noticeable liquefaction occurs at saturated sandy soil sites, accompanied by sand boils and water ejection; however, no liquefaction is observed at dry–unsaturated–saturated layered sandy soil sites under the same excitation amplitude, and only marginal sand ejection is detected under higher amplitude loading. These findings confirm that an upper unsaturated overburden layer can effectively suppress the accumulation of excess pore water pressure and the development of liquefaction in underlying saturated sandy soils.
- (2)
- The acceleration response of the site is jointly modulated by the characteristics of input ground motion and the natural frequency of the site. As the input PGA increases, the surface peak acceleration also increases, but the acceleration amplification factor decreases correspondingly. This trend is attributed to the increased soil shear strain and enhanced soil stiffness degradation under strong ground shaking. When the dominant frequency of the input seismic wave approaches the fundamental frequency of the site, the surface acceleration response is significantly amplified; in contrast, low-frequency components (<10 Hz), whose wavelengths are much larger than the thickness of the soil layer, are unlikely to induce resonance and, thus, produce weak amplification effects.
- (3)
- The development pattern of pore pressure demonstrates the high liquefaction susceptibility of shallow soil layers. The pore pressure ratio exhibits non-uniform variation with depth, peaking at shallow depths. Although absolute pore pressure is higher in intermediate soil layers, the lower initial effective stress in shallow layers increases their propensity for liquefaction initiation. Under fully saturated sand conditions, both the rate of pore pressure buildup and the peak pore pressure ratio are higher than those under layered sand conditions, indicating that full saturation facilitates pore pressure accumulation and increases liquefaction susceptibility. Larger input seismic wave amplitudes, as well as input frequencies closer to the site’s fundamental frequency, lead to more pronounced increases in the pore pressure ratio.
- (4)
- Quantitative ranking of the sensitivity of liquefaction susceptibility to the considered influencing factors was carried out. Normalized sensitivity analysis was performed for three influencing factors—peak ground acceleration (PGA), seismic wave frequency, and burial depth—via range analysis and multiple linear regression. Range analysis yielded the following order of influence strength: PGA > burial depth > seismic wave frequency. The coefficient for frequency (0.002) was not statistically significant (p = 0.834). This indicates that under the experimental conditions adopted in this study, frequency affects liquefaction mainly through interaction with other factors, while PGA is the dominant controlling factor for liquefaction occurrence.
- (5)
- Shallow underground structures and buildings supported by shallow foundations are exposed to higher seismic damage risk at liquefaction-prone sites. If bedrock ground motion is directly adopted as input in seismic design, the actual seismic forces acting on the ground surface will be significantly underestimated. Meanwhile, the thickness of a site’s overburden layer and its saturation condition both have considerable impacts on liquefaction assessment; therefore, refined seismic response analysis should be carried out incorporating the characteristic frequency of the site.
Author Contributions
Conceptualization, Y.C.; Data Curation, Y.G.; Formal Analysis, Y.G.; Funding Acquisition, Y.C., J.Y., W.S.; Methodology, Y.C.; Project Administration, Y.C.; Resources, Y.G.; Software, Y.C.; Validation, Y.C.; Visualization, Y.C.; Writing—Original Draft, Y.G.; Writing—Review and Editing, Y.C., J.Y., W.S. All authors have read and agreed to the published version of the manuscript.
Funding
This research was funded by the Innovation and Entrepreneurship Science and Technology Project of China Coal Technology and Engineering Group (No. 2023-TD-ZD014-002) and the Key Research and Development Project of the Chongqing Research Institute of China Coal Technology & Engineering Group (No. 2024ZDYF20).
Institutional Review Board Statement
Not applicable.
Informed Consent Statement
Not applicable.
Data Availability Statement
The data that support the findings of this study are available from the corresponding authors upon reasonable request.
Conflicts of Interest
Authors Yixiong Gan, Ye Cheng, and Jinghu Yang were employed by the Research Institute of Emergency Science, Chinese Institute of Coal Science. Author Wei Sun was employed by CCTEG Chongqing Research Institute. The authors declare that the research was conducted in the absence of any commercial or financial relationships that could be construed as a potential conflict of interest.
References
- Maurer, B.W.; Green, R.A.; Cubrinovski, M.; Bradley, B.A. Fines-content effects on liquefaction hazard evaluation for infrastructure in Christchurch. Soil Dyn. Earthq. Eng. 2015, 76, 58–68. [Google Scholar] [CrossRef] [Scilit]
- Zhang, X.; Zhang, H.; Wei, C. Numerical simulation study on the influence of mine earthquake on the bolt stress. Shock Vib. 2021, 2, 6364718. [Google Scholar]
- Roy, J.; Rollins, K.M.; Athanasopoulos-Zekkos, A.; Harper, M.; Linton, N.; Basham, M.; Greenwood, W.; Zekkos, D. Gravel liquefaction assessment using dynamic cone penetration and shear wave velocity tests based on field performance from the 1964 Alaska earthquake. Soil Dyn. Earthq. Eng. 2022, 160, 107357. [Google Scholar] [CrossRef] [Scilit]
- Zweck, C.; Freymueller, J.T.; Cohen, S.C. The 1964 great Alaska earthquake: Present day and cumulative postseismic deformation in the western Kenai Peninsula. Phys. Earth Planet. Inter. 2002, 132, 5–20. [Google Scholar] [CrossRef] [Scilit]
- Hong, N.L.; Yan, G.Z.; Guo, X.W. Chuetsu earthquake damages in Niigata County of Japan. Prog. Nat. Sci. 2007, 17, 1255–1259. [Google Scholar]
- Guo, E.; Zhao, Z.Z.; Zhou, X.Y. Comparative analysis of seismic records of Wenchuan in 2008 and other domestic and international earthquakes. Adv. Mater. Res. 2012, 446, 2375–2378. [Google Scholar] [CrossRef] [Scilit]
- Ye, S.S.; Zhai, G.F. Damages and lessons from the Wenchuan earthquake in China. Hum. Ecol. Risk Assess. 2011, 17, 598–612. [Google Scholar] [CrossRef] [Scilit]
- Unjoh, S.; Kaneko, M.; Kataoka, S.; Nagaya, K.; Matsuoka, K. Effect of earthquake ground motions on soil liquefaction. Soils Found. 2012, 52, 830–841. [Google Scholar] [CrossRef] [Scilit]
- Meng, Q.L. Bridges damage during East-Japan earthquake on 11th March 2011. Appl. Mech. Mater. 2011, 90, 1649–1658. [Google Scholar] [CrossRef] [Scilit]
- D’Apuzzo, M.; Evangelisti, A.; Spacagna, R.L.; Cappelli, G.; Nicolosi, V.; Modoni, G.; Paolella, L. Seismic resilience assessment strategy for social and sustainability impact evaluation on transportation road network: A seismic liquefaction-induced damage application. Sustainability 2022, 14, 8411. [Google Scholar] [CrossRef] [Scilit]
- Todorovic, L.; Silva, V. A liquefaction occurrence model for regional analysis. Soil Dyn. Earthq. Eng. 2022, 161, 107430. [Google Scholar] [CrossRef] [Scilit]
- Dunatunga, S.; Kamrin, K. Continuum modelling and simulation of granular flows through their many phases. J. Fluid Mech. 2015, 779, 483–513. [Google Scholar] [CrossRef] [Scilit]
- Huang, Y.; Miao, Y. Review of soil liquefaction characteristics during major earthquakes of the twenty-first century. Nat. Hazards 2013, 65, 2375–2384. [Google Scholar] [CrossRef] [Scilit]
- Cappellaro, C.; Cubrinovski, M.; Bray, J.D.; Chiaro, G.; Riemer, M.F.; Stringer, M.E. Liquefaction resistance of Christchurch sandy soils from direct simple shear tests. Soil Dyn. Earthq. Eng. 2021, 141, 106489. [Google Scholar] [CrossRef] [Scilit]
- Dief, H.M.; Figueroa, J.L. Liquefaction assessment by the unit energy concept through centrifuge and torsional shear tests. Can. Geotech. J. 2007, 44, 1286–1297. [Google Scholar] [CrossRef] [Scilit]
- Hamada, M.; Wakamatsu, K. A Study on ground displacement caused by soil liquefaction. Doboku Gakkai Ronbunshu 1998, 596, 189–208. [Google Scholar] [CrossRef] [Scilit]
- Tokimatsu, K.; Yoshimi, Y. Empirical correlation of soil liquefaction based on SPT N-value and fines content. Soils Found. 1983, 23, 56–74. [Google Scholar] [CrossRef] [Scilit]
- Elgamal, A.; Yang, Z.; Parra, E. Computational modeling of cyclic mobility and post-liquefaction site response. Soil Dyn. Earthq. Eng. 2002, 22, 259–271. [Google Scholar] [CrossRef] [Scilit]
- Yasuda, S.; Nagase, H.; Kiku, H.; Uchida, Y. The mechanism and a simplified procedure for the analysis of permanent ground displacement due to liquefaction. J. Jpn. Soc. Soil Mech. Found. Eng. 1992, 32, 149–160. [Google Scholar] [CrossRef] [Scilit]
- Zhang, J.M.; Wang, G. Large post-liquefaction deformation of sand, Part I: Physical mechanism, constitutive description and numerical algorithm. Acta Geotech. 2012, 7, 67–113. [Google Scholar] [CrossRef] [Scilit]
- Moss, R.E.S.; Honnette, T.R.; Jacobs, J.S. Large-scale liquefaction and postliquefaction shake table testing. J. Geotech. Geoenviron. Eng. 2020, 146, 04020138. [Google Scholar] [CrossRef] [Scilit]
- Ye, B.; Xie, X.; Zhao, T.; Song, S.; Ma, Z.; Feng, X.; Zou, J.; Wang, H. Centrifuge tests of macroscopic and mesoscopic investigation into effects of seismic histories on sand liquefaction resistance. J. Earthq. Eng. 2022, 26, 4302–4324. [Google Scholar] [CrossRef] [Scilit]
- Sonmezer, Y.B.; Kayabali, K.; Beyaz, T.; Fener, M. Influence of grain size ratio and silt content on the liquefaction potentials of silty sands. Geomech. Eng. 2022, 31, 167–181. [Google Scholar]
- Yen, K.Y.; Chen, C.H. On the variation of mechanical properties of saturated sand during liquefaction observed in shaking table tests. Soil Dyn. Earthq. Eng. 2020, 129, 105946. [Google Scholar] [CrossRef] [Scilit]
- Varghese, R.M.; Madhavi, L.G. Shaking table tests to investigate the influence of various factors on the liquefaction resistance of sands. Nat. Hazards 2014, 73, 1337–1351. [Google Scholar] [CrossRef] [Scilit]
- Zhang, J.; Yang, Z.; Yang, Q.; Li, G.; Liu, J. Pore water pressure model for sands reinforced with randomly distributed fibers based on cyclic triaxial tests. Soil Dyn. Earthq. Eng. 2021, 148, 106812. [Google Scholar] [CrossRef] [Scilit]
- Gu, X.; Wu, D.; Zuo, K.; Tessari, A. Centrifuge Shake Table Tests on the Liquefaction Resistance of Sand with Clayey Fines. J. Geotech. Geoenviron. Eng. 2021, 148, 04021180. [Google Scholar] [CrossRef] [Scilit]
- Tohumcu, P.; Özaydın, K. Investigation of liquefaction and pore water pressure development in layered sands. Bull. Earthq. Eng. 2009, 7, 199–219. [Google Scholar] [CrossRef] [Scilit]
- Huang, X.; Cai, X.; Yang, P.; Zheng, X.; Zhang, S.; Bo, J. Study on the dynamic pore water pressure model of centerline tailings sand based on dynamic triaxial tests. Geomech. Geophys. Geo-Energy Geo-Resour. 2023, 9, 79. [Google Scholar] [CrossRef] [Scilit]
- Feng, X.; Ye, B.; He, J.; Miao, H.; Lin, C. Shaking table test on underwater slope failure induced by liquefaction. Soils Found. 2023, 63, 101357. [Google Scholar] [CrossRef] [Scilit]





Disclaimer/Publisher’s Note: The statements, opinions and data contained in all publications are solely those of the individual author(s) and contributor(s) and not of MDPI and/or the editor(s). MDPI and/or the editor(s) disclaim responsibility for any injury to people or property resulting from any ideas, methods, instructions or products referred to in the content. |
© 2026 by the authors. Licensee MDPI, Basel, Switzerland. This article is an open access article distributed under the terms and conditions of the Creative Commons Attribution (CC BY) license.