


Abstract
Cardiovascular diseases pose a significant global health threat, with atrial fibrillation representing a critical precursor to more severe heart conditions. In this work, a multimodality-based deep learning model has been developed for diagnosing atrial fibrillation using an embedded system consisting of a Raspberry Pi 4B, an ESP8266 microcontroller, and an AD8232 single-lead ECG sensor to capture real-time ECG data. Our approach leverages a deep learning model that is capable of distinguishing atrial fibrillation from normal ECG signals. The proposed method involves real-time ECG signal acquisition and employs a multimodal model trained on the PTB-XL dataset. This model utilizes a multi-step approach combining a CNN–bidirectional LSTM for numerical ECG series tabular data and VGG16 for image-based ECG representations. A fusion layer is incorporated into the multimodal CNN-BiLSTM + VGG16 model to enhance atrial fibrillation detection, achieving state-of-the-art results with a precision of 94.07% and an F1 score of 0.94. This study demonstrates the efficacy of a multimodal approach in improving the real-time diagnosis of cardiovascular diseases. Furthermore, for edge devices, we have distilled knowledge to train a smaller student model, CNN-BiLSTM, using a larger CNN-BiLSTM model as a teacher, which achieves an accuracy of 83.21% with 0.85 s detection latency. Our work represents a significant advancement towards efficient and preventative cardiovascular health management.
1. Introduction
Cardiovascular disorders are leading causes of death worldwide, responsible for approximately 17% of all fatalities [1]. The World Health Organization estimates that these conditions contribute to 9 million deaths annually. Atrial fibrillation (AF), a common arrhythmia, significantly increases the risk of stroke and heart failure [2]. Therefore, proper management of AF requires early detection and continuous monitoring to prevent severe outcomes. However, current ECG monitoring systems are expensive and complex, often necessitating hospital visits, making these systems inadequate for continuous real-time monitoring, particularly in non-clinical settings.
Internet of Things (IoT) technology has rapidly accelerated, bringing a drastic change in the healthcare sector by establishing portable health monitoring systems [3]. These IoT-based systems enable constant surveillance of a patient’s condition, providing timely notifications and significantly better outcomes [4]. Despite their potential, current IoT-based ECG monitoring solutions often fail to provide complete multimodal diagnostic tools designed for atrial fibrillation identification. Recent research indicates that there have been significant advancements in the healthcare sector in deep learning and IoT technology. For example, they developed a portable, low-cost ECG monitoring system with deep learning algorithms to detect arrhythmias with an overall accuracy of 97.57% [5]. Furthermore, they employed affordable components such as Raspberry Pi, ESP8266, and ECG sensors in this system to demonstrate the feasibility of creating cost-effective and portable remote monitoring systems [6].
In this work, we present an embedded system for real-time atrial diagnosis based on the multimodal analysis of ECG data. The proposed system combines the latest deep learning techniques, IoT devices, and interfaces to provide a complete solution for continuous heart monitoring. It has been designed to overcome the drawbacks of conventional ECG systems and become a very effective, portable, and accurate tool for the early diagnosis and control of atrial fibrillation, which will help to enhance the quality of life of patients and decrease the costs of healthcare services.
This work describes a novel approach to detecting stroke and coronary heart disease based on ECG-based biosignals. The system employs embedded technologies and machine learning to analyze real-time ECG data, which is recorded via an integrated methodology. The seamless integration of hardware and machine learning facilitates the interpretive process, offering a user-friendly and cost-effective means for individuals to monitor their heart health. The findings from semantic analysis can be incorporated into this system to provide objective diagnoses and potentially prognostic therapies for medical professionals. The key contributions of our work include the following:
- Advanced deep learning algorithms: The system employs classification algorithms, e.g., CNN-LSTM, CNN-BiLSTM, and VGG16, for efficient and sensitive identification of atrial fibrillation.
- Multimodal ECG data analysis: A multimodal system with CNN-BiLSTM + VGG16 model has been developed for AF detection employing numerical and image data of ECG signals in contrast to the single-modality systems.
- Real-time monitoring and alerts: The proposed real-time ECG signal analysis system, comprising a Raspberry Pi 4B, an ESP8266 microcontroller, and an AD8232 single-lead ECG sensor, instantaneously alerts patients and healthcare providers of potential AF episodes, ensuring timely treatment.
- Cost-effective solution: The system is cost-effective, making it suitable for home use and use in areas with limited access to healthcare, thus filling the existing void in healthcare.
The novelty of this work lies in the multimodal integration of CNN-BiLSTM and VGG16 techniques for real-time ECG analysis, offering a cost-effective solution for continuous atrial fibrillation detection.
The remainder of this work is structured as follows. Section 2 further discusses the real-time stroke prediction and heart disease diagnosis using ECG data and machine learning presented in this research. Section 3 illustrates a comprehensive methodology and experimental setup of the proposed automatic multimodal AF detection system. Elaborated results demonstrating the effectiveness of the developed system in the advanced healthcare domain are presented in Section 4. Finally, Section 5 concludes the work, offering information on potential future research directions.
2. Related Work
Substantial works have been performed on automated real-time stroke prediction and heart disease diagnosis, emphasizing methodologies that use ECG data and advanced artificial intelligence techniques for stroke prediction. A few recent studies on deep-learning-based AF detection have been briefly discussed in this section. For instance, Yu et al. [7] developed an intelligent system that used real-time ECG and PPG multimodal biosignals to detect stroke and evaluate the health status of individuals. The authors developed a signal sensor for assessment and reporting, using a sample of 287 stroke patients and 287 elderly patients without stroke. They extracted features based on the peak values obtained from the ECG and PPG signals. The authors then incorporated a method to capture, record, and wirelessly transfer multimodal real-time biosignals to a server. Lastly, they used a machine learning algorithm to predict prognostic symptoms of stroke in older people in real time, and the validation was 91.56% for the C4.5 decision tree, 97.51% for Random Forest, and 99.15% for CNN-LSTM models using 10-fold cross-validation datasets.
Choi et al. [8] presented a deep learning approach to predict stroke from raw real-time biosignals without frequency characteristics. They gathered raw EEG data from a hospital emergency medical center for people 65 years and older, preprocessed at a sampling rate of 1000 Hz from six channels, and derived power and relative values from the frequency attribute. They employed four types of deep learning models, and the best model was the CNN–bidirectional LSTM model. They also found a way of sending data to a server, where the model analyzed them to make the predictions. Eventually, their CNN–bidirectional LSTM model achieved an accuracy of 94%, comprising a 6.0% (low) false positive rate and a 5.75% false negative rate. At the same time, it decreases the cost of stroke testing in everyday life.
Choi et al. [9] presented a machine learning approach to monitor the health of older people during their daily activities using vital EEG signals for stroke and other diseases. Their system had a user or caregiver layer for visualization and a layer for inputting wave frequency. They obtained raw EEG data and preprocessed it using FFT, which obtained power values from raw spectra; they used a Random Forest algorithm with quartiles and Z-score normalization and obtained an accuracy of 92.5% stroke prediction accuracy. Zhou et al. [10] transformed ECG signals into modal images using Gramian angular field (GAP) and recurrence plot (RP) techniques and then inputted them into a CNN-based model with FCA for better preservation detail in multimodal ECG applications. Eventually, this method achieved 99.6% accuracy in working with the MIT-BIH arrhythmia database, which consisted of five different arrhythmia classes. Then, they demonstrated the possibility of using multimodal fusion in ECG analysis.
Zhang et al. [11] proposed a deep neural network using ECG and PCG signals for event classification. Combining the features from both signal types, their model, trained on the PhysioNet database, obtained 92.3% accuracy, sensitivity of 97%, specificity of 99%, precision of 98%, and an F1 score of 98%. Ahmad et al. [12] used two multimodal fusion approaches, namely Multimodal Image Fusion (MIF) and Multimodal Feature Fusion (MFF), to classify ECG heartbeats. Furthermore, they transformed ECG signals into images using GAF, MTF, and RP techniques; MIF fused these images for CNN input; MFF extracted features for classification using SVM. Their approach achieved 99.7% accuracy in working with the MIT-BIH and PTB datasets.
Han et al. [13] presented a multimodal multi-instance learning neural network (MAMIL) to classify long-term ECG signals using original ECG signals and their GAF images as inputs. The MIL approach ensured no information loss, considering each heartbeat on the ECG and the GAF patch as instances. CNN extracted features and an attention-based fusion method combined them for the final classification, which was superior to other deep-learning-based models in long-term ECG datasets. Mert and Akan [14] proposed a new vision transformer model to identify fibrillation from lead ECG signals. They employed wavelet-based synchrosqueezing transform (WSST) for the time–frequency domain analysis and generated time–frequency images from ECG signals. They evaluated these signals using a developed vision transformer (ViT) model. This system achieved a precision of 95.8% in identifying fibrillation and high sensitivity, specificity, recall, and F1 scores.
Żyliński et al. [15] proposed an edge computing algorithm for atrial fibrillation detection on microcontrollers, like the ARM Cortex-M4, which enables efficient implementation of machine learning classifiers for atrial fibrillation detection, with notable advantages in power efficiency, data privacy, and system costs. However, difficulties like false-positive detection and the clinical significance of detected arrhythmias remain in the applied model. The applied SVM technique accomplished 97% accuracy and 0.72 ms. Obeidat et al. [16] proposed a cost-effective, portable ECG diagnostic system utilizing Raspberry Pi, offering wireless and wired interfaces for real-time heart monitoring, leading the development of recent advancements. So, this embedded system integrates analog and digital components for signal conditioning and conversion, providing accurate ECG measurements on a graphical display. The system’s ability to detect heart abnormalities efficiently highlights its potential in various medical settings. Eventually, this system performed with vast effectiveness, ranging from 60 to 300 BPM, with an average 5% deviation.
Su et al. [17] introduced an ECG acquisition and analysis system that combined traditional machine learning models, including logistic regression, SVMs, and XGBoost, with deep learning models like CNNs and LSTMs for enhanced ECG signal classification for the recent advancement. By applying the fusion of these models, achieving a classification accuracy of 99.13% was the core contribution of the work. Eventually, this study highlights the potential of integrating machine learning with feature engineering to improve ECG signal analysis and emphasizes future work on portability and model optimization. Shin et al. [18] proposed an ensemble algorithm for arrhythmia diagnosis with the MobileNet architecture to smooth the work in mobile applications. The authors successfully enhanced the measurements of the ECG signal taken over a short period by employing the matching search algorithm. Using the MIT-BIH database, their proposed ensemble classifier with MobileNetV2 and BILSTM performed 91.7% perfection and an F1 score of approximately 0.92. Eventually, the attempt was to make it easier for people with a tight schedule to manage their health.
Reviews in the literature emphasized extensive research on different heart problems, especially automatic AF detection using deep learning techniques. Despite advancements in ECG monitoring, existing systems often struggle with real-time analysis and accuracy, necessitating the development of more robust solutions. Most articles did not utilize real-time ECG signals and predicted atrial fibrillation instantaneously. Moreover, they did not explore algorithms or approaches for the diverse forms of the multimodal ECG dataset. Very few authors deployed the automatic AF identification system in edge devices.
3. Proposed Methodology
3.1. Hardware Components
The proposed AF detection system includes a hardware component that captures real-time ECG signals as input. However, this hardware is not a pre-assembled system; instead, we sourced individual components from the market and assembled them into a complete system tailored to our specifications. Table 1 presents the hardware system’s individual components, quantities, and prices based on quotes from online marketplaces in Dhaka, Bangladesh, in March 2024.
Table 1.
Approximate cost of the proposed AF detection hardware device.
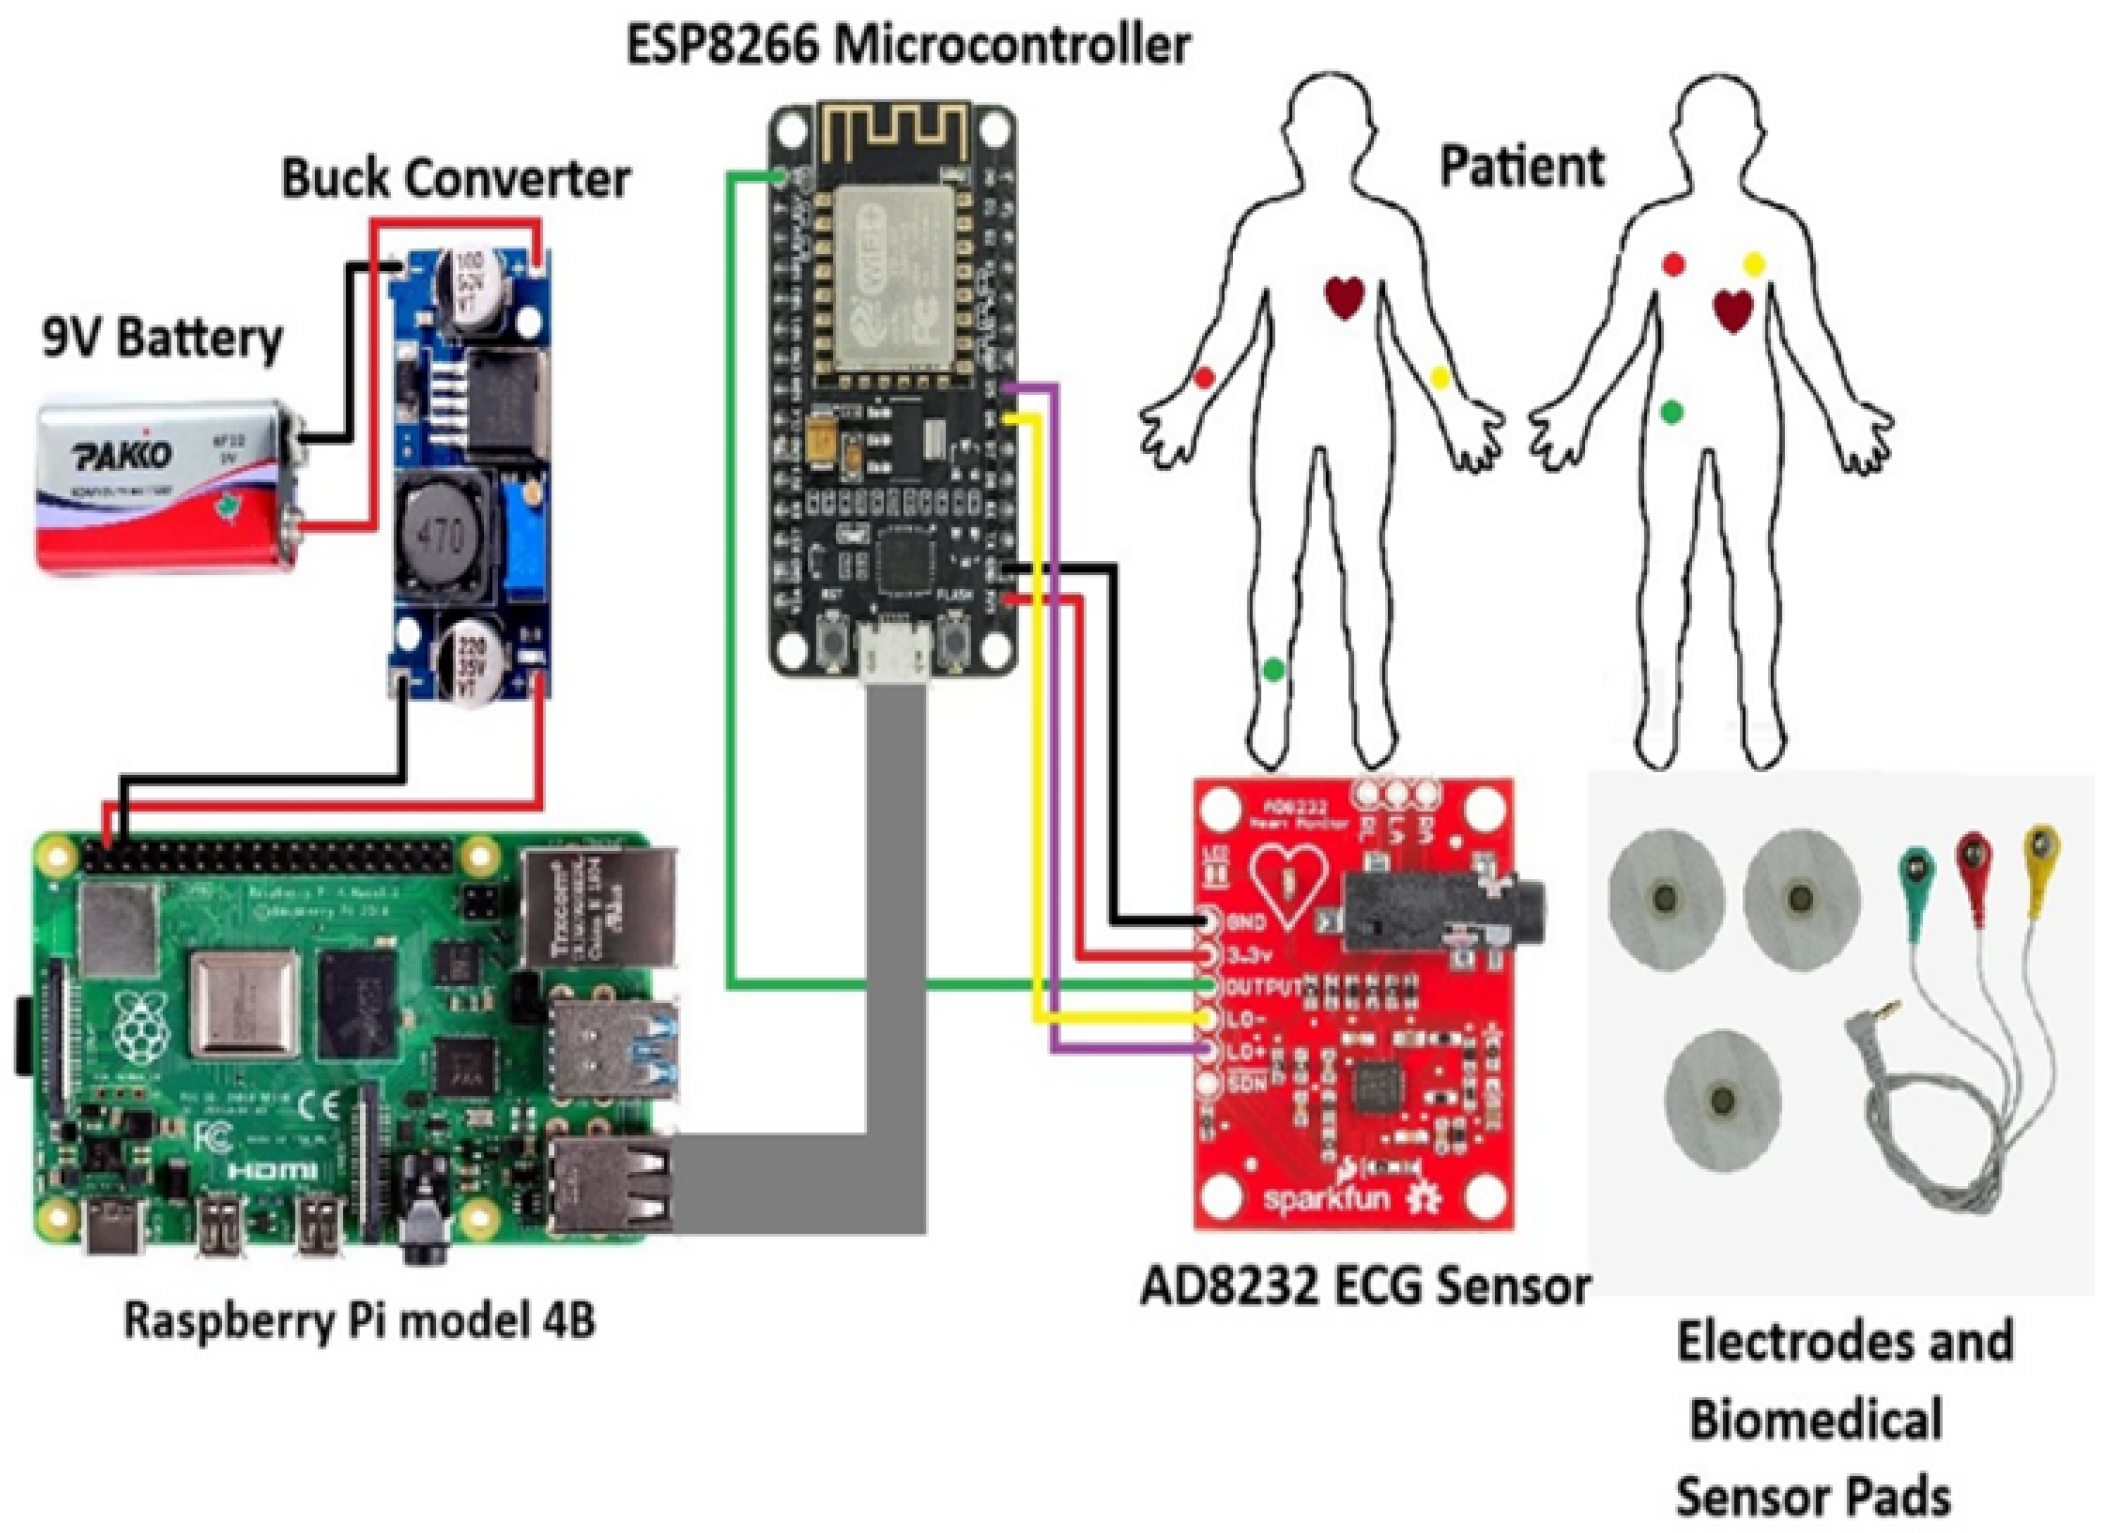
The proposed system comprises several critical hardware components for effective and precise ECG monitoring. At the core of this configuration is the AD8232 single-lead ECG sensor, which utilizes three biomedical electrode pads to capture the heart’s electrical signals. Using the AD8232 sensor, we recorded the real-time ECG signals. The ESP8266 microcontroller is used for data gathering and transmission that occur in real-time and the data are transferred from the AD8232 ECG sensor. Eventually, this microcontroller acts as a relay and transmits the gathered data to the Raspberry Pi 4 B for further signal processing. The Raspberry Pi is in charge of processing and analyzing ECG data by using deep learning algorithms simultaneously.
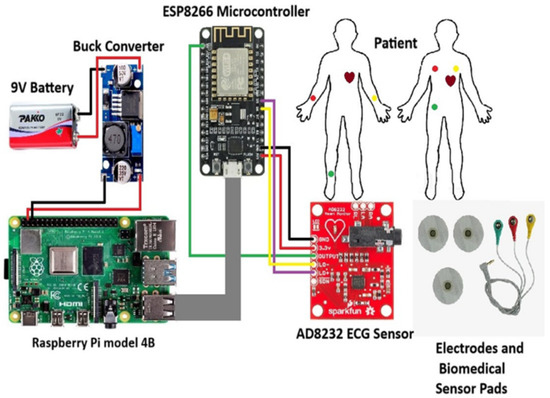
The ESP8266 was directly connected to the Raspberry Pi 4B edge device via a USB cable for efficient data transfer. The Arduino Integrated Development Environment (IDE) was installed on the Raspberry Pi operating system to read the serial data. This setup enabled real-time data acquisition and processing on the Raspberry Pi platform. A 9 V battery was also integrated into the circuit to power the entire system. A buck converter was used to step down the voltage to 5 V, ensuring the power supply to all components. This configuration provided the system with operational stability and portability, making it suitable for continuous ECG monitoring in various environments. Figure 1 illustrates the design of the complete AF classification hardware system with labeled components.
Figure 1.
The proposed architecture of the hardware system.
3.2. Real-Time ECG Monitoring and Data Collection
The system utilizes three electrodes as the primary inputs during the implementation phase. These electrodes are strategically positioned on the appropriate body parts to obtain the most accurate data. The electrodes are connected to the AD8232 ECG sensor, which records the cardiac signals and relays them to the ESP8266 microcontroller. The ESP8266 module then receives the data and displays the ECG readings on the serial monitor of the Arduino Integrated Development Environment. ECG signals are processed and analyzed by converting sampled data into voltage, filtering it, and mapping it to time points, which can be described as follows:
where T represents the duration, n is the number of samples taken, and is the sampling rate, which in our case is 99 Hz.
Next, to improve the raw ECG signal, the ADC values are converted to voltages using the reference voltage of 3.3 V that the AD8232 sensor uses.
The proposed system includes several critical hardware components for effective and precise ECG monitoring. The core of this configuration is the AD8232 single-lead ECG sensor that employs three biomedical electrodes. The mean voltage is subtracted from the converted signal to remove the baseline signal. To filter the signal further, a bandpass filter is employed with a low and high cutoff frequency of 0.5 Hz and 40 Hz, respectively. This step was very useful in eliminating high-frequency noise and low-frequency drift, hence improving the quality of the ECG signal. Finally, a time vector is constructed to map each sample to its corresponding time point as follows:
During the development stage, various iterative methods were applied to fine-tune signal processing and obtain the best response of the ECG signal. This iterative process transformed the system to be more reliable in capturing and processing the ECG data, since we repeated it several times.
3.3. Experimental Setup
The proposed AF detection system has been deployed to an embedded device which has been tested and implemented in real-world conditions.
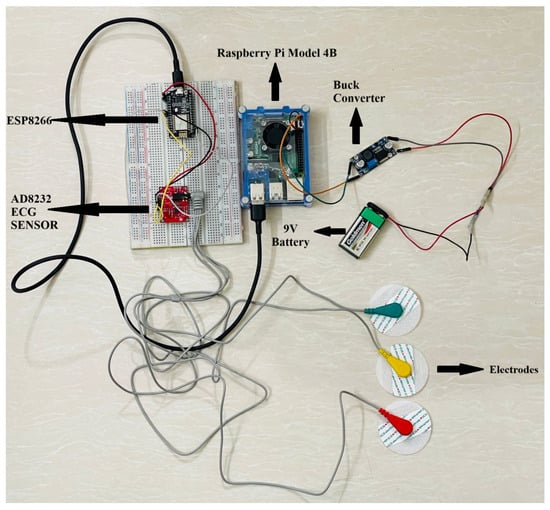
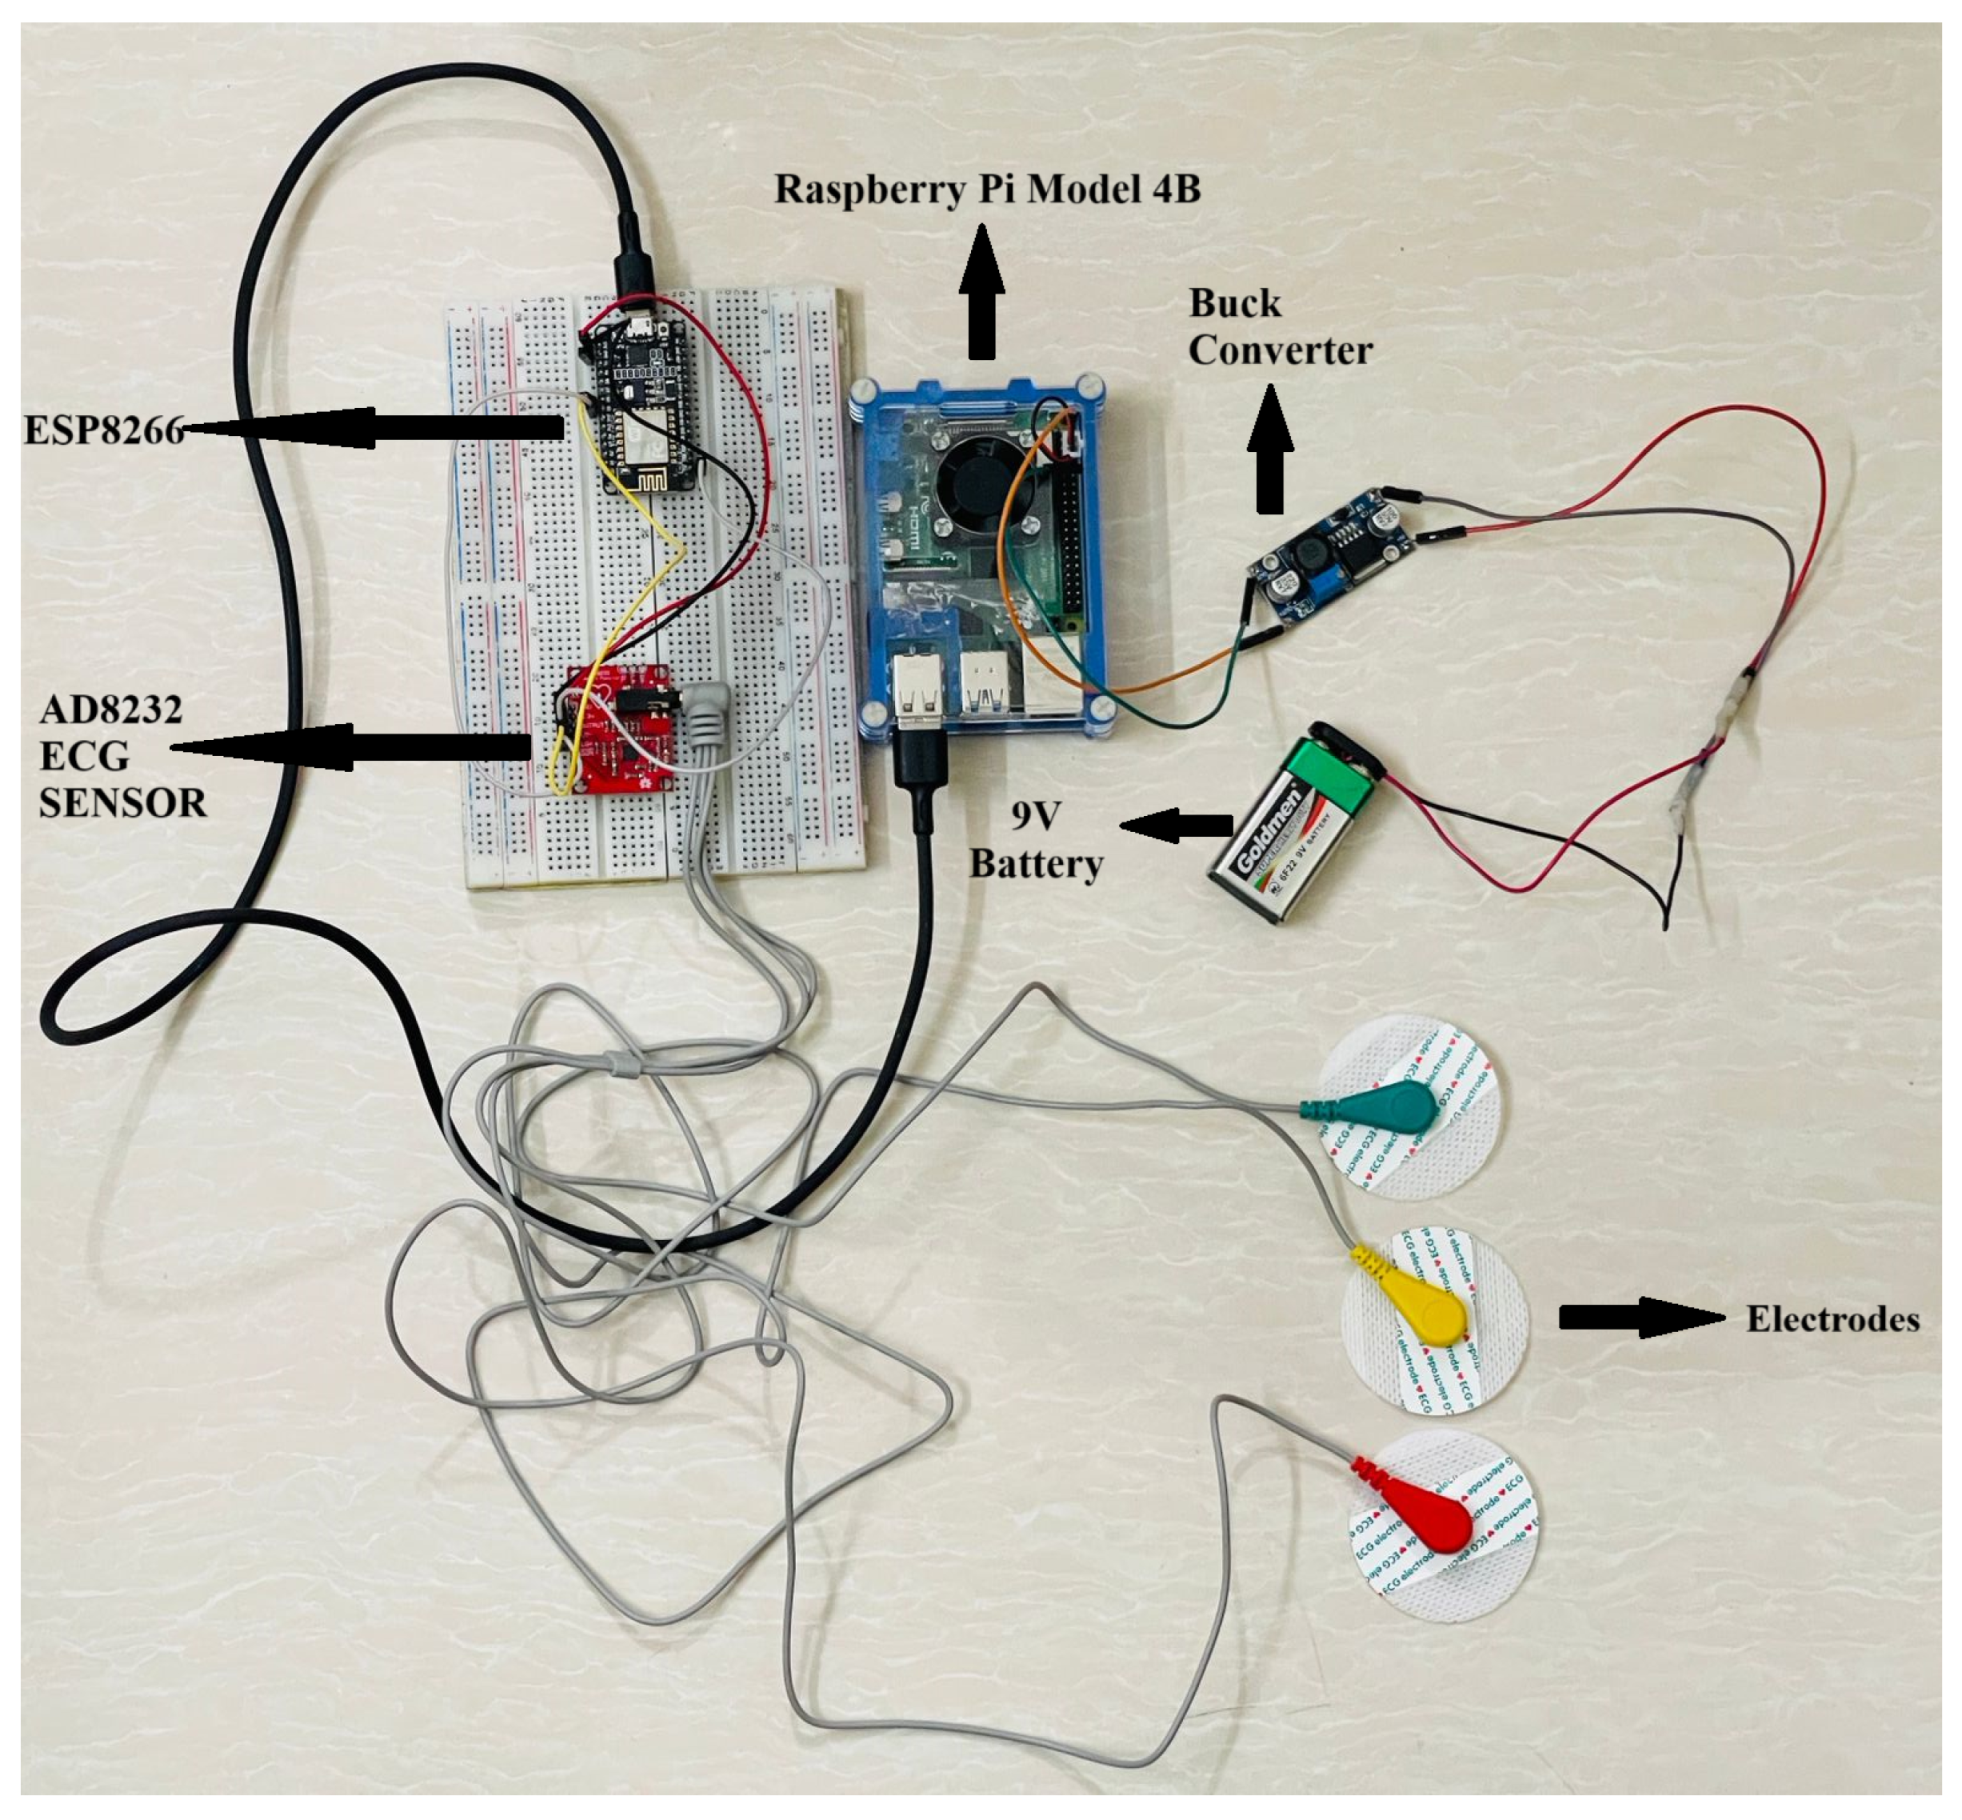
Figure 2 illustrates the complete hardware setup used for capturing real-time ECG data using three leads. These three leads generate three distinct ECG signals. We utilize three out of the twelve possible leads, as not all twelve are required to detect atrial fibrillation.
Figure 2.
Hardware setup of the proposed AF detection system.
There exist two standard techniques for electrode placement in ECG recordings. Figure 3 depicts the recommended procedure for positioning the electrodes on a patient’s body. The electrodes should be placed according to the procedure outlined in this study. During the ECG recording, the patient should remain relaxed and still to minimize interference with the acquired results. This relaxation helps reduce the likelihood of movement artifacts and other noise sources that could distort the ECG signal, thereby enhancing the quality of the obtained data.
Figure 3.
Placement of the electrodes.
3.4. Dataset
This study utilizes the PTB-XL ECG signal database [19], which includes data for atrial fibrillation detection. The database comprises ECG signals recorded from 12 leads, i.e., I, II, III, aVF, aVR, aVL, V1, V2, V3, V4, V5, and V6. It contains 21,799 clinical ECG records, along with a metadata file. The recorded signals were collected from 18,869 patients, with data available at two sampling frequencies, 100 Hz and 500 Hz, each 10 s in duration. In this study, the 100 Hz signals have been used. The PTB-XL dataset initially includes five diagnostic classes; however, for our study, we focused on the binary classification task for atrial fibrillation and normal categories. From the PTB-XL ECG signal dataset, we selected 2500 ECG samples for the normal class and 1335 samples for the AF class. Since the dataset was slightly imbalanced, we applied the SMOTE technique to the training set, ensuring both the majority (normal) and minority (AF) classes were equally represented. However, the test set remained untouched, preserving its original distribution to evaluate the performances of the applied models.
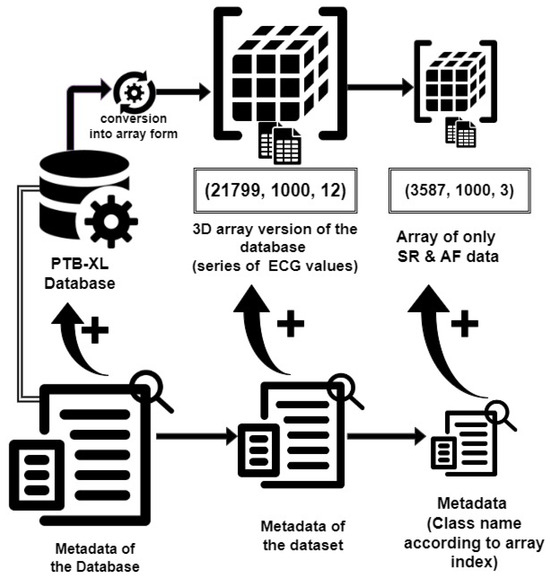
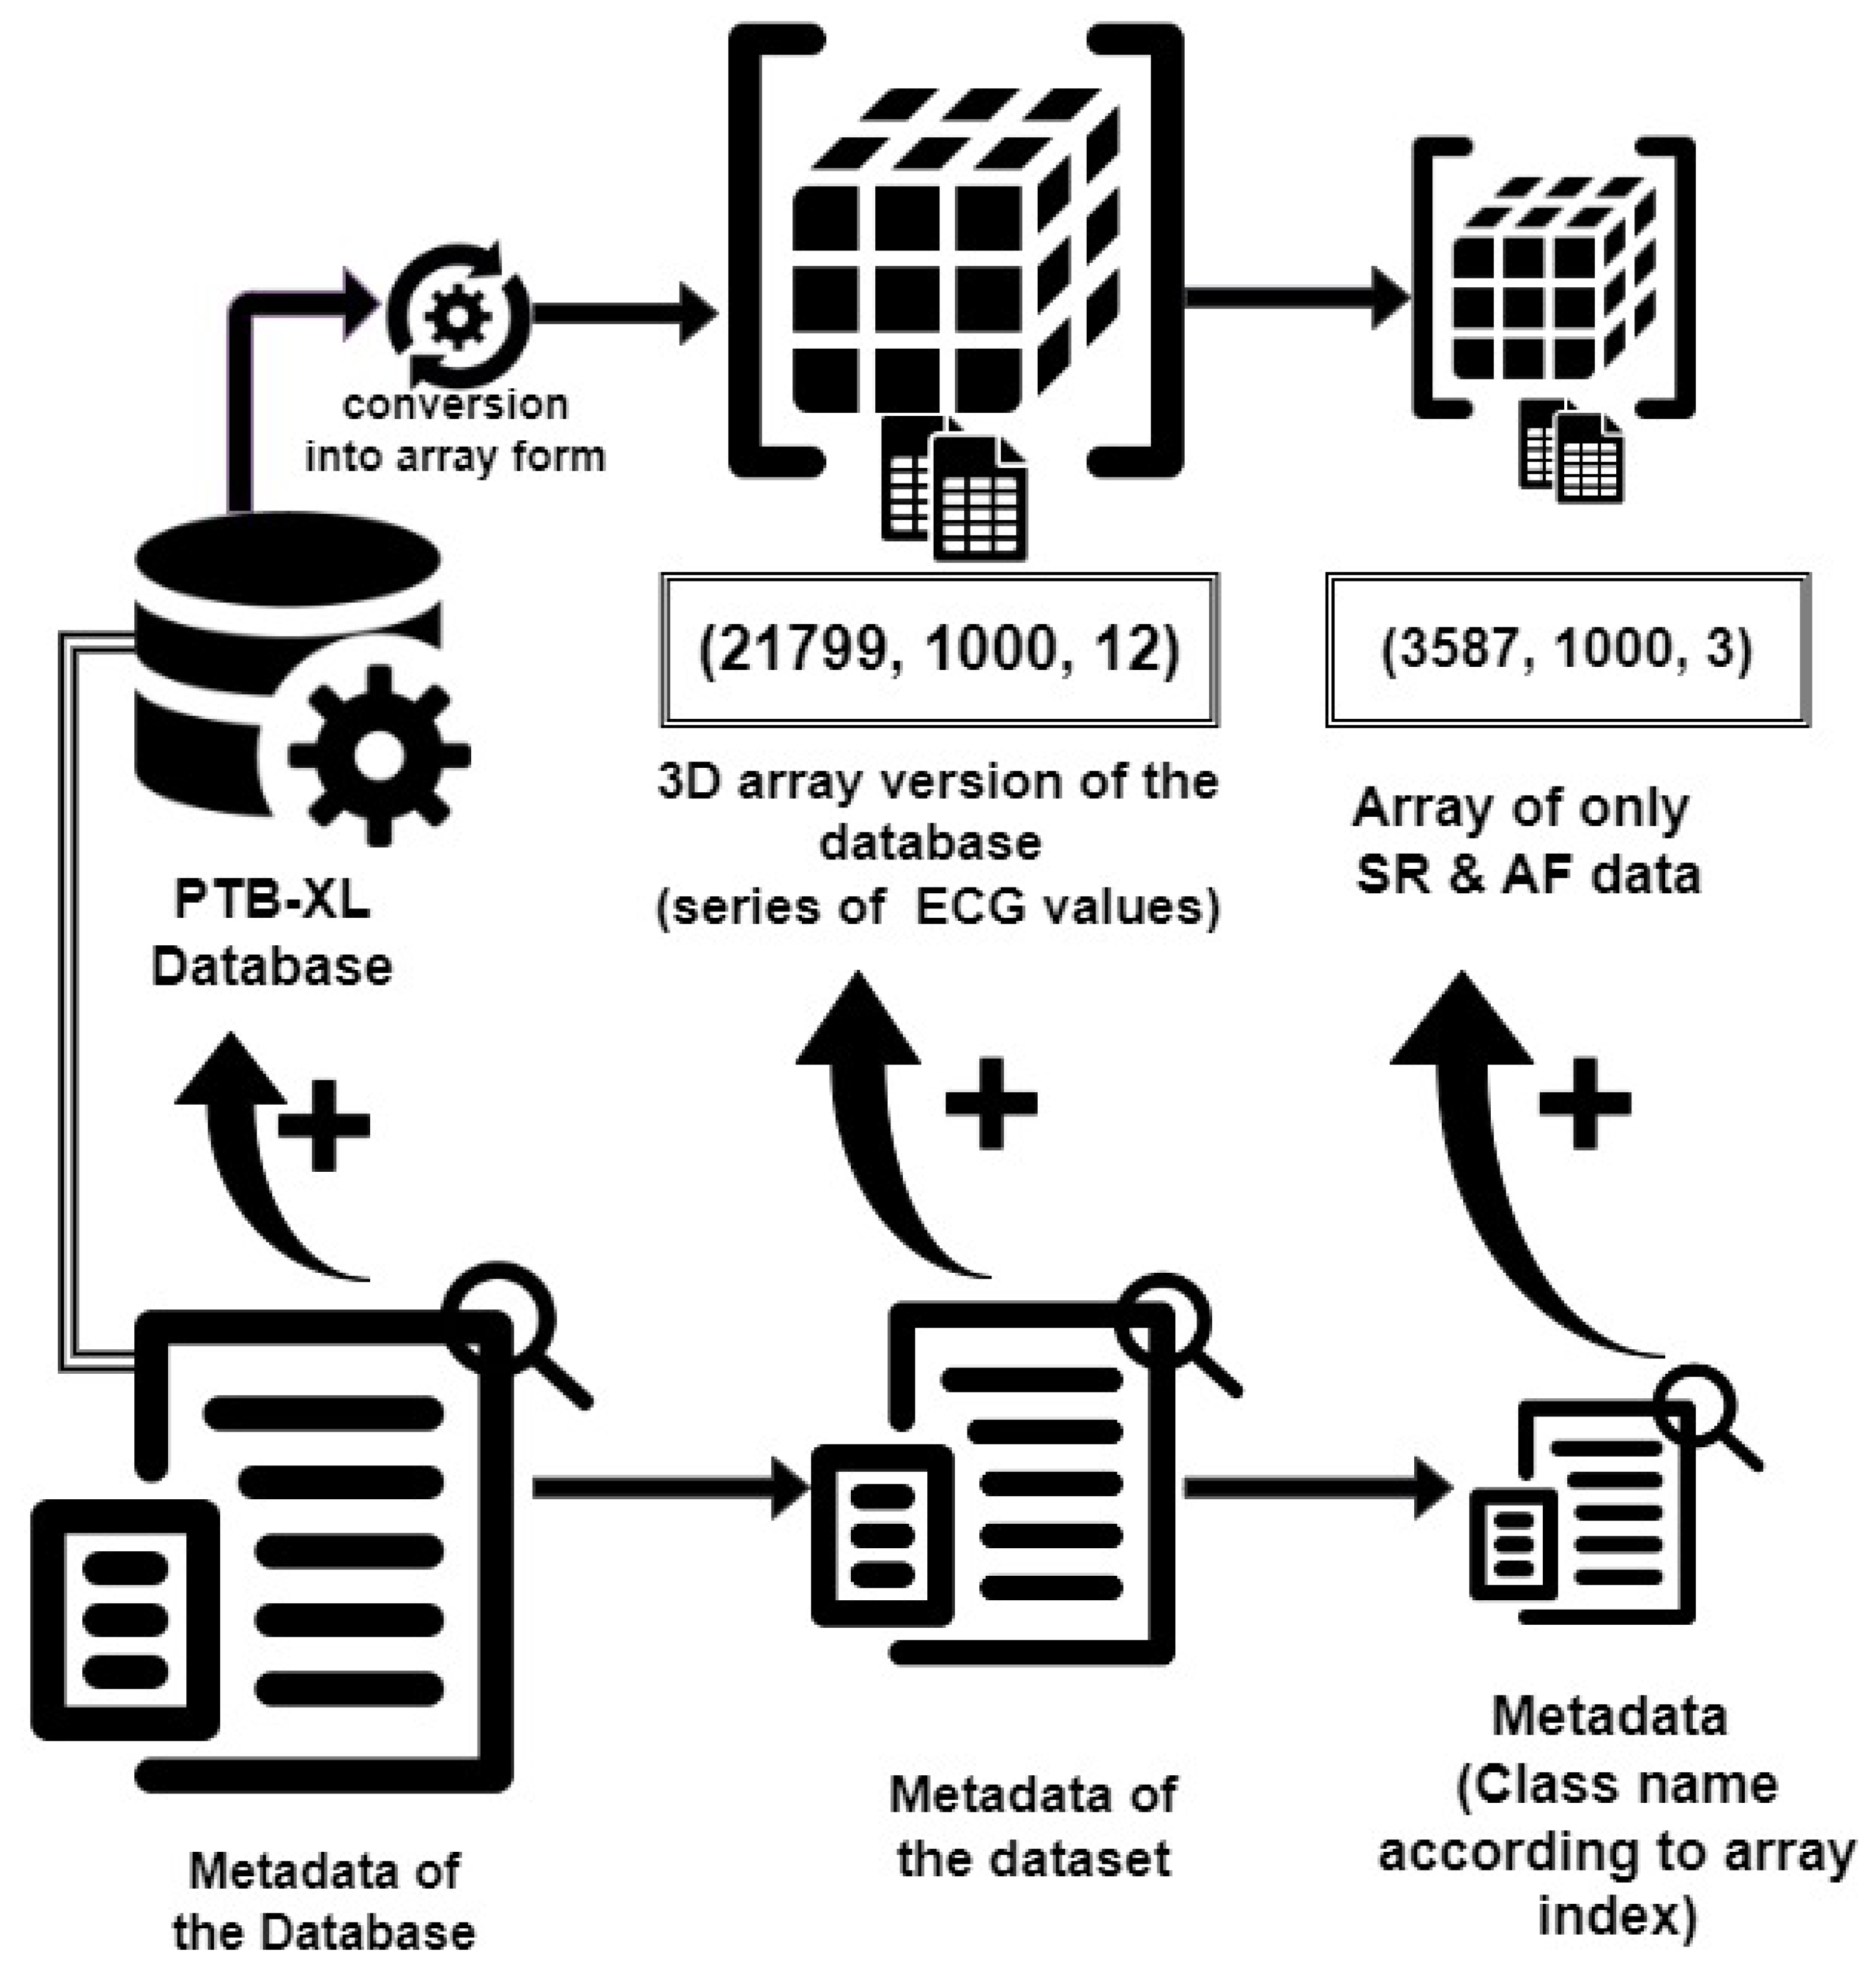
Figure 4 illustrates the conversion of the dataset from the database. To make the database usable, we created a 3D array of ECG data series values and a metadata file that includes the type of diagnosis for each sample. The array has a shape of (21,799, 1000, 12), where 21,799 represents the number of samples, 1000 corresponds to the data points per signal (100 Hz × 10 s), and 12 denotes the number of leads. The dataset includes 9514 normal ECGs, 5469 myocardial infarctions, 5235 STTCs, 4898 conduction disturbances, and 2649 hypertrophy samples. However, our study focused on differentiating between normal sinus rhythm and atrial fibrillation. We selected 2000 standard sinus rhythm samples and 1587 atrial fibrillation samples, resulting in a final dataset of 3587 samples with a size of (3587, 1000, 12).
Figure 4.
Conversion of PTB-XL database to dataset.
Leads V1 and II are crucial for identifying atrial fibrillation [20]. However, it has been demonstrated that only three leads, i.e., V1, V5, and II, are sufficient for detecting atrial fibrillation [21]. Consequently, we included lead V5 and limited the dataset to these required leads to reduce noise in this work. This process resulted in a final filtered dataset with a shape of (3587, 1000, 3). The metadata file was also cleaned to retain only the diagnosis type, where 0 represents normal sinus rhythm and 1 represents atrial fibrillation.
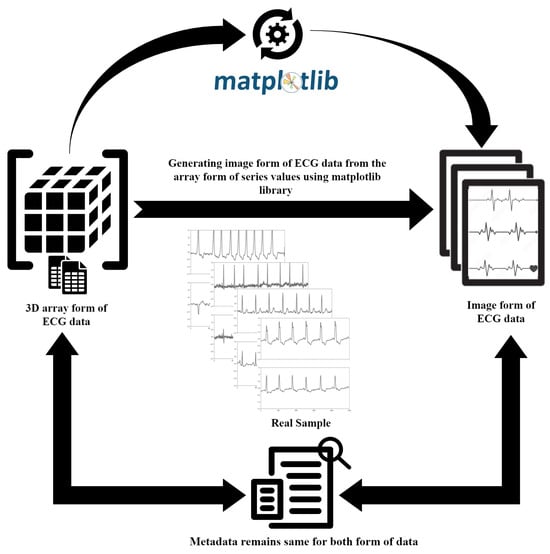
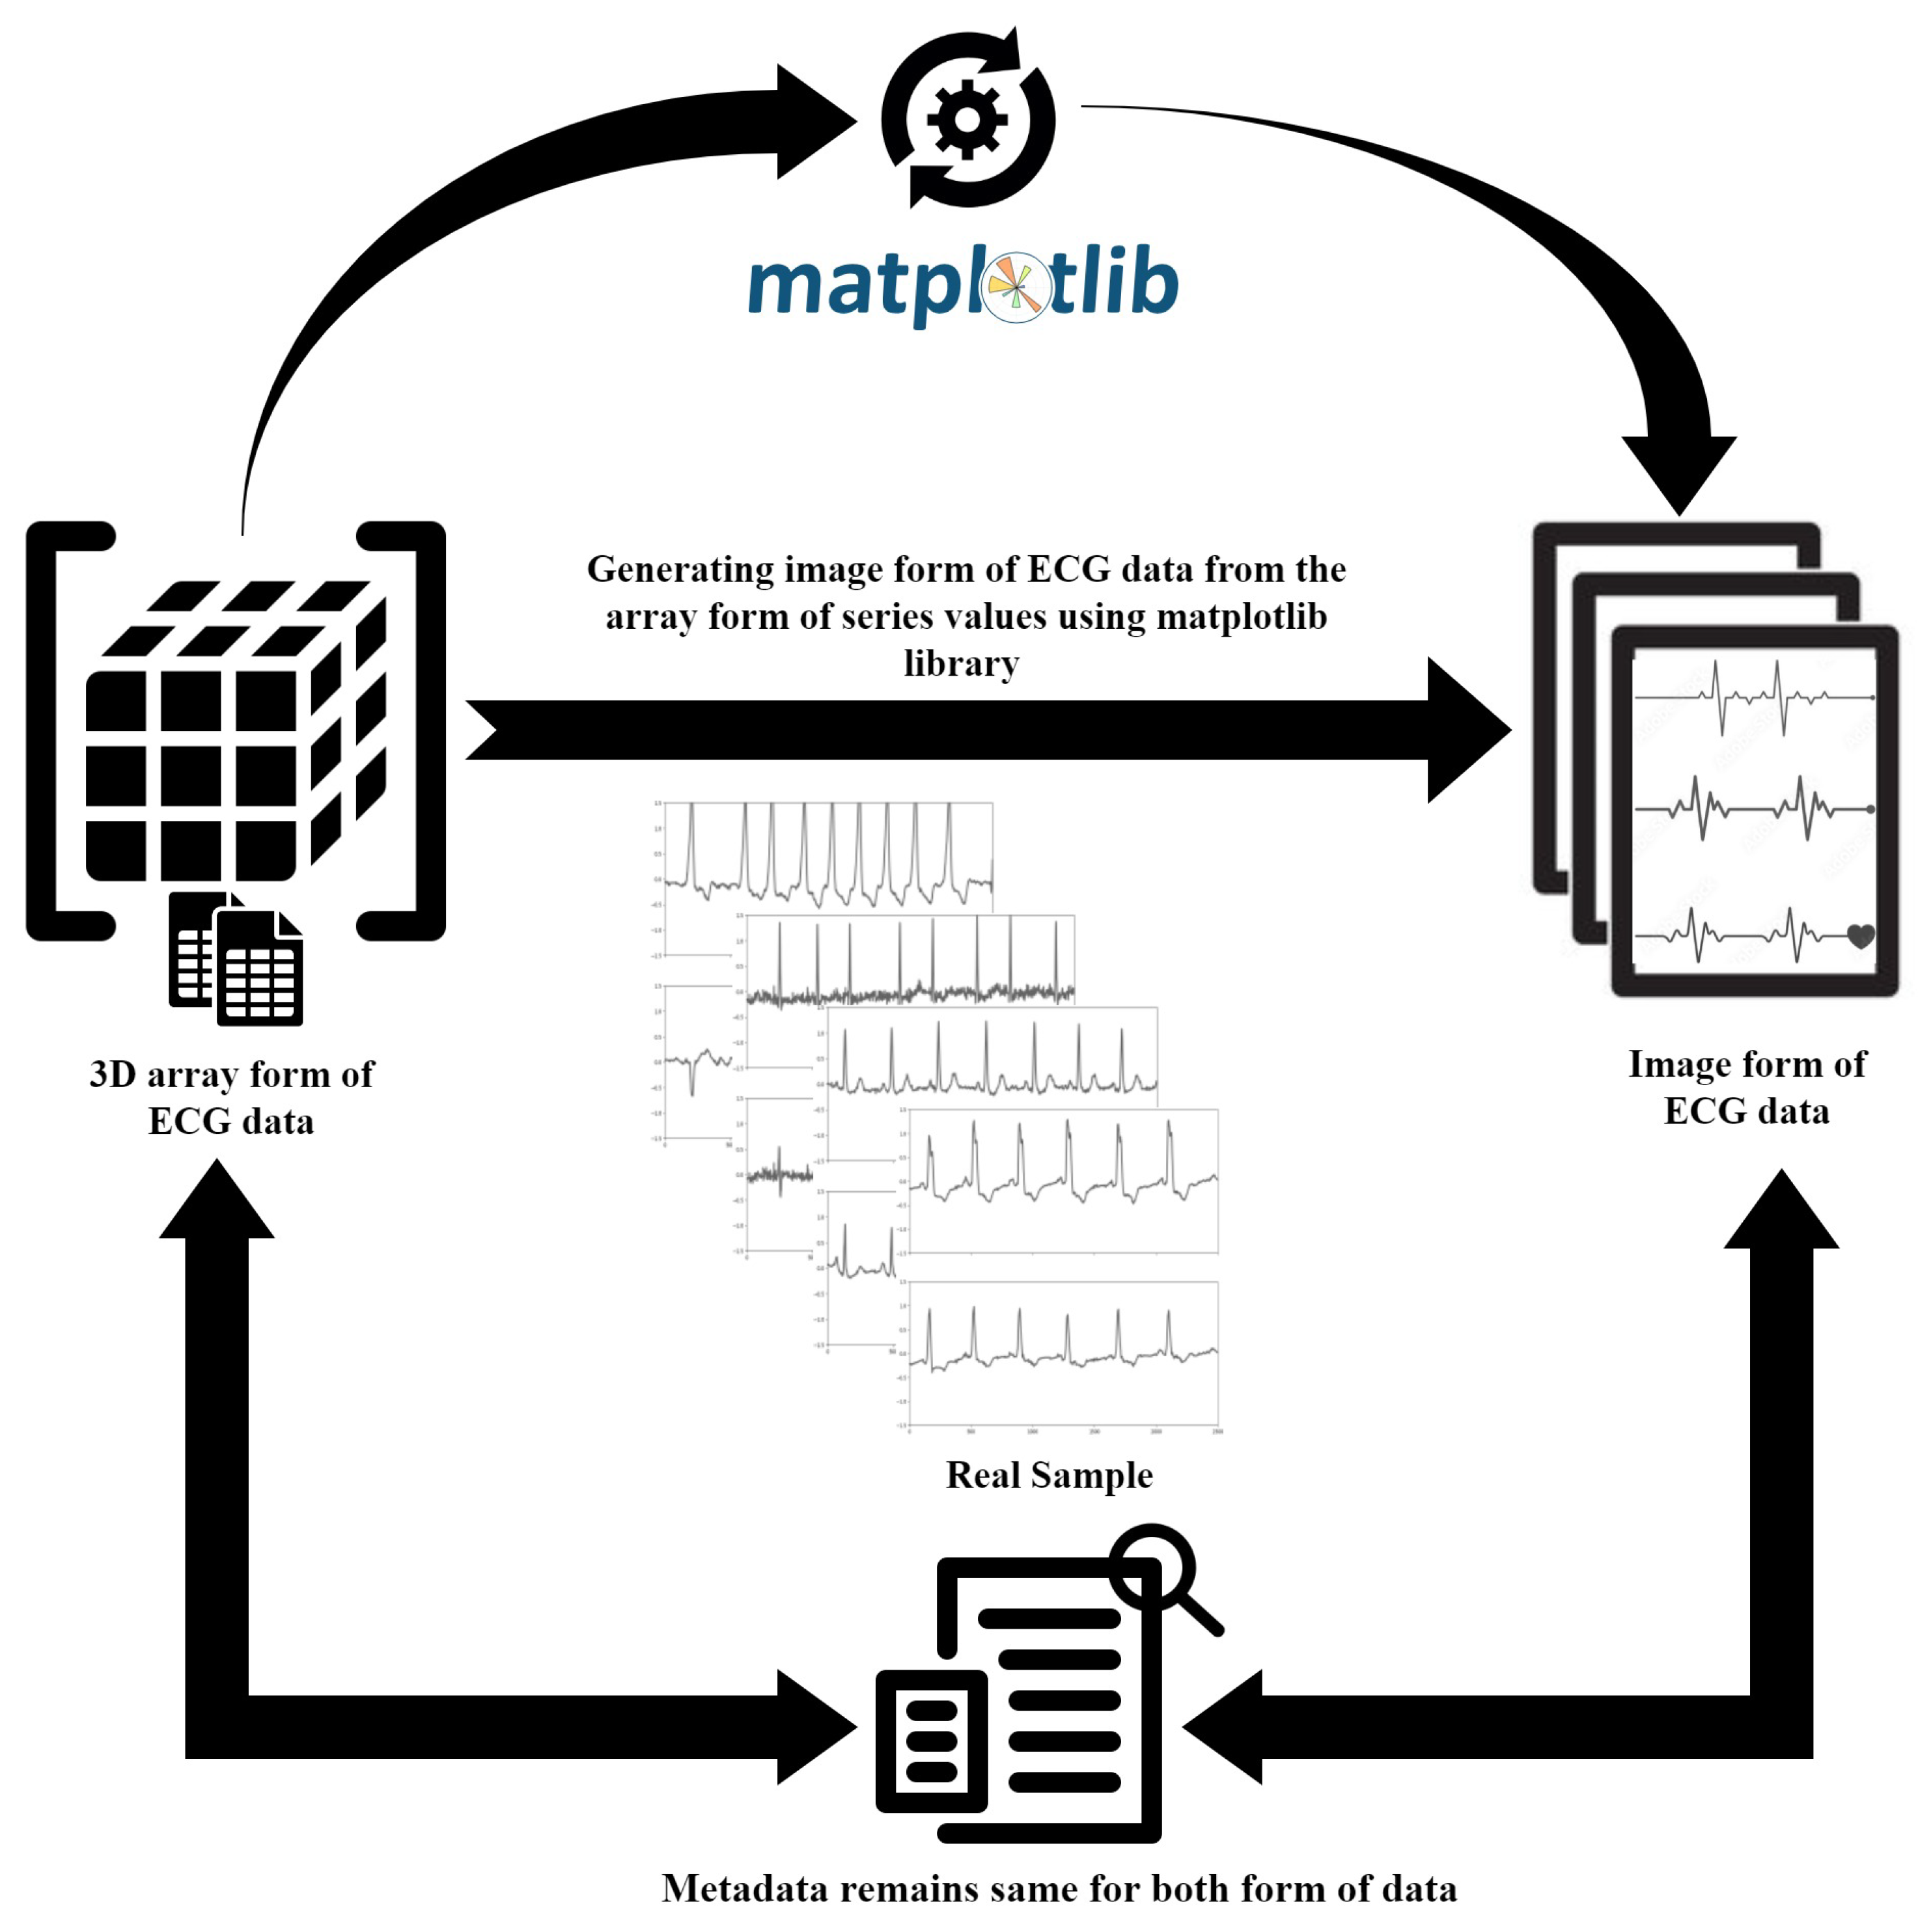
Figure 5 depicts the process of generating ECG images from the raw ECG signals or 3D array data. For visualization, we converted the array data into image representations of the ECG data using the Matplotlib library, resulting in 3587 ECG graph images corresponding to the 3587 array instances. This dual-format data approach facilitates a new multimodal analysis method, enhancing our model’s ability to identify atrial fibrillation accurately.
Figure 5.
Generating image data from 3D array data.
The AF identification task is a binary classification task since two diagnostic classes comprise the employed dataset. The number of instances in both classes was approximately similar, with the dataset containing 2000 normal sinus rhythm samples and 1587 atrial fibrillation samples. The data distribution can be satisfactorily balanced for the analysis because the ratio between these classes is not less than half.
3.5. Preprocessing Data
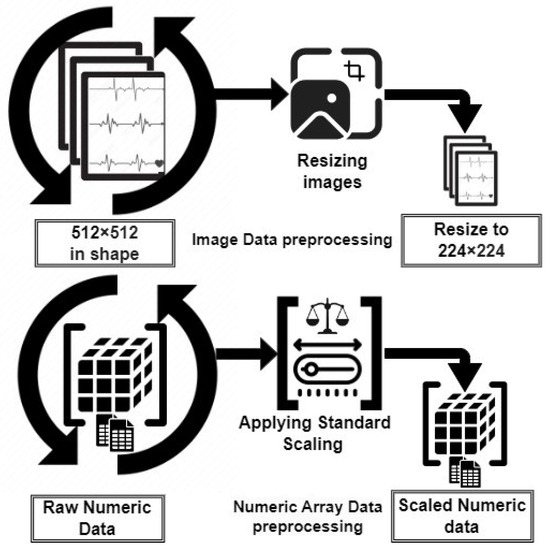
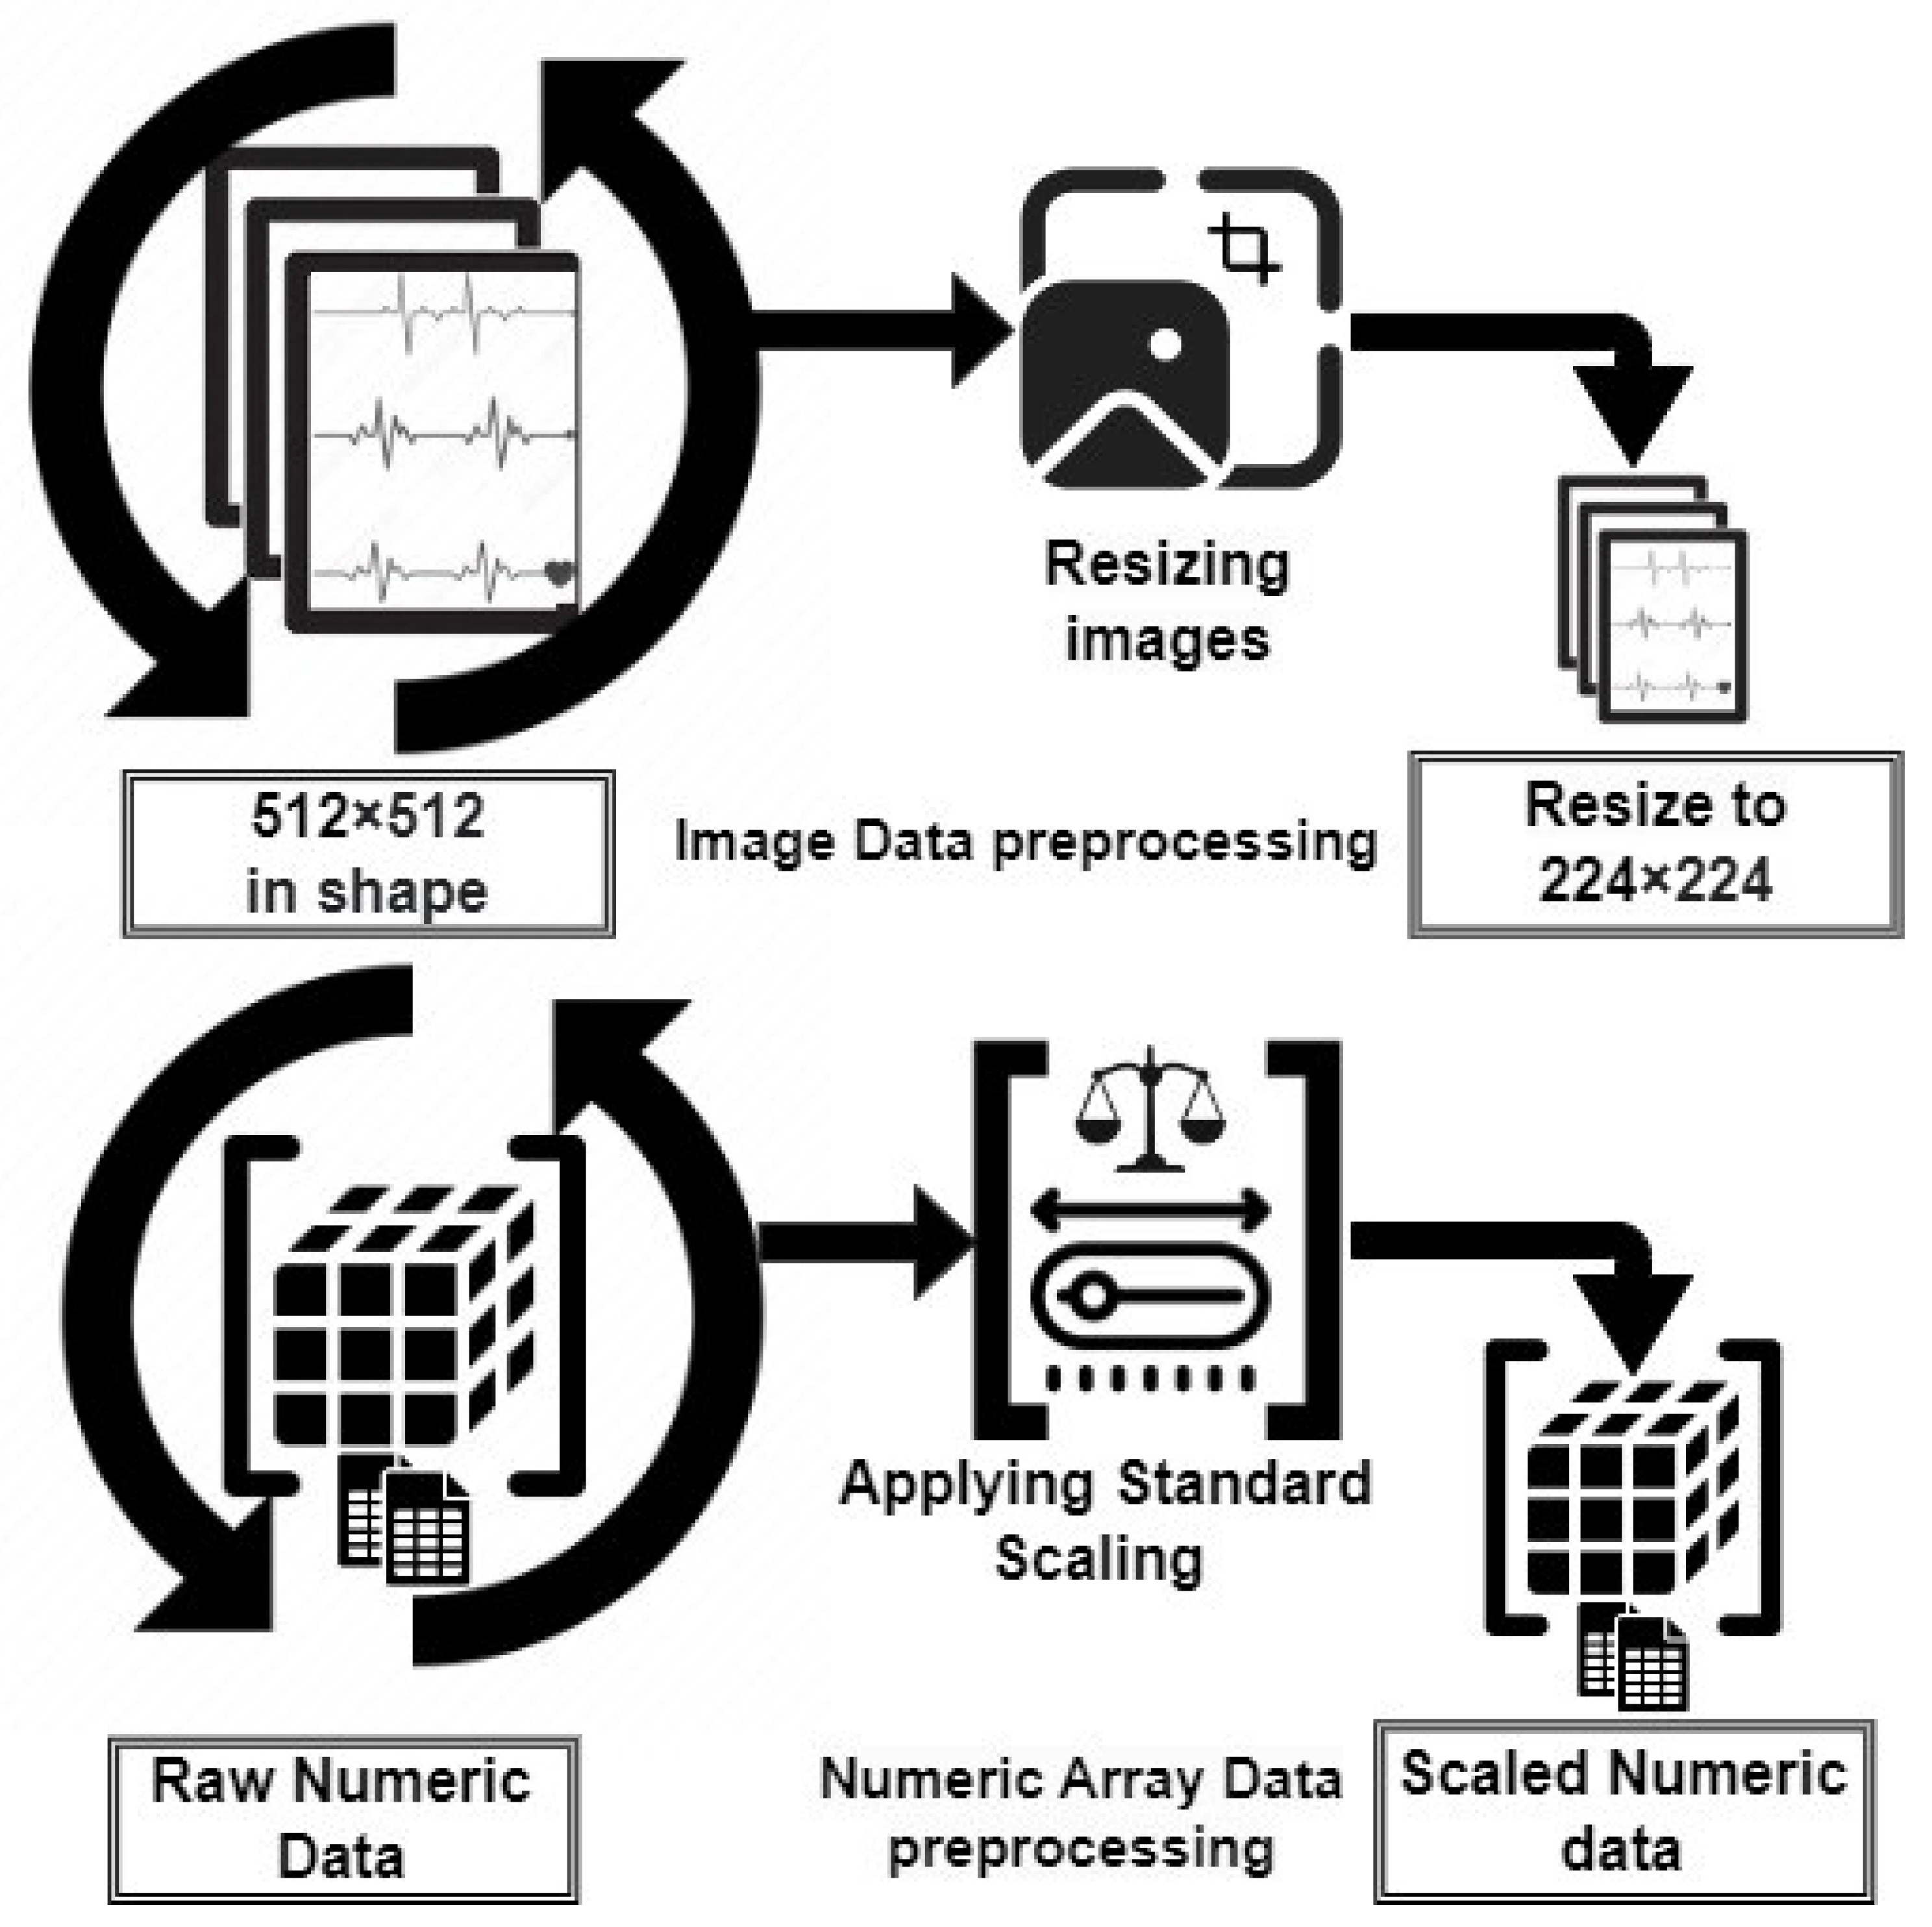
As illustrated in Figure 6, we preprocessed and prepared the data for model training. Specifically, we resized the image data from 512 × 512 to 224 × 224 pixels to ensure compatibility with the models. The 224 × 224 size is a standard resolution that balances time efficiency and cost-effectiveness, reducing the computational load and training time while maintaining data quality.
Figure 6.
Preprocessing of the employed ECG dataset.
For the 3D array form of numeric series data, we applied standard scaling, a widely used preprocessing technique, to improve model performance. This method standardized the data to have a mean of zero and a standard deviation of one, which is crucial for enhancing the performance and convergence of machine learning models. Scaling the data ensured that all features had an equal impact on the model training process, improving the model’s ability to learn and generalize from the data.
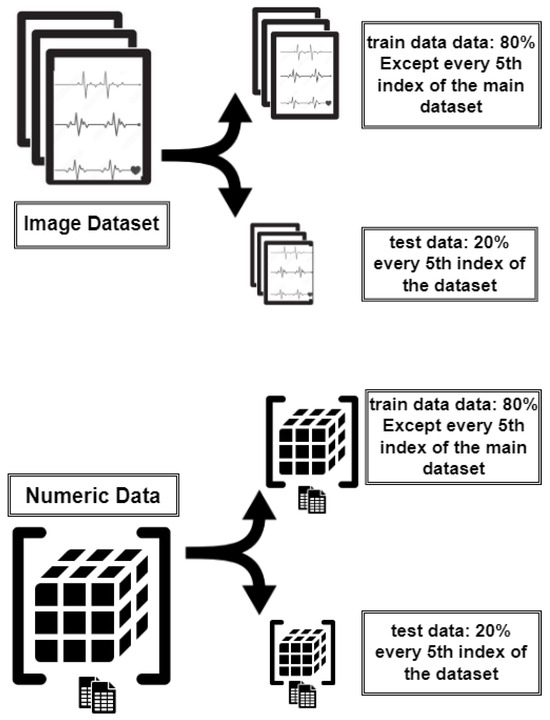
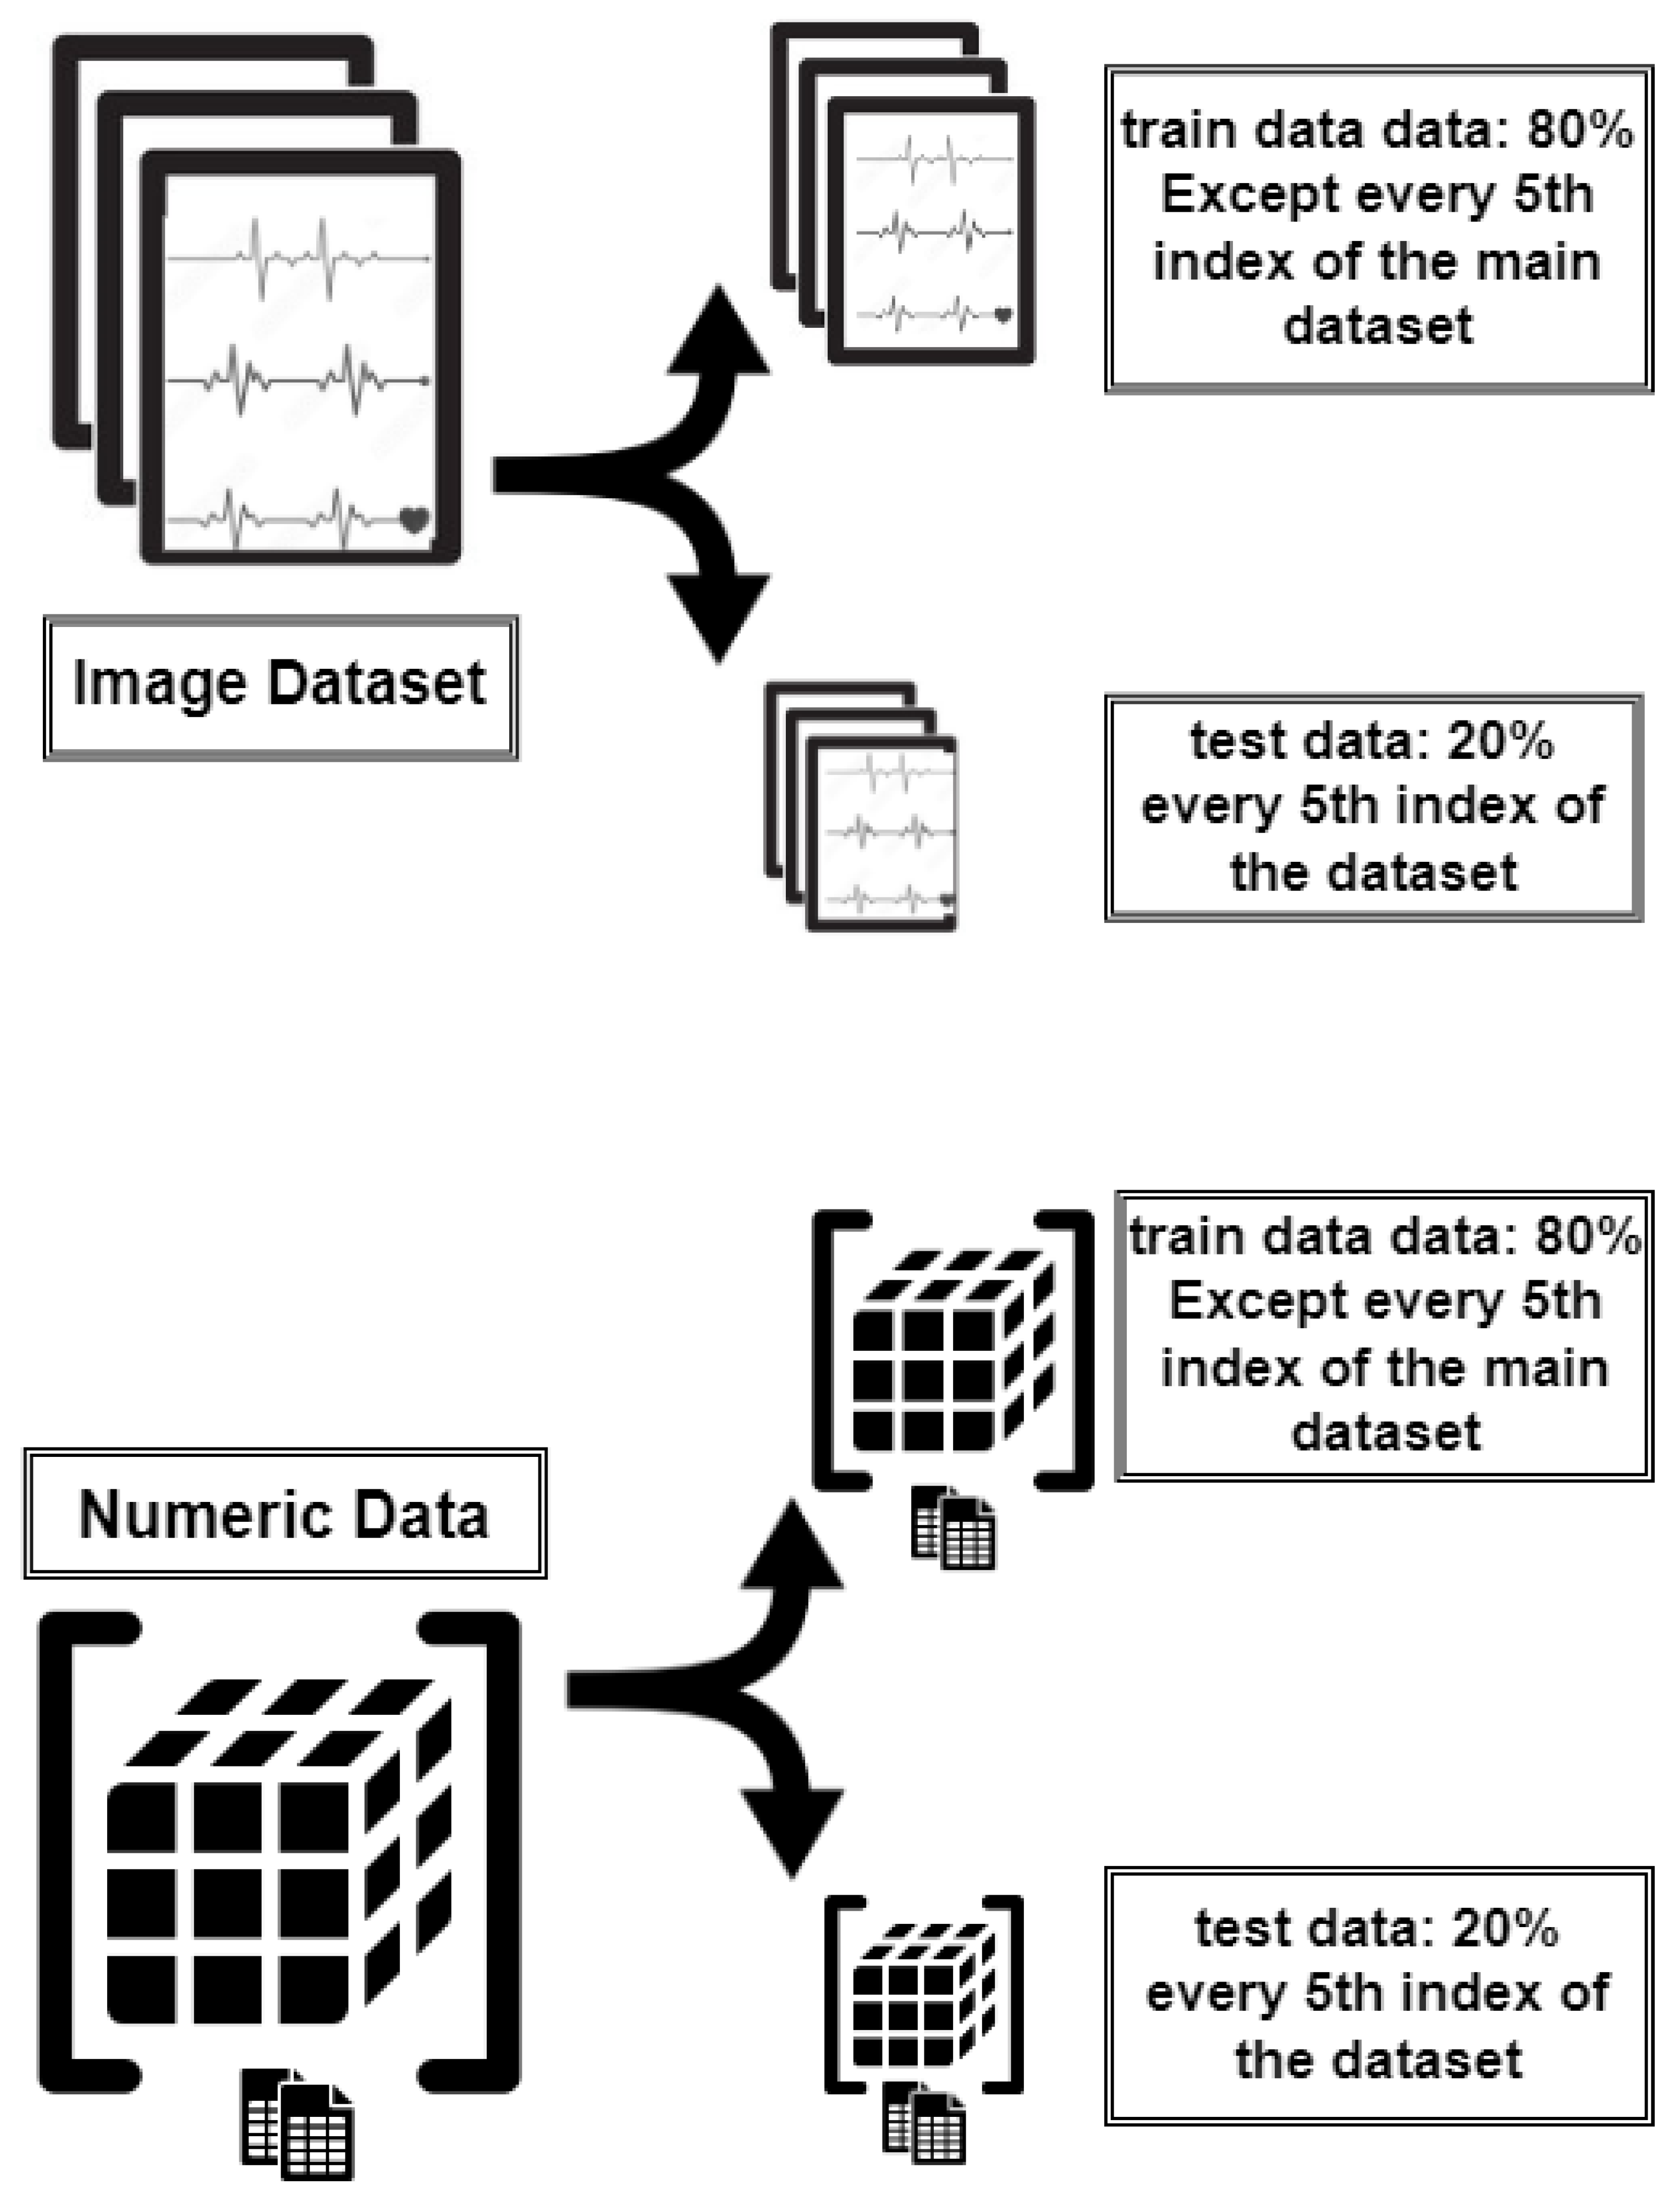
Figure 7 illustrates the technique we employed to split numeric and image datasets into training and testing sets. Specifically, we placed every 5th index of the original dataset into the test set, with the remaining indexes allocated to the training set. This approach resulted in approximately 20% of the data being allocated to the test set and 80% to the training set. We applied this technique in both cases to ensure the indexes were aligned, maintaining consistency between the training and testing subsets. This alignment is crucial for pursuing a coherent multimodal approach in our analysis.
Figure 7.
Splitting numeric and image data into training and testing sets.
3.6. Applied Classification Models
The study aimed to evaluate deep learning models using image and numerical data on a training dataset. Image data analysis focused on comparing convolutional neural networks (CNNs) and vision transformers, highlighting the trade-off in performance between ResNet32 and vision transformer (ViT) for image classification, with VGG16 demonstrating an edge in terms of higher accuracy. However, it also exhibited greater computational efficiency. Human labeling was necessary for the numerical data arrays to facilitate tasks involving Long Short-Term Memory (LSTM), CNN-LSTM, and the concurrent usage of LSTM with conventional convolutional architectures, either in monodirectional or bidirectional temporal observation, specifically CNN-Bi-LSTMs, to evaluate numeric data. The results indicated maximum success using both approaches, mainly due to the nature of BiLSTM. These findings demonstrate that CNNs and transformers can be effectively used for image data analysis and sequential numeric data processing when combined with a CNN and LSTM model. An in-depth analysis identified the most appropriate models for specific datasets, resulting in reliable and effective classification solutions.
3.7. VGG16
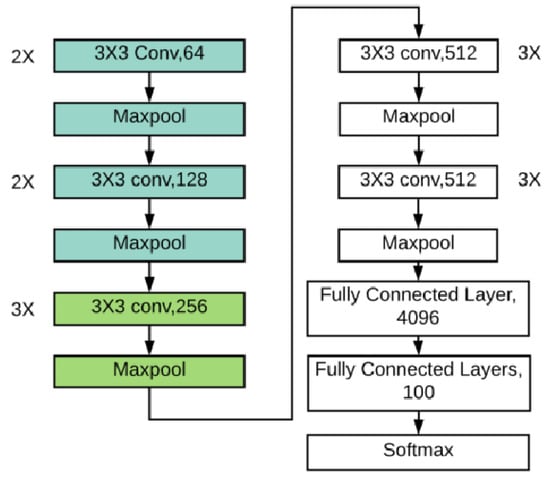
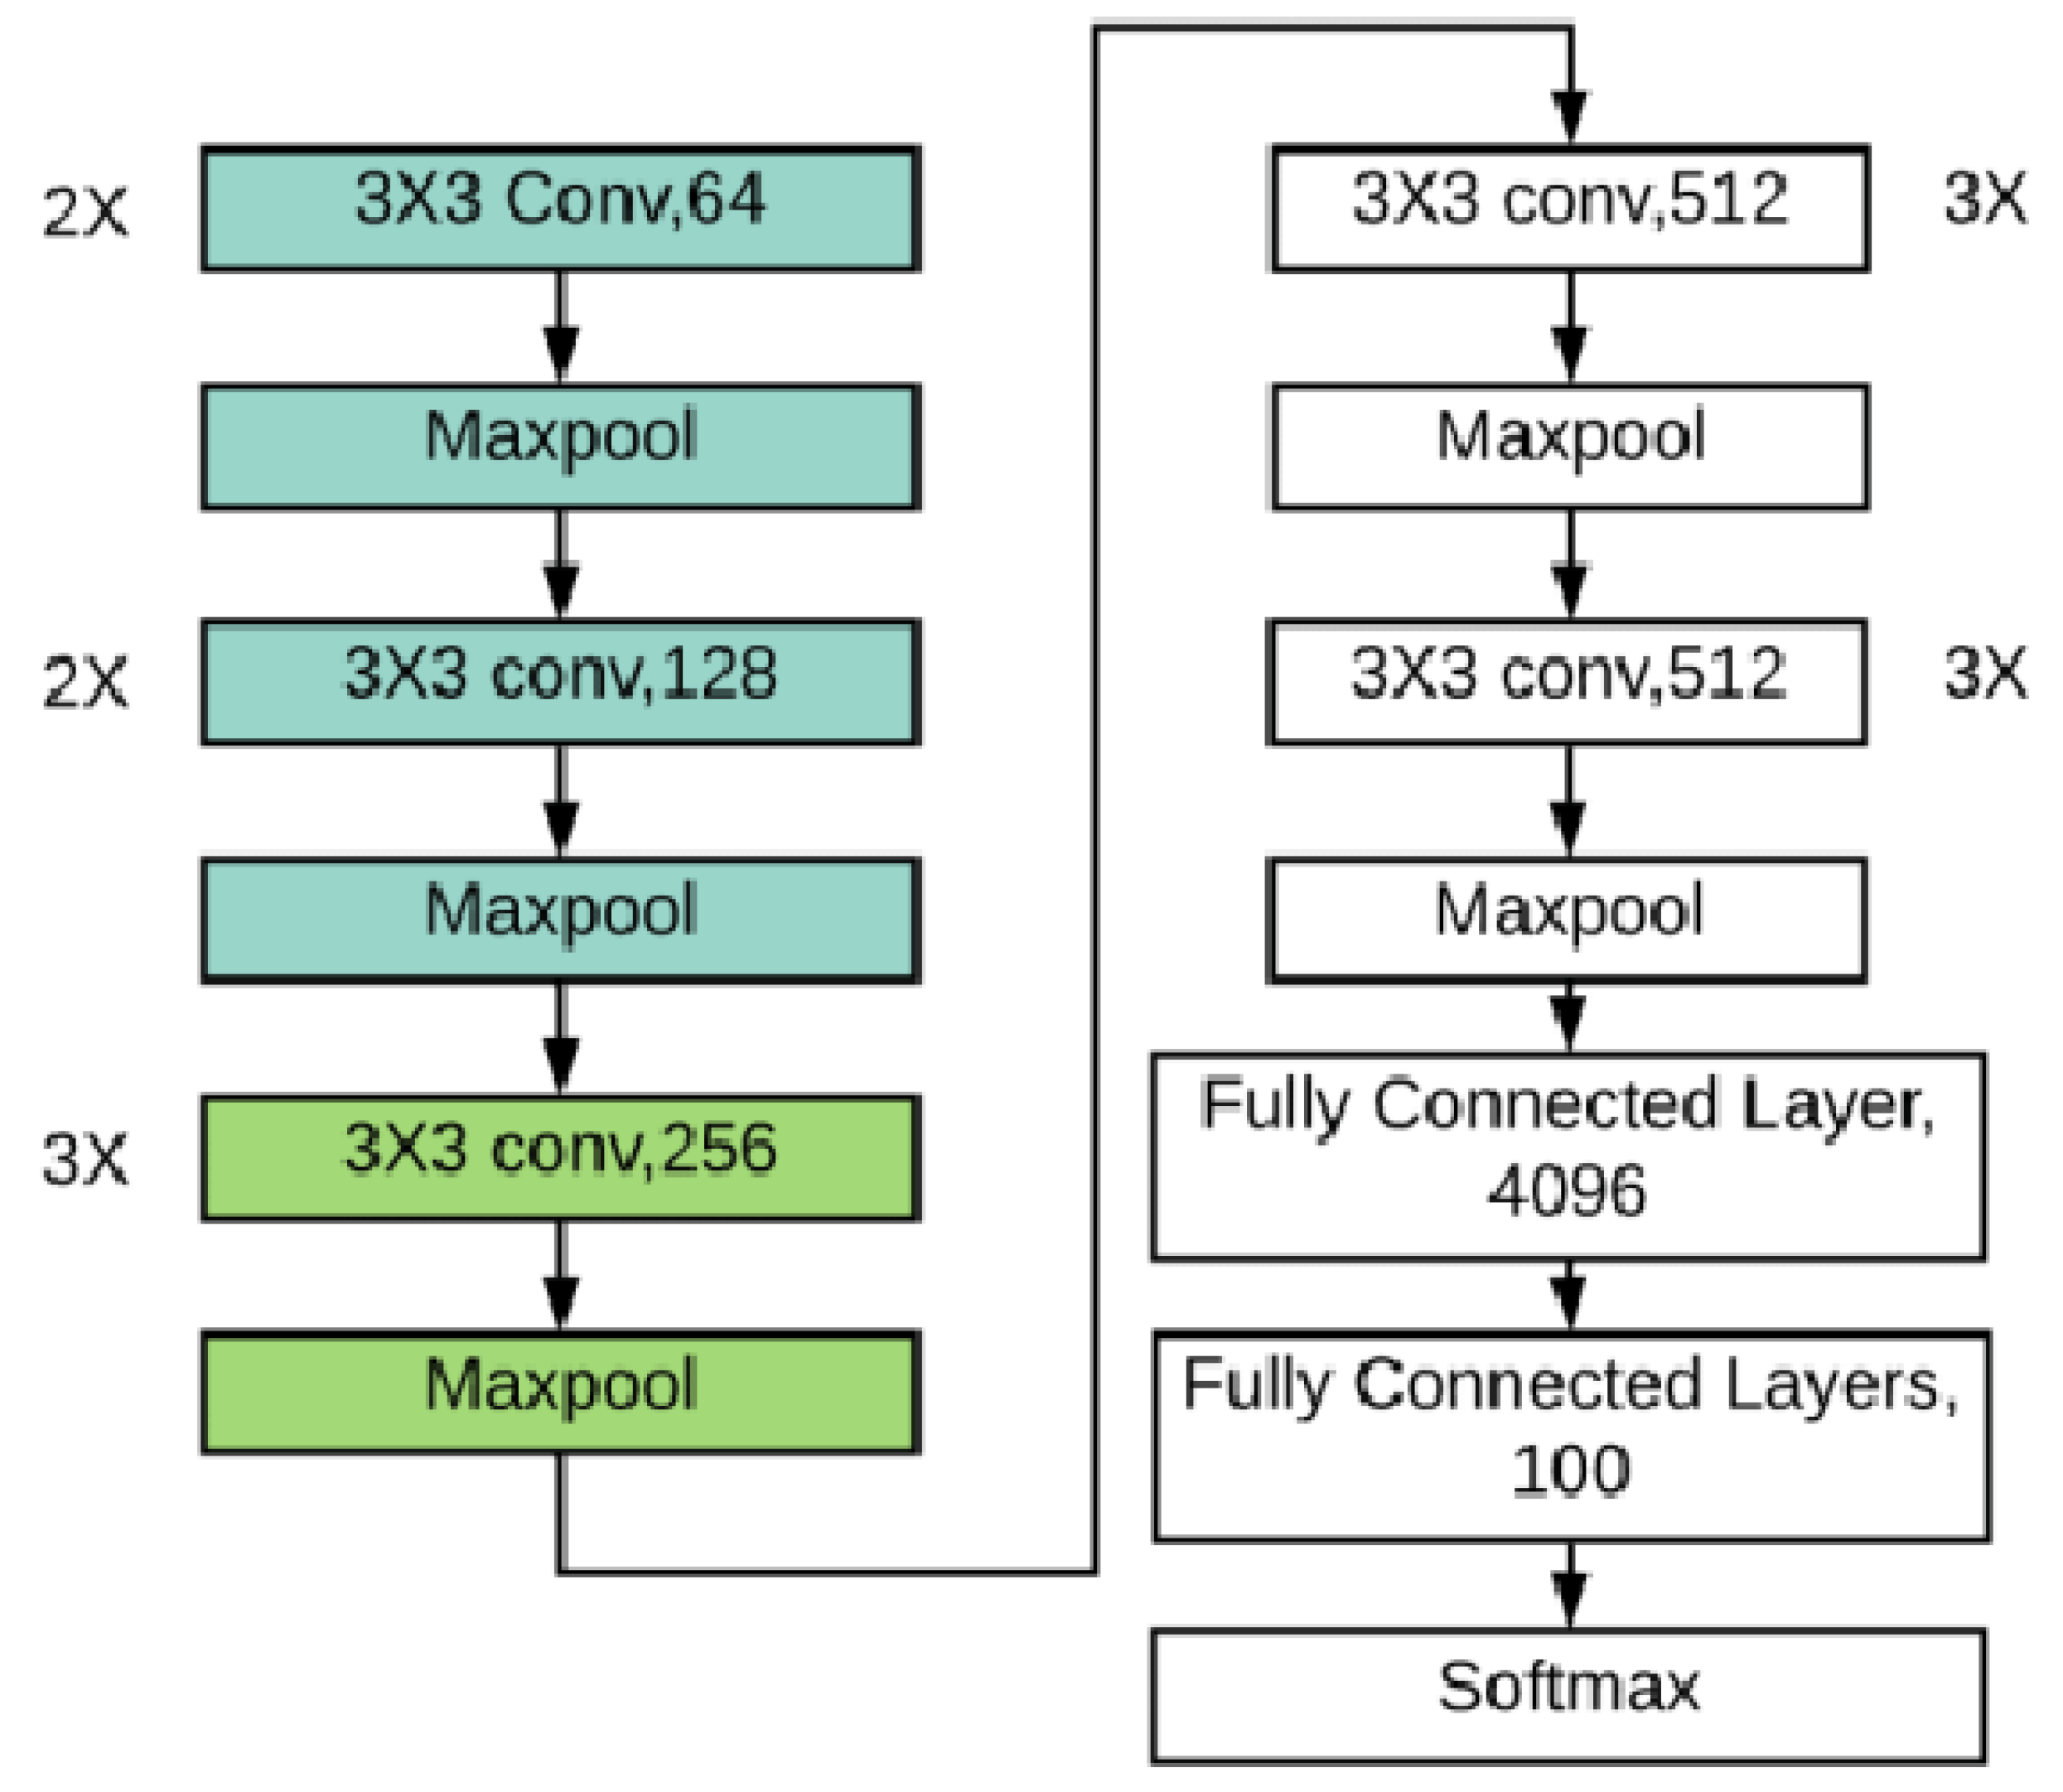
VGG16 is a CNN created by the Visual Geometry Group, and it is mainly used for image classification [22]. It contains 16 weight layers, of which 13 are convolutional, and 3 are fully connected layers.
The architecture of VGG16, as shown in Figure 8, consists of 13 convolutional layers, where each layer has 3 × 3 kernel size with a stride of 1 and padding of 1 to maintain the spatial dimension. All the convolutional layers are followed by a Rectified Linear Unit (ReLU) to introduce linearity. On the other hand, the model contains the activation functions in its structure to introduce nonlinearity.
Figure 8.
VGG16 model architecture.
Moreover, the model has five max-pooling layers, which down-sample the feature maps by applying a 2 × 2 window with a stride of 2. Furthermore, the first two of the fully connected layers had 4096 neurons, and the last layer had 1000 neurons. These layers help to learn higher-level features in the data hierarchy.
The output layer uses the softmax activation function to obtain class probabilities. Thus, VGG16 is suitable for tasks that involve accurate classification in various image datasets.
3.8. CNN-BiLSTM Model
CNN-BiLSTM is a model that combines CNNs and BiLSTMs to learn features from sequential data and temporal dependencies [23]. It is most effective for tasks that require the identification of patterns and sequences within the data.
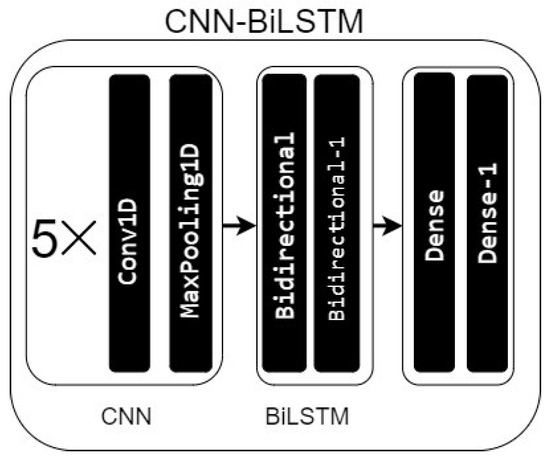
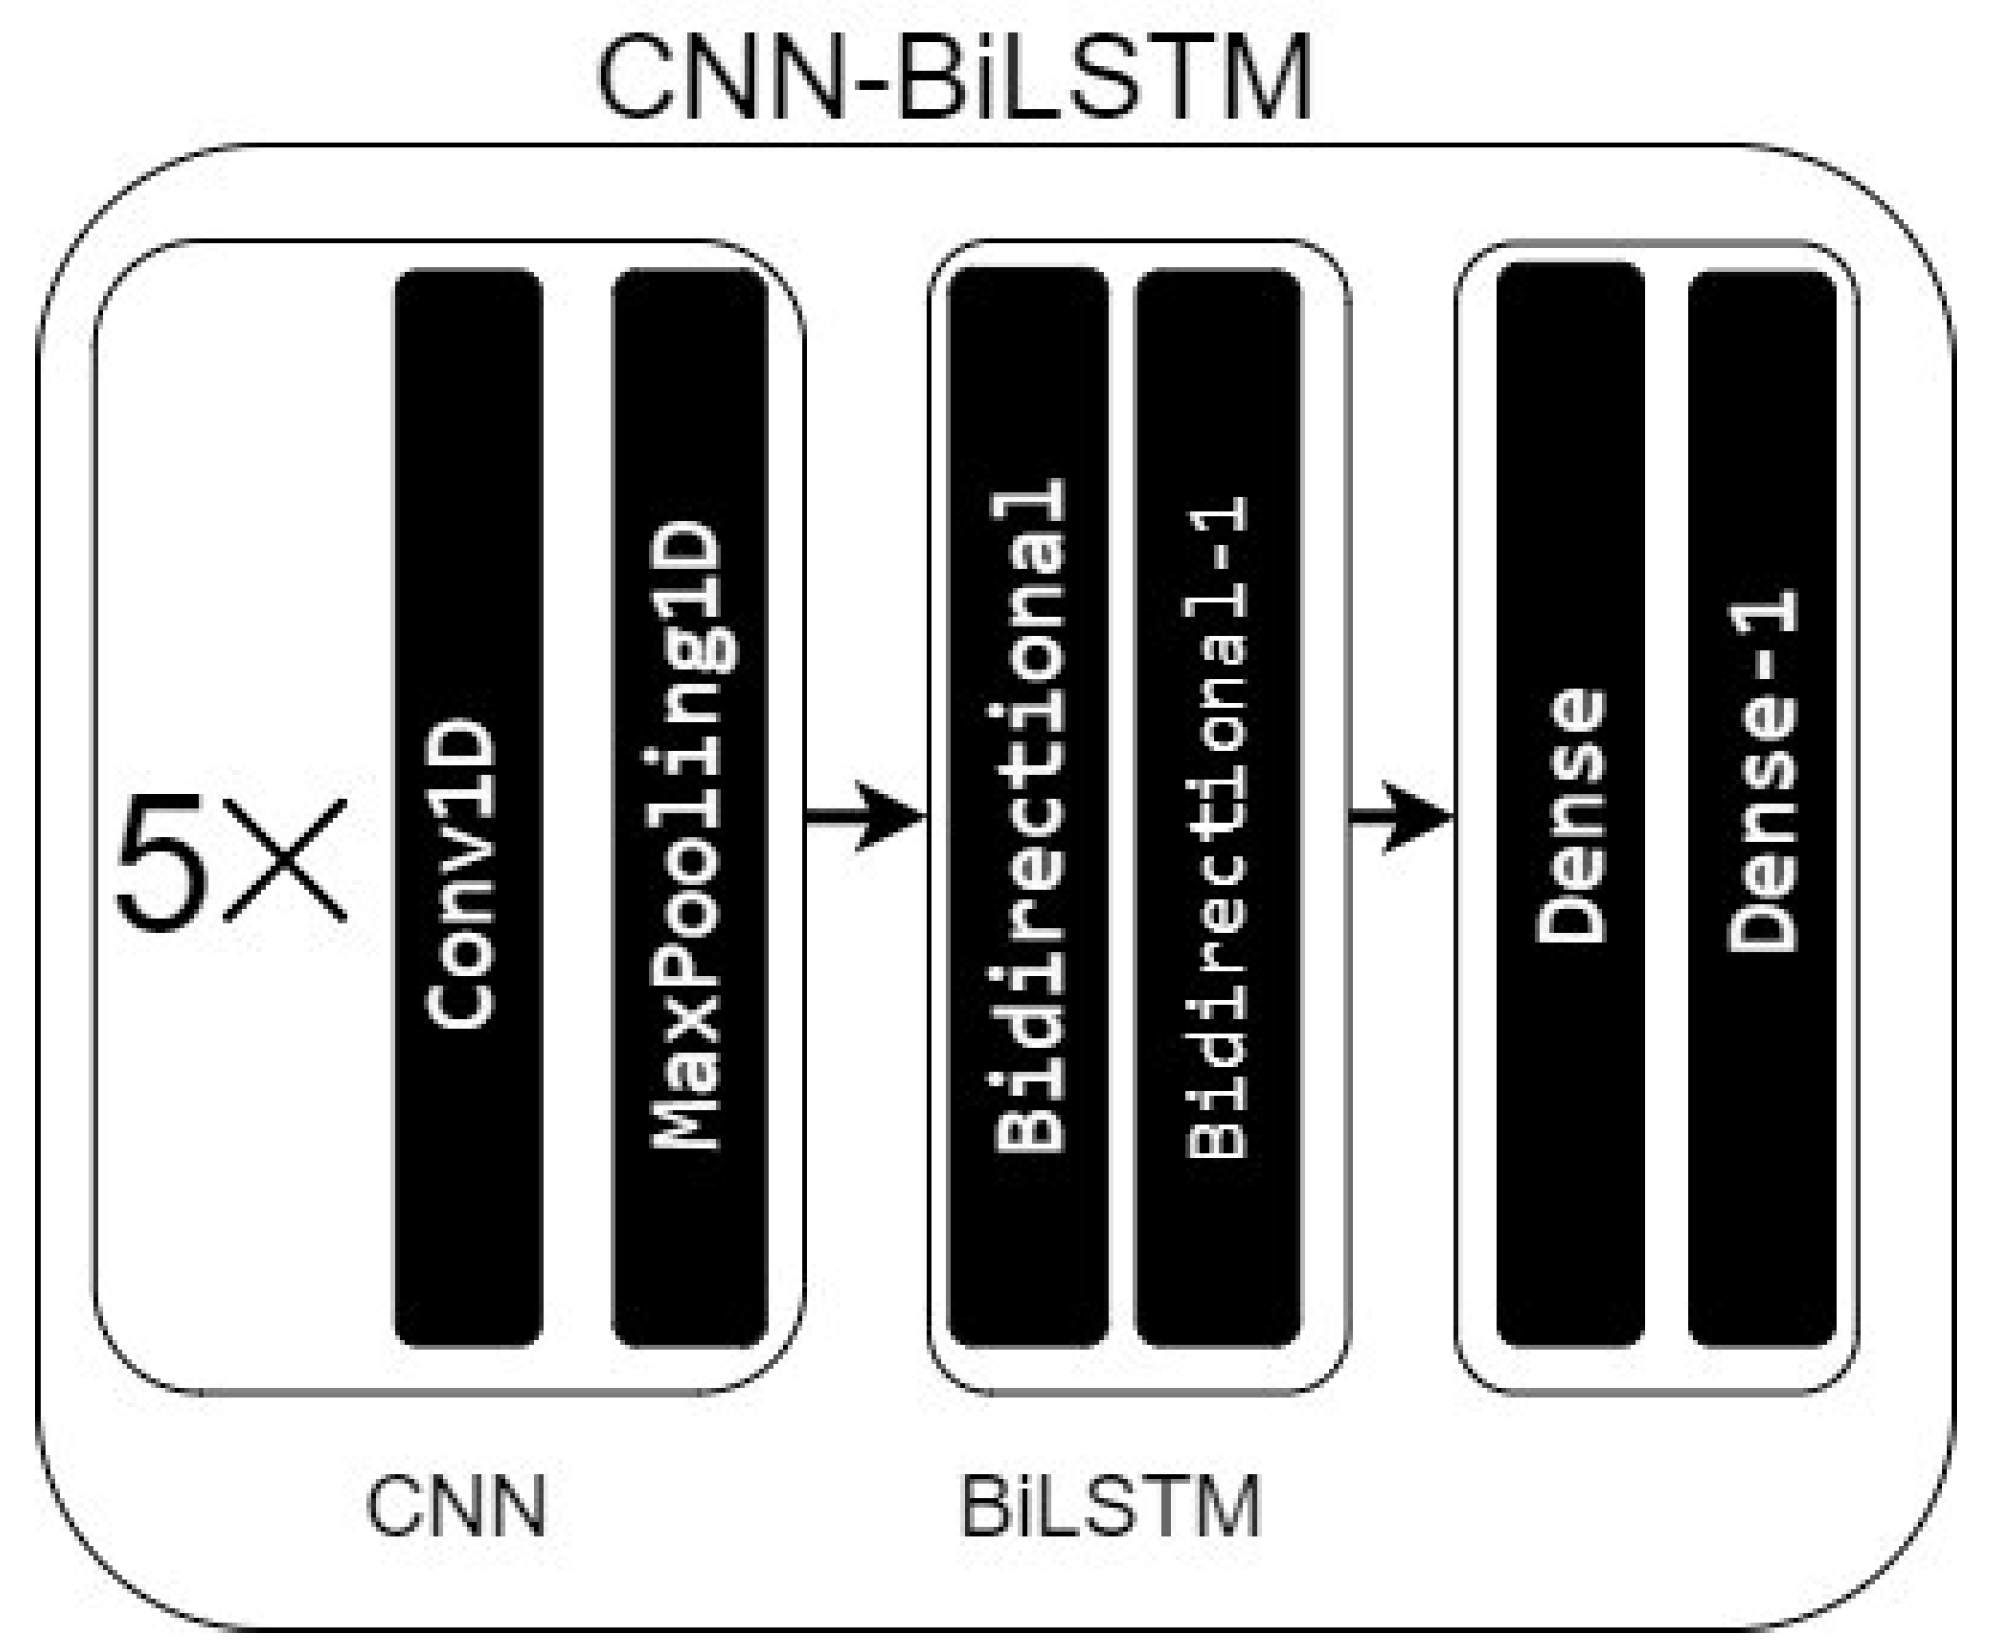
As shown in Figure 9, the CNN-BiLSTM framework consists of the following layers, depicted in black. The first layer is Conv1D-64 with ReLU activation, followed by a MaxPooling1D layer that downsamples the feature maps generated by the first convolutional layer. Next, the second convolutional layer, Conv1D-128, uses the ReLU activation function, followed by another MaxPooling1D layer. The model then incorporates two bidirectional LSTM layers, BiLSTM-64 and BiLSTM-32, essential for capturing temporal dependencies in both forward and backward directions. The final layer is dense with a softmax activation function, primarily used for classifying sequential data. This model is particularly well-suited for applications involving sequential data, as it combines CNNs for local feature extraction with LSTMs for handling sequential dependencies.
Figure 9.
Architecture of the CNN-BiLSTM model.
3.9. Multimodal Approach for Enhanced ECG Signal Classification
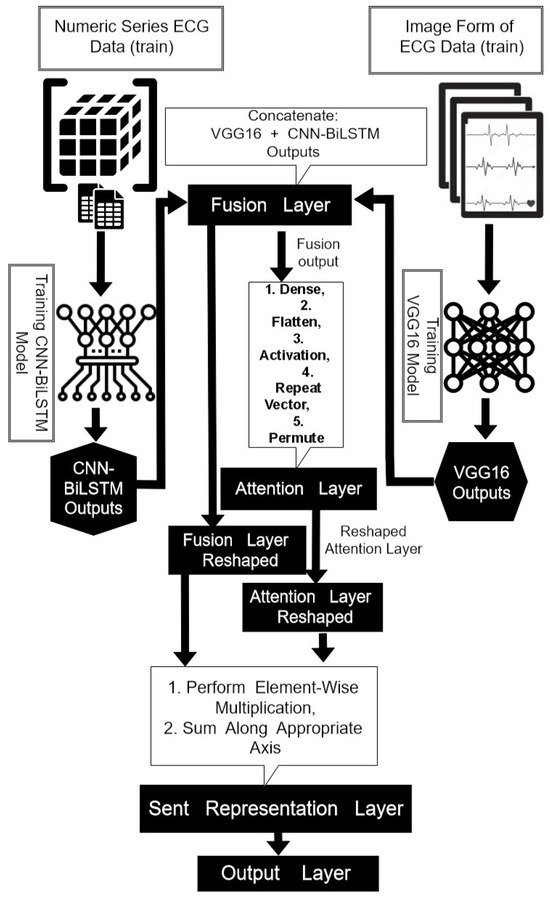
The primary objective of this research was to demonstrate the effectiveness of a multimodal approach that utilizes two different forms of the same data in this specific case. To this end, we employed two high-performance models: CNN-BiLSTM for the numerical ECG data and VGG16 for the ECG image data. Ultimately, these models were integrated into a single multimodal system. In summary, the CNN-BiLSTM model processes numerical ECG data, while the VGG16 model analyzes image-based representations, with a fusion layer combining their outputs for enhanced classification.
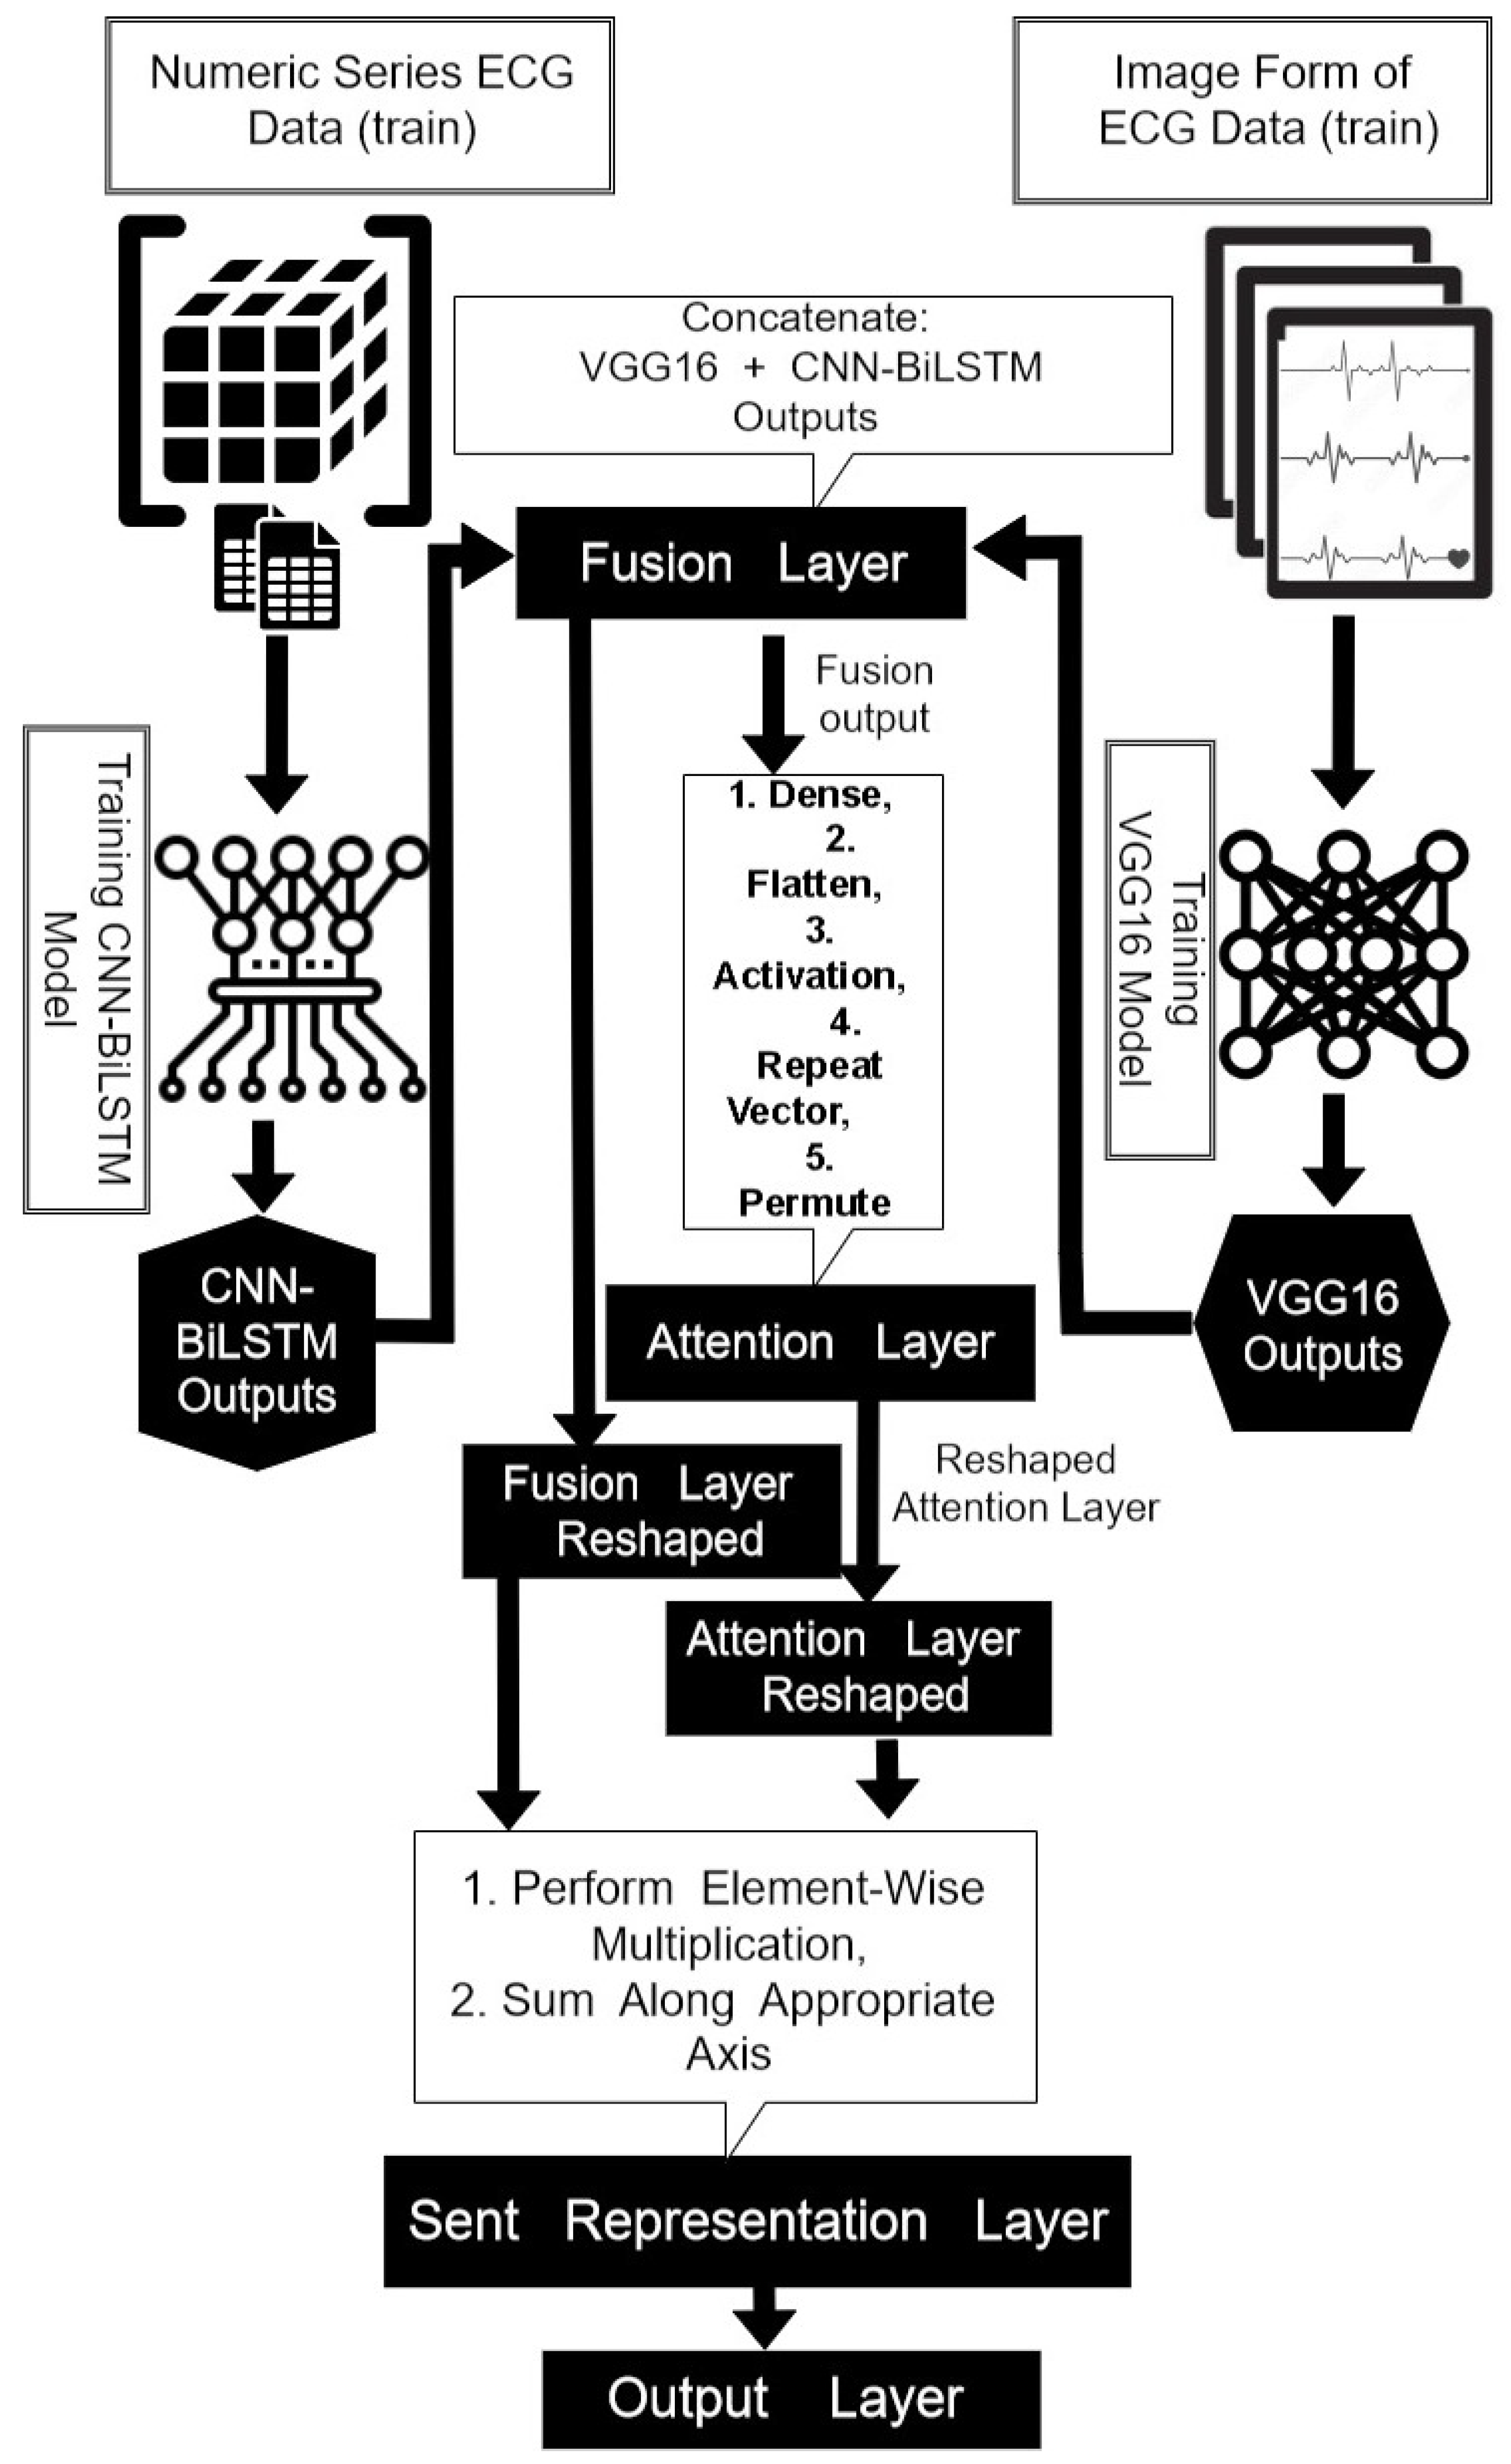
Figure 10 illustrates the multimodal approach, which aims to improve classification accuracy by leveraging both the image and numerical series data of ECG signals. This approach combines a CNN model based on VGG16 for image data with a CNN-BiLSTM model for numerical data. The integration of these networks allows the model to extract complementary information from both data types. The VGG16 model was pre-trained, with the final fully connected layers removed, enabling it to extract features from ECG images and encode spatial information.
where represents the input image data, and denotes the extracted features.
Figure 10.
Architecture of the proposed multimodal approach for AF detection.
On the other hand, the CNN-BiLSTM model was designed to handle numerical ECG data by capturing both local and long-term features. The CNN component of the model extracts local features in the ECG data using filters that identify essential features, e.g., peaks and valleys, which are crucial for analyzing cardiac signals. The BiLSTM component then captures the sequential nature of the data, as well as the long-term dependencies and temporal relationships that are essential for the classification and prediction of cardiac conditions. This dual approach ensures that the model captures fine details in the data while maintaining a global view of the temporal evolution of ECG signals.
where is the input numerical data and represents processed features.
The outputs of these models were combined to form a fused feature vector that integrates both visual and temporal information. This method provides a comprehensive representation of the data, merging the strengths of different models: CNNs capture visual–spatial characteristics, and LSTMs capture sequential temporal trends. The resulting feature vector offers a robust input for subsequent analysis, utilizing multidimensional data to enhance predictive accuracy.
where ⊕ denotes the concatenation operation.
Subsequently, the model computes a weighted sum of attention vectors on the concatenated feature representation. It assigns larger weights to more significant features, enhancing predictive accuracy by focusing on crucial aspects. The relevance scores of each feature, indicating its importance to the task, are computed using a dense layer. These scores are then used to normalize the attention weights, ensuring that the sum of all weights is one, highlighting the features that contribute the most to the prediction while minimizing the impact of less relevant information as follows:
where and are the weights and biases of the dense layer, and tanh is the hyperbolic tangent activation function. represents the attention weight for the i-th feature.
The attention weights are then used to scale the fused features, creating a weighted feature representation that emphasizes the essential features.
This weighted representation r is the sum of the original characteristics, each multiplied by its weight. In addition, this weighted sum ensures that more important features are given more weight while less important features are given less weight. Subsequently, we reshape the attention and fusion layers to prepare for element-wise multiplication in the subsequent silent representation layer. Reshaping the data helps prepare them for further enhancement of feature interactions and integration in the next step. Finally, the classification layer uses a sigmoid activation function suitable for binary classification problems in the weighted feature representation. Eventually, this activation function maps the sum of the features to a probability score, aiding in identifying the class label and thus solving the binary classification problem.
The output is the probability value between 0 and 1. Consequently, by combining features from image and numerical data, selecting the most relevant features, and adding the final classification layer, the multimodal model improves the precision of atrial fibrillation classification. This approach emphasizes the model’s capacity to utilize additional data types, improving predictive accuracy and providing a comprehensive solution for AF identification and analysis of atrial fibrillation.
3.10. Knowledge Distillation
Knowledge distillation is a technique in which a smaller student model is trained to mimic the behavior of a larger teacher model [24]. This method enables the compression of model knowledge, allowing for the deployment of more efficient models without a significant loss in performance.
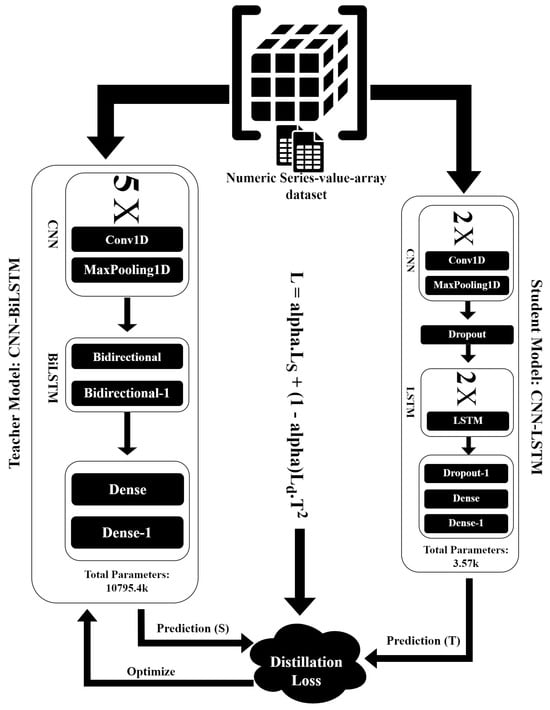
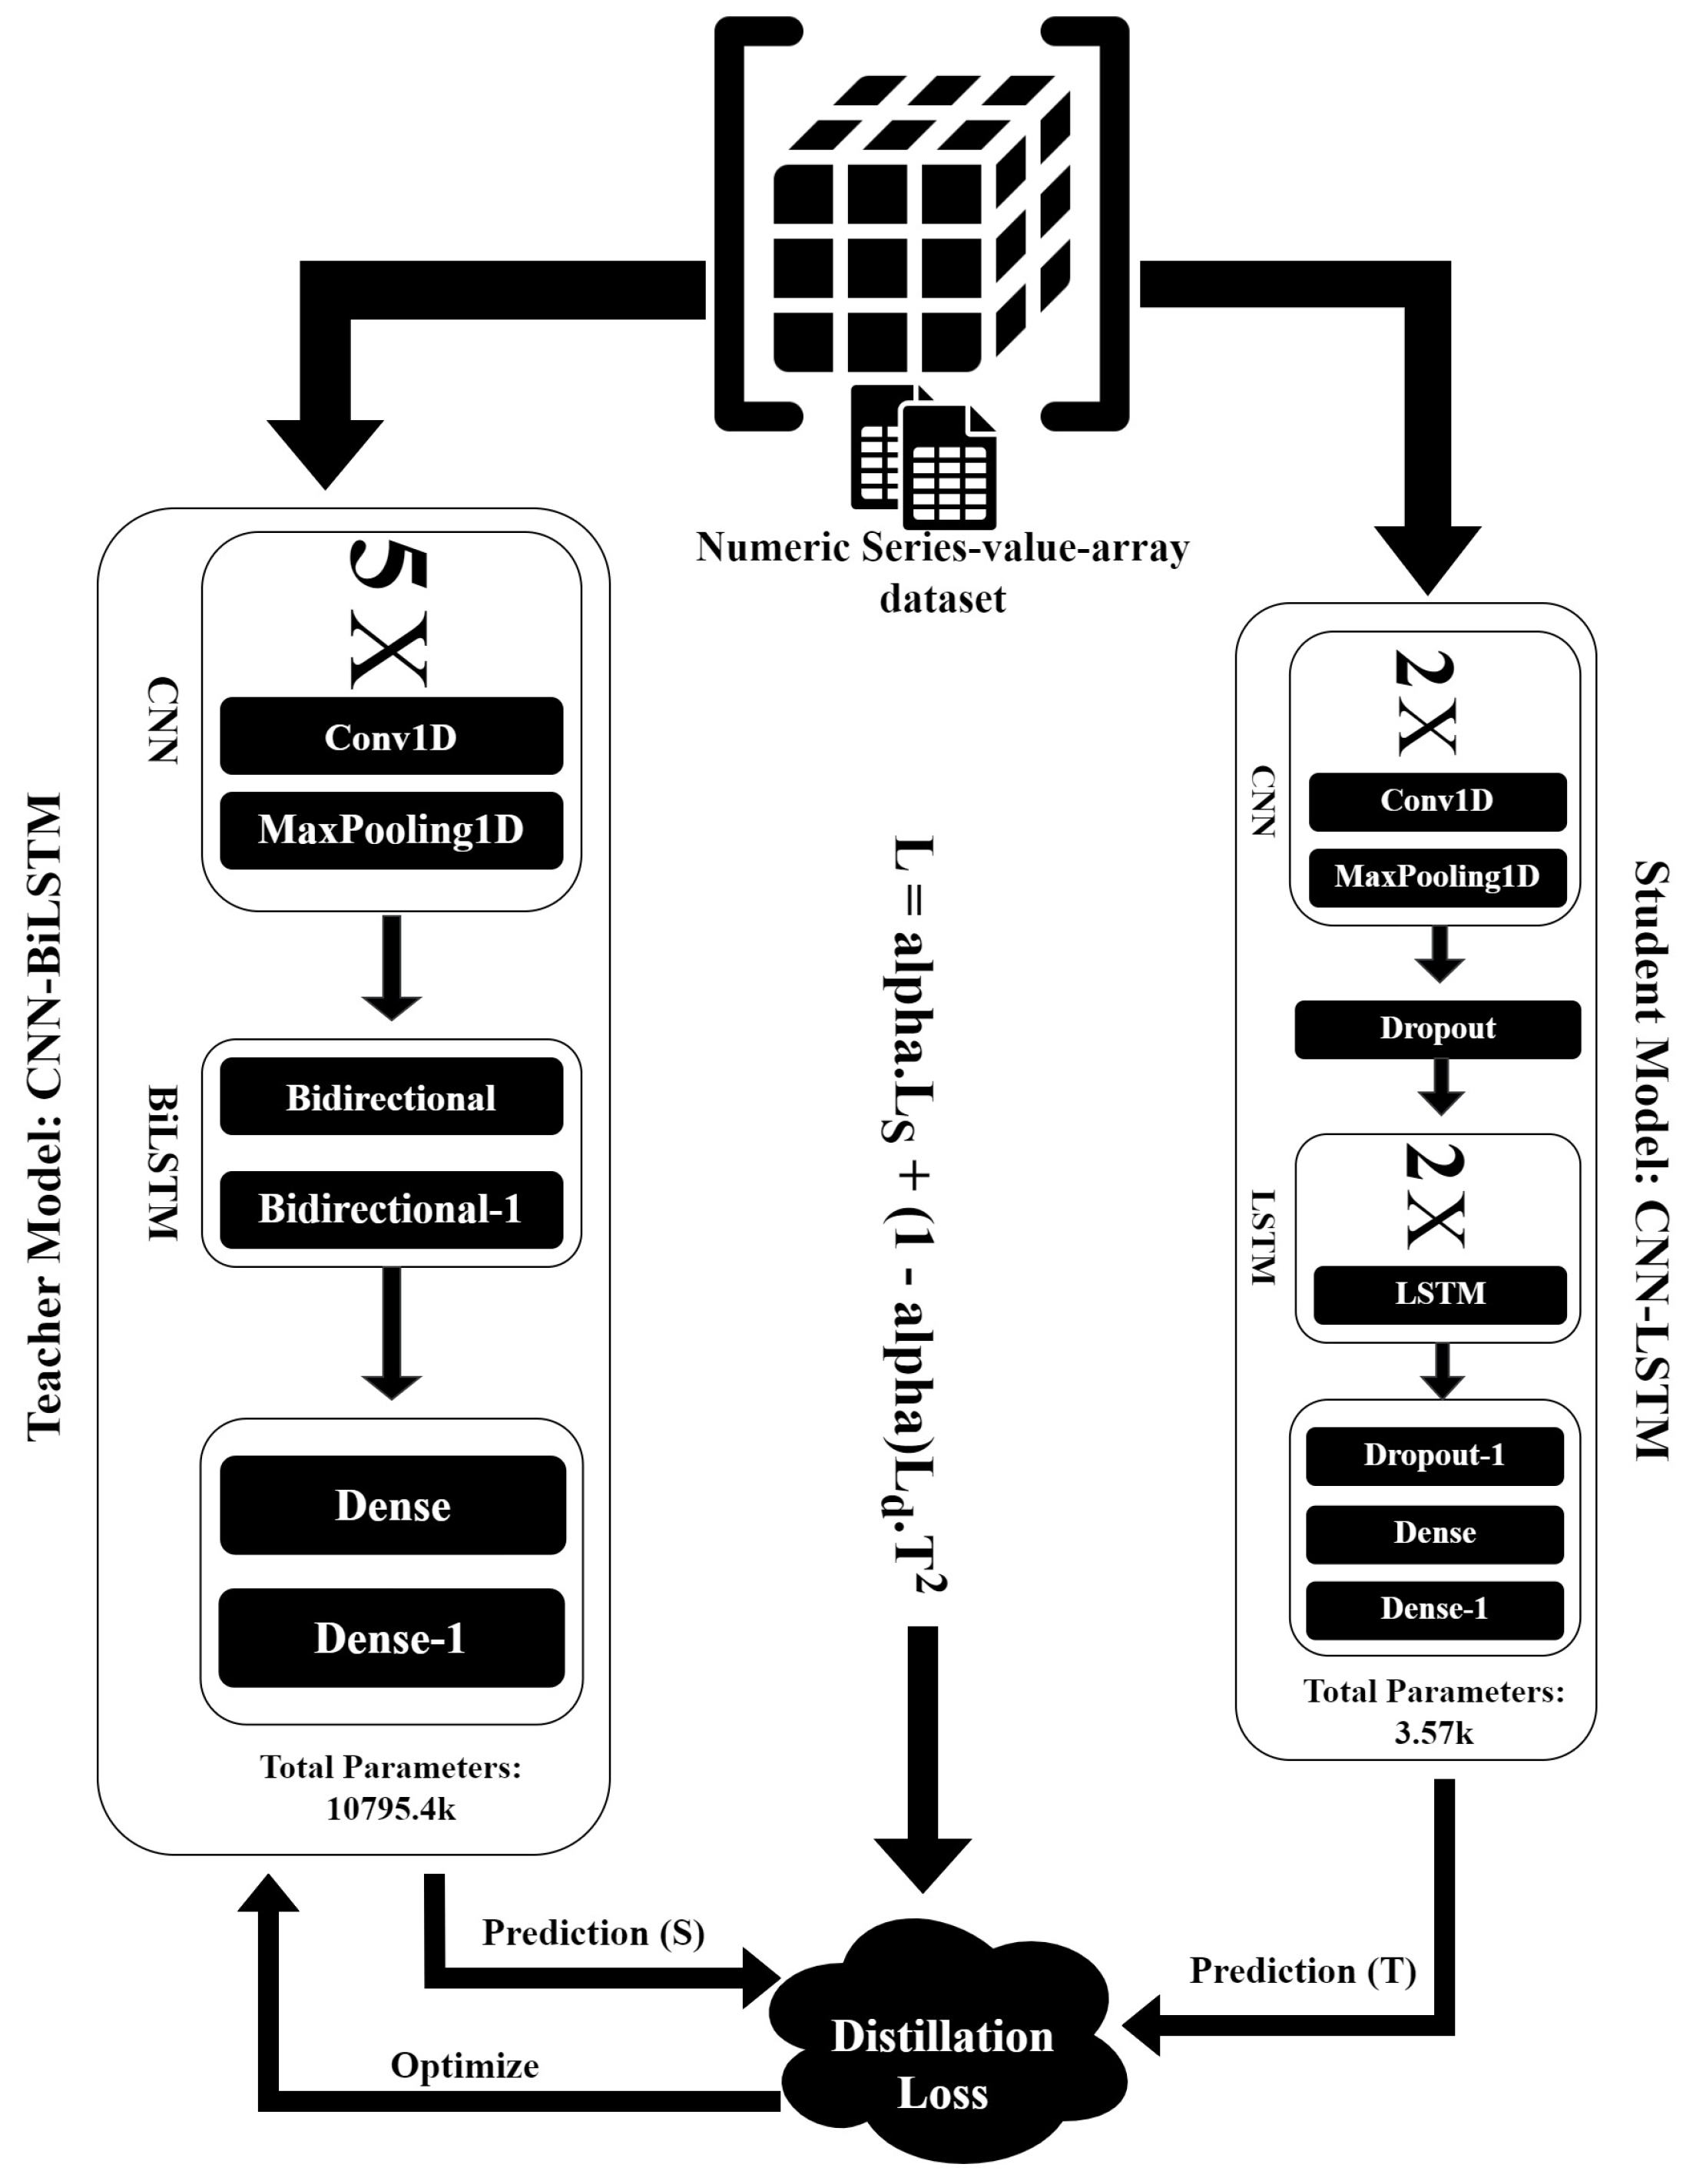
Figure 11 illustrates the knowledge distillation process used in this study. In this process, a compact CNN-LSTM model serves as the student model, while a larger CNN-BiLSTM model functions as the teacher model. The teacher model, with approximately 10,795.4 k parameters, is substantially larger than the student model, which has only 3.57 k parameters. Distillation training involves a combination of standard student loss and distillation loss, regulated by parameters and T.
Figure 11.
Architecture of the proposed knowledge distillation technique.
The output logits of the teacher model are denoted as , and for the student model, they are denoted as given an input x. To soften the logits, the softmax function is applied at temperature T:
where represents the predictions of the teacher and represents the predictions of the student. The loss of cross-entropy between the true labels y and the predictions of the student model is given by:
The total loss L combines the student loss and the distillation loss, scaled by and :
Here, denotes the distillation loss.
Thus, the student model integrates both student loss and distillation loss, allowing it to mimic the teacher’s predictions effectively while being smaller and more efficient, thus improving its overall performance.
4. Results and Discussion
4.1. ECG Data Acquisition and Analysis
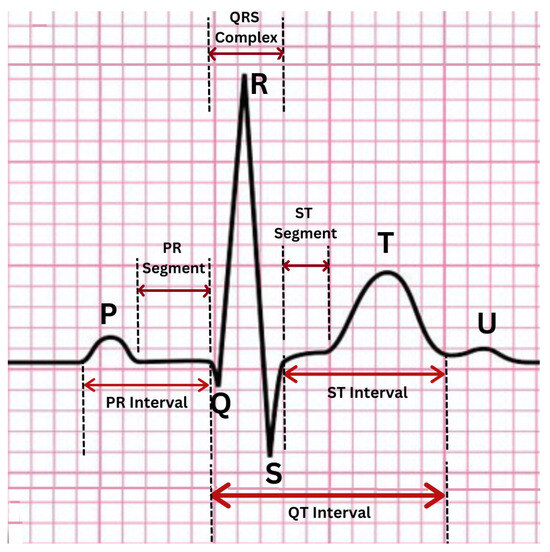
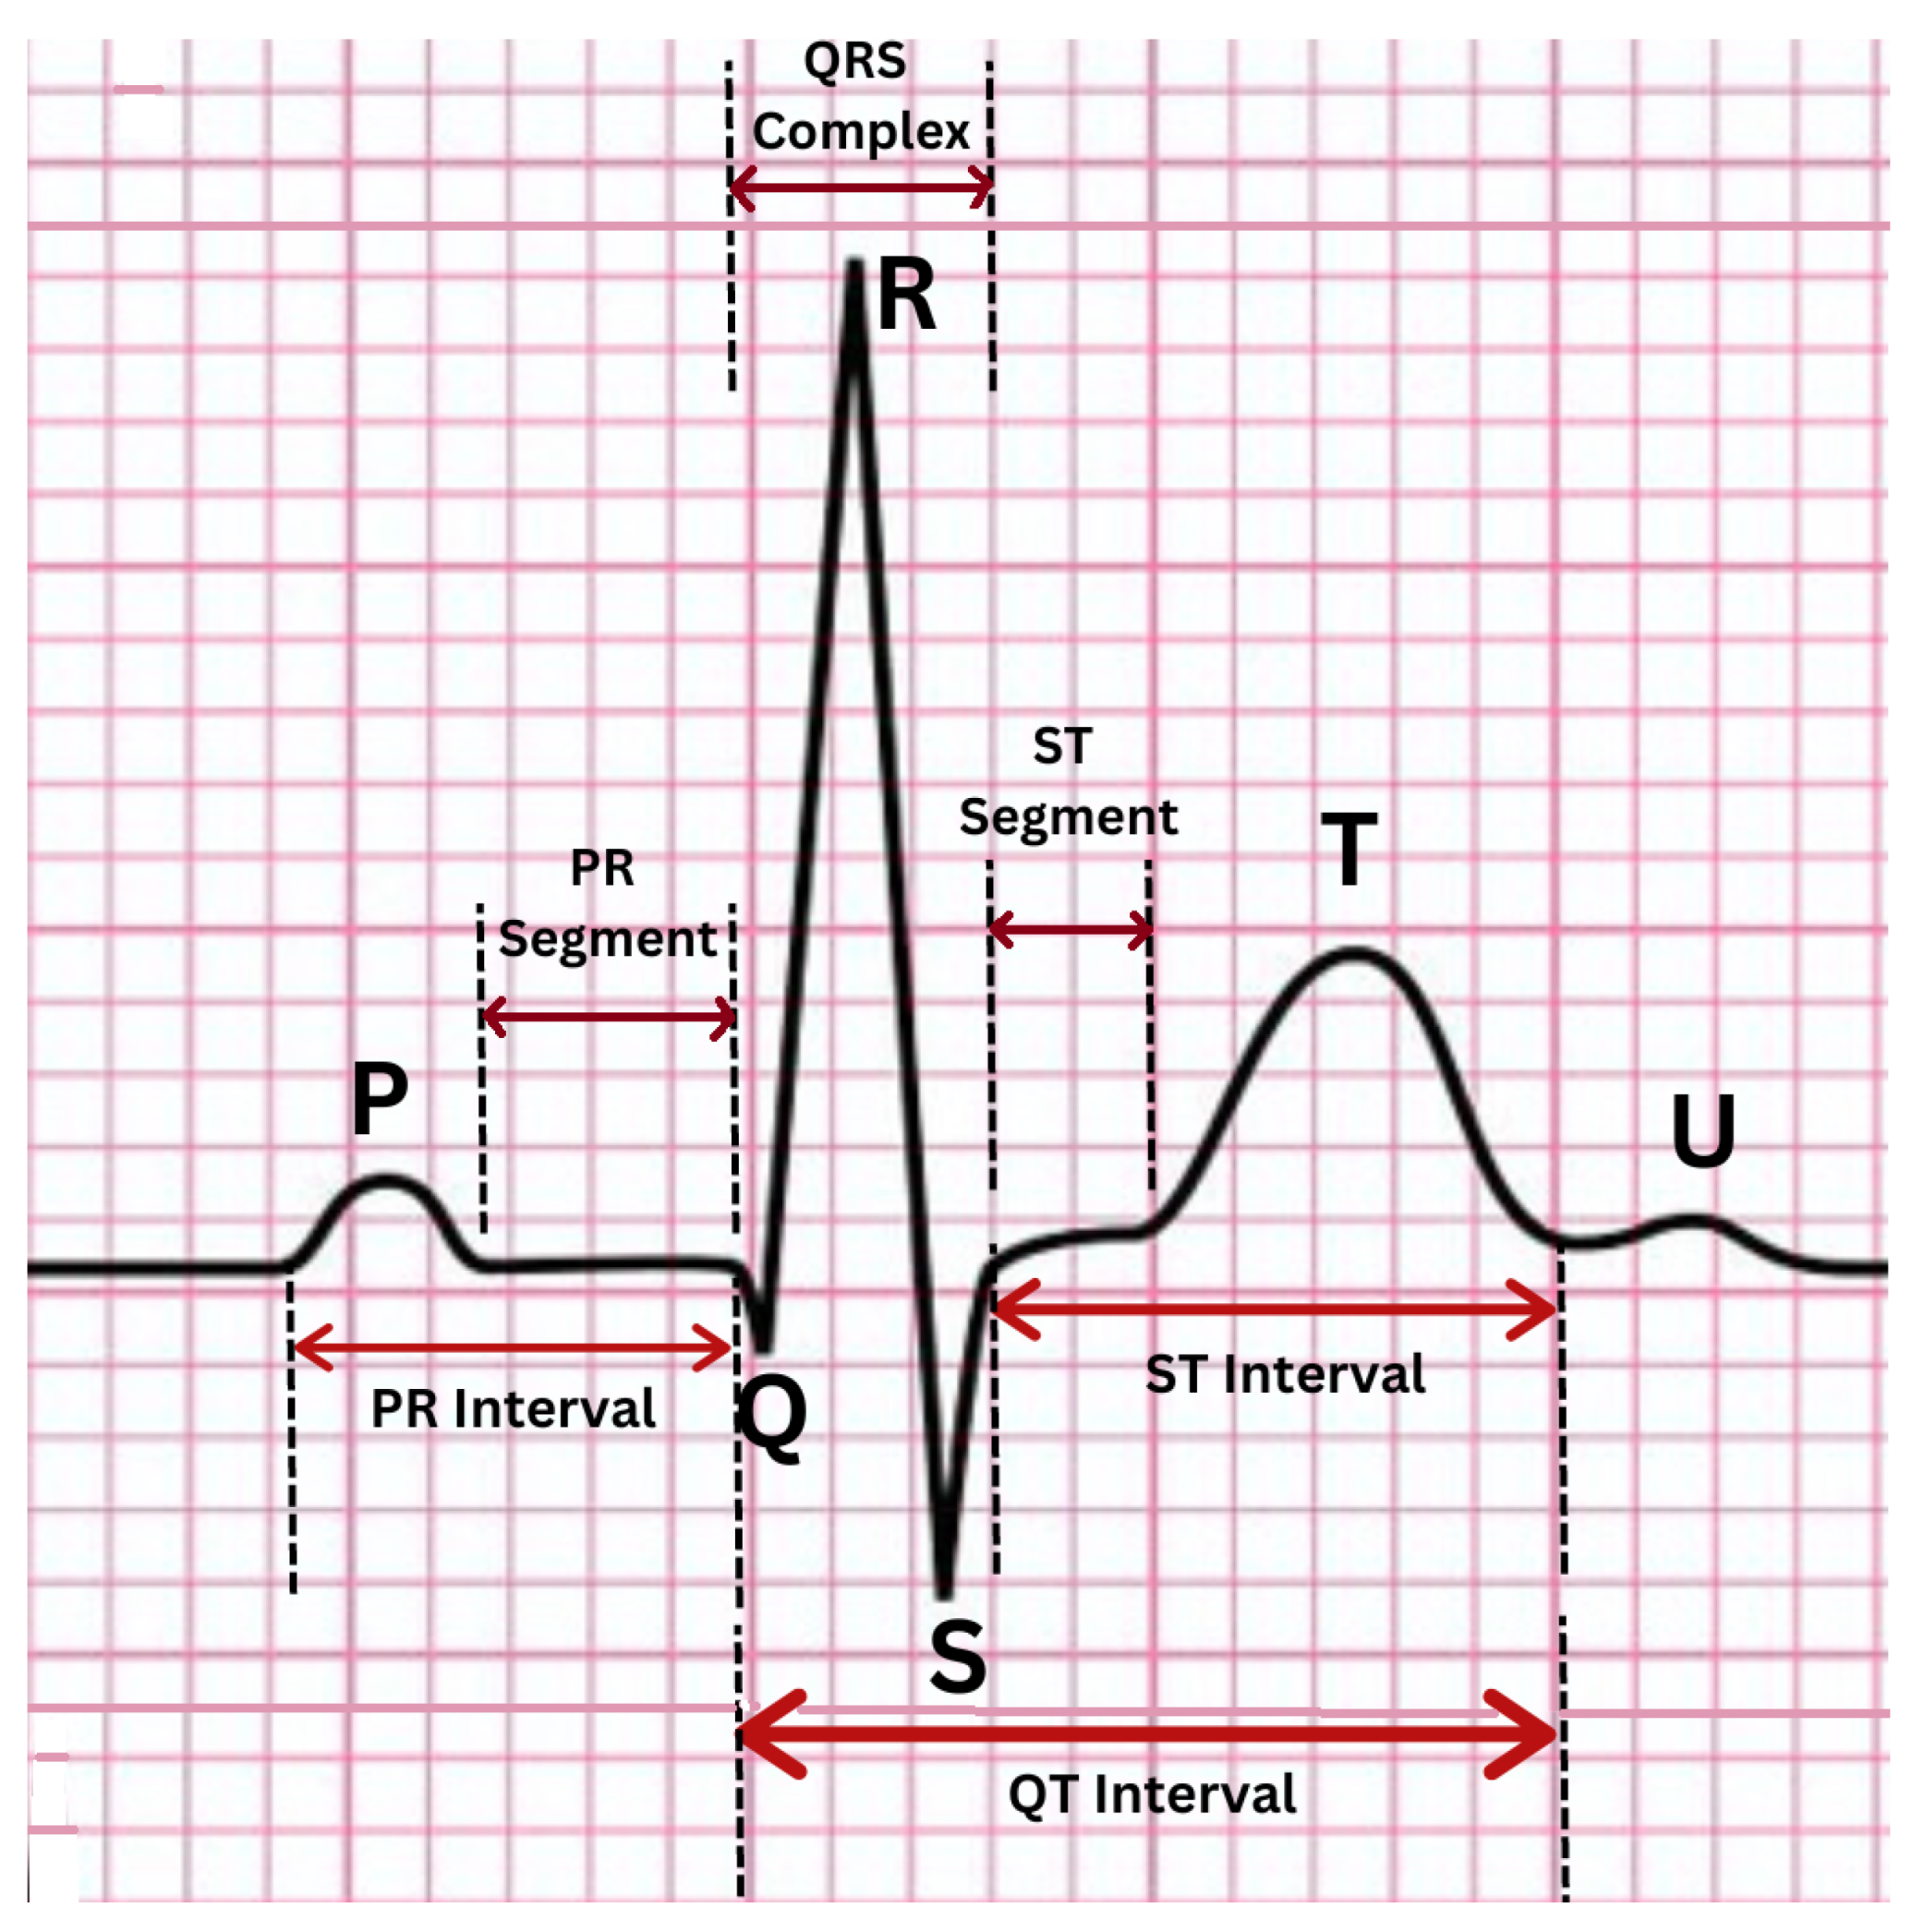
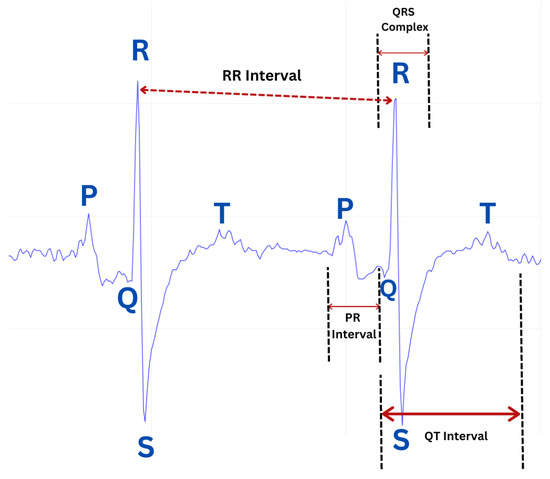
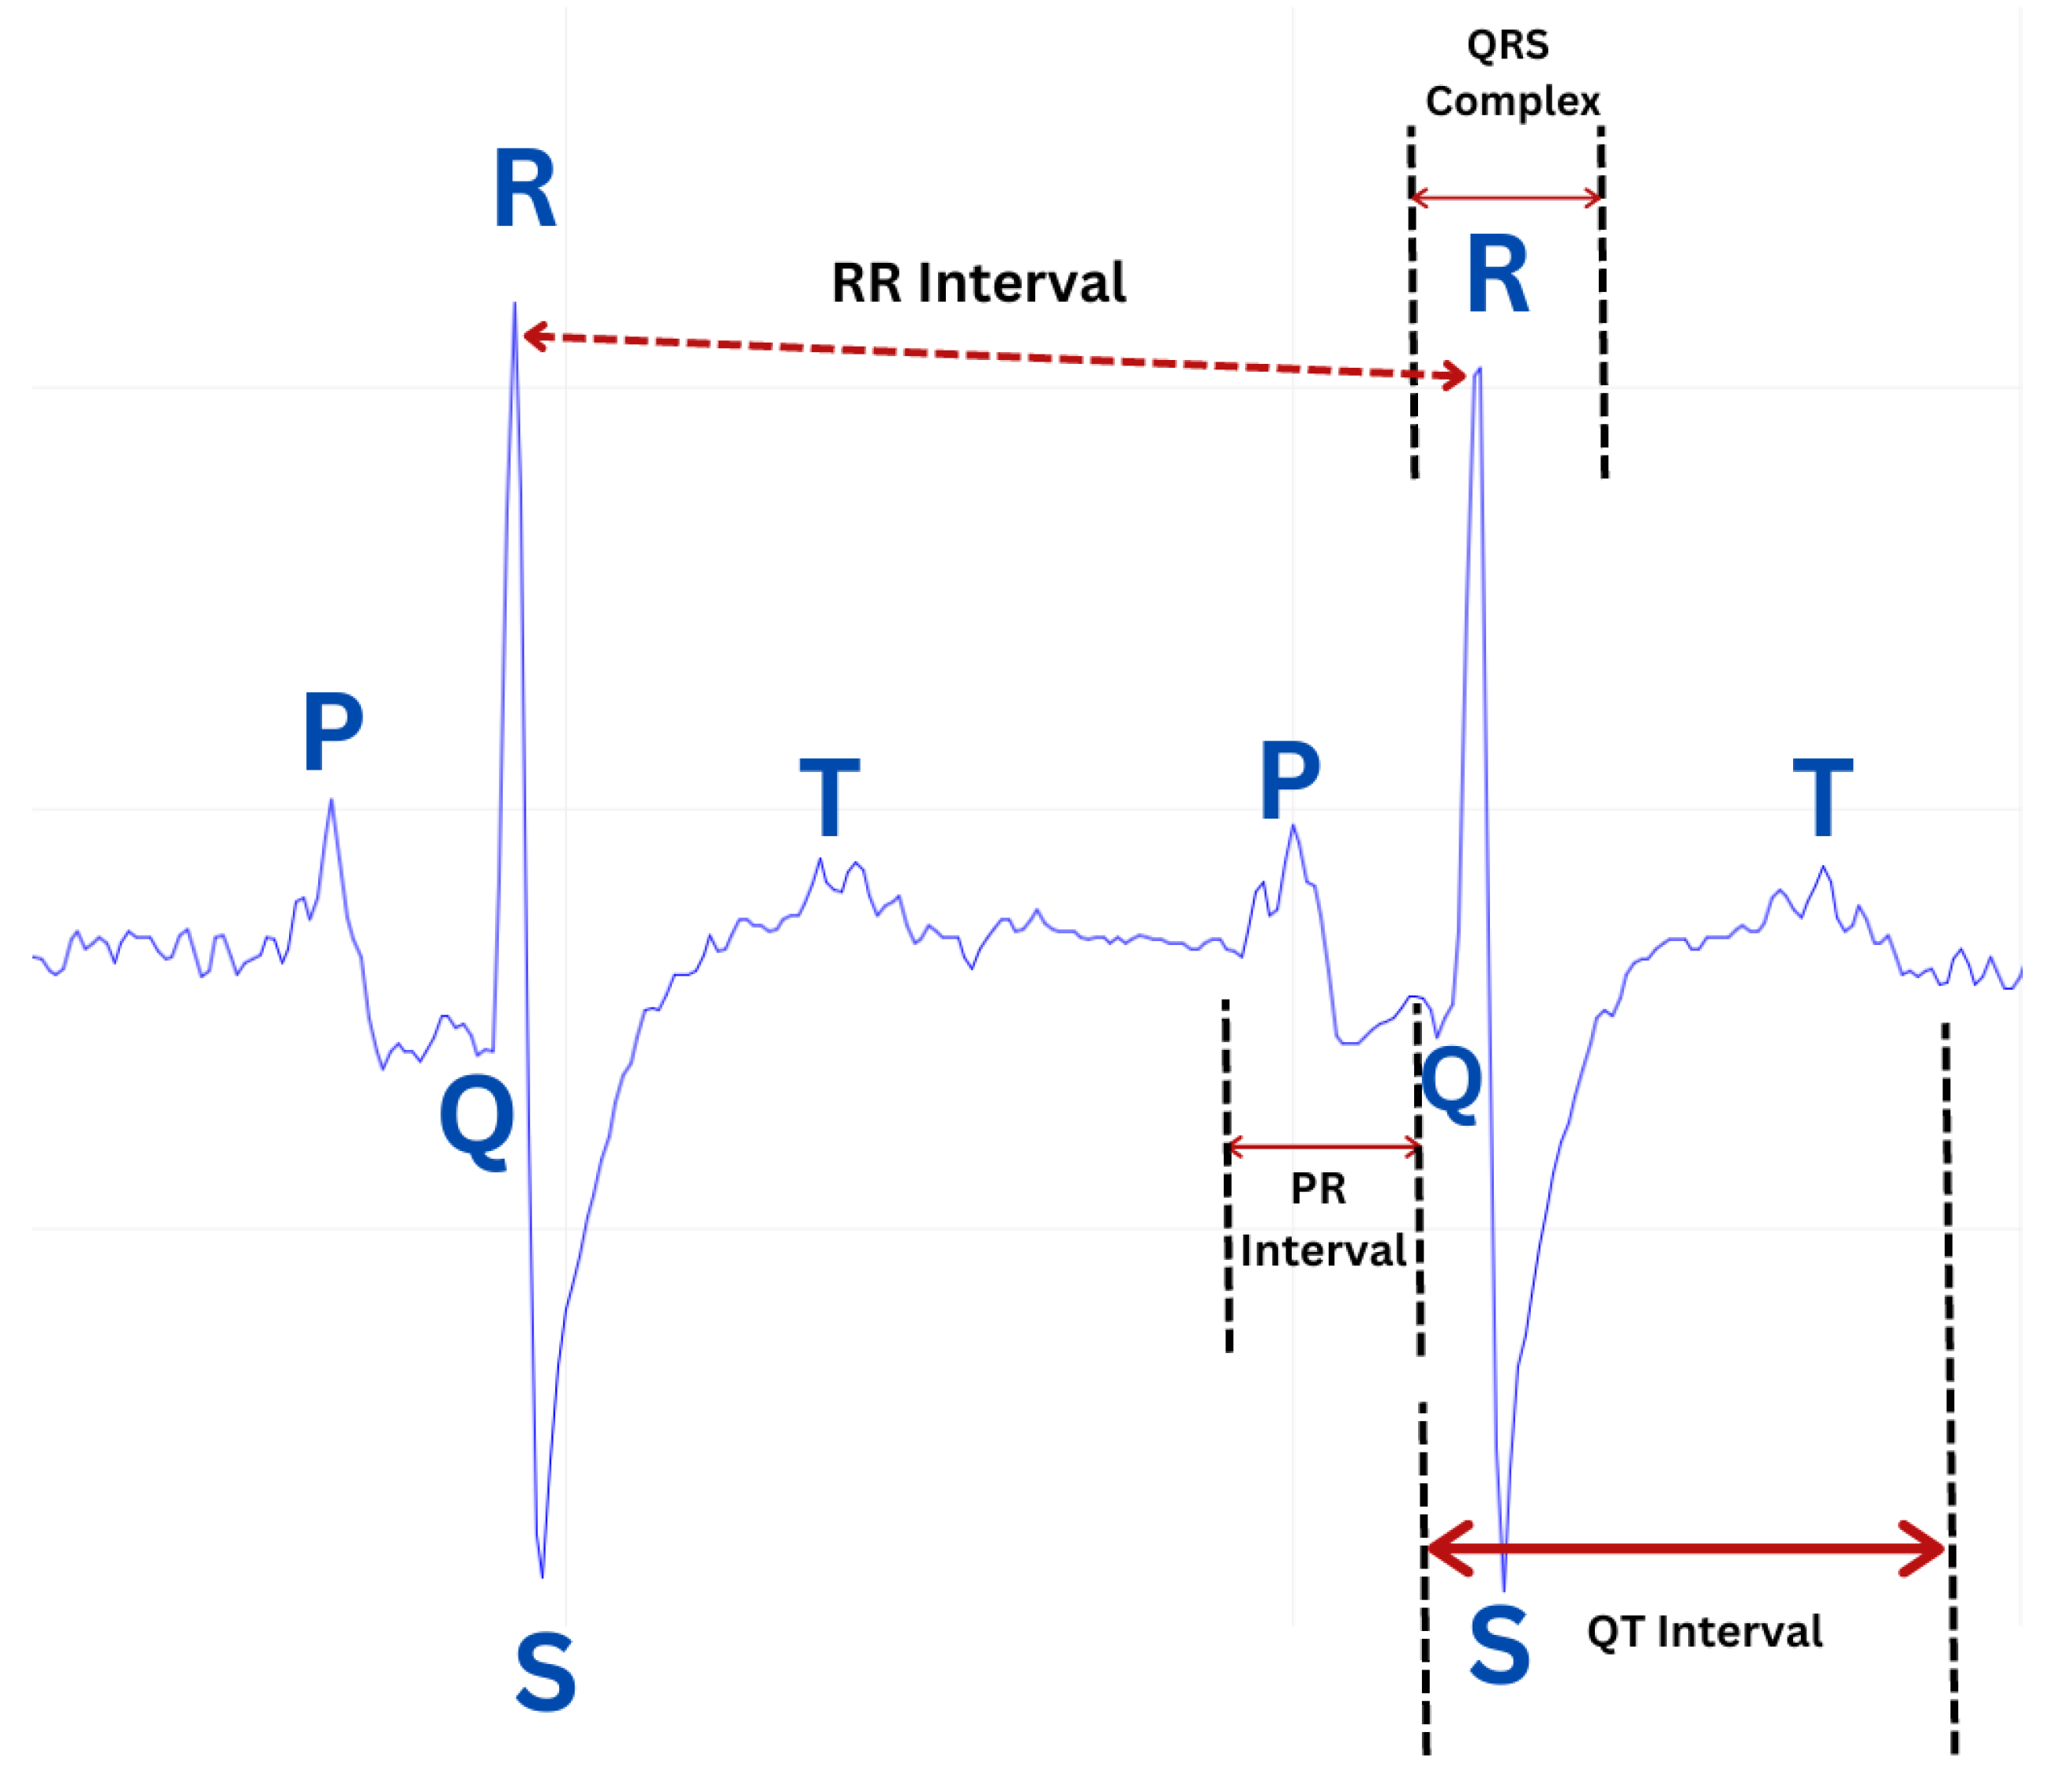
The ECG data acquisition process, signal noise removal, analysis, and assessment of the proposed AF detection algorithms used in the developed embedded system are described in the subsequent paragraphs. Typical ECG signals mainly consist of several types of waves, one complex, as well as intervals and segments, as seen in Figure 12.
Figure 12.
A typical ECG waveform.
- P Wave: Represents atrial depolarization.
- Q Wave: A slight downward deflection after the P wave.
- R Wave: A large upward deflection following the Q wave.
- S Wave: A slight downward deflection following the R wave.
- T Wave: Represents ventricular repolarization.
- U Wave: Sometimes present but usually not seen due to its low peak value.
The intervals of these waves are used to diagnose several heart diseases [25].
Interval: Represents the time between two specific ECG waves. The intervals commonly measured on an ECG are the PR interval, QT interval, and RR interval.
Segment: Represents the length between two specific points on an ECG signal that is supposed to be at the baseline amplitude. The segments on an ECG signal include the PR segment and the ST segment.
Complex: The only complex on an ECG signal is the QRS complex.
We used the AD8232 single-lead ECG sensor that extracts, amplifies, and filters small bioelectric signals from the human heart. When the three electrodes are typically placed on the right arm (RA), left arm (LA), and right leg (RL), we obtain a single-lead ECG waveform. The ECG waveform we received from our experiment contains several key components (PR interval, QRS complex, and QT interval) that represent different electrical activities of the heart, as illustrated in Figure 13.
Figure 13.
Real-time ECG waveform from the AD8232 sensor.
RR interval: Indicates the time interval between two adjacent R waves. In arrhythmias, these intervals may become irregular.
PR interval: This measures the time between the beginnings of the P wave and the QRS complex.
QRS complex: Represents ventricular depolarization, which consists of three essential waves, i.e., Q wave, R wave, and S wave. By analyzing the QRS complex, certain diseases, such as drug toxicity and electrolyte imbalance, are likely to be detected.
QT interval: This represents the time between the beginning of the Q wave and the end of the T wave, which is related to ventricular depolarization and repolarization [25]. If the QT interval exceeds the normal value, there is an increased risk of ventricular fibrillation.
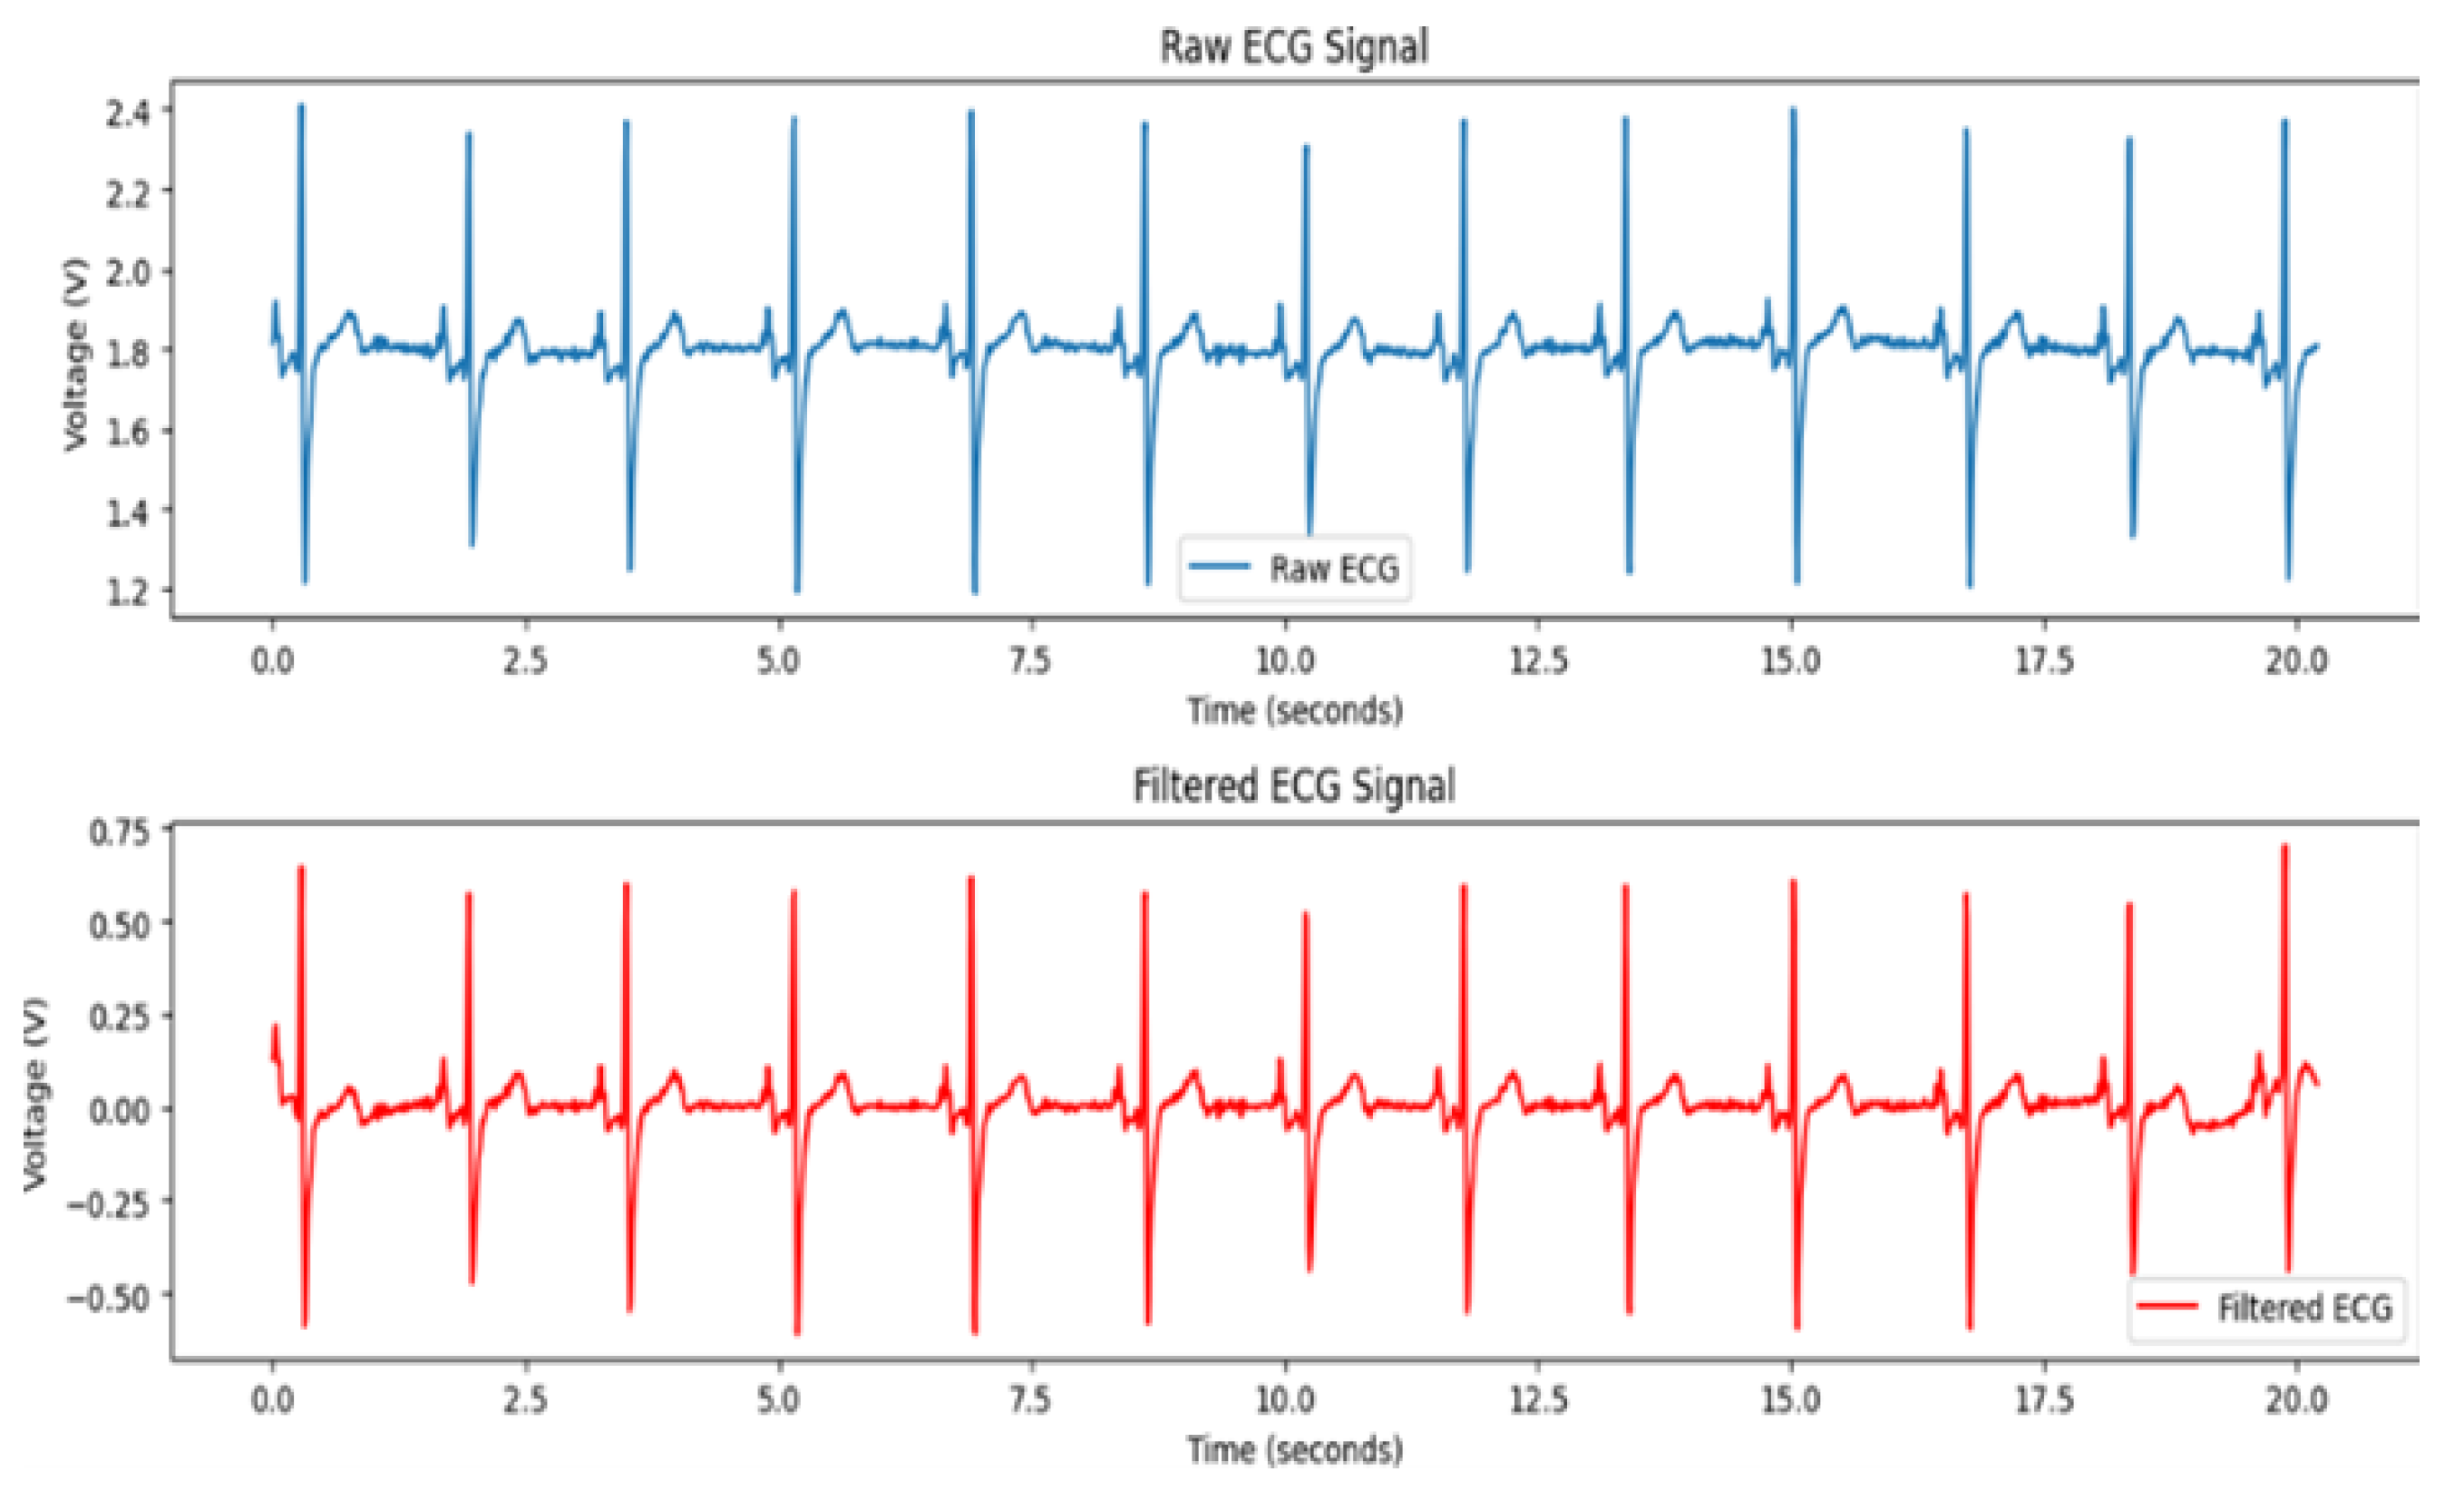
We collected the raw ECG signal values from the Arduino IDE serial monitor for 20.21 s at a sampling rate of 99 Hz with a total of 2001 raw ADC values.
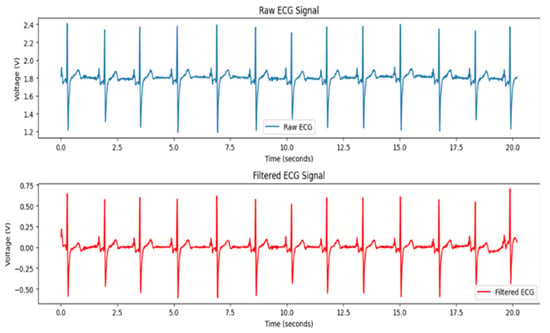
Figure 14 illustrates the raw and filtered ECG signals, with the horizontal axis representing time and the vertical axis representing voltage. The upper panel shows the raw ECG signal recorded over approximately 20.21 s, highlighting various peaks of the QRS complex, noise, and baseline wandering. The lower panel displays the filtered ECG signal, which was processed using a band-pass filter. This filter effectively removes high-frequency noise and low-frequency baseline drifts, resulting in a cleaner signal that retains the essential characteristics of the ECG waveform, including the P-waves, QRS complexes, and T-waves. Additionally, the previously created time vector can be used to convert the sample numbers into actual time in seconds.
Figure 14.
Raw vs. filtered ECG signal visualization over 20 s.
The hardware sample was initially collected as a CSV file and then prepared for input into the trained model. Specifically, the CSV was converted into a 3D array of series values. This input was subsequently passed through the preprocessing pipeline to be prepared for the applied model. The Raspberry Pi 4B receives ECG data from the ESP8266 via a serial connection and processes the signals to execute the preloaded multimodal deep learning model (VGG16 + distilled CNN-BiLSTM) for atrial fibrillation (AF) diagnosis. This model, developed using Python 3.12 with the Keras library and TensorFlow as the backend, analyzes the data and provides diagnostic outcomes. The Raspberry Pi displays the results upon the completion of the testing phase. The latency of detection for the proposed hardware device, comprising a Raspberry Pi 4B, an ESP8266 microcontroller, and an AD8232 ECG sensor, is approximately 0.85 s.
4.2. Model Evaluation on ECG Dataset
The three trained models were thoroughly assessed in the form of the ECG dataset in the test data, which was 20% of the entire dataset. Table 2 presents the accuracy, precision, recall, and F1 score of these models after 80 epochs of training, which gives a quantitative measure of the efficiency of the proposed models. The table compares the performance metrics of three applied models, LSTM, CNN-LSTM, and CNN-BiLSTM, on ECG data, showing that the CNN-BiLSTM model achieves the highest accuracy (92.73%) and F1 score (0.93). In contrast, the LSTM model performs the least effectively, with an accuracy of 71.24% and an F1 score of 0.71.
Table 2.
Performance metrics for array form of ECG tabular data.
Table 3 summarizes the performance metrics of three models, i.e., ViT, ResNet32, and VGG16, on ECG image data, with VGG16 achieving the highest accuracy (89.97%) and F1 score (0.90). Despite having significantly fewer parameters (165.5k), VGG16 outperforms the other models, with ResNet32 showing slightly lower performance and the ViT model having the lowest accuracy (83.57%) and F1 score (0.82).
Table 3.
Performance metrics of different models of ECG image data.
4.3. Performance of Multimodal Approach
Given that the CNN-BiLSTM and VGG16 models demonstrated the best performance for each data type in Table 2 and Table 3, respectively, we integrated these models into our proposed multimodal approach to enhance overall performance. Table 4 presents the data type, training accuracy, validation accuracy, and validation loss for both the individual and multimodal models.
Table 4.
Comparison between unimodal and multimodal models.
Table 4 shows that the multimodal model (VGG16 + CNN-BiLSTM) outperforms the unimodal models in terms of training and validation accuracy and exhibits a lower validation loss. Specifically, the multimodal model achieved the highest validation accuracy of 94.07% with a validation loss of 0.24, indicating better generalization compared to the unimodal models, VGG16 (89.89% accuracy, 0.45 loss) and CNN-BiLSTM (92.73% accuracy, 0.36 loss).
4.4. Performance of Knowledge Distillation
Table 5 illustrates various performance metrics of the applied distilled knowledge distillation student model. As expected, the distilled lightweight student models attained satisfactory performance, making them viable for deployment on edge devices with limited computational resources. The evaluation of the proposed approach demonstrated that the CNN-BiLSTM model outperformed the others when applied to the array form of the ECG dataset. Knowledge distillation proves effective for fine-tuning models for edge devices, underscoring its utility in real-world scenarios.
Table 5.
Performance metrics for knowledge distillation.
4.5. Model Evaluation Using Confusion Matrix
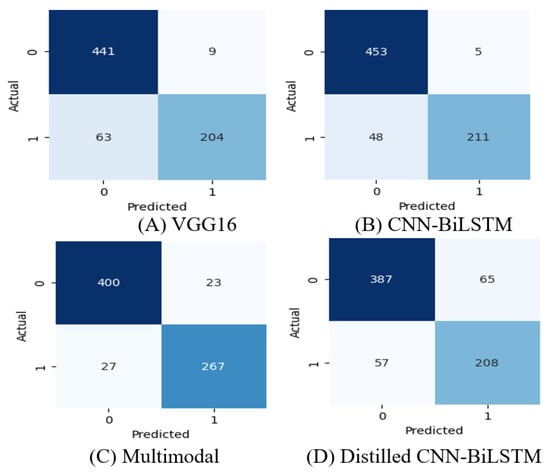
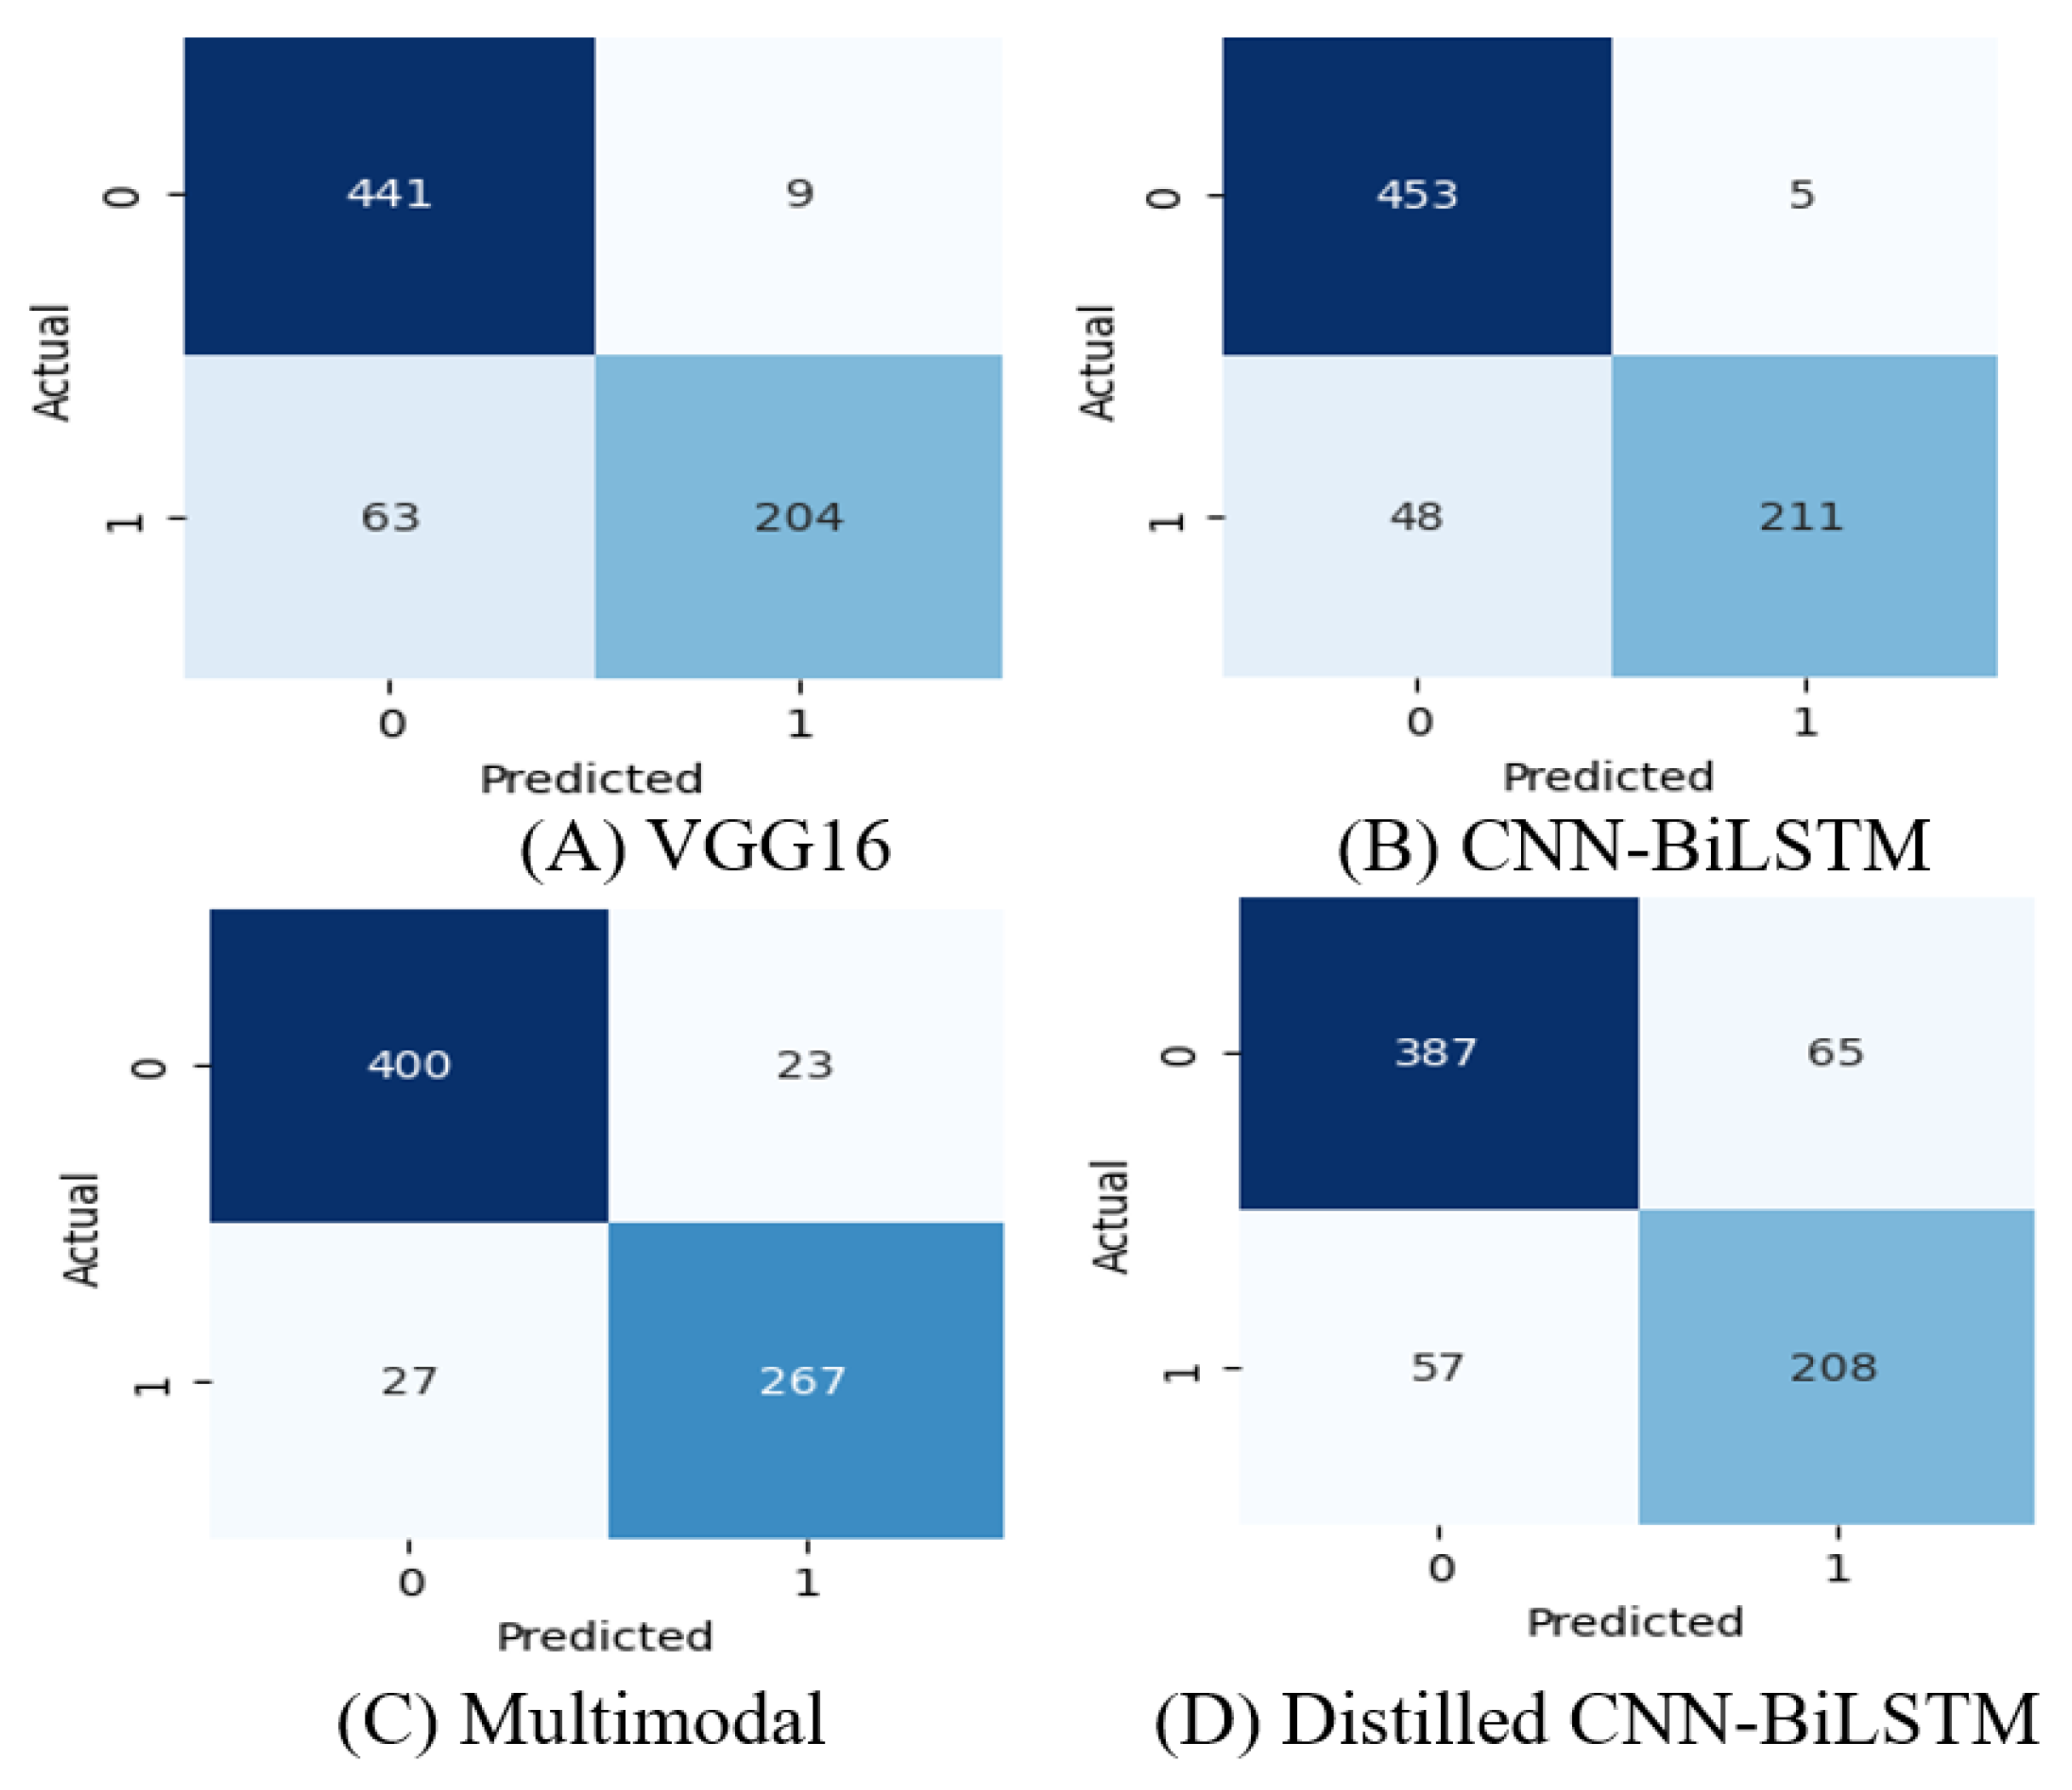
According to the confusion matrix in Figure 15, we can observe that the VGG16 model accurately predicted the ‘Normal’ samples for the ECG image data but was less accurate in predicting the other class. A similar pattern was observed with the CNN-BiLSTM model for the array version of the same data, indicating that both models exhibit a slight bias toward the ‘Normal’ class. However, when examining confusion matrix (c), it becomes evident that the multimodal approach successfully reduced this bias toward the ‘Normal’ class and handled both classes more equitably. As a result, the quality of learning improved with the application of the multimodal model. Furthermore, in the confusion matrix (d), the knowledge distillation student model demonstrated a balanced performance similar to that of the multimodal model, although its prediction accuracy was not as high as that of the multimodal model.
Figure 15.
Confusion matrices for the proposed models: (A) VGG16, (B) CNN-BiLSTM, and (C) multimodal (D) KD student.
4.6. Model’s Detection Interpretation Using XAI
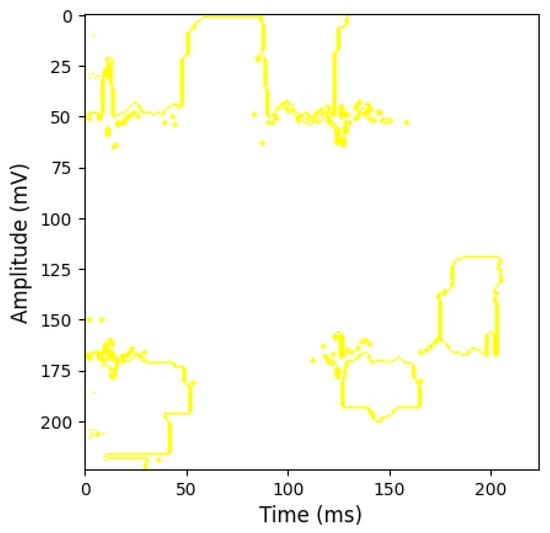
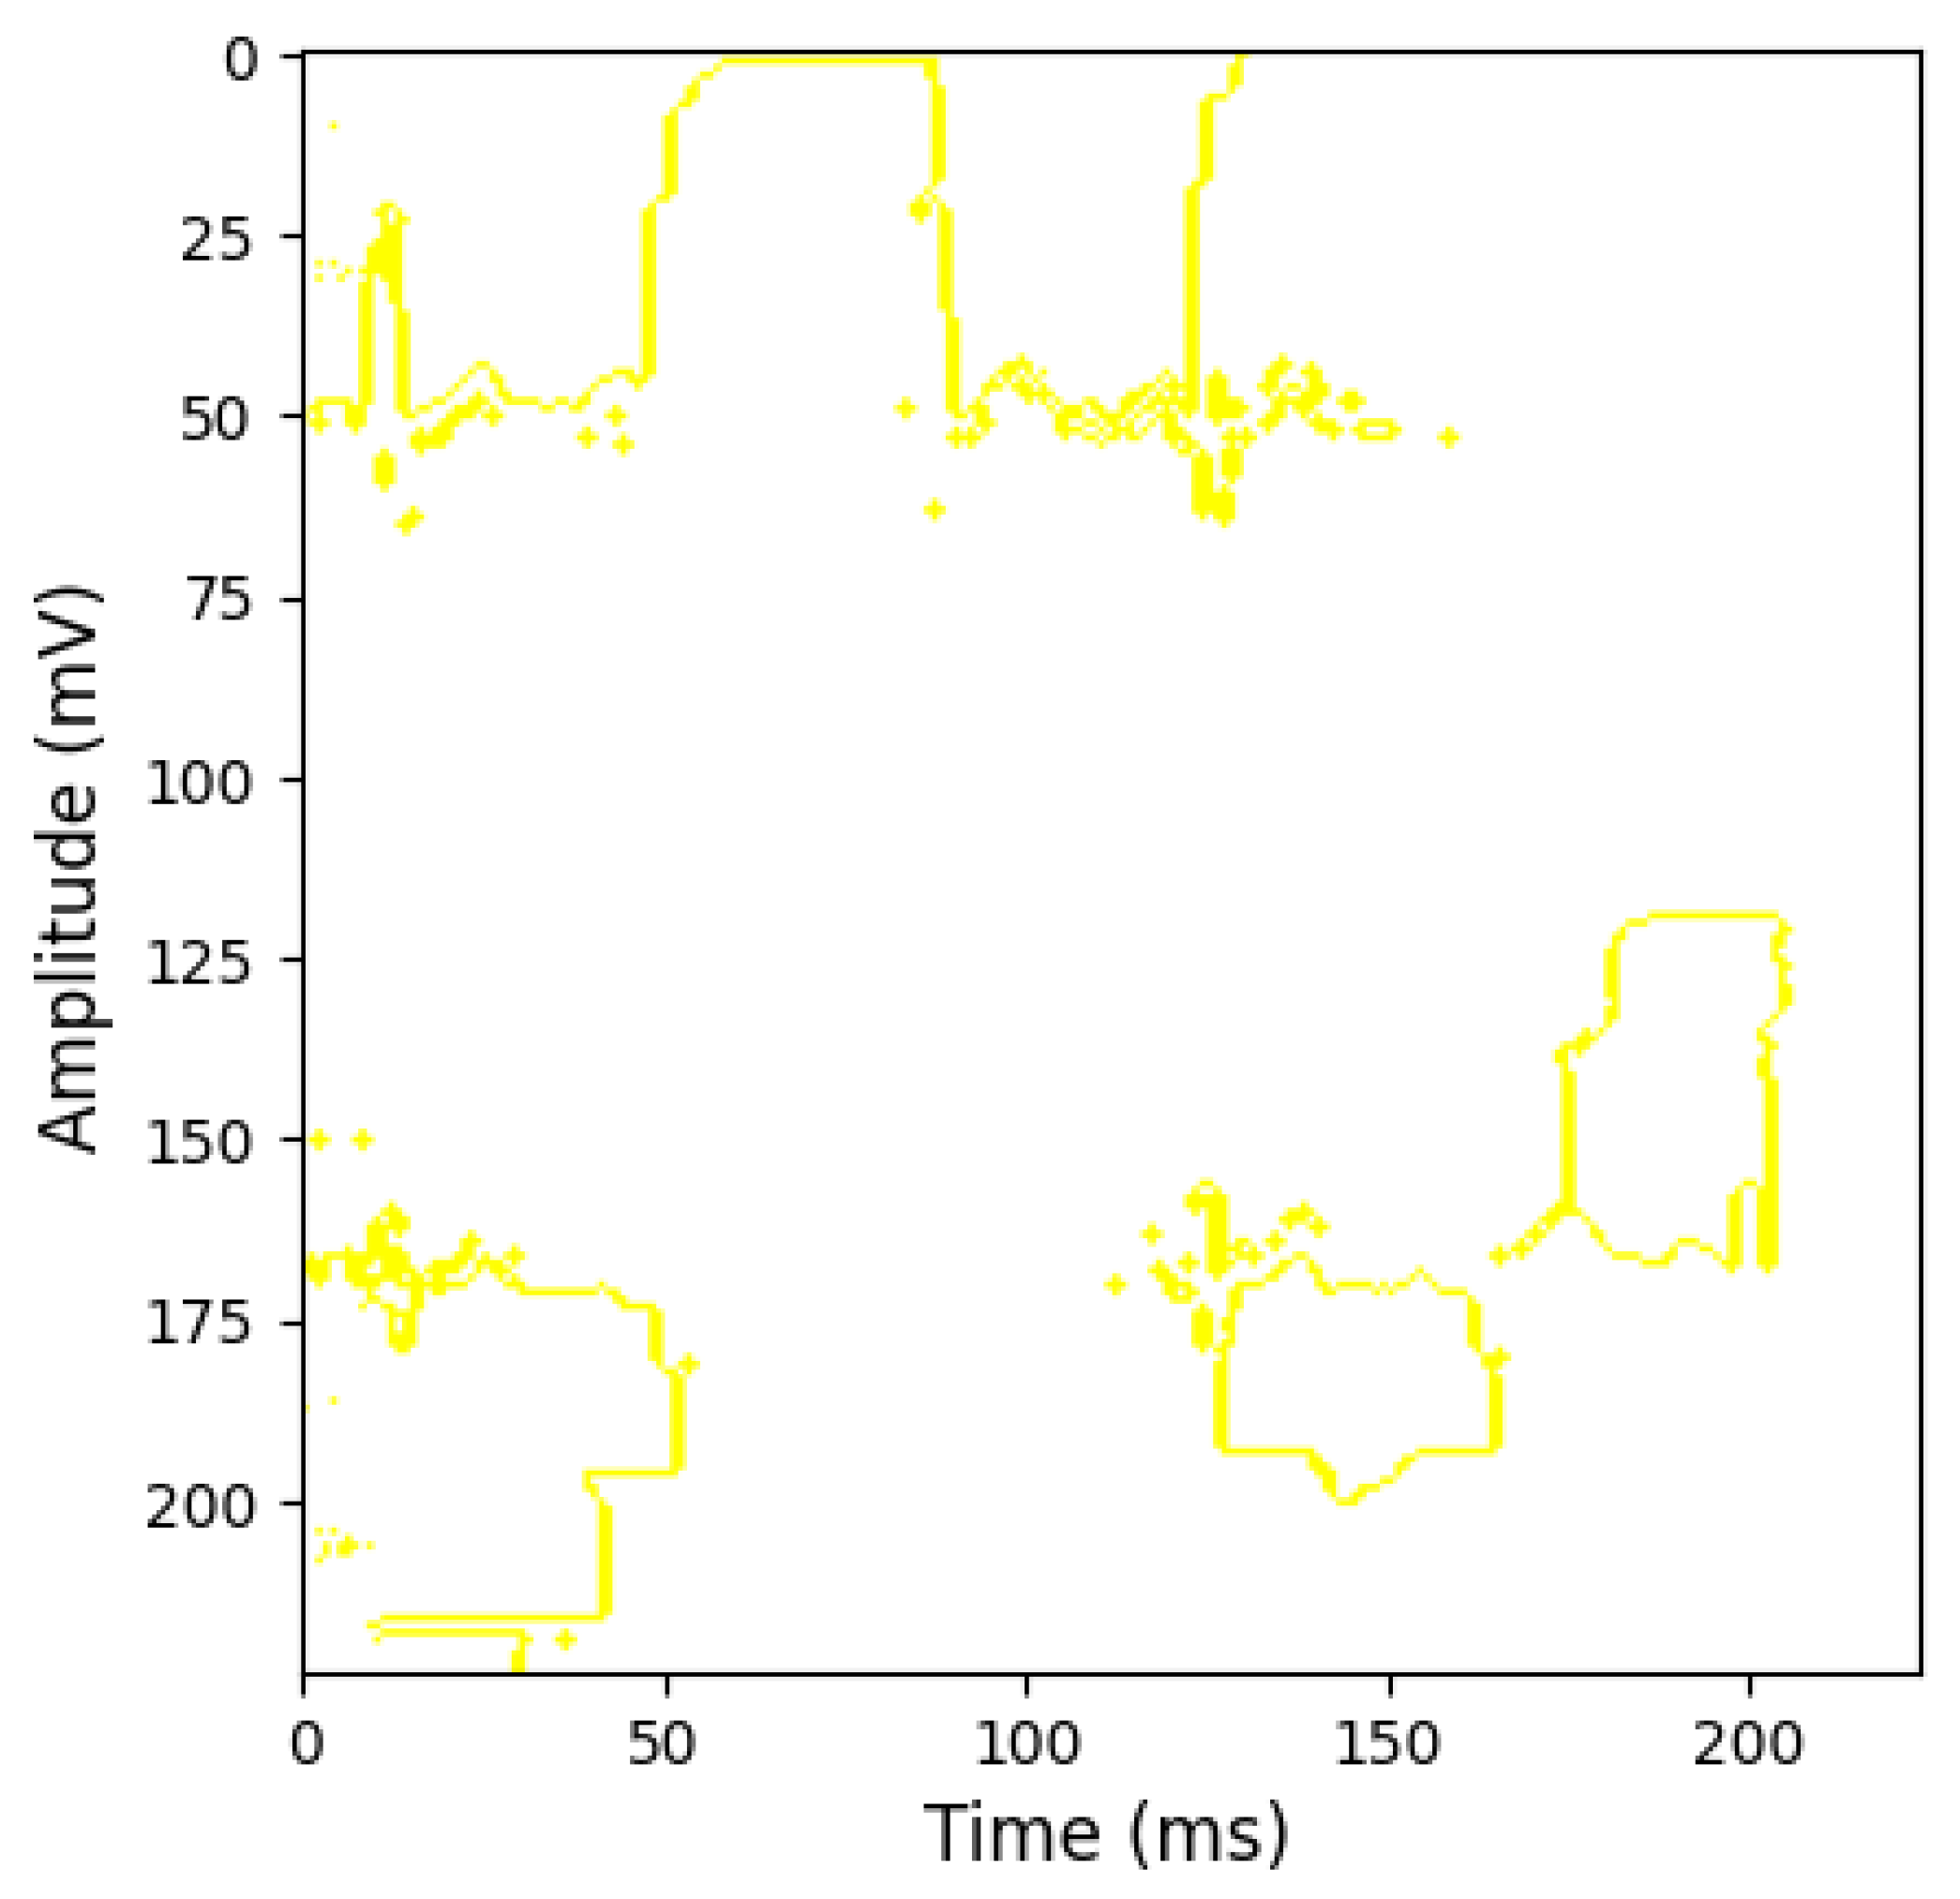
An advanced explainable AI method, Local Interpretable Model-Agnostic Explanations (LIME), has been employed to gain deeper insight into the model’s focus and decision-making process. LIME facilitates the interpretation of individual predictions by determining whether our VGG16 model focuses on the relevant areas of the ECG images. It treats the model as a black box and only requires access to its predictions while creating easily interpretable visualizations such as heatmaps.
Figure 16 demonstrates the heatmap generated by LIME, applied to the VGG16 model, where the yellow regions highlight the portions of the ECG signal that the model considered most significant in making its prediction. From the heatmap, we can conclude that the VGG16 model adequately focused on the relevant areas. Therefore, the model’s internal processes were functioning effectively during training. A performance assessment of machine learning and deep neural network models involves multiple perspectives. We measured the models’ performance using metrics such as accuracy and precision. By analyzing metrics like accuracy, precision, recall, and the confusion matrix, we gained insights into how well the model identified true positives, performed overall classification, and predicted unseen data, ultimately leading to improved model selection and performance for specific tasks.
Figure 16.
Heatmap of the applied VGG16 model produced by LIME XAI.
Table 6 compares various atrial fibrillation (AF) detection studies, highlighting the best-performing deep learning model, datasets, accuracy, F1 scores, and hardware devices. The proposed work achieved a 94.07% accuracy and an F1 score of 0.94 using a multimodal approach (CNN-BiLSTM + VGG16) on the PTB-XL ECG dataset, and it was implemented on an SP8266- and Raspberry Pi 4B-embedded device. In contrast, other works have achieved higher accuracy using different models and datasets, such as the Multimodal Feature Fusion Framework in [9], with a 99.70% accuracy on the MIT-BIH arrhythmia dataset. This study is the first to use only three ECG leads to identify atrial fibrillation, outperforming previous research that utilized the PTB-XL dataset. Furthermore, we investigated a multimodal approach, knowledge distillation for edge devices, and an embedded system for AF detection from ECG.
Table 6.
Comparison of the proposed AF detection system with existing works.
4.7. Limitations of the Proposed AF Detection System
The AD8232 provides a single-lead ECG, which is helpful for essential heart rate monitoring and detecting some arrhythmias. However, it does not offer the comprehensive diagnostic capabilities of a multi-lead or 12-lead ECG system because it may need more fine detail and spatial resolution than a 12-lead ECG. The utilized AD8232 module is limited by its narrow frequency band, which may restrict its accuracy for comprehensive clinical ECG analysis. In addition, the proposed system is useful for monitoring heart rate and detecting significant arrhythmias such as atrial fibrillation. However, it is limited in its ability to diagnose more complex cardiac conditions. Therefore, the quality and accuracy of the waveform depend on proper electrode placement and good contact with the skin. The proposed system can classify between atrial fibrillation and normal ECG signals. However, its functionality would be significantly enhanced if it could identify other forms of cardiac disease from ECG data. The prototype currently lacks shielding and advanced noise suppression, leading to power line interference and other artifacts in the ECG signal.
5. Conclusions
This work presents a novel system that integrates sensors, microcontrollers, and advanced signal processing techniques for real-time ECG monitoring. Bluetooth technology has been utilized to connect the AD8232 sensor, ESP8266, and Raspberry Pi 4B. The battery-powered design is crucial, enhancing the system’s mobility and transforming our solution into a portable tool for monitoring cardiovascular health in a mobile setting. By fine-tuning machine learning and deep learning models, along with optimizing hyperparameters employing the Ray Tune framework, we have extended the range of cardiac analysis and identified the characteristics contributing to the system’s robustness. The data preprocessing and model training yielded promising outcomes, confirming the precision of the proposed method for the classification and prediction of cardiac conditions with high accuracy.
Our future development plan includes developing a web application that will enhance connectivity and accessibility for users, providing a centralized platform for real-time ECG monitoring. This application will offer an intuitive interface for users to track their cardiac activity and access real-time ECG data. Users can examine their ECG results in real time through the integrated Wi-Fi capabilities of the ESP8266, sensors, and the mobile application. This user-centered approach ensures that potential health issues can be detected early; thus, cardiac assessments will be easily understandable to the general public. Future improvements of this work will involve designing a more integrated and compact PCB layout for a fully developed product that is suitable for healthcare applications. In future work, we aim to enhance the system’s robustness by incorporating shielded cables, hardware-based noise filtering, and improved artifact reduction techniques to ensure more accurate and reliable ECG signal acquisition in diverse environments.
We propose a general approach to addressing challenges associated with ECG supervision and timely cardiac care. By providing real-time data and analysis, our solution will not just be limited to ECG monitoring, but will contribute to advancing our mission of patient-centered preventive healthcare. Furthermore, the system offers insights into future health monitoring advancements, laying the groundwork for further developments in the healthcare field.
Author Contributions
Conceptualization, M.A., N.I., F.F.A. and R.K.; Methodology, M.A., N.I. and F.F.A.; Software, A.A. and F.F.A.; Validation, M.A.; Investigation, M.A., N.I., A.A., M.A.C. and R.K.; Data curation, A.A.; Writing—original draft, M.A., N.I., A.A. and M.A.C.; Writing—review & editing, R.K.; Supervision, R.K. All authors have read and agreed to the published version of the manuscript.
Funding
This research received no external funding.
Institutional Review Board Statement
Not applicable.
Informed Consent Statement
Not applicable.
Data Availability Statement
The data presented in this study are openly available in Scientific Data at https://physionet.org/content/ptb-xl/1.0.3/, accessed on 6 September 2024.
Conflicts of Interest
The authors declare no conflicts of interest.
References
- Drozd, M.; Pujades-Rodriguez, M.; Sun, F.; Franks, K.N.; Lillie, P.J.; Witte, K.K.; Kearney, M.T.; Cubbon, R.M. Causes of death in people with cardiovascular disease: A UK Biobank cohort study. J. Am. Heart Assoc. 2021, 10, e023188. [Google Scholar] [CrossRef] [Scilit] [PubMed]
- Chung, M.K.; Refaat, M.; Shen, W.K.; Kutyifa, V.; Cha, Y.M.; Di Biase, L.; Baranchuk, A.; Lampert, R.; Natale, A.; Fisher, J.; et al. Atrial fibrillation: JACC council perspectives. J. Am. Coll. Cardiol. 2020, 75, 1689–1713. [Google Scholar] [CrossRef] [Scilit]
- Dalloul, A.H.; Miramirkhani, F.; Kouhalvandi, L. A review of recent innovations in remote health monitoring. Micromachines 2023, 14, 2157. [Google Scholar] [CrossRef] [Scilit]
- Boikanyo, K.; Zungeru, A.M.; Sigweni, B.; Yahya, A.; Lebekwe, C. Remote patient monitoring systems: Applications, architecture, and challenges. Sci. Afr. 2023, 20, e01638. [Google Scholar] [CrossRef] [Scilit]
- Mehra, R. Global Public Health Problem of Sudden Cardiac Death. J. Electrocardiol. 2007, 40, 118–122. [Google Scholar] [CrossRef] [Scilit]
- Ahsanuzzaman, S.M.; Ahmed, T.; Rahman, M.A. Low Cost, Portable ECG Monitoring and Alarming System Based on Deep Learning. In Proceedings of the IEEE Region 10 Symposium, Dhaka, Bangladesh, 5–7 June 2020; pp. 313–319. [Google Scholar] [CrossRef] [Scilit]
- Yu, J.; Park, S.; Kwon, S.H.; Cho, K.H.; Lee, H. AI-Based Stroke Disease Prediction System Using ECG and PPG Bio-Signals. IEEE Access 2022, 10, 43623–43638. [Google Scholar] [CrossRef] [Scilit]
- Choi, Y.A.; Park, S.J.; Pyo, J.A.C.S.; Cho, K.H.; Lee, H.S.; Yu, J.H. deep-learning-based stroke disease prediction system using real-time bio-signals. Sensors 2021, 21, 4269. [Google Scholar] [CrossRef] [Scilit]
- Choi, Y.A.; Park, S.; Jun, J.A.; Ho, C.M.B.; Pyo, C.S.; Lee, H.; Yu, J. Machine-Learning-Based Elderly Stroke Monitoring System Using Electroencephalography Vital Signals. Appl. Sci. 2021, 11, 1761. [Google Scholar] [CrossRef] [Scilit]
- Zhou, F.; Fang, D. Multimodal ECG heartbeat classification method based on a convolutional neural network embedded with FCA. Sci. Rep. 2024, 14, 8804. [Google Scholar] [CrossRef] [Scilit]
- Zhang, Y.; Wang, H.; Zhao, L. A Multimodal Deep Neural Network for ECG and PCG Classification with Multimodal Fusion. IEEE Trans. Biomed. Eng. 2023, 27, 1221–1230. [Google Scholar]
- Ahmad, Z.; Tabassum, A.; Guan, L.; Khan, N.M. ECG Heartbeat Classification Using Multimodal Fusion. IEEE Access 2021, 9, 120043–120065. [Google Scholar] [CrossRef] [Scilit]
- Han, H.; Lian, C.; Zeng, Z.; Xu, B.; Zang, J.; Xue, C. Multimodal Multi-instance Learning for Long-term ECG Classification. Knowl.-Based Syst. 2023, 270, 110555. [Google Scholar] [CrossRef] [Scilit]
- Mert, M.; Akan, A. Time-frequency Domain Modified Vision Transformer Model for Detection of Atrial Fibrillation using Multi-lead ECG Signals. J. Med. Imaging Health Inform. 2023, 11, 2453–2462. [Google Scholar]
- Żyliński, M.; Nassibi, A.; Mandic, D.P. Design and implementation of an atrial fibrillation detection algorithm on the ARM Cortex-M4 microcontroller. Sensors 2023, 23, 7521. [Google Scholar] [CrossRef] [Scilit]
- Obeidat, Y.M.; Alqudah, A.M. An embedded system based on Raspberry Pi for effective electrocardiogram monitoring. Appl. Sci. 2023, 13, 8273. [Google Scholar] [CrossRef] [Scilit]
- Su, S.; Zhu, Z.; Wan, S.; Sheng, F.; Xiong, T.; Shen, S.; Hou, Y.; Liu, C.; Li, Y.; Sun, X.; et al. An ECG signal acquisition and analysis system based on machine learning with model fusion. Sensors 2023, 23, 7643. [Google Scholar] [CrossRef] [Scilit]
- Shin, S.; Kang, M.; Zhang, G.; Jung, J.; Kim, Y.T. Lightweight Ensemble Network for Detecting Heart Disease Using ECG Signals. Appl. Sci. 2022, 12, 3291. [Google Scholar] [CrossRef] [Scilit]
- Wagner, P.; Strodthoff, N.; Bousseljot, R.D.; Kreiseler, D.; Lunze, F.; Samek, W.; Schaeffter, T. PTB-XL, a large publicly available electrocardiography dataset. Sci. Data 2020, 7, 1–15. [Google Scholar] [CrossRef] [Scilit]
- Ramkumar, S.; Nerlekar, N.; D’Souza, D.; Pol, D.J.; Kalman, J.M.; Marwick, T.H. Atrial fibrillation detection using single lead portable electrocardiographic monitoring: A systematic review and meta-analysis. BMJ Open 2018, 8, e024178. [Google Scholar] [CrossRef] [Scilit]
- Kristensen, A.N.; Jeyam, B.; Riahi, S.; Jensen, M.B. The use of a portable three-lead ECG monitor to detect atrial fibrillation in general practice. Scand. J. Prim. Healthc. 2016, 34, 304–308. [Google Scholar] [CrossRef] [Scilit] [PubMed]
- Simonyan, K.; Zisserman, A. Very deep convolutional networks for large-scale image recognition. In Proceedings of the International Conference on Learning Representations. Computational and Biological Learning Society, San Diego, CA, USA, 7–9 May 2015; pp. 1–14. [Google Scholar]
- Wu, M.P.; Wu, F. Predicting Residential Electricity Consumption Using CNN-BiLSTM-SA Neural Networks. IEEE Access 2024, 12, 71555–71565. [Google Scholar] [CrossRef] [Scilit]
- Gou, J.; Yu, B.; Maybank, S.J.; Tao, D. Knowledge Distillation: A Survey. Int. J. Comput. Vis. 2021, 129, 1789–1819. [Google Scholar] [CrossRef] [Scilit]
- Shaown, T.; Hasan, I.; Mim, M.R.; Hossain, M.S. IoT-based Portable ECG Monitoring System for Smart Healthcare. In Proceedings of the International Conference on Advances in Science, Engineering and Robotics Technology, Dhaka, Bangladesh, 3–5 May 2019; pp. 1–5. [Google Scholar] [CrossRef] [Scilit]

Disclaimer/Publisher’s Note: The statements, opinions and data contained in all publications are solely those of the individual author(s) and contributor(s) and not of MDPI and/or the editor(s). MDPI and/or the editor(s) disclaim responsibility for any injury to people or property resulting from any ideas, methods, instructions or products referred to in the content. |
© 2024 by the authors. Licensee MDPI, Basel, Switzerland. This article is an open access article distributed under the terms and conditions of the Creative Commons Attribution (CC BY) license (https://creativecommons.org/licenses/by/4.0/).