


Abstract
Global policy narratives on livestock development increasingly emphasize environmental concerns, often overlooking the social dimensions of the sector. In the case of dairy, the world’s most valuable agricultural commodity, its role in social and economic development remains poorly quantified. Our study contributes to a more balanced vision of the UN SDGs thanks to the inclusion of a socio-economic dimension. Here we present a novel empirical approach to assess the socio-economic impacts of dairy development using a new global dataset and non-parametric modelling techniques (local polynomial regressions), with yield as a proxy for sectoral performance. We find that as dairy systems intensify, the number of farm households engaged in production declines, yet household incomes rise. On-farm labour productivity also increases, accompanied by a reduction in employment but higher wages. In dairy processing, employment initially grows, peaks, and then contracts, again with rising wages. The most substantial impact is observed among consumers: an increased milk supply leads to lower prices and improved affordability, expanding the access to dairy products. Additionally, dairy development is associated with greater agricultural value added, an expanding tax base, and the increased formalization of the economy. These findings suggest that dairy development, beyond its environmental footprint, plays a significant and largely positive role in social transformation, yet is having to adapt sustainably while tackling labour force relocation, and that dairy development’s social impacts mimic the general agricultural sector. These results might be of interest for the assessment of policies regarding dairy development.
1. Introduction
In 1900, the United States had 4.4 million dairy farms, which directly sustained around 21 million people (farmers and family) and, according to our estimates, in 1915 fed 52.5 million consumers (around 53% of the population). Today, the same country has reduced the number of dairy farms to 32,000, sustaining 87,000 people in dairy households but feeding over 319 million people (93.6% population) in its country only (not considering exports, which would be feeding a higher number). Converted to 2018 prices, in retail shops, a litre of milk cost 2.37 USD in 1900, while in 2018 the price was a fraction of that, around 0.88 USD/litre (0.5 percent of a person’s daily income if they were buying one litre of milk daily, instead of over 7% in 1930). It is evident that dairy development in this country has contributed to social changes (Estimates from authors (upcoming)).
The reader might ask whether those changes are a global phenomenon. With this same aim, several partnership and institutions (Global Agenda for Sustainable Livestock (GASL), the Food and Agriculture Organization of the United Nations (FAO), the International Farm Comparison Network (IFCN), the International Fund for Agricultural Development (IFAD), and the Global Dairy Platform (GDP)) have put together for the first time a global dataset gathering data on dairy and social development. This piece of work distils 14 stylized facts on dairy development and social transformation from that database. The results might be key for the assessment of policies regarding dairy development.
The dairy sector is one of the most important components of global agriculture, ranking first as the most valuable agricultural commodity worldwide (raw cattle milk was valued at 325 billion international dollars in 2023), and it makes up a tenth of the value of total agricultural production [1]. This sector plays a vital role not only in economic terms but also in the broader social and nutritional dimensions. The dairy sector feeds around 80 percent of the world’s population (around 6 billion people) [2], providing essential micronutrients for human development [3]. For example, a glass of milk provides a five-year-old child with over 20 percent of their daily proteins [4]. Dairy consumption is particularly important in addressing malnutrition, especially in developing countries. The sector is integral to the livelihoods of millions of households, especially in rural areas, where it often constitutes a primary source of income and sustenance. Globally, dairy farming is prevalent in many developing economies, where it supports smallholder farmers and provides an economic safety net.
On top of that, the dairy sector is expected to expand and significantly change in the upcoming years, particularly in developing countries, with accelerating growth in production and yields in the Global South. Milk is expected to grow faster than other main agricultural commodities in the next decade [5,6], being the fastest-expanding livestock sector. In the next decade, the sector is expected to grow at 1.6 percent per annum with the drivers being yield increases (thanks to optimized production systems, animal health and genetic improvements, and feed efficiency) and growth in the number of animals, particularly in Sub-Saharan Africa, India, and Pakistan [5,6].
Despite the focus on environmental sustainability, there has been limited discussion about how dairy sector transformation will affect social development, particularly in achieving the social Sustainable Development Goals (SDGs). While scattered research exists that demonstrates the positive impacts of dairy on poverty reduction, food security, and nutrition [7,8], systematic evidence remains scarce.
In order to respond to the question on how dairy development might contribute to social development, we followed a four-step approach. First, we looked at stylized facts on general agricultural development and social transformation; second, we put together a dairy–social dataset and constructed a number of indicators linking dairy sector stats with social variables; third, we provide quantitative evidence on the effect of dairy development on society through the description of stylized facts using non-parametric techniques; finally, we assess and compare this with the existing evidence on the role of general agricultural development and social development, and perform a multivariate assessment to better understand the socio-economic outcomes. By examining these patterns, we can begin to form a clearer picture of the sector’s potential to contribute to the social SDGs, such as reducing poverty or improving nutrition.
The UN’s ‘Food Systems’ vision and the Sustainable Development Goals (SDGs) can greatly benefit from the socio-economic contributions of the dairy sector. Dairy sector development supports several SDGs, including SDG 1 (no poverty), SDG 2 (zero hunger), SDG 3 (good health and well-being), SDG 4 (quality education), and SDG 8 (decent work and economic growth) [7,8]. Dairy activities generate regular cash income for smallholders and landless workers, while creating both direct and indirect employment across the value chain—from production and processing to transport and retail— particularly in rural communities [8]. Where supportive policies and investment frameworks are in place, the sector also stimulates entrepreneurship and drives rural industrialization. Dairy products supply high-quality protein, calcium, and essential micronutrients, contributing to reductions in malnutrition, stunting, and micronutrient deficiencies, particularly in vulnerable groups such as children and pregnant women [9,10]. A greater availability of dairy has been associated with improved household food security and better health outcomes in regions where the sector has grown [11].
The results show that the dairy sector follows a parallel development with the agricultural sector in its social role for development. This document does not aim to be a comprehensive collection of the existing literature on agricultural and social development. To this end, the next subsection summarizes some of the most well-known studies on the matter to check the parallelism, opposition, and feasibility of the results for the larger agricultural sector with the dairy sector. The authors acknowledge that many key studies might be omitted in the process and apologize for any important absences. With this aim, Section Agriculture Development and Its Social Implications addresses the role of agriculture development and its social implications. Section 2 handles the materials and methods. Section 3 presents the results, Section 4 the different regions and systems, and Section 5 the conclusions and policy recommendations.
Agriculture Development and Its Social Implications
Numerous authors have explored the connections between agricultural transformation, particularly agricultural productivity growth, and related social developments. This extensive body of literature examines how agricultural development, achieved through increased agricultural productivity, contributes to poverty reduction [12,13,14,15], economic growth [16,17,18], enhanced food supply [19,20], and lower food prices [15,21]. The effects of agricultural growth extend beyond economic factors to include improved nutrition, better health, and education [13,16,22] beyond sectors and geographical borders.
The benefits of agricultural development transcend geographical and social boundaries. For instance, lower food prices resulting from agricultural advancements benefit not only local inhabitants but also consumers worldwide, especially the most economically vulnerable, who allocate a significant portion of their income to food [23].
A substantial body of research focuses on how these social benefits are particularly felt among the poor [17]. Hunger reduction stands out as one of the most studied and well-documented effects of agricultural development. Developing regions and countries rely on increased agricultural productivity not only for economic growth and hunger reduction but also for improved food security and rural development [14,15,24,25]. However, the impact varies based on specific local circumstances [13].
Overall, the literature consistently highlights a strong relationship between agricultural productivity growth and poverty reduction. Empirical evidence and econometric studies support this claim [15,17]. For instance, Thirtle et al. [26] found that in Asia, each 1 percent increase in crop productivity led to a 0.48 percent reduction in poverty. In India, a 1 percent increase in agricultural value added per hectare resulted in a 0.4 percent reduction in poverty in the short term and a 1.9 percent reduction in the long run due to higher wages and lower prices [27].
Furthermore, agricultural development contributes significantly to food security. Webb [19] highlights the pivotal role of the Green Revolution (GR) in bolstering food security and incomes. Nutrition improved through increased protein and energy intake [17] and diet diversification [28]. Nutritional gains varied between producers and consumers but benefited all consumers due to wider supply and higher salaries [20]. Ultimately, as Timmer [22,29] suggests, agricultural and non-agricultural development are closely linked. As a result, global undernourishment decreased during the GR decades [19].
The impact of agricultural development has been assessed and compared with other sectors. Christiaensen et al. [30] provided evidence that agricultural development has a greater capacity to reduce poverty than other sectors. In low-income countries, poverty reduction was 2.3 times larger than development in the service sector and 4.25 times greater in Sub-Saharan Africa. However, not all areas responded equally. For example, rain-fed areas in South Asia benefited from the GR more slowly [21,31], and nutritional gains might be uneven [15]. Thus, while agricultural development supports poverty reduction and food security, it is not a miracle solution.
Moving from agricultural development to dairy, two studies assess the relationship between dairy sector development and (a) poverty reduction and (b) hunger reduction [7,8]. Both publications provide quantitative evidence for the potential impact of dairy farming on eradicating hunger (and promoting a balanced and healthy nutrition) and improving welfare. Only randomized control trials and observational studies with a control group were included. The results found a causal relationship between dairy development and poverty reduction for individuals, families, and communities, as well as a positive impact on hunger reduction.
2. Materials and Methods
Changing focus to dairy sector development, we provide exclusively data-based evidence, which limited ourselves to four domains of research because of data availability: dairy sector development and (1) farmer livelihoods, (2) employment, (3) the consumption of milk and dairy products, (4) governments’ benefits. Adding other social domain evidence would be much desired, such as youth or gender impact, education, or social cohesion. However, quantitative and global databases linked to the dairy sector to verify the social implications on those areas do not exist. In our case, local or regional data is not useful, as it would prevent us from providing comparable measures worldwide.
So, we gathered existing global data and constructed indicators that were easily related to the dairy sector impact. For example, it would not make sense to link general employment in the whole economy to dairy development, but we could investigate dairy industry transformation and dairy farm employment and check the social implications of sector development.
We constructed a cross-country database gathering data on the structure of the dairy sector and related social variables. To our knowledge, it is the largest database to explore the correlations between dairy sector status and social development. It comprises over 200 countries and territories in different world regions (over 180 active ones) and over 120 variables. The observations cover all economic levels and climatic conditions. The base year is 2018. The data was homogenized and standardized for comparability purposes. Inference is applied to estimate missing observations. Public sources are also prioritized (85 percent are public). Table 1 summarizes the data sources, and the Supplementary Materials expand on the database construction.
Table 1.
Data sources.
For the literature search, we relied mainly on the Web of Science (WoS) and Google Scholar, ordering research papers by the number of citations and focusing on those published from 2010 onwards. We widened the research by a snowball approach. This procedure may have given more weight to older research due to higher citation counts.
One of the most well-documented processes in agricultural development is the Green Revolution (GR). In the GR literature, yield is commonly used to measure agricultural development—see Hazell [21], Pingali [15], Evenson and Gollin [32], and Pinstrup-Andersen and Hazell [33].
“Productivity is a measure of a performance” [34]. While, on one side there are various approaches to evaluating agricultural development, on the other side one might use multi-factor productivity measures, crop yields, and labour productivity, which are “among the key indicators used to monitor the performance of the agricultural sector” [34]. These are considered partial productivity measures, such as milk yield, which we use in this report.
Data constraints are a major limitation, especially in developing regions, allowing only limited data sophistication. By using the most elementary productivity measure (milk yield) as a development proxy, we aim to cover a wide variety of regions and conditions and identify global stylized facts to support decision making in the dairy sector. In summary, while there might be more sophisticated methods for measuring performance, we maintain a simple approach and use yield as a direct and readily available worldwide statistic for global database construction.
We aim to find stylized facts [35] on dairy development’s social impact. Kaldor, in 1961, was the first to introduce the term ‘stylized facts’ as summary of the relevant facts or a ‘stylized view of the facts’ [36]. This is, focusing on the ‘broad tendencies and ignoring the individual detail’ [36]. The concept is related to an empirical pattern and ‘a stylized fact must be true in general but not necessarily in every case’ [37]. This is, we might observe a general regular trend, but a particular country might not follow it. Michler [38] notes that stylized facts help set the development policy agenda and provide evidence to support stakeholders, investment, and policy decisions.
In line with Michler [38], we use non-parametric techniques to extract the evidence on global patterns in the dairy sector based on the constructed dataset. We use LOESS, a descriptive technique which stands for ‘locally estimated scatterplot smoothing’ to describe possible patterns between the milk yield evolution and the related social variables. LOESS application is a strategy for fitting smooth curves to empirical data for exploration and analysis in the social sciences and is of particular interest in behavioural data. In essence, its character is descriptive. LOESS is non-parametric in the sense that the descriptive graphical pattern is obtained empirically; it does not require an a priori specification about the nature of any structure/relationship that may exist within the data. “The distinctive feature of this procedure is that it allows the data to speak for themselves” [39]. It is a convenient visualization of patterns in the social variables, which avoids making any assumption on the functional form to be estimated—“data itself informs the resulting model in a particular manner” [39,40,41,42].
We estimate the mean and variance of each variable over changes in milk yield using local polynomial regressions [41,42,43]. This provides a graphical representation of the form (mean and 95 percent confident interval for each level of milk yield) and describes changes in the studied variables over yield changes [40]. The use of local polynomial regressions brings some advantages, including correctly identifying the true underlying structure of the data and the focus on local particularities inherent in the data [39,41]. For more information about the LOESS tool, refer to Cleveland [42], Cleveland and Devlin [43], and Jacoby [39].
We conducted a series of comprehensive multivariate analyses to examine how various factors influence socio-economic development. Using a multivariate analysis of variance (MANOVA) and principal component analysis (PCA), we evaluated the significance of geographic, economic, and ecological conditions on social outcomes. Additionally, we performed univariate ANOVAs to assess the effects on each indicator individually.
3. Results
To assess the similarity or dissonance between the social impact of agriculture and dairy sector development, we begin with the assessment of 14 social variables across four domains for which global data is available in the dairy sector domains (farmer livelihoods, employment, consumers, and governments’ benefits). We review the existing literature on these 14 variables within the context of agricultural development and compare them with the data-driven typical patterns from the dairy sector.
Table 2 summarizes both the agricultural development references on social impact and dairy sector stylized facts from the assessment of 187 countries across the world. They include observations covering all development levels, socio-economic developments, climatic conditions, and agricultural systems.
Table 2.
Agriculture development literature and dairy and socio-economic development stylized facts.
We start with the first domain, which concerns farmer livelihoods and agricultural development, and the two identified relationships.
3.1. Farmers’ Livelihoods
- Stylized fact no. 1. Decreasing presence of dairy farm households in population.
There is limited literature on the global prevalence of farmers and household members in society in relation to agricultural development, with no references found regarding farmers per capita in society. European data signals a decreasing number of farmers [44]. The global evidence on stylized fact no. 3 (decreasing farm employment) also indicates a smaller share of farmers in society. In 2014, the FAO’s “The State of Food and Agriculture” focused on family farmers, smallholders, and agricultural farms, noting stable agricultural holding numbers [76]. A background paper commented on increasing holdings from the 1960s to the 1990s in low- and middle-income countries [45,77]. Even under such considerations and in the context of a growing population, a declining share of dairy farm households is plausible.
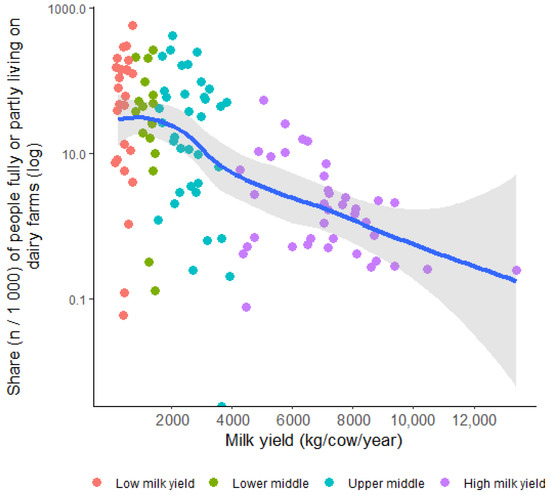
Figure 1 is a scatterplot showing the share of people living in dairy farm households (per thousand inhabitants) and milk yield (kg/cow/year). Each point represents a different country, with different colours indicating different milk yield levels. The horizontal axis represents dairy sector development (milk yield), and the vertical axis represents the social variable being assessed. The curve and the 95% confidence interval indicate a typical pattern that dairy sector development may relate to a decreasing presence of dairy farm households in the general population.
Figure 1.
Share of people living in dairy farm households (per thousand inhabitants) and milk yield per animal. Source: own elaboration based on 2018 cross-country data. Line corresponds to mean (and 95% confidence interval) for that level of yield. We used local polynomial regressions.
An observed decrease in the prevalence of dairy farming within society seems to be, at least plausibly, aligned with the trends in general agriculture.
- Stylized fact no. 2. Higher income for dairy farm households.
There is extensive literature linking agricultural development (yield increases) with rising income and poverty reduction. Pinstrup-Andersen and Pandya-Lorch [46] highlight productivity increases as a factor in raising small farmers’ income. In developing countries, Mozumdar [14] links increased agricultural productivity with improved rural livelihoods, food security, and poverty reduction. In rural India, Datt and Ravallion [47] found that higher farm yields increased real wages and lowered food prices, raising living standards. They noted that the short-term effects were smaller than the long-term effects. They compared the gains with respect to the poverty line and found a reduction in poverty both above and below the poverty level (gains not limited around the poverty line but going further), with a stronger gain above the poverty line. Instead, Christiaensen et al. [30] found that agricultural development more effectively reduced poverty among the poorest populations.
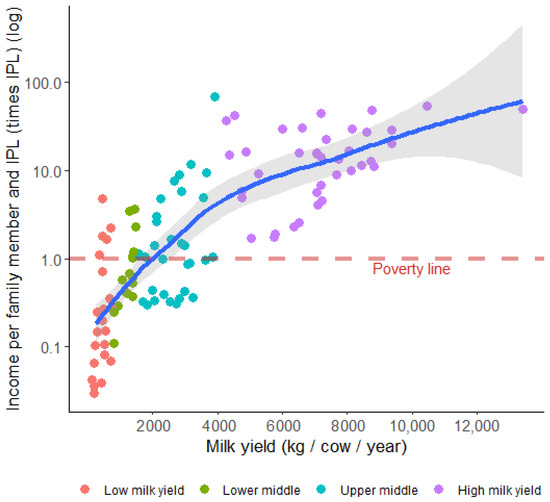
Figure 2 shows the relationship between dairy sector development (milk yield) and dairy farm income per family member (relative to the international poverty line). Global data indicates a positive relationship between dairy sector development and farmer income, both above and below the poverty line.
Figure 2.
Dairy farm income per family member in relation to the international poverty line and milk yield per cow. Source: own elaboration based on 2018 cross-country data. Line corresponds to mean (and 95% confidence interval) for that level of yield. We used local polynomial regressions.
The evidence on farm income and agricultural development is aligned with Figure 2’s dairy sector stylized fact. However, national observations might differ at some stage from the global findings.
3.2. Employment
- Stylized fact no. 3. Higher milk yield correlates with fewer people working on dairy farms.
The labour shift from agriculture to other sectors is common in development literature. Kuznets [48] found that as economies develop, the agricultural share of GDP and employment share diminishes (see also Timmer [29]). Hazell [49] describes how higher yields initially increase on-farm employment, followed by labour displacement due to mechanization. Lipton and Longhurst [50] found a similar trend with the GR. Irz et al. [13] reported both job creation on the land and labour displacement depending on the technology used. Eurostat [44] data indicates a decreasing trend in farm employment.
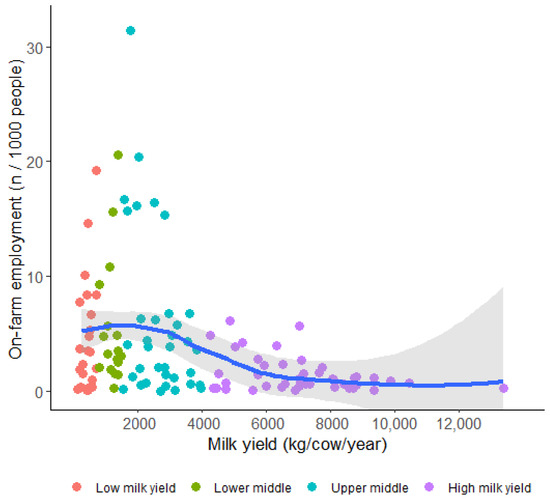
Figure 3 shows a pattern in the proportion of people employed in dairy farms relative to sector development. As the dairy sector develops, the proportion of on-farm workers shows a changing tendency, initially increasing, to decrease and stabilize later.
Figure 3.
Share of people employed on dairy farms and milk yield per cow. Source: own elaboration based on 2018 cross-country data. Line corresponds to mean (and 95% confidence interval) for that level of yield. We used local polynomial regressions.
In summary, existing evidence for the agricultural sector is aligned with stylized fact no. 3. There are several factors behind this phenomenon. As mentioned in a report by the FAO [3] with a specific focus on automated agriculture, “historically, as countries develop, more attractive jobs draw workers away from agriculture, and labour-saving innovations increase agricultural productivity by reducing labour requirements per unit of output”; as a result, the share of people employed in agriculture declines. Not only is there a technological factor behind this fact, but social preferences such as the unattractiveness of agriculture as a career or simply moving to higher-paid jobs are also important considerations [3]. Indeed, Gollin [51] depicted a similar scatterplot to Figure 3 but for the agricultural workforce share vs. general economic development, using Heston et al. [52] data.
- Stylize fact no. 4. Rising farm labour productivity.
The literature on agricultural development and labour productivity increases is well documented. Dorward [53] links agricultural revolutions with higher labour productivity. Many authors provide empirical evidence of growing agricultural labour productivity, particularly in Asia [51,54]. Yangfen et al. [55] provide evidence for China.
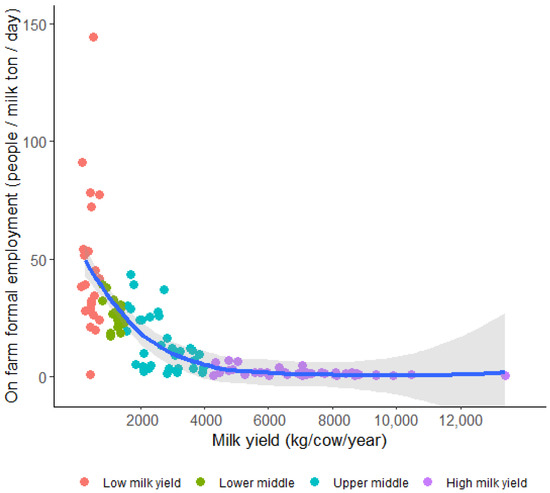
Figure 4 shows the relationship between dairy sector development (productivity gains) and labour productivity (people employed per ton produced; the lower the ratio, the higher the labour productivity). It depicts a positive relationship between productivity gains from production and labour.
Figure 4.
Number of people employed in dairy farms per tonne of milk produced and milk yield per cow. Source: own elaboration based on 2018 cross-country data. Line corresponds to mean (and 95% confidence interval) for that level of yield. We used local polynomial regressions.
According to the data and the literature, both labour productivity in the agricultural sector and in the dairy subsector would rise when sector yields improve.
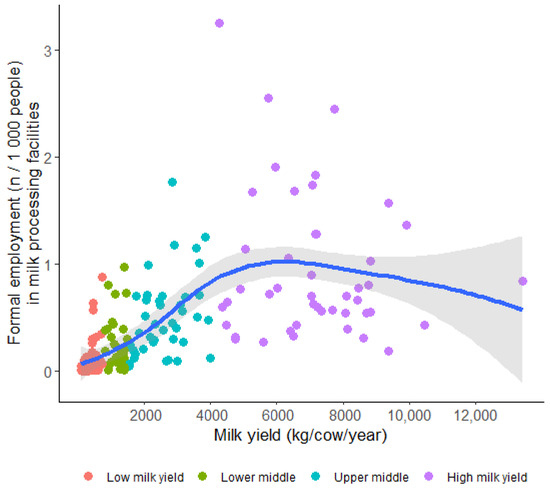
- Stylized fact no. 5. Employment in dairy processing facilities (pervasiveness, share in population) first rises, then declines and stabilizes as the sector matures.
As commented on in stylized fact no. 3 (Figure 3), Lipton and Longhurst [50] reported an initially increasing and later decreasing trend for agricultural employment vs. agricultural development. Irz et al. [13] noted that agricultural growth creates jobs upstream and downstream of the farm and food chain, particularly in areas with strong rural–urban links and existing infrastructure. Labour-substituting technologies may decrease employment shares. From a broader perspective outside agriculture, Herrendorf et al. [56] find a similar structural pattern in the share of manufacturing employment and general economic development.
Figure 5 shows the relationship between dairy sector development (milk yield) and the share of people working in milk processing facilities (per thousand people). Employment increases, stabilizes, then decreases.
Figure 5.
Formal employment in milk processing facilities and milk yield per cow. Source: own elaboration based on 2018 cross-country data. Line corresponds to mean (and 95% confidence interval) for that level of yield. We used local polynomial regressions.
The existing agricultural literature seems to support a parallel development of stylized fact no. 5 for the dairy industry.
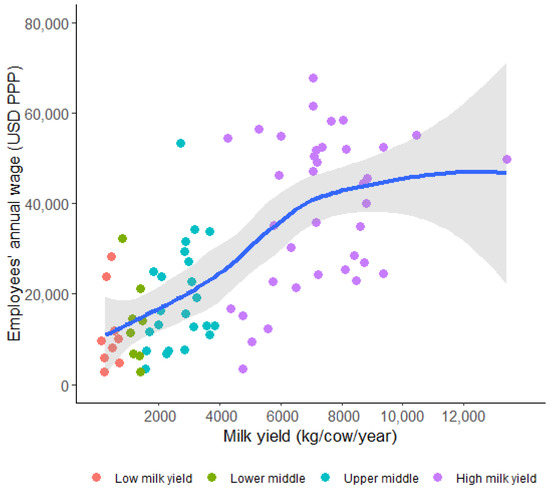
- Stylized fact no. 6. Wages in milk processing increase with sector development.
According to Hazell [49], “agricultural growth generates important income and employment multipliers within the local non-farm economy”, and those multipliers might be high for wages in the non-farm economy. Agricultural technological change has the potential to create significant new employment opportunities and higher wages in the non-farm economy. Irz et al. [13] also note that agricultural productivity growth can trigger higher non-farm incomes, with some exceptions.
Figure 6 shows a positive relationship between wages in dairy processing and dairy sector development.
Figure 6.
Employees’ wages in milk processing facilities and milk yield per cow. Source: own elaboration based on 2018 cross-country data. Line corresponds to mean (and 95% confidence interval) for that level of yield. We used local polynomial regressions.
Stylized fact no. 6 is aligned with agricultural development and downstream wage increases.
3.3. Consumers
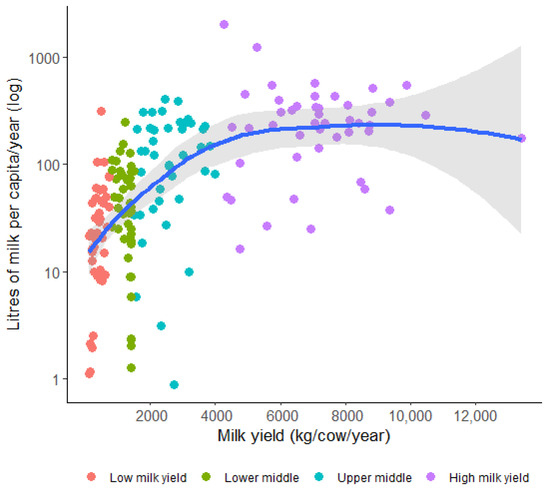
- Stylized fact no. 7. Milk supply per capita increases, as the sector develops.
Availability is considered as the first step towards food security. Previous work found a clear connection between increased agricultural productivity and food security in the following three aspects: availability, access to food, and enhanced dietetic value [14]. A large body of literature associates agricultural development with an enhanced food supply [15,19,20,57,58].
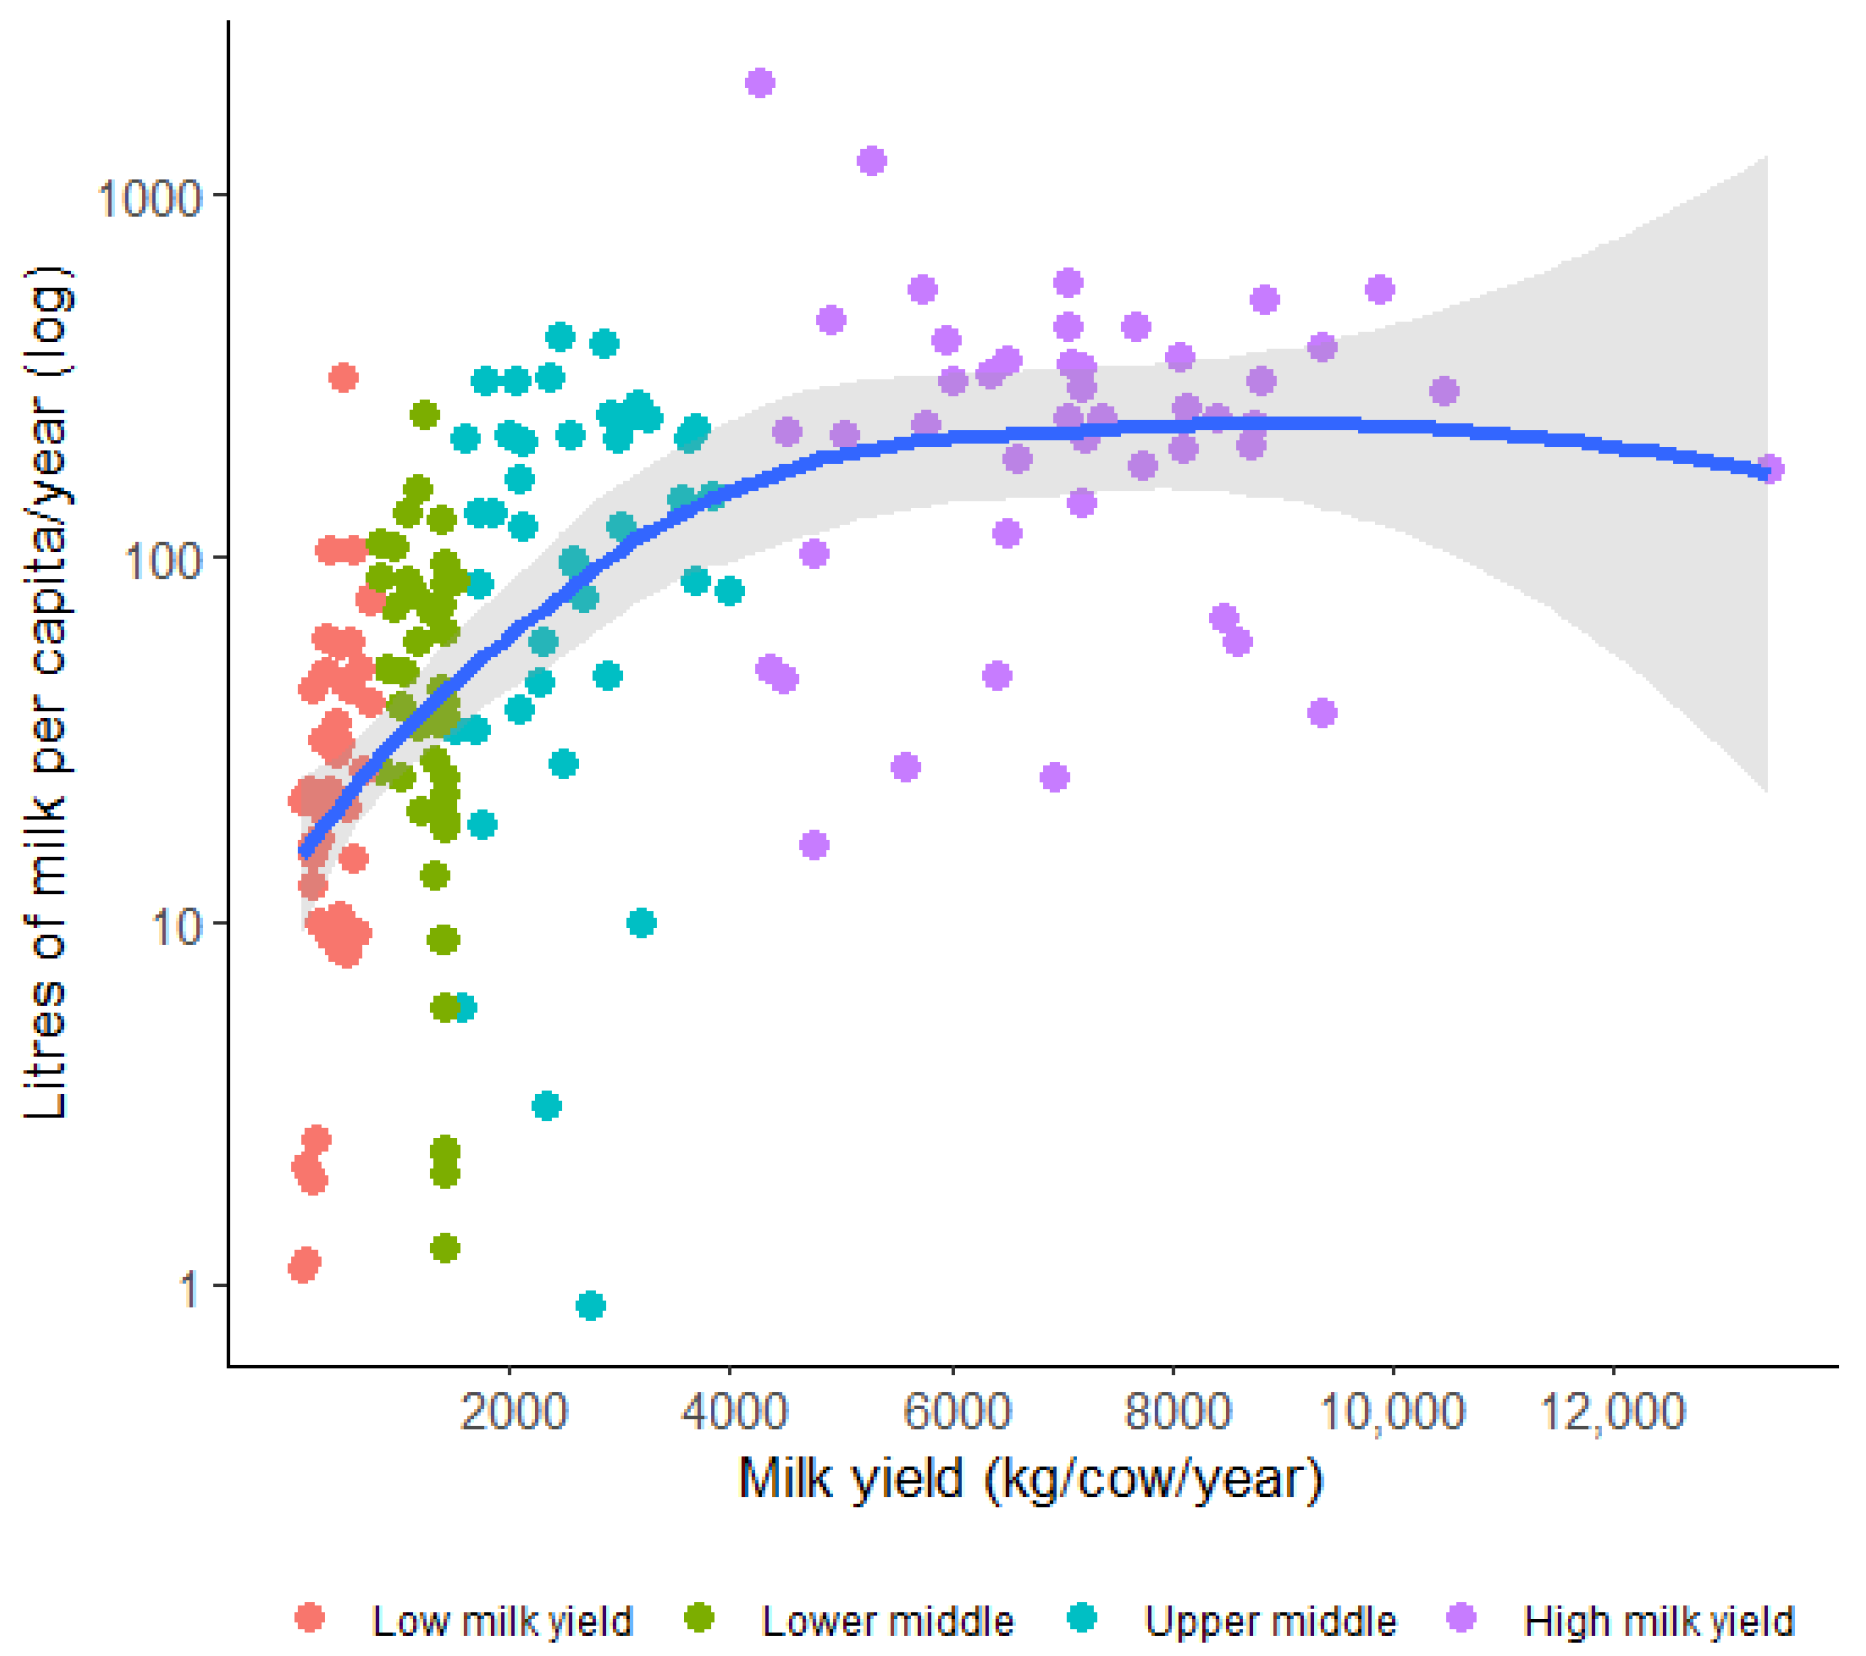
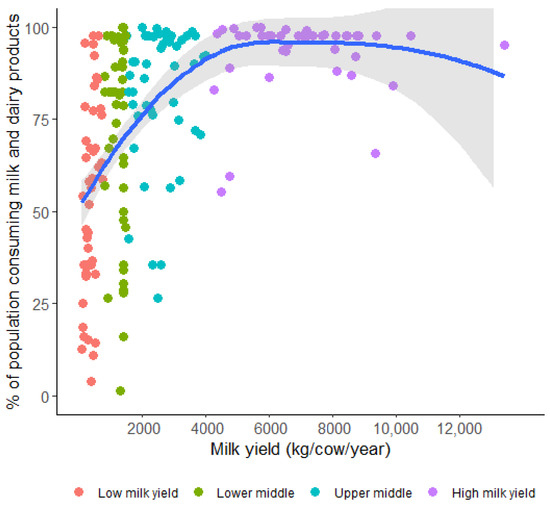
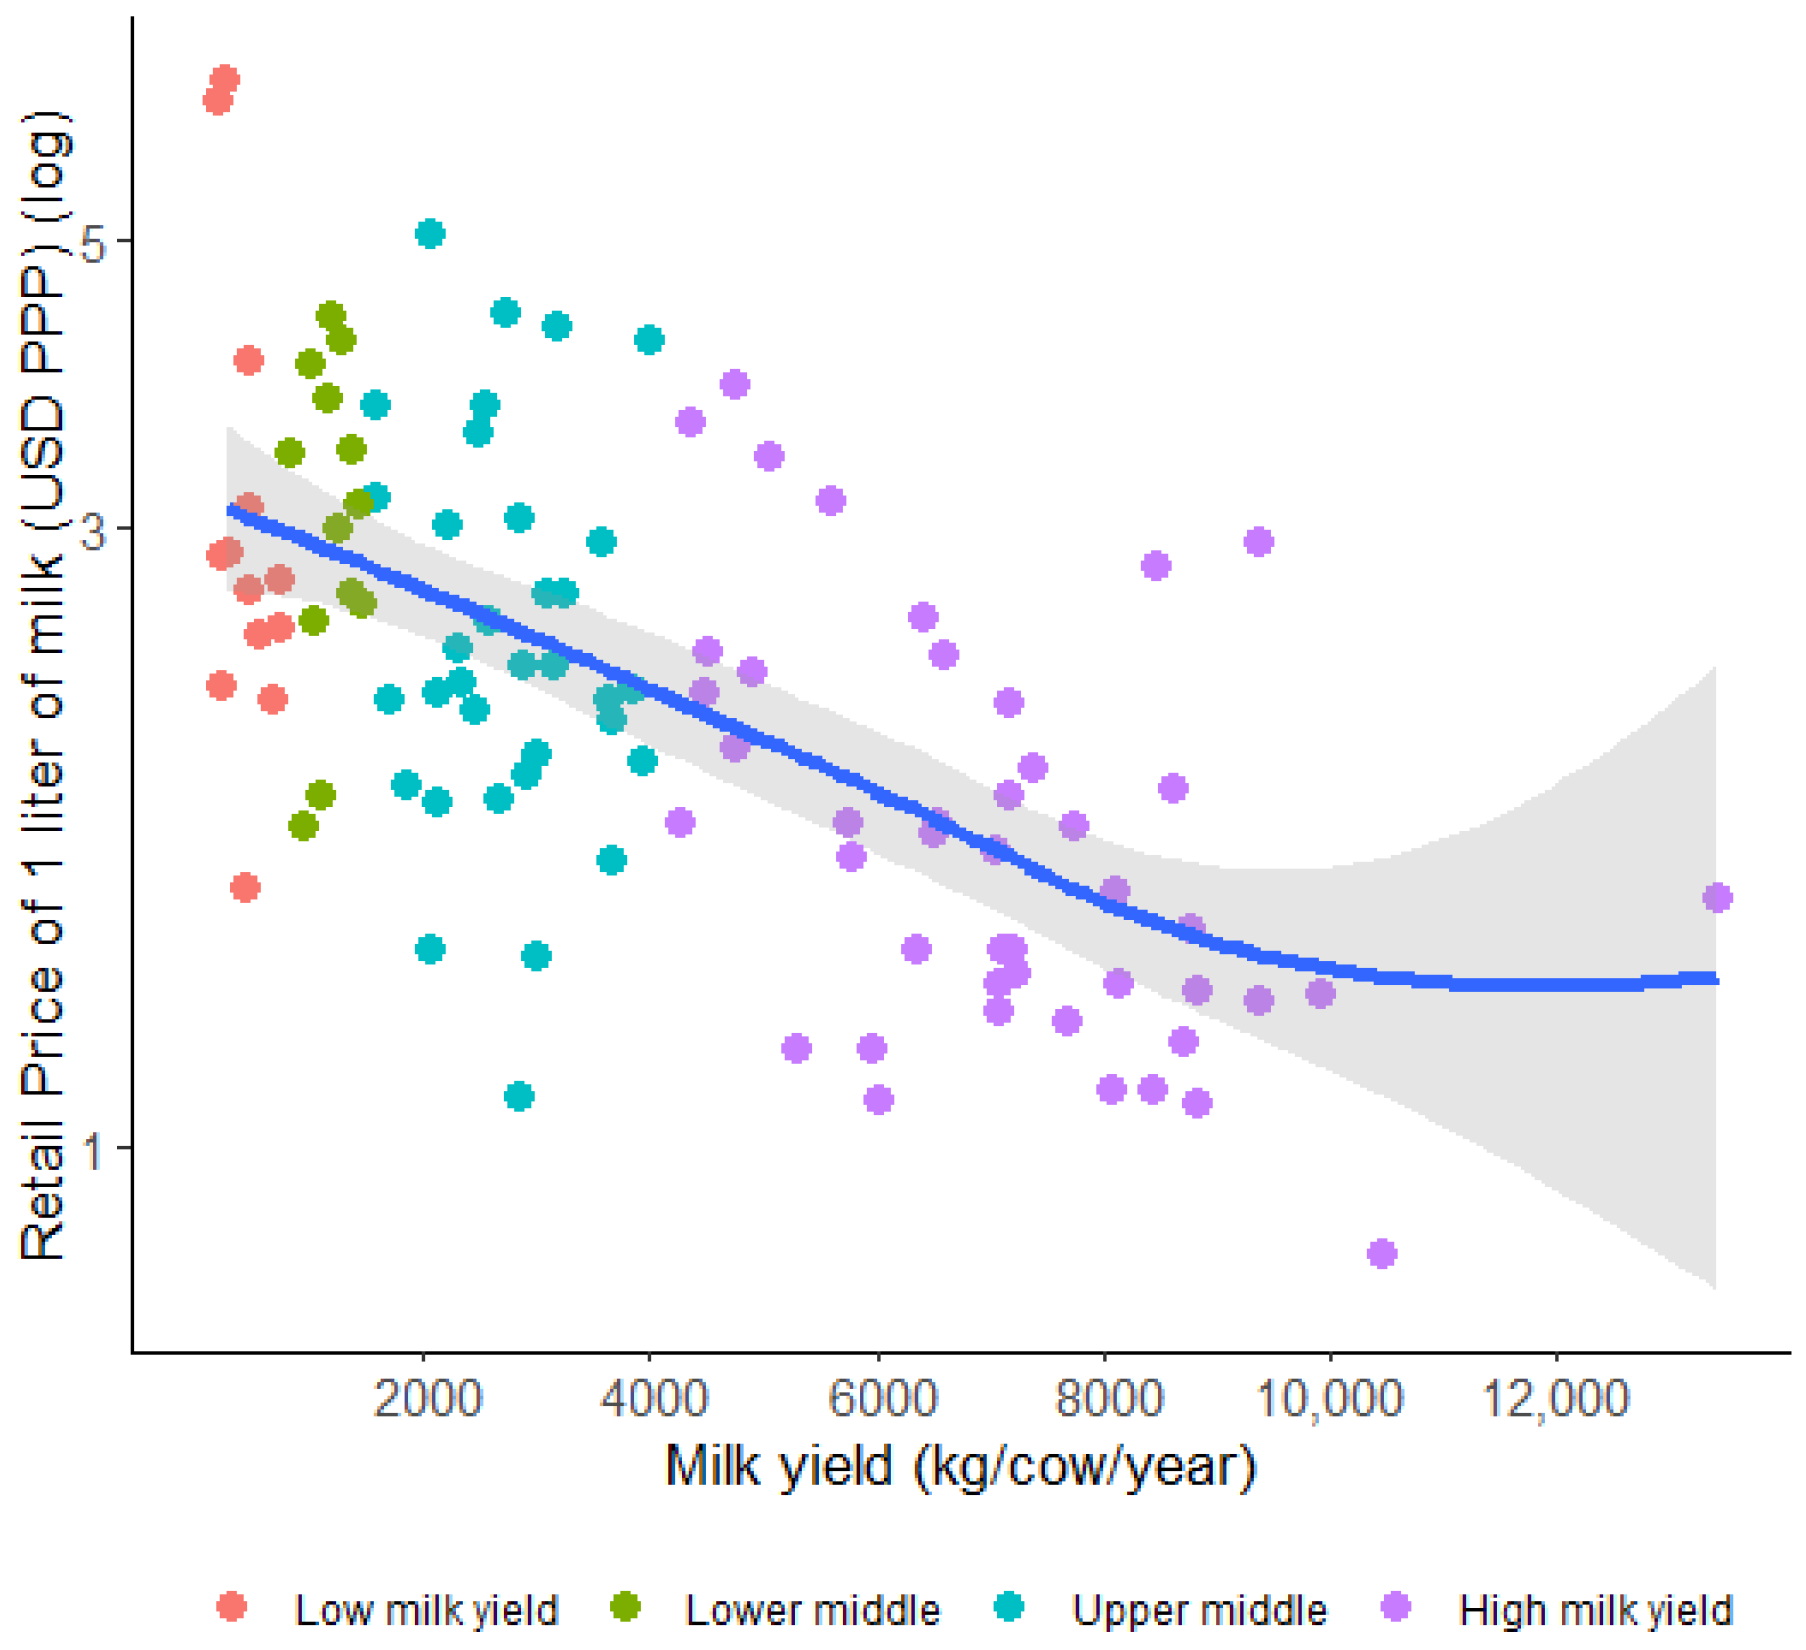
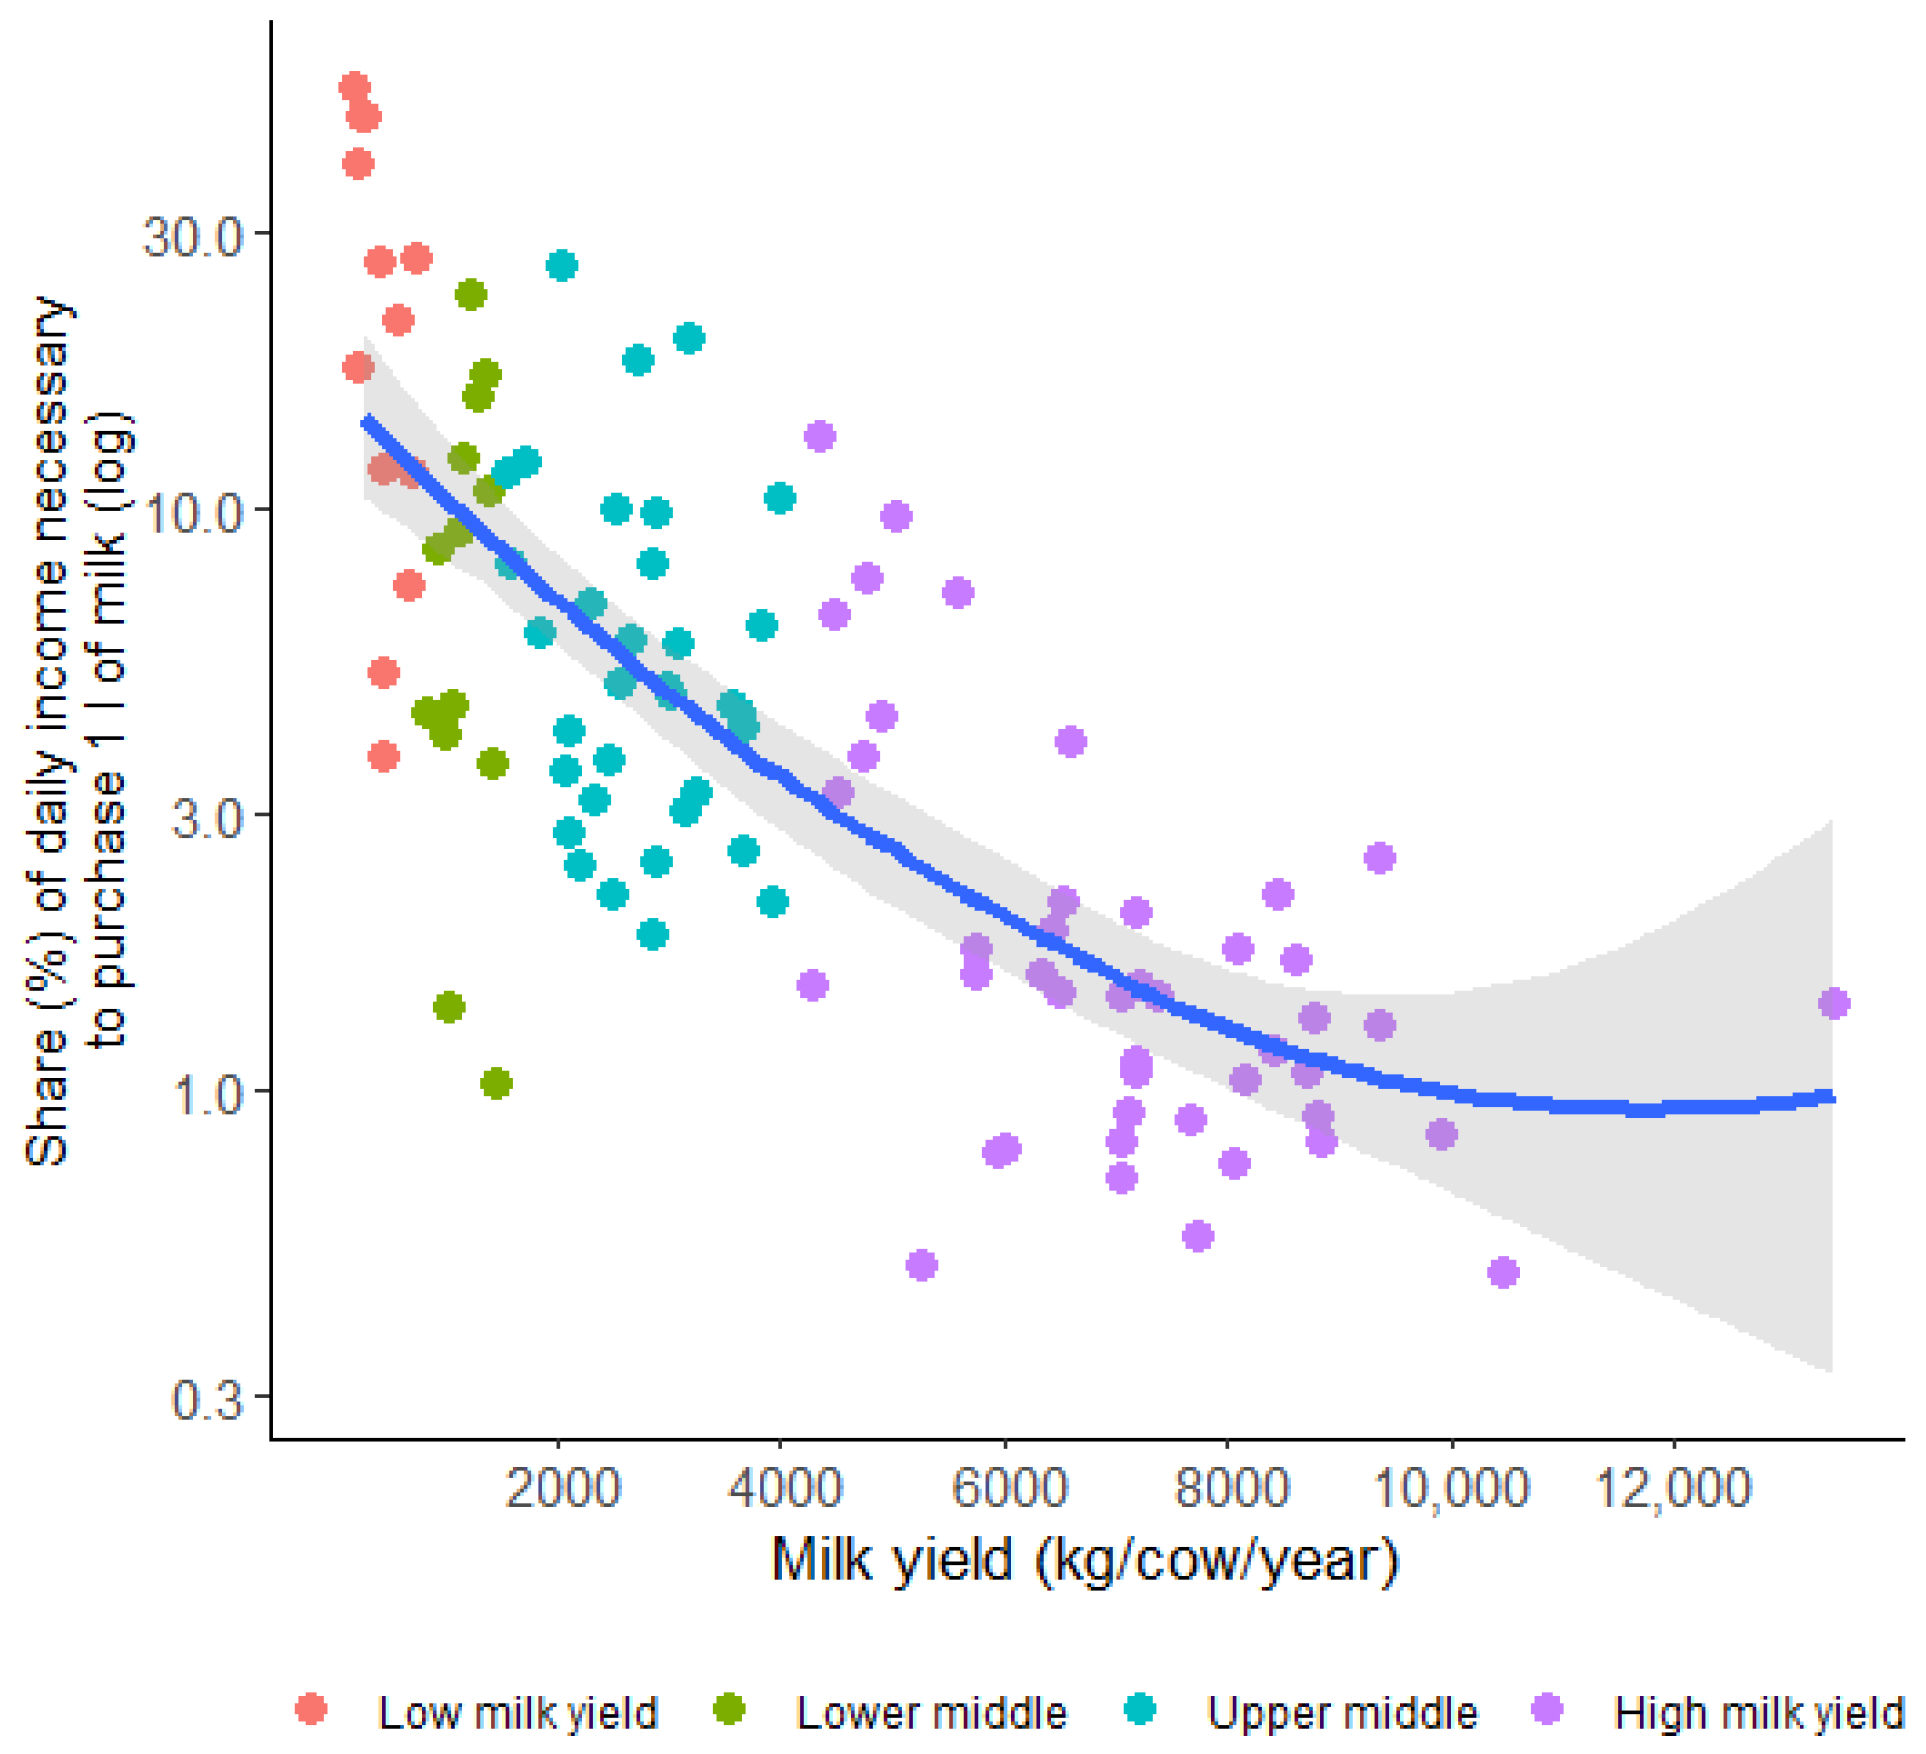
Figure 7, Figure 8, Figure 9 and Figure 10 illustrate increasing benefits for consumers as the dairy sector develops: availability, access, lower prices, and major affordability. Figure 7 depicts an increasing food supply (milk supply per capita) as the dairy sector develops. In this global pattern, the gains are steeper for lower levels of development (lower yields) and soften as the sector is more developed.
Figure 7.
Milk supply per capita and milk yield per cow. Source: own elaboration based on 2018 cross-country data. Line corresponds to mean (and 95% confidence interval) for that level of yield. We used local polynomial regressions.
Figure 8.
Share of people consuming dairy products and milk yield per cow. Source: own elaboration based on 2018 cross-country data. Line corresponds to mean (and 95% confidence interval) for that level of yield. We used local polynomial regressions.
Figure 9.
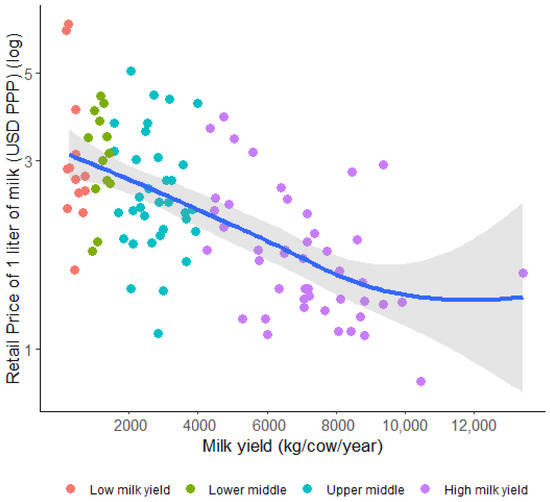
Milk price and milk yield per cow. Source: own elaboration based on 2018 cross-country data. Line corresponds to mean (and 95% confidence interval) for that level of yield. We used local polynomial regressions.
Figure 10.
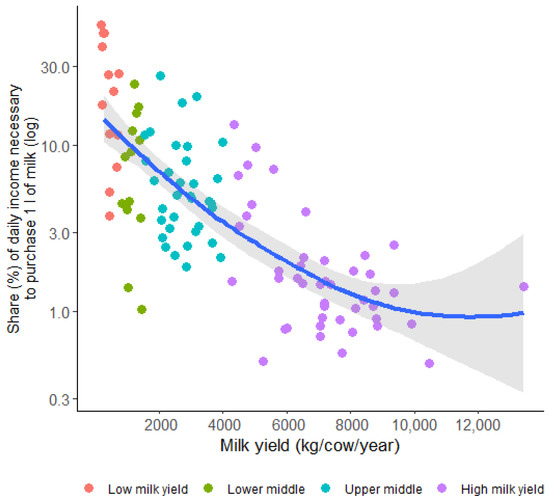
Share of income needed to purchase 1 l. of milk and milk yield per cow. Source: own elaboration based on 2018 cross-country data. Line corresponds to mean (and 95% confidence interval) for that level of yield. We used local polynomial regressions.
We find again a similar pattern in the dairy sector mirroring the agricultural sector.
- Stylized fact no. 8. More people access and consume dairy products.
Globally, agricultural development is positively related to food access and consumption. Barrett [16] highlights agricultural productivity growth and its nutritional impact: from hunger escape to broader access to a satisfactory diet. In this process, countries (and people) improve their nutritional status. Lipton [59] notes improved (often and stable) access to food thanks to agricultural growth. Regionally, raising agricultural yields in Africa are seen as a cornerstone to enhanced food security [60]. Furthermore, among Nigerian households, data-driven research found that experience-based indicators also improved for (i) preferred foods, (ii) widening the variety of food, (iii) increasing portion sizes [61].
Once full food access for a population is achieved, consumers might decide to diversify or change their consumption habits. Globally and historically, one can observe a higher food energy availability trend, followed by changes in the composition of the diet. First, populations increase energy intake (“expansion”), and secondly, they experience food “substitution” [62].
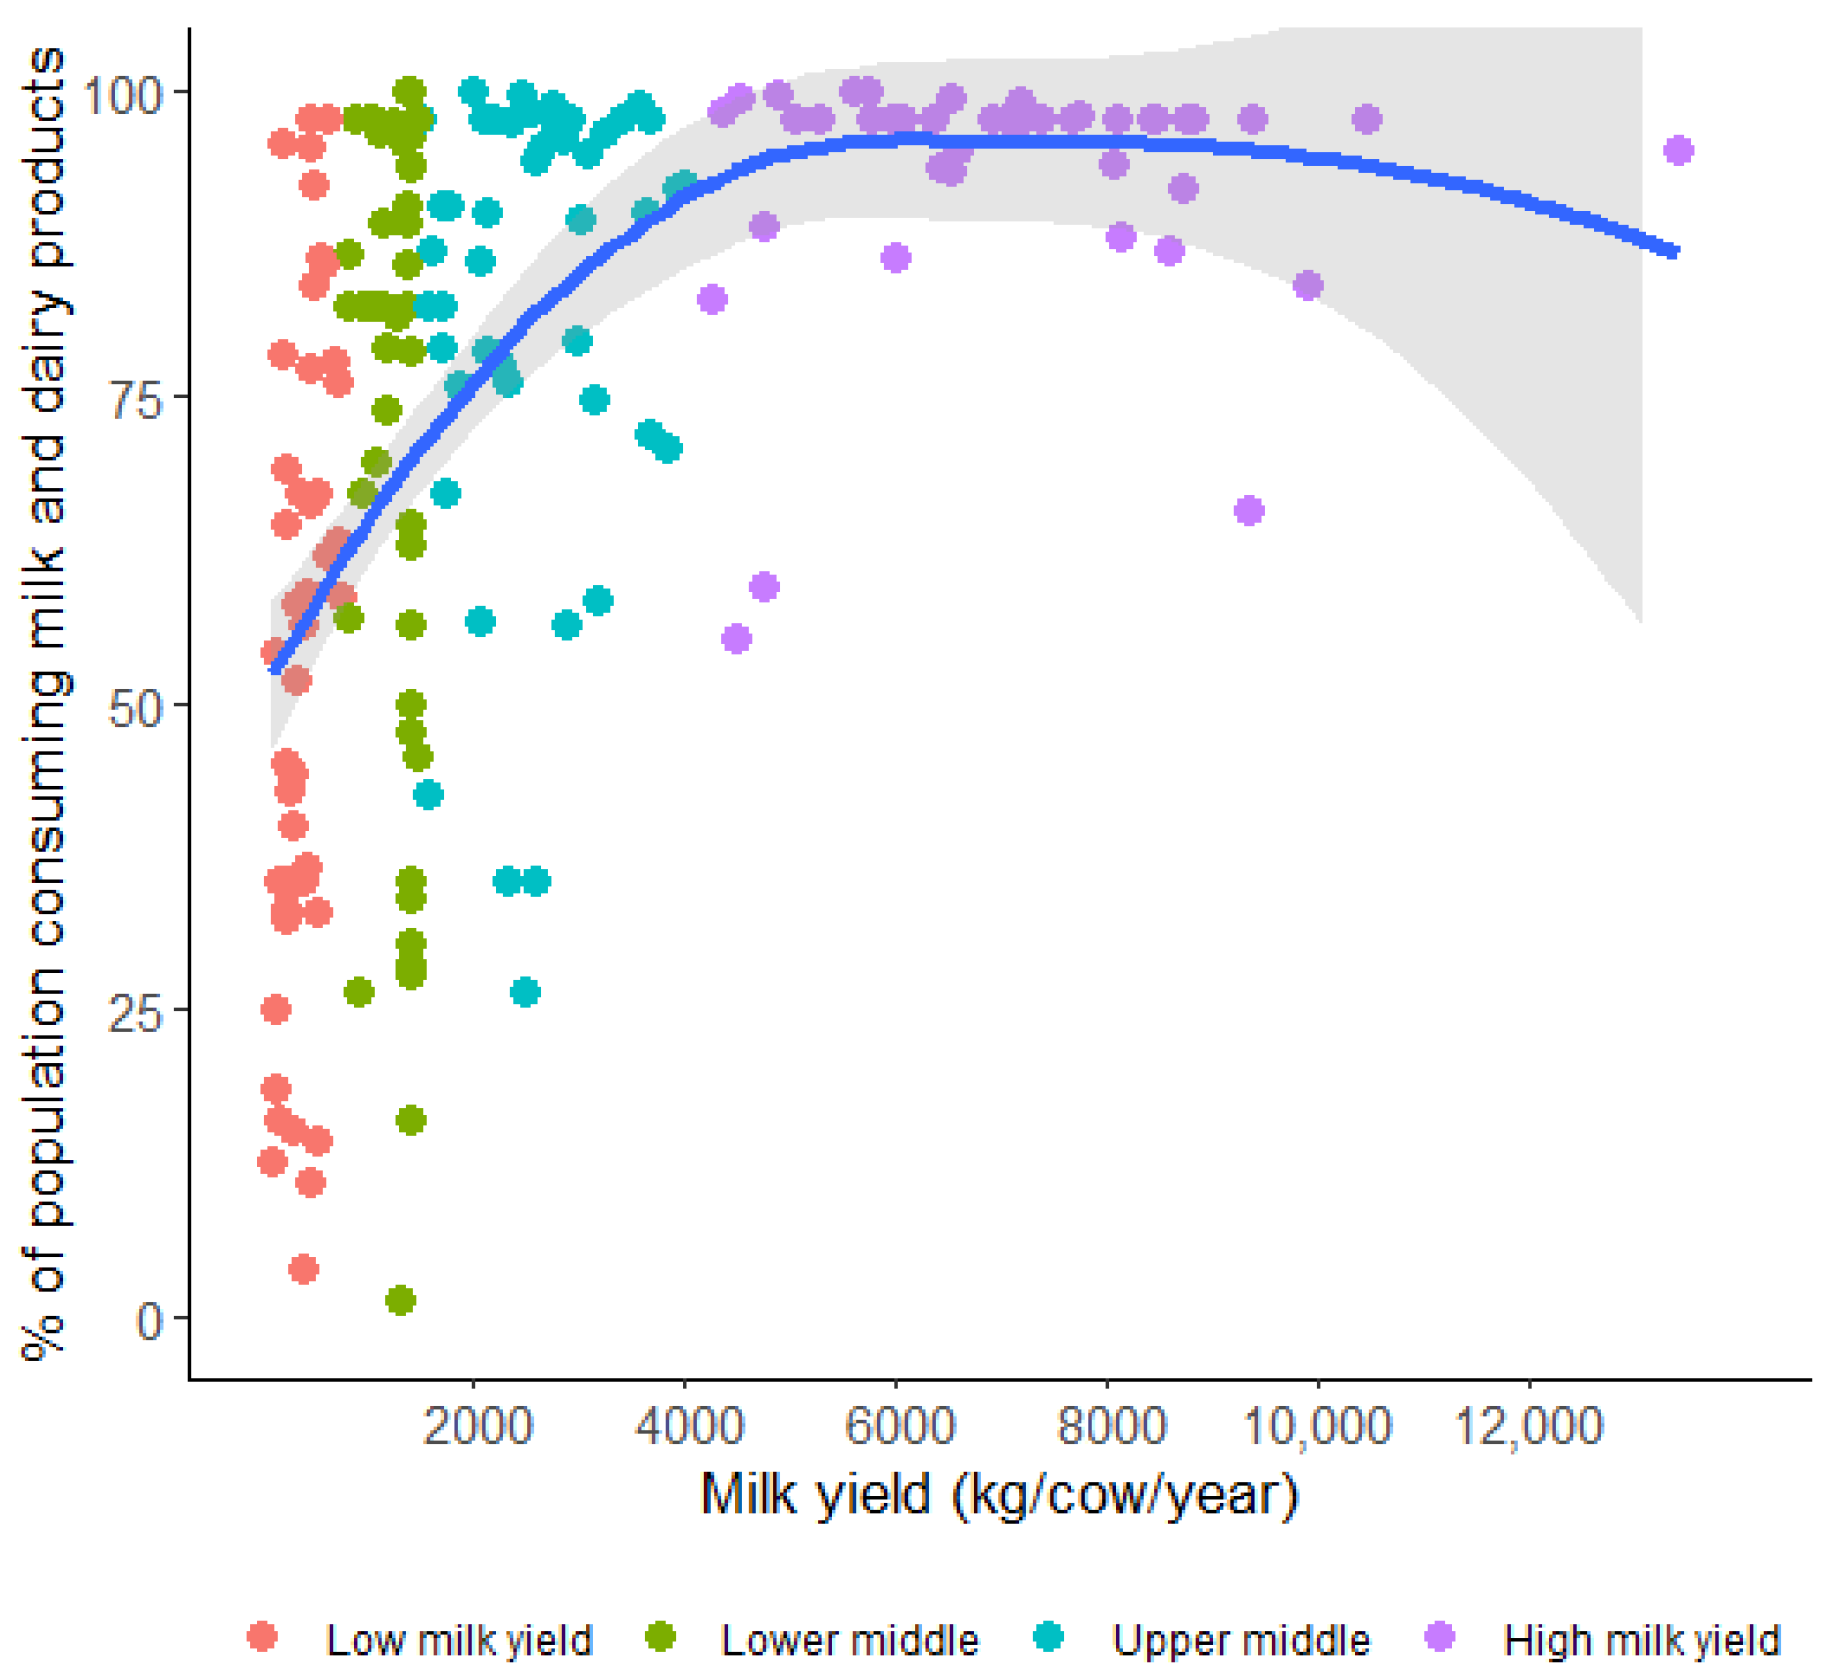
Global access to milk consumption is depicted in Figure 8. As the dairy sector develops (horizontal axis, higher yield is achieved), more people access dairy products. Here, a higher share of consumers corresponds to increased access to food in the population. Food access gains are steeper for lower levels of sector development and softens (even reduces) as it approaches full population access to dairy. Indeed, while milk consumption rises in some developing countries, in other developed countries, such as the USA, milk consumption declined while carbonated beverage and juice consumption rise [62,78,79].
As we will show in the following stylized fact, the greatest beneficiaries from agricultural development are consumers, thanks to low prices [16]. This situation would result in a plausible rise in the share of the population accessing and consuming food.
- Stylized fact no. 9. Greater benefits for consumers through lower prices.
The literature on agricultural development indicates that agricultural development is associated with lower food prices. Both larger supply and lower prices are broadly mentioned in the literature. Barrett [16] makes a summary of empirical evidence on technical change in agricultural development and finds that consumers obtain greater welfare gains thanks to lower prices, rather than the producers. Pingali [15] shows how higher agriculture productivity through improvements in crop germplasm not only reduced poverty but also lowered food prices. For Irz et al. [13], the decline in the real cost of food for the whole economy is a strong poverty reduction instrument linked to agricultural productivity growth. Also, Dorward [53] highlights fallen relative prices when monitoring agricultural productivity change.
Figure 9 depicts the reduction in the retail price of milk as the dairy sector develops (horizontal axis—milk yield). Milk prices are shown as the retailer prices in comparable international dollars. In light of the literature, stylized fact no. 9 is supported by the evidence observed in the general agricultural sector.
- Stylized fact no. 10. More affordable milk as the sector develops.
Affordability “is the cost of the diet relative to income” [63]. Agricultural productivity gains remain at the core of the policy options to enhance the affordability of healthy diets [63], and are needed to reach food cost reductions and greater affordability [64]. Additionally, previously cited evidence on diminishing prices (see stylized fact 9) and growing income (stylized facts 6 and 2) would support affordability enhancement and agricultural development.
Figure 10 shows the increasing affordability of milk as the dairy sector develops (a decreasing share of income needed to access food). The vertical axis shows how much of a person’s daily income in different countries worldwide would be needed to purchase a litre of milk.
3.4. Governments’ Benefits
In this section, we portray formal government conditions as the agricultural/dairy sectors develop (measured by higher yields).
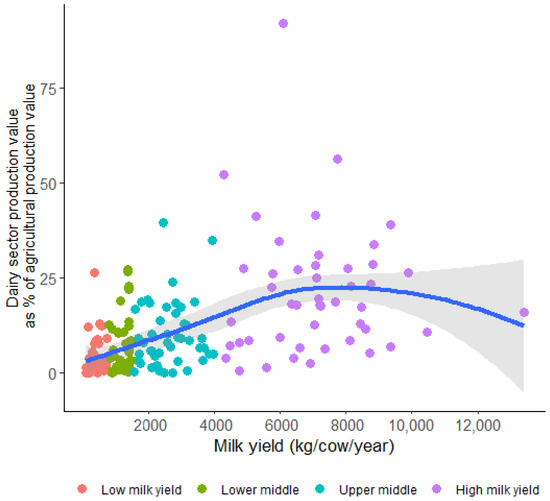
- Stylized fact no. 11. Dairy’s contribution to agricultural value addition increases with sector development.
As Hazell [21] signals, regarding agricultural development, the “contribution to national GDP is higher than ever in absolute terms; it is only less important in relative terms.” Being true for the agricultural sector, it might also be true for a subsector such as dairy.
However, the variable to study is the share of agricultural added value (agricultural GDP). Thus, when our goal is to compare subsector (dairy) development with supersector (agriculture) development, we should examine the changes in activity within the agricultural sector to assess the plausibility of the observed trend. Blanco and Raurich [65] found that development encourages farmers to move from less to more capital-intensive products in agriculture. The transformation in agriculture has led to greater product specialization, from traditional to high-value products, such as livestock products [54,66].
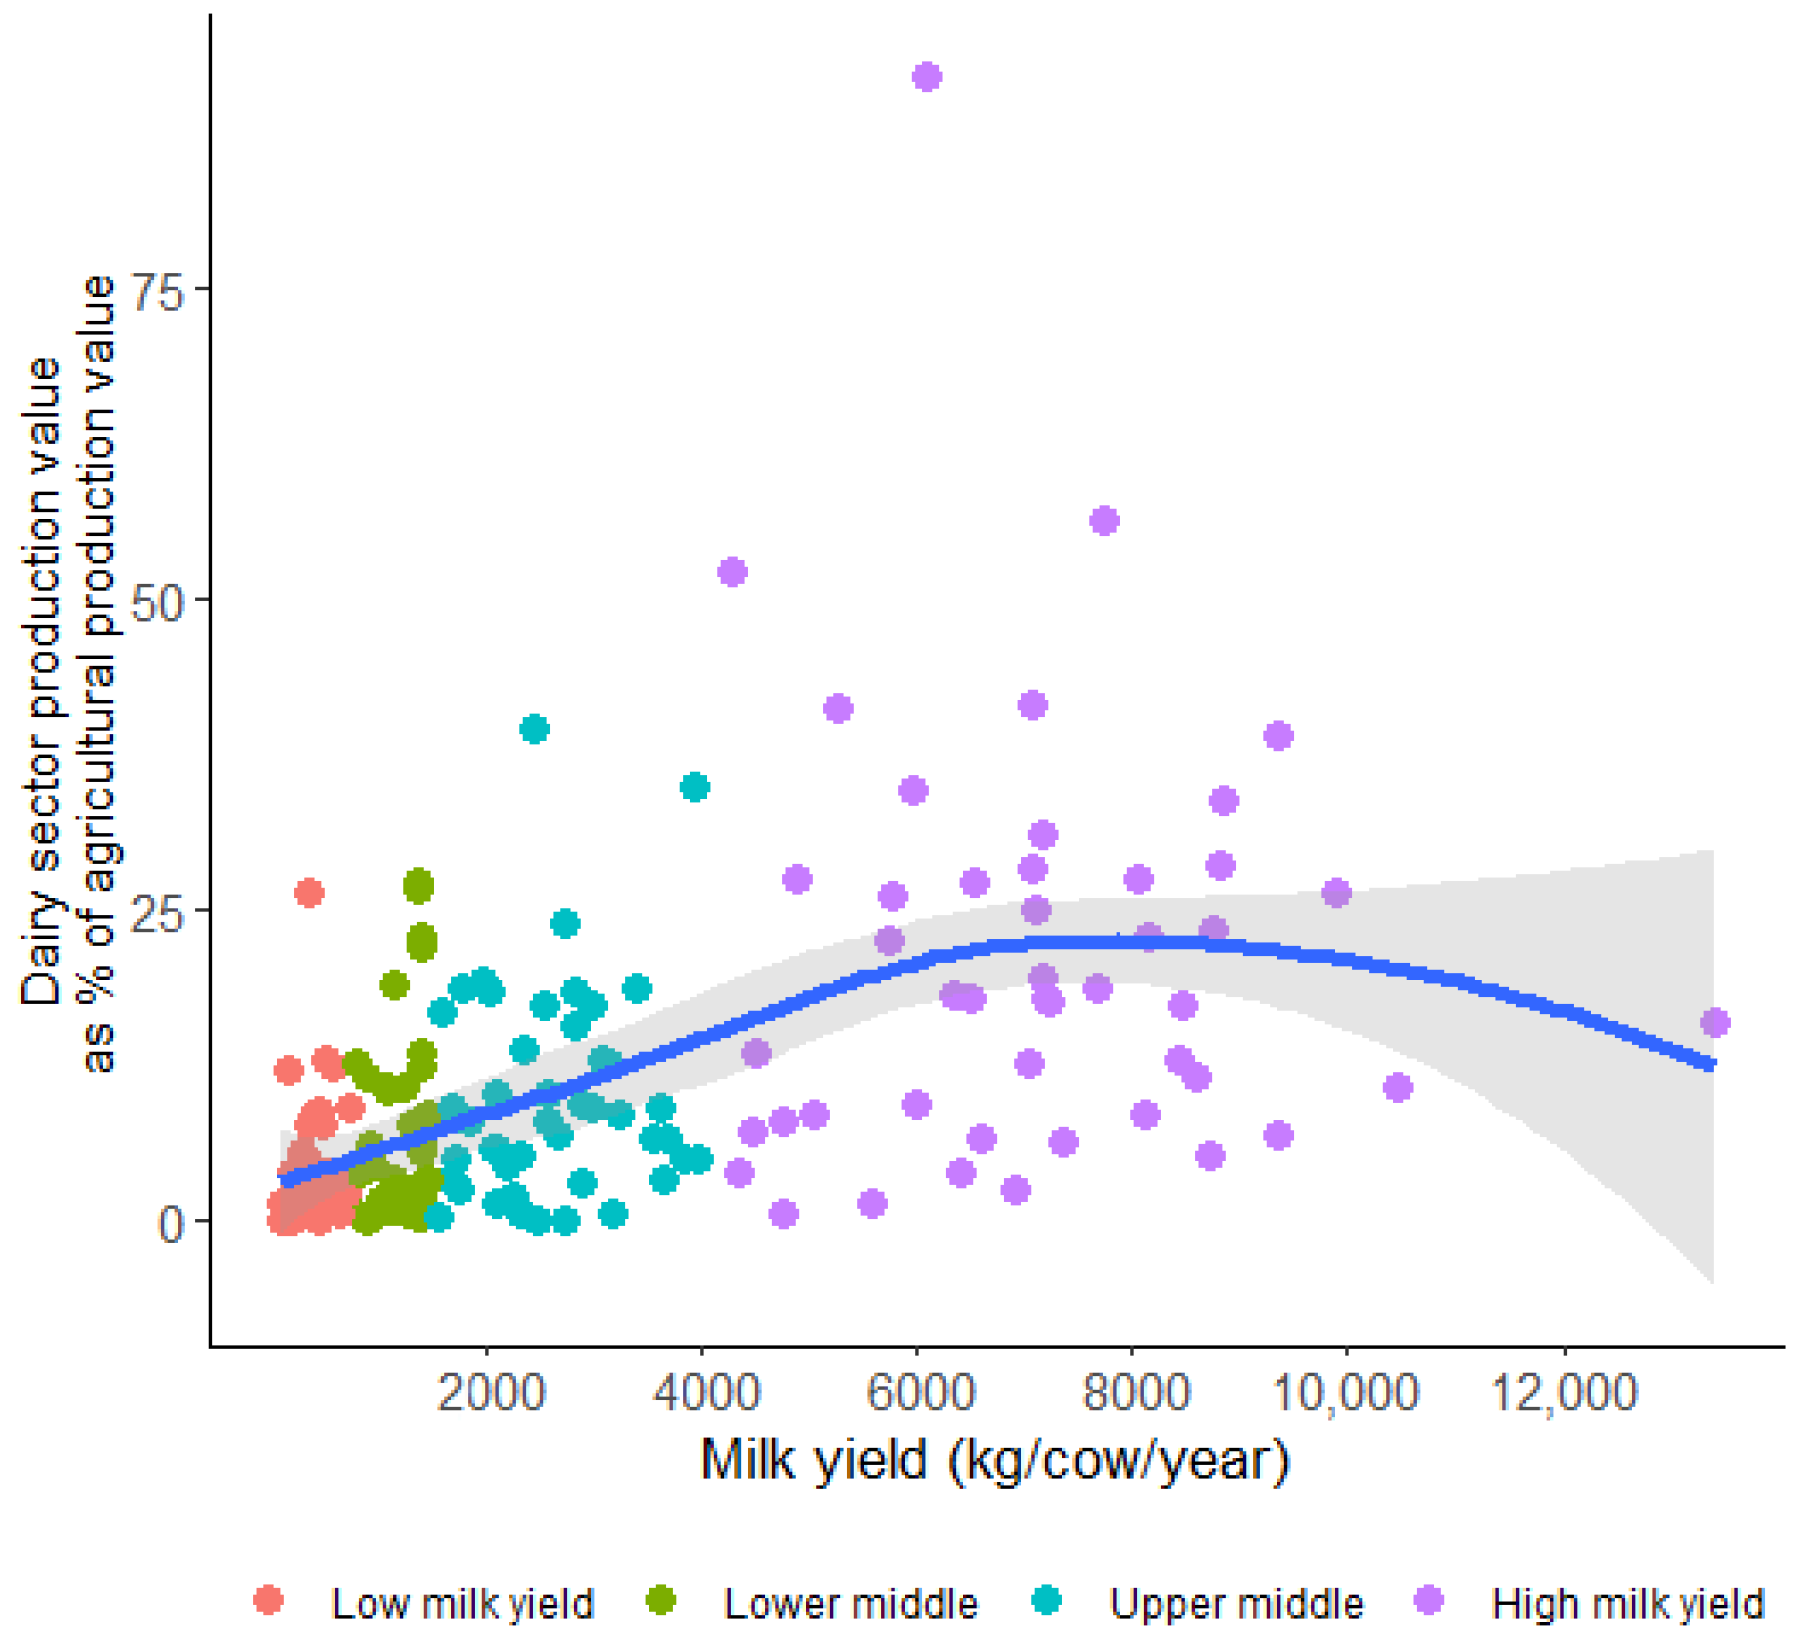
Figure 11 illustrates the share of dairy value within agricultural production. The relationship is generally positive (dairy‘s value increases within the agricultural sector) up to a saturation point. Figure 11 shows that the dairy sector contributes more to agricultural value as the dairy sector develops (up to 8000 kg/cow/year). This movement represents the growing importance of the dairy sector in agriculture, which is aligned with the literature in agricultural output composition and transformation. Figure 11 also shows stabilization and decrease for higher levels of dairy development.
Figure 11.
Share of milk production on agricultural value and milk yield per cow. Source: own elaboration based on 2018 cross-country data. Line corresponds to mean (and 95% confidence interval) for that level of yield. We used local polynomial regressions.
Stylized fact no. 11 (increasing contribution to agricultural GDP) is supported by the literature on agricultural added value composition.
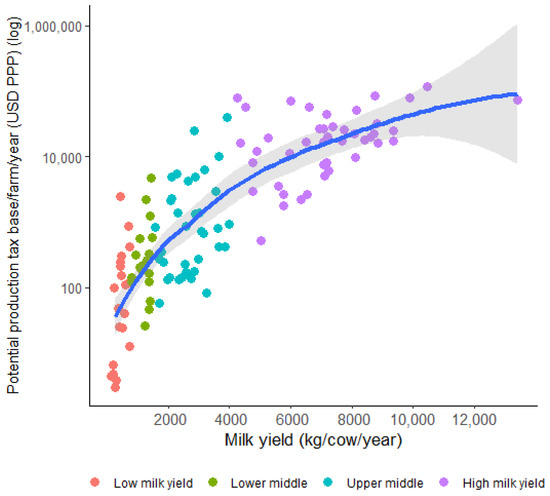
- Stylized fact no. 12. Potential tax base (income) increases.
The literature about tax revenue performance tends to link a higher agricultural share in GDP with a lower tax to GDP ratio in developing countries [80]. However, this is not linked to productivity, on the contrary; this is due to difficulties in taxing a subsistence sector. In general, economic development is related to better revenue performance, and agricultural development is a “step in the right direction” to maximize tax collection in the long run [80,81].
It is apparent that the agricultural productivity and tax revenue relationship is not profusely documented in the agricultural development literature. Chang et al. [67] found that higher agricultural productivity generates higher tax revenues. Irz et al. [13] highlight the consequences of agricultural growth, such as the greater generation of local tax revenues for the rural economy and the general generation of taxes for the national economy. However, for Nigeria, some studies point to a negative relationship between resource mobilization and agricultural productivity, signalling a lack of efficiency in resource mobilization as the possible explanation [68].
From a broader perspective, surpassing the agricultural context, empirical patterns correlate general economic development and higher tax collection [69].
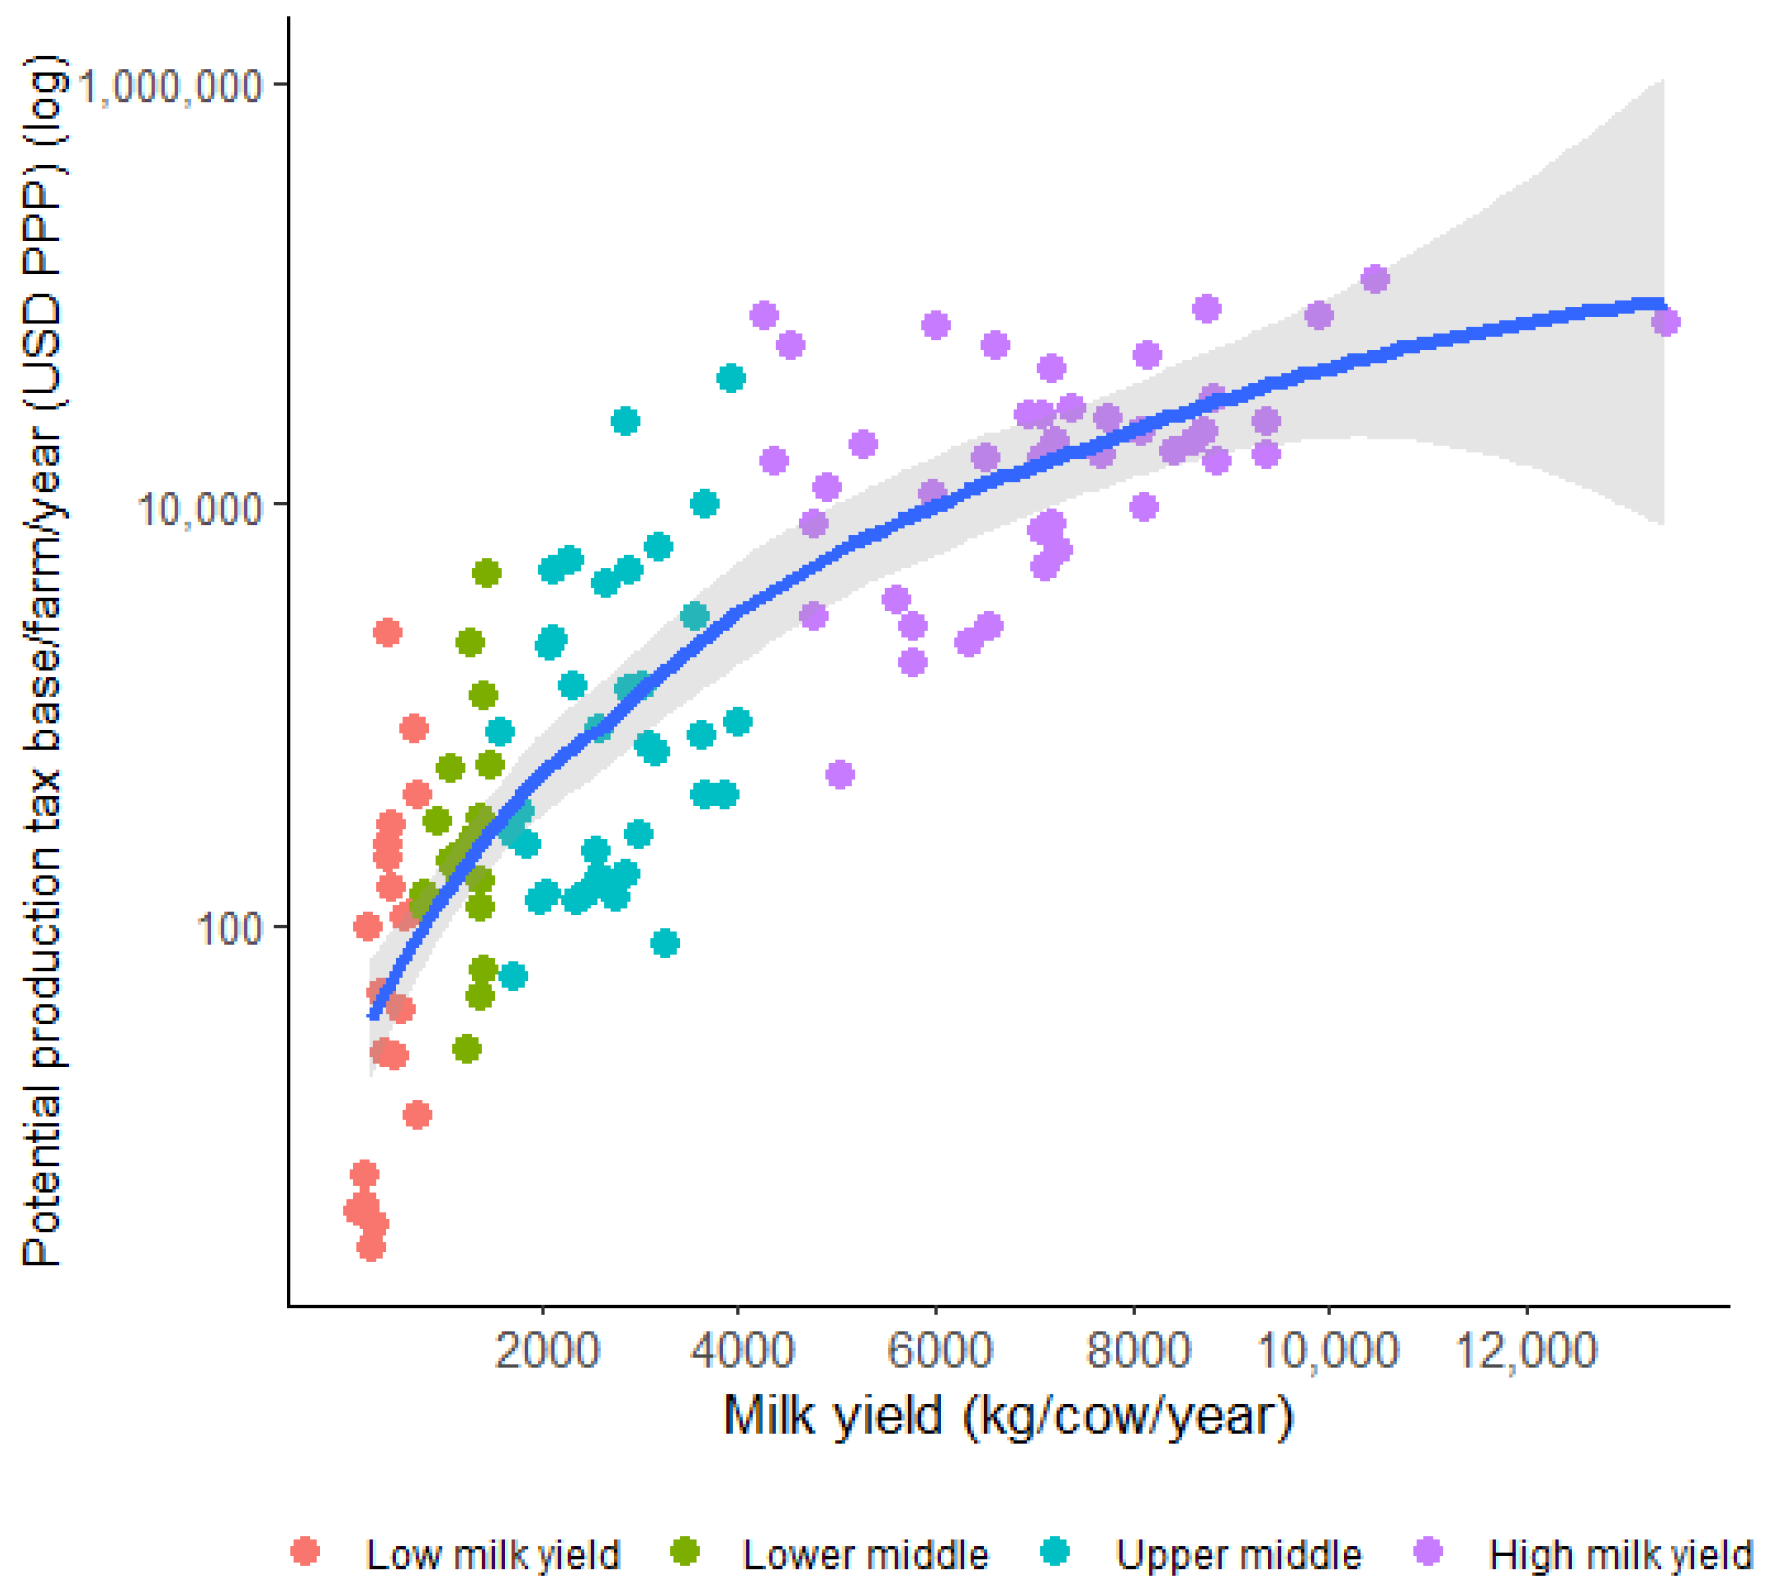
Figure 12 characterizes the tax base derived from dairy activity (production) as positively associated with dairy sector development. This might be understood as a potential wider basis for government revenues.
Figure 12.
Production tax base from milk and milk yield per cow. Source: own elaboration based on 2018 cross-country data. Line corresponds to mean (and 95% confidence interval) for that level of yield. We used local polynomial regressions.
The increase in tax bases in the dairy sector is shown by Figure 12 and Figure 13. The trend depicted in Figure 12 describes an inherent tax base increase derived from sector development, which directly clashes with the tax bias against agriculture relative to other sectors, which would work against country prosperity [82,83].
Figure 13.
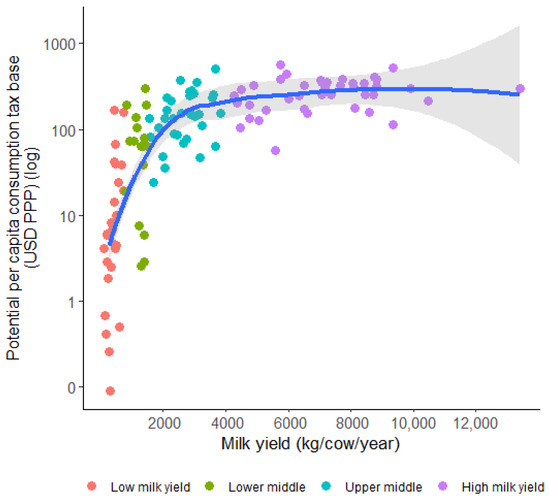
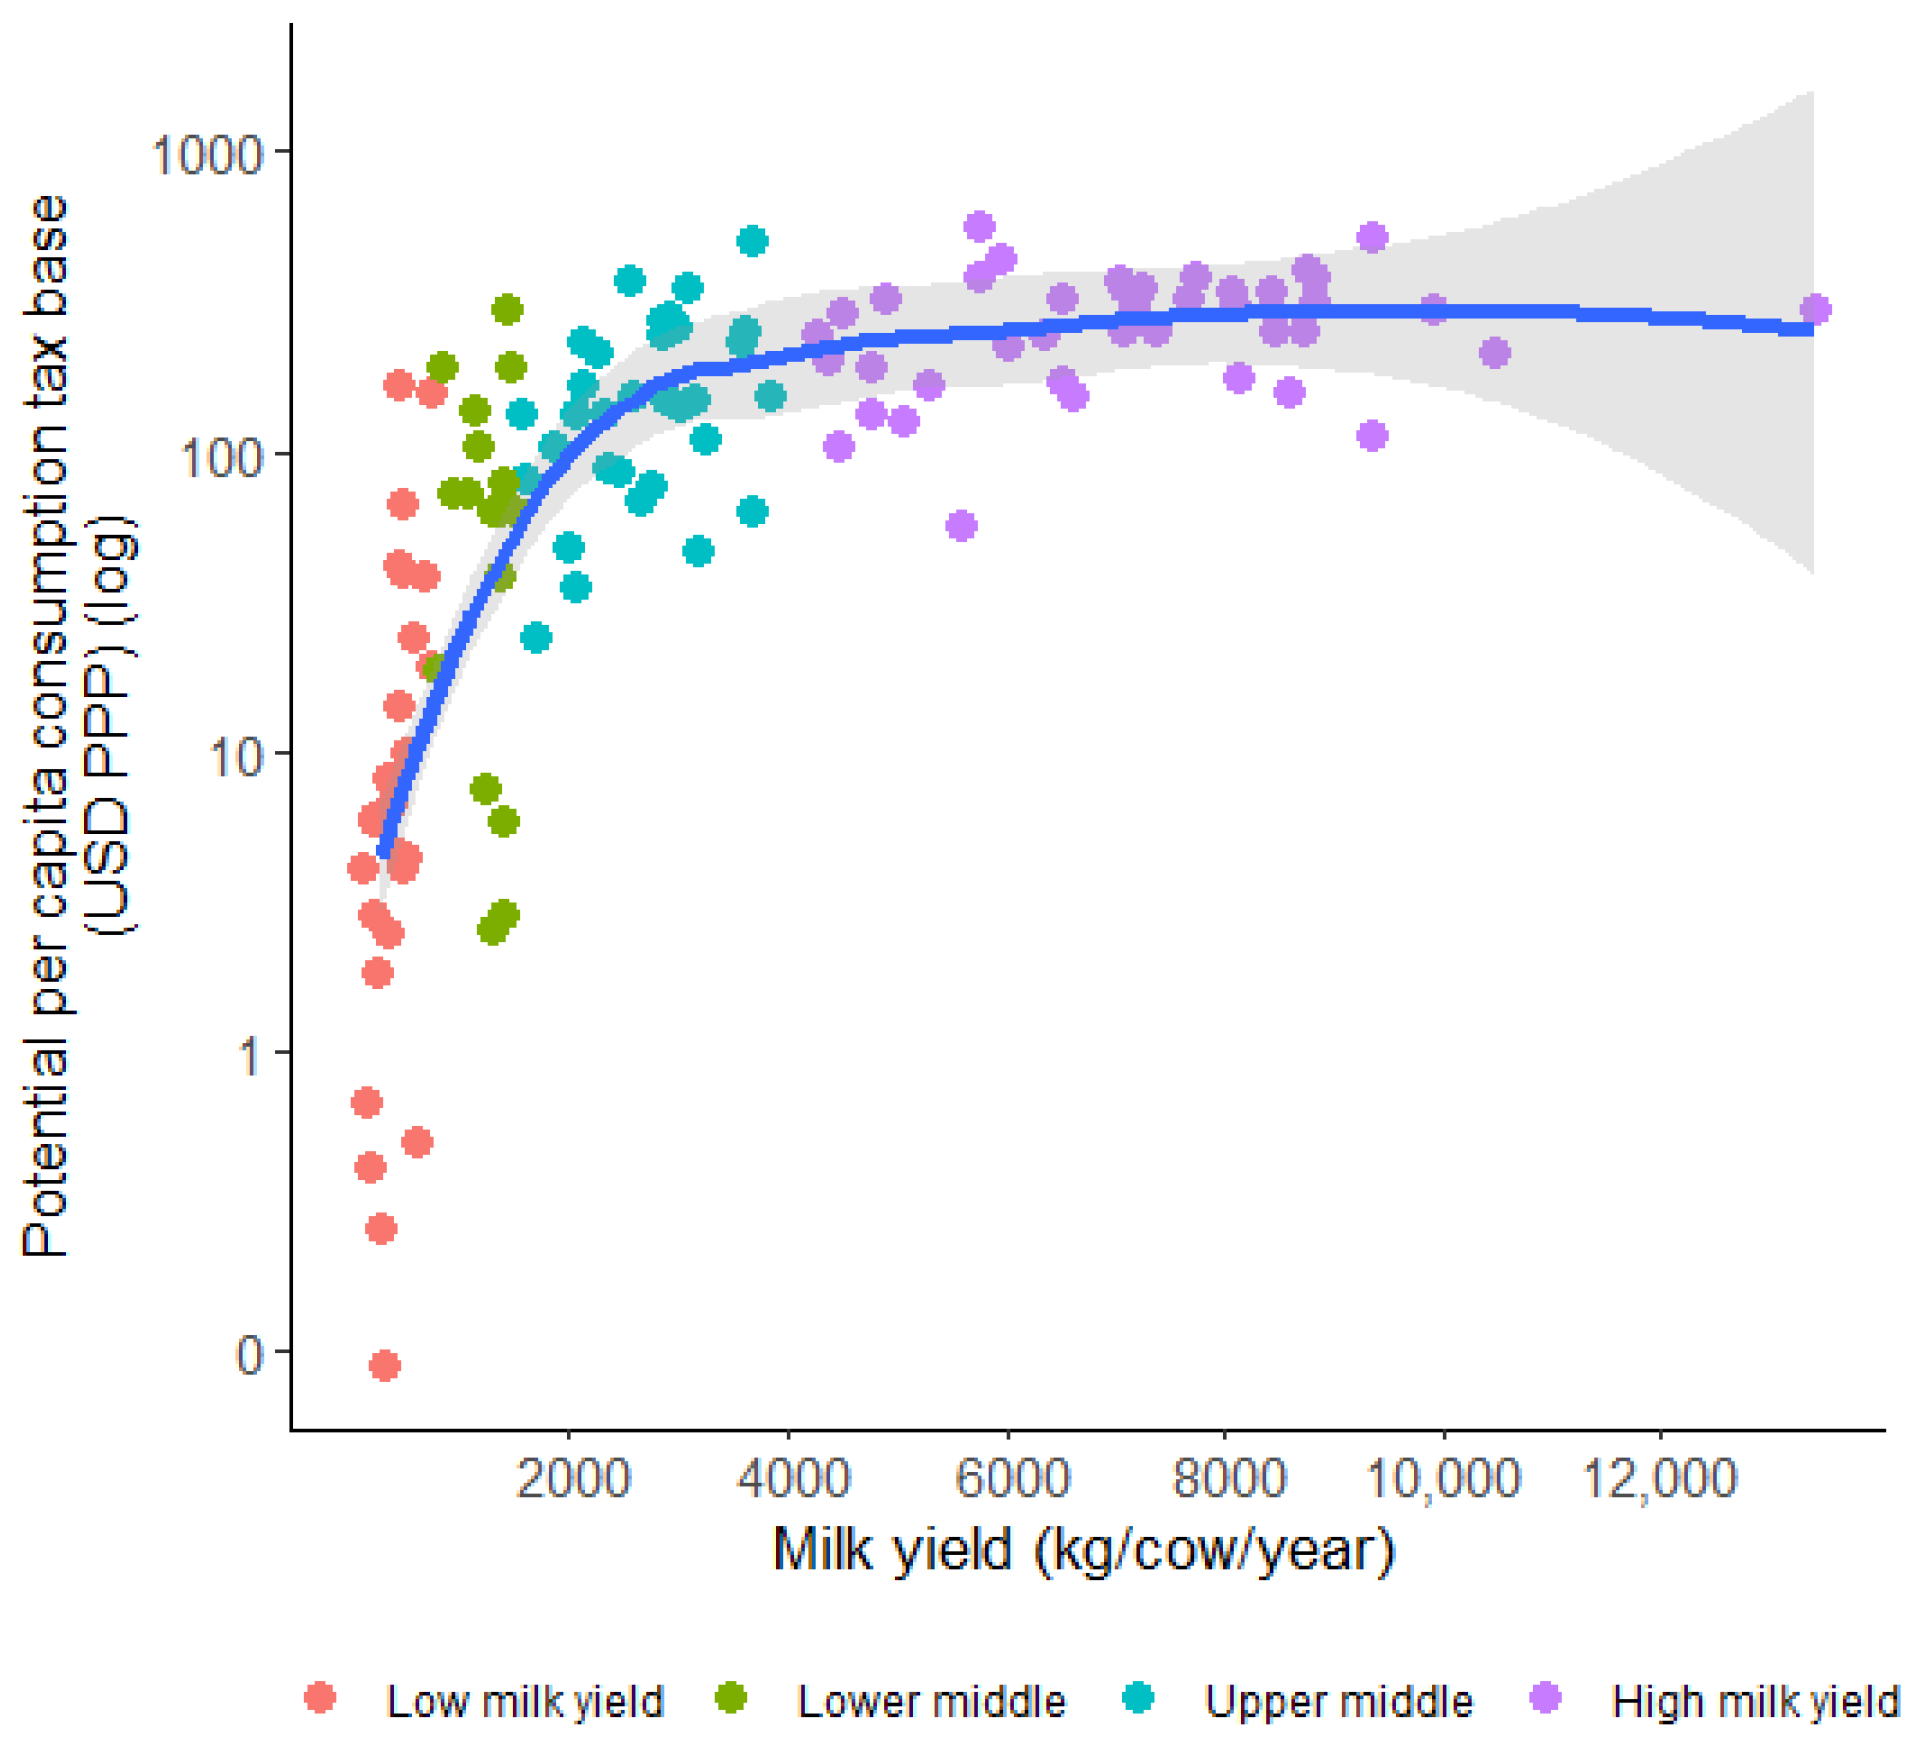
Consumption tax base from milk and milk yield per cow. Source: own elaboration based on 2018 cross-country data. Line corresponds to mean (and 95% confidence interval) for that level of yield. We used local polynomial regressions.
- Stylized fact no. 13. Potential tax base (consumption) increases.
Potential tax bases are expected to expand due to agricultural development (see previous section on stylized fact no. 12). As gathered in the previous section, Irz et al. [13] signal to the increase in local and national tax revenues as a consequence of growth in agricultural productivity.
As the dairy sector develops, Figure 13 shows a steep growth in the milk consumption tax base, reaching a saturation point around 100 USD PPP per person and year.
- Stylized fact no. 14. Formality in the sector growths.
In a general way, informality is defined as a market-based activity (legal goods and services production) that is hidden from public authorities generally because of monetary, regulatory, or institutional reasons [70]. By opposition, formality is the share of the production under the radar of public authorities. By nature, the definition of informality is context-specific [84] and it is difficult to observe and measure (the methods for regularly measuring informality/formality are survey-based (for example, employment surveys) or model-based (GDP share of formal–informal economy estimation) [84]). For example, the most commonly used measure of informal employment is the share of self-employment in total employment. The regular GDP measure of formality/informality is also built on the share of GDP production. Similarly, as a proxy for informality in the dairy sector, we use the share of milk formally processed compared with total production (proportion of milk channelled through formal markets). The variable is then a proxy for the formality degree in dairy-producing markets.
No major literature was found regarding agricultural development and the degree of formality. Due to the lack of agriculture studies, we look for evidence on (a) global development and informality trends, (b) evidence at the firm level. Schneider et al. [70] and Kouakou and Yeo [71] proved with data from over 130 countries that, worldwide, economic development reduces the size of the informal economy. The extant evidence of economic development and decreasing informality is extensive [70,71,72,73,74].
At the firm level, despite Levenson and Maloney [85] making the case that, in developing countries, new firms that start as informal become formal if they successfully grow, the recent literature believes that informal firms rarely transform to formal [74,75]. However, authors concur and provide evidence (Taymaz [75]) on a positive association between formality and own-firm productivity, with the informal firms being less productive than the formal ones.
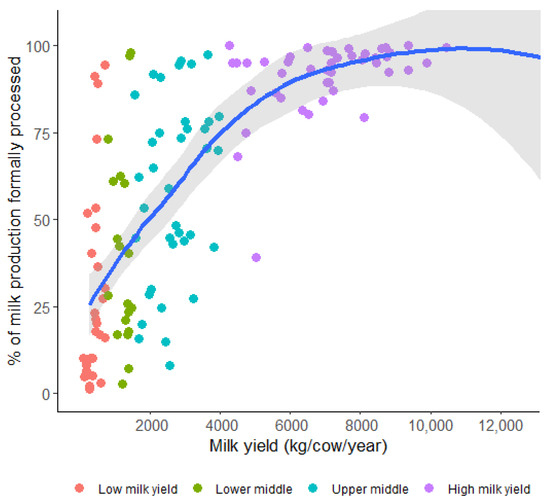
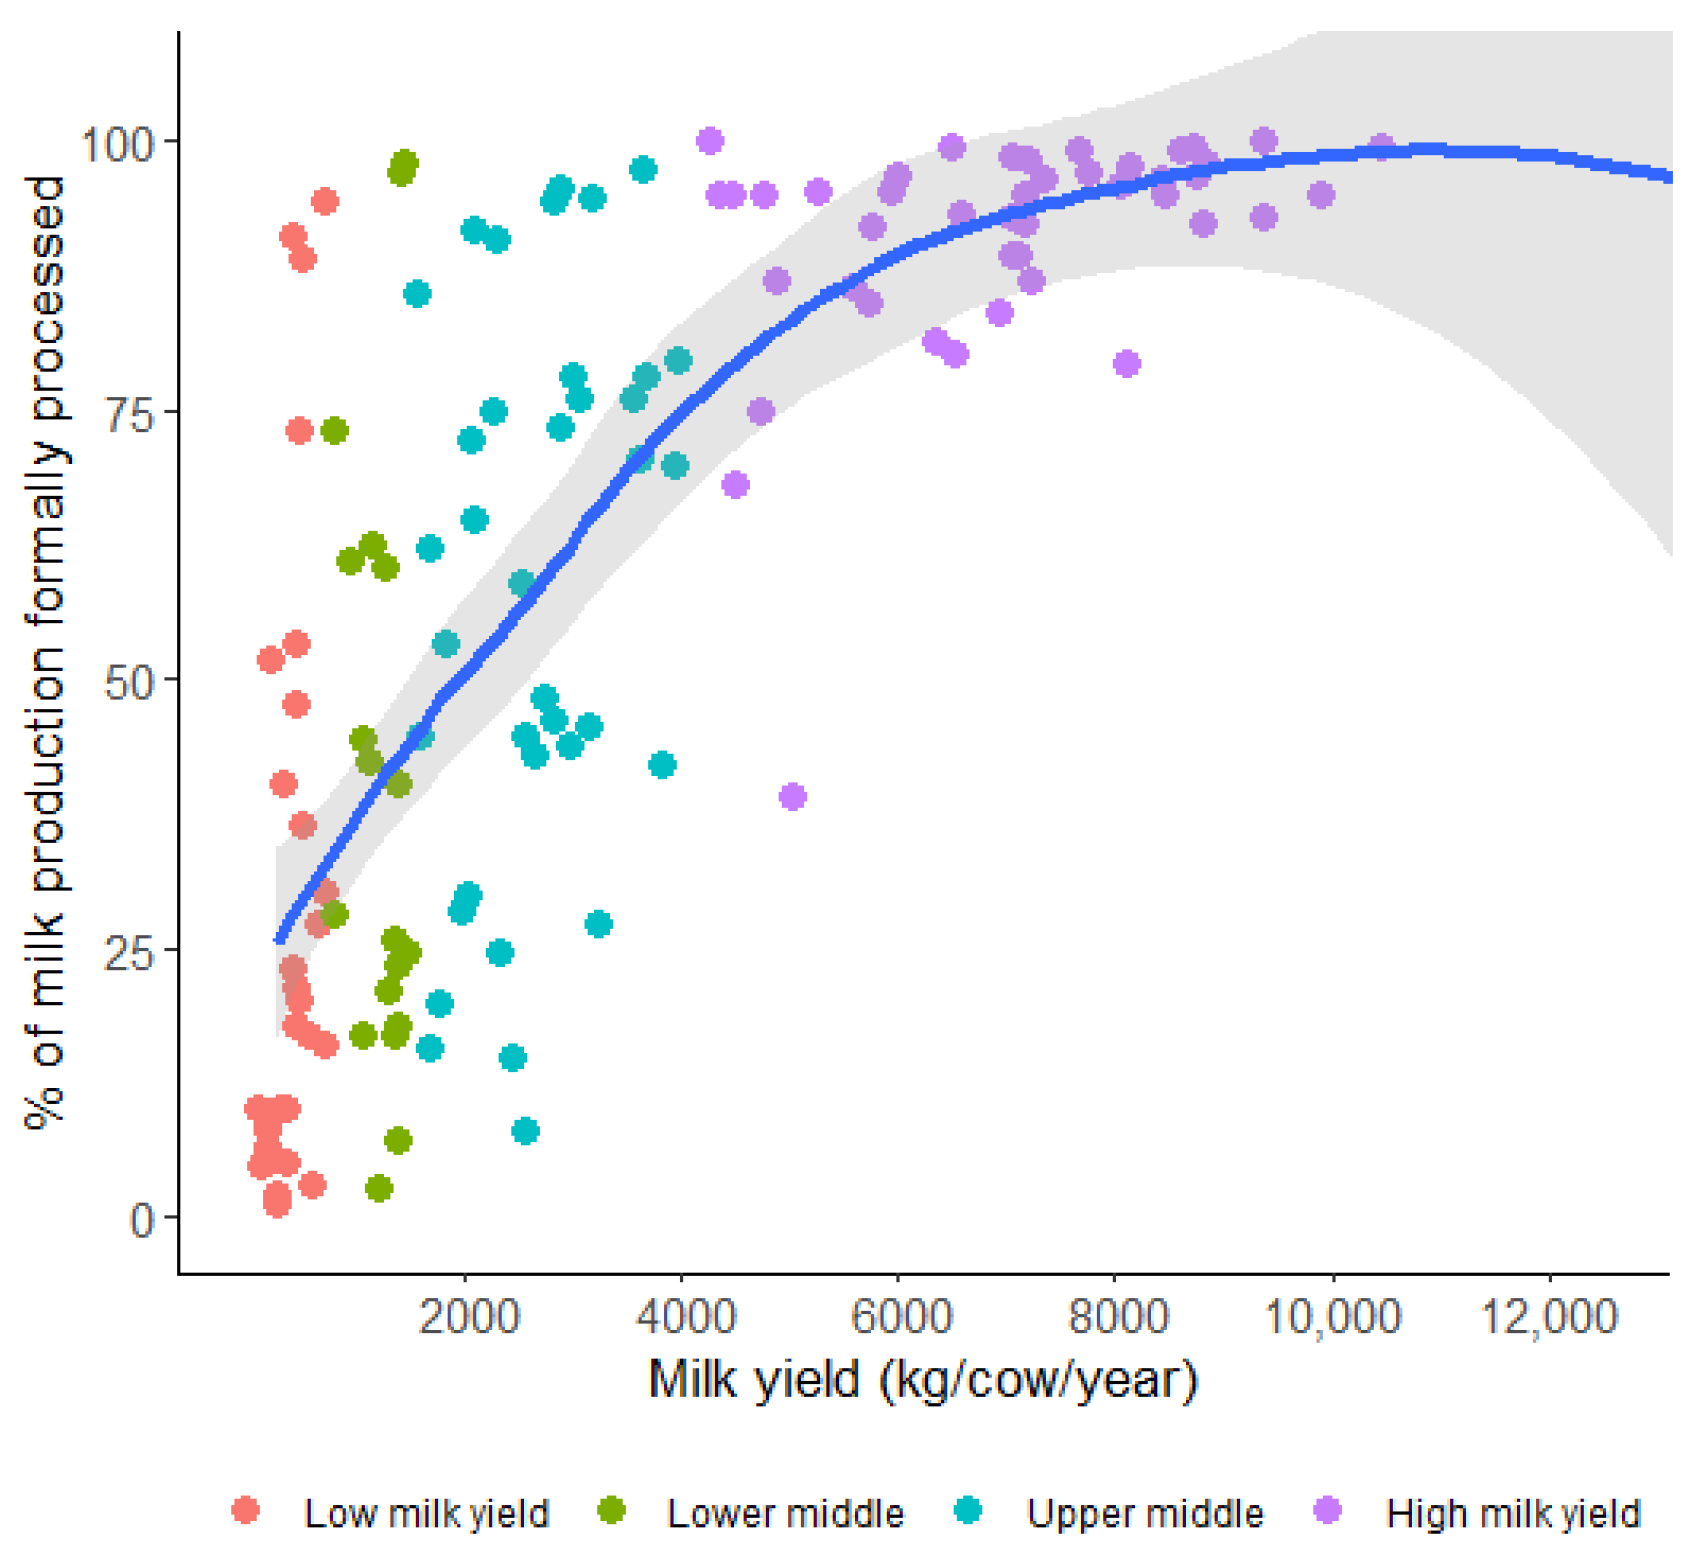
Figure 14 describes a narrowing shadow economy as the dairy sector develops. As the sector develops, we found increasing formality in the operations of the sector.
Figure 14.
Proportion of milk channelled through formal markets and milk yield per cow. Source: own elaboration based on 2018 cross-country data. Line corresponds to mean (and 95% confidence interval) for that level of yield. We used local polynomial regressions.
The pattern described in Figure 14 is supported by both groups of evidence (macro-, global-, and micro-firms), which are aligned with Figure 14’s findings. In the dairy sector, an increased level of formality means that a higher fraction of production is under the radar of public authorities. This might impact the quality of handled milk (under standardized controls such as somatic cell counts, which are an indicator of milk quality and udder health in dairy animals, or others), thereby impacting enhanced food safety and nutrition. In contexts where informal food channels predominate, surveillance and inspectorate capacities are limited [86]. In other fields, higher formalization might also lead to the consolidation of the value chain, which implies midterm employment opportunities, and other impacts such as increased tax revenue for the government.
4. Different Regions and Systems
It is important to note that our findings represent observed global stylized facts. However, individual countries or regions may follow distinct paths that differ from these global patterns. The reasons for not aligning with the generalized trends can be varied and numerous—for example, geographical, cultural, or historical factors.
Table 3 gathers the results from a comprehensive multivariate assessment about whether region, income level, and ecozone (in addition to yield) might be significant for the variance in the social development. The results in Table 3 show that all components are significant. Region and income level have a highly significant effect on social development.
Table 3.
MANOVA results on principal components.
The analysis is complemented by univariate ANOVAs on individual indicators. As shown in Table 4, the assessment reveals that not all social dimensions behave homogenously regarding regional differences. ‘Dairy farms households per 1000 people’, ‘dairy farm income’, ‘people working on dairy farms’, ’wages in milk processing’, ‘milk supply per capita’, and ‘potential income tax base’ showed no significant regional differences. On the contrary, other indicators such as ‘farm labour productivity’, ‘share of population accessing and consuming dairy’, ‘milk price’, ‘affordability’, ‘milk contribution to agri GDP’, ‘potential consumption tax base’, and ‘formality’ might have strong regional effects.
Table 4.
Univariate ANOVA results by region.
In any event, in addition to the descriptive patterns gathered here, countries and food systems will be shaped by their own culture, resource availability, and a myriad of aspects. In line with these differences, we would like to bring to the discussion the differences among food systems and their differential impact on social development.
Food systems, understood as complex units comprising not only production but linkages with and towards several actors and contexts [87,88], “are in continuous state of change and adaptation. It is in the nature of farming and food production that systems evolve” [88]. Different dairy development models across regions demonstrate how transitions in the sector can generate diverse socio-economic effects.
In Eastern Europe, countries moved from small-scale cooperative models under state control to privatized, market-driven systems. The state withdrew, value chains strengthened, and the private industry met the growing demand. With assured consumption and infrastructure, but insufficient production scale, the access to resources and technical services enabled a transformation in 20 years, opening international markets and attracting foreign firms [89]. In Latin America, development has been driven by a growing consumer market, formal or semi-formal milk consumption, and large companies. Production has shifted based on natural resources, with producers accessing technical services.
In Asia (e.g., India, Pakistan, and Bangladesh), millions depend on dairy. Informal micro-processing and urban farms dominate, serving a growing population. Dairy is key to rural development, with women playing a major role, though the formalization of value chains is needed. In Africa, the value chain is weak and mostly informal. Production faces limited resources, poor feed, and inadequate storage, transport, and processing. Public–private partnerships are vital, and tourism offers the potential for growth.
Considering these differences, social impact in Eastern Europe is centred on scaling production, improving productivity, and organizing value chains, creating jobs and entrepreneurship in a stable market. In Latin America, formalization and specialization have driven progress. In Asia, dairy is central to rural development, though formalization remains a challenge. In Africa, investment and alliances are crucial to overcome infrastructure limits [90]. Overall, these contrasting models illustrate that dairy sector transformations—whether driven by industrial expansion, formalization, or the upgrading of informal systems—shape socio-economic outcomes differently across regions.
Even if we are focusing on the social arena of these different development paths (e.g., by region and production system), one may be concerned by the environmental implications of dairy sector development. While the environmental impacts of dairy activity range from anthropogenic emissions to land use change to water use and pollution, which are widely reported on in the literature [91,92,93,94], the environmental impacts of dairy development should go in line with the SDGs, as there is a clear inverse relationship between productivity and emission intensity [91]. In the dairy industry, most of the emissions are found in extensive systems (regularly with low or moderately low yields), so increases in productivity would lower the emissions per unit of product. The extensive systems themselves might improve with the use of certain practices (for example, enhancing forage quality). However, certain risks remain in the form of land and water use or quality. Which practice or system of production is chosen for that development is key in understanding the effect of that development on the environment. Certainly, not all production systems evolve and impact equally. We are witnessing a high interest in understanding food system changes and how this affects the environment, yet realizing systems is complex. In terms of mitigation, possible options include improved animal nutrition, health management, manure treatment (such as biogas recovery), and carbon sequestration through better pasture management [95]. These measures could reduce sectoral emissions by 18–30 percent [91]. However, barriers such as investment needs, technical capacity, and risks—especially for smallholder systems—limit widespread adoption.
5. Conclusions and Recommendations
This work provides evidence on how global dairy development contributes to social progress. To our knowledge, this study offers the first global quantitative evidence of dairy development’s societal impacts. It pioneers a comprehensive dairy sector database and contextualizes the results within the broader agricultural sector. We present 14 stylized facts based on cross-country data from 187 nations. A stylized fact is an observed general and regular pattern, which, however, does not prevent particular individuals from following their own path, according to their own characteristics. Our empirical findings cover four domains: (i) dairy sector development and farmer livelihoods, (ii) employment, (iii) milk and dairy consumption, (iv) government benefits. In terms of farmer livelihoods, we observe (1) a decline in the presence of dairy farm households in the population while (2) the income for those farmers is higher.
Regarding employment, the data indicate (3) that higher milk yields correlate with fewer workers on dairy farms, (4) increasing farm labour productivity. We also found (5) shifting trends in dairy processing industry employment: employment first rises, then declines and stabilizes as the sector matures. Additionally, we found that (6) wages in milk processing increase with sector development.
The consumption domain has the broadest societal impact. Dairy sector growth is associated with (7) an increased milk supply (food availability), (8) greater access and consumption of dairy products (food accessibility), (9) lower consumer prices, (10) improved milk affordability. These factors support social welfare by making nutritious food more widely available at lower costs.
Governments benefit as (11) dairy’s contribution to agricultural value addition increases with sector growth. Additionally, (12) income-based tax potential, (13) consumption-based tax potential, (14) formality in the sector rise.
Our findings align with broader agricultural development trends. The results also confirm that social development is significantly affected by the regional component in dairy systems.
Methodologically, we followed a four-step approach. First, we reviewed the existing evidence on agricultural development and social change. Second, we built a novel global database on dairy sector structure and social indicators. Third, we used non-parametric techniques to establish quantitative stylized facts on dairy development’s societal effects. We used yield per cow per year as a proxy for sector development, applying local polynomial regressions [41], following Michler [38]. Finally, we compared dairy sector development with general agricultural trends and perform multivariate assessments to better understand socio-economic outcomes.
The results suggest that the social impact of dairy development could be positive, or even very positive, overall. However, risks remain and differences will continue existing in dairy systems and their impacts. A key challenge is labour displacement, which may strain economies with rigid labour markets.
Additionally, environmental concerns in high-income countries have led to initiatives and efforts focused on reducing emissions through more sustainable farming practices, improved feed efficiency, or innovative technologies [96]. However, this requires investment in sustainable practices and technology. Compounding this, dairy consumption in some developed nations is declining due to plant-based alternatives, though the environmental and health benefits of these substitutes remain debated [5].
In summary, while dairy development has proven potential for positive social impact, it must address labour transitions and growing environmental concerns. The sector will likely innovate to meet sustainability targets while adapting to evolving consumer preferences and policy objectives.
A shortcoming of this study is the unavailability of further data. Data limitations prevented deeper analysis into education, social cohesion, gender, and nutrition. Future research could expand global data collection in these areas to enhance insights. Similarly, data on different dairy systems would enrich the research. It would undoubtedly be of great interest to understand how different systems are related to different social developments. In the same vein, it would be beneficial to have time series data to investigate the dynamics with time. Future work might focus on integrating time series, introducing farm-level data, and value chain employment estimates beyond dairy industries.
Methodologically, the use of stylized facts allows us to comprehensively understand general observed patterns, which is useful to our scope of understanding development and data-based contrasted patterns. However, they do not provide a direct causal relationship.
With a more general outlook, development is not a linear model, so one cannot affirm that more milk will bring more social development. Development does not follow a strict line nor does it behave the same in different contexts.
Despite all our limitations, we have pioneered a quantitative and descriptive study of dairy and social development and contributed to a more complete vision of Food Systems and the SDGs. Further and deeper studies can depart from here and enhance our contribution.
Policy Recommendations
Policy makers should consider the context in which the sector is developing, as it will lead to different impacts and implications. Access to natural resources or value chain development stages should be considered. For example, value chain consolidation or improved supplies and transportation might be needed.
Policy makers should ensure a smooth transition in the labour market to allow society to benefit from wealth increases. Flexible labour markets will smooth the transition from farm employment to other sectors.
Other beneficial assessments to consider include the following:
- Assessing the nutritional status of the population and examining the role of the dairy sector in improving nutrition (drawing on information from healthcare providers, hospitals, etc.). Policy makers could identify how the dairy sector could contribute to better nutrition and which actions should be taken to promote and enhance nutrition.
- Possibilities of public–private partnerships.
Supplementary Materials
The following supporting information can be downloaded at: https://www.mdpi.com/article/10.3390/world6030105/s1, Supplementary Materials: Database Construction.
Author Contributions
Conceptualization, A.F., U.P.-C. and E.R.; methodology, A.F., U.P.-C. and E.R.; software, A.F.; validation, A.F., U.P.-C. and E.R.; formal analysis, A.F., U.P.-C. and E.R.; investigation, A.F., U.P.-C. and E.R.; resources, U.P.-C. and E.R.; data curation, A.F.; writing—original draft preparation, A.F., U.P.-C. and E.R.; writing—review and editing, A.F., U.P.-C. and E.R.; visualization, A.F.; supervision, A.F., U.P.-C. and E.R.; project administration, U.P.-C. and E.R.; funding acquisition, U.P.-C. and E.R. All authors have read and agreed to the published version of the manuscript.
Funding
This research was supported by the Global Dairy Platform (GDP) as part of its engagement in the Global Agenda for Sustainable Livestock (GASL) [MTF/GLO/787/MUL].
Institutional Review Board Statement
Not applicable.
Informed Consent Statement
Not applicable.
Data Availability Statement
The data presented in this study are available on request from the corresponding author.
Conflicts of Interest
Author Ana Felis has been involved as consultant and expert analyst by GDP. Author Ugo Pica-Ciamarra and Ernesto Reyes have managed the Livestock for Social Development Action Network of the FAO Global Agenda for Sustainable Livestock to which GDP con-tributed financially. GDP had no role in the design of the study; in the collection, analyses, or interpretation of data; in the writing of the manuscript, or in the decision to publish the results. All authors can share report results.
Abbreviations
The following abbreviations are used in this manuscript:
| SDGs | Sustainable Development Goals |
| UN | United Nations |
| GR | Green Revolution |
| GASL | Global Agenda for Sustainable Livestock |
| FAO | Food and Agriculture Organization of the United Nations |
| IFCN | International Farm Comparison Network |
| IFAD | International Fund for Agricultural Development |
| GDP | Global Dairy Platform |
| IPL | International Poverty Line |
| GDP | Gross Domestic Product |
| WB | World Bank |
| ILO | International Labour Organization |
| UNPF | United Nations Population Fund |
| UNIDO | United Nations Industrial Development Organization |
| LCU | Local Currency Unit |
| PPP | Purchasing Power Parity |
| WoS | Web of Science |
References
- FAOSTAT. Food and Agriculture Data. Available online: https://www.fao.org/faostat/en/#data (accessed on 11 October 2023).
- GASL. Dairy and Socio-Economic Development. In What Evidence Does the Data Hold; GASL: Rome, Italy, 2024. [Google Scholar]
- FAO. The State of Food and Agriculture 2022; FAO: Rome, Italy, 2022. [Google Scholar] [CrossRef] [Scilit]
- FAO. Milk Facts. Available online: https://www.fao.org/3/I9966EN/i9966en.pdf (accessed on 5 February 2025).
- OECD-FAO. OECD-FAO Agricultural Outlook 2024–2033; OECD: Paris, France, 2024. [Google Scholar] [CrossRef] [Scilit]
- Bojovic, M.; McGregor, A. A review of megatrends in the global dairy sector: What are the socioecological implications? Agric. Hum. Values 2023, 40, 373–394. [Google Scholar] [CrossRef] [Scilit]
- FAO; GDP; IFCN. Dairy’s Impact on Reducing Global Hunger; FAO; GDP; IFCN: Chicago, IL, USA, 2020; Available online: http://www.fao.org/3/ca7500en/CA7500EN.pdf (accessed on 1 January 2025).
- FAO; GDP; IFCN. Dairy Development’s Impact on Poverty Reduction; FAO; GDP; IFCN: Chicago, IL, USA, 2018; Available online: http://www.fao.org/3/ca0289en/ca0289en.pdf (accessed on 1 January 2025).
- Dror, D.K.; Allen, L.H. The Importance of Milk and other Animal-Source Foods for Children in Low-Income Countries. Food Nutr. Bull. 2011, 32, 227–243. [Google Scholar] [CrossRef] [Scilit] [PubMed]
- FAO. Milk and Dairy Product in Human Nutrition; Food and Agriculture Organization of the United Nations: Rome, Italy, 2013; Available online: http://www.fao.org/3/i3396e/i3396e.pdf (accessed on 7 July 2025).
- Hoddinott, J.; Headey, D.; Cows, M.D.; Markets, M.M. Nutrition in Rural Ethiopia. J. Dev. Stud. 2015, 51, 958–975. [Google Scholar] [CrossRef] [Scilit]
- Dethier, J.J.; Effenberger, A. Agriculture and development: A brief review of the literature. Econ. Syst. 2012, 36, 175–205. [Google Scholar] [CrossRef] [Scilit]
- Irz, X.; Lin, L.; Thirtle, C.; Wiggins, S. Agricultural Productivity Growth and Poverty Alleviation. Dev. Policy Rev. 2001, 19, 449–466. [Google Scholar] [CrossRef] [Scilit]
- Mozumdar, L. Agricultural productivity and food security in the developing world. Bangladesh J. Agric. Econ. 2012, 35, 53–69. [Google Scholar] [CrossRef]
- Pingali, P.L. Green Revolution: Impacts, limits, and the path ahead. Proc. Natl. Acad. Sci. USA 2012, 109, 12302–12308. [Google Scholar] [CrossRef] [Scilit]
- Barrett, C.B. The Economics of Agricultural Development: An Overview. Orig. Essay 2011, 1–63. Available online: http://barrett.dyson.cornell.edu/Books/Introduction%20Chapter%201%208June2011%20Revised%20Final%20Version.pdf (accessed on 25 April 2024).
- Hazell, P.B.R. The Asian Green Revolution. In Proven Successes in Agricultural Development. A Technical Compedium to Million Fed; Spielman, D.J., Pandya-Lorch, R., Eds.; International Food Policy Research Institute: Washington, DC, USA, 2010; Volume 3, pp. 67–98. [Google Scholar]
- Fuglie, K.; Gautam, M.; Goyal, A.; Maloney, W.F. Harvesting Prosperity: Technology and Productivity Growth in Agriculture; World Bank: Washington, DC, USA, 2020. [Google Scholar] [CrossRef] [Scilit]
- Webb, P. More food, but not yet enough: 20th century successes in agriculture growth and 21st century challenges. In Fiat Panis: For a World Without Hunger; Eiselen, H., Ed.; Hampp Media/Balance Publications: Stuttgart, Germany, 2009; pp. 410–434. [Google Scholar]
- Fan, S.; Brzeska, J. Production, Productivity, and Public Investment in East Asian Agriculture. In Handbook of Agricultural Economics; Gardner, G.C., Rausser, P.L., Pingali, R.E., Robert, E., Eds.; Elsevier: Amsterdam, The Netherlands, 2010; Volume 4, pp. 3401–3434. [Google Scholar] [CrossRef] [Scilit]
- Hazell, P.B.R. An Assessment of the Impact of Agricultural Research in South Asia Since the Green Revolution. In Handbook of Agricultural Economics; Gardner, G.C., Rausser, P.L., Pingali, R.E., Robert, E., Eds.; Elsevier: Amsterdam, The Netherlands, 2010; Volume 4, pp. 3469–3530. [Google Scholar] [CrossRef] [Scilit]
- Timmer, C.P. Getting agriculture moving: Do markets provide the right signals? Food Policy 1995, 20, 455–472. [Google Scholar] [CrossRef] [Scilit]
- Pingali, P. Agricultural Mechanization: Adoption Patterns and Economic Impact. In Handbook of Agricultural Economics; Evenson, R.E., Pingali, P., Eds.; Elsevier: Amsterdam, The Netherlands, 2007; Volume 3, pp. 2779–2805. [Google Scholar] [CrossRef] [Scilit]
- World Bank. 2007 World Development Report 2008: Agriculture for Development; World Development Report: Washington, DC, USA, 2007. [Google Scholar] [CrossRef] [Scilit]
- Mellor, J.W. The New Economics of Growth: A Strategy for India and the Developing World; Cornell University Press: Ithaca, NY, USA, 1976. [Google Scholar]
- Thirtle, C.; Lin, L.; Piesse, J. The Impact of Research-Led Agricultural Productivity Growth on Poverty Reduction in Africa, Asia and Latin America. World Dev. 2003, 31, 1959–1975. [Google Scholar] [CrossRef] [Scilit]
- Ravallion, M.; Datt, G. How Important to India’s Poor Is the Sectoral Composition of Economic Growth? World Bank Econ. Rev. 1996, 10, 1–25. [Google Scholar] [CrossRef] [Scilit]
- Torlesse, H.; Kiess, L.; Bloem, M.W. Association of household rice expenditure with child nutritional status indicates a role for macroeconomic food policy in combating malnutrition. J. Nutr. 2003, 133, 1320–1325. [Google Scholar] [CrossRef] [Scilit] [PubMed]
- Timmer, P.C. The agricultural transformation. In Handbook of Development Economics; Elsevier: Amsterdam, The Netherlands, 1988; Volume 1, pp. 275–331. [Google Scholar] [CrossRef] [Scilit]
- Christiaensen, L.; Demery, L.; Kuhl, J. The (evolving) role of agriculture in poverty reduction—An empirical perspective. J. Dev. Econ. 2011, 96, 239–254. [Google Scholar] [CrossRef] [Scilit]
- Fan, S.; Hazell, P. Returns to Public Investments in the Less-Favored Areas of India and China. Am. J. Agric. Econ. 2001, 83, 1217–1222. [Google Scholar] [CrossRef] [Scilit]
- Evenson, R.E.; Gollin, D. Assessing the Impact of the Green Revolution, 1960 to 2000. Science 2003, 300, 758–762. [Google Scholar] [CrossRef] [Scilit] [PubMed]
- Pinstrup-Andersen, P.; Hazell, P.B.R. The impact of the green revolution and prospects for the future. Food Rev. Int. 1985, 1, 1–25. [Google Scholar] [CrossRef] [Scilit]
- FAO. Guidelines for the Measurement of Productivity and Efficiency in Agriculture; FAO: Rome, Italy, 2018; Available online: http://www.fao.org/3/ca6395en/ca6395en.pdf (accessed on 16 May 2024).
- Buchanan, M. It’s a (stylized) fact! Nat. Phys. 2012, 8, 3. [Google Scholar] [CrossRef] [Scilit]
- Kaldor, N. Capital Accumulation and Economic Growth. In The Theory of Capital; Palgrave Macmillan: London, UK, 1961; pp. 177–222. [Google Scholar] [CrossRef] [Scilit]
- Black, J.; Hashimzade, N.; Myles, G. A Dictionary of Economics; Oxford University Press: Oxford, UK, 2009. [Google Scholar] [CrossRef] [Scilit]
- Michler, J.D. Agriculture in the process of development: A micro-perspective. World Dev. 2020, 129, 104888. [Google Scholar] [CrossRef] [Scilit]
- Jacoby, W.G. Loess: A nonparametric, graphical tool for depicting relationships between variables. Elect. Stud. 2000, 19, 577–613. [Google Scholar] [CrossRef] [Scilit]
- Racine, J.S. Nonparametric Econometrics: A Primer. Found. Trends® Econom. 2007, 3, 1–88. [Google Scholar] [CrossRef] [Scilit]
- Henderson, D.J.; Parmeter, C.F. Applied Nonparametric Econometrics; Cambridge University Press: Cambridge, UK, 2015. [Google Scholar] [CrossRef] [Scilit]
- Cleveland, W.S. Robust locally weighted regression and smoothing scatterplots. J. Am. Stat. Assoc. 1979, 74, 829–836. [Google Scholar] [CrossRef]
- Cleveland, W.S.; Devlin, S.J. Locally weighted regression: An approach to regression analysis by local fitting. J. Am. Stat. Assoc. 1988, 83, 596–610. [Google Scholar] [CrossRef]
- Eurostat. Farmers and the Agricultural Labour Force—Statistics. Available online: https://ec.europa.eu/eurostat/statistics-explained/index.php?title=Farmers_and_the_agricultural_labour_force_-_statistics#Fewer_farms.2C_fewer_farmers (accessed on 24 May 2024).
- Lowder, S.K.; Skoet, J.; Singh, S. What Do We Really Know About the Number and Distribution of Farms and Family Farms in the World? Background Paper for the State of Food and Agriculture 2014; FAO: Rome, Italy, 2014; Available online: https://ageconsearch.umn.edu/record/288983/ (accessed on 27 April 2024).
- Pinstrup-Andersen, P.; Pandya-Lorch, R. Food security and sustainable use of natural resources: A 2020 Vision. Ecol. Econ. 1998, 26, 1–10. [Google Scholar] [CrossRef] [Scilit]
- Datt, G.; Ravallion, M. Farm productivity and rural poverty in India. J. Dev. Stud. 1998, 34, 62–85. [Google Scholar] [CrossRef] [Scilit]
- Kuznets, S. Modern Economic Growth. Rate, Structure, and Spread; Yale University Press: New Haven, CT, USA, 1966. [Google Scholar]
- Hazell, P.B.R. The Impact of Agricultural Research on the Poor: A Review of the State of Knowledge. In Agricultural Research and Poverty Reduction Some Issues and Evidence; Mathur, S., Pachico, D., Eds.; International Center for Tropical Agriculture (CIAT): Cali, Colombia, 2003. [Google Scholar]
- Lipton, M.; Longhurst, R. New Seeds and Poor People; Routledge Taylor & Francis Group: London, UK, 1989. [Google Scholar] [CrossRef] [Scilit]
- Gollin, D. Chapter 73 Agricultural Productivity and Economic Growth. In Handbook of Agricultural Economics; Elsevier: Amsterdam, The Netherlands, 2010; Volume 4, pp. 3825–3866. [Google Scholar] [CrossRef] [Scilit]
- Heston, A.; Summers, R.; Aten, B. Penn World Tables Version 6.2—Center for International Comparisons of Production, Income and Prices at the University of Pennsylvania; University of Pennsylvania: Philadelphia, PA, USA, 2006; Available online: https://datacentre.chass.utoronto.ca/pwt62/ (accessed on 26 April 2024).
- Dorward, A. Agricultural labour productivity, food prices and sustainable development impacts and indicators. Food Policy 2013, 39, 40–50. [Google Scholar] [CrossRef] [Scilit]
- Briones, R.; Felipe, J. Agriculture and structural transformation in developing Asia: Review and outlook. In Asian Development Bank Economics Working Paper Series; Asian Development Bank: Manila, Philippines, 2013; Volume 363, Available online: https://papers.ssrn.com/sol3/papers.cfm?abstract_id=2321525 (accessed on 16 May 2024).
- Yangfen, C.; Xiande, L.; Yu, L. Increasing China’s Agricultural Labor Productivity: Comparison and Policy Implications from Major Agrarian Countries. J. Resour. Ecol. 2018, 9, 575–584. [Google Scholar] [CrossRef] [Scilit]
- Herrendorf, B.; Rogerson, R.; Valentinyi, Á. Growth and Structural Transformation. Handb. Econ. Growth 2014, 2, 855–941. [Google Scholar] [CrossRef] [Scilit]
- Alston, J.M.; Norton, G.W.; Pardey, P.G. Science Under Scarcity: Principles and Practice for Agricultural Research Evaluation and Priority Setting; Cornell University Press for the International Service for National Agricultural Research (ISNAR): London, UK; Ithaca, NY, USA, 1995; Available online: https://hdl.handle.net/10568/136536 (accessed on 17 May 2024).
- Hazell, P.; Ramasamy, C. The Green Revolution Reconsidered: The Impact of High-Yielding Rice Varieties in South India; Johns Hopkins Univ Press: Baltimore, MD, USA, 1991; Available online: https://www.cabidigitallibrary.org/doi/full/10.5555/19921894419 (accessed on 17 May 2024).
- Lipton, M. Learning from others: Increasing agricultural productivity for human development in Sub-Saharan Africa. In United Nations Development Programme; Regional Bureau for Africa; Working Paper 7; Addis Ababa, Ethiopia, 2012; Available online: https://www.undp.org/sites/g/files/zskgke326/files/migration/africa/Agricultural-Learning.pdf (accessed on 25 April 2024).
- Conceição, P.; Levine, S.; Lipton, M.; Warren-Rodríguez, A. Toward a food secure future: Ensuring food security for sustainable human development in Sub-Saharan Africa. Food Policy 2016, 60, 1–9. [Google Scholar] [CrossRef] [Scilit]
- Villacis, A.H.; Mayorga, J.; Mishra, A.K. Experience-based food insecurity and agricultural productivity in Nigeria. Food Policy 2022, 113, 102286. [Google Scholar] [CrossRef] [Scilit]
- Kearney, J. Food consumption trends and drivers. Philos. Trans. R. Soc. B Biol. Sci. 2010, 365, 2793–2807. [Google Scholar] [CrossRef] [Scilit] [PubMed]
- FAO; IFAD; UNICEF; WFP; WHO. The State of Food Security and Nutrition in the World 2020. Transforming Food Systems for Affordable Healthy Diets; FAO; IFAD; UNICEF; WFP; WHO: Rome, Italy, 2020. [Google Scholar] [CrossRef] [Scilit]
- Herforth, A.; Bai, Y.; Venkat, A.; Mahrt, K.; Ebel, A.; Masters, W.A. Cost and affordability of healthy diets across and within countries. In Background Paper for The State of Food Security and Nutrition in the World 2020; FAO Agricultural Development Economics Technical Study; FAO: Rome, Italy, 2020; Volume 9. [Google Scholar] [CrossRef] [Scilit]
- Blanco, C.; Raurich, X. Agricultural composition and labor productivity. J. Dev. Econ. 2022, 158, 102934. [Google Scholar] [CrossRef] [Scilit]
- Chavas, J.P. Chapter 5 Structural change in agricultural production: Economics, technology and policy. In Handbook of Agricultural Economics; Elsevier: Amsterdam, The Netherlands, 2001; Volume 1, pp. 263–285. [Google Scholar] [CrossRef] [Scilit]
- Chang, J.J.; Chen, B.-L.; Hsu, M. Agricultural Productivity and Economic Growth: Role of Tax Revenues and Infrastructures. South Econ. J. 2006, 72, 891–914. [Google Scholar] [CrossRef] [Scilit]
- Popoola, O.; Asaleye, A.J.; Eluyela, D.F. Domestic Revenue Mobilization and Agricultural Productivity: Evidence from Nigeria. J. Adv. Res. Law Econ. 2018, IX, 1439–1450. [Google Scholar] [CrossRef] [Scilit] [PubMed]
- Besley, T.; Persson, T. Why Do Developing Countries Tax So Little? J. Econ. Perspect. 2014, 28, 99–120. [Google Scholar] [CrossRef] [Scilit]
- Schneider, F.; Buehn, A.; Montenegro, C.E. Shadow economies all over the world: New estimates for 162 countries from 1999 to 2007. In Handbook on the Shadow Economy; Edward Elgar Publishing: Cheltenham, UK, 2011; pp. 9–77. [Google Scholar] [CrossRef] [Scilit]
- Kouakou, D.C.M.; Yeo, K.I.H. Can Innovation Reduce the Size of the Informal Economy? Evidence from Panel Data. SSRN 2024. [Google Scholar] [CrossRef] [Scilit]
- Feld, L.P.; Schneider, F. Survey on the shadow economy and undeclared earnings in OECD countries. Ger. Econ. Rev. 2010, 11, 109–149. [Google Scholar] [CrossRef] [Scilit]
- Goel, R.K.; Nelson, M.A. Shining a light on the shadows: Identifying robust determinants of the shadow economy. Econ. Model 2016, 58, 351–364. [Google Scholar] [CrossRef] [Scilit]
- La Porta, R.; Shleifer, A. Informality and Development. J. Econ. Perspect. 2014, 28, 109–126. [Google Scholar] [CrossRef] [Scilit]
- Taymaz, E. Informality and Productivity: Productivity Differentials Between Formal and Informal Firms in Turkey; ERC—Economic Research Center, Middle East Technical University: Ankara, Turkey, 2009; Available online: http://erc.metu.edu.tr/en/system/files/menu/series09/0901.pdf (accessed on 29 April 2024).
- FAO. The State of Food and Agriculture. Innovation in Family Farming; FAO: Rome, Italy, 2014; Available online: https://openknowledge.fao.org/handle/20.500.14283/i4040e (accessed on 27 April 2024).
- Lowder, S.K.; Skoet, J.; Raney, T. The Number, Size, and Distribution of Farms, Smallholder Farms, and Family Farms Worldwide. World Dev. 2016, 87, 16–29. [Google Scholar] [CrossRef] [Scilit]
- Duffey, K.J.; Popkin, B.M. Shifts in Patterns and Consumption of Beverages Between 1965 and 2002. Obesity 2007, 15, 2739–2747. [Google Scholar] [CrossRef] [Scilit] [PubMed]
- Cavadini, C.; Siega-Riz, A.M.; Popkin, B.M. US adolescent food intake trends from 1965 to 1996. Arch. Dis. Child. 2000, 83, 18–24. [Google Scholar] [CrossRef] [Scilit] [PubMed]
- Sen Gupta, A. Determinants of Tax Revenue Efforts in Developing Countries; International Monetary Fund: Washington, DC, USA, 2007. [Google Scholar] [CrossRef]
- Nnyanzi, J.B. Main drivers of tax revenue in Uganda: Does the agriculture sector in its current form qualify for taxation? J. Bus. Manag. Appl. Econ. 2015, 4, 1–20. [Google Scholar]
- Schiff, M.; Valdés, A. The Plundering of Agriculture in Developing Countries. Financ. Dev. 1995, 32. Available online: https://www.elibrary.imf.org/view/journals/022/0032/001/article-A013-en.xml (accessed on 24 May 2024).
- Wiggins, S. African Agricultural Development: Lessons and Challenges. J. Agric. Econ. 2014, 65, 529–556. [Google Scholar] [CrossRef] [Scilit]
- Ohnsorge, F.; Yu, S. The Long Shadow of Informality. Challenges and Policies; World Bank Publications: Washington, DC, USA, 2022. [Google Scholar]
- Levenson, A.R.; Maloney, W.F. The informal sector, firm dynamics, and institutional participation. Policy Research Working Paper Series. 1998. Available online: https://ideas.repec.org/p/wbk/wbrwps/1988.html (accessed on 29 April 2024).
- Jaffee, S.; Henson, S.; Unnevehr, L.; Grace, D.; Cassou, E. The Safe Food Imperative: Accelerating Progress in Low- and Middle-Income Countries; World Bank: Washington, DC, USA, 2019. [Google Scholar] [CrossRef] [Scilit]
- FAO. Sustainable Food Systems Concept and Framework Brief; FAO: Rome, Italy, 2018. [Google Scholar]
- Von Braun, J.; Afsana, K.; Fresco, L.; Hassan, M.; Torero, M. Food Systems-Definition, Concept and Application for the UN Food Systems Summit. Sci. Innov. 2020, 27, 27–39. Available online: https://sc-fss2021.org/ (accessed on 3 July 2025).
- Dries, L.; Swinnen, J.F. Foreign direct investment, vertical integration, and local suppliers: Evidence from the Polish dairy sector. World Dev. 2004, 32, 1525–1544. [Google Scholar] [CrossRef] [Scilit]
- ILRI. More Milk by and for the Poor: Adapting Dairy Market Hubs for Pro-Poor Smallholder Value Chains in Tanzania; ILRI: Nairobi, Kenya, 2014. [Google Scholar]
- Gerber, P.J.; Steinfeld, H.; Henderson, B.; Mottet, A.; Opio, C.; Dijkman, J.; Falcucci, A.; Tempio, G.T. Tackling Climate Change Through Livestock. A Global Assessment of Emissions and Mitigation Opportunities; FAO: Rome, Italy, 2013. [Google Scholar]
- Mekonnen, M.M.; Hoekstra, A.Y. A Global Assessment of the Water Footprint of Farm Animal Products. Ecosystems 2012, 15, 401–415. [Google Scholar] [CrossRef] [Scilit]
- FAO. Global Livestock Environmental Assessment Model; FAO: Rome, Italy, 2017. [Google Scholar]
- Herrero, M.; Havlík, P.; Valin, H.; Notenbaert, A.; Rufino, M.C.; Thornton, P.K.; Blümmel, M.; Weiss, F.; Grace, D.; Obersteiner, M. Biomass use, production, feed efficiencies, and greenhouse gas emissions from global livestock systems. Proc. Natl. Acad. Sci. USA 2013, 110, 20888–20893. [Google Scholar] [CrossRef] [Scilit] [PubMed]
- FAO. Pathways Towards Lower Emissions; FAO: Rome, Italy, 2023. [Google Scholar] [CrossRef] [Scilit]
- Pathways to Dairy Net Zero. Available online: https://pathwaystodairynetzero.org/ (accessed on 5 February 2025).

Disclaimer/Publisher’s Note: The statements, opinions and data contained in all publications are solely those of the individual author(s) and contributor(s) and not of MDPI and/or the editor(s). MDPI and/or the editor(s) disclaim responsibility for any injury to people or property resulting from any ideas, methods, instructions or products referred to in the content. |
© 2025 by the authors. Licensee MDPI, Basel, Switzerland. This article is an open access article distributed under the terms and conditions of the Creative Commons Attribution (CC BY) license (https://creativecommons.org/licenses/by/4.0/).