


Abstract
Plant diseases have long been considered a major threat to global food production systems. Therefore, early diagnosis is vital to mitigate the risk of these diseases. This task can be challenging, as the number of harmful diseases is substantial. One technology that has gained widespread interest is artificial intelligence, specifically deep learning, which is used to identify plant diseases using leaf patterns. This paper presents two deep learning models, a custom CNN model and a transfer learning model based on the DenseNet-121 architecture. Experiments were carried out using the PlantCity dataset, which consists of twelve subsets of diverse crop species representing fruits, vegetables, and grains with variations among the subsets, including the number of classes, the subset sizes, class distribution, and visual complexity of disease symptoms. The two models were evaluated using multiple metrics, including accuracy, loss, precision, recall, and F1-score. Explainable AI using the LIME technique was deployed to better interpret the acquired results. Results showed that the developed transfer learning model based on DenseNet-121 had superior performance over the CNN model, with accuracies ranging from 86% to 99% across eleven experimented crops. In order to perform an independent experimental validation for the developed model, future work will focus on constructing a local crop dataset captured from Iraqi fields to evaluate the developed models based on the local environment.
1. Introduction
Agriculture is considered the cornerstone that enabled the development of early civilizations, particularly in Mesopotamia, the region that marked the beginning of this practice [1]. It is responsible not only for food production but also for generating economic benefits, conserving ecosystems, providing employment, and supporting community health worldwide [2]. Agriculture integrates the creativity, knowledge, and skills involved in crop cultivation with innovative production technologies. In addition, it contributes to maintaining sustainability by utilizing recent technological advancements. Agriculture plays a far more vital role than is often recognized, as it provides opportunities for socioeconomic equity and helps support prosperity on a global scale [3].
In Iraq, agriculture is widely practiced on smallholder farms. In the rainfed regions of northern and central Iraq, cereal crops, primarily wheat and barley, constitute the main agricultural production. In central and southern Iraq, where farming relies predominantly on irrigation from the Tigris and Euphrates rivers, dates are a principal product, with fruit trees such as oranges intercropped within date palm groves. Vegetables, including tomatoes and potatoes, are also important crops cultivated in these areas [4].
Plant diseases are abnormal physiological conditions caused by pathogens such as fungi, bacteria, and viruses, leading to reduced growth and development, reduced productivity and quality, and, in serious cases, plant death. Based on the type of pathogen, plant diseases can be classified into fungal, bacterial, viral, and nematode diseases. Moreover, new diseases may emerge in regions where they have not been previously reported, particularly in the absence of local knowledge [5]. For example, in Iraq, infected tomato samples were recently collected from multiple provinces across the country, and tomato yellow leaf curl virus (TYLCV) was identified [6]. Similarly, wheat streak mosaic virus has been reported in three Iraqi governorates, Baghdad, Erbil, and Mosul, where it infects a broad range of hosts, including wheat, barley, oats, and corn [7].
Plant diseases represent a critical threat to total crop production and global food security. According to the authors of [8], annual crop losses due to plant diseases are expected to exceed 30% worldwide, with an economic impact valued at hundreds of billions of dollars. Preventive treatments may not be sufficient for the effective control of epidemics and endemics. Therefore, early monitoring supported by a robust crop protection system and effective treatment is essential, since regular examination allows for early detection before the problems intensify. Moreover, it may support improved decision-making processes in optimizing agricultural productivity and mitigating reductions in production quality.
Infected plants often have noticeable lesions on stems, fruits, leaves, or flowers. Most precisely, each infection leaves distinct patterns that can be used to detect abnormalities.
Understanding plant diseases and their management is essential for maintaining agricultural productivity and ensuring food security. Given the extensive cultivated areas, such tasks can be challenging and require expertise and manpower, since the number of harmful crop diseases is considerable. Furthermore, manual inspection is subjective, requiring substantial time, and sometimes, the disease identified by farmers or experts may occasionally be inaccurate. Traditional identification techniques often fail to capture complex and visually similar leaf patterns. As a result, the use of inappropriate agrochemicals during plant disease monitoring can potentially reduce crop quality and pollute the ecosystem.
Therefore, recent technological advancements, particularly in image processing and artificial intelligence (AI), are being explored to enhance plant disease detection and classification, since the infection symptoms initially appear as visible spots and patterns on leaves [9].
Motivated by the need for more accurate and scalable methods for plant disease classification, this study proposes a modular deep learning-based architecture. Unlike previous studies that primarily focus on specific crop species, this work presents a unified framework for plant disease identification across multiple species using the publicly available PlantCity dataset [10]. The contribution of this study does not lie in proposing a novel deep learning architecture; rather, it lies in establishing a comprehensive multi-crop evaluation framework that combines crop-specific CNN baselines, transfer learning with DenseNet-121, and an explainable AI technique under real-field conditions. The performance of both models was evaluated using multiple metrics, including accuracy, loss, precision, recall, and F1-score, to determine the most effective classification approach. The main contributions of this paper are as follows:
- This paper demonstrates that transfer learning provides superior capability for heterogeneous multiclass classification problems compared with a custom CNN architecture.
- This paper develops a plant disease classification architecture that preprocesses leaf images for input into two DL models.
- This paper proposes two DL models, a convolutional neural network (CNN) and a transfer learning model based on DenseNet-121 for plant disease classification.
- This paper evaluates the proposed models using accuracy, loss, precision, recall, and F1-score metrics.
The rest of this paper is organized as follows. In Section 2, we present an in-depth survey of existing research on the use of AI in plant disease detection and classification. In Section 3, we describe our methodology, including detailed explanations of the employed dataset, data preparation, and DL models. In Section 4, we report our experimental results. Finally, in Section 5, we conclude our paper by presenting our findings, discussing their implications, and suggesting possible directions for future research.
2. Related Work
This section reviews recent studies to highlight the methods and techniques applied in the detection and classification of leaf diseases. Some of these studies focus on a specific plant, while others investigate multiple plant species.
The study in [11] proposed a classification technique based on an adapted version of a pre-trained model using the visual characteristics of potato leaves to classify leaves into five classes. The proposed model was trained on the PlantVillage dataset, which has three classes of potato leaves, while data for the remaining classes were collected manually. The DenseNet-201 model was modified by adding an extra transition layer to increase the compactness of the network. The PlantVillage dataset exhibits class imbalance; therefore, it was handled using the reweighted cross-entropy loss function to make the proposed algorithm more robust. The dense connections with regularization properties help to minimize overfitting during the training of limited training sets.
The study in [12] presented a DL technique for plant disease detection and classification utilizing ant colony optimization (ACO) with CNN. ACO was employed to improve disease diagnosis effectiveness, whereas the CNN classifier was used to distinguish differences in color, texture, and leaf geometry. The disease detection process consisted of several stages, including image acquisition, image separation, noise removal, and classification. However, the employed dataset (i.e., citrus fruits) was not clearly described in the study. Therefore, the aforementioned dataset was examined and found to consist of two parts: the first contains 609 images of healthy and unhealthy citrus leaves, and the second contains 150 images of healthy and unhealthy citrus fruits, for a total of 759 images [13]. Therefore, data augmentation is essential in this case due to the limited size of the dataset; however, it was not applied in the study.
The detection of plant diseases is currently performed by expert personnel, so the process can be quite time-consuming. Therefore, the primary objective of the study in [14] was to use DL-based disease detection techniques to enhance cherry production and enable early disease diagnosis. Additionally, the study investigated the impact of the dataset on performance using two different datasets. Furthermore, the authors examined the impact of hybrid architectures, combining convolutional neural networks (CNNs) and recurrent neural networks (RNNs), in addition to transfer learning methods and classical CNNs. For the PlantVillage dataset, AlexNet, VGG-16, MobileNet-V2, Inception-V3, and CNN models were compared. The best results were obtained from the MobileNet-V2 model and the CNN + LSTM model.
The study in [15] proposed a DL model for plant disease classification, focusing on potato diseases. The authors designed a CNN architecture that applied filters to input images to extract relevant features, followed by dimensionality reduction while preserving essential image characteristics. The study utilized the PlantVillage dataset, consisting of 2152 images of potato leaves categorized into three classes: healthy, early blight, and late blight. However, data augmentation was not applied in this study, although it is considered an essential technique for improving the model’s generalization capability by enhancing its robustness to variations in the input data. Furthermore, data augmentation assists in mitigating overfitting.
The study in [16] presented a DL-based automated diagnostic system for rice leaf diseases using a large-scale dataset composed of labelled images representing six common rice diseases. The study evaluated seven transfer learning models, among which GoogLeNet, DenseNet-121, ResNet-34, and VGG16 achieved the highest performance across multiple evaluation metrics. Subsequently, an ensemble model was constructed by integrating these four top-performing networks using an average fusion strategy. Although the ensemble model achieved superior accuracy, it required substantial computational resources, particularly during inference, which would limit its deployment in resource-constrained environments.
The study in [17] investigated the development of generalizable DL models for plant disease detection, intending to advance sustainable agricultural techniques and identify plant diseases under diverse conditions. A combined dataset was employed, combining the PlantDoc dataset with web-sourced images of plants from online platforms. Recent transfer learning architectures, including EfficientNet-B0, EfficientNet-B3, ResNet50, and DenseNet201, were deployed and fine-tuned for plant leaf disease classification. To improve model generalization, the study applied enhanced data augmentation techniques, particularly the addition of Gaussian noise to the images. The application of such techniques provided valuable insights into the resilience and adaptability of the models. The experimental results demonstrated varied performance across the datasets. Furthermore, the effects of noise addition varied significantly across different models and experiments. However, this addition led to potential sensitivity of the models to noise, especially in noisy environments where various environmental factors could introduce unpredictable variations. Another limitation in this study is the class imbalance within the datasets, which may hinder the ability of the model to reliably classify all plant species, particularly underrepresented diseases. Table 1 presents a summary of recent studies utilizing a DL approach for plant disease detection. The table summarizes each study by the authors’ names, publication year, DL technique, the utilized dataset, the experimented plant, the number of classes, and any limitations imposed by the study.
Table 1.
Summary of recent studies utilizing DL for plant disease detection.
3. Materials and Methods
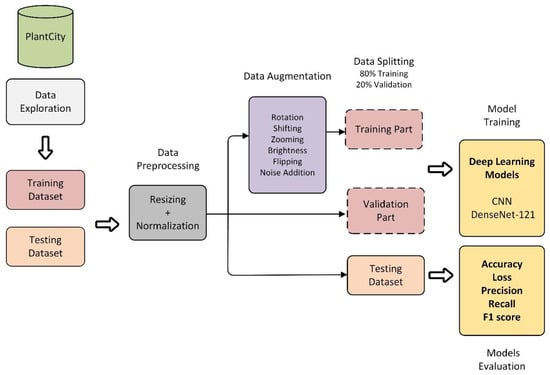
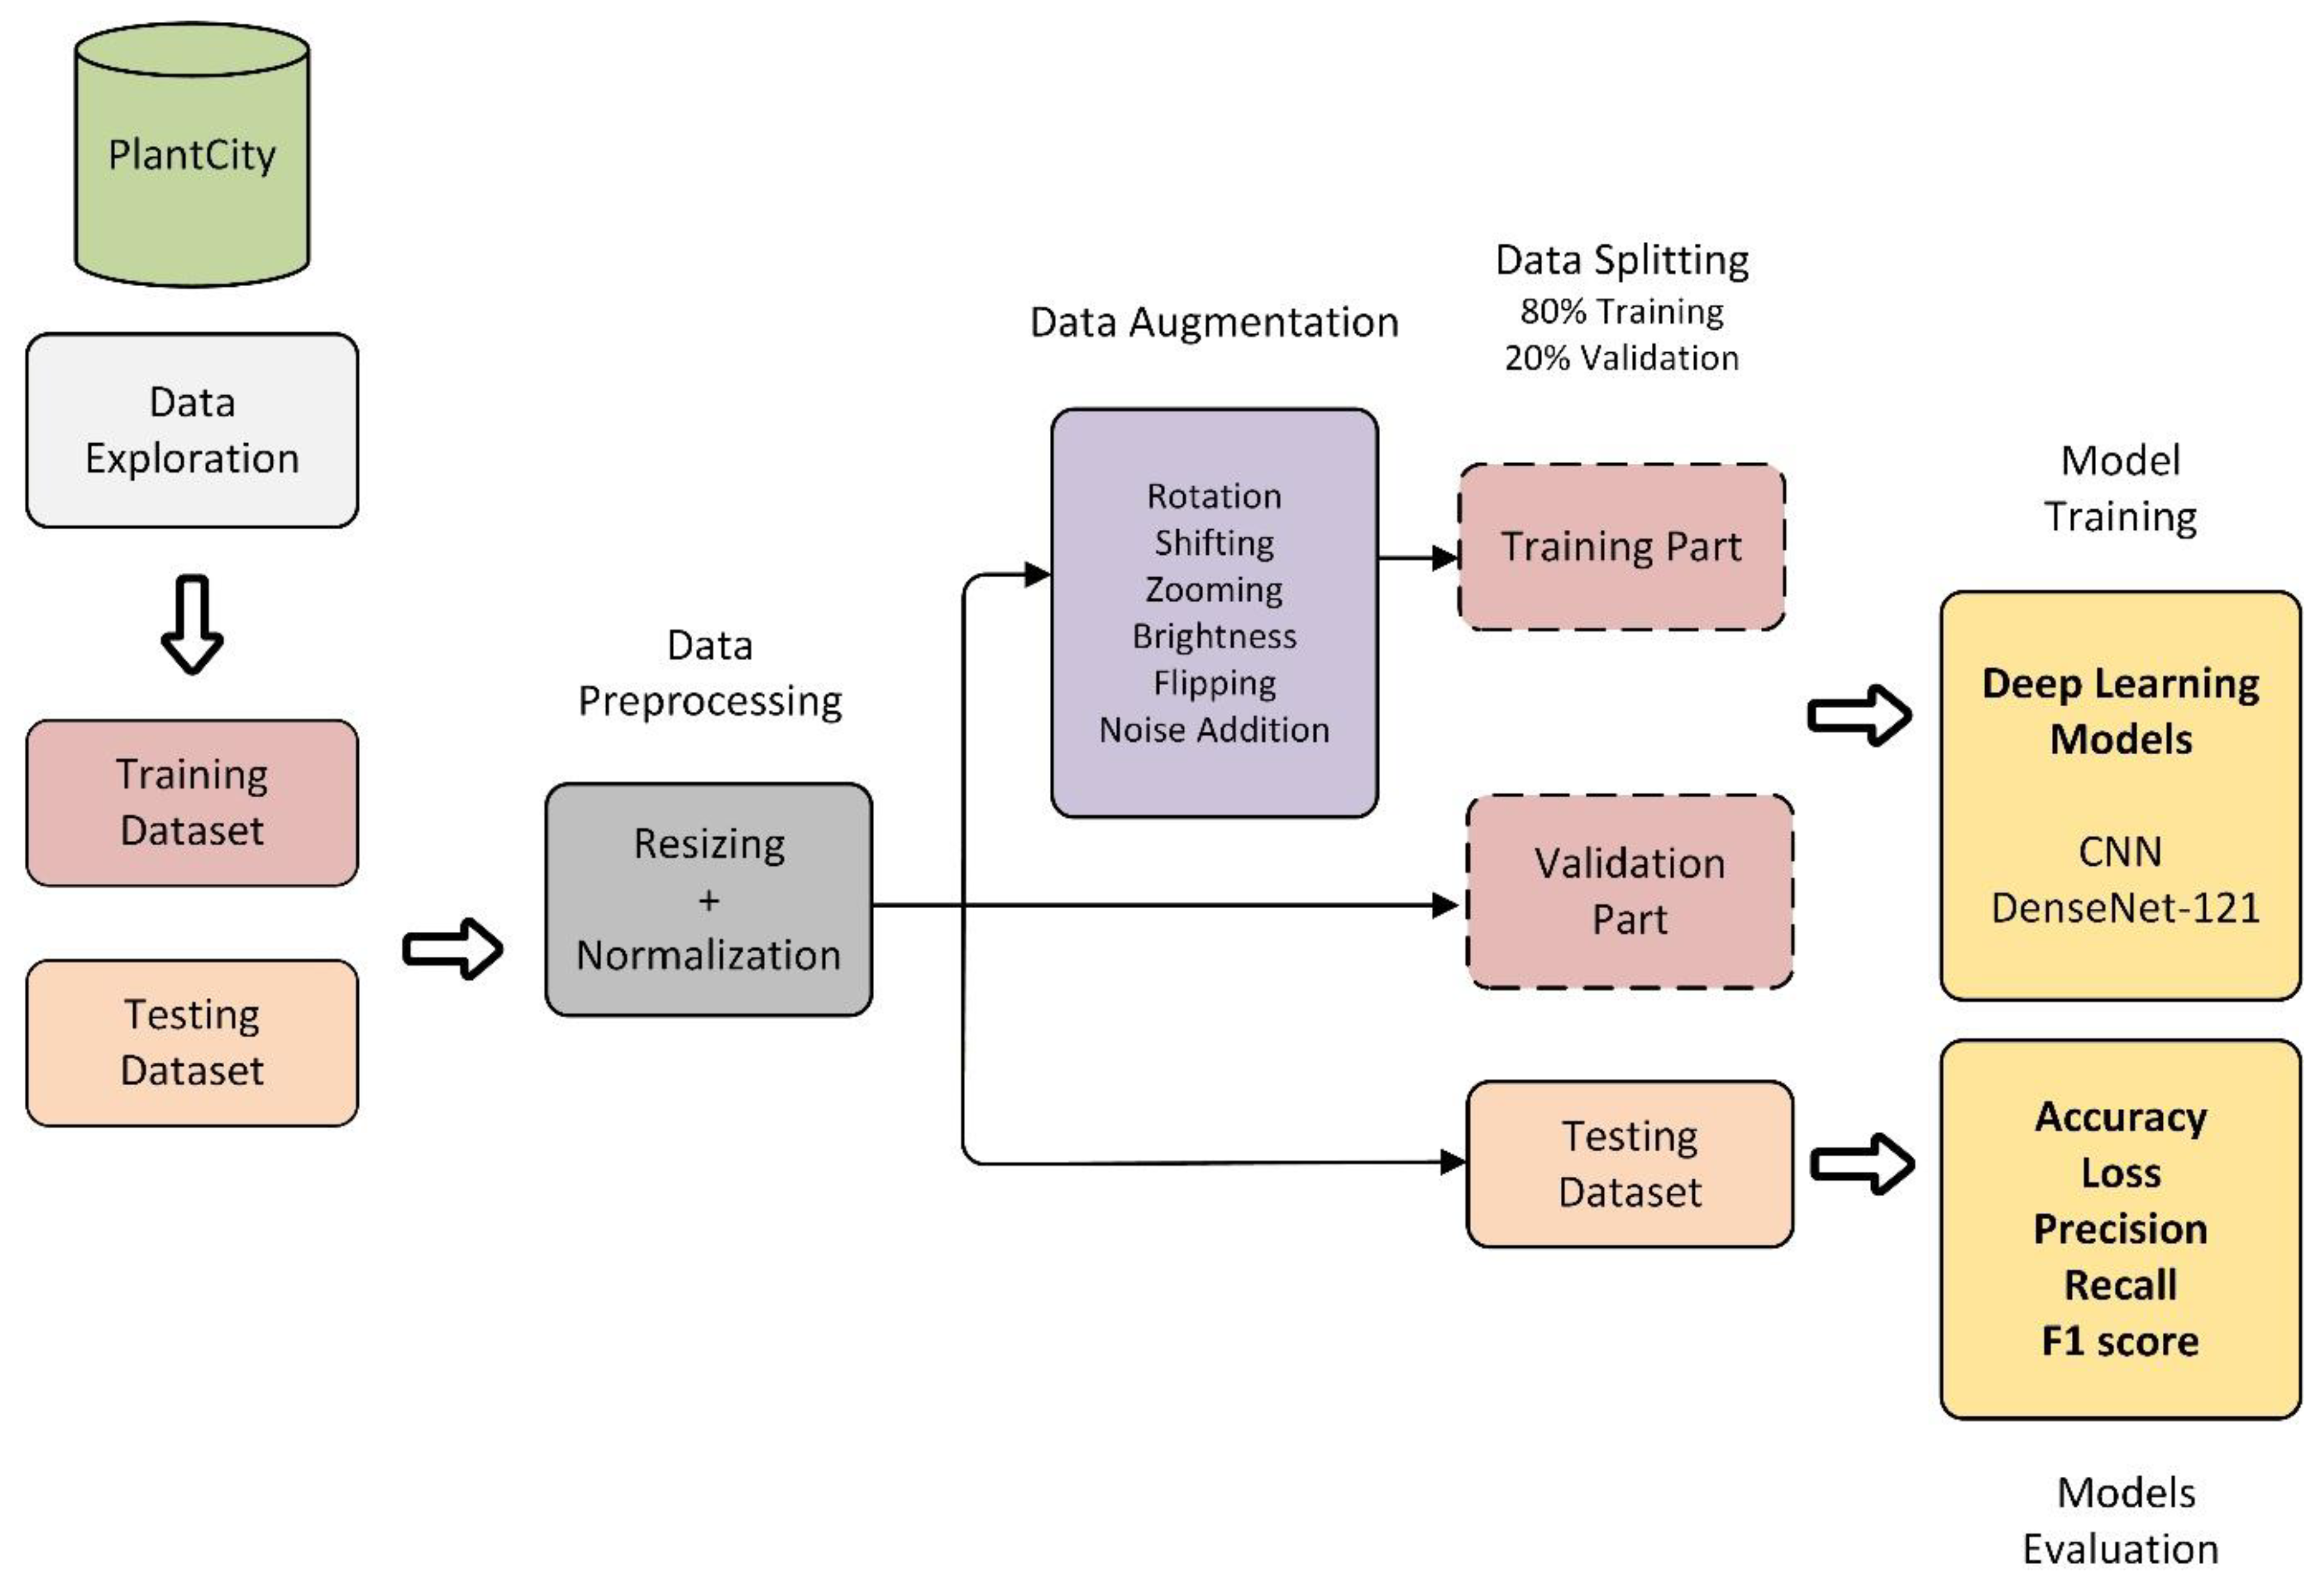
In this section, the dataset utilized in this study is explained, in addition to the methods used for data preparation, augmentation, and the development of the DL models. Furthermore, the evaluation metrics employed in this study are explained with the necessary equations. Figure 1 presents the complete pipeline of our proposed plant disease detection architecture. It consists of a sequence of three main processes, starting with data exploration, followed by data preparation and augmentation, and ending with DL model training and evaluation.
Figure 1.
The complete system architecture.
3.1. Data Exploration, Preparation, and Augmentation
PlantCity [10] is a comprehensive dataset created to mitigate substantial agricultural field losses caused by plant diseases. The images constituting the dataset were collected under real-field conditions in Pakistan between April 2023 and July 2024. They are captured from two districts with significant differences in temperature. The first district is Charasadda, where the temperature ranges from 40 to 44 °C, while the second district is Chitral, where the temperature ranges from 25 to 30 °C. Tomato samples were collected from Charasadda district, while the remaining crop samples were collected from Chitral due to its convenient weather conditions that enhance crop growth.
A Canon EOS 1200D camera was used to capture the images under natural daylight. The cameras were placed at a distance of 30–50 cm from the leaves to ensure consistent and clear images. Moreover, three settings were used for capturing high-resolution images: first, using ISO settings with a resolution of 5184 × 3456, second, an Infinix Hot 10 model with a resolution of 4608 × 3456, and third, an Infinix Hot 5 model with a resolution of 1872 × 4160.
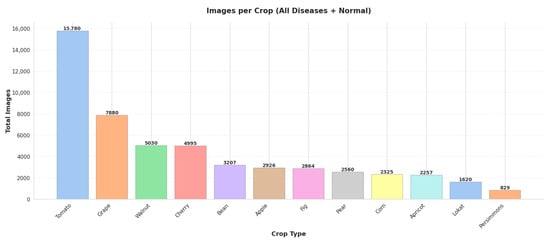
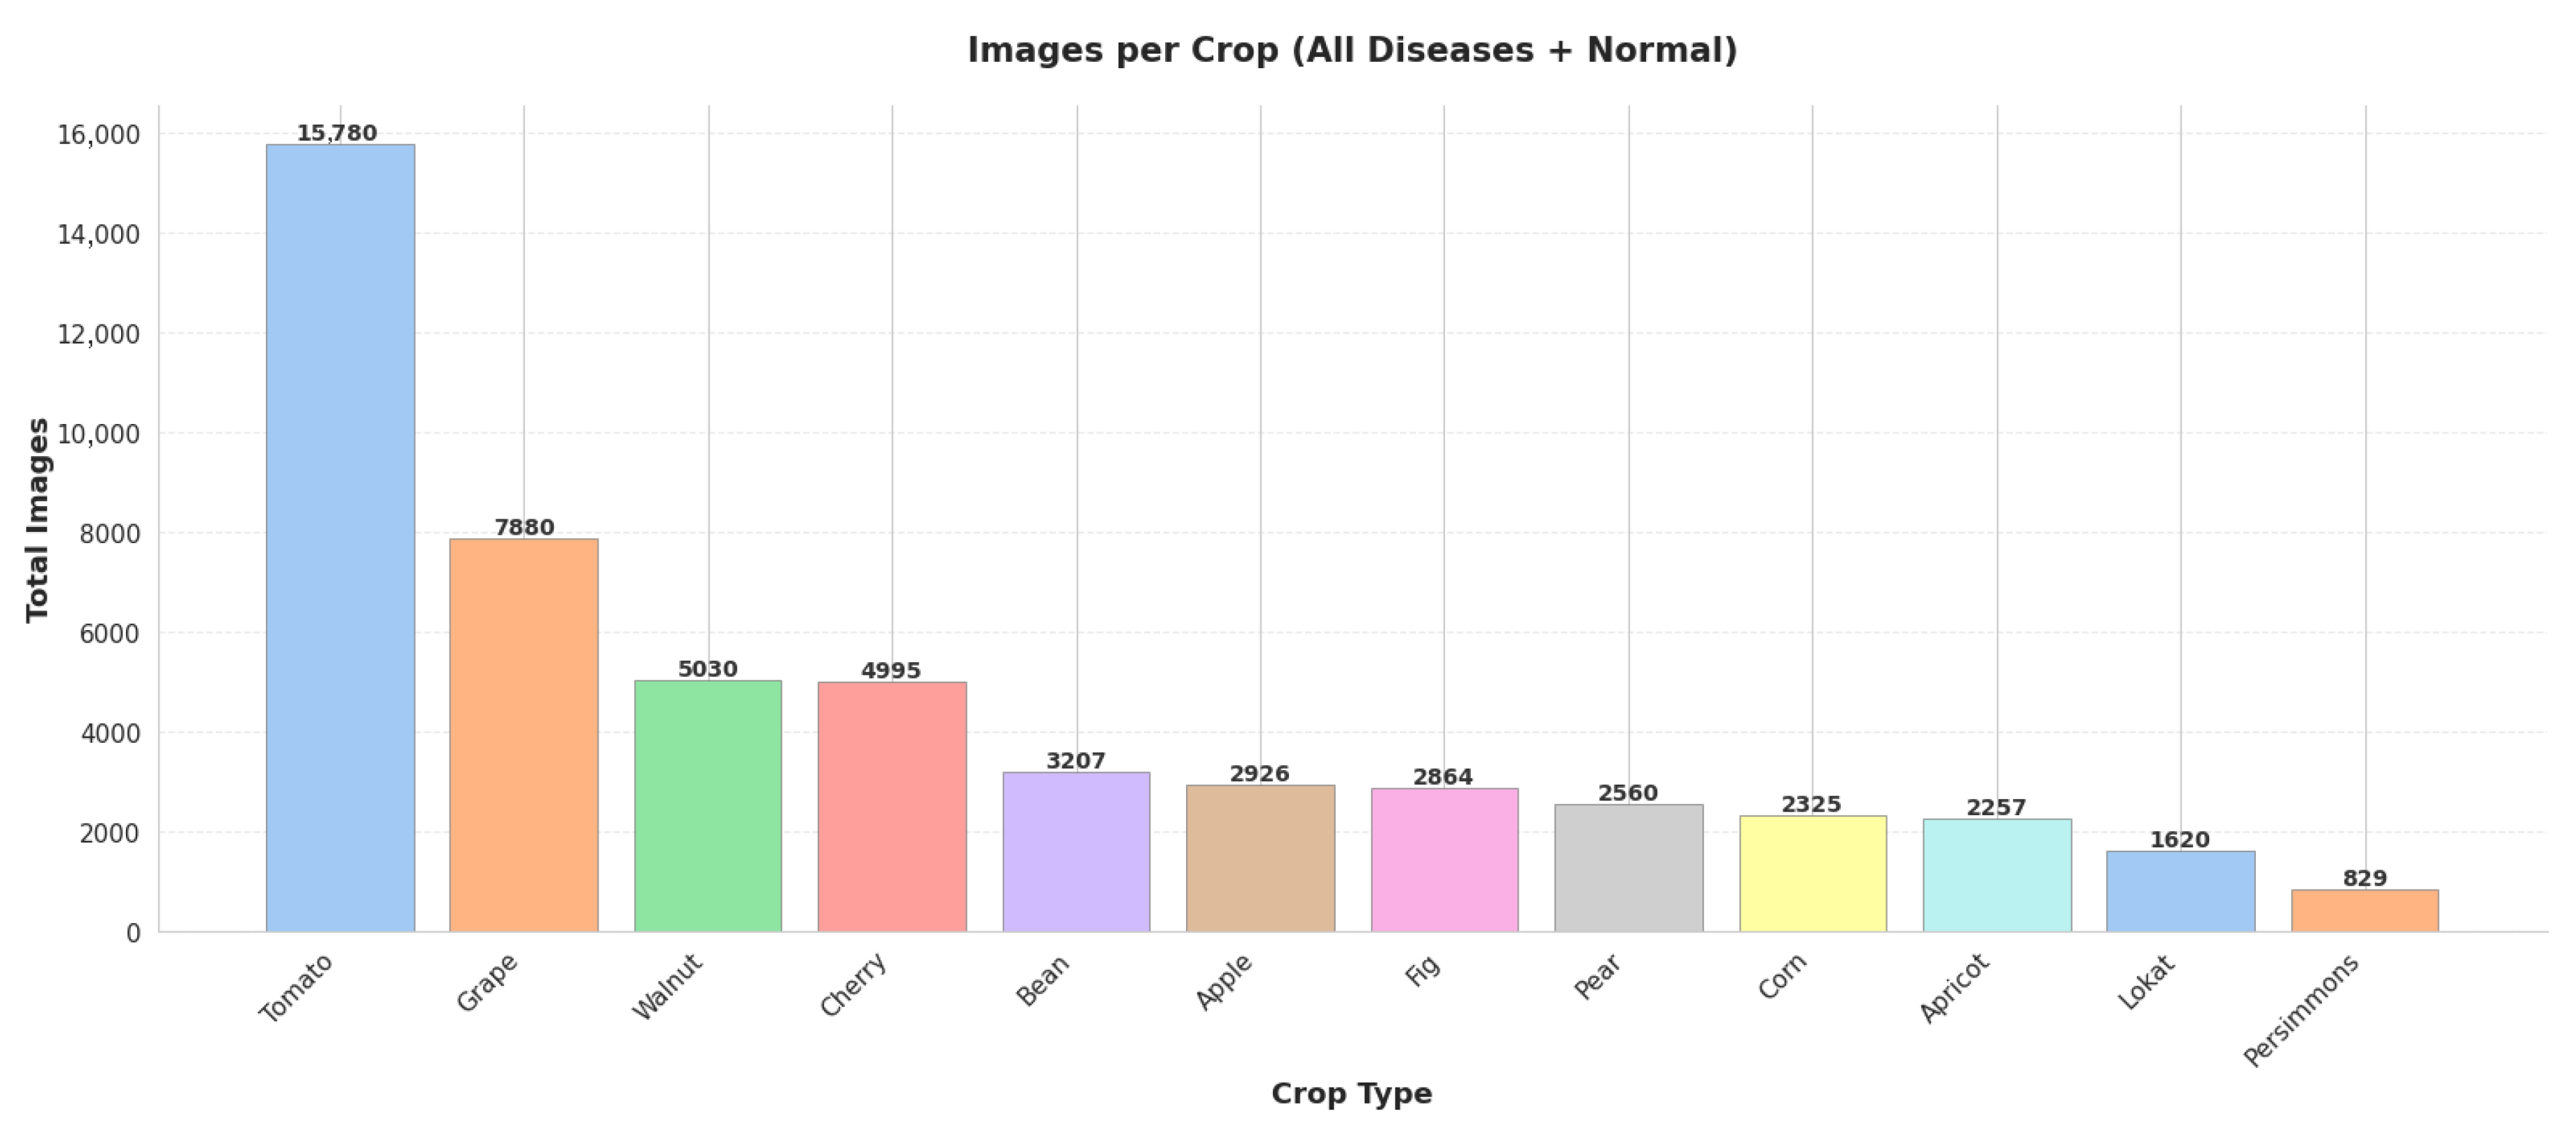
Originally, the PlantCity dataset contains 10,667 fine-grained, high-resolution leaf images belonging to twelve healthy and infected plant species, including apple, apricot, bean, cherry, fig, grape, loquat, corn, pear, persimmon, tomato, and walnut. The original dataset, i.e., the PlantCity dataset, was augmented using multiple augmentation techniques, resulting in a total of 52,273 RGB images. The dataset utilized smart-based multimedia, specifically leaf images, to support early detection and identification of plant diseases. Figure 2 demonstrates the twelve plant species with their image counts. As observed from Table 2, the plant sets vary in size. For instance, tomato is the largest set with 15,780 images distributed among eleven classes. After Tomato comes grape with 7880 images distributed among seven classes.
Figure 2.
The twelve plant species with their image count.
Table 2.
Details of the PlantCity dataset split by class and the total image count for each plant.
It is worth mentioning that one-class classification aims to train a model to identify in-class samples from out-of-class samples when training using samples from only a single class. However, the approach cannot be applied to the persimmon dataset, since it contains a diseased class, i.e., the persimmon brown spot, not the healthy persimmon leaf. Therefore, persimmon was excluded from the experimental evaluation.
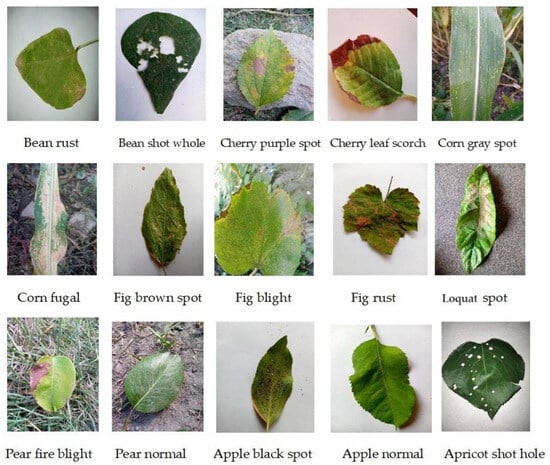
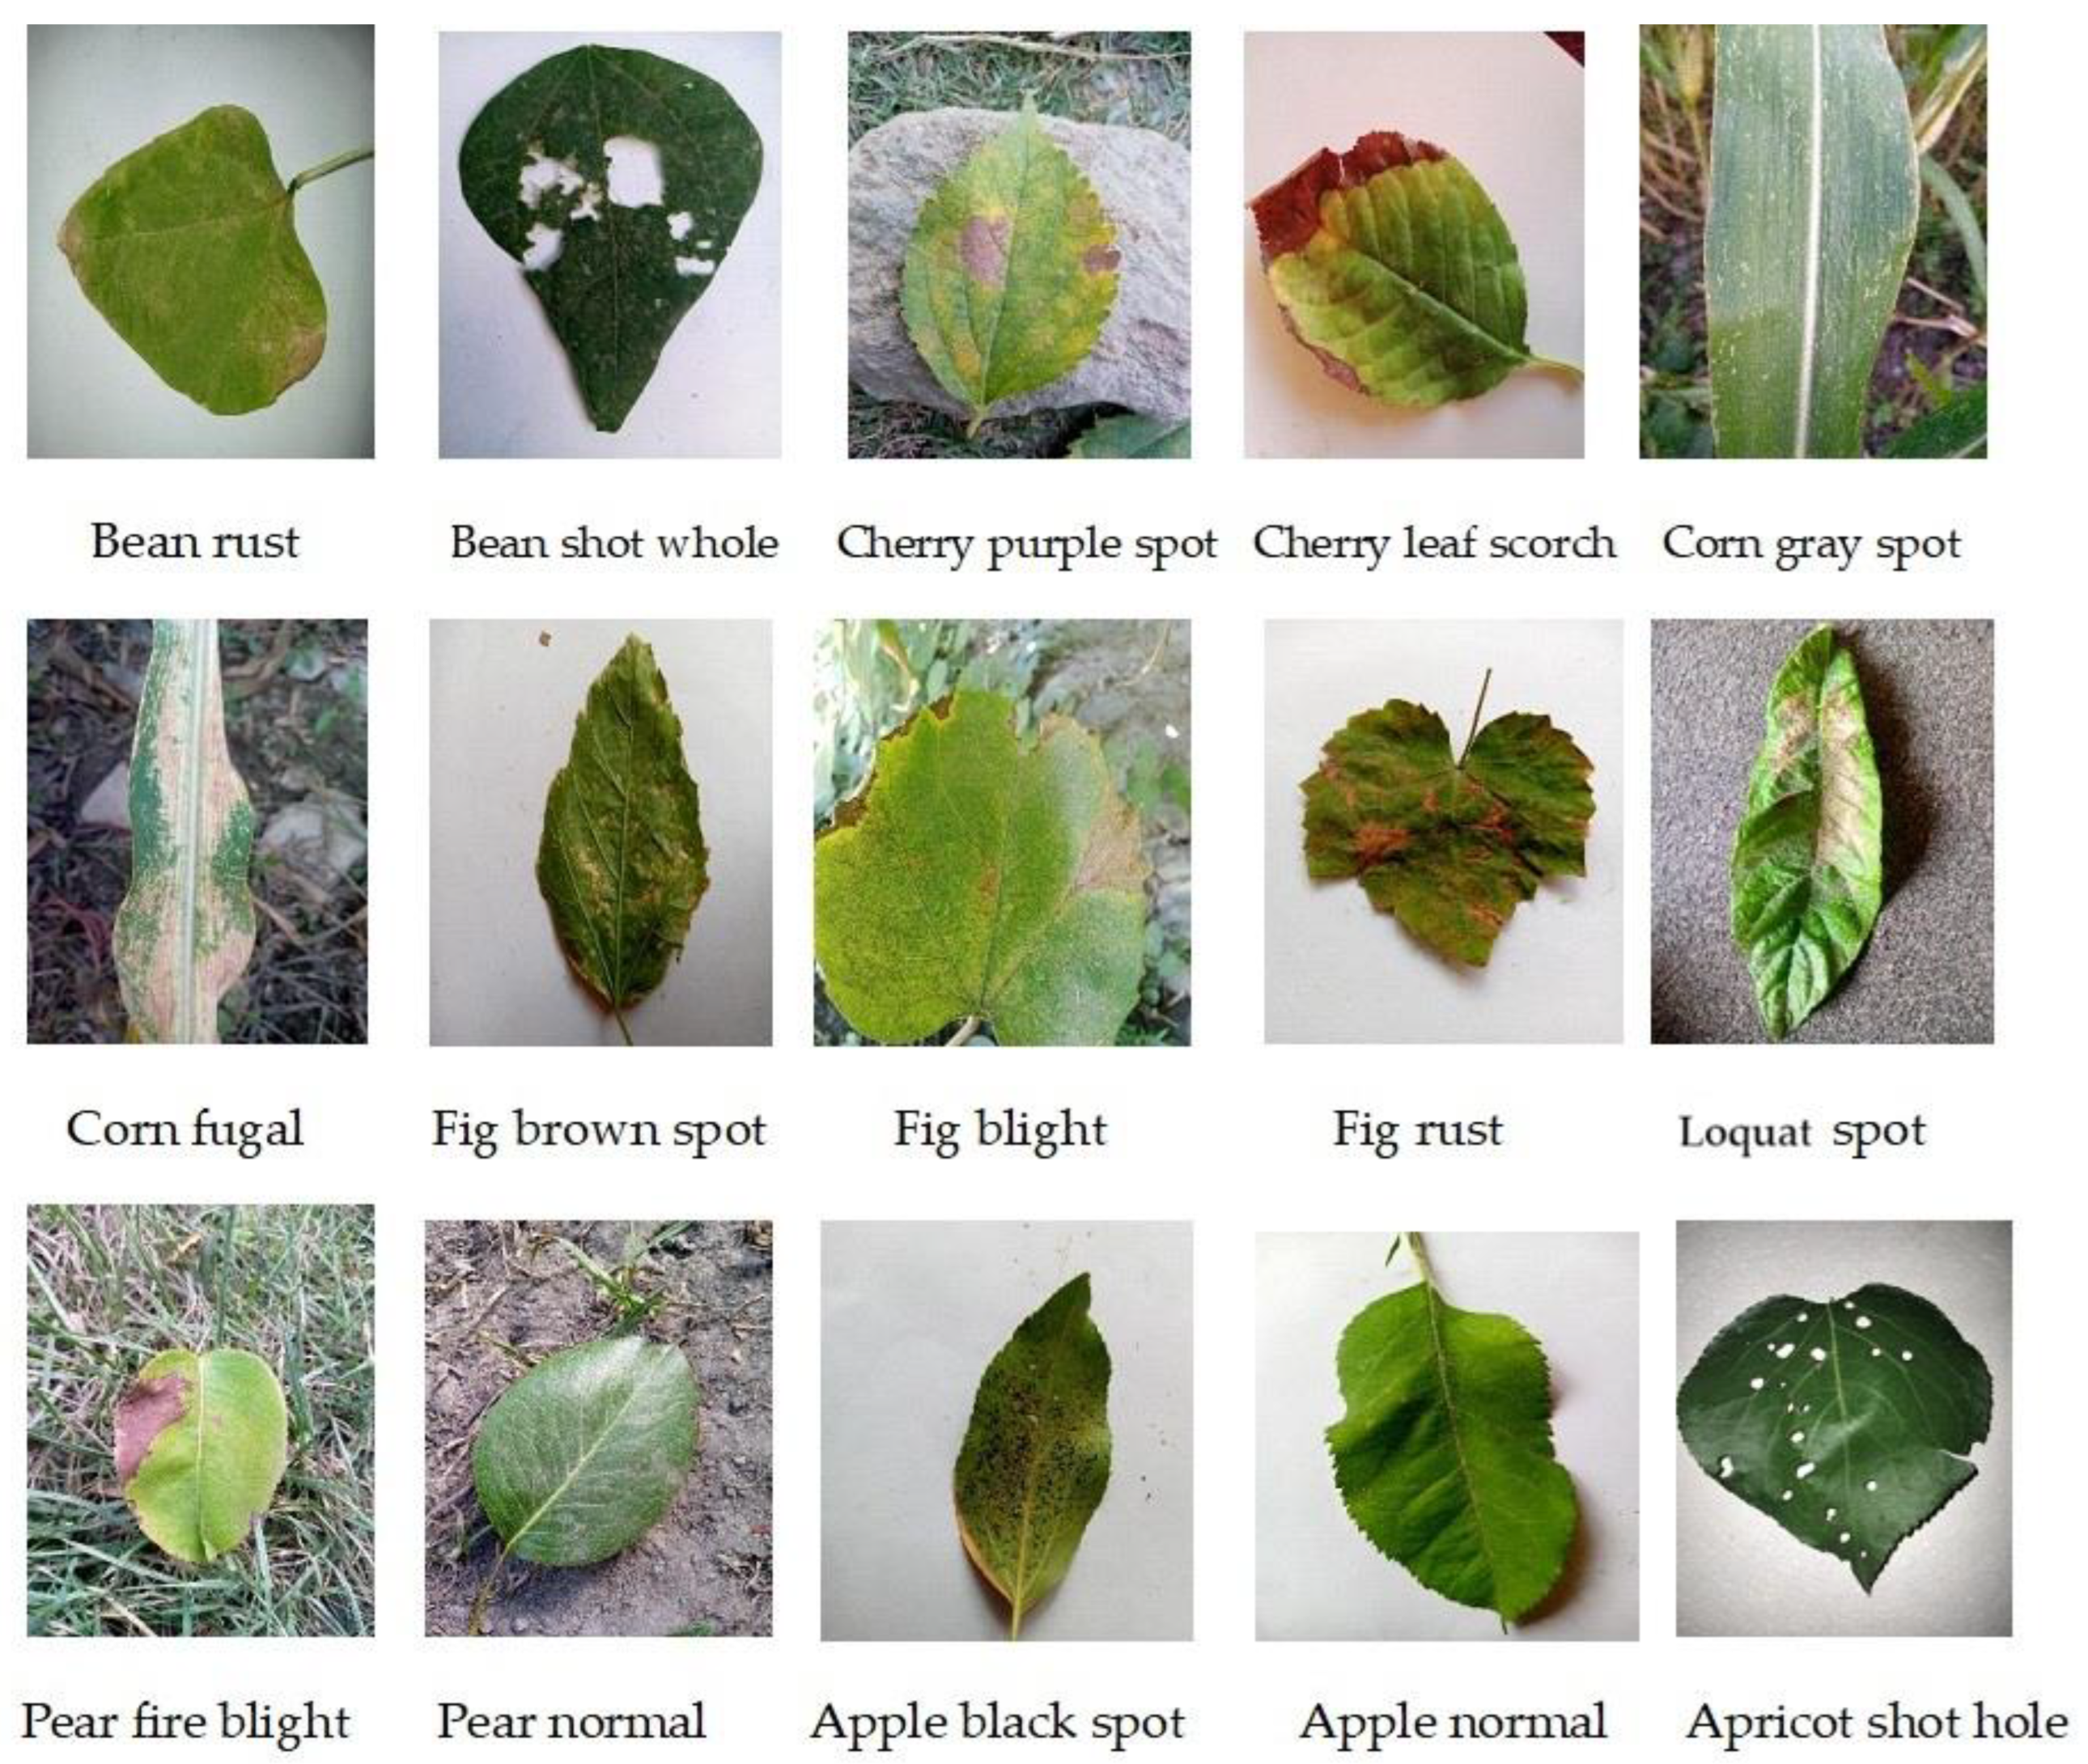
One of the benefits of this dataset is its coverage of diverse plant types, i.e., fruits, vegetables, and grains. Figure 3 shows samples of these images with a description of the infecting disease in case it is not a normal leaf image. Each plant has a normal leaf set beside the infected sets of images.
Figure 3.
Samples of images from the PlantCity dataset and their descriptions.
For instance, the total number of parameters in deep learning models, specifically CNNs, depends on the input size. Throughout the training process, the total number of parameters should remain stable. Similarly, the size of the input image should be consistent [18]. Since the images in the dataset have varying dimensions, the best way to handle this variation is by resizing. Resizing is performed to match the dimensions of the smallest image in the dataset. Therefore, all the images are resized to 224 224 3 (height, width, and channels), as a standardized format. After resizing, the images are processed by the model in batches of 32 images each. Deep learning models work better when the input images are normalized [19]; therefore, all pixel values are scaled to the range [0, 1] [20].
After normalization, the training set is split into two parts, 80% for training and 20% for validation. The images in the training part are augmented by adding slight variations to prevent overfitting resulting from imbalanced datasets introduced by some disease images that are rarely identified in natural environments [21]. Augmentation is an efficient technique of modifying the available data to artificially generate additional data [22]. It enhances the training process of the DL models, particularly when the dataset is limited or when data collection is expensive. In this study, we use several augmentation techniques, including rotation, shifting, flipping, and noise addition.
In image rotation, the images are randomly rotated between −25 and +25, while information in the rotated images remains unchanged. Rotation promotes robust generalization to unseen data since it learns diverse image orientations. The second augmentation technique is shifting, in which the image is randomly shifted left or right by 15% of the image width. Moreover, the image is randomly shifted up or down by 15% of the image height. Shifting the image vertically or horizontally can change the position of the objects in the image, giving more variety to the model.
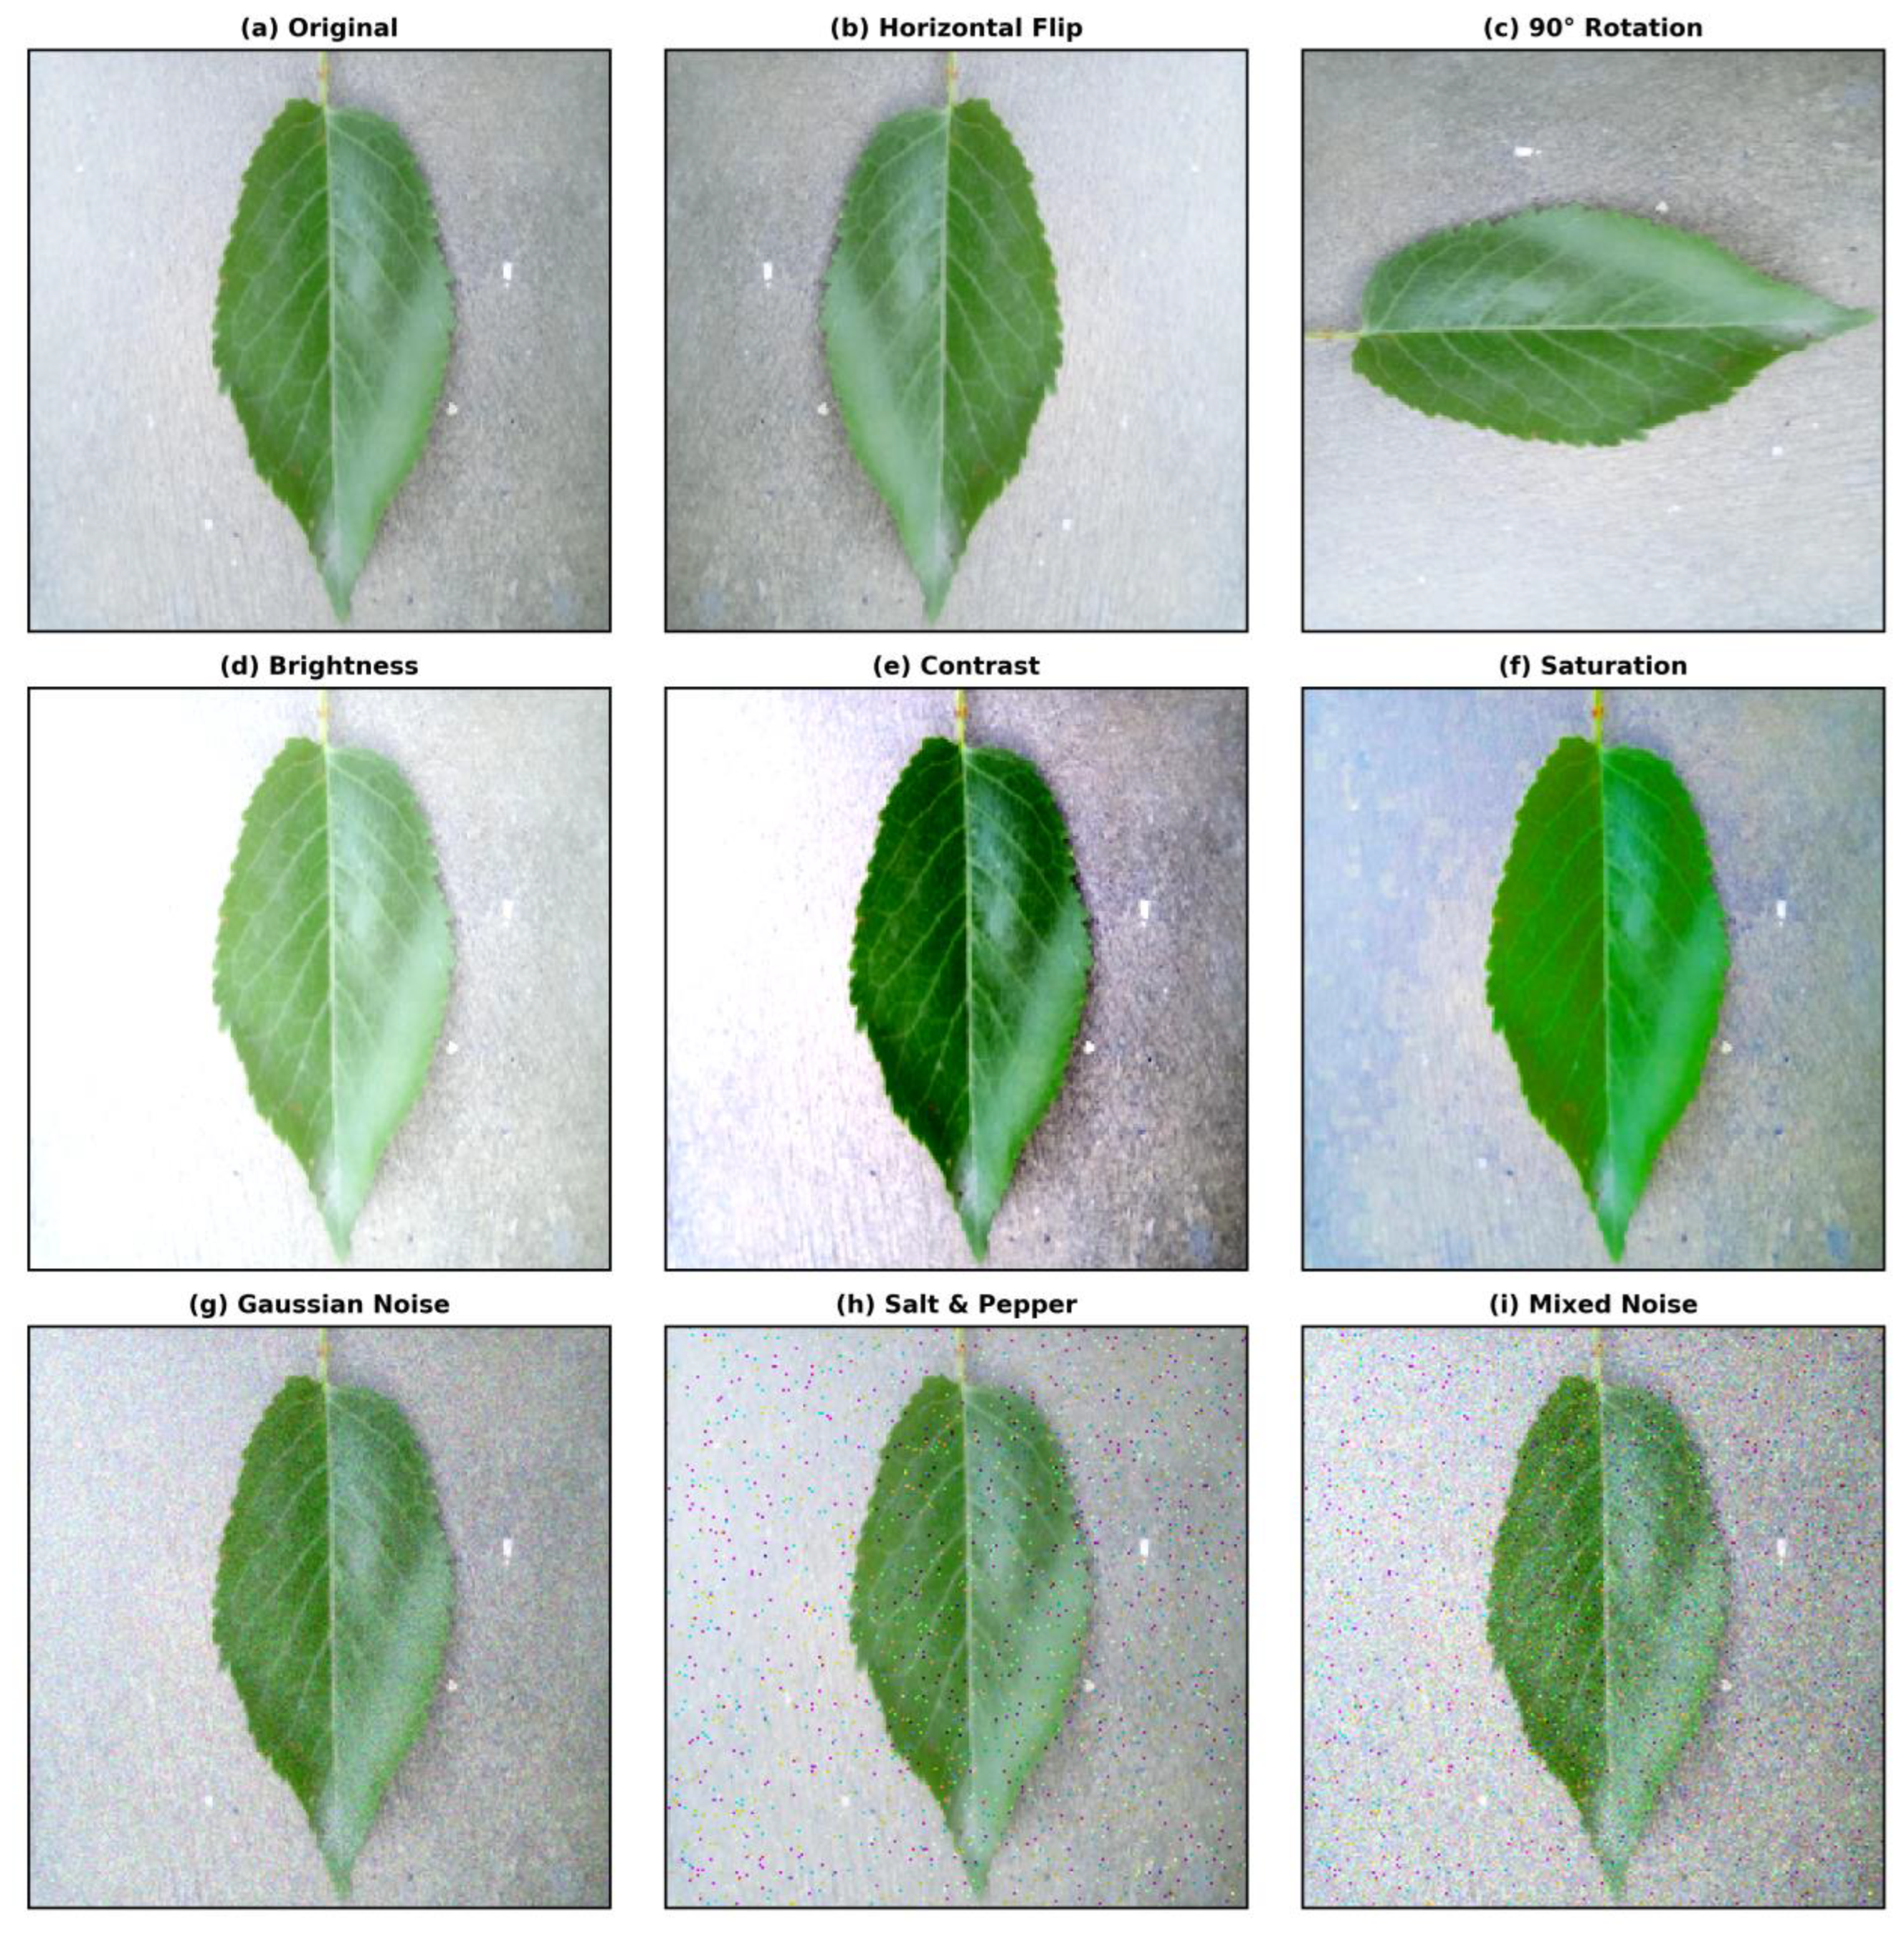
After shifting, the image is randomly zoomed in or out by up to 20%. Next, flipping is applied, which is considered an extension of the rotation technique. The images are flipped in the left–right direction and the up–down direction. Finally, noise addition, in which small random noise is added to create variations [23]. Two types of noise are added to the image data, specifically, Gaussian noise and Salt and Pepper noise. Data augmentation is applied exclusively to the training part to avoid data leakage. Data leakage occurs when information that would not be available at inference is used when building the model, resulting in overly optimistic performance estimates, and thus poorer performance when the model is used on actually novel data. One of the reasons for data leakage is not keeping the test and train data subsets separate. In the case of the PlantCity dataset, the training and testing sets are provided in separate folders; therefore, only the training part is augmented, i.e., after splitting the training folder into a training part and a validation part. It is worth noting that data augmentation does not increase the dataset size. It only increases the number of images passed to the network per batch. Table 3 presents the deployed augmentation techniques with their values that are used in all the conducted experiments. Figure 4 shows a sample image with multiple augmentation techniques applied to it.
Table 3.
The augmentation techniques.
Figure 4.
A sample image and multiple augmentation techniques applied.
In deep learning, specifically when dealing with classification problems, an imbalanced dataset like PlantCity is a common challenge. This imbalance can result in biased models that perform well on the majority class but poorly on the minority class. The scikit-learn library in Python 3.14 provides class_weight parameter to address this issue. Using this parameter, classes with fewer samples receive larger weights while classes with many samples receive smaller weights. In this way, more attention is paid to rare disease classes, and less attention is paid to classes that have many images. Table 4 shows the use of the class_weight parameter to handle the class imbalance of corn and cherry in the PlantCity dataset. As we can observe, the corn fungal leaf class, which is the class with the fewest samples, gains the highest weight, while the corn normal leaf, which is the class with the largest number of samples, gains the smallest weight. Likewise, the cherry shot hole disease, which is the class with the fewest samples, gains the highest weight, while the cherry leaf scorch, which is the class with the largest number of samples, gains the smallest class weight.
Table 4.
Image counts and the assigned class weights for corn and cherry in the training experiments.
3.2. Deep Learning Models
In this section, the utilized DL models, custom CNN and DenseNet-121, are explained with their detailed architecture.
3.2.1. CNN
A convolutional neural network (CNN) is a type of DL network mainly designed for tasks that require object detection, for instance, image segmentation and classification [24]. It consists of essential layers [25], as follows:
The input layer takes the original image and feeds it into the network for processing. The input image is generally represented as a three-dimensional tensor (width × height × depth).
The convolution layer extracts important features from the input image by applying a set of trainable filters. These filters slide over the input image and perform element-wise multiplication between the filter weights and the aligned input patches, generating feature maps. These feature maps detect patterns such as edges, textures, and shapes.
The batch normalization layer is used to enhance the training of deep neural networks by stabilizing the learning process. It introduces noise to the network activations to handle overfitting by adding randomness to the system [26].
The pooling layer is commonly inserted between convolutional layers. It is used to reduce the spatial dimensions of the feature maps, thus reducing computational cost and memory requirements. As a result, it may prevent overfitting. The two common types of pooling layers are the maximum pooling and the average pooling.
The dropout layer randomly deactivates a subset of neurons, preventing their output from being propagated to the next layer. In this way, the network is driven to learn more robust and generalizable features, therefore preventing overfitting.
The dense layer is a fully connected layer, in which every neuron in this layer is connected to every neuron in the previous layer. It is used to learn complex global patterns and relationships across the entire input image. A typical CNN includes one or more dense layers in the head block. The intermediate dense layer uses ReLU activation to provide non-linearity and learn complex feature combinations. The number of units in this layer is a tunable hyperparameter, i.e., 128, 256, and 512. While the output dense layer is considered the final layer, producing the network’s prediction. For multiclass classification, it has N units, where N represents the number of classes, and a softmax activation. As shown in Table 2, the number of classes in this study varies since each plant has a different number of diseases affecting it. For example, tomato has eleven classes while Loquat has two classes.
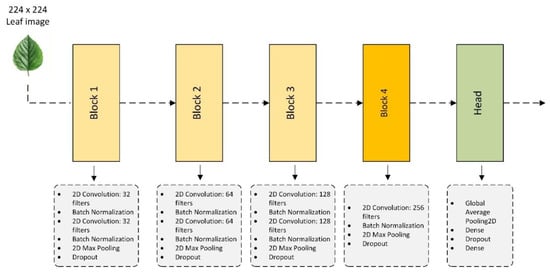
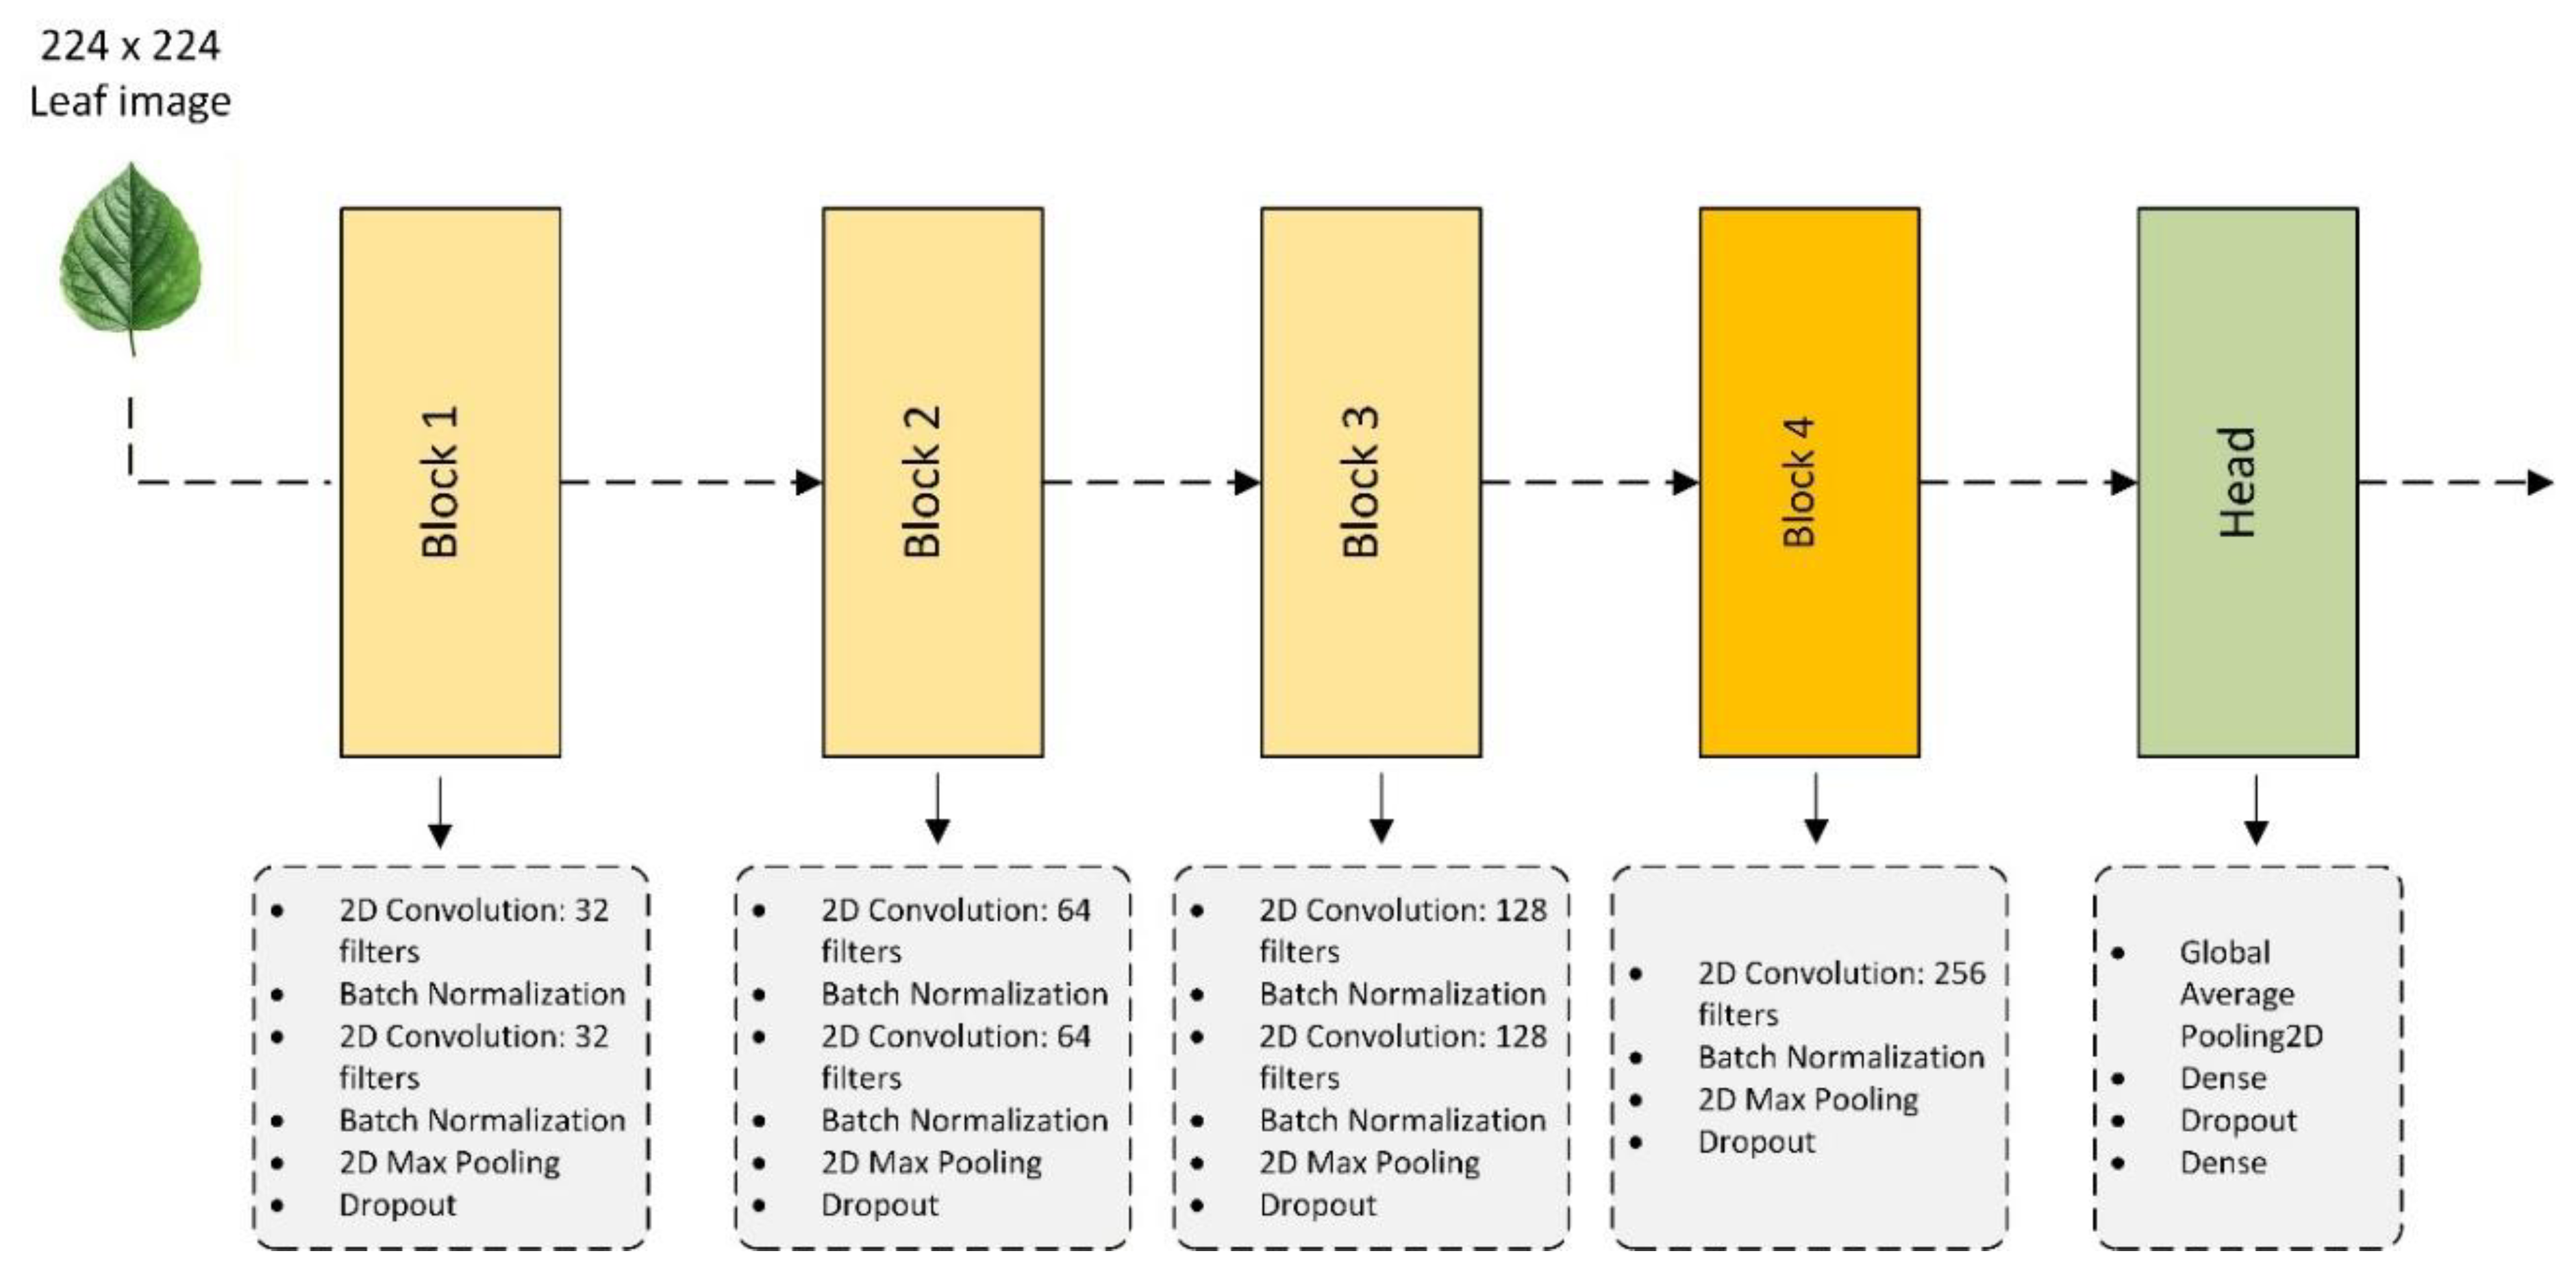
The proposed CNN model consists of four blocks, besides the input and the head block. Each of these four blocks has a specific task. The first block extracts low-level features like edges. The second block detects mid-level shapes and textures, while the third block detects complex patterns. Lastly, the fourth block is responsible for the high-level feature aggregation. The detailed architecture of each block and the head is described in Figure 5.
Figure 5.
The proposed CNN model.
It is worth noting that the CNN architecture was adapted for each crop dataset because the number of classes, dataset size, and visual complexity varied across plant species. Initial experiments were conducted to determine an architecture that achieved stable training behavior while minimizing overfitting. As a result, the number of convolutional filters, dense units, and dropout rates were adjusted for each crop-specific model. Table 5 presents the CNN architecture for each crop, where GAP denotes the presence of the Global Average Pooling layer. When there is no GAP, this means that the architecture employs a Flatten layer instead.
Table 5.
CNN Architecture for each crop.
3.2.2. DenseNet-121
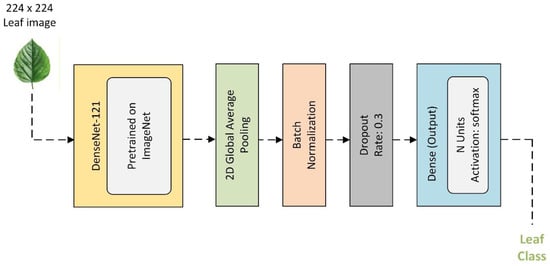
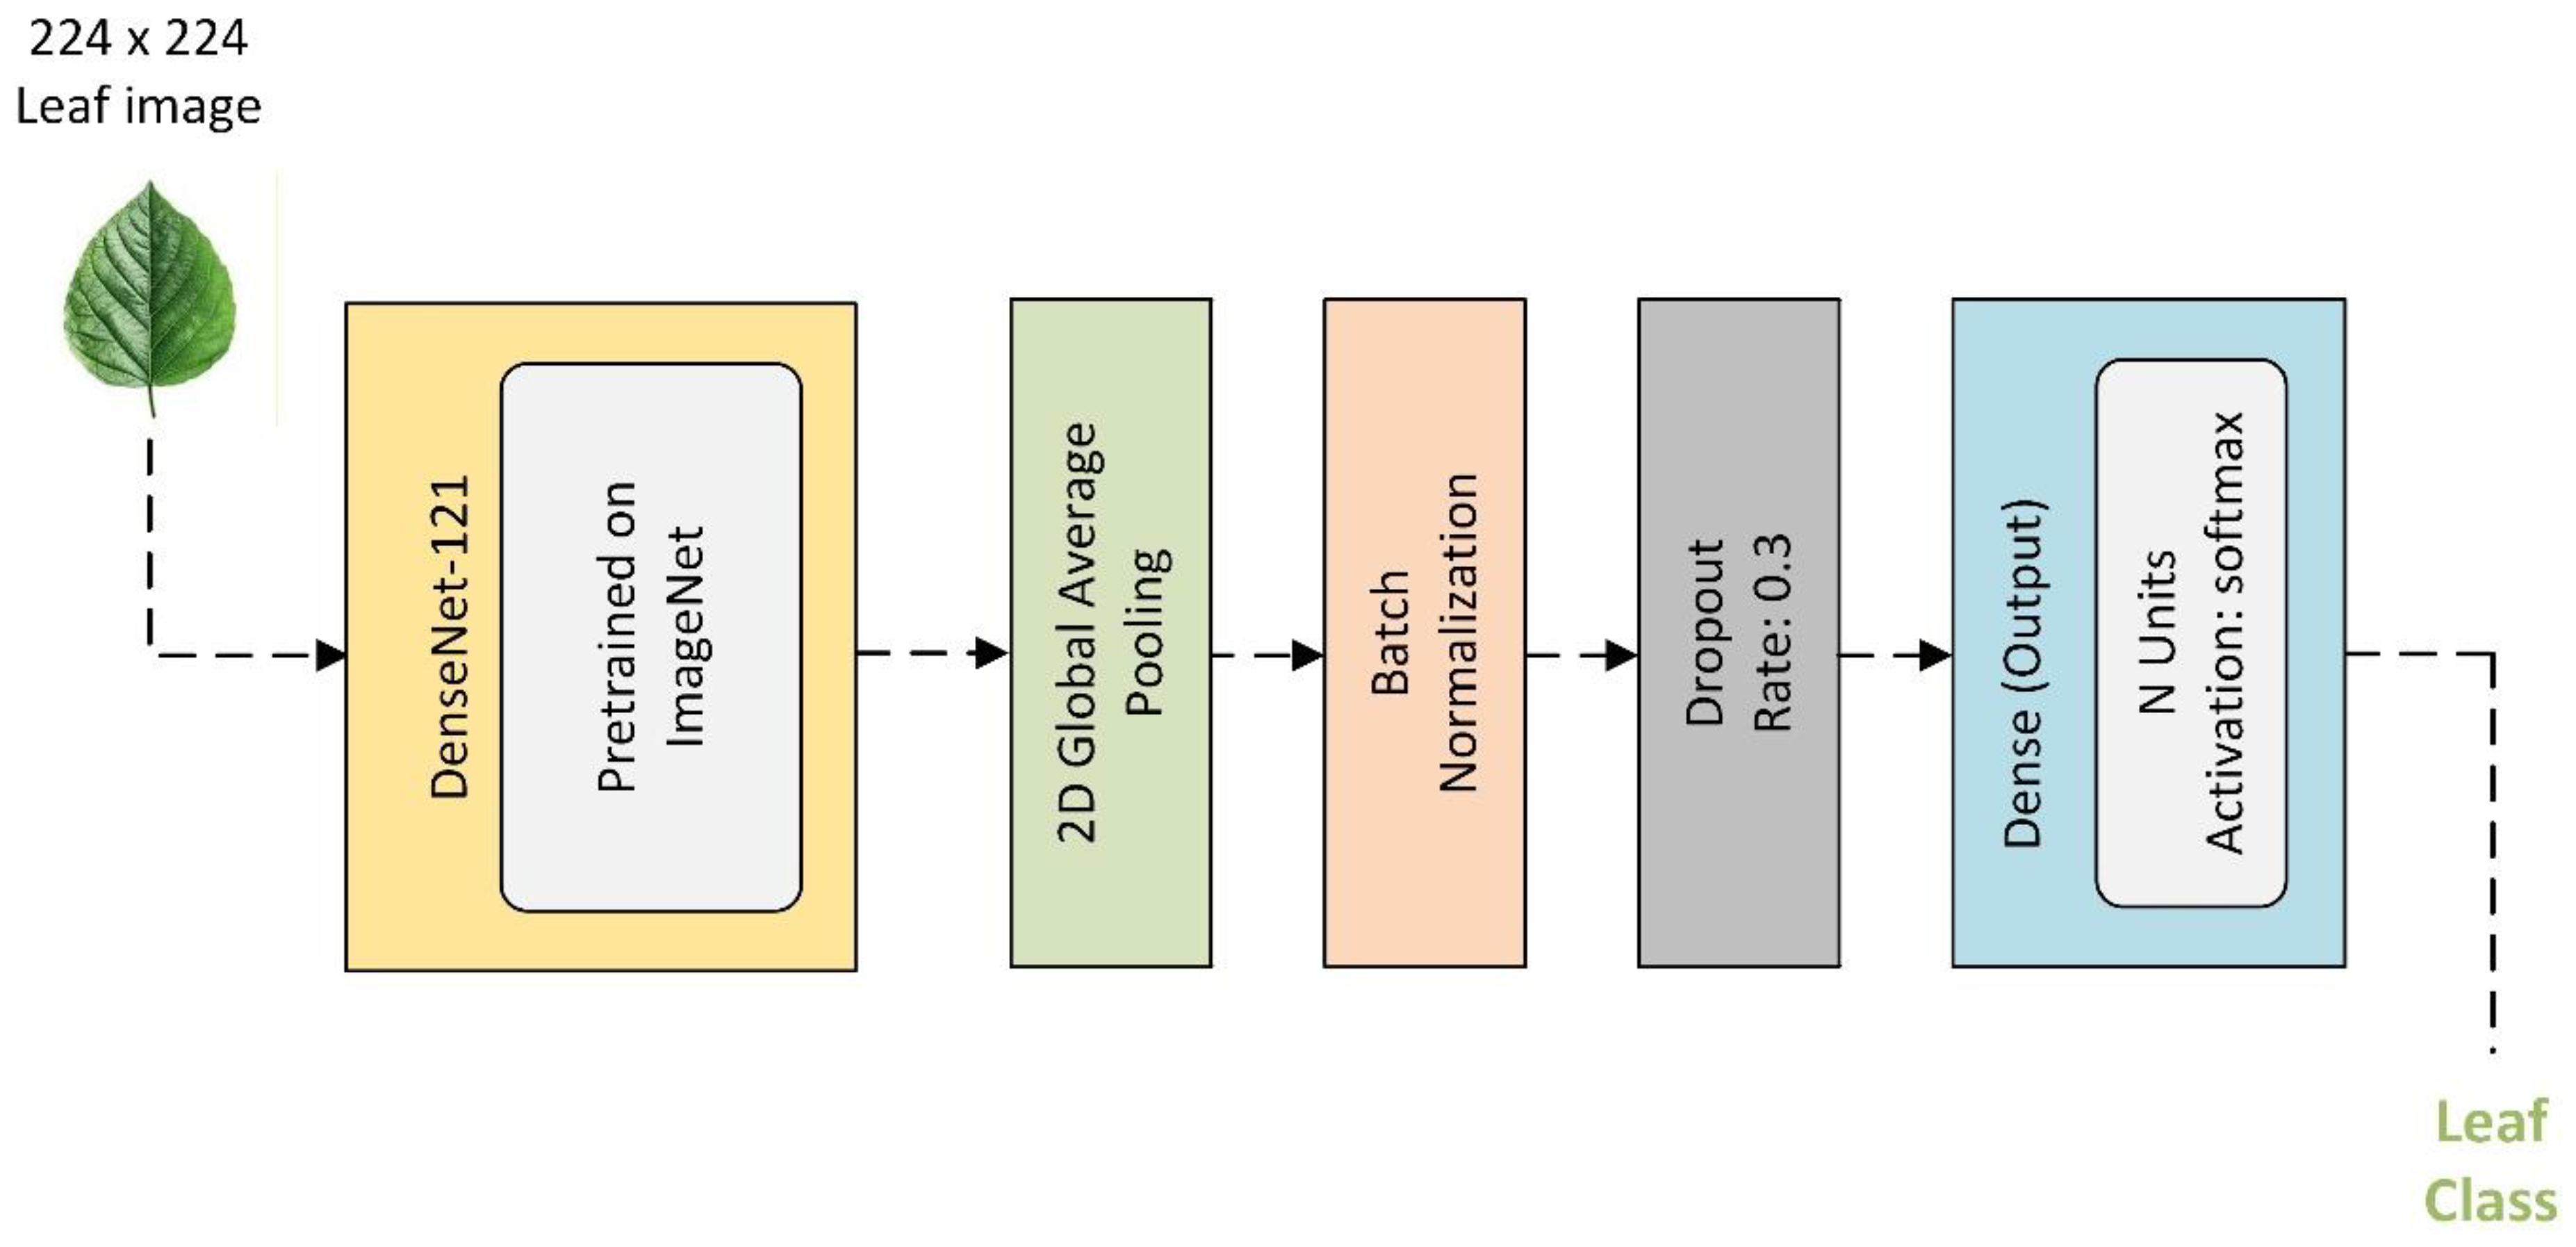
As CNN networks became deeper, two significant challenges were identified by researchers. First, during backpropagation, gradients tend to diminish in deeper layers, thereby hindering effective training. Second, deeper layers often learn redundant features, resulting in computational and memory inefficiencies. To overcome these challenges, the Dense Convolutional Network (DenseNet) was proposed in 2017 by Gao Huang et al. [27]. It is a DL model that belongs to the family of CNNs and is primarily designed for image classification [28]. It is characterized by its distinct connectivity pattern in which the output of each layer is passed to all subsequent layers, since each layer is connected to all subsequent layers in a feed-forward approach, whereas in conventional CNNs, each layer is connected only to the next layer. The result of this dense connectivity is the improvement of feature reuse and gradient flow, thereby facilitating the training of deeper networks while mitigating the vanishing gradient problem. It consists of 121 layers and is characterized by its ability to balance the trade-off between accuracy and computational efficiency. In addition, it is considered an ideal candidate for tasks entailing moderate computational resources [29]. The DenseNet-121 model was previously trained with the ImageNet dataset, which consists of 1.2 million colored images with 1000 image categories [30]. In this study, the DenseNet-121 model is fine-tuned on the PlantCity dataset for plant disease classification. Following the DenseNet-121 backbone, a Global Average Pooling layer has been employed to decrease the dimensions of the image and restrict the number of parameters to prevent overfitting. Batch normalization has been applied to stabilize the training process and speed up the convergence of the network. A dropout layer has been incorporated to enhance the generalization ability of the network by preventing neurons from co-adapting to each other’s output. At last, a dense layer with softmax activation has been applied to perform task-specific multiclass classification. Figure 6 demonstrates the architecture of the DenseNet-121 model proposed in this work. Table 6 presents the hyperparameter tuning for the employed DenseNet-121 model. The hyperparameters were selected based on preliminary experiments and commonly adopted settings in transfer learning studies. Alternative configurations were evaluated during model development, and the chosen values provided stable convergence and consistent performance across the heterogeneous crop datasets.
Figure 6.
The proposed DenseNet-121 model.
Table 6.
The DenseNet-121 hyperparameter tuning.
3.3. Evaluation Metrics
To evaluate the two DL models, multiple metrics are utilized, including accuracy, cross-entropy loss, precision, recall, and F1-score [2]. A detailed explanation for each metric is presented in this section. Accuracy is an essential metric for evaluating the performance of a classification model [31] that shows the proportion of correct predictions produced by the model out of all predictions. However, it can give a false positive (FP) interpretation of achieving high accuracy. The problem stems from the possibility of misclassification of minor class samples exhibiting excessively high values. The classification accuracy is computed according to the following equation:
where TP is the true positive, TN is the true negative, FP is the false positive, and FN is the false negative.
Precision is the proportion of all the model’s positive classifications that are actually positive. It is computed according to the following equation:
Recall is the proportion of all actual positives that were classified correctly as positives. It is mathematically defined as the following equation:
The F1 score is the harmonic mean of precision and recall. It is computed according to the following equation:
In multiclass classification scenarios, categorical cross-entropy is commonly used as a loss function to measure the effectiveness of the model in predicting the correct class [32]. It measures the difference between the predicted probability distribution obtained from the model and the true label distribution, i.e., the one-hot encoded labels. As a result, the categorical cross-entropy guides the model to assign a higher probability score to the correct class compared to other classes. In this metric, high loss indicates that the prediction exhibits a large deviation from the ground-truth class, while lower loss indicates that the DL model is performing well. To measure the cross-entropy, the DL model should use the softmax activation function as a final layer to convert raw outputs, i.e., logits, into a probability distribution over the classes where probabilities sum to 1. The cross-entropy loss is computed according to the following equation:
where L is the cross-entropy loss, is the true probability of class k, is the predicted probability of class , and is the number of classes.
3.4. Explainable AI with LIME
In this section, we investigate the importance of explainable AI (XAI) in enriching transparency and trust in complicated AI models. LIME (Local Interpretable Model-agnostic Explanations) is one of the XAI techniques that is used to clarify the predictions of deep learning models locally. The word locally in this context means for individual predictions instead of the model as a whole. The purpose of LIME is to reveal insights into the reason behind the model making a specific prediction for a particular instance. This is crucial for complex models like transfer learning models, where one of the challenges is understanding the reason behind individual predictions.
In image data, distinct pixels may not thoroughly extract meaningful information. Instead, pixel clusters are generated by grouping similar adjacent pixels, forming more core features. These clusters can be selectively deactivated by setting their values to zero. This approach modifies the feature set effectively, allowing us to gauge which image segments have the greatest impact on predictions, thereby assisting in the interpretation of model decisions.
4. Results and Discussion
In the experiments, we utilize Python, tensorFlow, and Keras to develop two DL models, the CNN model and the DenseNet-121 model. The proposed models are executed on Kaggle platform, a computational environment that facilitates collaborative and reproducible analysis. GPU T4 2 is utilized to speed up the execution. The dataset of each plant is uploaded to a Kaggle notebook that is created specifically for that plant. Moreover, all the notebooks were executed under the same Kaggle configuration and GPU settings.
PlantCity, the dataset employed in this study, consists of 12 plant species; each plant is considered a separate dataset. Persimmon was excluded from training since it has only one class, the persimmon brown spot. Therefore, the two models are trained and evaluated on eleven datasets of varying sizes, with each plant species having a different number of classes. These details were clarified in Table 2. In this study, two DL models were trained; the first model is a CNN model built from scratch, and the second model is a transfer learning-based model that leverages the feature extraction capabilities of DenseNet-121. The aforementioned dataset was used to fine-tune the pre-trained DenseNet-121 model.
PlantCity consists of multiple plant datasets whose sizes differ across plant species, and the leaf class distributions are also uneven. Furthermore, image textures vary between plants, since each plant leaf is infected in a different way according to the disease affecting that specific plant. For these reasons, classifying the images as normal or infected by a specific disease becomes challenging. Therefore, the architecture of the first DL model, i.e., the CNN model, is not identical for all plant species. Several modifications are applied to the proposed model shown in Figure 5 for multiple plants to gain better performance. These modifications were explained in Section 3.2.1 and clarified in Table 5. Nevertheless, the architecture of the transfer learning-based model deployed in this study remains identical for all the plant species.
During training, the DenseNet-121 model, early layers already capture generic visual features such as edges, textures, and shapes; therefore, it is essential to fine-tune deeper layers to adapt to the plant-specific dataset. Consequently, the model achieves better generalization with the transfer learning-based model utilizing DenseNet-121, with a better overall performance among all plant species, as illustrated in Table 7, compared to the results obtained from the CNN model shown in Table 8.
Table 7.
DenseNet-121 model results.
Table 8.
CNN model results.
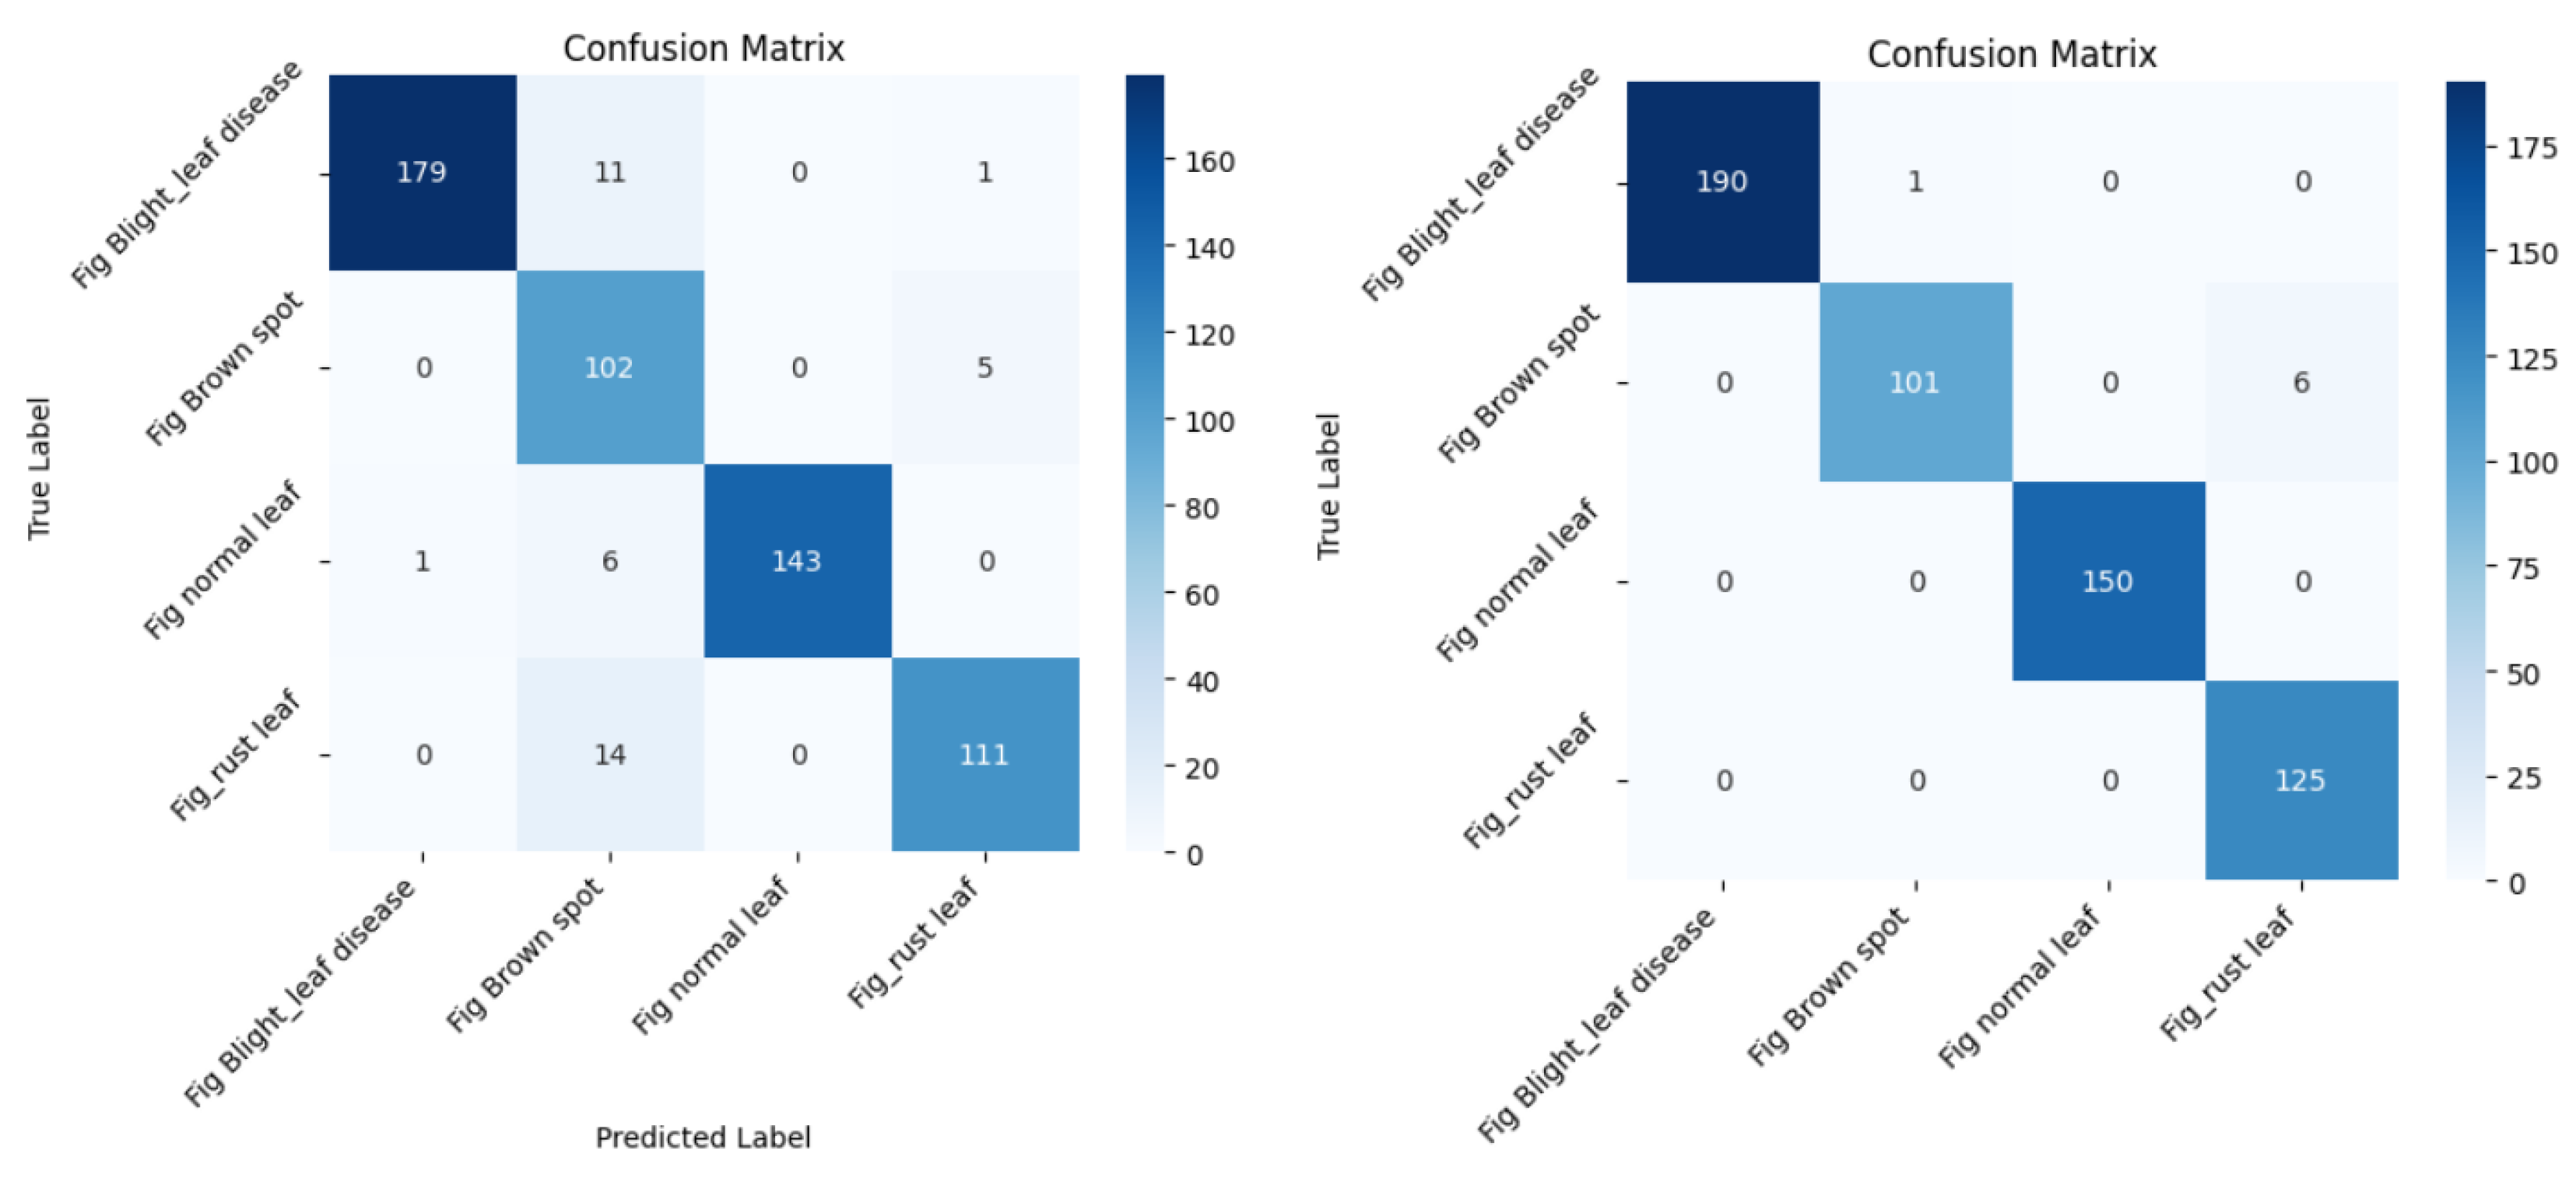
As part of the results collected from the experiments, samples of the confusion matrices for selected plants are presented to show the difference in performance between the CNN model and the DenseNet-121 model. For example, the confusion matrix in Figure 7 exhibits strong classification performance across all four fig leaf classes, with specifically high accuracy for the fig brown spot and fig normal leaf, which were classified with only a few errors using the CNN model. Minor misclassification was observed between visually similar classes such as fig blight leaf disease and fig brown spot, as well as fig rust leaf and fig brown spot. While the usage of the DenseNet-121 model shows better performance, as we can observe from Figure 7, with specifically high accuracy for the fig rust leaf and fig normal leaf, which achieved perfect classification accuracy. Minor misclassification was observed between fig blight leaf disease and fig brown spot, as well as fig brown spot and fig rust leaf, but with higher accuracy than the CNN model.
Figure 7.
Fig confusion matrix for CNN and DenseNet-121.
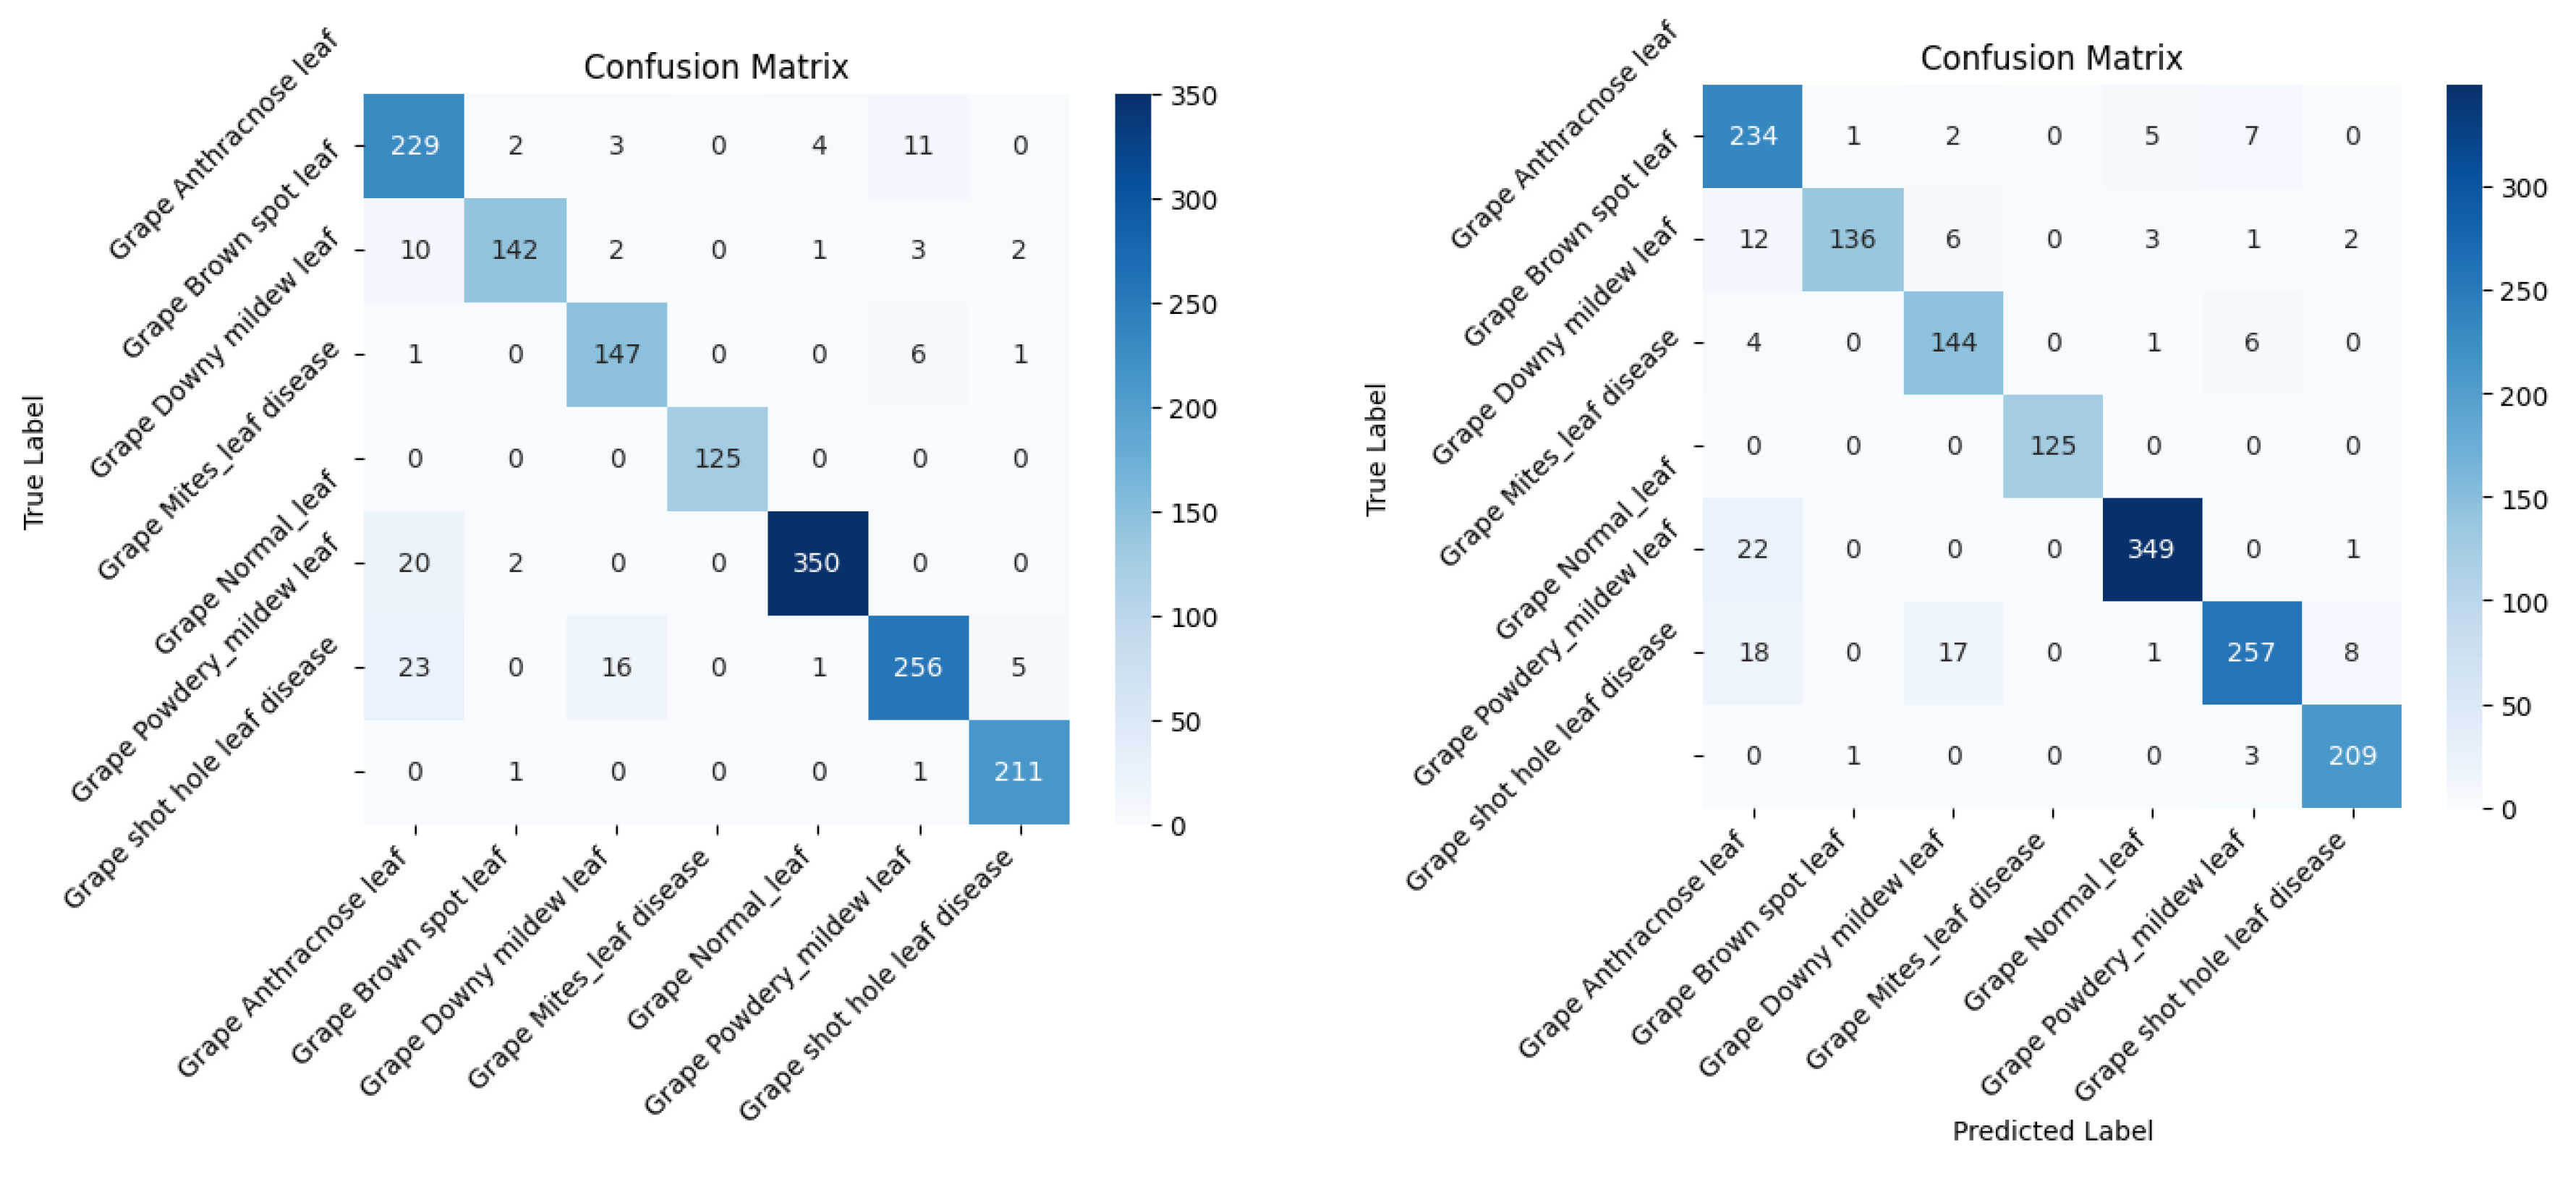
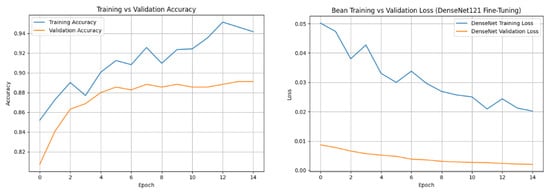
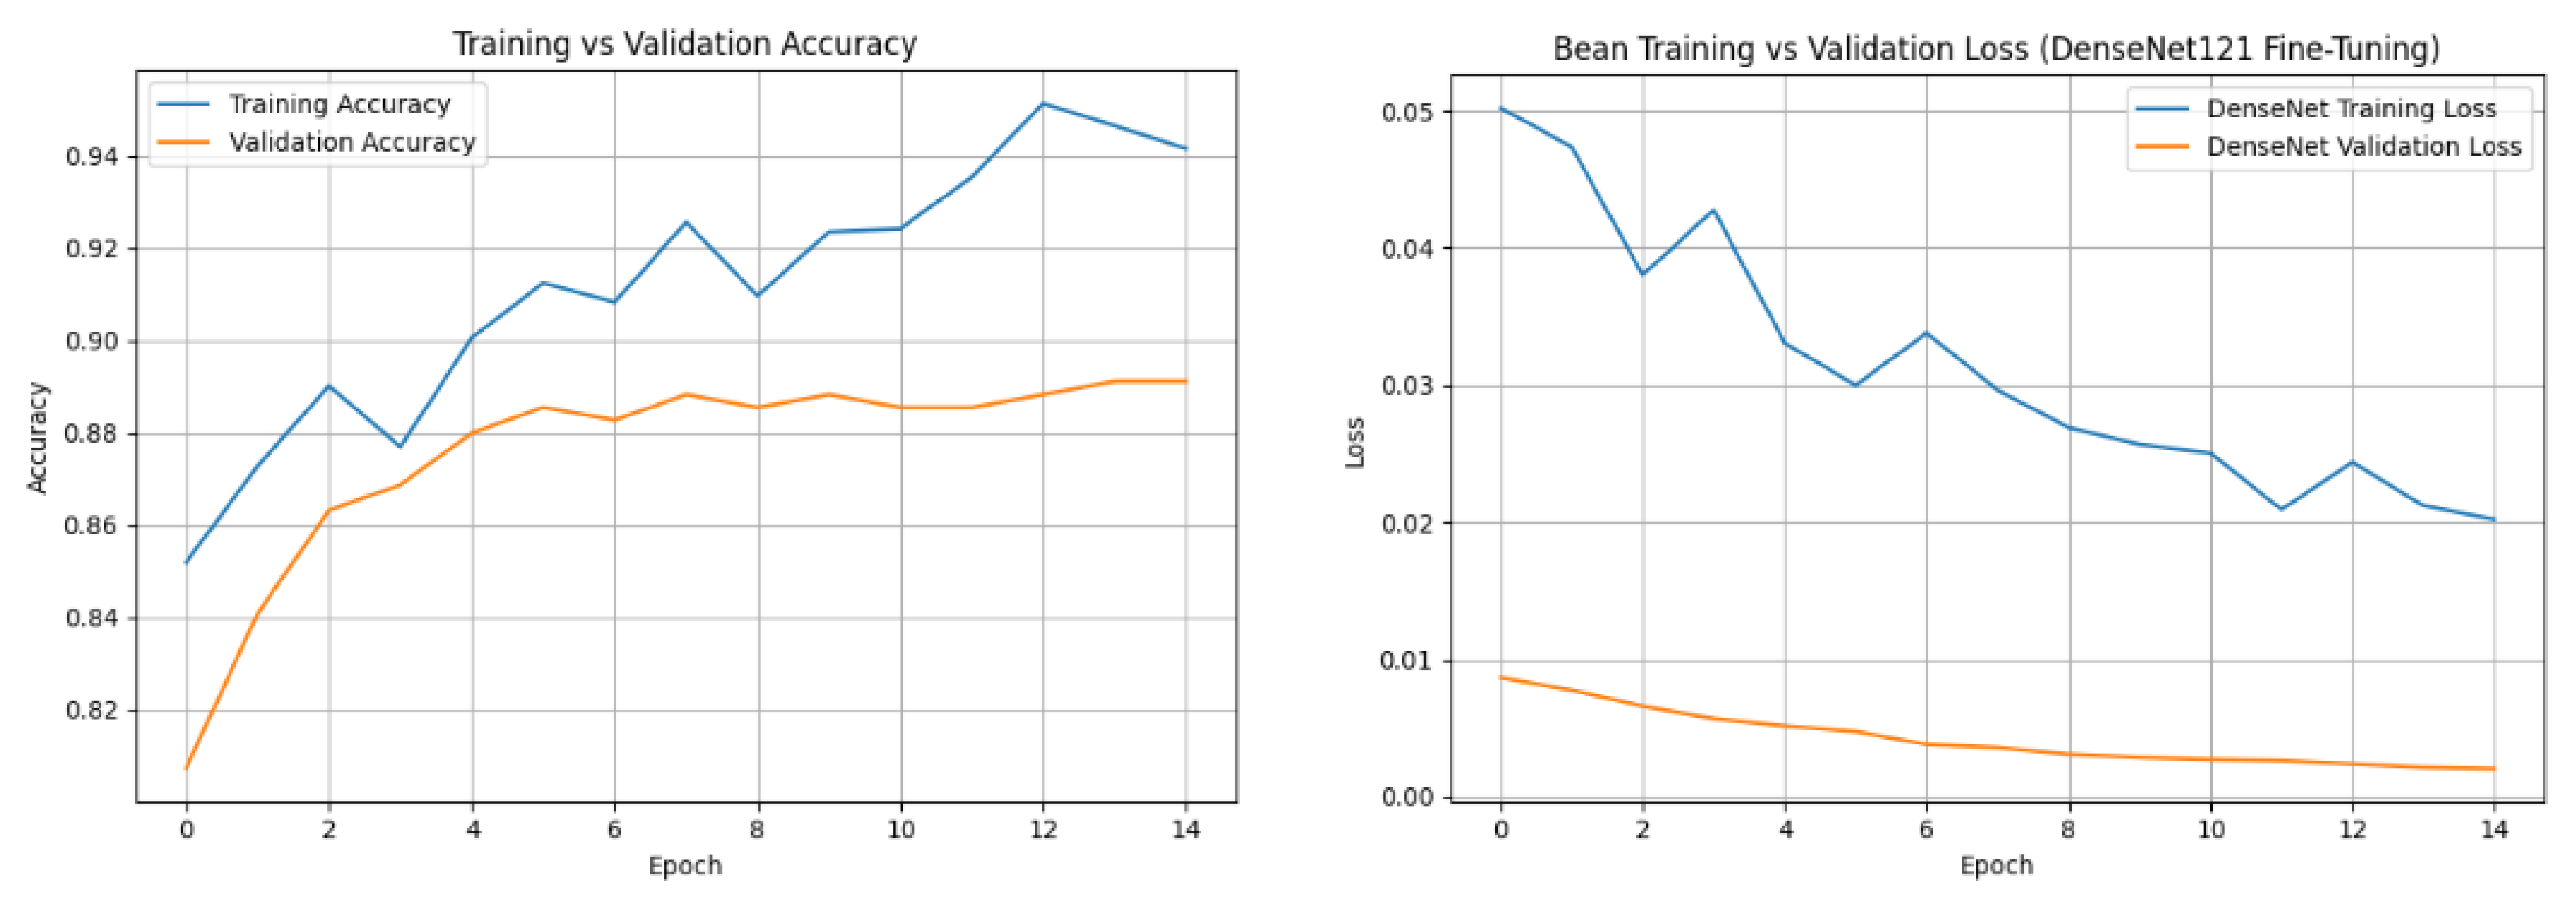
Another plant example is grape, where its dataset includes seven classes. The confusion matrix in Figure 8 demonstrates robust classification performance across all seven grape leaf classes, with high accuracy for the grape normal leaf, which was classified correctly without any errors using the CNN model. Minor misclassifications were observed among other classes having comparable visual patterns. Part (a) of Figure 9 shows training versus validation accuracy acquired from training the DenseNet-121 model using the apricot dataset, and part (b) of the same figure shows training versus validation loss acquired from training the same model.
Figure 8.
Grape confusion matrix for CNN and DenseNet-121.
Figure 9.
Training and validation performance of DenseNet-121 using the apricot dataset.
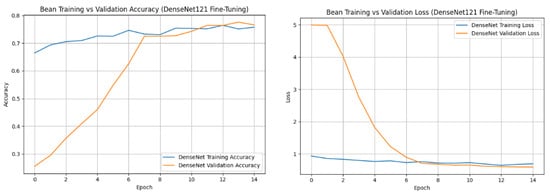
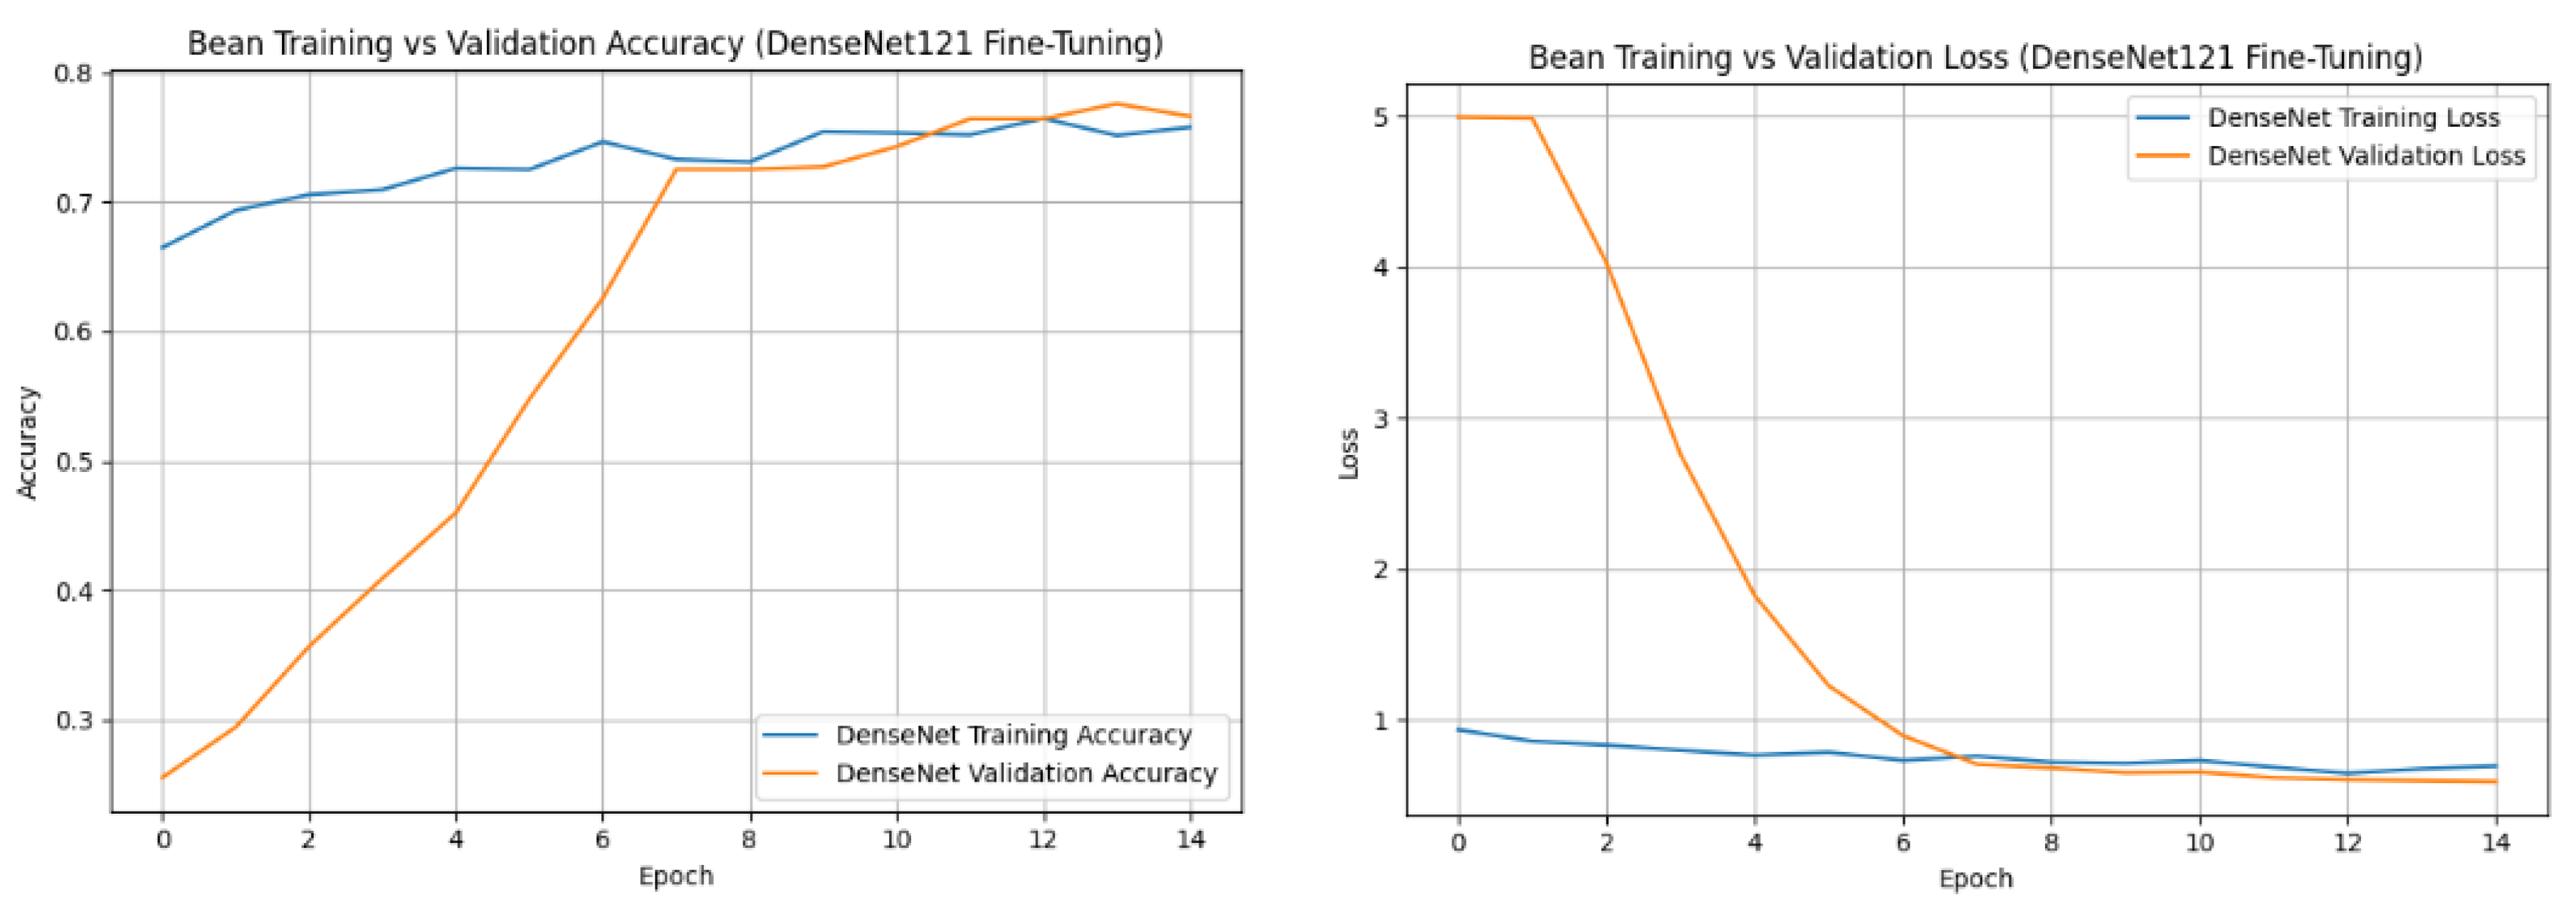
Figure 10 shows training versus validation accuracy acquired from training the DenseNet-121 model using the bean dataset, and part (b) of the same figure shows training versus validation loss acquired from training the same model using the same dataset.
Figure 10.
Training and validation performance of DenseNet-121 using the bean dataset.
The differences observed between the apricot and bean learning curves in Figure 9 and Figure 10 can be explained by the variations in the dataset complexity and disease symptom characteristics. Apricot disease classes exhibit more distinctive visual features, allowing the model to achieve higher classification accuracy. In contrast, bean disease classes show greater intra-class variability and inter-class similarity, making discrimination more complicated. Furthermore, differences in class distribution, image quality, and symptom appearance may contribute to the lower performance observed for bean.
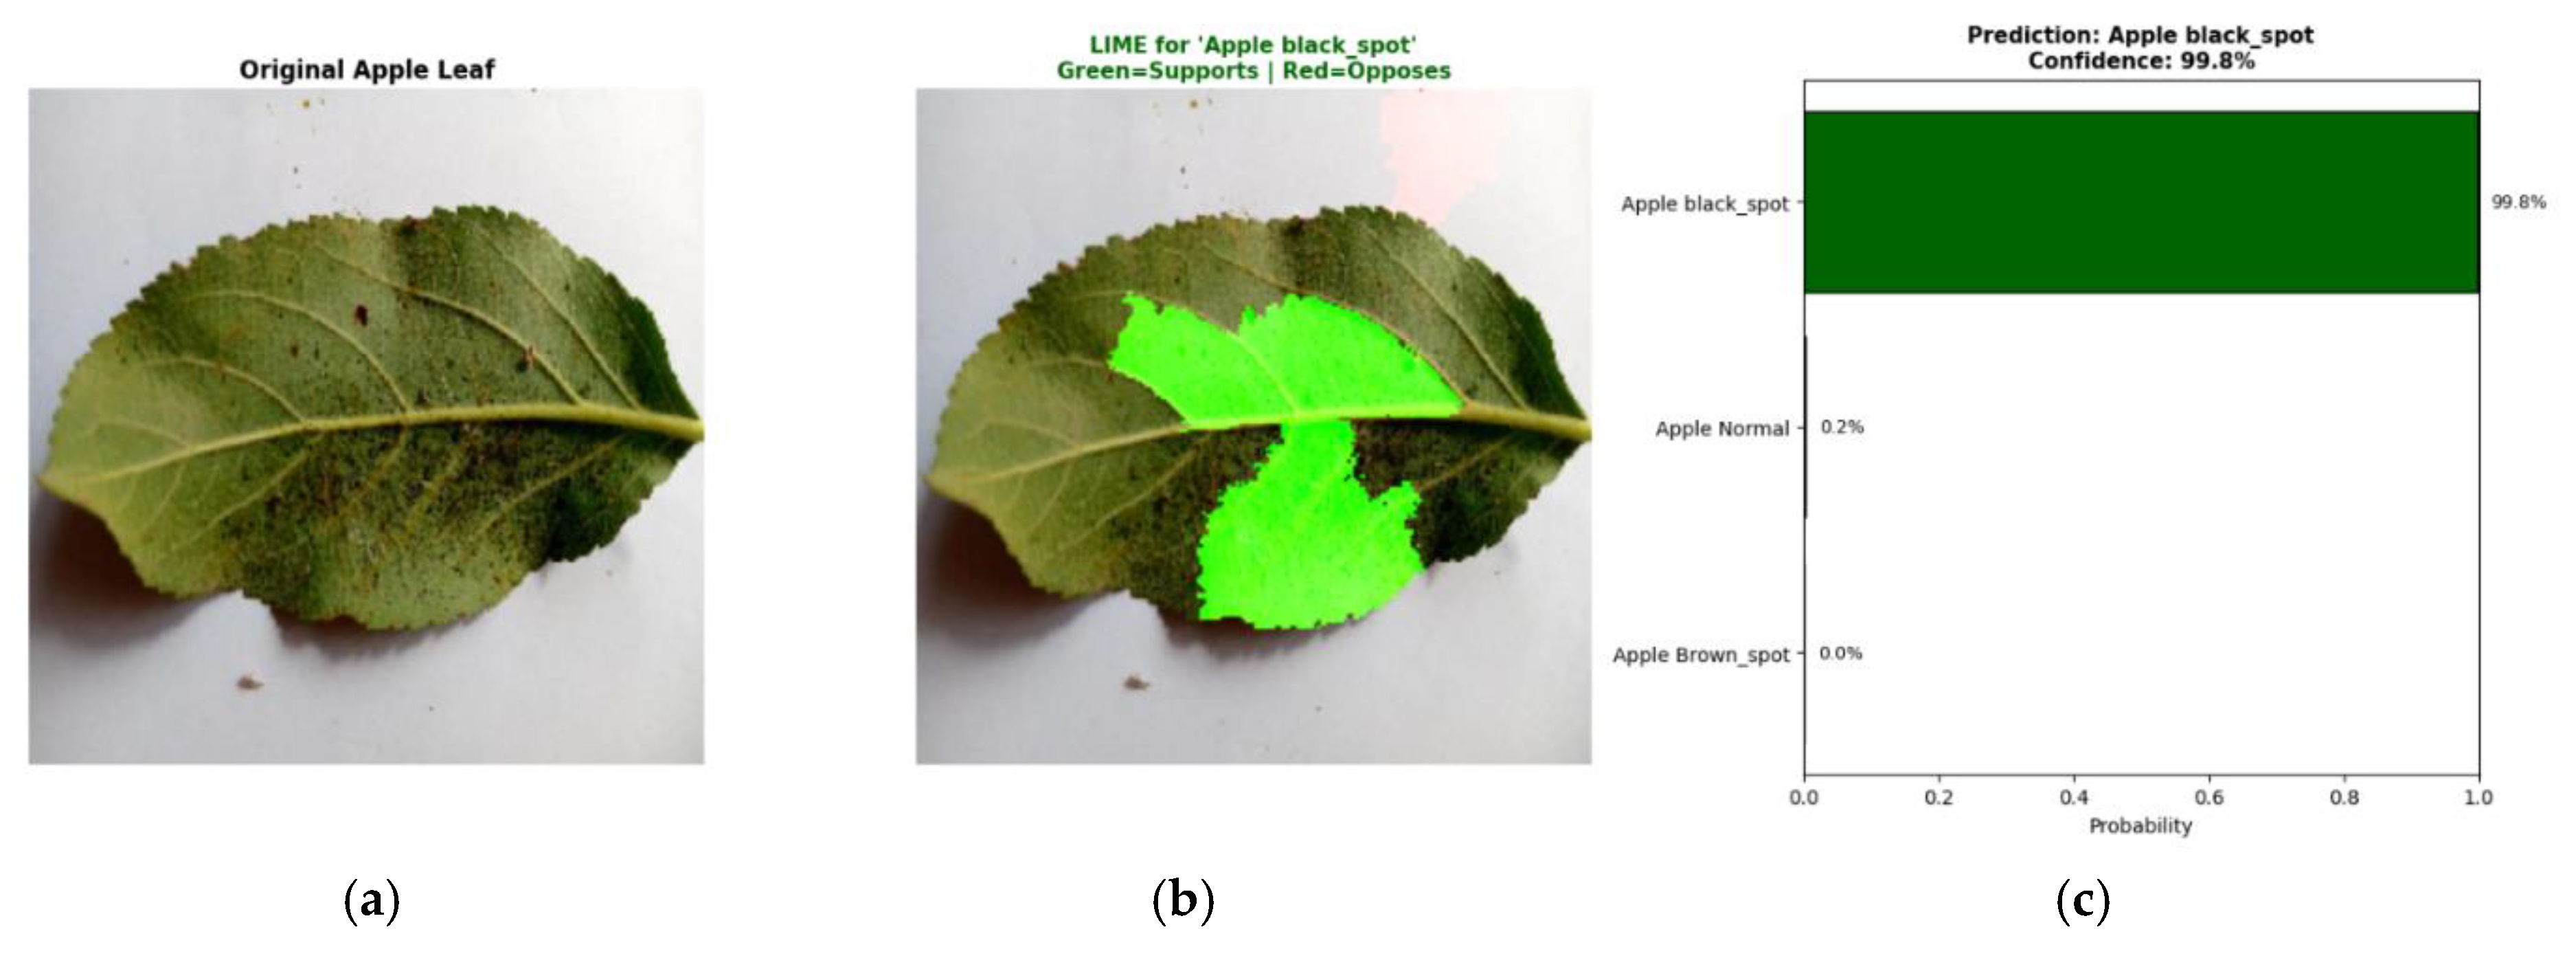
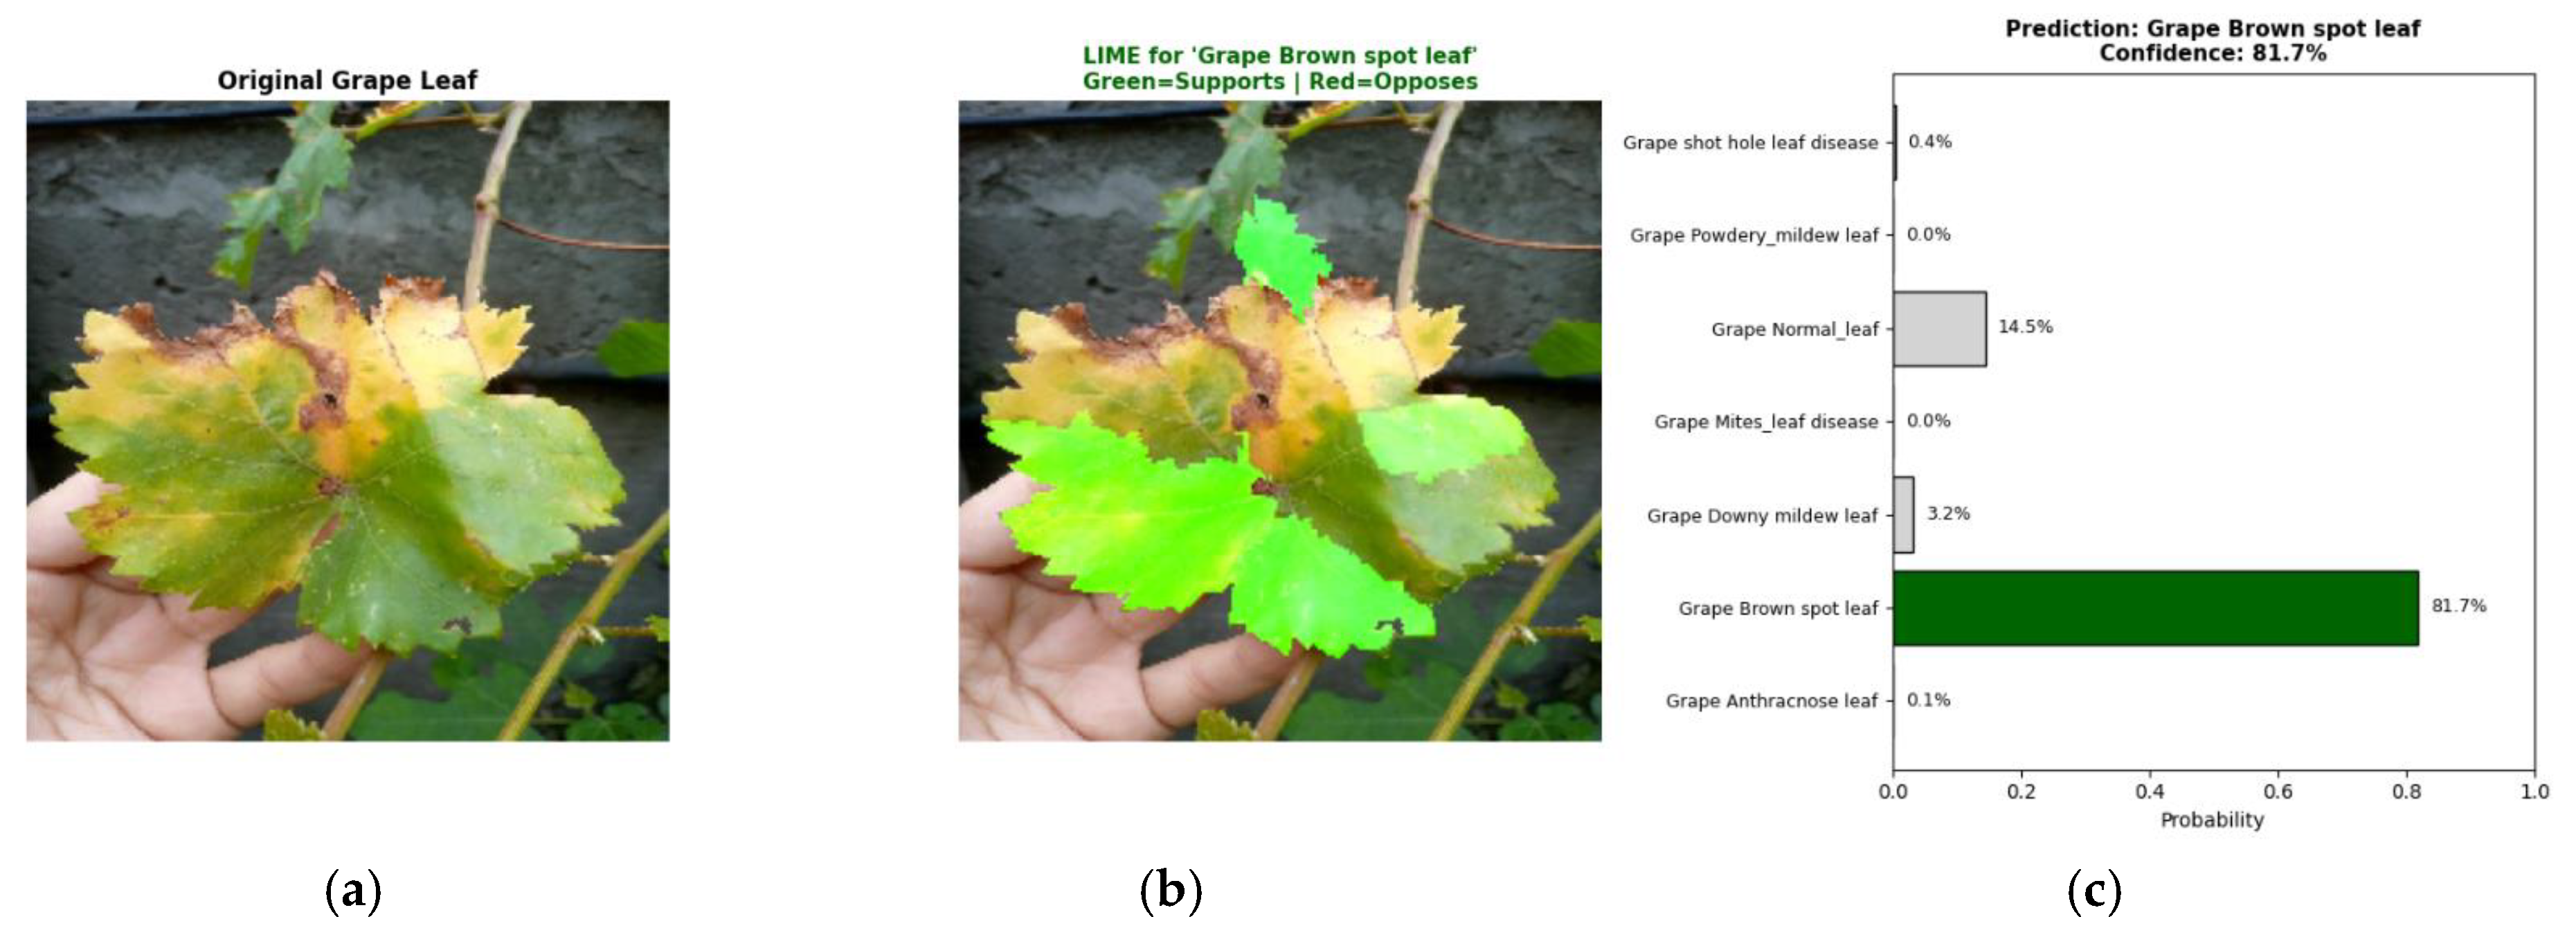
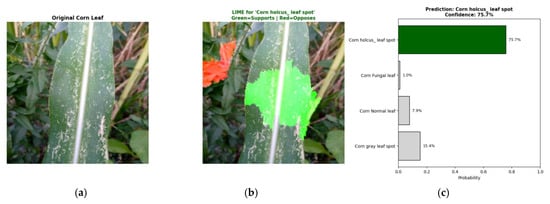
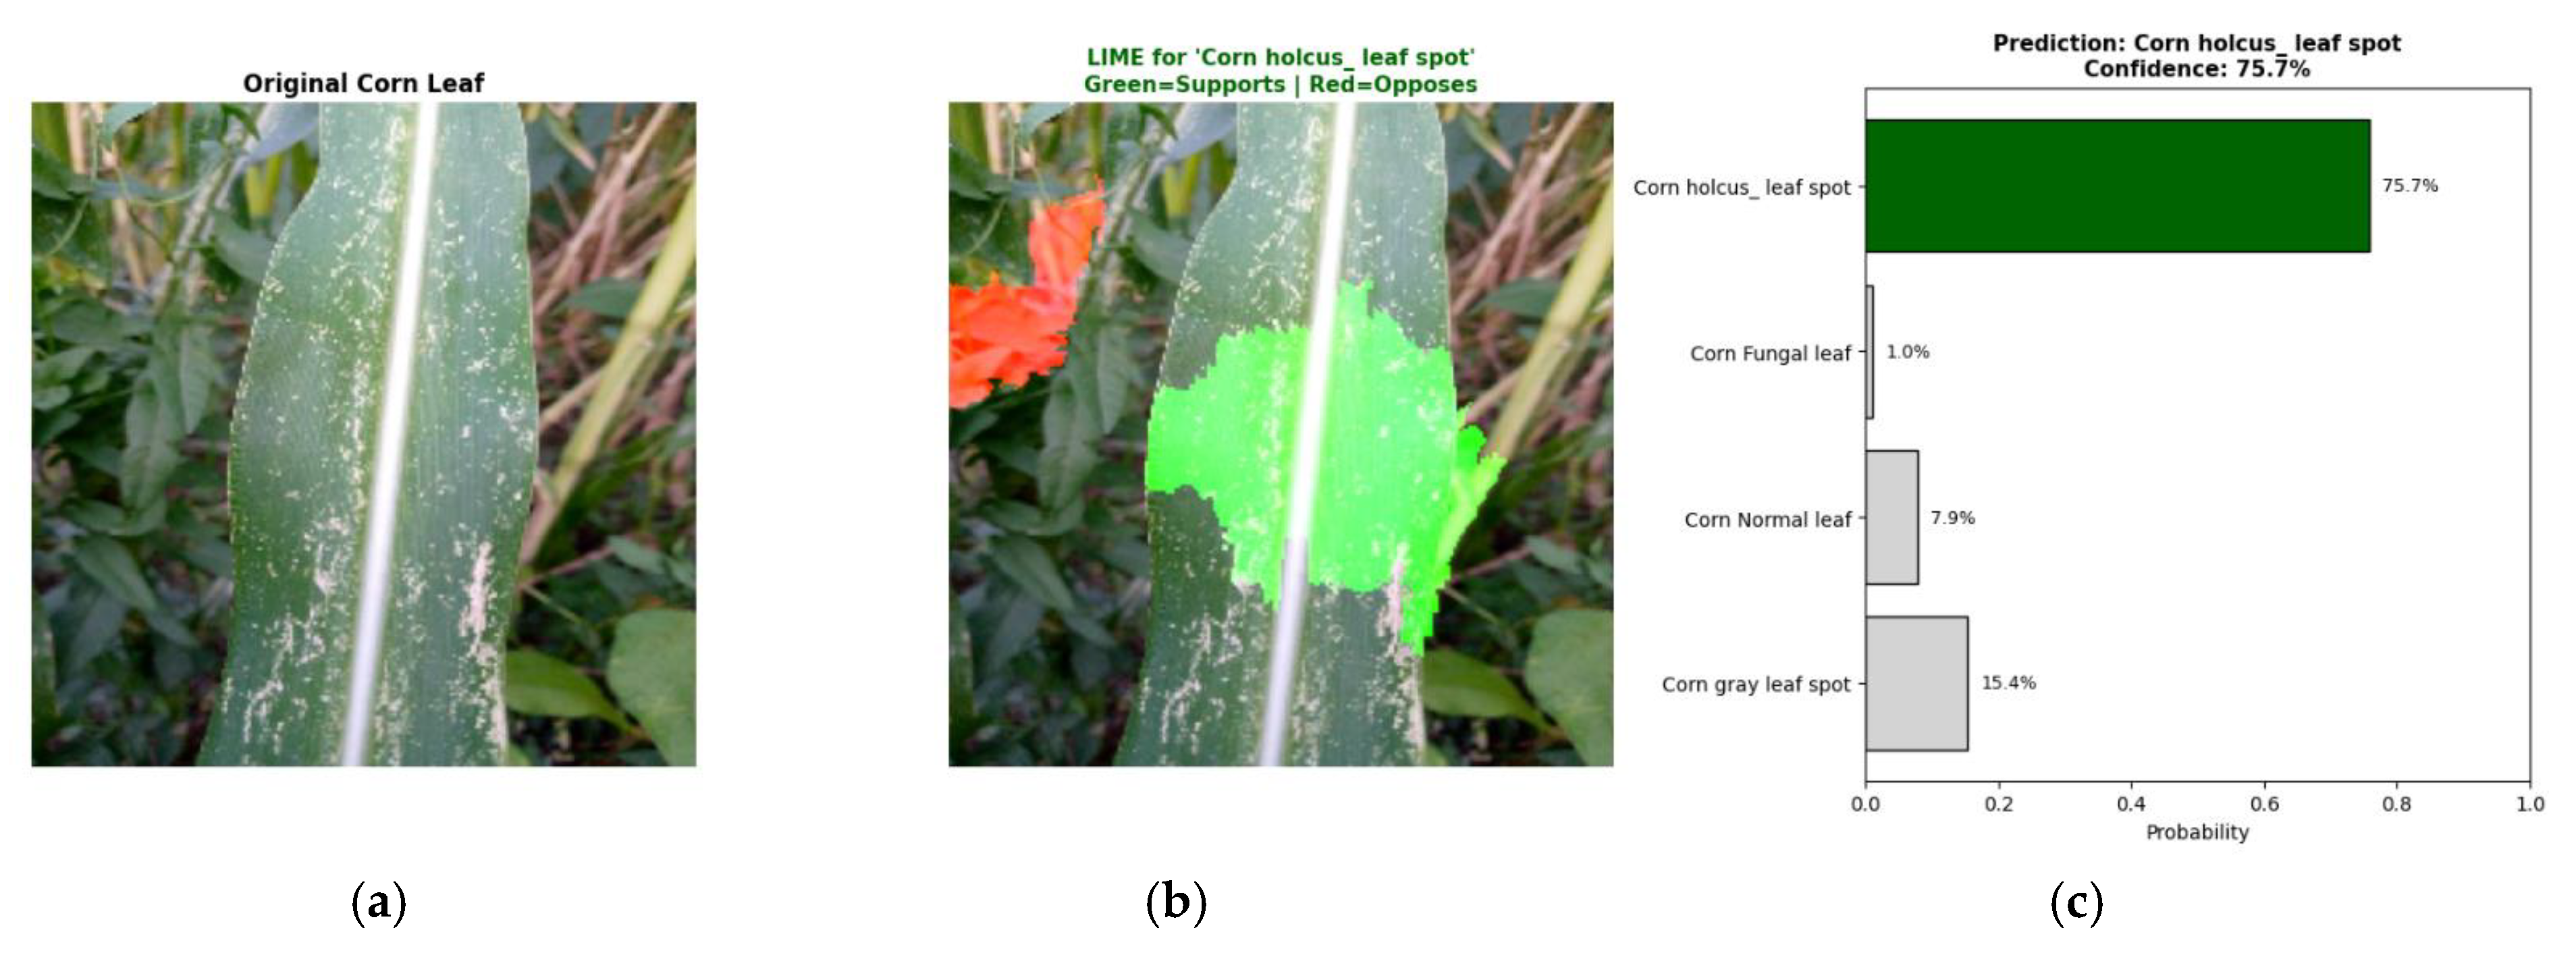
Moreover, we evaluated the confidence of the DenseNet-121 model using the LIME technique. We experimented with three crops: grape, apple, and corn. We selected one sample for each of the aforementioned crops. Part (a) of Figure 11 shows the original apple leaf with black spots. The green regions in part (b) support the prediction with a confidence score of 99.8% as shown in part (c) of the same figure. Part (a) of Figure 12 shows the original grape leaf with brown spots. The green regions in part (b) support the prediction with a confidence score of 81.7%, as shown in part (c) of the same figure. Finally, the corn case, where part (a) of Figure 13 shows the original corn leaf with holcus spots. The green regions in part (b) support the prediction with a confidence score of 75.7%, as shown in part (c) of the same figure.
Figure 11.
LIME explanation for the apple disease case. (a) Original apple leaf. (b) LIME for apple black spot leaf. (c) Prediction of black spot leaf with confidence 99.8%.
Figure 12.
LIME explanation for the grape disease case. (a) Original grape leaf. (b) LIME for grape brown spot leaf. (c) Prediction of brown spot leaf with confidence 81.7%.
Figure 13.
LIME explanation for the corn disease case. (a) Original corn leaf. (b) LIME for corn holcus leaf spot. (c) Prediction of holcus leaf spot with confidence 75.7%.
For the apple black spot sample, LIME emphasized regions containing visible spots and localized discoloration, which are characteristic symptoms used by plant pathology experts for disease identification. The model paid little attention to the background or unaffected leaf areas, indicating that its decision was driven mainly by biologically meaningful features. In the grape brown spot example, the highlighted regions correspond closely to the visible necrotic and chlorotic areas of the leaf. These symptomatic regions are commonly used by experts when diagnosing grape brown spot disease. The limited attention assigned to the surrounding background further supports that the model learned disease-specific characteristics rather than contextual information. For the corn leaf spot sample, LIME concentrated on regions containing dense lesion patterns distributed across the leaf surface. These lesions are among the primary indicators used by specialists when diagnosing leaf spot diseases. Therefore, the explanation suggests that the model relies on symptom-related structures rather than unrelated background elements.
Finally, we evaluated the two models—CNN and DenseNet-121—against multiple recent state-of-the-art studies, as clarified in Table 9. Here, we investigated the DL model used, how well the model performed, and the datasets used for evaluation. The comparison shows that the proposed models outperformed existing approaches. This can be attributed to the fact that we utilized a large dataset comprising multiple plant species with varying numbers of disease classes.
Table 9.
A comparison of the proposed CNN and DenseNet-121 models for plant disease classification with the existing state-of-the-art.
It should be noted that the studies summarized in Table 9 were conducted using different datasets, crop species, disease categories, and experimental settings. Therefore, direct numerical comparisons should be considered with caution. To a large extent, the comparison is provided to position the proposed framework within the broader literature. Since PlantCity is a recently released dataset, only limited benchmark results are currently available for direct comparison on the same data.
5. Conclusions
In the agriculture area, PlantCity is a recently released dataset that contains a collection of labeled images with various plant species. It contains a collection of reported diseases for each plant. PlantCity is used as an open-source dataset to train models for detecting plant diseases through classification. In our study, we used all the plant species from the PlantCity dataset.
In this work, we successfully analyzed the CNN model built from scratch and transfer learning-based models utilizing DenseNet-121 for the accurate classification of 51 plant disease classes. Evaluation of state-of-the-art convolutional neural networks and the DenseNet-121 model was undertaken based on the classification accuracy, precision, recall, F1 score, and cross-entropy loss. From the performance analysis of the CNN model and the pre-trained architecture, it was found that DenseNet-121 outperformed the CNN model.
Although building models from scratch is valuable, the transfer learning approach based on DenseNet-121 achieves faster convergence, even with limited data, as demonstrated by the experimental findings. In addition, it achieves significantly higher accuracy and lower risk of overfitting due to strong pretrained weights.
As we observed through the experiments, transfer learning using DenseNet-121 provides a preferable starting point when working with fine-grained datasets with various sizes, as in the case of the PlantCity dataset. Training the DenseNet-121 model is computationally efficient, since it has fewer trainable parameters with lower computational complexity. Therefore, DenseNet-121 is considered more efficient for plant disease detection and classification, particularly when an additional disease class is introduced, indicating reduced training complexity. The experimental results demonstrated that the proposed approach performs consistently well across the evaluated crops, attaining an average accuracy of 95.81%. The highest classification accuracy was obtained for apple, while lower performance was observed for bean, likely due to visual similarities between certain disease classes.
It is important to note that the eleven crop datasets considered in this study differ substantially in terms of sample size, number of categories, and class distribution. Therefore, the classification tasks are not comparable in difficulty across all plant species. For instance, datasets with fewer classes or more balanced class distributions may yield higher classification performance than datasets containing a larger number of classes or greater class imbalance. Therefore, direct comparisons of performance metrics across different crop species should be interpreted with careful consideration. The primary objective of the reported experiments is to evaluate and compare the performance of the examined models within each crop dataset rather than to establish a definitive ranking of classification difficulty among plant species.
One of the limitations of this work is the lack of independent experimental validation. This can be attributed to the absence of a local plant disease dataset that is collected from Iraqi fields. The existence of similar datasets is crucial, since the environmental conditions in Iraq are different from other regions like Europe or South Asia. It is worth noting that the utilized dataset, the PlantCity dataset, is collected by capturing images from fields in Charsadda and Chitral regions located in Pakistan. For instance, the overall summer temperature in Iraq is 40–45° C with extreme peaks above 50° C. On the other hand, in Charsadda, located in the northeast of Pakistan, the typical temperature is 40–44 °C, and in Chitral, located in the extreme north of Pakistan, the typical temperature is 25–30 °C. The difference in temperature is one of the major environmental differences between Iraq and Pakistan, leading to variations in the plant species, the diseases infecting these plants, and the mode of infection. As a result, collecting data from local fields is an essential part of the future work directions to build a dataset for plant diseases recorded in the Iraqi environment. Another future work direction may investigate fusing existing datasets with data obtained from diverse online sources to improve the generalization, resilience, and adaptability of disease detection models.
Author Contributions
Conceptualization, H.A.J. and S.S.S.; methodology, H.A.J.; software, O.J. and S.D.K.; validation, H.A.J., S.S.S. and A.J.H.; formal analysis, O.J. and S.D.K.; investigation, S.S.S.; resources, H.A.J.; data curation, S.S.S. and S.D.K.; writing—original draft preparation, H.A.J.; writing—review and editing, S.S.S., A.J.H.; visualization, O.J. and S.D.K.; supervision, A.J.H. All authors have read and agreed to the published version of the manuscript.
Funding
This research received no external funding.
Institutional Review Board Statement
Not applicable.
Informed Consent Statement
Not applicable.
Data Availability Statement
The data supporting the conclusions of this article are available on the Kaggle website (https://www.kaggle.com/datasets/codewithsk/plantcity-a-comprehensive-images-multicrop-leaves, accessed on 1 December 2025).
Conflicts of Interest
The authors declare no conflicts of interest.
References
- Allen, R.C.; Heldring, L. The Collapse of Civilization in Southern Mesopotamia. Cliometrica 2022, 16, 369–404. [Google Scholar] [CrossRef] [Scilit]
- J., A.; Eunice, J.; Popescu, D.E.; Chowdary, M.K.; Hemanth, J. Deep Learning-Based Leaf Disease Detection in Crops Using Images for Agricultural Applications. Agronomy 2022, 12, 2395. [Google Scholar] [CrossRef] [Scilit]
- Pandey, P.C.; Pandey, M. Highlighting the Role of Agriculture and Geospatial Technology in Food Security and Sustainable Development Goals. Sustain. Dev. 2023, 31, 3175–3195. [Google Scholar] [CrossRef] [Scilit]
- Sabir, D.M. Irrigation System in Ancient Mesopotamia. Athens J. Hist. 2024, 11, 73–88. [Google Scholar] [CrossRef] [Scilit]
- Al-Akkam, R.M.J.; Altaei, M.S.M. Plants Leaf Diseases Detection Using Deep Learning. Iraqi J. Sci. 2022, 63, 801–816. [Google Scholar] [CrossRef] [Scilit]
- Al-Waeli, M.; Shahmohammadi, N.; Tavakoli, S.; Dizadji, A.; Kvarnheden, A. Infection of Tomato in Iraq with Tomato Leaf Curl Palampur Virus and Multiple Variants of Tomato Yellow Leaf Curl Virus. J. Plant Pathol. 2024, 106, 1283–1294. [Google Scholar] [CrossRef] [Scilit]
- Khalaf, L.K.; Adhab, M.; Aguirre-Rojas, L.M.; Timm, A.E. Occurrencesf Wheat Curl Mite Aceria Tosichella Keifer 1969 (Eriophyidae) nd The Associated Viruses, (Wsmv, Hpwmov, Trimv) In Iraq. Iraqi J. Agric. Sci. 2023, 54, 837–849. [Google Scholar] [CrossRef] [Scilit]
- Gai, Y.; Wang, H. Plant Disease: A Growing Threat to Global Food Security. Agronomy 2024, 14, 1615. [Google Scholar] [CrossRef] [Scilit]
- Shafik, W.; Tufail, A.; Namoun, A.; De Silva, L.C.; Apong, R.A.A.H.M. A Systematic Literature Review on Plant Disease Detection: Motivations, Classification Techniques, Datasets, Challenges, and Future Trends. IEEE Access 2023, 11, 59174–59203. [Google Scholar] [CrossRef] [Scilit]
- Khan, M.S.; Nisa, K.; Ahmad, I.; Zubair, M.; Alshammari, K. PlantCity: A Comprehensive Image Based on Multi Crop Leaves in Pakistan. Data Brief 2025, 63, 112130. [Google Scholar] [CrossRef] [Scilit] [PubMed]
- Mahum, R.; Munir, H.; Mughal, Z.-U.-N.; Awais, M.; Sher Khan, F.; Saqlain, M.; Mahamad, S.; Tlili, I. A Novel Framework for Potato Leaf Disease Detection Using an Efficient Deep Learning Model. Hum. Ecol. Risk Assess. 2023, 29, 303–326. [Google Scholar] [CrossRef] [Scilit]
- Abd Algani, Y.M.; Marquez Caro, O.J.; Robladillo Bravo, L.M.; Kaur, C.; Al Ansari, M.S.; Kiran Bala, B. Leaf Disease Identification and Classification Using Optimized Deep Learning. Meas. Sens. 2023, 25, 100643. [Google Scholar] [CrossRef] [Scilit]
- Rauf, H.T.; Saleem, B.A.; Lali, M.I.U.; Khan, M.A.; Sharif, M.; Bukhari, S.A.C. A Citrus Fruits and Leaves Dataset for Detection and Classification of Citrus Diseases through Machine Learning. Data Brief 2019, 26, 104340. [Google Scholar] [CrossRef] [Scilit] [PubMed]
- Bozcu, H.; Cubukcu, B. Deep Learning-Based Damage Assessment in Cherry Leaves Abstract. J. Innov. Sci. Eng. 2024, 8, 160–178. [Google Scholar] [CrossRef] [Scilit]
- Sofuoglu, C.I.; Birant, D. Potato Plant Leaf Disease Detection Using Deep Learning Method. J. Agric. Sci. 2024, 30, 153–165. [Google Scholar]
- Pai, P.; Amutha, S.; Patil, S.; Shobha, T.; Basthikodi, M.; Shafeeq, B.M.A.; Gurpur, A.P. Deep Learning-Based Automatic Diagnosis of Rice Leaf Diseases Using Ensemble CNN Models. Sci. Rep. 2025, 15, 27690. [Google Scholar] [CrossRef] [Scilit] [PubMed]
- Krishna, M.S.; Machado, P.; Otuka, R.I.; Yahaya, S.W.; Neves dos Santos, F.; Ihianle, I.K. Plant Leaf Disease Detection Using Deep Learning: A Multi-Dataset Approach. J 2025, 8, 4. [Google Scholar] [CrossRef] [Scilit]
- Upadhyay, A.; Chandel, N.S.; Singh, K.P.; Chakraborty, S.K.; Nandede, B.M.; Kumar, M.; Subeesh, A.; Upendar, K.; Salem, A.; Elbeltagi, A. Deep Learning and Computer Vision in Plant Disease Detection: A Comprehensive Review of Techniques, Models, and Trends in Precision Agriculture. Artif. Intell. Rev. 2025, 58, 92. [Google Scholar] [CrossRef] [Scilit]
- Khudhur, S.D.; Samaan, S.S.; Taher, O.N.M.; Salman, A.D.; Humaidi, A.J. NetGuard: A Hybrid Framework for Intelligent and Scalable Malicious URL Detection. J. Cybersecur. Priv. 2026, 6, 102. [Google Scholar] [CrossRef] [Scilit]
- Tyagi, M. Advancements in Plant Disease Detection: A Comprehensive Review of Traditional, Modern, and AI-Driven Approaches. Int. J. Multidiscip. Res. 2025, 7, 1–27. [Google Scholar] [CrossRef]
- Xu, M.; Park, J.-E.; Lee, J.; Yang, J.; Yoon, S. Plant Disease Recognition Datasets in the Age of Deep Learning: Challenges and Opportunities. Front. Plant Sci. 2024, 15, 1452551. [Google Scholar] [CrossRef] [Scilit] [PubMed]
- Min, B.; Kim, T.; Shin, D.; Shin, D. Data Augmentation Method for Plant Leaf Disease Recognition. Appl. Sci. 2023, 13, 1465. [Google Scholar] [CrossRef] [Scilit]
- Dou, H.-X.; Lu, X.-S.; Wang, C.; Shen, H.-Z.; Zhuo, Y.-W.; Deng, L.-J. PatchMask: A Data Augmentation Strategy with Gaussian Noise in Hyperspectral Images. Remote Sens. 2022, 14, 6308. [Google Scholar] [CrossRef] [Scilit]
- Sujatha, R.; Chatterjee, J.M.; Jhanjhi, N.Z.; Brohi, S.N. Performance of Deep Learning vs Machine Learning in Plant Leaf Disease Detection. Microprocess. Microsyst. 2021, 80, 103615. [Google Scholar] [CrossRef] [Scilit]
- Abdulraheem Fadhel, M.; Humaidi, A.J.; Oleiwi, S.R. Image Processing-Based Diagnosis of Sickle Cell Anemia in Erythrocytes. In Proceedings of the 2017 Annual Conference on New Trends in Information & Communications Technology Applications (NTICT); IEEE: Baghdad, Iraq, 2017; pp. 203–207. [Google Scholar] [CrossRef] [Scilit]
- Samaan, S.S.; Korial, A.E.; Sarra, R.R.; Humaidi, A.J. Multilingual Web Traffic Forecasting for Network Management Using Artificial Intelligence Techniques. Results Eng. 2025, 26, 105262. [Google Scholar] [CrossRef] [Scilit]
- Huang, G.; Liu, Z.; van der Maaten, L.; Weinberger, K.Q. Densely Connected Convolutional Networks. arXiv 2016, arXiv:1608.06993. [Google Scholar]
- Arulananth, T.S.; Prakash, S.W.; Ayyasamy, R.K.; Kavitha, V.P.; Kuppusamy, P.G.; Chinnasamy, P. Classification of Paediatric Pneumonia Using Modified DenseNet-121 Deep-Learning Model. IEEE Access 2024, 12, 35716–35727. [Google Scholar] [CrossRef] [Scilit]
- Santoso, H.A.; Fandhi Safsalta, B.; Febrianto, N.; Wilujeng Saraswati, G.; Haw, S. Comparative Analysis of Convolutional Neural Network and DenseNet121 Transfer Learning in Agriculture Focusing on Crop Leaf Disease Identification. Appl. Comput. Inform. 2026, 22, 316–328. [Google Scholar]
- Deng, J.; Dong, W.; Socher, R.; Li, L.-J.; Li, K.; Li, F.-F. ImageNet: A Large-Scale Hierarchical Image Database. In Proceedings of the 2009 IEEE Conference on Computer Vision and Pattern Recognition; IEEE: New York, NY, USA, 2009. [Google Scholar]
- Zhong, Y.; Zhao, M. Research on Deep Learning in Apple Leaf Disease Recognition. Comput. Electron. Agric. 2020, 168, 105146. [Google Scholar] [CrossRef] [Scilit]
- Vasavi, P.; Punitha, A.; Narayana Rao, T.V. Crop Leaf Disease Detection and Classification Using Machine Learning and Deep Learning Algorithms by Visual Symptoms: A Review. Int. J. Electr. Comput. Eng. 2022, 12, 2079. [Google Scholar] [CrossRef] [Scilit]

Disclaimer/Publisher’s Note: The statements, opinions and data contained in all publications are solely those of the individual author(s) and contributor(s) and not of MDPI and/or the editor(s). MDPI and/or the editor(s) disclaim responsibility for any injury to people or property resulting from any ideas, methods, instructions or products referred to in the content. |
© 2026 by the authors. Licensee MDPI, Basel, Switzerland. This article is an open access article distributed under the terms and conditions of the Creative Commons Attribution (CC BY) license.