


Abstract
This paper presents a hybrid physics–AI framework for real-time emission monitoring in industrial boiler systems within an IIoT-enabled Industry 4.0 environment. The proposed framework integrates physics-based emission estimation with AI-based anomaly detection within a unified operational technology and information technology (OT–IT) architecture to support continuous environmental monitoring. Process data, including fuel oil consumption, oxygen concentration, temperature, and pressure, are acquired from an industrial boiler through a Siemens programmable logic controller (PLC) using an Open Platform Communications Unified Architecture (OPC UA) communication layer. The acquired measurements are processed at the edge analytics level to estimate the emission rates of carbon monoxide (CO), sulfur dioxide (SO2), nitrogen dioxide (NO2), and particulate matter (PM) using stoichiometric combustion models based on fuel composition and flue gas characteristics. An autoencoder-based anomaly detection model is employed to identify abnormal operating conditions by monitoring the reconstruction error against a predefined threshold. The framework is validated using a PLC-based quasi-real-time prototype that replays one year of historical industrial boiler operating data. The emission estimation results show close agreement with reference engineering calculations, with relative errors below 0.1% across the evaluated operating conditions. The anomaly detection model achieved an F1-score of 96.14% and an AUC of 0.981. An edge monitoring dashboard provides real-time visualization of process variables, estimated emissions, and alarm status, while cloud connectivity supports remote monitoring and long-term data analytics. Overall, the proposed framework demonstrates how existing industrial process data can be utilized to transform conventional offline emission estimation into a continuous OT–IT monitoring service for legacy industrial environments.
1. Introduction
Industrial boilers are essential energy-generation and process-heating units in numerous industrial sectors, including oil refineries, power plants, and chemical industries [1]. Their operation is accompanied by the emission of pollutants such as carbon monoxide (CO), sulfur dioxide (SO2), nitrogen oxides (NOx), and particulate matter (PM), which pose significant environmental and public health concerns [2]. Consequently, accurate and continuous emission monitoring has become increasingly important for regulatory compliance, environmental protection, and sustainable industrial operation [3].
In many industrial brownfield facilities, emission estimation is still performed through periodic sampling and offline calculations based on standardized emission factors, such as those provided by the EPA AP-42 database [4,5]. Although these methods provide practical engineering estimates, they are unable to capture dynamic variations in operating conditions and therefore offer limited support for continuous monitoring, early fault detection, and real-time operational awareness.
Conventional approaches to industrial emission estimation have been largely founded on combustion theory and atmospheric dispersion modeling. Classical models, including the Industrial Source Complex Short-Term (ISCST) model, the CSIRO photochemical smog model, Gaussian plume models, CALPUFF (California Puff Model), and AERMOD (American Meteorological Society/Environmental Protection Agency Regulatory Model), have been widely applied for estimating pollutant emissions and atmospheric dispersion under different environmental and operating conditions [6,7,8,9]. Although these approaches provide physically interpretable engineering models, they are generally applied offline and rely on predefined operating assumptions.
Industrial emission monitoring has subsequently evolved from conventional Continuous Emission Monitoring Systems (CEMS), which depend on direct stack measurements, toward Predictive Emission Monitoring Systems (PEMS) and soft-sensor approaches that estimate emissions using process variables and computational models. While CEMS provide direct and reliable measurements, their installation, calibration, and maintenance requirements may limit their deployment in many industrial facilities. In contrast, PEMS and soft sensors utilize existing operational measurements to provide cost-effective continuous emission estimation. More recently, hybrid approaches combining physics-based models with data-driven techniques have attracted considerable attention because they improve the balance between physical interpretability and predictive capability [10,11,12,13].
Artificial intelligence (AI) has further expanded the capabilities of industrial emission monitoring. Machine learning and deep learning techniques, including LSTM, SVR, and gradient boosting methods, have demonstrated promising performance for emission prediction, process monitoring, and operational optimization across different industrial applications [14,15,16,17,18]. Despite these advances, most AI-based approaches remain dependent on historical datasets and have relatively limited integration with practical industrial monitoring infrastructures.
At the same time, Industry 4.0 technologies—including the Industrial Internet of Things (IIoT), OPC Unified Architecture (OPC UA), edge computing, and cloud platforms—have established the technological foundation for industrial digital transformation. These technologies enable standardized interoperability, real-time access to industrial process data, and seamless communication between Operational Technology (OT) and Information Technology (IT) environments [19,20,21,22,23]. Such capabilities provide the infrastructure required to deploy intelligent industrial monitoring systems while preserving compatibility with existing automation platforms.
Despite these technological developments, several important challenges remain. First, many existing studies continue to rely on offline datasets or post-processed measurements that do not fully represent practical industrial operating conditions. Second, physics-based models, AI algorithms, and industrial monitoring infrastructures are commonly developed as separate solutions, with limited integration into a unified real-time monitoring framework. Third, practical validation strategies that bridge offline model development and industrial deployment remain relatively limited.
To address these challenges, this study proposes a hybrid physics–AI framework for real-time emission monitoring of industrial boilers within an IIoT-enabled Industry 4.0 architecture. The proposed framework integrates physics-based emission estimation, AI-based anomaly detection, OPC UA communication, edge analytics, cloud monitoring, and operator visualization within a unified OT–IT environment. Process data are acquired from a PLC through OPC UA communication and utilized to support continuous emission estimation and operational monitoring. Furthermore, the framework is validated through a PLC-based quasi-real-time replay of one year of historical industrial operating data, providing a safe and realistic environment for deployment-oriented evaluation. The proposed framework demonstrates how existing industrial process data can be transformed from conventional offline emission estimation into a continuous OT–IT monitoring service for legacy industrial environments.
2. Physics-Based Modeling of Pollutant Emissions
The proposed emission modeling framework is based on first-principles combustion analysis integrated with real-time process measurements acquired from an industrial boiler system. The formulation follows established emission estimation methodologies reported in the literature, particularly those developed for refinery-scale combustion systems and atmospheric emission modeling, where pollutant formation is directly related to fuel consumption, combustion conditions, and flue gas composition. These engineering approaches have been extensively validated for emission-rate calculation and pollutant dispersion analysis, providing both physical interpretability and engineering reliability [9,24].
Within the proposed framework, pollutant emission rates are estimated by establishing direct relationships among fuel mass flow rate, combustion characteristics, and flue gas composition under actual operating conditions. The adopted mathematical formulation enables continuous estimation of emission rates while preserving the physical relationships governing the combustion process. Rather than introducing new combustion equations, this work adapts established engineering formulations for continuous execution within an IIoT-enabled monitoring architecture, allowing seamless integration with industrial control data streams.
2.1. Industrial Boiler System and Operating Environment
The proposed emission monitoring framework was developed for medium-pressure water-tube refinery utility boilers operating under typical refinery combustion conditions. The framework targets boilers with nominal steam-generation capacities ranging from approximately 140 to 160 t/h and operating loads between 40% and 120% of the rated capacity. The boilers operate as dual-fuel units using either fuel oil or fuel gas, providing operational flexibility under varying process demands. The combustion system consists of a furnace equipped with four burners, a combustion chamber, and a stack approximately 60 m in height for flue gas discharge and atmospheric dispersion.
A PLC-based control system continuously acquires real-time process measurements from field instrumentation. These measurements are transferred to the edge analytics layer through the OPC UA communication layer, where the physics-based emission estimation model converts the acquired process data into continuous estimates of carbon monoxide (CO), sulfur dioxide (SO2), nitrogen dioxide (NO2), and particulate matter (PM) based on fuel properties and flue gas composition. By integrating data acquisition with physics-based modeling, the proposed framework transforms conventional industrial process measurements into continuously updated emission information that can be utilized by higher-level monitoring, visualization, and decision-support services while preserving the physical interpretability of the estimation process.
2.2. Fuel Mass Flow Calculation
Fuel mass flow rate is obtained directly from field measurements and serves as the primary input to the proposed emission estimation model. Since pollutant formation is fundamentally governed by the amount of fuel supplied to the combustion process, accurate measurement of the fuel mass flow provides the basis for all subsequent emission calculations. The measured fuel mass flow rate is expressed as:
The volumetric fuel flow rate (m3/h) is obtained from the process data. The mass flow rate of fuel (kg/h) is then calculated using the fuel density (kg/m3).
2.3. Flue Gas Analysis and Mass Calculations
Flue gas composition provides the basis for relating the combustion process to pollutant formation. The measured concentrations of the major combustion products are used to characterize combustion conditions and to establish the subsequent mass-balance calculations required for emission estimation. Under the proposed framework, the combustion process is modeled using stoichiometric relationships, while the volumetric composition of the dry flue gas is measured (or assumed) as the volume percentages of CO2, CO, O2, and N2: .
These are converted to mass fractions using molecular weights (kg/kmol). First, the mass of each component per kg of fuel is obtained by:
where kg/kmol. The total mass of dry flue gas produced per kg of fuel is:
This value also represents the average molecular weight of the flue gas (kg/kmol).
The weight fractions (mass fractions) of each component in the flue gas are:
2.4. Carbon Balance and Total Gas Flow
A carbon balance is used to establish the relationship between fuel composition and combustion products. The mass of carbon contained in 1 kg of dry flue gas is determined from the carbon present in CO2 and CO:
Given that the fuel contains a carbon mass fraction (kg C/kg fuel), the amount of flue gas produced per kg of fuel is:
Thus, the total mass flow rate of flue gas is:
where () is the carbon mass fraction in the fuel. This enables estimation of CO2 and CO formation based on combustion completeness.
2.5. Pollutant Emission Rates
- Carbon Monoxide (CO)
The CO emission rate is estimated from its weight fraction in the flue gas, providing a direct measure of carbon monoxide generated during combustion:
For display in the dashboard, it is converted to g/s:
- Sulfur Dioxide (SO2)
Based on the sulfur content of the fuel (kg S/kg fuel) and assuming all sulfur converts to SO2 (with molar mass 64), the emission rate is:
(The factor 2 arises from the ratio )
- Nitrogen Dioxide (NO2)
NO2 emissions are estimated using a volumetric emission factor (kg/m3 of fuel). The volumetric fuel flow rate is derived from the mass flow:
Then,
- Particulate Matter (PM)
The PM emission rate is estimated using the corresponding volumetric emission factor, :
Carbon Dioxide (CO2) (Optional), for completeness, the CO2 emission rate can also be computed:
All parameters () are user-configurable through the graphical interface and can be updated in real time.
3. Proposed Framework and Implementation
This section presents the architecture and implementation of the proposed framework, which integrates physics-based emission modeling, AI-driven anomaly detection, and OT–IT communication within an Industrial Internet of Things (IIoT)-enabled Industry 4.0 environment.
3.1. Framework Overview
The proposed framework provides a unified monitoring platform for industrial boiler systems by integrating physics-based emission estimation with AI-based anomaly detection. From a functional perspective, the framework consists of three main modules:
- (i)
- A physics-based emission estimation module;
- (ii)
- An AI-based anomaly detection module; and
- (iii)
- A real-time visualization and alarm monitoring module.
These modules operate on continuously acquired process data to support emission estimation, anomaly detection, and operator monitoring.
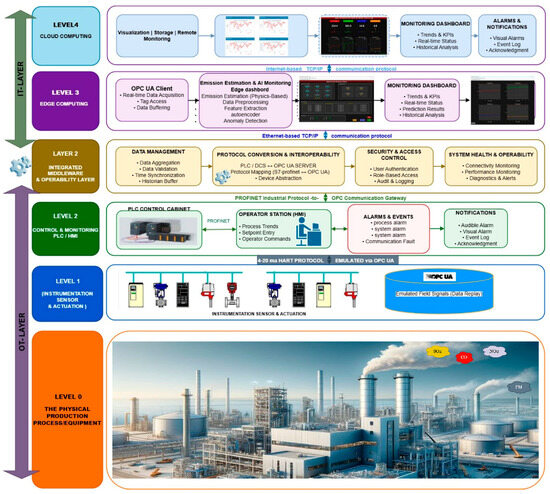
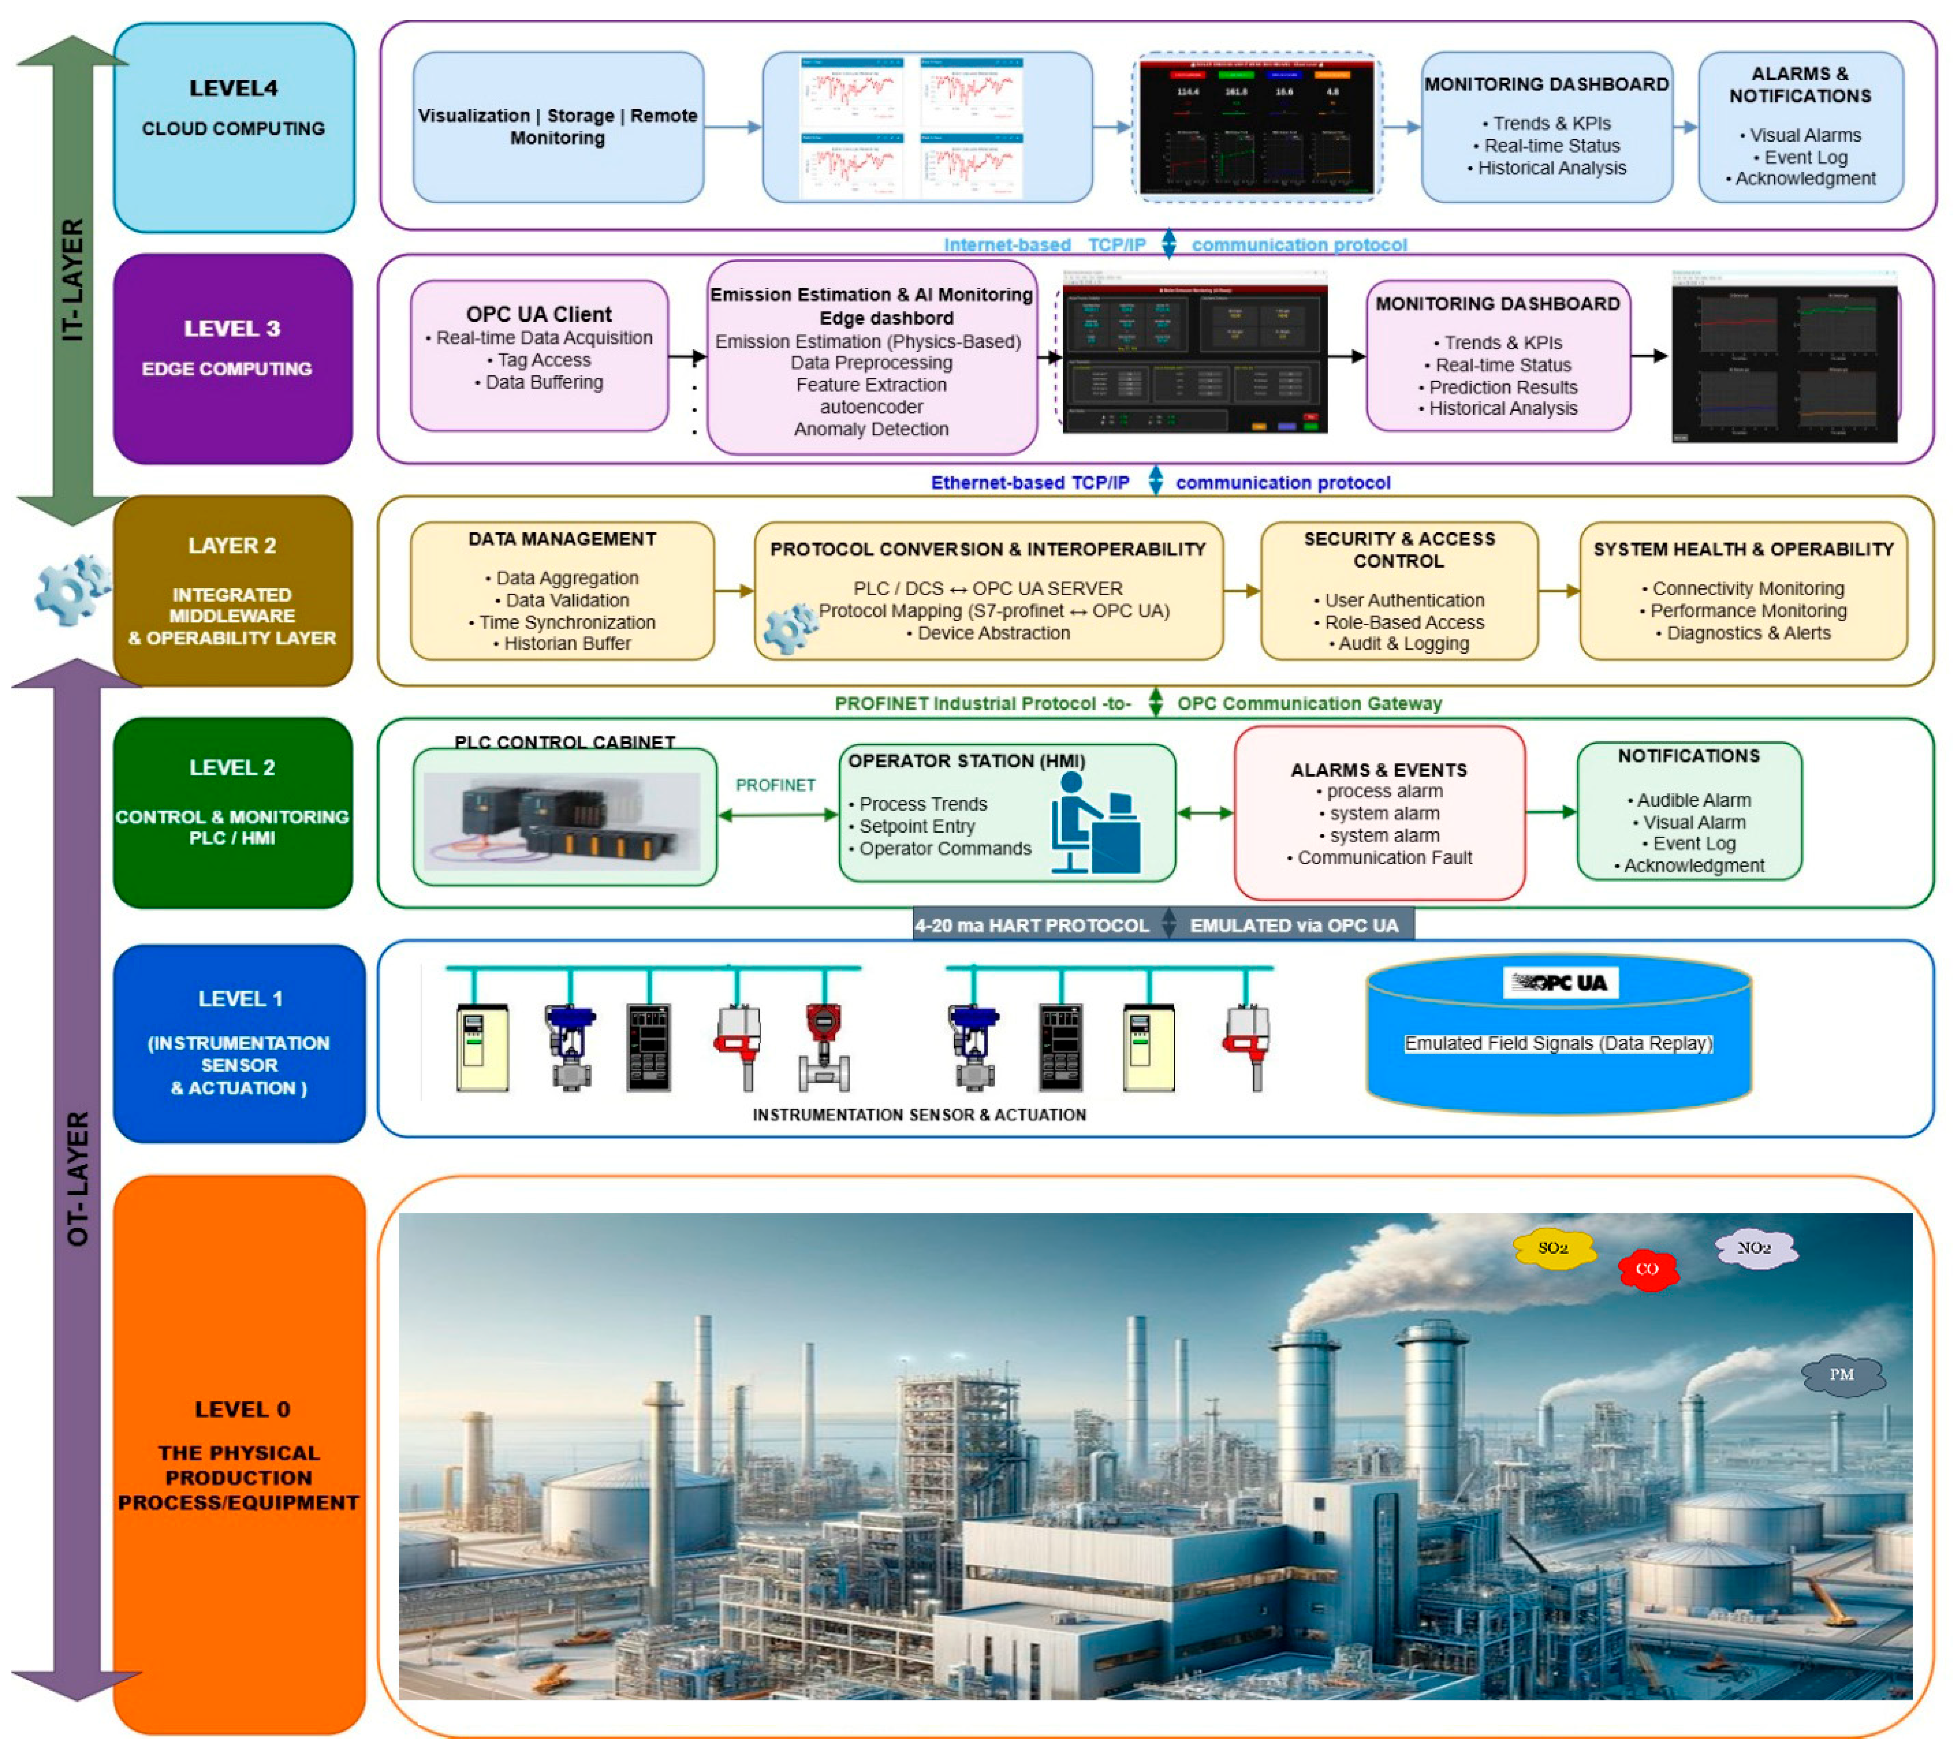
From an architectural perspective, the framework is organized into three layers: the Operational Technology (OT) layer, the OPC UA middleware layer, and the Information Technology (IT) layer. The OT layer acquires process measurements from the industrial control system, the middleware layer provides standardized interoperability between the OT and IT domains, and the IT layer performs edge/cloud analytics, visualization, and monitoring services. This layered architecture enables seamless integration of legacy industrial control systems with higher-level digital services while preserving the existing automation infrastructure. The interaction among these layers is illustrated in Figure 1, while Table 1 and Table 2 summarize the hardware and software components used in the implementation.
Figure 1.
Proposed OT–IT emission monitoring framework aligned with the ISA-95 model and enabled by. OPC UA communication.
Table 1.
Summary of System Hardware Components.
Table 2.
Software Components.
The description of layers and their role and function is illustrated in the following subsections.
3.2. Operational Technology (OT) Layer
The Operational Technology (OT) layer represents the physical process and control environment of the industrial boiler, where process variables are generated, measured, and controlled in real time. This layer comprises the field level (sensors and actuators) and the control level (PLC and SCADA systems), which together form the foundation of the industrial data acquisition infrastructure.
At the field level, industrial-grade sensors continuously measure key process variables, including fuel flow rate, air flow, oxygen concentration, temperature, and pressure. These measurements reflect the dynamic behavior of the combustion process and provide the real-time operating data required for emission estimation and condition monitoring.
At the control level, a Siemens S7-300 PLC continuously acquires signals from the field devices and executes the boiler control logic, ensuring deterministic operation. The PLC organizes the acquired measurements into structured data blocks, providing consistent and reliable data handling. A SCADA interface enables operators to visualize process conditions, supervise boiler operation, and interact with the control system in real time.
3.3. OPC UA Middleware Layer
The OPC UA communication protocol serves as the interoperability middleware between the PLC-based control system and the edge analytics layer, enabling standardized and secure data exchange between the OT and IT domains without affecting real-time control operation. The OPC UA server is deployed on an industrial communication platform and connected to the PLC through an Industrial Ethernet network. The PLC data blocks, DB1500 (process variables) and DB5000 (estimated emission rates), are mapped to structured OPC UA tags with predefined addresses, data types, engineering units, and scaling factors to ensure consistent data interpretation throughout the framework, as summarized in Table 3.
Table 3.
Mapping of PLC Data Blocks (DB1500, DB5000) to Structured OPC UA Tags.
The OPC UA server operates synchronously with the PLC scan cycle, providing time-consistent data acquisition through non-intrusive communication that does not modify the existing control logic or affect system performance. In addition, OPC UA incorporates built-in security mechanisms, including user authentication, authorization, and secure communication channels, to support protected data exchange between industrial control systems and higher-level applications. The security configuration can be adapted according to the cybersecurity requirements of the target industrial environment.
The OPC UA information model further organizes process variables within a hierarchical namespace, enabling efficient data access and seamless integration with edge and cloud applications. Consequently, this middleware layer provides the standardized interoperability required to transform industrial control data into higher-level monitoring, analytics, and decision-support services while preserving the integrity of the existing automation infrastructure.
3.4. Information Technology (IT) Layer
The Information Technology (IT) layer processes, analyzes, visualizes, and stores industrial process data received from the OT domain through the OPC UA communication layer. It transforms real-time process measurements into actionable monitoring information for operators and higher-level digital services. The IT layer comprises two levels: Level 3 performs edge-based real-time analytics, while Level 4 provides cloud-based monitoring and data storage, as described in Section 3.4.1 and Section 3.4.2.
3.4.1. Edge Analytics (Level 3)
At this level, the edge computer receives real-time process data through OPC UA and performs local processing with minimal communication latency. Edge analytics integrates physics-based emission estimation, AI-based anomaly detection, and real-time visualization to support continuous monitoring and timely operational awareness.
- Physics-Based Emission Estimation
The physics-based emission estimation module continuously calculates the emission rates of major pollutants, including CO, SO2, NO2, and particulate matter (PM), using process variables acquired every second. The adopted model is based on established combustion and flue gas relationships, enabling continuous emission estimation under varying operating conditions.
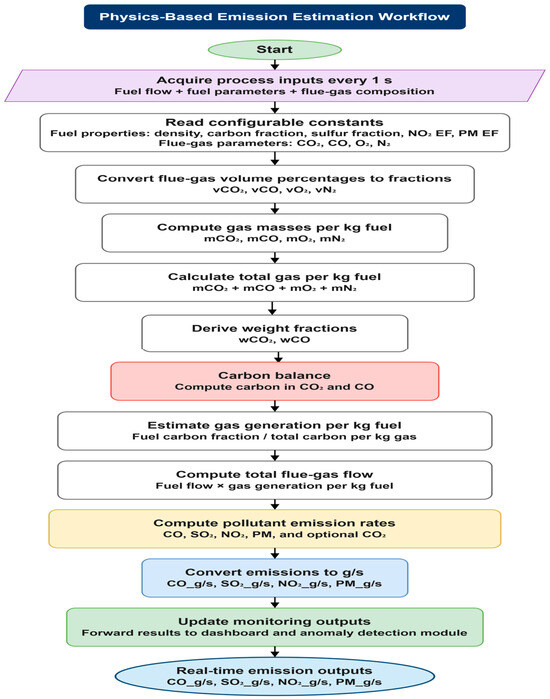
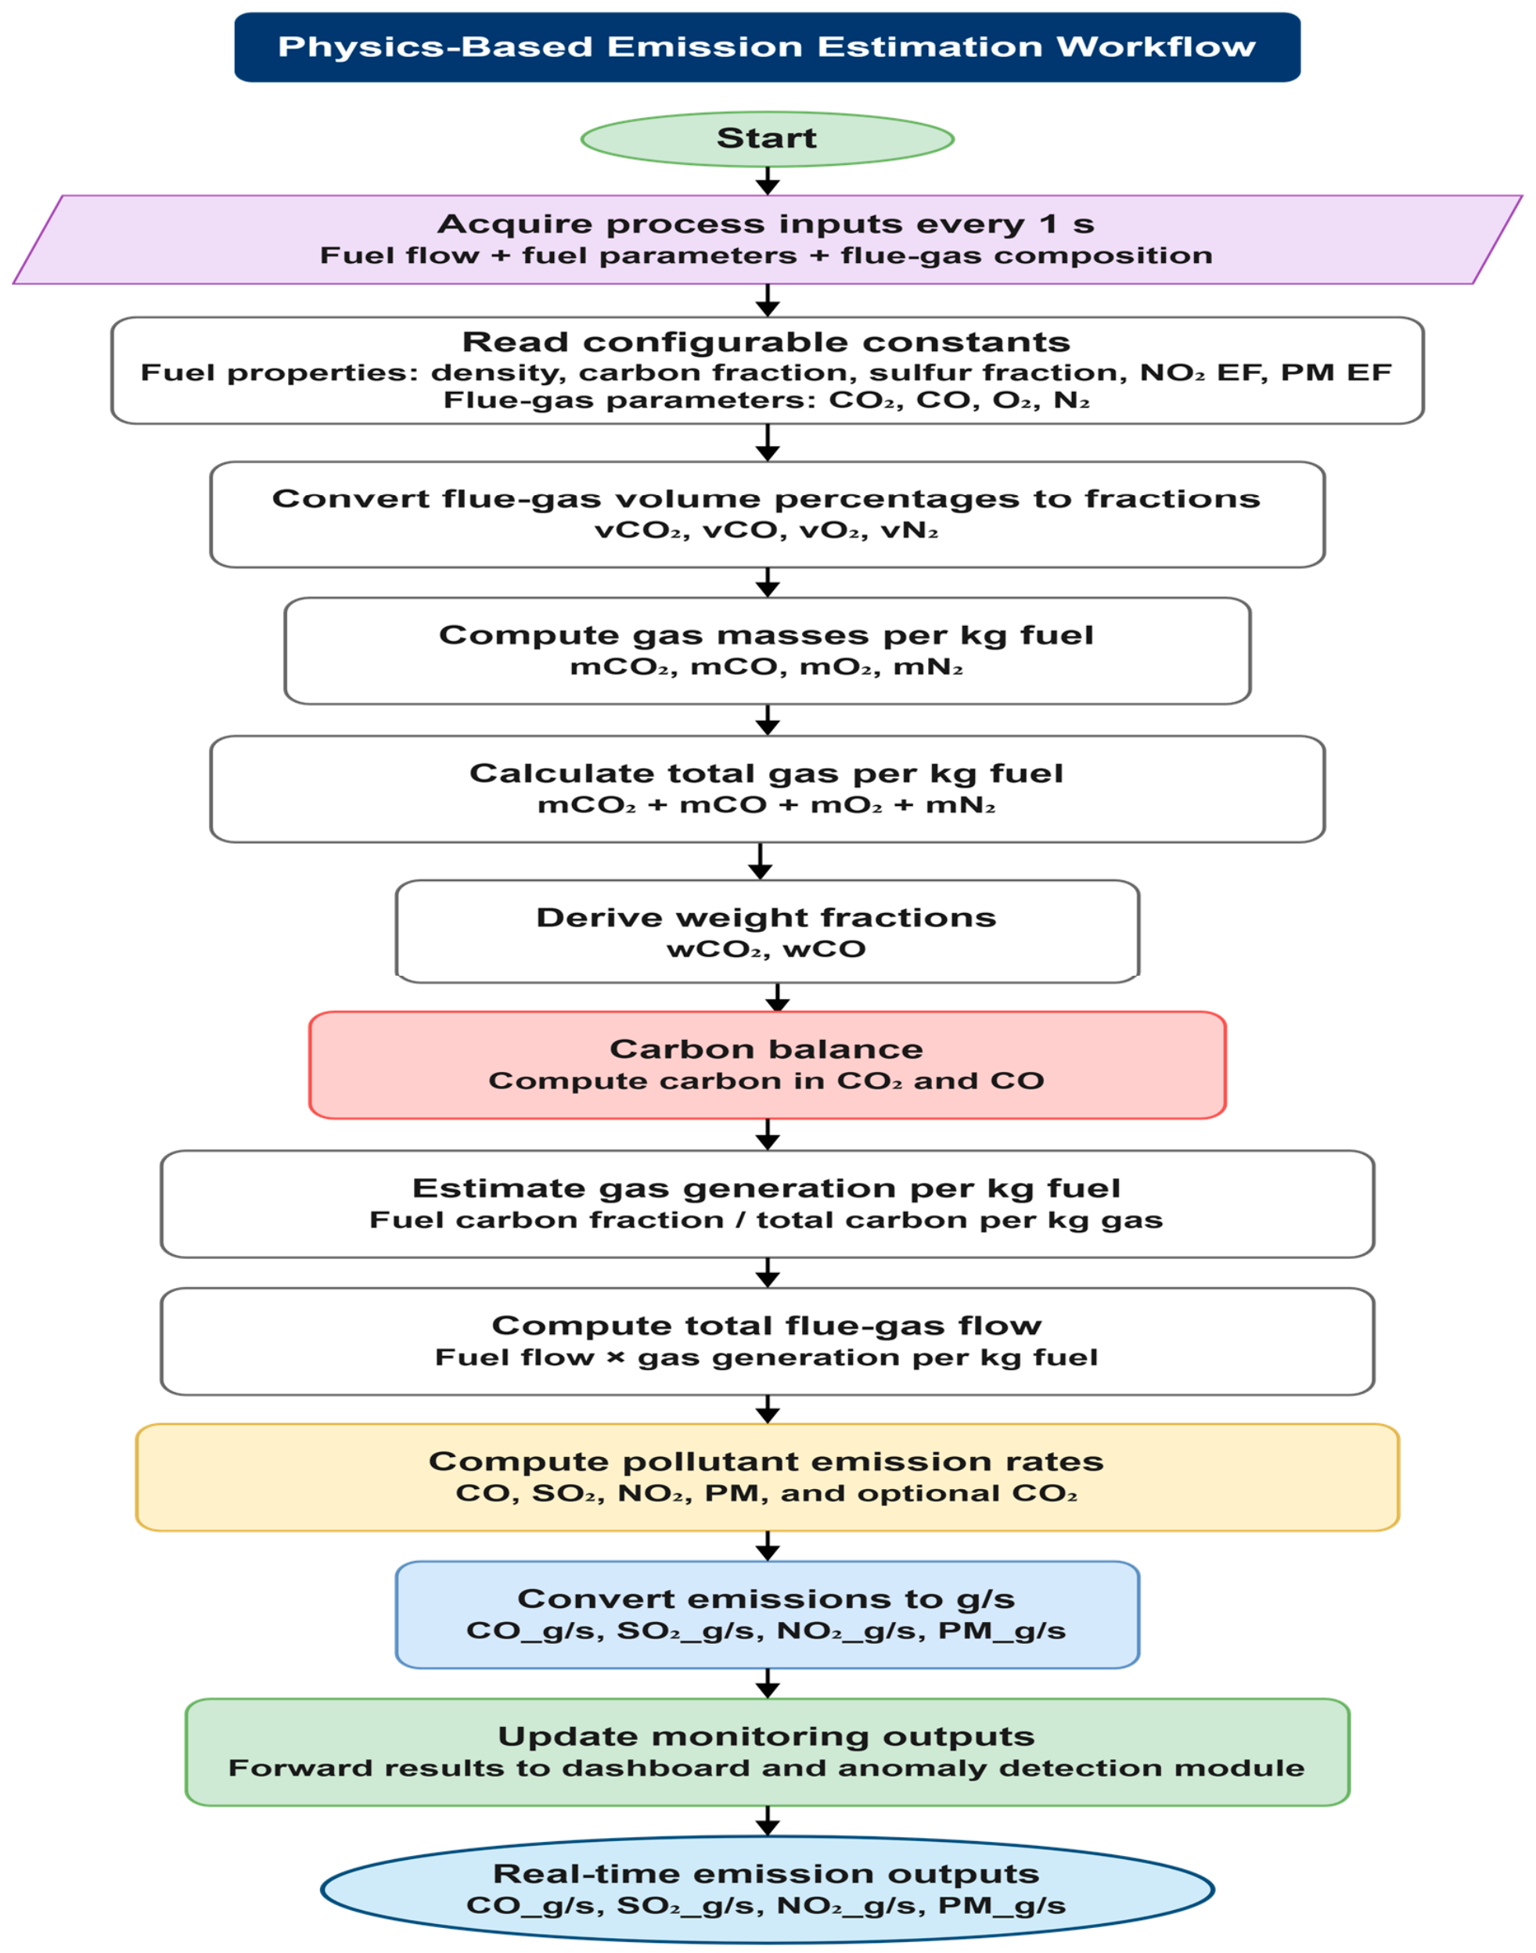
The complete mathematical formulation of the proposed emission estimation model is presented in Section 2. Figure 2 summarizes the computational workflow from raw process measurements to continuous emission estimation.
Figure 2.
Work Flow for Physics-Based Emission Calculation.
- B.
- AI-Based Anomaly Detection
The proposed anomaly detection module employs a data-driven autoencoder to learn the underlying multivariate relationships that characterize normal boiler operation. Unlike conventional threshold-based approaches, the model learns a compressed representation of normal system behavior, enabling the detection of subtle and previously unseen operational deviations.
The model was trained offline using 7825 normal samples collected over approximately one year of boiler operation. The original dataset consisted of the measured process variables, which were subsequently processed by the proposed physics-based emission estimation module to generate the corresponding estimated emission variables. These estimated emissions were incorporated into the original dataset, forming the integrated feature set presented in Table 4. The autoencoder was then trained using this expanded dataset to learn the normal relationship between the measured process variables and the corresponding estimated emissions over different operating loads. Consequently, abnormal process conditions, sensor deviations, or inconsistencies affecting either the measured variables or the estimated emissions are reflected as increased reconstruction error during inference, thereby improving anomaly detection sensitivity.
Table 4.
Input Features for Auto encoder Training.
An encoder function maps the input vector from the high-dimensional feature space into a lower-dimensional latent representation , while a decoder function reconstructs the original input from the latent space:
The encoder layers employed the saturating linear activation function (satlin), while the decoder layers utilized a pure linear activation function (purelin) to reconstruct the original process variables. The training objective is to minimize the reconstruction error using the Mean Squared Error (MSE):
Due to the limited availability of labeled industrial fault records, synthetic anomalies were generated to enable controlled evaluation of the proposed anomaly detection framework. These anomalies were designed to emulate representative abnormal operating conditions encountered in industrial boiler systems, including sensor drift, abrupt signal deviations, and process disturbances, while remaining consistent with the physical behavior of the monitored process.
The dataset was divided into training, validation, and testing subsets (80%, 15%, and 5%, respectively). The training and validation sets contained only normal samples, allowing the autoencoder to learn and validate the baseline operating behavior. The testing set combined the remaining normal samples with the generated anomalies to evaluate the detection performance. The optimal model configuration was identified through a systematic grid search over the selected hyperparameters, as summarized in Table 5.
Table 5.
Grid Search Parameters and Optimal Configuration.
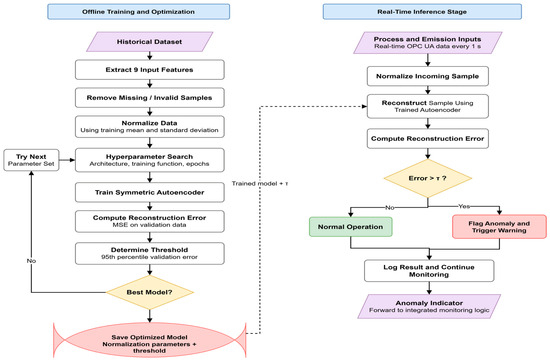
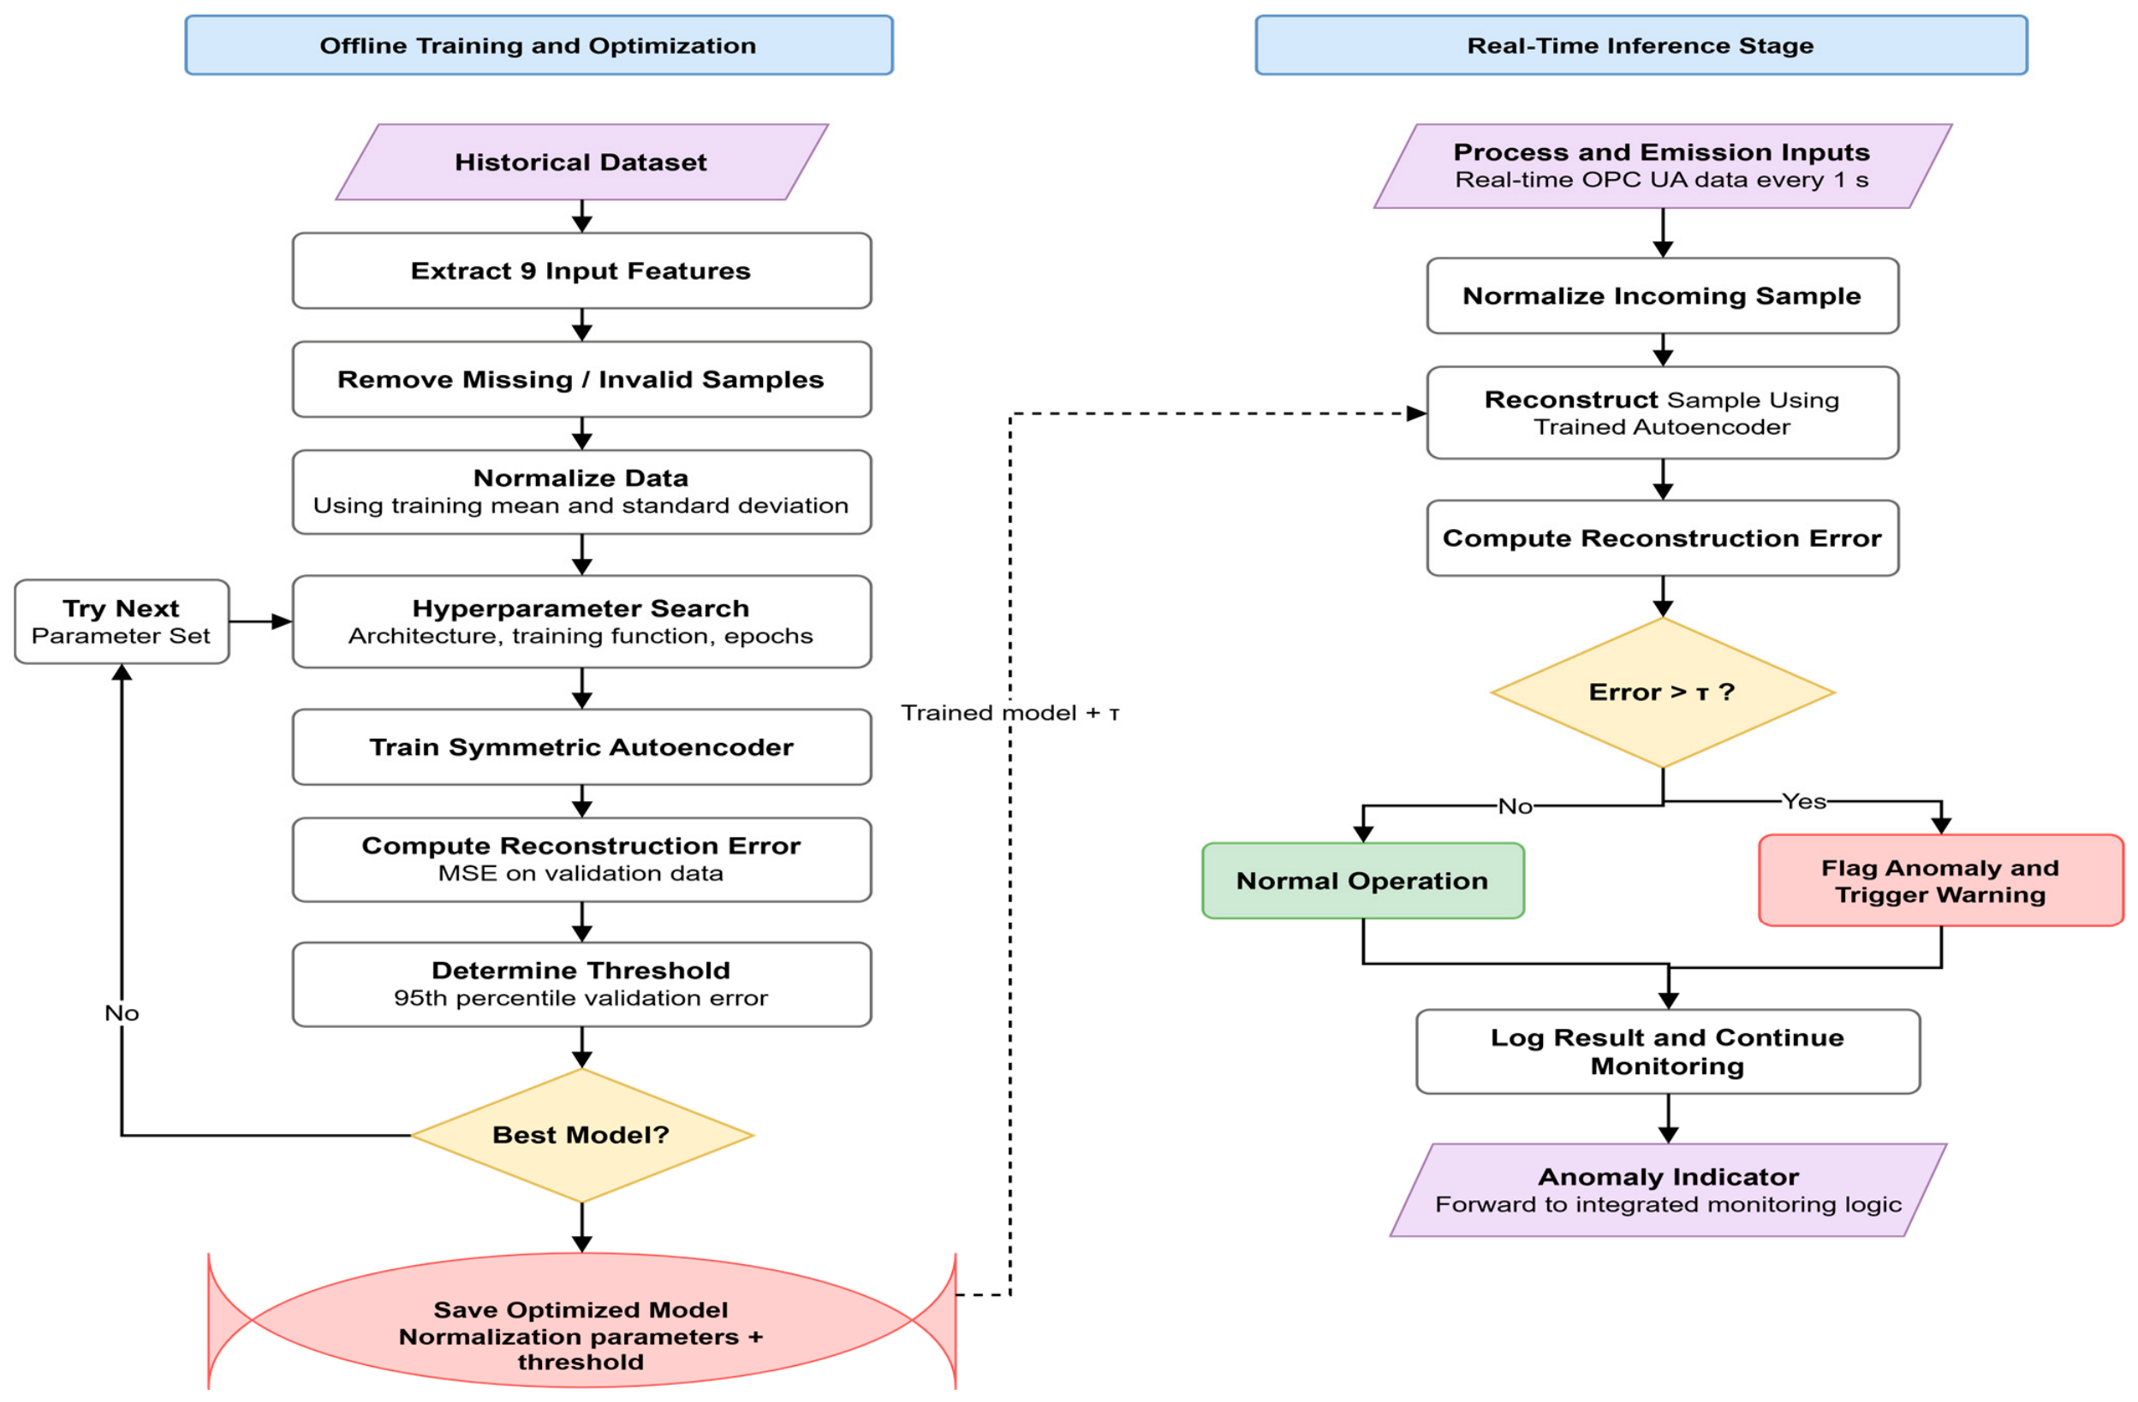
During inference, anomalies are identified by comparing the reconstruction error with a statistically determined threshold. Specifically, the 95th percentile of the reconstruction error distribution obtained from the validation dataset is selected as the decision threshold, denoted by τ. Consequently, approximately 95% of the normal validation samples fall below this threshold, while samples exceeding τ are classified as anomalous. This data-driven thresholding strategy eliminates manual threshold selection and improves adaptability to normal process variations. Figure 3 summarizes the complete workflow, including data preprocessing, model training, threshold determination, and real-time inference.
Figure 3.
Flowchart of the proposed auto encoder-based anomaly detection workflow, including offline training and quasi-real time deployment.
- C.
- Monitoring and Visualization
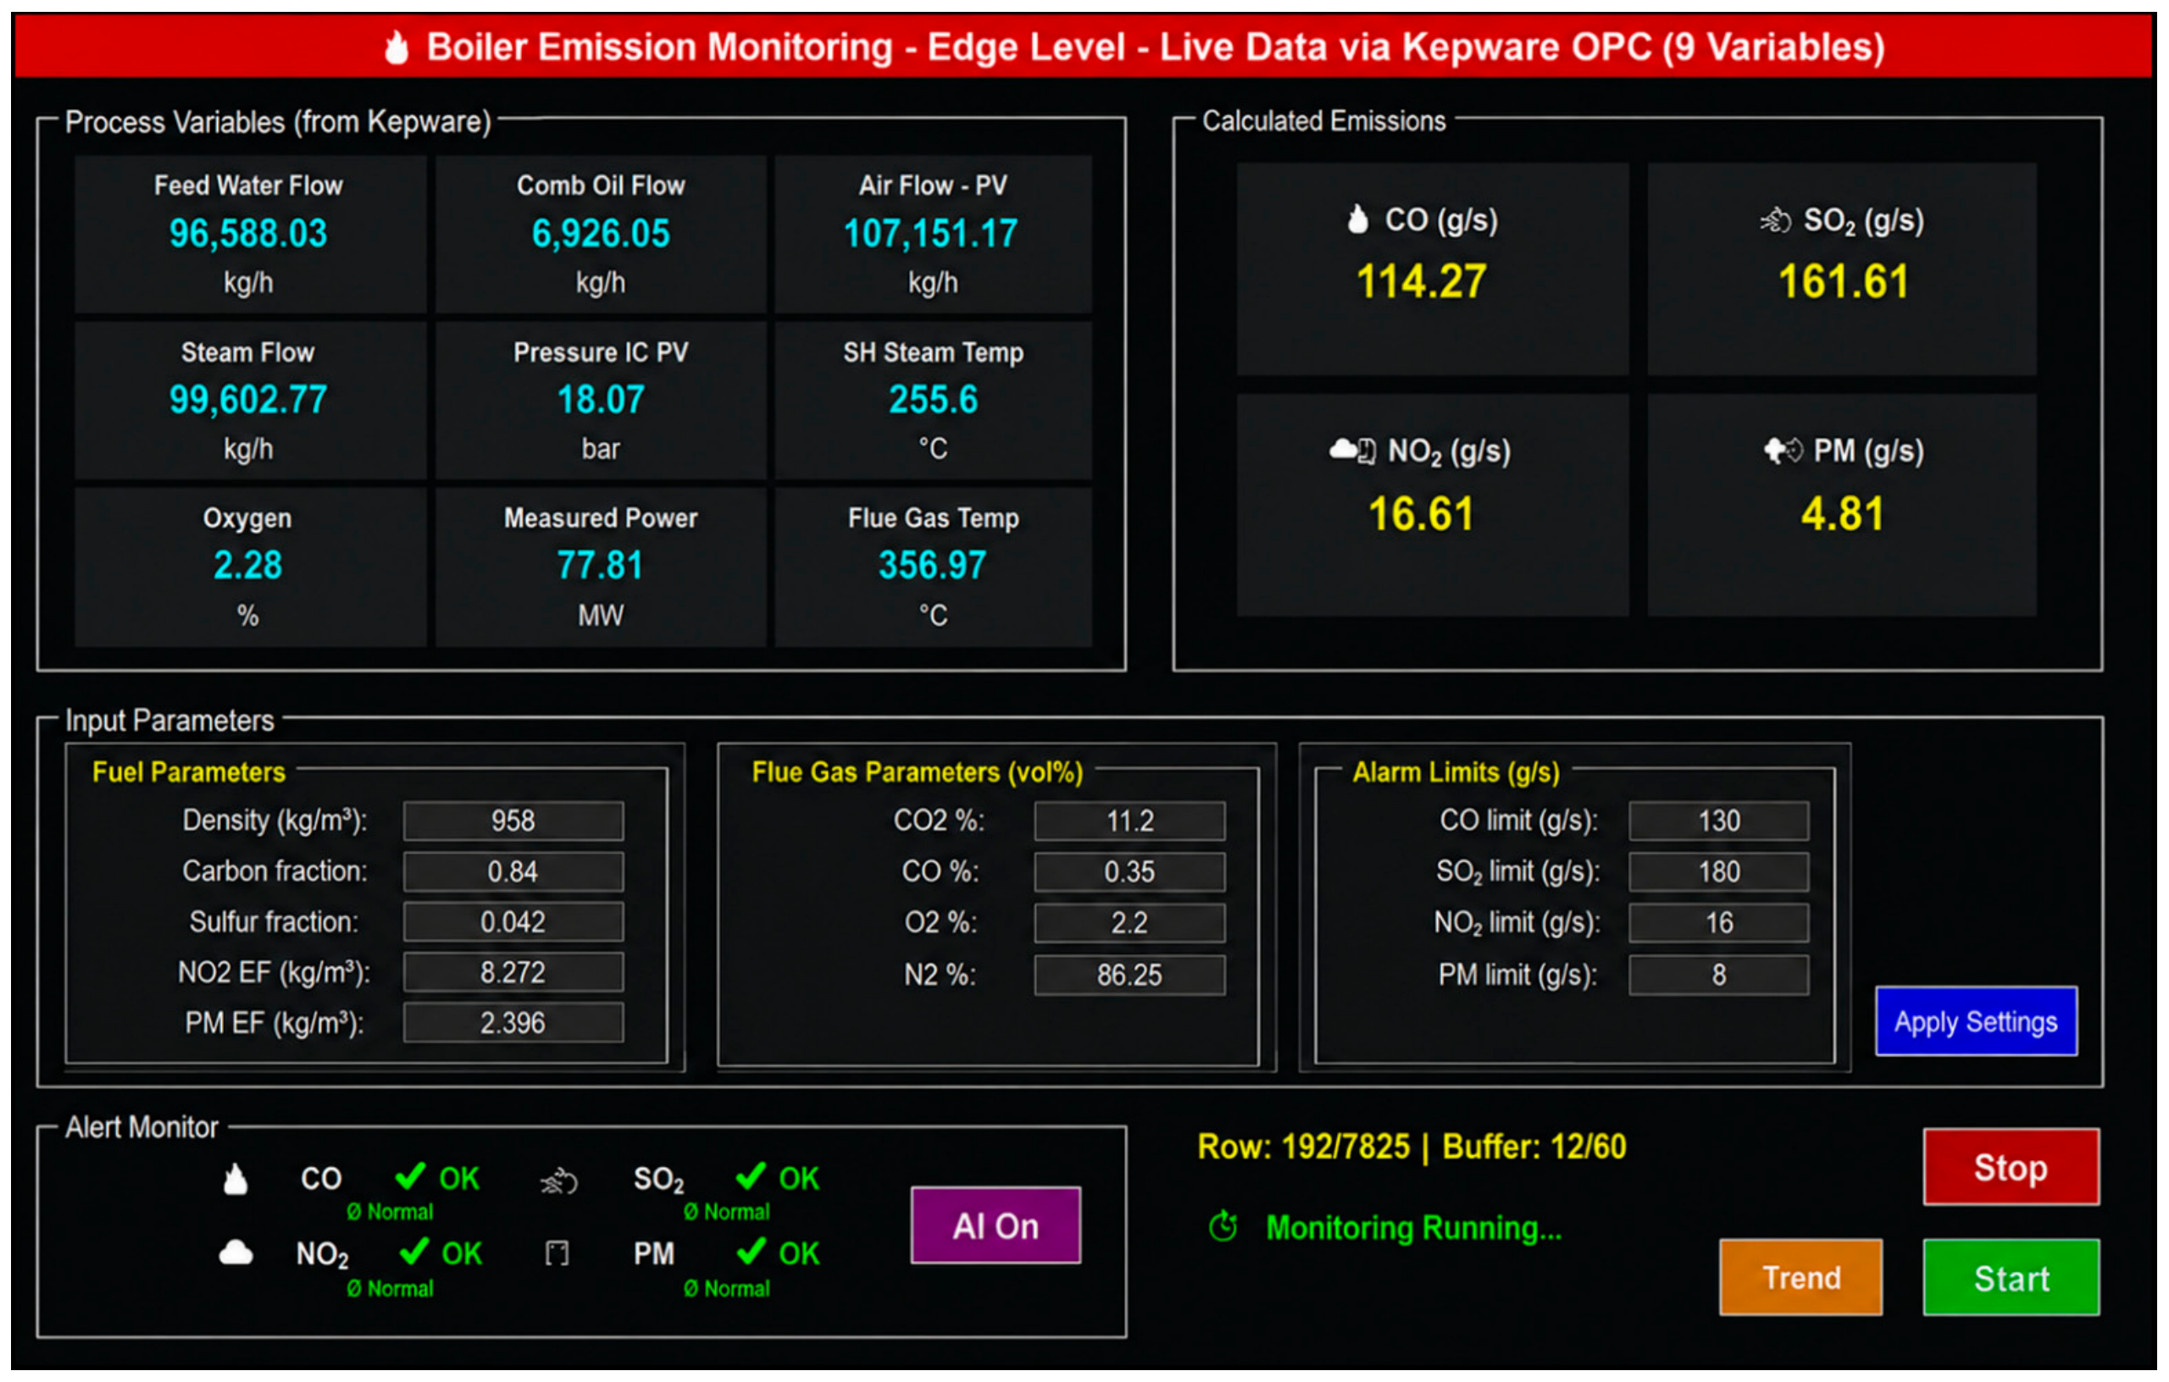
The edge monitoring dashboard provides a unified human–machine interface for visualizing process measurements, estimated emissions, and anomaly information. The interface is organized into multiple functional panels, each supporting a specific monitoring or configuration task.
The upper section displays real-time process measurements, including fuel flow, air flow, oxygen concentration, temperature, pressure, and power, together with the corresponding estimated emissions of CO, SO2, NO2, and PM. Presenting process variables and emission estimates simultaneously enables operators to directly relate combustion conditions to the corresponding environmental indicators.
The central section provides configuration functions for the proposed framework. It includes panels for fuel properties, flue gas composition, and alarm configuration, allowing users to define carbon and sulfur fractions, emission factors, gas concentrations, and pollutant alarm thresholds. The lower section presents system status, anomaly indicators, and control functions for system execution, trend visualization, and activation of the AI-based anomaly detection module.
Overall, the dashboard provides a non-intrusive edge-level interface that separates monitoring, configuration, and control functions while remaining fully compatible with the existing industrial automation system.
3.4.2. Cloud Layer
The cloud layer extends the monitoring capability beyond the plant environment by providing remote access to process and emission information through the ThingSpeak platform. It complements the edge analytics layer by supporting long-term data storage, web-based visualization, and remote environmental monitoring.
Selected variables, including CO, SO2, NO2, PM, fuel oil flow rate, steam flow, oxygen concentration, and flue gas temperature, are periodically transmitted from the edge layer to a dedicated cloud channel every 60 s. The edge application verifies each transmission and temporarily buffers data during communication interruptions, ensuring data continuity without affecting real-time industrial operation.
The cloud platform further supports configurable alarm notifications, remote visualization, and historical data analysis. Consequently, it extends the proposed monitoring framework beyond the local industrial environment while preserving low-latency processing and operational integrity at the edge level.
4. Results and Discussion
The evaluation of the framework is accomplished through three complementary aspects: (i) the accuracy of the model, (ii) the ability to detect anomalies, and (iii) system-level performance under quasi-real time deployment.
4.1. Verification of the Physics-Based Emission Estimation Framework
This subsection presents the offline validation of the proposed physics-based emission estimation model using experimentally determined fuel properties and flue gas composition under representative industrial operating conditions. The laboratory measurements summarized in Table 6 and Table 7 characterize the actual combustion conditions and provide the basis for model validation.
Table 6.
Fuel Parameters.
Table 7.
Flue Gas Parameters (vol%).
The validation was performed under four representative boiler operating conditions: (i) minimum load (40% MCR), (ii) normal operation (70% MCR), (iii) maximum continuous rating (100% MCR), and (iv) peak load (120% MCR), corresponding to fuel flow rates of approximately 4096, 7147, 10,240, and 12,435 kg/h, respectively. These operating conditions cover the typical combustion range encountered during industrial boiler operation.
The proposed estimation model was validated against independent engineering calculations performed manually using the mathematical formulations presented in Section 2 (Equations (1)–(14)). As summarized in Table 8, the estimated emission rates of CO, SO2, NO2, and PM closely agree with the corresponding engineering reference values across all evaluated operating conditions, with relative differences generally below 0.1%.
Table 8.
Comparison between physics-based model predictions and reference calculations.
Different estimation strategies are adopted for different pollutants within the proposed framework. While CO and SO2 are estimated directly from measured process variables and combustion relationships, the estimation of NO2 and PM incorporates standardized emission factors together with the measured operating conditions.
Minor deviations are observed under extreme operating conditions. At low boiler loads, these deviations are mainly associated with combustion instability and increased sensitivity to measurement uncertainty, whereas at high loads they are primarily attributed to nonlinear combustion behavior and variations in excess air. Overall, these deviations remain within the expected engineering tolerance and are consistent with the assumptions of the adopted combustion model.
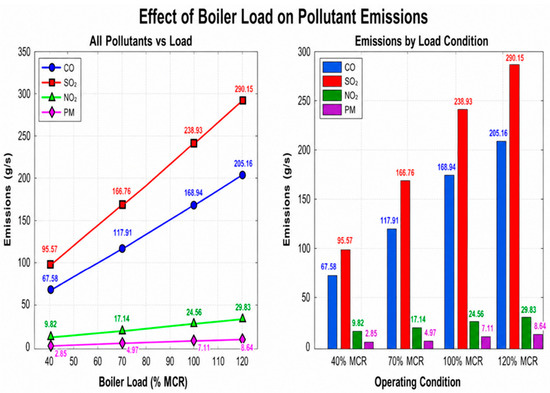
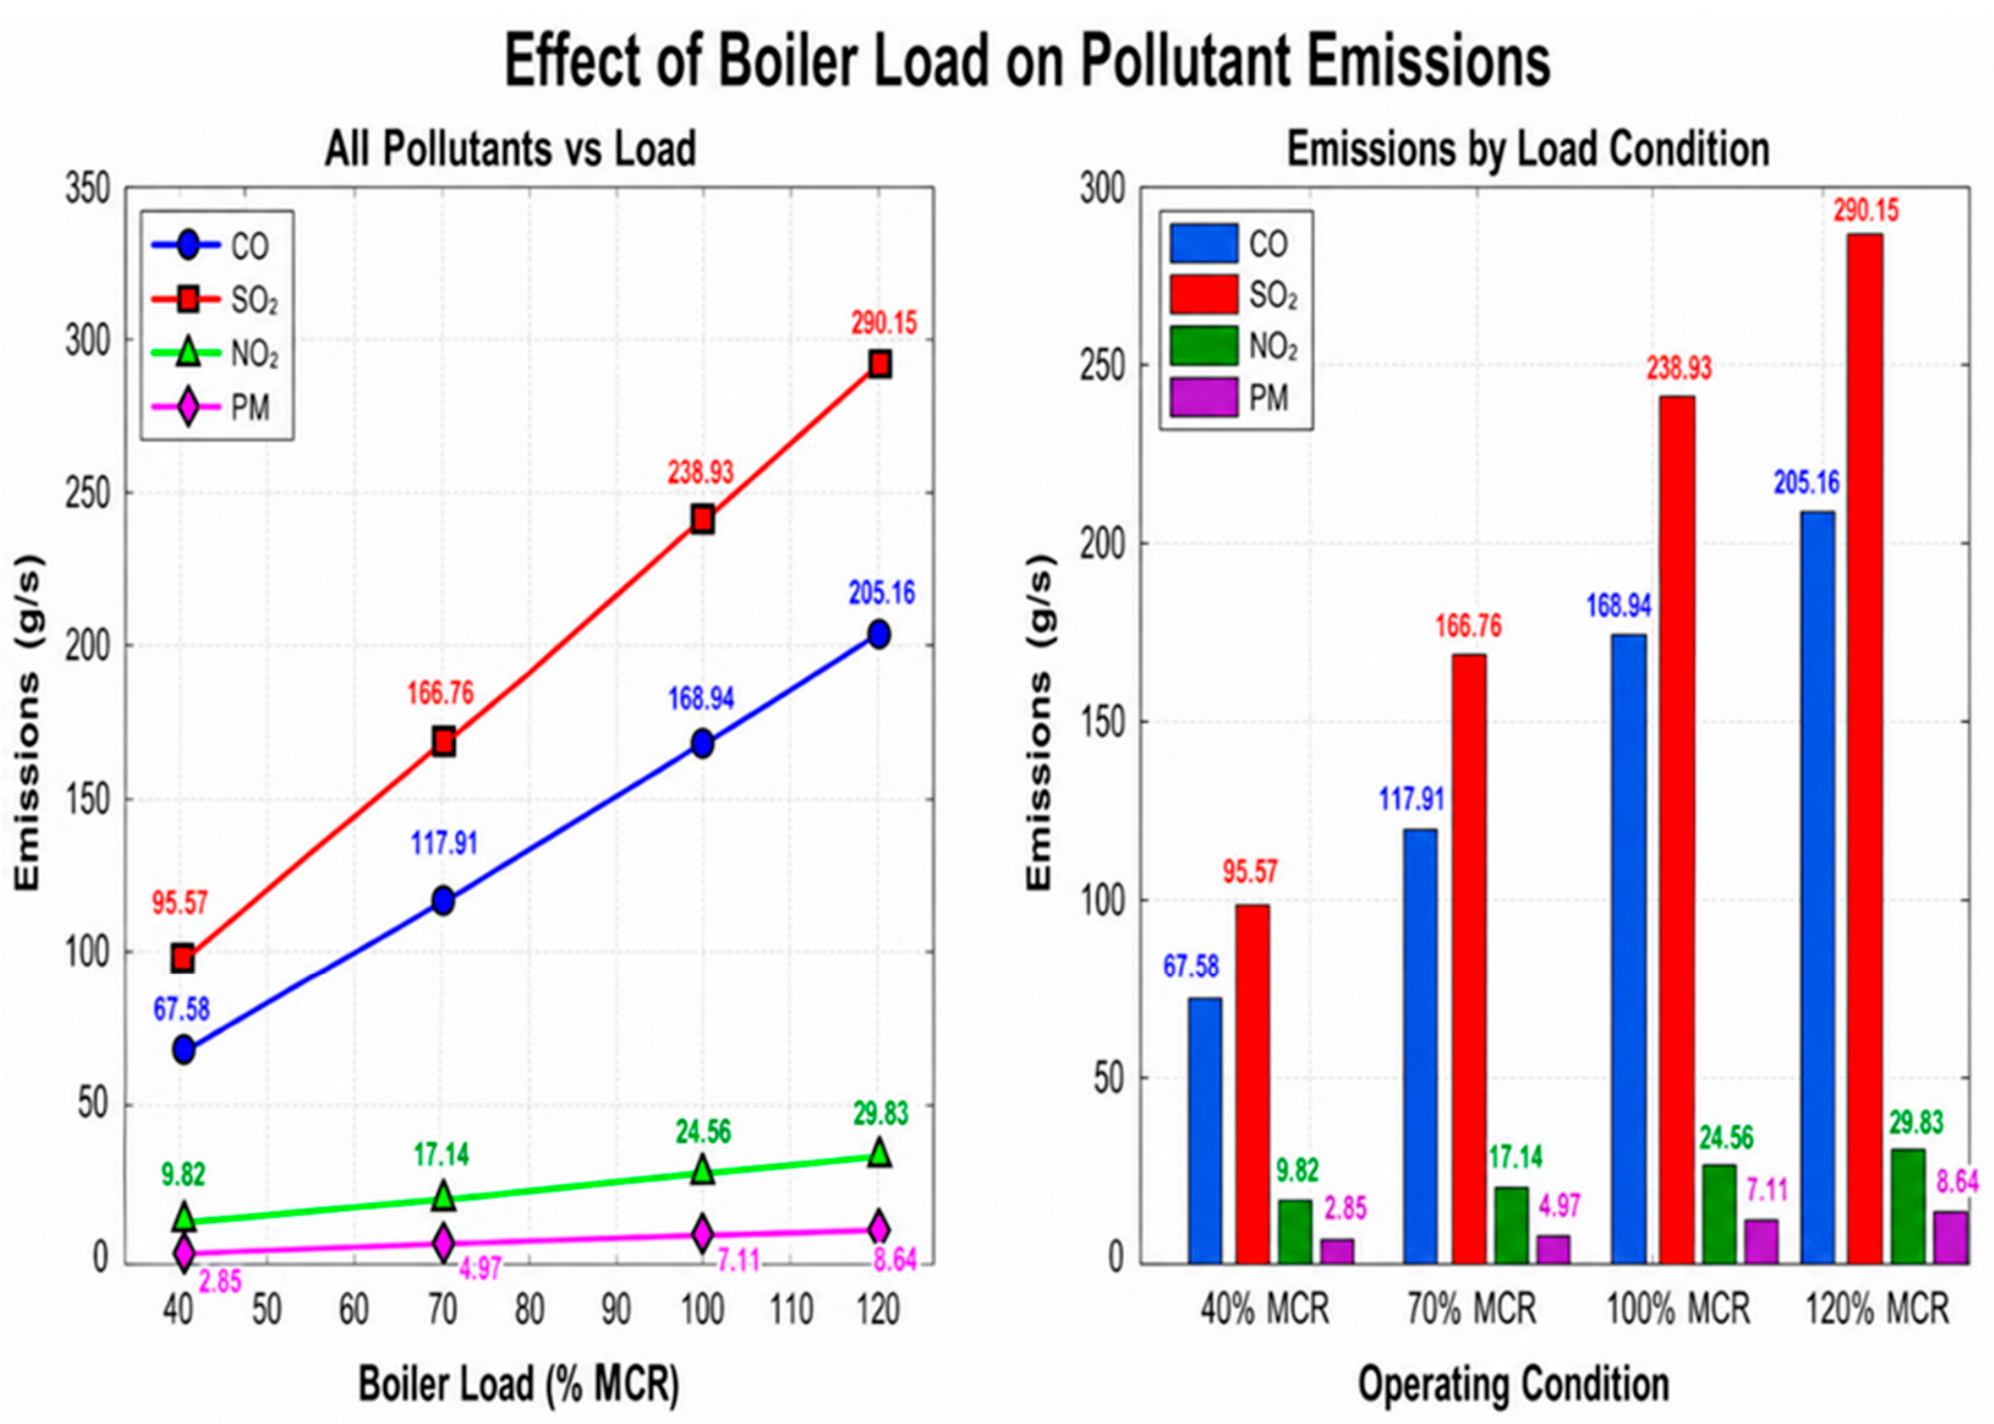
Figure 4 illustrates the variation of pollutant emission rates with boiler load under the four evaluated operating conditions. As expected, increasing boiler load increases fuel consumption, resulting in higher pollutant generation according to the adopted combustion relationships. SO2 exhibits the largest absolute increase, rising from 95.57 to 290.15 g/s across the evaluated load range, reflecting its direct dependence on the sulfur content of the fuel. CO, NO2, and PM also increase approximately proportionally with boiler load, exhibiting an average increase of about 203% between 40% and 120% MCR. These trends indicate that the implemented model preserves the expected relationship between fuel consumption and pollutant formation throughout the investigated operating range.
Figure 4.
Effect of Boiler Load on Pollutant Emissions.
Although the adopted combustion model captures the dominant emission behavior, the estimated values remain influenced by variations in operating conditions, fuel properties, and measurement uncertainty. To further evaluate these effects, a sensitivity analysis was performed at a fixed operating condition corresponding to 100% MCR (10,240 kg/h), where individual input parameters were varied while all remaining parameters were kept constant.
The sensitivity analysis indicates that the model is most responsive to changes in CO concentration within the flue gas, where a variation of only 0.05 vol% produces a 13.79% change in the estimated CO emission rate. Fuel composition also has a direct influence on the estimated emissions. A ±1% variation in carbon fraction produces an approximately ±1% change in CO emissions, while an equivalent variation in sulfur fraction results in an approximately ±1% change in SO2 emissions. In contrast, fuel density mainly influences the volume-based pollutants (NO2 and PM), where a ±1% variation produces an approximately ±1% change in the estimated emission rates.
Overall, the observed responses are consistent with the governing combustion relationships implemented in the proposed estimation model and confirm that the software implementation preserves the analytical behavior of the underlying engineering formulation across the investigated operating conditions.
4.2. AI-Based Anomaly Model Performance Metrics
The performance metrics summarized in Table 9 demonstrate the capability of the proposed anomaly detection model to distinguish between normal and abnormal operating conditions under the evaluated industrial scenarios. The model achieved an overall accuracy of 94.08%, together with high precision (98.07%) and recall (94.29%), indicating balanced performance in minimizing false alarms while maintaining a high detection rate. This balance is further reflected by the F1-score of 96.14%, suggesting consistent detection performance across the evaluated operating conditions.
Table 9.
Auto Encoder-Based Anomaly Model Performance.
The specificity of 93.35% indicates that the model accurately recognizes normal operating states, thereby reducing unnecessary alarm generation during routine boiler operation. In addition, the AUC value of 0.981 confirms the model’s ability to effectively separate normal and abnormal operating patterns based on the learned feature representation.
It should be noted that the reported performance was obtained using synthetically generated anomalies and therefore represents a controlled evaluation of the proposed anomaly detection framework rather than comprehensive validation using real industrial fault events.
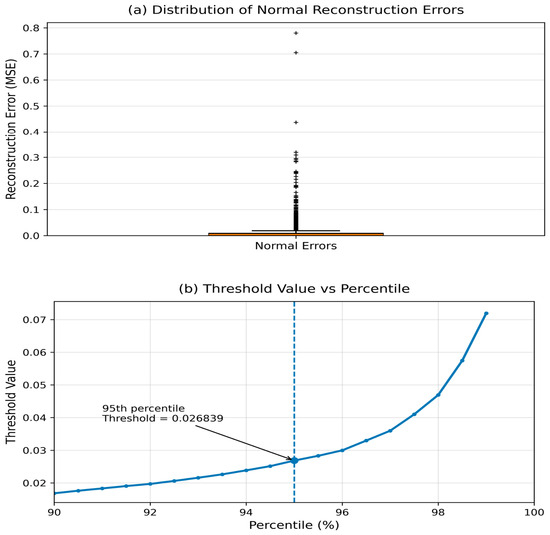
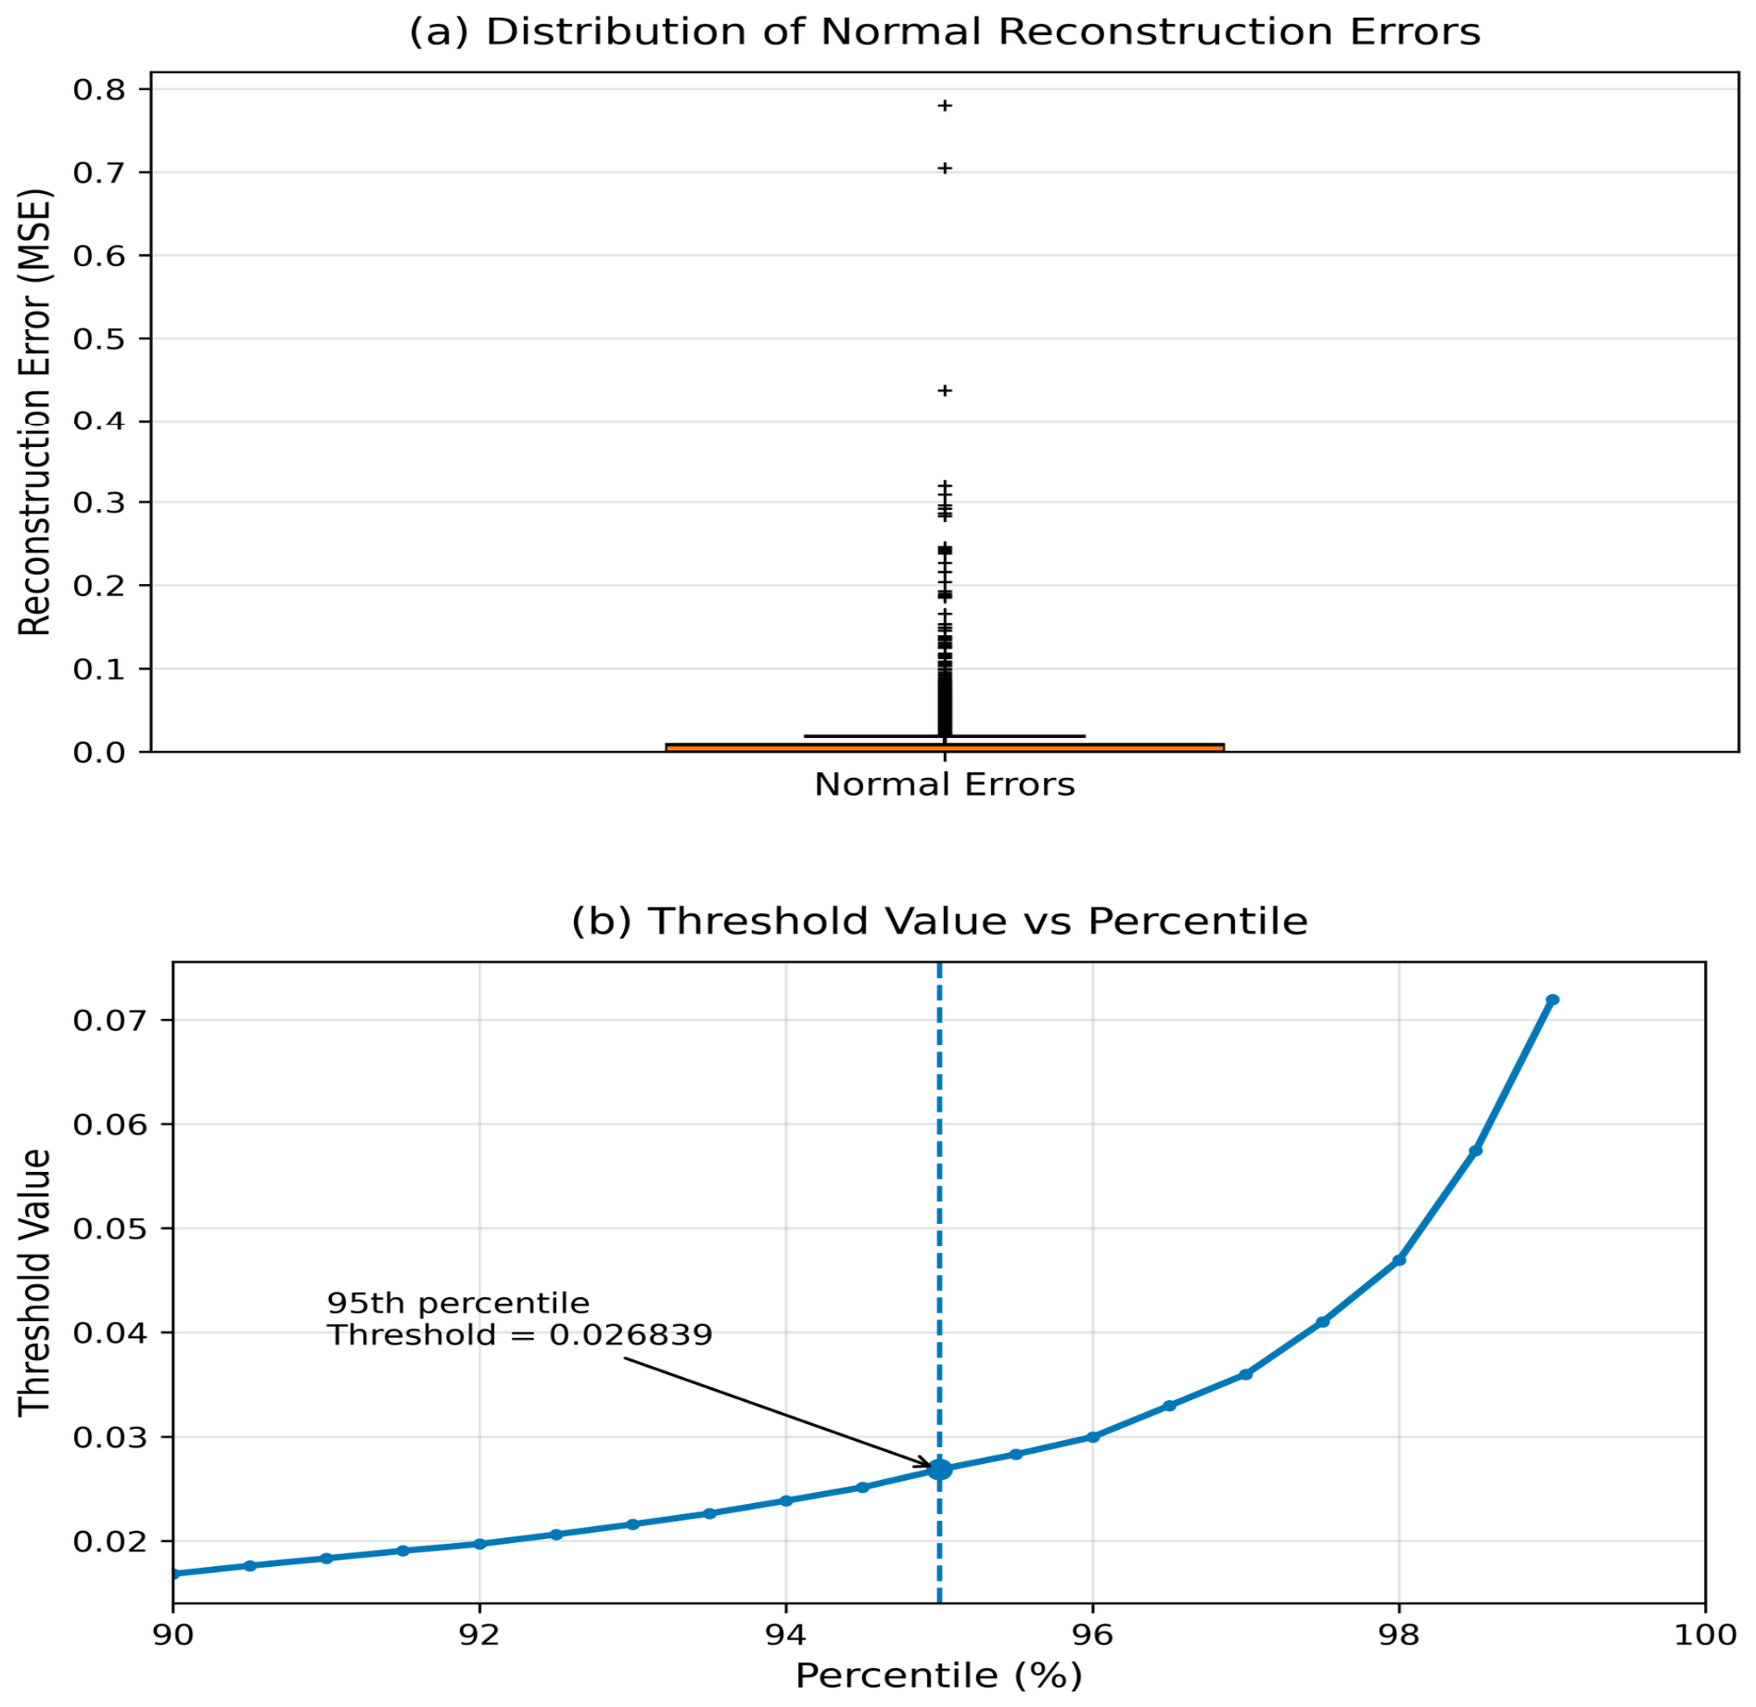
To further justify the anomaly decision criterion, Table 10 and Figure 5 present the statistical characteristics of the reconstruction errors together with the Sensitivity of the threshold value to percentile selection. As summarized in Table 10, the reconstruction errors are concentrated at relatively low values, with a median of 0.003922 and a mean of 0.008363, indicating that the autoencoder reconstructs normal operating conditions with relatively small reconstruction errors. The difference between the mean and median, together with the standard deviation (0.021239), reflects a positively skewed error distribution caused by a limited number of high-error observations. This behavior is also evident in Figure 5a, where most normal samples are clustered within a narrow low-error range, while only a small number of statistical outliers produce substantially larger reconstruction errors.
Table 10.
Descriptive statistics of reconstruction errors.
Figure 5.
(a) Distribution of normal reconstruction errors and (b) Sensitivity of the threshold value to percentile selection.
Figure 5b further demonstrates the influence of the selected percentile on the anomaly decision boundary. The threshold increases gradually between the 90th and 95th percentiles, whereas a more pronounced increase is observed beyond the 97th percentile as increasingly extreme reconstruction errors are included. Based on this analysis, the 95th percentile (0.026839) was selected as the operating threshold because it provides an appropriate compromise between limiting false alarms and maintaining sensitivity to abnormal operating conditions.
From an operational perspective, the selected process and estimated emission variables provide sufficient information to characterize the normal behavior of the boiler. Consequently, abnormal process conditions, sensor deviations, or inconsistencies affecting the monitored variables result in increased reconstruction error. During online inference, samples with reconstruction errors exceeding the predefined threshold are classified as anomalous, allowing operators to identify abnormal operating conditions and perform further investigation. These results indicate that the proposed AI module can be integrated with the physics-based emission estimation framework to provide complementary monitoring information within the same OT–IT architecture.
4.3. Online Deployment and System-Level Evaluation in an IIoT-Enabled OT–IT Framework
The proposed monitoring framework was implemented and validated using a Hardware-in-the-Loop (HiL) platform representing an IIoT-enabled OT–IT architecture. The platform operates directly on industrial control data acquired at one-second sampling intervals, enabling continuous monitoring and evaluation under representative industrial boiler operating conditions.
The integrated physics–AI framework performs two complementary tasks simultaneously. First, it continuously estimates the emission rates of CO, SO2, NO2, and PM using the proposed physics-based model. Second, it identifies abnormal operating conditions through the AI-based anomaly detection module, allowing deviations that may affect emission estimation to be detected during system operation.
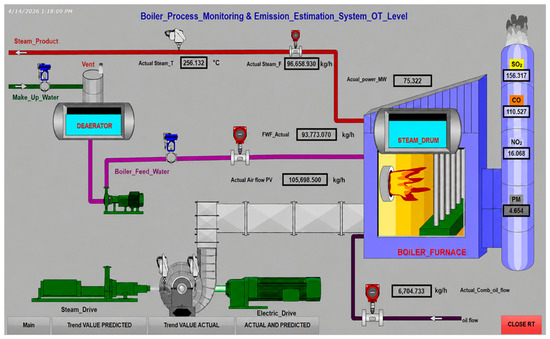
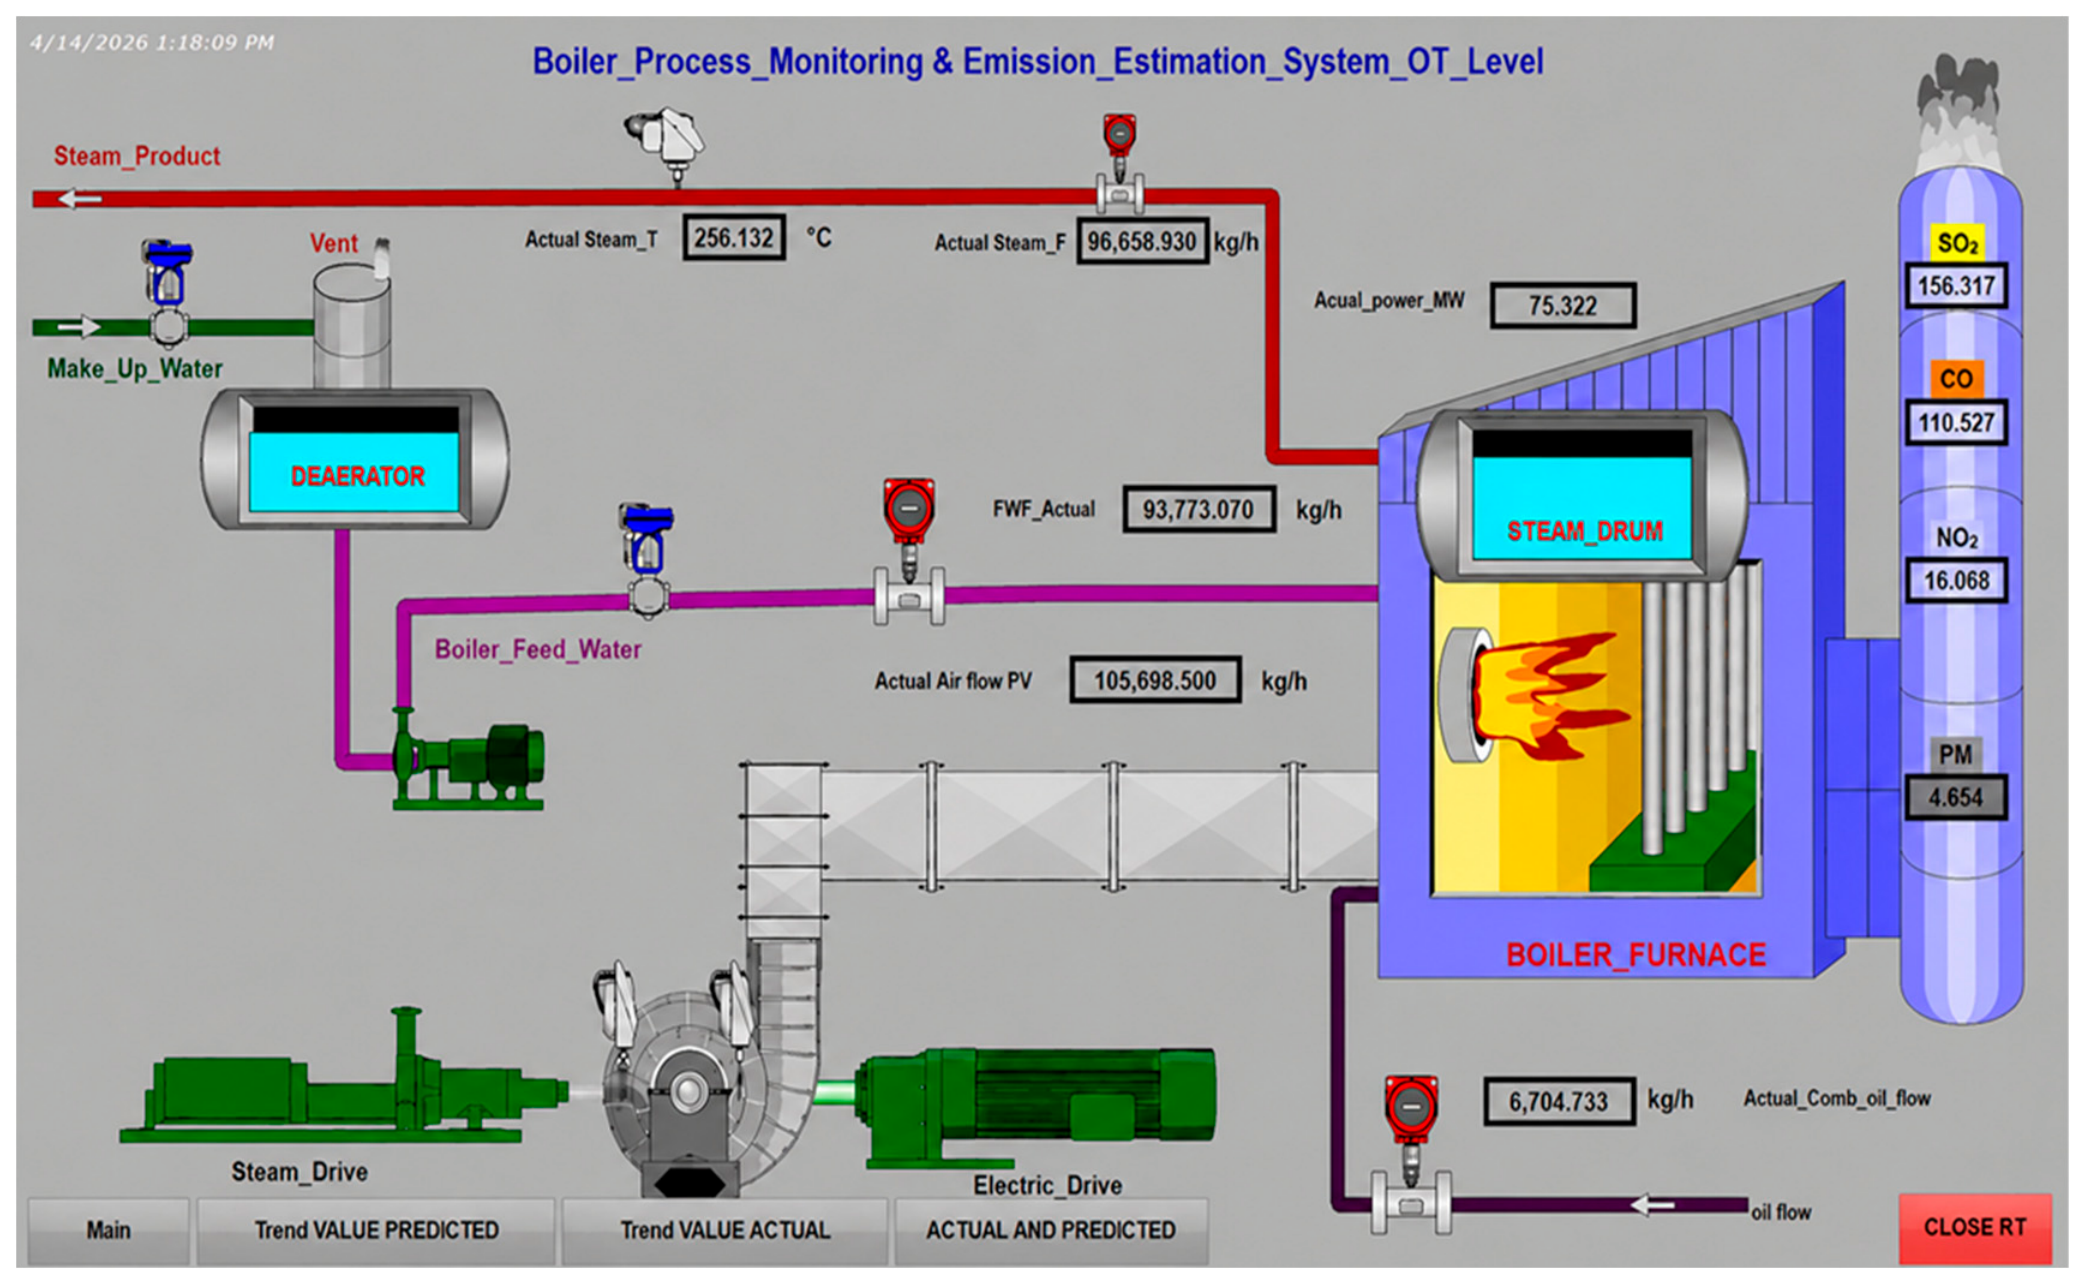
The estimated emission values are transmitted back to the OT layer and stored in dedicated PLC data blocks, allowing direct integration with the existing SCADA system. Figure 6 illustrates the resulting operator interface, where measured process variables and the corresponding estimated emission rates are displayed simultaneously. Presenting both types of information within a single interface enables operators to directly relate changes in combustion conditions to the corresponding environmental indicators.
Figure 6.
SCADA-based visualization of process and estimated variables.
The interface continuously displays key operating variables, including steam temperature, steam flow, feedwater flow, air flow, fuel consumption, and power output, together with the estimated emissions of CO, SO2, NO2, and PM. Variations in fuel flow or flue gas composition are immediately reflected in both the process variables and the estimated emissions, allowing operators to interpret changes in boiler operating conditions as they occur. In addition, the integrated trend displays facilitate the identification of gradual process deviations, supporting timely operational assessment without affecting the primary industrial control functions.
The edge-level dashboard (Figure 7) combines process measurements, estimated emissions, alarm status, and operator configuration into a unified human–machine interface. Presenting these data within a single workspace enables direct observation of the relationship between process dynamics and emission behavior, allowing gradual operational changes to be identified before they develop into significant process deviations.
Figure 7.
Edge-level real-time monitoring dashboard.
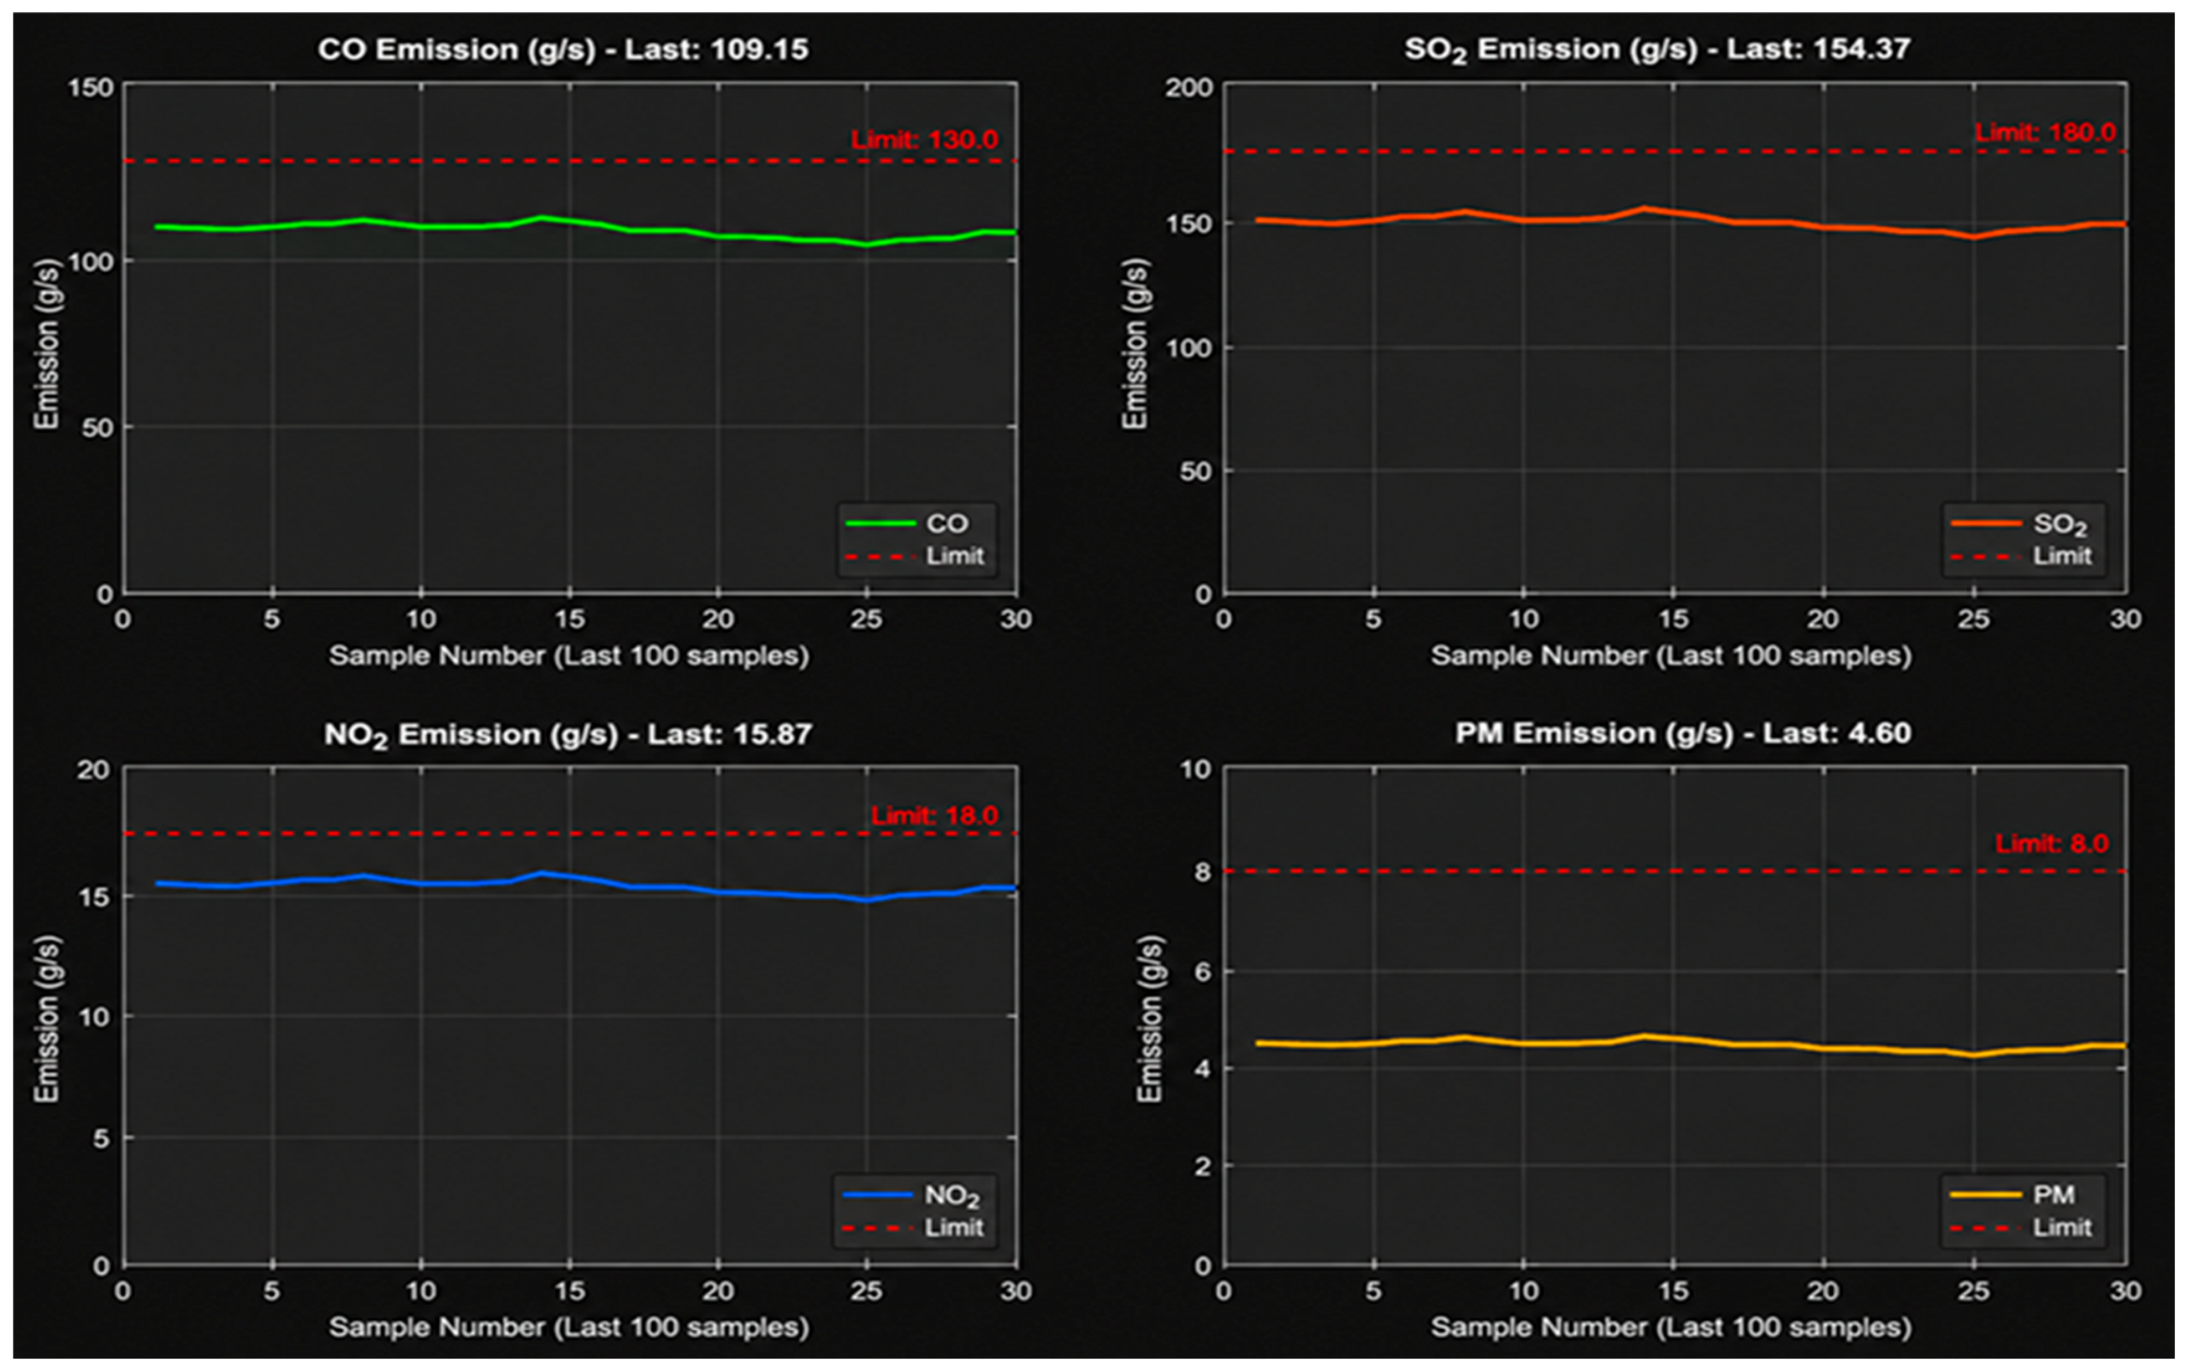
The trend visualization interface (Figure 8) further supports operational assessment by displaying the temporal evolution of estimated emissions. Continuous trend analysis assists operators in recognizing progressive changes that may not be evident from instantaneous measurements alone, thereby providing additional information for routine operational assessment.
Figure 8.
Real-time emission trend visualization at the edge layer.
From a computational perspective, the proposed edge implementation completed all processing tasks within the one-second acquisition interval. Each execution cycle included OPC UA data acquisition, physics-based emission estimation, AI-based anomaly detection, and dashboard updating, with an average execution latency of approximately 275 ms. Consequently, the analytical workload occupied less than one-third of the available sampling period, leaving sufficient computational margin for continuous operation. CPU utilization remained below 14% during normal operation and did not exceed 23% under peak workload, indicating stable computational resource utilization throughout the evaluation.
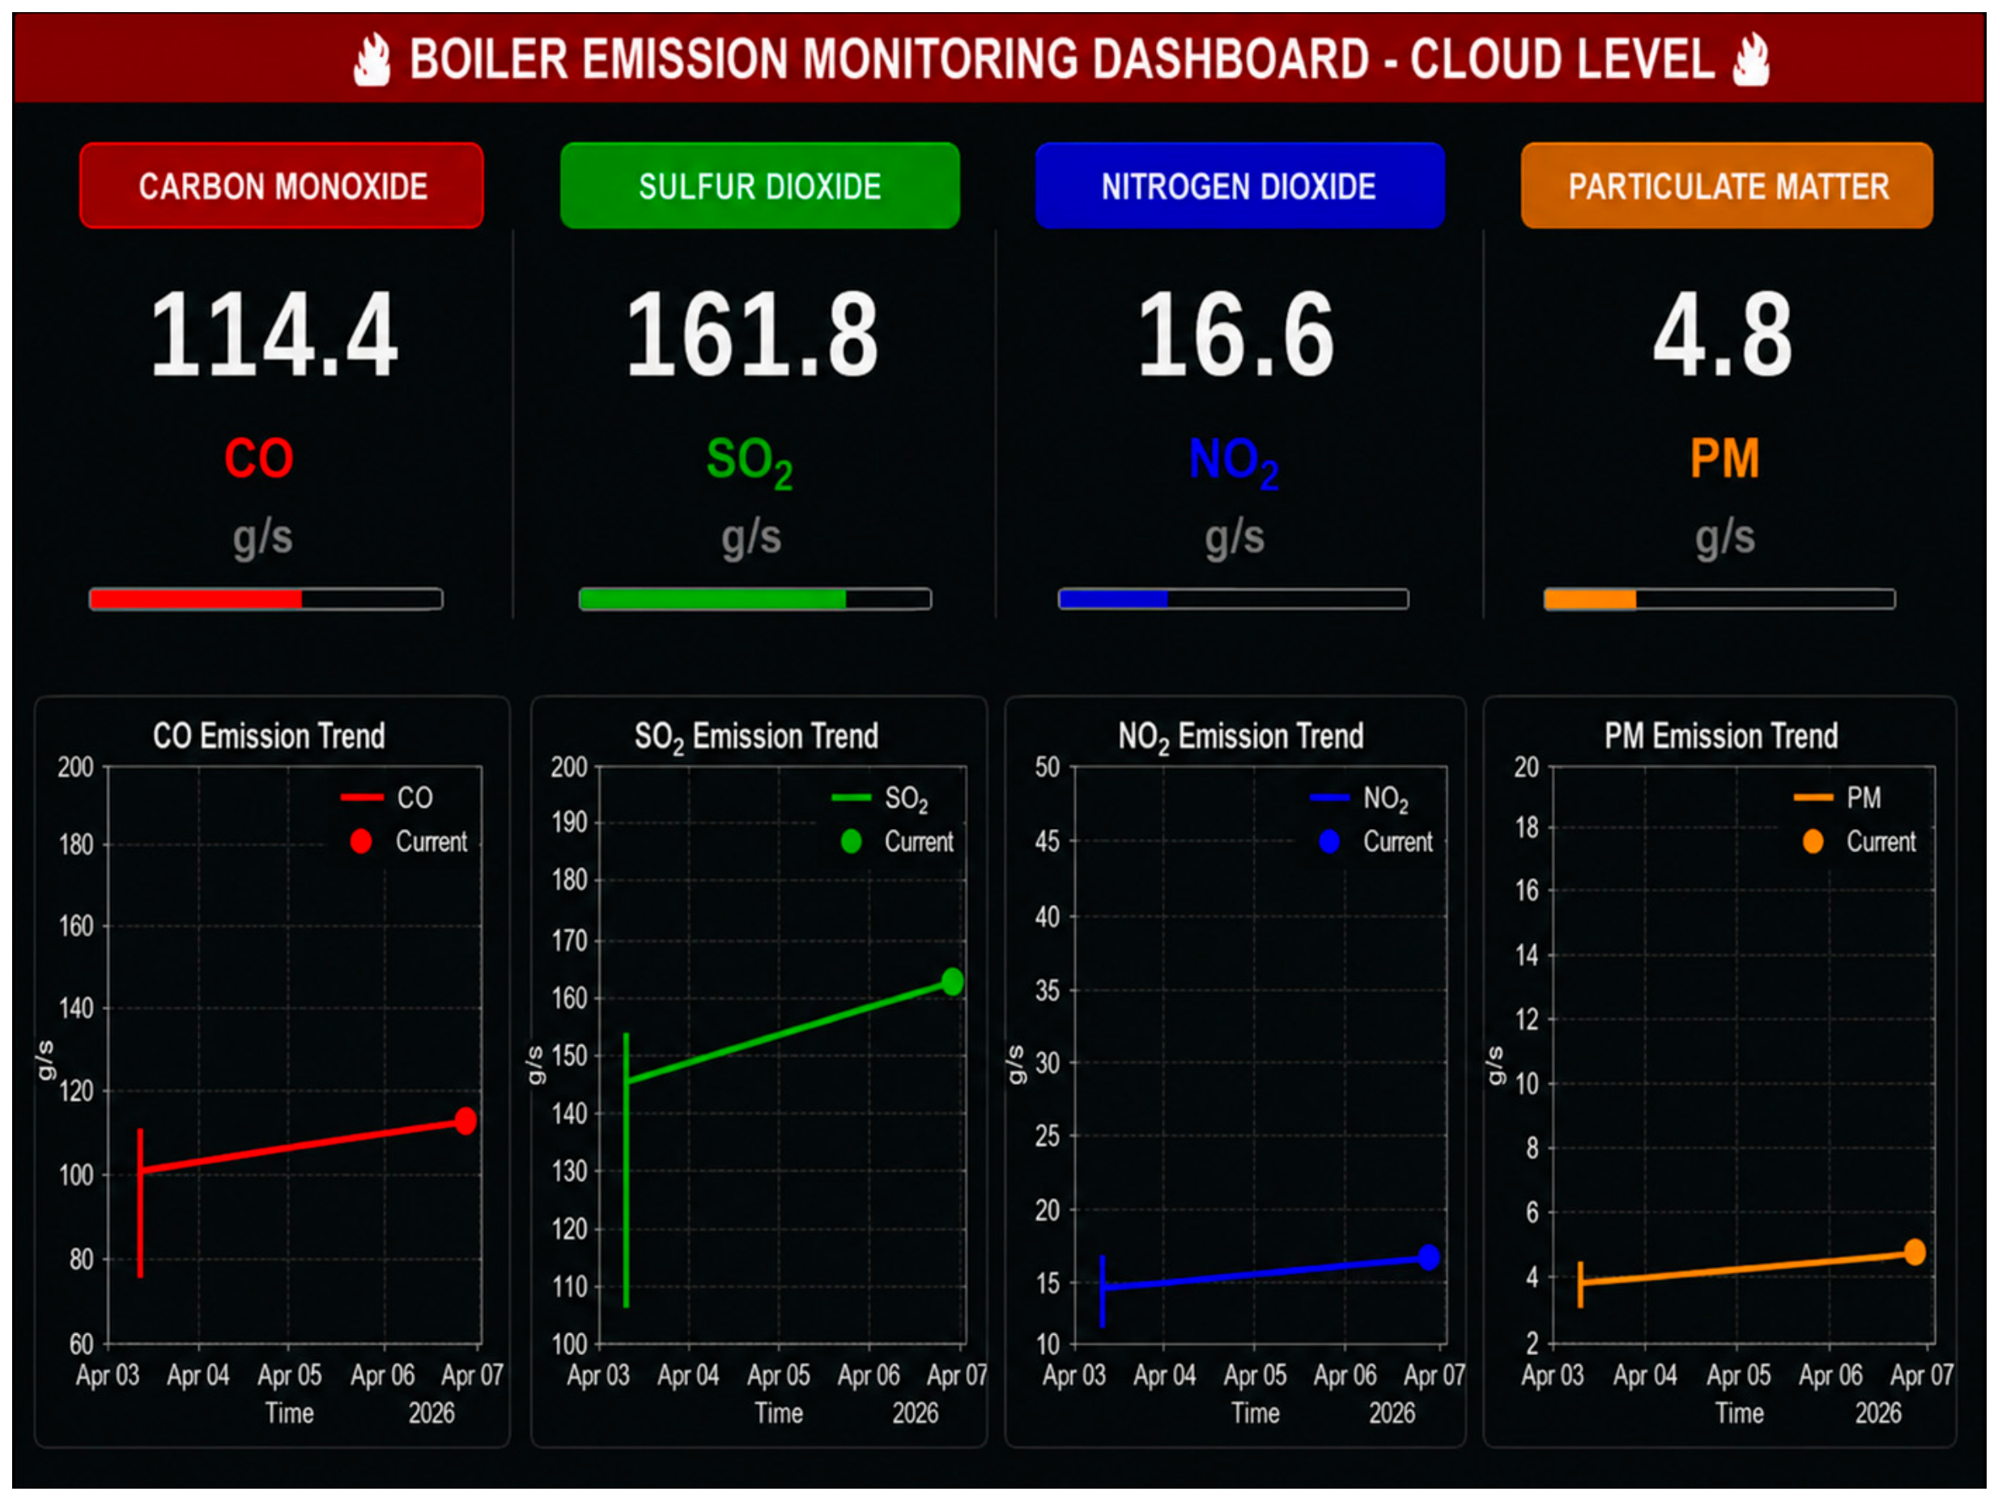
The proposed architecture is further extended through the cloud layer to support remote supervision and long-term data management. Selected process variables and estimated emissions are transmitted from the edge layer to the cloud every 60 s, separating latency-sensitive edge analytics from supervisory monitoring functions. This architecture preserves real-time edge operation while reducing unnecessary communication overhead.
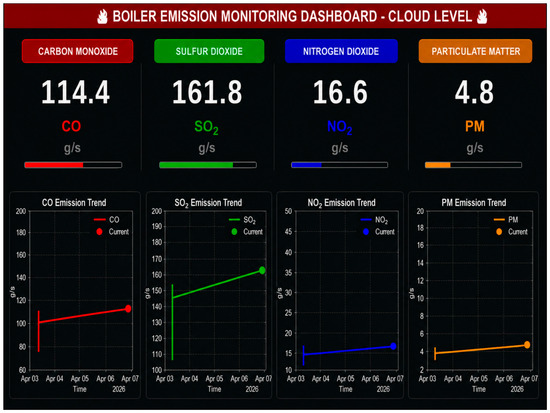
The cloud dashboard (Figure 9) provides centralized visualization of process conditions and emission trends that can be accessed remotely by multiple authorized users. In addition to supporting distributed operational supervision, the cloud repository stores historical process and emission records that can be used for long-term performance assessment, trend analysis, and future data-driven applications. Consequently, the cloud layer complements the edge analytics system by extending monitoring capabilities beyond the plant environment without compromising local operational responsiveness.
Figure 9.
Cloud-based remote monitoring dashboard.
4.4. Overall Discussion
The experimental results indicate that the proposed OT–IT framework enables continuous emission estimation and AI-based anomaly detection using existing industrial process measurements without modifying the primary control infrastructure. By integrating physics-based emission estimation, AI-based anomaly detection, and standardized industrial communication within a unified architecture, the framework extends conventional industrial monitoring beyond process supervision to include continuous environmental assessment.
Unlike conventional approaches that typically evaluate emission estimation models or AI algorithms independently using offline datasets, the proposed work emphasizes deployment-oriented integration. The contribution of this study is not the development of a new combustion model or anomaly detection algorithm, but the practical integration of established engineering models, AI-based monitoring, OPC UA interoperability, and edge–cloud computing into a unified OT–IT framework suitable for legacy industrial environments.
From a practical perspective, the proposed architecture provides a feasible pathway for gradually digitalizing brownfield refinery facilities. Existing PLC and SCADA systems remain unchanged, while additional monitoring capabilities are introduced through non-intrusive OT–IT integration. This deployment strategy allows environmental monitoring and intelligent supervisory functions to be incorporated without interrupting normal plant operation or requiring dedicated emission monitoring infrastructure.
The current validation represents a deployment-oriented evaluation performed using one year of historical industrial data replayed through a Hardware-in-the-Loop platform together with synthetically generated anomaly scenarios. Although this methodology provides a realistic environment for assessing the integrated framework under controlled conditions, additional validation using multiple industrial boilers, direct stack-emission measurements, and documented industrial fault events is required before large-scale industrial deployment.
5. Conclusions
This study presented a deployment-oriented hybrid physics–AI framework for industrial boiler emission monitoring within an IIoT-enabled OT–IT architecture. The proposed framework integrates physics-based emission estimation, AI-based anomaly detection, standardized OPC UA communication, and edge–cloud computing into a unified monitoring platform. Validation was performed using a PLC-based Hardware-in-the-Loop implementation driven by one year of industrial operating data.
The principal findings of this work are summarized as follows.
Key Findings
- The proposed framework transforms conventional offline emission estimation into a continuous industrial monitoring service using existing process measurements.
- The physics-based emission estimation model preserves the analytical behavior of the adopted combustion formulation, with relative differences generally below 0.1% compared with independent engineering reference calculations.
- The AI-based anomaly detection model achieved an F1-score of 96.14%, an accuracy of 94.08%, a precision of 98.07%, and an AUC of 0.981, demonstrating reliable identification of abnormal operating patterns under the evaluated scenarios.
- The Hardware-in-the-Loop implementation confirmed that emission estimation, anomaly detection, and operator visualization can be executed simultaneously within a unified monitoring workflow.
Computational Performance
- All processing tasks, including OPC UA communication, emission estimation, anomaly detection, and visualization, were completed within the one-second acquisition interval, with an average execution latency of approximately 275 ms.
- CPU utilization remained below 14% during normal operation and below 23% under peak workload, indicating that the proposed implementation satisfies the computational requirements of the evaluated industrial application.
Overall Contributions
The principal contributions of this work are summarized as follows.
- Development of a unified OT–IT framework integrating physics-based emission estimation, AI-based anomaly detection, OPC UA communication, and edge/cloud monitoring.
- Implementation of an OPC UA-based interoperability layer enabling continuous information exchange between industrial automation systems and higher-level monitoring services.
- Development of an edge-based monitoring platform capable of performing continuous emission estimation, anomaly detection, visualization, and alarm generation.
- Integration of cloud connectivity supporting remote monitoring, historical data storage, and future analytical services.
- Validation of the proposed framework using a PLC-based Hardware-in-the-Loop deployment strategy driven by one year of industrial boiler operating data.
Limitations and Future Work
The present study has several limitations. The emission estimation model was verified against independent engineering reference calculations rather than direct stack-emission measurements. In addition, the anomaly detection model was evaluated using synthetically generated anomaly scenarios because documented industrial fault records were unavailable during this study. Furthermore, the deployment-oriented validation was performed on a single industrial boiler using historical data replay within a Hardware-in-the-Loop environment.
Future work will focus on validating the proposed framework using Continuous Emission Monitoring System (CEMS) measurements, portable gas analyzers, and field calibration datasets. Additional studies involving multiple industrial boilers and documented industrial fault events will also be conducted to further assess the generalization capability of the proposed framework under diverse operating conditions.
Author Contributions
Conceptualization, A.S.H.; Methodology, S.A.-Z.; Software, A.S.H.; Validation, R.M.S.; Formal analysis, A.S.H. and R.M.S.; Investigation, A.S.H.; Data curation, A.S.H.; Writing—original draft, A.S.H.; Writing—review & editing, S.A.-Z.; Visualization, S.A.-Z.; Supervision, M.F.M. and S.A.-Z.; Project administration, M.F.M. All authors have read and agreed to the published version of the manuscript.
Funding
This research received no external funding.
Data Availability Statement
No new data were created or analyzed in this study.
Conflicts of Interest
Author Abdullah S. Hamoud and Ramiz M. Shubbar were employed by the Midland Refineries Company. The remaining authors declare that the research was conducted in the absence of any commercial or financial relationships that could be construed as a potential conflict of interest.
References
- Abdulkareem, M.A.; Udom, P.O.; Jimoh, M.T. Energy Analysis of Industrial Boilers: A Case Study of the Coca-Cola Challawa Plant in Kano, Nigeria. Kwaghe Int. J. Sci. Technol. 2024, 1, 685–707. [Google Scholar] [CrossRef] [Scilit]
- Delkash, M. Air Emissions from Combustion and Incineration Processes: Insights into Air Quality and US EPA Regulations. Water Air Soil Pollut. 2025, 237, 104. [Google Scholar] [CrossRef] [Scilit]
- Srivastava, R.P.; Kumar, S.; Tiwari, A. Continuous emission monitoring systems (CEMS) in India: Performance evaluation, policy gaps and financial implications for effective air pollution control. J. Environ. Manag. 2024, 359, 120584. [Google Scholar] [CrossRef] [Scilit] [PubMed]
- Office of United States Environmental Protection Agency. AP-42: Compilation of Air Emissions Factors from Stationary Sources. Available online: https://www.epa.gov/air-emissions-factors-and-quantification/ap-42-compilation-air-emissions-factors-stationary-sources (accessed on 30 March 2026).
- Office of United States Environmental Protection Agency. Emissions Estimation Protocol for Petroleum Refineries. Available online: https://19january2017snapshot.epa.gov/air-emissions-factors-and-quantification/emissions-estimation-protocol-petroleum-refineries (accessed on 30 March 2026).
- Abdul-Wahab, S.; Al-Alawi, S.; El-Zawahry, A. Patterns of SO2 emissions: A refinery case study. Environ. Model. Softw. 2002, 17, 563–570. [Google Scholar] [CrossRef] [Scilit]
- Abdul-Wahab, S.; Azzi, M.; Johnson, G.; Bouhamra, W.; Ettouney, H.; Sowerby, B.; Crittenden, B. Using the Integrated Empirical Rate-Reactive Plume Model in Assessment of the Potential Effects of Shuaiba Industrial Area NOx Plumes on Photochemical Smog Concentrations. Process Saf. Environ. Prot. 2003, 81, 363–374. [Google Scholar] [CrossRef] [Scilit]
- Gzar, H.A.; Kseer, K.M. Pollutants Emission and Dispersion from Flares: A Gaussian Case—Study in IRAQ. J. Al-Nahrain Univ. 2009, 12, 38–57. [Google Scholar] [CrossRef] [Scilit]
- Shubbar, R.M.; Lee, D.I.; Gzar, H.A.; Rood, A.S. Modeling Air Dispersion of Pollutants Emitted from the Daura Oil Refinery, Baghdad- Iraq using the CALPUFF Modeling System. J. Environ. Inform. Lett. 2019, 2, 28–39. [Google Scholar] [CrossRef] [Scilit]
- Chien, T.; Chu, H.; Hsu, W.; Tseng, T.; Hsu, C.; Chen, K. A Feasibility Study on the Predictive Emission Monitoring System Applied to the Hsinta Power Plant of Taiwan Power Company. J. Air Waste Manag. Assoc. 2003, 53, 1022–1028. [Google Scholar] [CrossRef] [Scilit] [PubMed]
- Hunde, J.M.; Ochono, T.S.; Senevirathne, D.; Eneyew, D.D.; Bitsuamlak, G.T.; Capretz, M.A.; Grolinger, K. Data-driven and physics-based modeling approaches and their integration in building digital twins: A systematic review. J. Build. Eng. 2025, 114, 114214. [Google Scholar] [CrossRef] [Scilit]
- Wang, F.; Pang, Y.; Bai, L.; Godin, M. Researching the landscape of predictive emissions monitoring system: A review of literature and technology trends. Environ. Syst. Res. 2025, 14, 11. [Google Scholar] [CrossRef] [Scilit]
- Audu, A.J.; Umana, A.U. Advances in environmental compliance monitoring in the oil and gas industry: Challenges and opportunities. Int. J. Sci. Res. Updates 2024, 8, 48–59. [Google Scholar] [CrossRef] [Scilit]
- Al Nuaimi, H.S.; Acquaye, A.; Mayyas, A. Machine learning applications for carbon emission estimation. Resour. Conserv. Recycl. Adv. 2025, 27, 200263. [Google Scholar] [CrossRef] [Scilit]
- Zuo, Z.; Niu, Y.; Li, J.; Fu, H.; Zhou, M. Machine Learning for Advanced Emission Monitoring and Reduction Strategies in Fossil Fuel Power Plants. Appl. Sci. 2024, 14, 8442. [Google Scholar] [CrossRef] [Scilit]
- Ojadi, J.O.; Onukwulu, E.C.; Odionu, C.S.; Owulade, O.A. AI-Driven Predictive Analytics for Carbon Emission Reduction in Industrial Manufacturing: A Machine Learning Approach to Sustainable Production. Int. J. Multidiscip. Res. Growth Eval. 2023, 4, 948–960. [Google Scholar] [CrossRef] [Scilit]
- Egbuna, I.K.; Agboro, H.; Nwachukwu, O.O.; George, F.E.; Asere, J.B.; Ogunkanmi, S.A. Artificial Intelligence for predictive analysis, efficiency improvement and reduction in carbon footprint during decommissioning and site remediation in oil and gas fields. World J. Adv. Res. Rev. 2025, 26, 3394–3405. [Google Scholar] [CrossRef] [Scilit]
- Balać, N.; Mileusnić, Z.; Dragičević, A.; Milanović, M.; Rajković, A.; Miodragović, R.; Ećim-Đurić, O. Implementation of XGBoost Models for Predicting CO2 Emission and Specific Tractor Fuel Consumption. Agriculture 2025, 15, 1209. [Google Scholar] [CrossRef] [Scilit]
- Freitas, L.; Silva, M.; Vale, G.; Avram, C.; Lopes, H.; Pereira, F.; Leal, N.; Machado, J. OPC UA and MQTT performance analysis within a unified namespace context. Internet Things 2025, 33, 101734. [Google Scholar] [CrossRef] [Scilit]
- Lee, C.; Kim, N.; Hong, S. Toward Industrial IoT: Integrated Architecture of an OPC UA Synergy Platform. IEEE Access 2021, 9, 164720–164731. [Google Scholar] [CrossRef] [Scilit]
- Ioana, A.; Korodi, A. DDS and OPC UA Protocol Coexistence Solution in Real-Time and Industry 4.0 Context Using Non-Ideal Infrastructure. Sensors 2021, 21, 7760. [Google Scholar] [CrossRef] [Scilit] [PubMed]
- Velesaca, H.O.; Holgado-Terriza, J.A.; Gutierrez-Guerrero, J.M. Industrial Process Automation Through Machine Learning and OPC-UA: A Systematic Literature Review. Electronics 2025, 14, 3749. [Google Scholar] [CrossRef] [Scilit]
- Busboom, A. Automated generation of OPC UA information models—A review and outlook. J. Ind. Inf. Integr. 2024, 39, 100602. [Google Scholar] [CrossRef] [Scilit]
- Shubbar, R. Thesis for the Degree of Doctor of Philosophy Numerical Simulation of Air Pollutants Using CALPUFF Model at an Urban Area in Baghdad-Iraq Numerical Simulation of Air Pollutants Using CALPUFF Model at an Urban Area in Baghdad-Iraq Advisor: Prof. Dong-In LEE. 2017. Available online: https://www.researchgate.net/publication/330812032_Thesis_for_the_Degree_of_Doctor_of_Philosophy_Numerical_Simulation_of_air_pollutants_using_CALPUFF_model_at_an_urban_area_in_Baghdad-Iraq_Numerical_Simulation_of_air_pollutants_using_CALPUFF_model_at_?channel=doi&linkId=5c54c1c8a6fdccd6b5da6fe5&showFulltext=true (accessed on 24 February 2017).

Disclaimer/Publisher’s Note: The statements, opinions and data contained in all publications are solely those of the individual author(s) and contributor(s) and not of MDPI and/or the editor(s). MDPI and/or the editor(s) disclaim responsibility for any injury to people or property resulting from any ideas, methods, instructions or products referred to in the content. |
© 2026 by the authors. Licensee MDPI, Basel, Switzerland. This article is an open access article distributed under the terms and conditions of the Creative Commons Attribution (CC BY) license.