


Abstract
Engineer-to-Order (ETO) manufacturing environments are characterized by high product variety, low repetitiveness, and unstable demand, which pose significant challenges to the application of Lean Manufacturing (LM). This study investigates the application and adaptation of LM principles and tools in an ETO production line using an action research approach integrated with Value Stream Mapping (VSM). The research was conducted at a manufacturer of highly customized electrical equipment. An adapted method for calculating representative cycle times based on weighted production volumes was developed to support line sizing and workload balancing. The proposed future-state design incorporates multifunctional operators, FIFO lanes, daily scheduling, and pitch-based control. The results show a 9.5% reduction in labor requirements, a 61.7% decrease in manufacturing lead time, and a 75.0% reduction in overtime hours. Statistical validation using daily PPC records confirmed significant improvements in actual output, schedule adherence, overtime, and lead time after implementation. In addition to operational improvements, this study offers methodological contributions by proposing practical adaptations of LM tools suitable for high-variability ETO environments, thereby contributing to both theory and industrial practice.
1. Introduction
This paper reports on the application of Lean Manufacturing (LM) in a company operating under the Engineer-to-Order (ETO) production typology, which manufactures electrical equipment according to customer-specific technical specifications. The production system under study is characterized by high variability in both products and engineering designs, resulting in a complex and dynamic manufacturing environment.
ETO production is defined by the exclusive selection or development of products and projects based on the technical requirements of each customer [1,2]. In such systems, the entire supply cycle, including engineering design, process planning, and raw material procurement, typically begins only after a customer order is received [3,4]. Therefore, ETO environments exhibit low product repetitiveness, unstable demand patterns, and strong interdependence between engineering and manufacturing activities.
LM, originating from the Toyota Production System (TPS), aims to improve operational efficiency by systematically eliminating non-value-adding activities. The TPS philosophy seeks to deliver high-quality products at low cost and with minimal lead time by reducing waste across all stages of production [5]. Over the past decades, LM has become one of the most widely adopted production paradigms worldwide, supporting organizations in enhancing productivity, quality, and competitiveness [6,7,8].
Despite its widespread adoption, the implementation of LM in ETO environments remains particularly challenging, especially in companies producing highly customized industrial products. Demand uncertainty caused by fluctuating order volumes, combined with a high diversity of products and engineering projects, limits the direct applicability of traditional Lean practices [9]. Under such conditions, production stages often become unbalanced, with some resources operating as bottlenecks while others remain underutilized. These imbalances are further exacerbated by the fact that heterogeneous products share common manufacturing resources, despite exhibiting significant variation in processing times.
One of the most critical difficulties in ETO systems lies in defining representative and reliable cycle times for production planning and control. A single product family may encompass hundreds of engineering variants, each with distinct processing requirements, resulting in substantial variability across manufacturing stages. Moreover, new products and projects can be introduced at any time in response to specific customer demands, often without historical data on processing times. These characteristics complicate capacity planning, hinder workload leveling, and undermine the stability of production flow.
As a result, ETO manufacturers frequently experience excessive work-in-process (WIP) inventories, extended lead times, and reduced responsiveness to short delivery deadlines, ultimately affecting their competitive performance. Additionally, the lack of workload balance often leads to excessive overtime, increasing labor costs, and negatively affecting profitability [10].
In response to these challenges, this study addresses a critical gap in the manufacturing literature by exploring how LM principles and tools can be effectively adapted to ETO environments. The research adopts an action research methodology, enabling close collaboration between the researcher and the industrial organization while simultaneously supporting practical problem-solving and theory development [11,12,13].
Accordingly, the main objective of this paper is to apply and analyze LM principles and tools within an ETO production environment, aiming to improve key production performance indicators. Beyond the empirical application, this study seeks to advance the existing body of knowledge on LM by proposing and validating theoretical adaptations of core Lean concepts to contexts characterized by high product variety, low repetitiveness, and demand instability. Specifically, the paper contributes to LM theory by reinterpreting traditional assumptions related to takt time, cycle-time representation, and production flow control, demonstrating how these concepts can be operationalized through weighted performance metrics, pitch-based control mechanisms, and flexible workforce configurations in ETO systems.
This study addresses the lack of operational methods for applying LM in ETO environments where product families include multiple project variants with highly variable cycle times. The main contribution is an adapted VSM-based action research approach that combines weighted cycle-time calculation, workload balancing, multifunctional operators, FIFO-controlled flow, and pitch-based daily production control.
2. Lean Manufacturing in Engineer-to-Order Environments
Lean Manufacturing (LM) is widely recognized as a managerial and operational philosophy aimed at systematically eliminating waste, improving flow, reducing lead time, and creating value from the customer’s perspective [5,7]. Although Lean principles have been extensively applied in repetitive and high-volume production systems, their direct implementation in Engineer-to-Order (ETO) environments remains challenging. ETO systems are typically characterized by high product variety, low repetitiveness, customer-specific engineering, unstable demand, and strong interaction among engineering, planning, purchasing, and manufacturing activities [1,2,3]. These characteristics create a production context in which traditional Lean assumptions, such as stable takt time, repetitive work cycles, standard product families, and predictable pull loops, are not always directly applicable.
The literature increasingly recognizes that ETO companies require specific Lean adaptations rather than the direct transfer of tools originally developed for repetitive production systems. Lean implementation must be analyzed according to the characteristics of the production system, since its effectiveness depends on the degree of product variety, demand stability, process repetitiveness, and flow predictability [14]. In ETO supply chains, customer requirements permeate engineering, procurement, and manufacturing processes, making them substantially different from make-to-stock and make-to-order systems [15]. As a result, recent research on ETO has evolved toward themes such as coordination, customization, project-based production, and cross-functional integration, reinforcing the need for context-specific Lean implementation approaches [16].
Studies on high-variety, low-volume production indicate that Lean implementation in such environments is constrained by product heterogeneity, demand instability, and the difficulty of establishing stable manufacturing flow. In these systems, operational turbulence emerges from changes in product mix, production volume, engineering requirements, and delivery priorities [17]. Therefore, traditional product-family logic may need to be complemented, or even replaced, by process-family logic, enabling hybrid cellular layouts that preserve flexibility while improving material flow [18]. In addition, order release and workload control become critical because the uncontrolled release of jobs increases work-in-process (WIP), waiting time, and manufacturing lead time [19].
A relevant stream of research has therefore focused on adapting production planning and control mechanisms to ETO and non-repetitive manufacturing. Controlled order review and release systems have been proposed to improve flow stability by balancing workload and limiting the number of jobs released to the shop floor [20]. Other approaches combine Lean Manufacturing with the Theory of Constraints, recommending hybrid control mechanisms such as CONWIP and Drum-Buffer-Rope to regulate production flow in capital goods industries operating under order-based conditions [21]. These contributions indicate that pull control in ETO systems must be more flexible, capacity-oriented, and responsive to workload variability than in repetitive production systems.
Another important research stream concerns the adaptation of Value Stream Mapping (VSM). Although VSM is a central Lean tool for visualizing material and information flows, its traditional application assumes relatively stable product families, linear process routes, and recurrent production patterns. In ETO environments, these assumptions are limited because value streams frequently include engineering, procurement, planning, and other administrative activities that strongly influence total manufacturing lead time [22]. Specific VSM adaptations for ETO production systems include the identification of critical value streams, customer order decoupling points, average takt time, FIFO lanes, pull-control mechanisms, and pacemaker processes. These adaptations show that classical VSM logic can be extended to high-mix and complex ETO contexts when variability, shared resources, and non-standard routings are explicitly considered [23].
The use of improved VSM combined with simulation and Design of Experiments (DOE) has also been proposed to support Lean system design in ETO manufacturing. This type of approach combines current-state analysis, pull-system design, simulation of future scenarios, DOE-based factor analysis, and sensitivity analysis [24]. Such contributions are important because ETO systems are frequently stochastic and non-linear, requiring analytical support beyond static mapping. Complementary studies also show that VSM can support cycle-time reduction in complex production environments when simplifications and approximations are properly applied. In these cases, Gemba Walks, systematic questioning, and optimization methods strengthen the diagnosis and redesign of highly customized production systems [25].
Several studies emphasize that Lean implementation in ETO environments also depends on organizational, informational, and human factors. Dynamism and complexity influence Lean implementation strategies because they affect demand behavior, engineering changes, production priorities, and resource allocation. Complexity should not be understood only as a barrier; it can also motivate Lean adoption when organizations develop standardization, visual management, supplier coordination, and flexible capacity [26]. Sustaining performance under operational turbulence requires not only Lean tools but also a continuous-improvement mindset, multifunctional shop-floor teams, visual control, and integration between transactional and manufacturing processes [27]. These findings indicate that workforce flexibility and organizational learning are essential to sustain Lean improvements in ETO environments.
In the same direction, Lean management techniques have been applied to support ETO design and production planning, demonstrating the relevance of daily management, visual control, and planning based on project complexity [28]. Kanban has also been explored in high-mix, low-volume, and ETO-related contexts, showing that visual Kanban boards, WIP limits, and daily stand-up meetings can be used to control work even when demand is discontinuous [29]. Furthermore, the Lean and Learn perspective indicates that Lean practices can enhance supply chain capabilities in ETO environments when combined with organizational learning and supplier collaboration [30]. These studies reinforce that Lean implementation in ETO should be understood as a socio-technical transformation involving people, routines, information flow, and supplier-customer integration.
More recent research has also addressed Lean maturity, waste identification, and digital support in ETO implementation. Lean maturity assessment models specifically developed for ETO scenarios indicate that maturity evaluation can support the prioritization of Lean implementation efforts and help identify organizational gaps before large-scale transformation initiatives are launched [30]. Waste reduction in ETO projects must also extend beyond the shop floor, including engineering design, project management, information flow, and interdepartmental coordination [1]. In addition, the integration between Lean practices and Industry 4.0 technologies has been highlighted as a promising way to mitigate losses in ETO manufacturing, particularly by improving transparency, traceability, real-time coordination, and decision-making across the value stream [31]. These contributions show that Lean implementation in ETO increasingly requires systemic integration across the entire value stream rather than isolated shop-floor improvements.
Table 1 summarizes the main literature streams and their relevance to Lean adaptation in ETO environments.
Table 1.
Main literature contributions to Lean Manufacturing adaptation in ETO environments.
Despite these contributions, important gaps remain in the literature. First, many studies provide conceptual recommendations or isolated tool adaptations, but fewer studies demonstrate how these adaptations can be operationalized in a real ETO manufacturing line through an integrated intervention. Second, the problem of defining representative cycle times in environments with many engineering variants remains insufficiently explored, although it is central to capacity planning, line sizing, and workload balancing. Third, while takt time is widely discussed in Lean literature, its direct use as a shop-floor control mechanism is limited in ETO environments due to variable product complexity, non-repetitive work content, and unstable demand. This creates the need for alternative control mechanisms, such as pitch-based daily control, which can translate customer demand into a manageable production rhythm without assuming repetitive unit-by-unit flow.
Therefore, this study builds on and extends previous research by proposing and applying an adapted Lean implementation approach for ETO manufacturing. Its contribution lies in integrating VSM and action research with weighted cycle-time calculation, workload balancing, multifunctional operators, FIFO lanes, controlled WIP, daily scheduling, and pitch-based control. Unlike studies that focus on a single tool, a specific production-control mechanism, or a conceptual framework, this research demonstrates how multiple Lean adaptations can be combined in a real high-variety and unstable-demand ETO production environment to reduce labor requirements, manufacturing lead time, and overtime. In doing so, the study contributes to Lean theory by clarifying how traditional Lean concepts can be reinterpreted and operationalized under the specific constraints of ETO manufacturing.
3. Research Methodology
The action research method is a collaborative approach to problem-solving and knowledge generation involving both the researcher and the client organization. It emphasizes practical engagement and shared learning to drive organizational change [11].
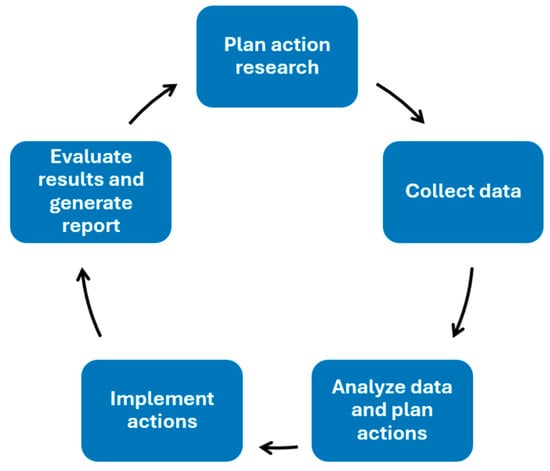
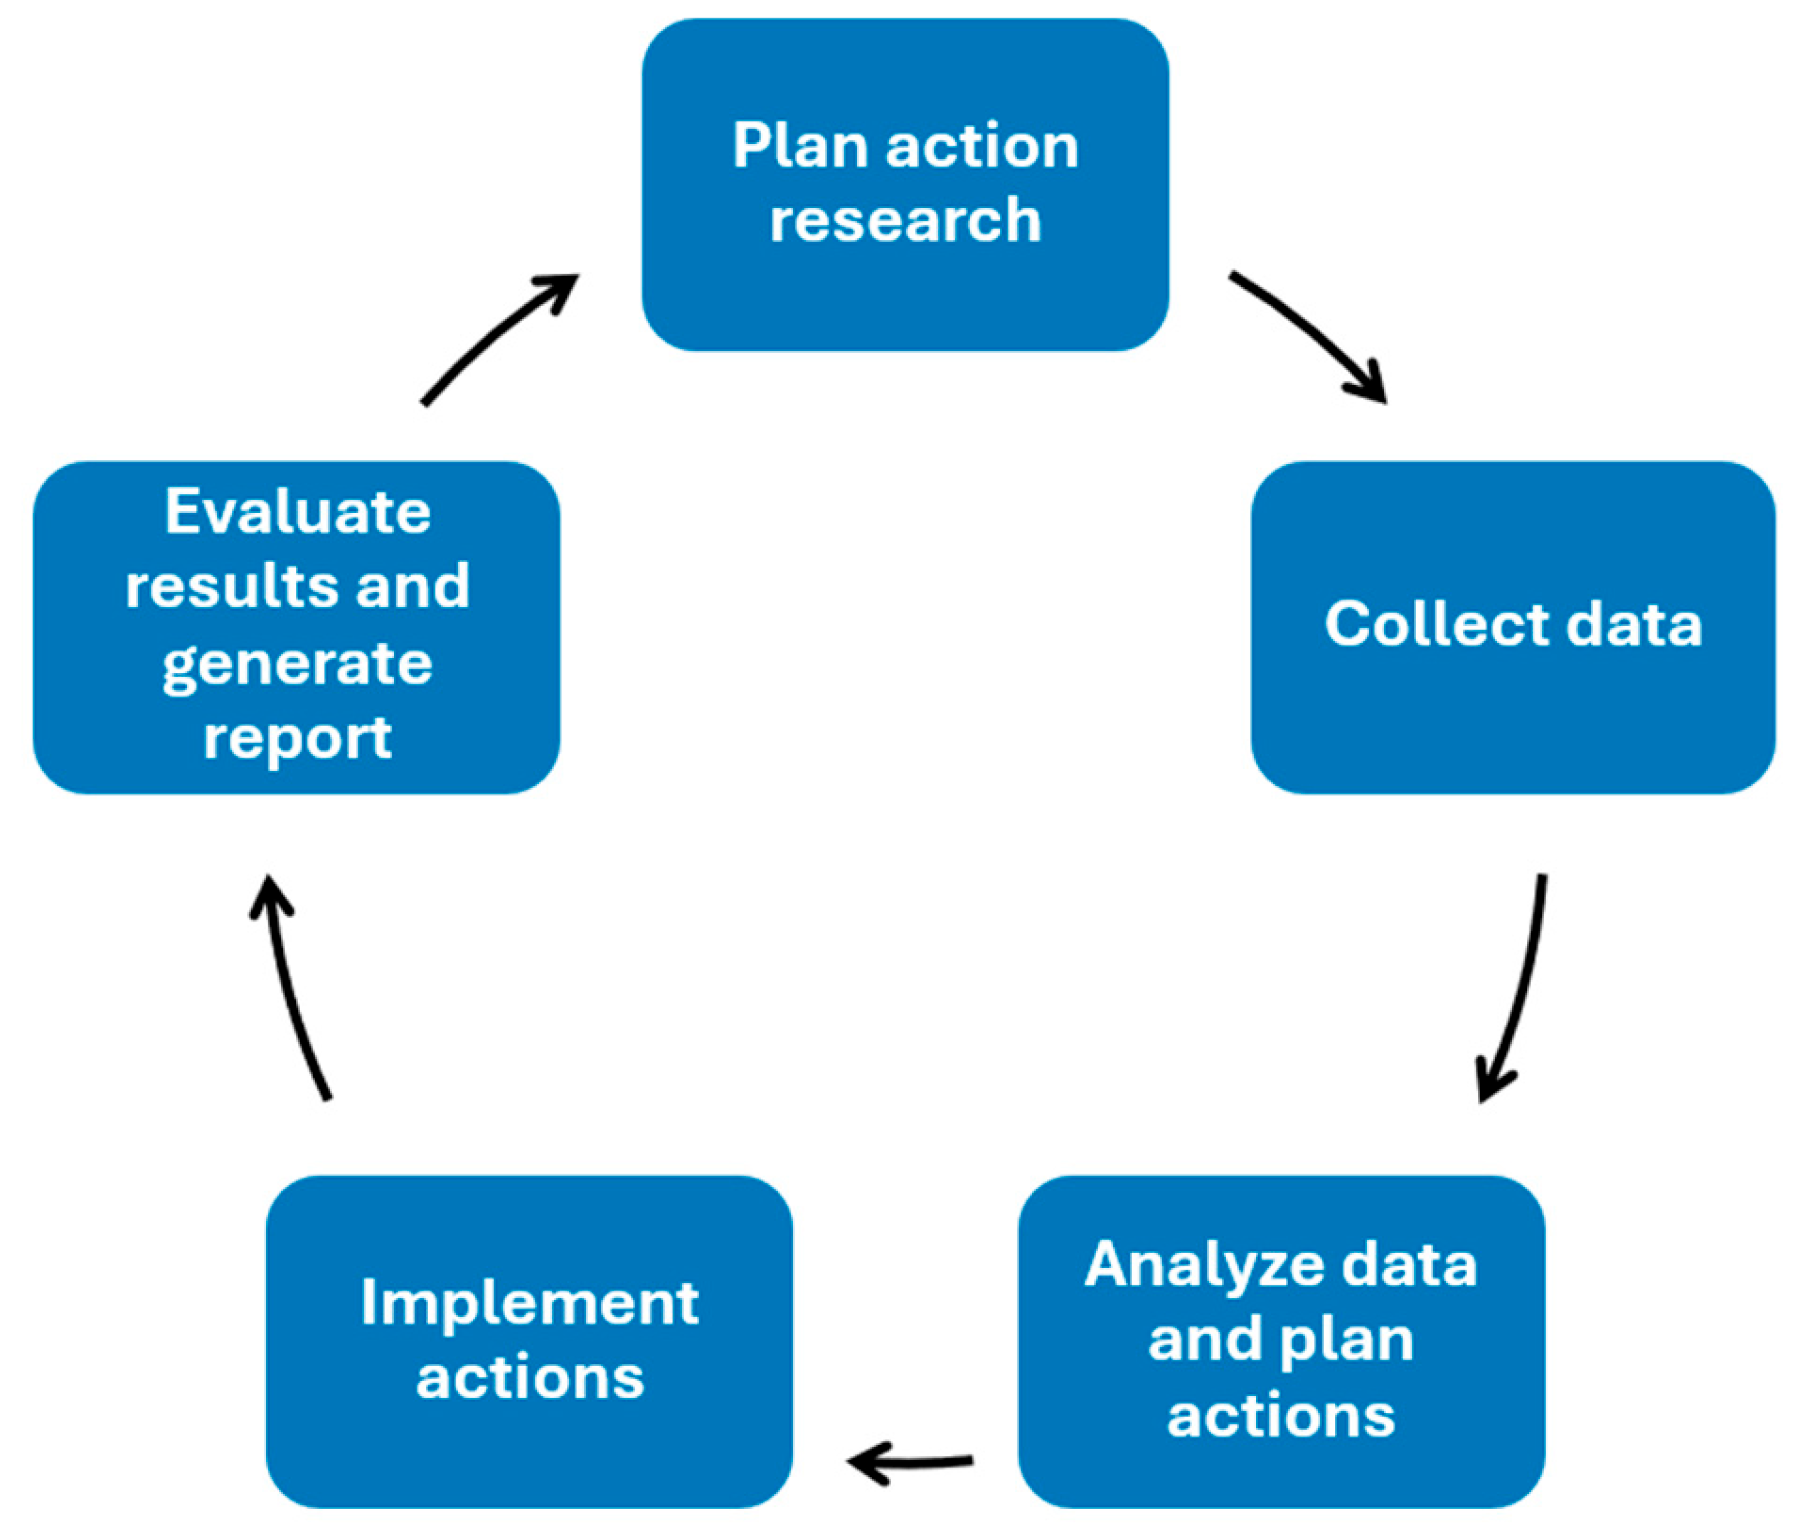
Action research unfolds in a cyclical process composed of five stages. Figure 1 illustrates the stages of the action research cycle.
Figure 1.
The action research cycle.
This cycle, adapted from the PDCA (Plan–Do–Check–Act) framework, promotes learning and change through iterative actions and analyses. It is applied continuously until the research objectives are achieved [32].
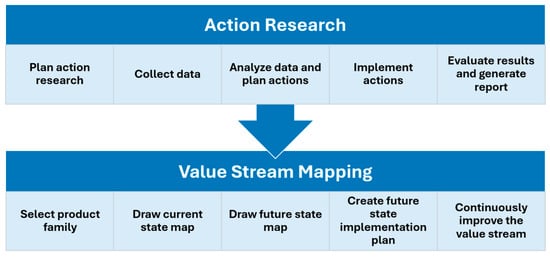
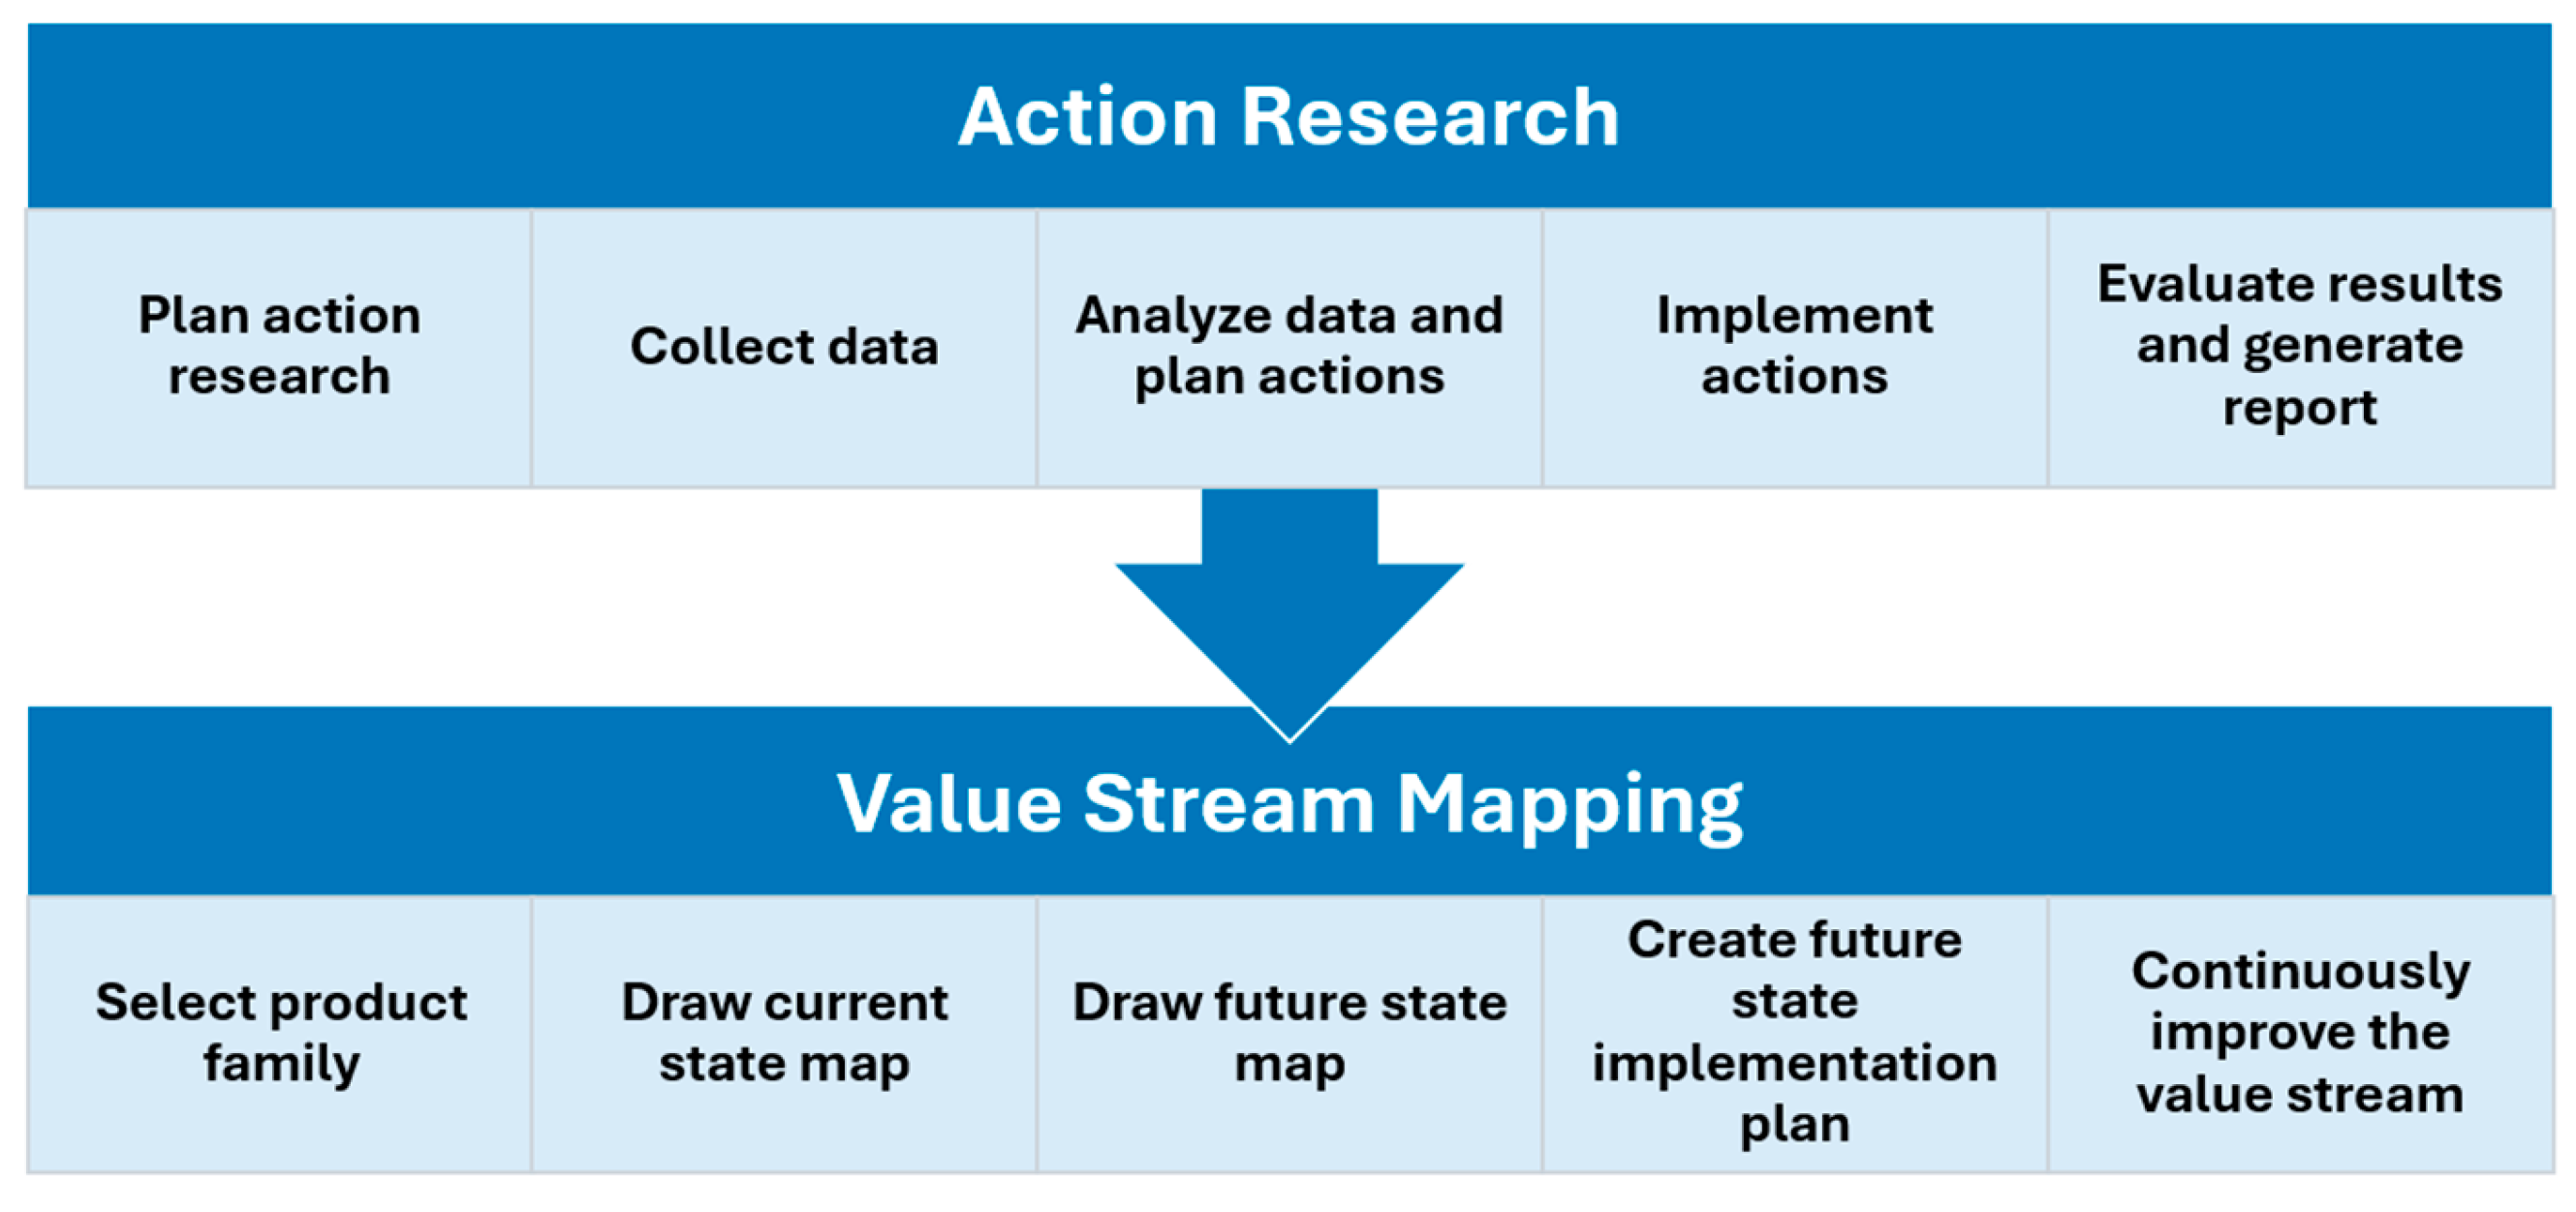
This study integrates the stages of Value Stream Mapping [33] into each phase of the action research methodology. Figure 2 presents the conceptual alignment developed for this purpose.
Figure 2.
Integration of the VSM stages into the action research phases.
The first phase of action research, planning, corresponds to the VSM stage of selecting the product family, in which a representative value stream is chosen based on products with similar characteristics and process flows.
The second phase, data collection, aligns with the development of the current-state map, which involves identifying the key manufacturing steps and gathering detailed process data, including daily demand, cycle times, machine setup times, available production time, and process reliability across the production line.
The third phase, data analysis and action planning, is equivalent to the creation of the future-state map. Based on the diagnosis of the current state, this stage envisions an improved value stream by identifying waste and proposing flow enhancements grounded in Lean principles.
The fourth phase, implementation, relates directly to the execution of the future-state implementation plan in VSM. Here, improvement actions are deployed to transition the current state into the designed future condition.
Finally, the fifth phase, evaluation and reporting, corresponds to the principle of continuous improvement. Once the future-state is implemented, results are assessed and form the basis for a new current state, feeding the next improvement cycle, consistent with the PDCA logic.
An illustrative case supporting this integrated approach demonstrates the practical effectiveness of VSM in identifying and correcting production inefficiencies [34]. The study outlines key steps such as cycle-time analysis, takt time alignment, inventory reduction, and workforce balancing. The transition from the current state to the future state is clearly documented, with measurable improvements in lead time, productivity, and inventory levels.
This structured and outcome-oriented use of VSM reinforces the methodological foundation of this study, which seeks to integrate VSM within the action research framework to diagnose, plan, implement, and evaluate Lean-based improvements in an ETO production environment.
The next section presents the application of this integrated methodology in the selected case company.
4. Application and Results
4.1. Case Context
This study was conducted at a manufacturer of instrument transformers operating under an Engineer-to-Order (ETO) production system. All stages of this research were authorized by the company and conducted in accordance with established ethical principles.
The analysis focused on a specific section of the production line, identified as PA-TP-MT, which is responsible for a key phase in the manufacturing of potential transformers.
The line comprises the following production stages (renamed for confidentiality): BS, BP, MN, COL, AF, TEST, and GRADE. Three main characteristics of this production line deserve attention:
- High variability of products and projects, resulting in significant cycle-time variations across process stages, especially due to product customization based on customer-specific technical specifications.
- Dimensional variability, with product size differing according to model specifications, influencing processing times at each stage.
- Unpredictable demand, driven by seasonal sales cycles and project-specific orders, makes it difficult to level production or distribute workloads evenly over time.
Currently, the production line handles 49 product models, which can be configured into hundreds of project variations, totaling 3496 unique combinations, according to engineering records.
The variability in cycle times across stages for different project designs makes line balancing a complex task. In this study, balancing refers to the proper allocation and distribution of labor across the production steps. In practice, depending on the project being processed, workers may face periods of both overload and idleness.
The current production planning relies on fixed standard times, which do not reflect project-level variability. This results in daily disturbances such as work overloads and excessive use of overtime.
Given these constraints, this study proposes alternative planning and scheduling approaches to reduce disruptions and enhance line performance.
4.2. Action Research Implementation
4.2.1. Planning
The production line under study focuses on building the internal components of the transformer, which are highly customizable depending on the client’s technical requirements for each model.
Upstream and downstream processes were not addressed in this study. The raw material warehouse was considered the supplier of the value stream, while the drying process was the internal customer.
4.2.2. Data Collection
The data collection phase resulted in the development of the current-state map using the Value Stream Mapping (VSM) approach. The process began with an assessment of demand.
Using historical data from the past 12 months and demand forecasts from the company’s Commercial Department, a daily demand of 40 units was established. The product mix was not considered in detail due to its variability.
Following the demand definition, each process step in the value stream was characterized. The next critical task was determining the cycle time for each stage. Given the high variety of products and projects, a tailored approach was developed to calculate representative cycle times—one of the conceptual contributions of this study.
This method may be replicated in other ETO environments and supports line sizing, which determines the number of operators needed to meet daily demand. The adapted cycle time was based on the product models representing approximately 80% of the annual production volume. For each selected model, the most frequently produced project variant was identified.
Industrial time studies were then conducted directly on the shop floor for each selected product model and its most representative project variant. The measurements were performed at each manufacturing stage under regular production conditions, following the actual sequence of operations executed by the operators. For each stage, the recorded time represented the complete operational cycle required to process one unit, including the effective processing time and, when applicable, machine setup, operator movement, internal part transportation, and rework activities incorporated into the normal production flow. This criterion was adopted because these time elements directly affect line capacity, production cost, and workload balancing in the company’s planning routine. Therefore, the purpose of the time study was not to define an ideal theoretical time, but to obtain representative operational cycle times that reflected the real behavior of the ETO production system.
Using the time-study data, the demand-weighted average cycle time for each manufacturing stage was calculated using Equations (1) and (2). First, the demand weight (ωi) of each selected product/project variant was determined based on its annual production volume:
Then, the representative cycle time of each manufacturing stage was calculated as the weighted average of the measured cycle times of the selected product/project variants:
where CTj is the demand-weighted average cycle time of manufacturing stage j, CTij is the measured cycle time of product/project variant i at stage j, Di is the annual production volume of product/project variant i, ωi is the demand weight of product/project variant i, and n is the number of selected product/project variants representing approximately 80% of the annual production volume. Table 2 presents the adapted cycle time values for each manufacturing stage. Model and project names have been anonymized.
Table 2.
Adaptation for determining the cycle time of each production stage.
Subsequently, information regarding material flow and information flow was gathered to complete the current-state map. The raw material warehouse delivers components daily to the line.
For information flow, production orders are received daily and processed by the Planning, Production, and Materials departments. These teams generate a weekly production schedule, which defines the type and quantity of work orders released to the line. Instructions are distributed in the form of job cards, which are delivered daily to the first process step by the line supervisor.
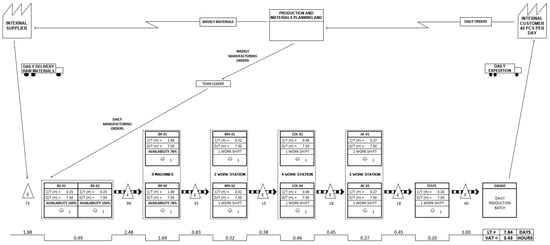
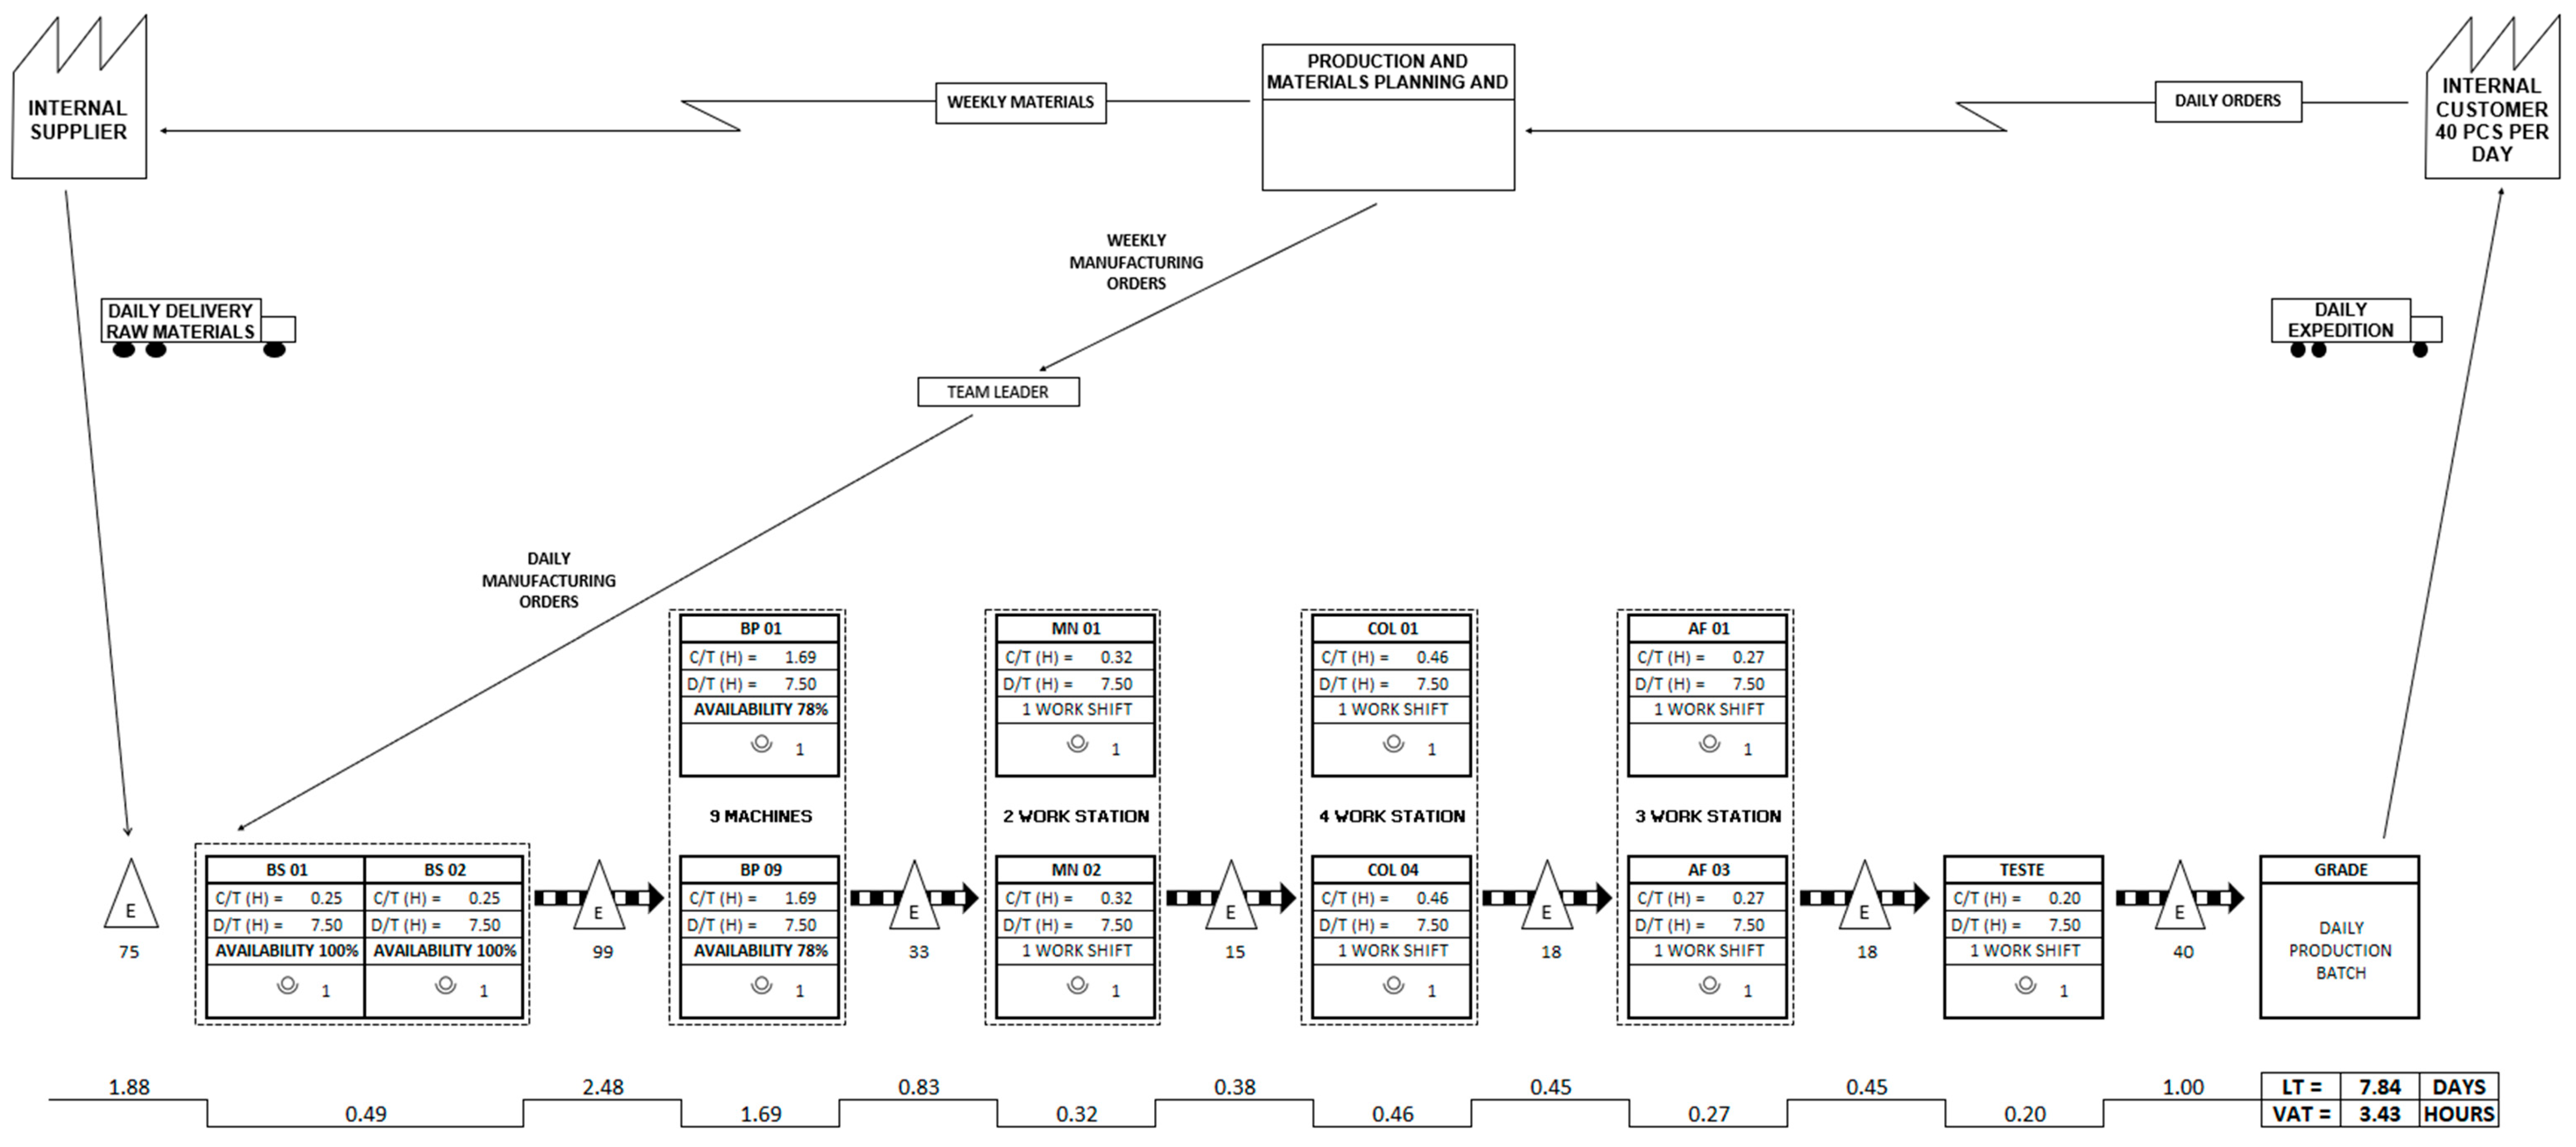
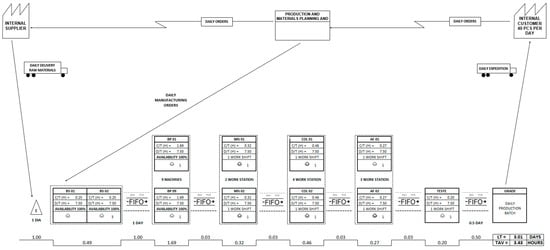
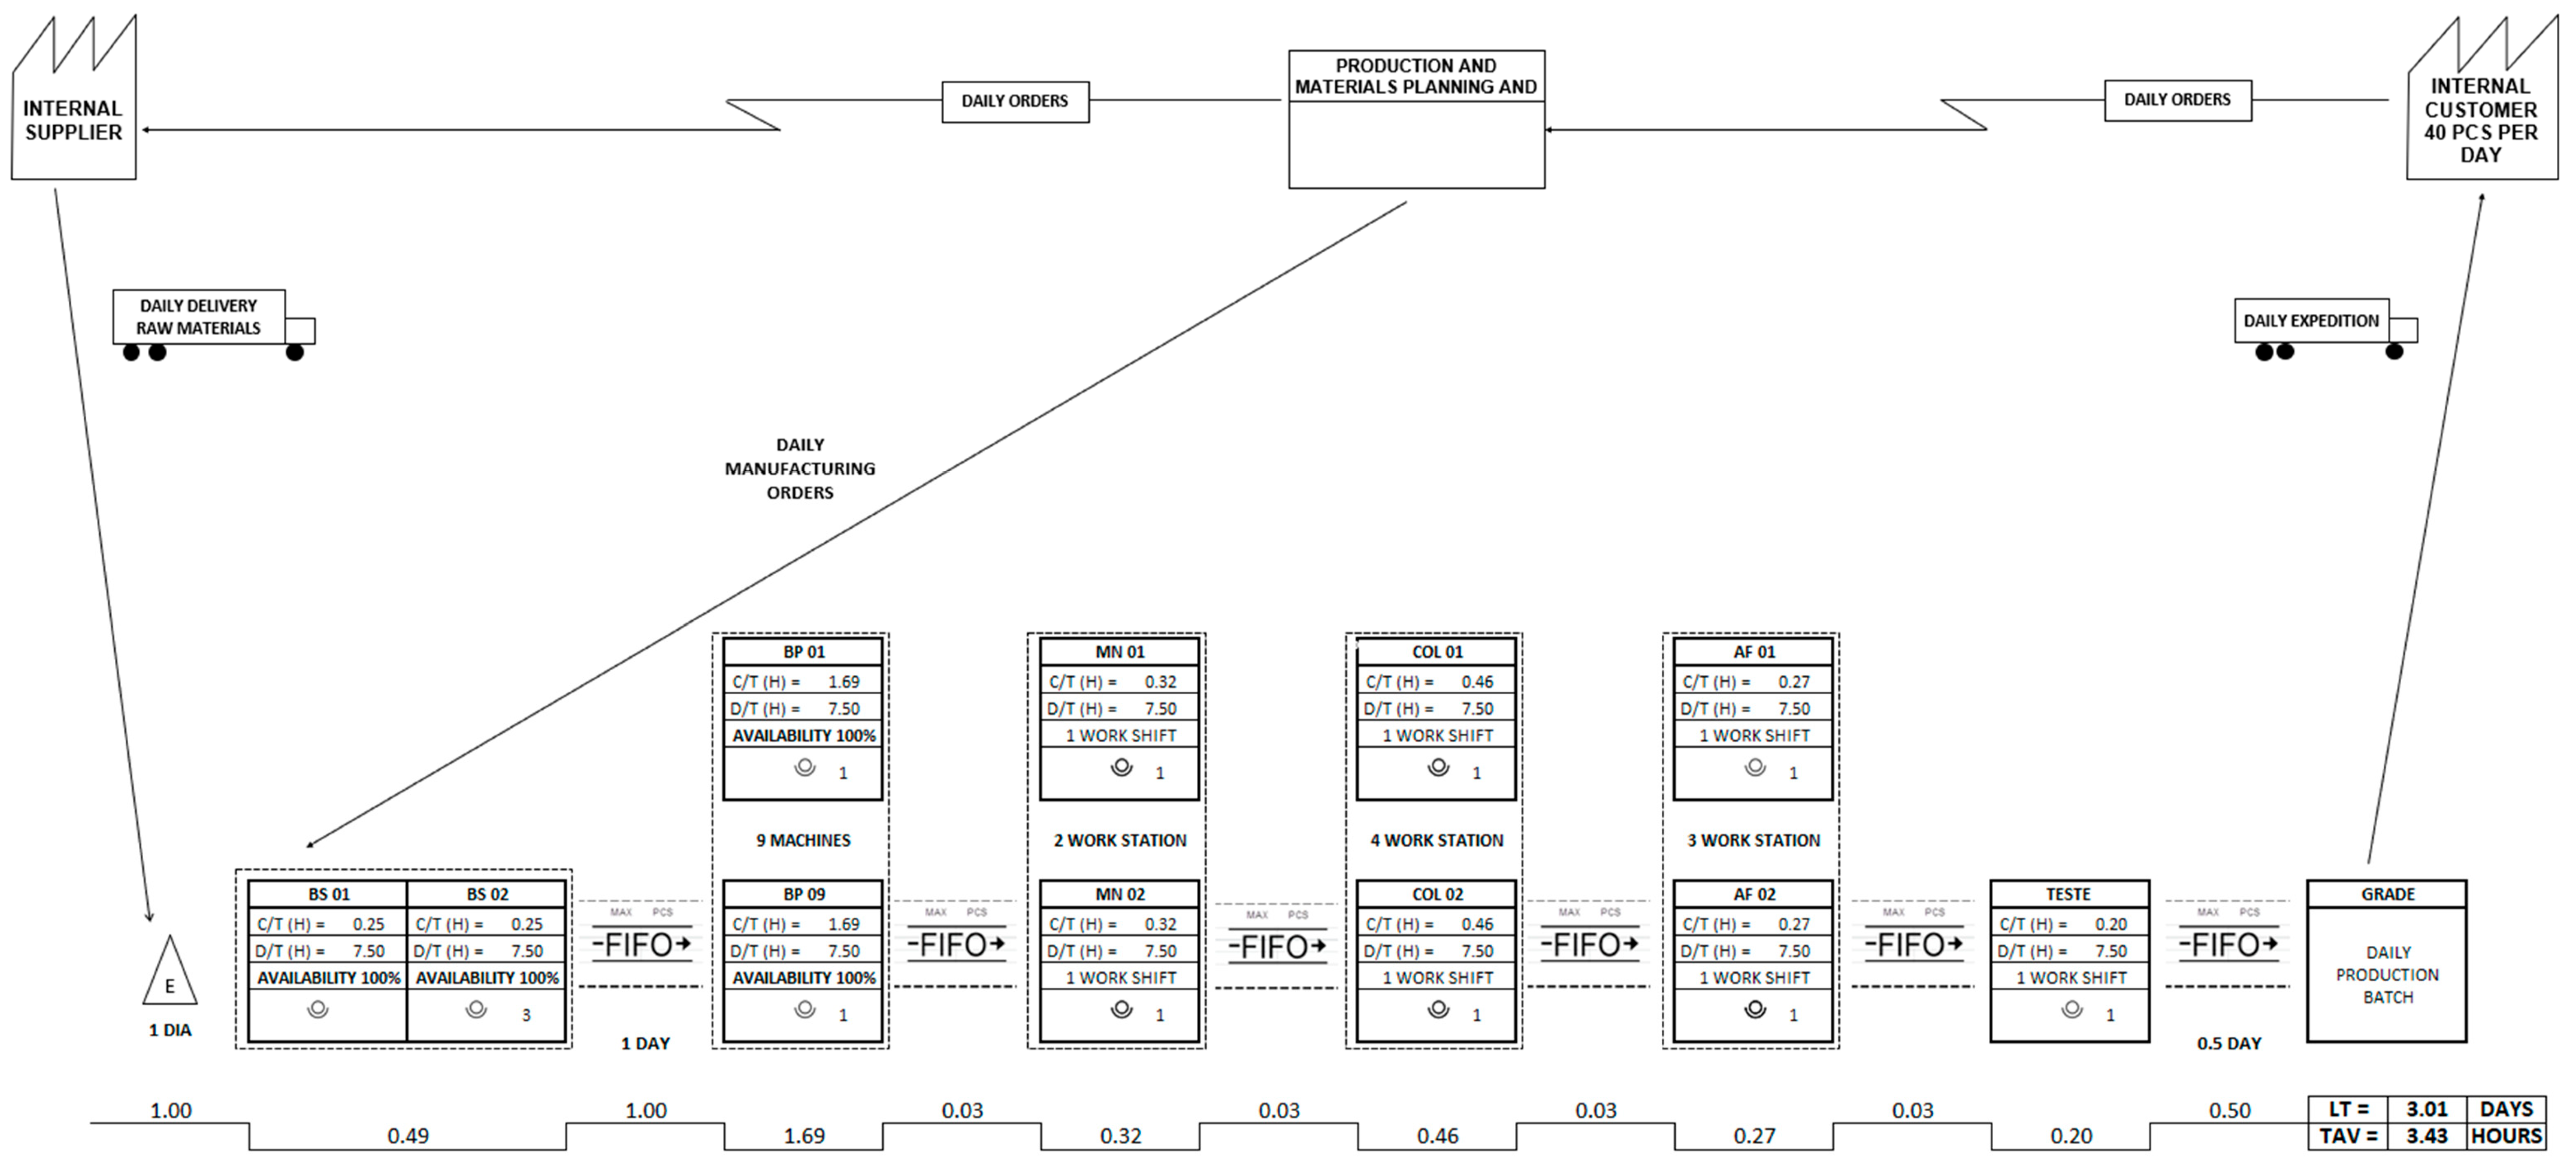
Using all collected data, the current-state VSM was created, as shown in Figure 3, including WIP inventory levels between stages.
Figure 3.
VSM current-state map.
Table 3 summarizes the key operational indicators extracted from the current-state map. From the process cycle times and inventory levels, two performance indicators were calculated:
Table 3.
Current-state value stream map information.
- Value-Added Time (VAT): the total processing time across stages
- Lead Time (LT): the total time from material entry to final delivery, considering inventory levels converted into equivalent days of demand.
4.2.3. Data Analysis and Action Planning
This phase of the action research corresponded to the design of the future-state VSM, aimed at establishing a leaner and more balanced production flow. The first step in this redesign was the calculation of takt time, defined as the available daily production time divided by the daily demand. In this case, the available time was set at 85% of a full work shift, equivalent to 7.5 out of 8.8 h, to account for personal allowances such as breaks, short meetings, ergonomic exercises, and other expected interruptions.
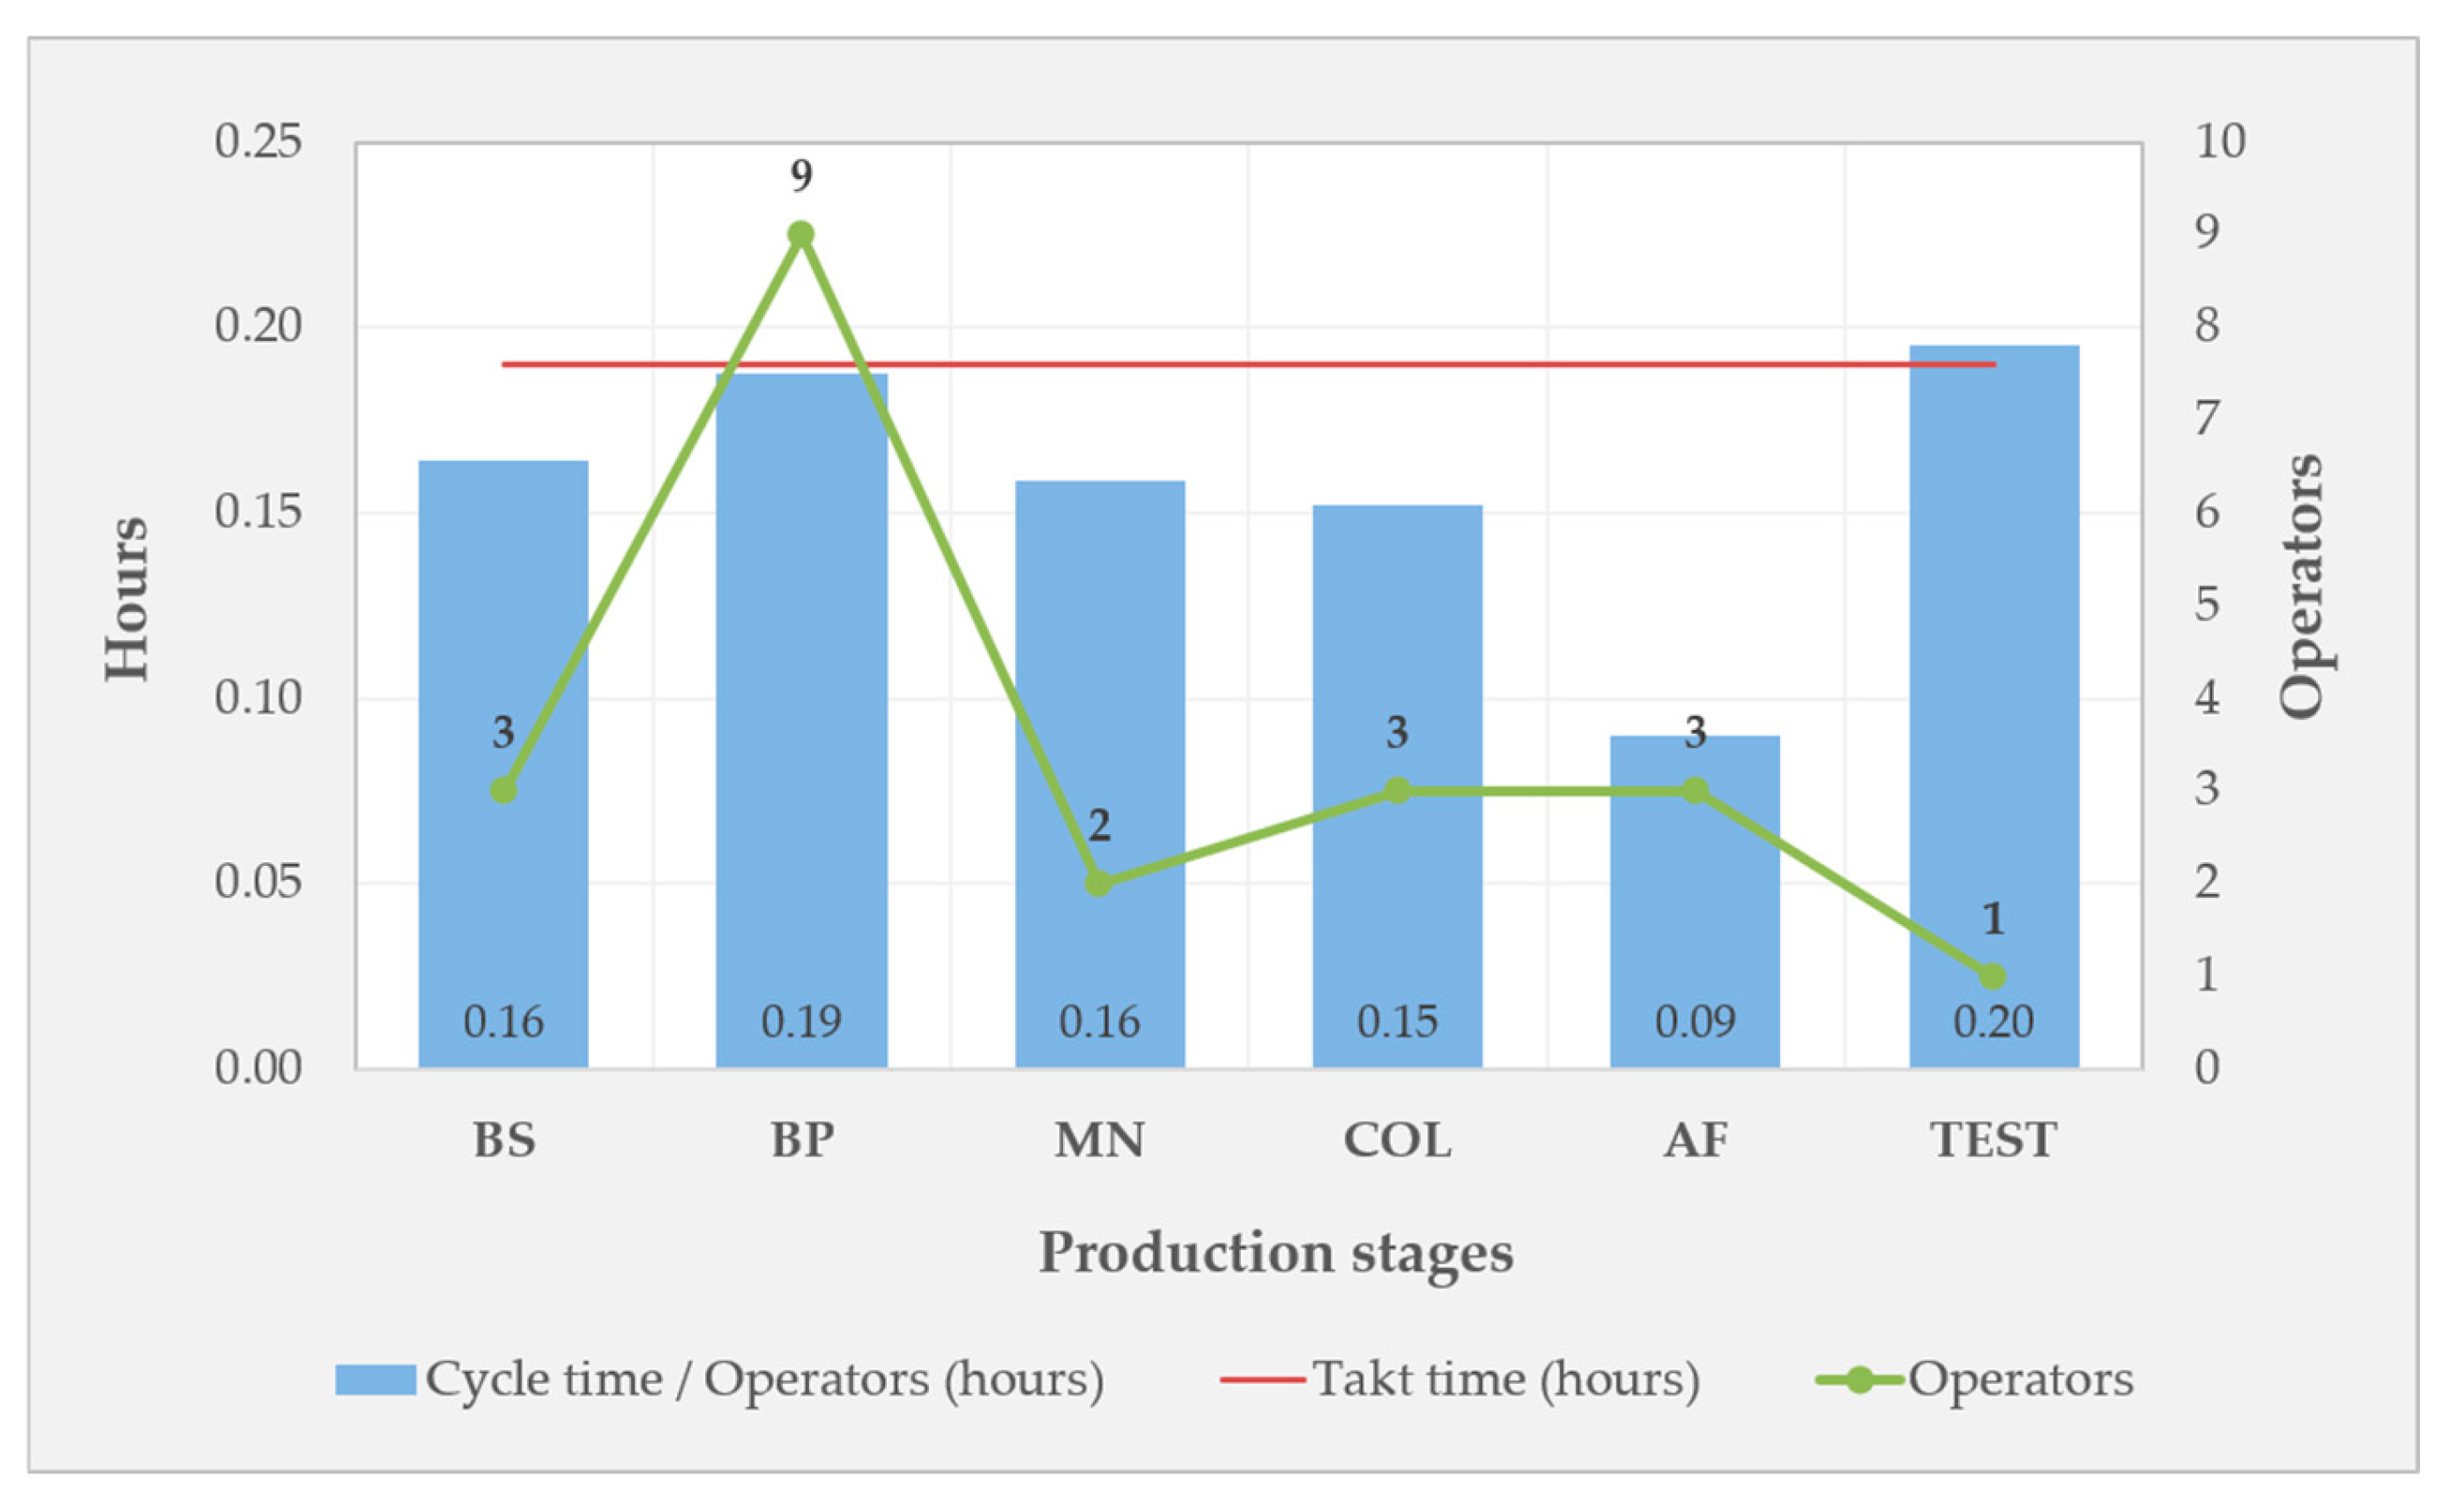
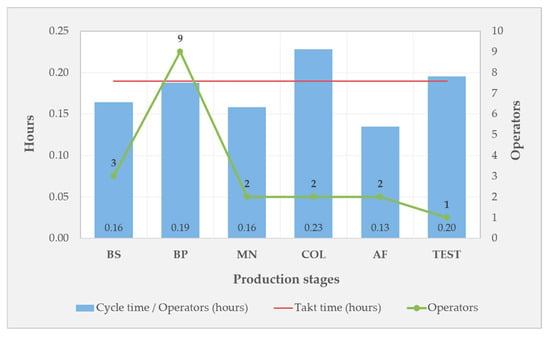
With a daily demand of 40 units, the resulting takt time was 0.19 h per unit. This value was used exclusively as a reference for line sizing and workload balancing, helping to define the number of operators required in each process stage based on the representative cycle times previously calculated.
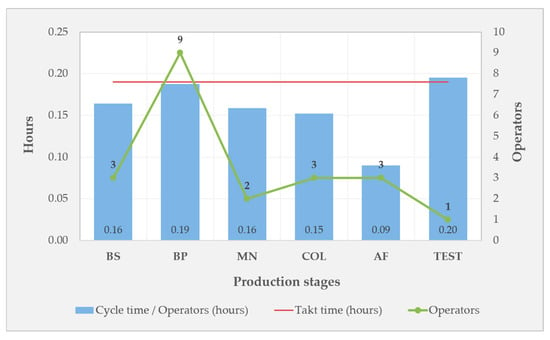
At the time of the study, the production line had 21 operators assigned to the mapped value stream. To evaluate the initial balance of the line, a Workload Balancing Chart (WBC) was developed for the current state, as shown in Figure 4. The chart compares the cycle time per operator in each production stage with the takt time and the number of operators allocated to each stage. The current-state WBC shows that the workload was not evenly distributed along the line, with some stages operating close to or above takt time, while others presented available capacity. This imbalance contributed to WIP accumulation, waiting time, and the need for overtime.
Figure 4.
Workload balancing chart for the current state.
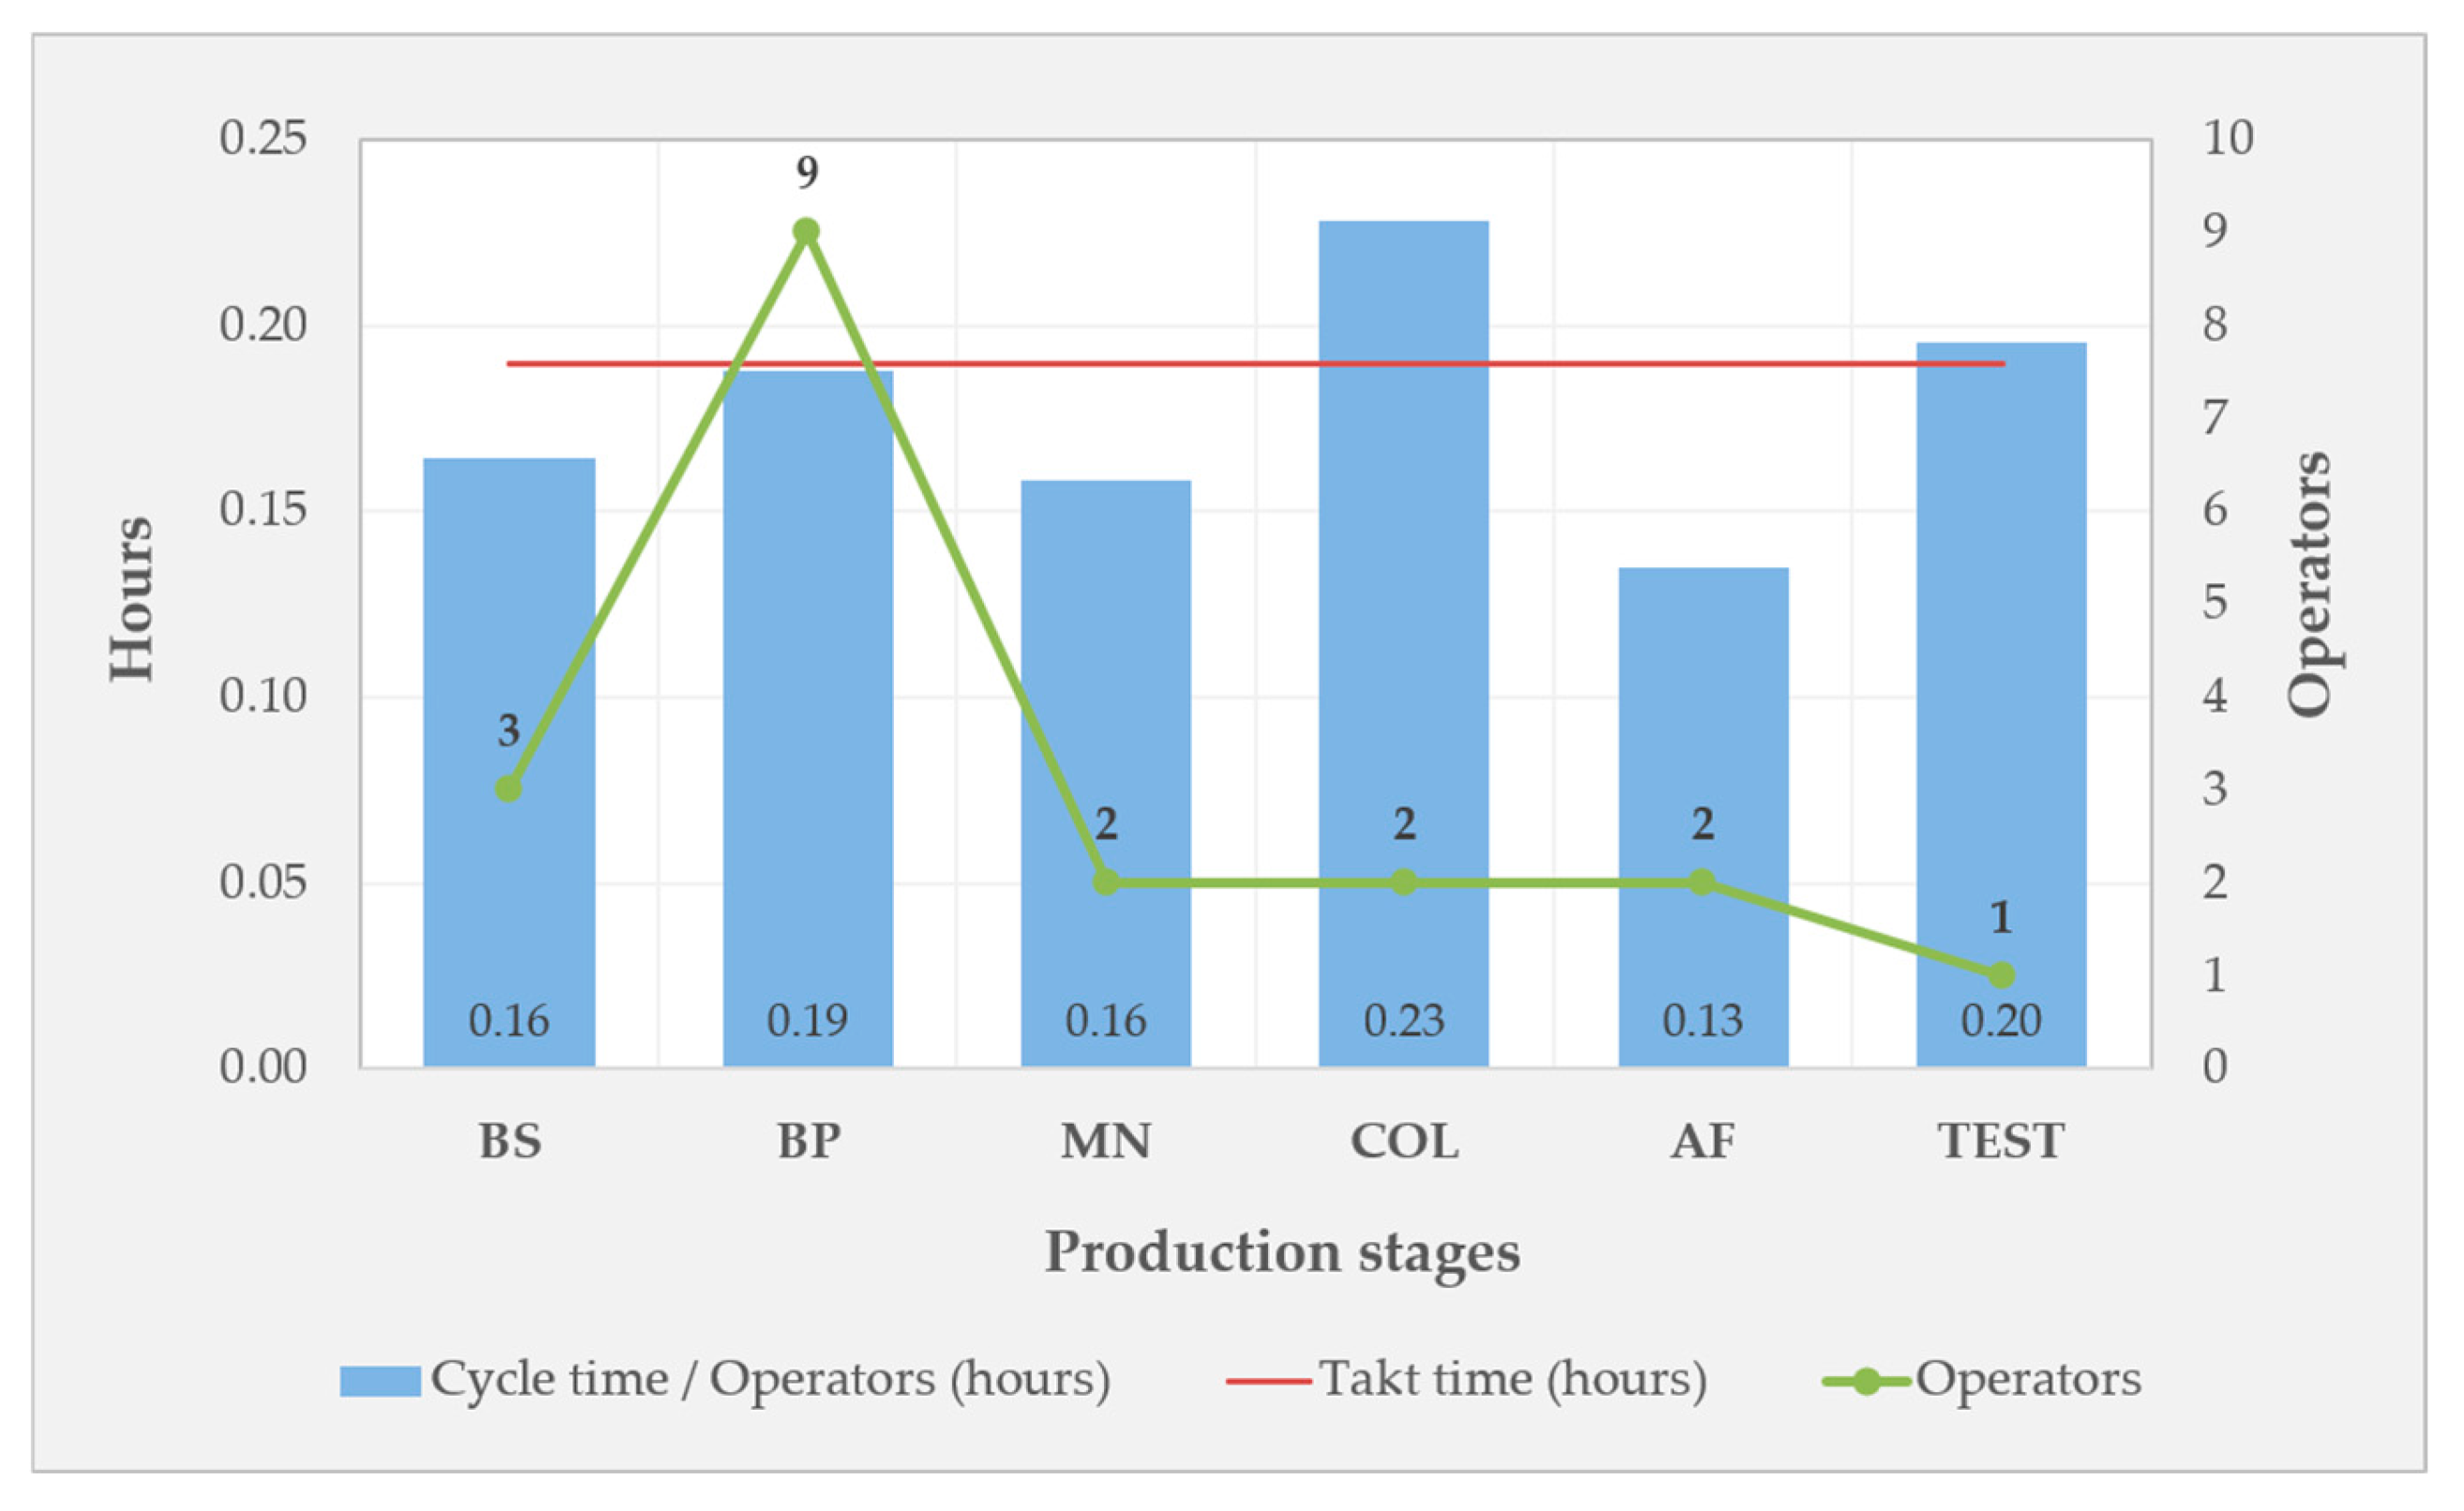
Based on the total cycle time of 3.43 h and the takt time of 0.19 h per unit, the theoretical workforce requirement was calculated as approximately 18 operators. However, considering the high process variability typical of the ETO environment, 19 operators were retained in the future state as a safety margin. As a result, two operators from stages with available capacity were reallocated to other production lines.
After this resizing, a second WBC was developed for the future state, as shown in Figure 5. The future-state WBC illustrates the revised operator allocation and the expected workload distribution after balancing. Compared with the current state, the future state presents a more coherent distribution of work among production stages, while maintaining the cycle time per operator close to the takt time reference. This analysis supported the definition of the future operator allocation and provided a visual basis for the workforce reallocation decision.
Figure 5.
Workload balancing chart for the future state.
Following the resizing of the workforce, a new balance of workstations was required to define how operators should be allocated throughout the shift. To ensure that this balance could be maintained in practice, a critical adaptation was introduced: the use of multifunctional operators. Employees were trained and assigned to move flexibly between different stages of the line according to real-time production needs. This flexibility was essential to absorb demand and mix variability, reduce overload in specific stages, and support the future-state flow defined through the VSM analysis.
In Lean Manufacturing, pitch is commonly used as a short-interval production-control mechanism that translates customer demand into manageable production and monitoring intervals. In repetitive environments, pitch is often derived from takt time and packaging quantity. However, in ETO systems, unit-by-unit takt control is limited because the work content varies substantially according to each project variant. Therefore, in this study, pitch was adapted as a daily workload-control interval. It did not replace lead-time management; instead, it complemented it by enabling PPC and Production to monitor whether the scheduled daily workload was completed within one shift, considering the complexity of the product mix. This adaptation is consistent with the need for flexible production-control mechanisms in high-mix, low-volume, and ETO environments [20,21,23,29,33].
For day-to-day control of the line, the concept of pitch time was adopted instead of takt time. Accordingly, the production lot scheduled for each day had to be completed within one shift. Importantly, this daily lot size did not always consist of 40 units; it varied depending on the complexity of the projects in progress.
In designing the future state, the production strategy had to consider whether to produce finished goods for a supermarket or directly for shipping. Given the ETO nature of the system, where each product is highly customized, it was not viable to maintain a supermarket of finished products. It would be impractical to stock every variation of a single product model. As such, the line was designed to produce directly for shipment, meaning that completed products were sent immediately to the next downstream process.
To establish continuous flow between stages, FIFO lanes (First In, First Out) were implemented. These lanes regulated and sequenced the intermediate inventories between process steps. A maximum inventory level was defined for each buffer; when this threshold was reached, the upstream process would pause, allowing its operators to be reallocated to downstream steps with greater work accumulation.
The system did not include supermarkets between stages. Instead, the FIFO lanes served as pull mechanisms, controlling production flow and inventory levels.
Because product customization begins at the first step of the value stream, this step remained the only process to be actively scheduled. Furthermore, the planning horizon was reduced from a weekly to a daily schedule, allowing the line to operate based on a workload sized to a single shift.
To level the product mix, the Production Planning and Control (PPC) department used the average cycle times calculated for each process step. The production mix was then defined within the constraint of the effective production time, 7.5 h per day. Adjustments to the mix could also be made directly in the FIFO lanes by changing the sequence of items based on delivery priorities. For example, a product ordered more recently could be prioritized over others if its delivery date was more urgent.
The production volume entering the line each day was also leveled according to the capacity established in the first research cycle. However, the number of units produced each day could vary depending on the complexity of the scheduled projects. On one day, the PPC might schedule a larger volume of simpler products, while on another day, it might schedule a smaller volume of more complex items.
As part of the transition to the future state, it was necessary to identify opportunities for Kaizen events across the value stream. The Kaizen opportunities were grouped into three main improvement categories: standardized work, visual management, and reduction in motion and transportation waste. These categories were then translated into specific implementation actions.
Based on these changes, the future-state value stream map was constructed, incorporating all improvement opportunities identified during the analysis. This map is presented in Figure 6.
Figure 6.
VSM future-state map.
4.2.4. Action Implementation
The implementation stage was carried out after the future-state map had been defined and validated with the production and planning teams. The objective of this stage was to transform the improvement opportunities identified in the current state analysis into practical actions on the shop floor. For this purpose, an implementation plan was developed using the 5W2H method, defining what would be done, why it was necessary, where it would be implemented, when it would occur, who would be responsible, how it would be carried out, and the required investment.
The Kaizen opportunities identified during the current state analysis were translated into the implementation actions shown in Table 4. Therefore, each action in the implementation plan represents a Kaizen event or improvement action required to move the value stream from the current state to the proposed future state. These actions focused on workforce flexibility, workload balancing, pull-flow control, daily scheduling, visual management, standardized work, and reduction in motion and transportation waste.
Table 4.
Implementation plan of actions from the first action research cycle.
Most improvements were organizational or procedural and did not require significant investment. Before implementation, all operators involved in the value stream received training in Lean concepts, flow management, continuous improvement, and the new operating routines. This training was necessary to ensure understanding of the future state, alignment with the new flow logic, and proper execution of the proposed changes.
The implementation process was carried out progressively to avoid interruptions in daily production. The first actions were related to operator training and workload balancing, because workforce flexibility was necessary to support the new flow configuration. After that, FIFO lanes were implemented between processes, with maximum inventory limits defined for each buffer. These limits were used to control WIP and to indicate when upstream processes should stop producing or redirect operators to downstream stages with a higher workload.
The weekly scheduling routine was then replaced by daily scheduling, allowing the PPC team to release work orders according to the effective daily capacity and the complexity of the product mix. This change required closer coordination between PPC and Production, since the sequence and volume of orders had to be adjusted more frequently than in the previous weekly planning routine. A visual management board was also implemented at the final process to monitor hourly progress, identify deviations, and support faster decision-making during the shift.
The main challenges faced during implementation were related to changing established routines. Operators had to be trained to work in more than one production stage, and the production team had to adapt to the use of FIFO limits, daily scheduling, and visual management. In addition, the workforce reallocation had to be performed without interrupting daily production. These challenges were addressed through practical training, close follow-up by production leadership, and adjustments during the first weeks of implementation. Standardized work procedures and workstation layout improvements were then developed to stabilize the new routines and reduce variability, motion, and transportation waste.
4.2.5. Evaluation of Results and Reporting
After the proposed actions were implemented, the results were analyzed and are summarized in Table 5.
Table 5.
Summary of results after implementation.
To statistically verify the operational improvements, daily PPC records were compared between the pre-implementation and post-implementation periods. The complete anonymized dataset used for statistical validation is provided in Appendix A, Table A1 and Table A2. The dataset included 31 pre-implementation observations and 84 post-implementation observations with complete information. Since the daily planned quantity varied according to project complexity and product mix, schedule adherence, calculated as actual output divided by planned quantity, was included as a normalized performance indicator. The planned quantity was also analyzed to verify whether the post-implementation period had a statistically lower workload.
As several variables did not meet normality or equal-variance assumptions, the Mann–Whitney U test was adopted as the primary statistical test for before-and-after comparisons. Cliff’s δ was calculated as a non-parametric effect size. Operators were not statistically tested because workforce size was a structural capacity-sizing decision rather than a daily random variable.
The planned quantity did not differ significantly between the two periods (p = 0.531), indicating that the post-implementation performance was not obtained under a statistically lower planned workload. This is particularly relevant in the studied ETO context, where the planned daily quantity varies according to project complexity and the mix of products with shorter or longer processing times.
The results show statistically significant improvements after implementation. Actual output increased from 36.94 to 39.27 units/day (p = 0.003), while schedule adherence increased from 91.91% to 99.00% (p < 0.001). At the same time, overtime decreased from 18.00 to 3.96 h/day (p < 0.001), and lead time decreased from 6.39 to 3.00 business days (p < 0.001). The effect sizes were large for schedule adherence, overtime, and lead time, indicating that the improvements were not only statistically significant but also practically relevant.
The lead-time values in Table 5 were obtained from the VSM current and future-state maps, while Table 6 uses daily PPC records for statistical validation. Therefore, slight differences occur because the two analyses are based on different aggregation criteria.
Table 6.
Statistical validation of operational performance before and after Lean implementation based on daily PPC records.
Because the planned quantity did not differ significantly between periods, the statistical evidence supports that the observed improvements were associated with the Lean implementation rather than with normal operational variation or a reduction in planned workload.
5. Discussion
The results of this study show that Lean Manufacturing (LM) principles can be applied in Engineer-to-Order (ETO) environments when they are adapted to address high product variety, low repetitiveness, highly variable cycle times, and unstable demand. These findings contribute to the literature debate on the feasibility of Lean implementation in ETO systems, where complexity and customization limit the direct transfer of tools developed for repetitive manufacturing [1,2,3,14,15,16]. Therefore, Lean should not be considered incompatible with ETO production, but rather as a flexible socio-technical approach that requires contextual reinterpretation of its tools, assumptions, and performance metrics.
The main gap addressed by this study is the lack of operational methods that explain how Lean principles can be translated into practical shop-floor routines in ETO manufacturing lines composed of several product variants with highly variable cycle times. Although previous studies discuss Lean adaptations for ETO environments, many focus on conceptual recommendations, isolated tools, or specific planning mechanisms without demonstrating how these adaptations can be integrated into a structured intervention in a real production line [17,18,19,20,21,22,23,24,25,26,27,28,29,30,31,32,33]. Thus, the novelty of this study lies not only in applying Lean tools in an ETO context but also in operationalizing an adapted VSM-based action research approach that combines weighted cycle-time calculation, workload balance, multifunctional operators, FIFO-controlled flow, daily scheduling, and pitch-based production control.
The findings reinforce that the direct application of traditional Lean tools is insufficient in ETO environments [14,15,17,18]. Effective implementation requires adaptations that consider product heterogeneity, process variability, uncertain inputs, shared resources, non-linear material flows, and unstable demand [22,31,32]. In this study, the use of representative product families and process-oriented analysis enabled the application of Value Stream Mapping (VSM) in a highly customized context, allowing the visualization of production flows and the identification of improvement opportunities despite low product repetitiveness and multiple project variants [18,22,23].
A central methodological contribution of this study is the weighted cycle-time calculation. In ETO environments, a single product model may include several engineering variants with different processing requirements and cycle times, making traditional cycle-time definition inaccurate for capacity planning, line sizing, and workload balancing. By calculating representative cycle times based on the demand weight of each product/project variant, the proposed approach transforms operational variability into a practical planning parameter. This enables the use of Lean concepts such as takt time, workload balancing, and future-state design without assuming repetitive unit-by-unit production [22,23,24,25].
This contribution strengthens the connection between VSM, capacity analysis, and operational decision-making. Instead of sizing operators and machines based on a single standard product, the proposed method uses a representative production mix. As a result, resource sizing becomes more realistic and consistent with the variability of high-variety ETO manufacturing. In addition, the diagnosis extended VSM beyond shop-floor activities by including material flow, information flow, production planning routines, internal logistics, and the interaction between PPC and Production. This broader perspective is relevant because ETO performance is strongly influenced by planning, procurement, and administrative activities that occur before or alongside manufacturing [22,32].
The adapted pull-oriented logic also contributes to the discussion on Lean control mechanisms in ETO environments. Traditional Kanban systems are often limited in highly customized production because demand is unstable and product repetition is low [20,21,29]. Therefore, the future state combined FIFO lanes, controlled WIP, and daily production scheduling. This hybrid configuration stabilized material flow without imposing a rigid Kanban logic unsuitable for the studied ETO context.
Another relevant contribution concerns the use of pitch-based daily production control. Takt time was useful for capacity analysis and workload balancing, but its direct use as a shop-floor control mechanism was limited by high product variety and variable work content. The pitch-based approach translated demand into a daily production rhythm, allowing PPC and Production to monitor whether the scheduled workload was completed within one shift. Thus, pitch control did not replace lead-time management; it complemented it by improving short-interval control, visual monitoring, and rapid response to deviations in a high-variability production environment.
The results also confirm that complexity and dynamism are intrinsic characteristics of ETO systems and that Lean practices can improve performance when adapted to support flexibility. Visual management, standardized work, multifunctional teams, and daily production control increased visibility and responsiveness in the production system. Multifunctional operators were particularly important because bottlenecks varied according to the product mix and project characteristics. Dynamic workforce allocation helped reduce idle time in some stages and overload in others, reinforcing that Lean in ETO requires flexible capacity rather than only fixed standardization [26,27].
Unlike approaches that rely heavily on simulation and Design of Experiments to overcome the limitations of VSM in non-linear systems, this study shows that practical adaptations of VSM, combined with weighted cycle-time calculation and shop-floor visual control, can generate actionable insights without requiring advanced modeling tools [24]. This does not reduce the value of simulation-based methods, but demonstrates that a more accessible operational approach can also generate relevant improvements, especially for companies with limited analytical resources or lower digital maturity.
The empirical results support the effectiveness of the proposed approach. Reductions in lead time, overtime, and labor requirements indicate that the adapted Lean implementation improved flow stability and resource utilization. These results were not achieved through an isolated Lean tool, but through the integration of mutually reinforcing adaptations: weighted cycle-time calculation enabled realistic workload balancing; workload balancing supported multifunctional allocation; FIFO lanes stabilized material flow; and pitch-based daily control improved production visibility and responsiveness.
Despite these contributions, the study has limitations. The findings are based on a single industrial case, which restricts statistical generalization. In addition, the results were evaluated over a finite time horizon, limiting conclusions about long-term sustainability. Future research should include longer follow-up periods and statistical analyses using daily or order-level data to verify whether the observed improvements remain stable over time and are statistically significant beyond normal operational variation.
Overall, this study contributes to theory and practice by demonstrating that Lean Manufacturing can function as a flexible socio-technical system in ETO environments. From a theoretical perspective, it clarifies how traditional Lean concepts can be reinterpreted under ETO constraints, especially through weighted cycle-time calculation and pitch-based control. From a practical perspective, it provides an operational method for combining VSM, action research, workload balancing, multifunctional operators, FIFO-controlled flow, and daily scheduling in a real ETO production line. Thus, the study addresses the identified gap by showing how Lean adaptations can be integrated and operationalized to improve performance in high-variety and unstable-demand ETO manufacturing.
6. Conclusions
This study applied and analyzed Lean Manufacturing (LM) concepts and tools in an Engineer-to-Order (ETO) production environment, aiming to improve the operational performance of a high-variety and unstable-demand production line. To achieve this objective, action research was combined with Value Stream Mapping (VSM), allowing the diagnosis, design, implementation, and evaluation of Lean-based improvements in a real industrial context.
The results demonstrate that LM can be effectively applied in ETO environments when its tools are adapted to the specific constraints of this production typology. The implementation led to a 9.5% reduction in workforce requirements, from 21 to 19 operators, while maintaining the required daily production capacity. This improvement was mainly supported by line sizing based on representative weighted cycle times and workload balancing. Daily overtime was reduced by 75.0%, from 16 to 4 h per day, mainly due to improved flow stability, multifunctional operators, and better workload distribution. Manufacturing lead time was reduced by 61.7%, from 7.84 to 3.00 days, primarily because of WIP reduction, FIFO-controlled flow, and more responsive daily scheduling.
Beyond these operational improvements, the study contributes to the theoretical understanding of LM in ETO environments. The main methodological contribution is the use of demand-weighted average cycle times to support line sizing, workload balancing, and future-state VSM design in a context characterized by multiple product/project variants and highly variable processing times. In addition, the study shows that pitch-based daily production control can complement takt time in ETO environments. While takt time was useful for capacity analysis, pitch control provided a practical mechanism for monitoring daily workload completion without assuming repetitive unit-by-unit production.
The findings also reinforce that Lean implementation in ETO systems should not rely on isolated tools or direct replication of practices from repetitive manufacturing. Instead, performance improvement depends on the integration of adapted Lean practices, including VSM, weighted cycle-time calculation, workload balancing, multifunctional operators, FIFO lanes, daily scheduling, visual management, and standardized work. Together, these practices supported a more stable, flexible, and responsive production flow.
The sustainability of the improvements will be evaluated through continued monitoring after implementation. The company will track manufacturing lead time, overtime hours, WIP levels, daily schedule adherence, and workforce allocation on a monthly basis for at least six months after stabilization of the future state. Sustainability is expected to be supported by standardized work procedures, visual management, FIFO limits, daily scheduling routines, multifunctional operator training, and regular follow-up meetings between PPC and Production.
This study has limitations. The research was conducted in a single industrial case, which limits statistical generalization. In addition, the manuscript reports the first action research cycle, and long-term performance stability has not yet been fully demonstrated. Future studies should replicate the proposed approach in other ETO manufacturing contexts, include longer follow-up periods, and apply statistical analyses using daily or order-level data to verify whether the observed improvements are statistically significant and sustained over time.
Overall, this research shows that LM can be adapted to ETO production when variability is explicitly considered in the design of production-control mechanisms. By integrating weighted cycle-time calculation, VSM, action research, workload balancing, multifunctional operators, FIFO-controlled flow, and pitch-based daily control, the study provides a practical and theoretically grounded approach for improving performance in high-variety and unstable-demand ETO manufacturing systems.
Author Contributions
Conceptualization, I.G., J.A.d.Q. and J.H.d.F.G.; methodology, I.G.; validation, I.G., J.A.d.Q. and J.H.d.F.G.; formal analysis, investigation, resources, data curation, writing—original draft preparation, I.G.; writing—review, editing, visualization, I.G. and J.H.d.F.G.; supervision, J.A.d.Q. and J.H.d.F.G.; project administration, I.G.; All authors have read and agreed to the published version of the manuscript.
Funding
This research received no external funding.
Institutional Review Board Statement
Ethical review and approval were waived for this study because the research was based on anonymized operational data from an industrial production system and did not involve personal, sensitive, or health-related data from human participants.
Informed Consent Statement
Not applicable.
Data Availability Statement
The anonymized daily PPC records used for statistical validation are provided in Appendix A. Additional company data are not publicly available due to confidentiality restrictions.
Acknowledgments
The authors would like to thank the industrial company where this study was conducted for providing access to data, facilities, and personnel, which made the practical application of the proposed approach possible. Special thanks are extended to the engineering and production teams for their active participation and collaboration throughout the action research process. The authors also acknowledge the support provided by the Brazilian Federal Agency for Support and Evaluation of Graduate Education (CAPES, Coordenação de Aperfeiçoamento de Pessoal de Nível Superior) and by the National Council for Scientific and Technological Development (CNPq, Conselho Nacional de Desenvolvimento Científico e Tecnológico) for the development of this and other research at UNIFEI.
Conflicts of Interest
The authors declare no conflicts of interest.
Abbreviations
The following abbreviations are used in this manuscript:
| ETO | Engineer-to-Order |
| LM | Lean Manufacturing |
| TPS | Toyota Production System |
| VSM | Value Stream Mapping |
| WIP | Work-in-Process |
| VAT | Value-Added Time |
| LT | Lead Time |
| FIFO | First In, First Out |
| PPC | Production Planning and Control |
| PDCA | Plan–Do–Check–Act |
| DOE | Design of Experiments |
| SOP | Standard Operating Procedure |
| HVLV | High-Variety, Low-Volume |
| WBC | Workload Balancing Chart |
Appendix A
Appendix A presents the complete daily PPC records used for the before-and-after statistical validation. The dataset includes planned quantity, actual output, schedule adherence, workforce size, overtime, and lead time for the pre-implementation and post-implementation periods. Daily planned quantity varies according to project complexity and product mix; therefore, schedule adherence was used as a normalized performance indicator. Schedule adherence values above 100% indicate days on which actual output exceeded the planned daily quantity, usually due to the completion of delayed orders from previous days or the presence of a less complex product mix.
Table A1.
Daily PPC records during Lean ETO pre-implementation period (used for statistical comparison and validation, workforce size: 21 operators).
Table A2.
Daily PPC records during Lean ETO post-implementation period (used for statistical comparison and validation, workforce size: 19 operators).
References
- Jünge, G.; Alfnes, E.; Nujen, B.; Emblemsvag, J.; Kjersem, K. Understanding and eliminating waste in engineer-to-order (ETO) projects: A multiple case study. Prod. Plan. Control 2021, 34, 225–241. [Google Scholar] [CrossRef] [Scilit]
- Cannas, V.G.; Gosling, J. A decade of engineering-to-order (2010–2020): Progress and emerging themes. Int. J. Prod. Econ. 2021, 241, 108274. [Google Scholar] [CrossRef] [Scilit]
- Backstrand, J.; Powell, D. Enhancing supply chain capabilities in an ETO context through ‘Lean and Learn’. Oper. Supply Chain Manag. 2021, 14, 360–367. [Google Scholar] [CrossRef] [Scilit]
- Errasti, A.; Poler, R. Engineer to Order Supply Chain Improvement Based on the GRAI Meta-model for Interoperability: An Empirical Study. In Enterprise Interoperability III; Mertins, K., Ruggaber, R., Popplewell, K., Xu, X., Eds.; Springer: London, UK, 2008; Chapter 41. [Google Scholar] [CrossRef] [Scilit]
- Ohno, T. Toyota Production System: Beyond Large-Scale Production; Productivity Press: New York, NY, USA, 1988. [Google Scholar]
- Ghinato, P. Elementos fundamentais do Sistema Toyota de produção. In Produção e Competitividade: Aplicações e Inovações; UFPE: Recife, Brazil, 2000; Chapter 2; Available online: https://www.leanway.com.br/wp-content/uploads/Paper-04-STP.pdf (accessed on 28 June 2026).
- Womack, J.P.; Jones, D.T. Lean Thinking: Banish Waste and Create Wealth in Your Corporation; Free Press: New York, NY, USA, 2003. [Google Scholar]
- Antony, J.; Psomas, E.; Garza-Reyes, J.A.; Hines, P. Practical implications and future research agenda of lean manufacturing: A systematic literature review. Prod. Plan. Control 2021, 32, 889–925. [Google Scholar] [CrossRef] [Scilit]
- Schulze, F.; Dallasega, P. Barriers to lean implementation in engineer-to-order manufacturing with subsequent assembly on-site: State of the art and future directions. Prod. Plan. Control 2023, 34, 91–115. [Google Scholar] [CrossRef] [Scilit]
- Galhardo, I. Aplicação Dos Conceitos de Manufatura Enxuta em Empresa de Equipamentos Elétricos com Tipologia de Produção Engineer-to-Order. Master’s Thesis, Instituto de Engenharia de Produção e Gestão, Universidade Federal de Itajubá, Itajubá, Brazil, 2019. Available online: https://repositorio.unifei.edu.br/jspui/handle/123456789/2054 (accessed on 28 June 2026).
- Avison, D.; Baskerville, R.; Myers, M. Controlling action research projects. Inf. Technol. People 2001, 14, 28–45. [Google Scholar] [CrossRef] [Scilit]
- Thiollent, M. Metodologia da Pesquisa-Ação, 15th ed.; Cortez: São Paulo, Brazil, 2007. [Google Scholar]
- Coghlan, D.; Brannick, T. Doing Action Research in Your Own Organization, 2nd ed.; Sage Publications: London, UK, 2008. [Google Scholar]
- Cooney, R. Is ‘lean’ a universal production system? Int. J. Oper. Prod. Manag. 2002, 22, 1130–1147. [Google Scholar] [CrossRef] [Scilit]
- Gosling, J.; Naim, M.M. Engineer-to-order supply chain management: A literature review and research agenda. Int. J. Prod. Econ. 2009, 122, 741–754. [Google Scholar] [CrossRef] [Scilit]
- Naim, M.M.; Gosling, J. On leanness agility and leagile supply chains. Int. J. Prod. Econ. 2011, 131, 342–354. [Google Scholar] [CrossRef] [Scilit]
- Jina, J.; Bhattacharya, A.K.; Walton, A.D. Applying lean principles for high product variety and low volumes: Some issues and propositions. Logist. Inf. Manag. 1997, 10, 5–13. [Google Scholar] [CrossRef] [Scilit]
- Danford, M. From job shop chaos to lean order. Mod. Mach. Shop 2010, 83, 60–67. [Google Scholar]
- Thürer, M.; Stevenson, M.; Silva, C.; Land, M.J.; Fredendall, L. Workload control and order release: A lean solution for make-to-order companies. Prod. Oper. Manag. 2012, 21, 939–953. [Google Scholar] [CrossRef] [Scilit]
- Portioli-Staudacher, A.; Tantardini, M. A lean-based ORR system for non-repetitive manufacturing. Int. J. Prod. Res. 2012, 50, 3257–3273. [Google Scholar] [CrossRef] [Scilit]
- Votto, R.G.; Fernandes, F.C.F. Lean production and theory of constraints: A joint implementation method in engineer-to-order environments. Gestão Produção 2014, 21, 45–63. [Google Scholar] [CrossRef] [Scilit]
- Matt, D.T.; Rauch, E. Implementing lean in engineer-to-order manufacturing: Experiences from an ETO manufacturer. In Enterprise Interoperability III; IGI Global: Hershey, PA, USA, 2014; pp. 148–167. [Google Scholar] [CrossRef] [Scilit]
- Thomassen, M.K.; Alfnes, E.; Gran, E. A new value stream mapping approach for engineer-to-order production systems. In Advances in Production Management Systems (APMS 2015). IFIP Advances in Information and Communication Technology; Umeda, S., Nakano, M., Mizuyama, H., Hibino, H., Kiritsis, D., von Cieminski, G., Eds.; Springer: Cham, Switzerland, 2015; Volume 460, pp. 207–214. [Google Scholar] [CrossRef] [Scilit]
- Zhou, J.; Zhang, Q.; Wang, X.; Xiao, H. Lean system design for engineer-to-order manufacturing. J. Shanghai Jiaotong Univ. (Sci.) 2016, 21, 702–712. [Google Scholar] [CrossRef] [Scilit]
- Seth, D.; Seth, N.; Dhariwal, P. Application of value stream mapping (VSM) for lean and cycle time reduction in complex production environments: A case study. Prod. Plan. Control 2017, 28, 398–419. [Google Scholar] [CrossRef] [Scilit]
- Birkie, S.E.; Trucco, P. Understanding dynamism and complexity factors in engineer-to-order and their influence on lean implementation strategy. Prod. Plan. Control 2016, 27, 345–359. [Google Scholar] [CrossRef] [Scilit]
- Birkie, S.E.; Trucco, P.; Kaulio, M. Sustaining performance under operational turbulence: The role of lean in engineer-to-order operations. Int. J. Lean Six Sigma 2017, 8, 457–481. [Google Scholar] [CrossRef] [Scilit]
- Cannas, V.G.; Pero, M.; Pozzi, R.; Rossi, T. An empirical application of lean management techniques to support ETO design and production planning. IFAC-PapersOnLine 2018, 51, 134–139. [Google Scholar] [CrossRef] [Scilit]
- Powell, D.J. Kanban for lean production in high mix, low volume environments. IFAC-PapersOnLine 2018, 51, 140–143. [Google Scholar] [CrossRef] [Scilit]
- Chiera, M.; Lupi, F.; Rossi, A.; Lanzetta, M. Lean maturity assessment in ETO scenario. Appl. Sci. 2021, 11, 3833. [Google Scholar] [CrossRef] [Scilit]
- Schulze, F.; Dallasega, P. Industry 4.0 concepts and lean methods mitigating traditional losses in engineer-to-order manufacturing with subsequent assembly on-site: A framework. Procedia Manuf. 2020, 51, 1363–1370. [Google Scholar] [CrossRef] [Scilit]
- Mello, C.H.P.; Turrioni, J.B.; Xavier, A.F.; Campos, D.F. Pesquisa-ação na engenharia de produção: Proposta de estruturação para sua condução. Produção 2012, 22, 1–13. [Google Scholar] [CrossRef] [Scilit]
- Rother, M.; Shook, J. Learning to See: Value Stream Mapping to Add Value and Eliminate Muda; Productivity Press: New York, NY, USA, 1999. [Google Scholar]
- Seth, D.; Gupta, V. Application of value stream mapping for lean operations and cycle time reduction: An Indian case study. Prod. Plan. Control 2005, 16, 44–59. [Google Scholar] [CrossRef] [Scilit]

Disclaimer/Publisher’s Note: The statements, opinions and data contained in all publications are solely those of the individual author(s) and contributor(s) and not of MDPI and/or the editor(s). MDPI and/or the editor(s) disclaim responsibility for any injury to people or property resulting from any ideas, methods, instructions or products referred to in the content. |
© 2026 by the authors. Licensee MDPI, Basel, Switzerland. This article is an open access article distributed under the terms and conditions of the Creative Commons Attribution (CC BY) license.