


Abstract
Methane diffusivity controls matrix-to-cleat gas transfer in coalbed methane reservoirs and varies with pore structure, pressure, and water saturation. A three-dimensional pore–throat network combines steady-state Fickian transport with invasion percolation to evaluate these effects. Dynamic prediction refers to updating effective diffusivity at successive reservoir states. For the Pittsburgh and Madrid pressure series, the mean absolute relative errors are 3.3% and 2.5% across five observations per coal, and 2.9% and 2.5% for the two withheld observations. Effective diffusivity increases with coordination number and the investigated Weibull parameters within the specified network family, while the prescribed pressure response is negative. Increasing water saturation suppresses gas-connected transport, with near-zero diffusivity around 0.58 for the examined configuration. An alternating conditional expectation framework describes nonlinear structural responses, and a separate pressure–saturation relation expresses the state dependence in a compact form. The results distinguish the contributions of local mobility and gas-pathway connectivity to effective methane diffusion.
1. Introduction
Coalbed methane (CBM) is stored mainly in the coal matrix and must be transferred to the cleat system before pressure-driven flow can deliver it to a production well. Matrix diffusion therefore links desorption to fracture flow and increasingly controls production as readily mobile cleat gas is depleted. The coefficient used to represent this transfer is not a scale-independent molecular constant; instead, it is an effective transport parameter influenced by methane mobility, accessible pore volume, diffusion length, pore-size distribution, and connectivity. Research has converged on two principal approaches for determining or interpreting this quantity: experimental testing and molecular simulation [1]. Experimental studies commonly monitor transient methane adsorption or desorption from particles, flakes, or cores and infer diffusivity by fitting Fickian unipore, bidisperse, or time-dependent models to pressure or sorption data [2,3,4,5]. These tests are comparatively straightforward and can reproduce selected reservoir pressures, temperatures, and moisture conditions, but the recovered coefficient depends on sample geometry, particle size, sorption–diffusion coupling, the assumed boundary condition, and the inverse model. Steady-gradient and counter-diffusion methods instead obtain diffusivity from a sustained concentration-driven flux, reducing ambiguity from transient sorption; however, they require intact specimens, tight control of leakage and pressure-driven advection, and often long equilibration times [5,6,7]. Micro-computed tomography and low-field nuclear magnetic resonance extend experimental testing by resolving local gas migration or distinguishing adsorbed and free methane without destructively reducing the sample, although their spatial resolution, signal calibration, and practical specimen size remain limiting [6,8,9]. Molecular simulation provides the complementary approach. A representative coal macromolecular structure is loaded by grand canonical Monte Carlo, and molecular-dynamics trajectories are analysed through mean-square displacement or Maxwell–Stefan formulations to obtain self-, corrected-, or transport-diffusion coefficients [10,11,12,13]. This approach isolates guest–host interactions and permits controlled changes in pressure, temperature, pore size, water content, and gas composition, but its predictions remain sensitive to the selected coal structure, force field, simulation cell, and trajectory length. Nanoscale self-diffusivity cannot be equated directly with a bulk coefficient. The two approaches are therefore complementary: experiments constrain effective transport behaviour at the sample scale, whereas simulations provide mechanistic insights into processes that are difficult to observe directly.
Adsorption–diffusion experiments further show that the measured rate depends on grain size, moisture state, and temperature, which complicates transfer from laboratory samples to reservoir conditions [4].
Coalbed methane utilization also links subsurface gas supply to energy conversion and emissions. Fetisov et al. [14] evaluated power-generation performance and emissions for different fuels using thermodynamic modelling. Their system-scale analysis complements the present focus on matrix diffusion as a control on gas delivery to the cleat system.
Across both approaches, the reported diffusivity is governed by interacting structural and state variables rather than by a single coal property. Pore size, pore-volume distribution, tortuosity, and connectivity determine the available pathways, while coal rank affects these variables together with surface chemistry and adsorption capacity. Consequently, rank itself does not produce a universal monotonic trend: U-shaped, rise-then-decline, and coal-specific relations have all been reported, and particle-size tests show that crushing can change diffusion length and expose fractures rather than merely rescale an intrinsic matrix coefficient [5,15,16,17,18]. Confining stress generally suppresses bulk transport by narrowing connected pores and fractures, but the magnitude of this effect depends strongly on whether particles, intact cores, or fractured samples are tested [7,18]. The influence of pressure remains one of the most debated factors controlling methane diffusivity. Chromatographic, desorption-inversion, and pore-structure-based studies have reported diffusivity decreasing with pressure [3,19,20,21,22,23], whereas flake, core, and positive-pressure experiments have obtained increasing coefficients over their tested ranges [5,15,18,24,25]. Concentration-dependent analysis further shows that the recovered value can evolve during a single desorption experiment [21], and molecular calculations predict non-monotonic transport when surface diffusion, configurational restriction, and adsorption-induced swelling compete [11]. These trends need not be mutually exclusive because self-, transport-, and apparent diffusion coefficients describe different observables. Pressure also changes concentration gradients, surface coverage, gas mean free path, and the coal structure sampled by an experiment. Temperature gives a more consistent response: greater molecular kinetic energy generally increases methane mobility, although the sensitivity varies with pressure, coal rank, and coefficient definition [7,10,11,12,13,24,26,27]. Water usually lowers methane transport by occupying adsorption sites and pore volume and by interrupting gas-accessible pathways [28,29,30]. Nevertheless, the magnitude and even the local direction of this effect can depend on coal rank, moisture distribution, and whether adsorption or desorption is observed. U-shaped moisture responses have been measured in bituminous coal, and successive-depressurisation measurements have yielded a higher effective coefficient for wet anthracite but a lower value for wet bituminous coal [9,31]. Moisture should therefore be considered a factor affecting accessible pore structure and phase connectivity rather than a universal scalar correction applied to diffusivity.
Experiments on fractured coal also report specimen-size effects and dependence of effective diffusivity on confining stress and pore pressure [32].
These studies leave a specific upscaling problem. Particle and core tests constrain sample-scale transport but do not uniquely separate molecular mobility from connected-path geometry [1,6,8,16,17,21,32]. Molecular simulations resolve local interactions but require additional structural information to represent a connected coal matrix [10,11,12,13]. Coupled transient matrix–network models address time-dependent gas transfer [33], whereas the present study examines the effective conductance of fixed networks at successive pressure and water-saturation states. The aim is to distinguish changes in local transport coefficients from changes in gas-filled connectivity, and to describe the resulting state dependence compactly. Steady-state concentrations satisfy nodal mass conservation at each state, and invasion percolation defines phase occupancy [34,35,36,37]. At each prescribed pressure–saturation state, steady-state diffusion is solved on a fixed pore–throat network to update the effective diffusivity.
2. Materials and Methods
2.1. Pore-Network Representation and Assumptions
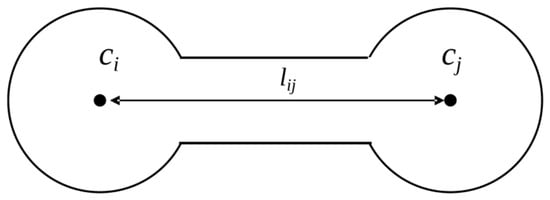
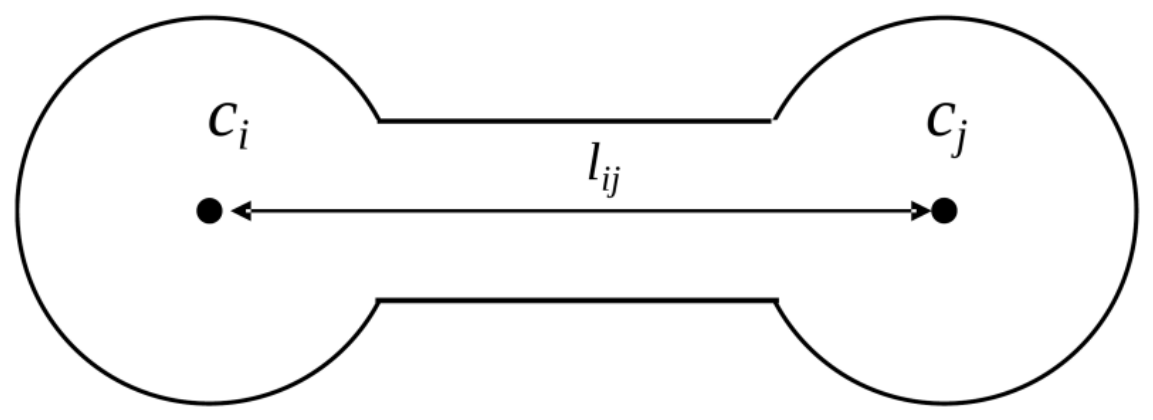
A pore-network model represents the coal matrix as storage nodes joined by conducting throats. Pore diameters specify local void volumes, while throat geometry and connectivity determine the paths available for transport. The N = 70 stochastic test uses spherical pores and circular-equivalent throat diameters; the capillary-entry derivation below states the corresponding geometric relation. Pore centres occupy a regular three-dimensional lattice, and the mean coordination number is controlled by the retained-neighbour selection. Figure 1 illustrates the pore–throat relation used in this network.
Figure 1.
Pore–throat relation in the pore-scale network. Adjacent pores i and j, with concentrations ci and cj, are connected by a throat of length lij.
Each prescribed pressure–saturation state is treated as an isothermal steady-state diffusion problem on a fixed pore–throat geometry. Gas invasion is represented as piston-like displacement in an initially water-filled, water-wet network. The reported effective diffusivity describes diffusion through connected gas-filled elements; dissolved-methane, liquid-film, and explicit adsorbed-phase fluxes are outside this definition [11,20,28,29,30,31].
2.2. Throat Conductance and Network-Scale Diffusivity
For a concentration gradient imposed across a conducting element, the steady diffusive flow rate is expressed as
where Qd is the signed molar diffusion rate (mol s−1), D is diffusivity (m2 s−1), A is cross-sectional area (m2), c is molar concentration (mol m−3), and l is distance (m). The minus sign denotes transport down the concentration gradient. The molar rate from pore i to pore j is
where gd,ij is the diffusive conductance. By treating each throat as an equivalent capillary element, the conductance can be expressed as
where Ds (m2 s−1) is the local diffusion coefficient, Aij (m2) is the throat area, and lij (m) is the throat length; gd,ij has units of m3 s−1. The local coefficient follows a diameter-dependent, linear pressure approximation:
where dh = 4Aij/Pij is the hydraulic diameter, and Pij is the wetted perimeter; for the square-throat conductance derivation used in the structural sweeps, dh equals the side length. The reference values are D* = 5.45 × 10⁻⁹ m2 s−1, d* = 10 nm, p* = 0.5 MPa, and χ = 0.080 MPa−1. Pressure is expressed in MPa in Equation (4). The pressure factor remains positive over the interval used in Section 2.6. A separate stream with the same PCG64 seed is used for the geometry and topology, so changing CN does not change the pore diameters. For the fixed-reference stochastic ensemble, D0 = 8.2 × 10⁻¹⁰ m2 s−1 at d0 = 4 nm and p0 = 0.5 MPa; the ensemble pressure is p = 3.5 MPa.
At every internal pore, steady mass conservation requires
where md,ij is the methane mass rate (kg s−1). With the concentration convention above, the mass and molar rates satisfy
where MCH4 is the methane molar mass (kg mol−1). Concentrations of 1 and 0 mol m−3 are imposed on the opposing x-inlet and x-outlet faces, respectively, and the four lateral faces have zero normal flux. The concentrations serve as a normalized driving gradient for the linear transport problem. The nodal equations are solved by sparse direct factorization; a realization is retained when the concentration solution is finite and the inlet flux is positive. The total inlet molar rate q gives
where q is the total inlet molar rate (mol s−1), A and L are the external network area (m2) and inlet–outlet separation (m), and cin − cout is the imposed concentration difference (mol m−3). D is the network effective diffusivity, also denoted De below, and has units of m2 s−1.
2.3. Invasion Percolation
The single-phase calculation is extended to water-bearing coal by invasion percolation. Gas can invade a water-filled throat only when the applied capillary pressure exceeds the throat entry pressure and the throat is connected to the existing gas cluster. For a circular capillary, the Young–Laplace relation gives
where Pc = Pg − Pw is the gas–water capillary pressure (Pa), σgw is the interfacial tension (N m−1), r is the circular-throat radius (m), and θ is the contact angle measured through water. Water-wet invasion requires cos θ > 0. The diameter is d = 2r; the radius is used only in the entry-pressure equation.
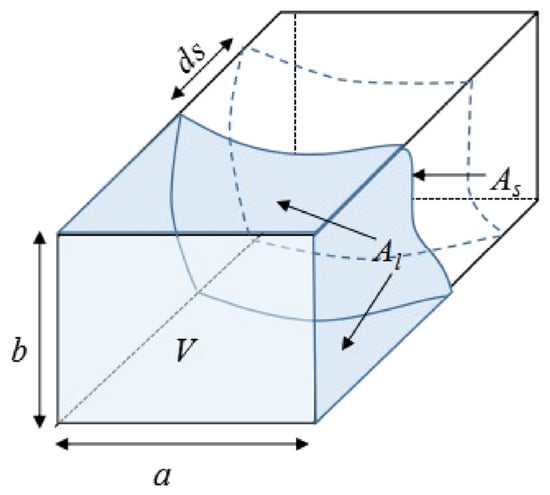
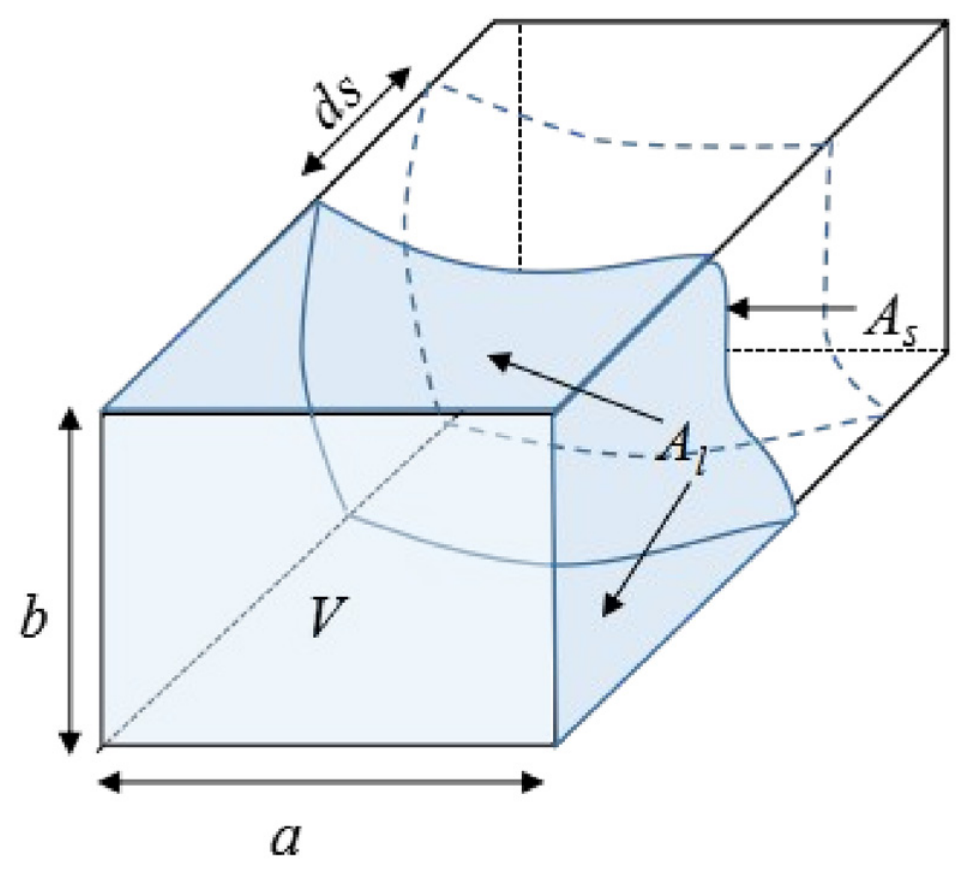
For the rectangular capillary shown in Figure 2, the entry pressure can be obtained from an interfacial force and energy balance [38]:
where Al is the wall area converted from liquid contact to gas contact during advance, As is the gas–water meniscus area, and V is the volume invaded by gas. This convention gives a positive entry pressure for a water-wet throat.
Figure 2.
Rectangular capillary geometry and meniscus displacement ds. The shaded region is water, and As is the gas–water meniscus area. The displaced water volume equals the increase in gas-invaded volume V; Al in Equations (9) and (10) denotes the wall area converted from water contact to gas contact.
For a piston-like meniscus translating in a straight throat with a uniform rectangular cross-section, the meniscus area is constant:
The converted wall area increases by the wetted perimeter multiplied by the advance distance, so
where a and b are the rectangular side lengths. Substitution into Equation (9) gives
Gas–water interfacial tension depends on temperature, pressure, salinity, and gas composition, as discussed by Zhang et al. [39]. Its general dependence is written as
where T is temperature (K), p is pressure (Pa), S is salinity (g kg−1), and xg is the gas-composition vector. The fixed-reference breakthrough ensemble uses pure methane and fresh water at 303.15 K, uses σgw = 0.030 N m−1, and assumes a water-wet reference contact angle θ = 0° through water. These values are held constant within the ensemble; throat geometry and inlet accessibility determine invasion order.
Gas invasion starts from the retained pores on the fixed x-inlet face of the initially water-filled network; the nominal N = 70 face contains 4900 sites before random retention. The entry pressure of each circular-equivalent throat is obtained from Equation (8). Accessible throats are ordered by entry pressure, with equal values resolved by ascending throat index. The throat with the lowest accessible entry pressure and its newly reached pore are filled with gas, after which the accessible list is updated. The sequence continues until the network is gas filled. Non-spanning realizations were excluded using the predefined acceptance criterion, and the number retained is reported.
where Vi,w and Vi are the water-filled and total void volumes of element i. At each recorded state, gas-filled throats whose adjacent pores are gas filled enter the diffusion calculation. The inlet-to-outlet spanning-gas cluster carries the boundary flux; disconnected clusters contribute zero through-flow. Spherical pore volumes and circular-equivalent throat volumes, π(dt/2)2lij, are included in the saturation balance.
The calculation is organized in three steps. Step 1 constructs the pore–throat network, assigns pore diameters and throat geometry, and applies the concentration boundaries. Step 2 calculates throat entry pressures and updates the gas-accessible cluster by invasion percolation from the x-inlet. Step 3 calculates water saturation, identifies the gas-connected inlet–outlet cluster, solves the steady diffusion equation on that cluster, and obtains the effective diffusivity from the total inlet flux. The sequence is repeated for each prescribed state.
Invasion percolation produces spatially organized gas–water occupancy. Gas accesses low-entry-pressure throats connected to the inlet rather than filling all large throats independently of accessibility. Here Sw denotes the water-filled volume fraction, whereas occupancy denotes the phase assigned to an individual pore or throat.
2.4. Network Generation and Pore-Size Distribution
The reported structural sweeps use the 70 × 70 × 70 reference lattice with a centre-to-centre spacing of 16.67 nm. The prescribed neighbourhood, Kruskal selection, and mean coordination number define the retained topology. Pore diameters follow the shifted Weibull distribution, and the pressure, coordination-number, and distribution-parameter levels are listed in Section 2.6.
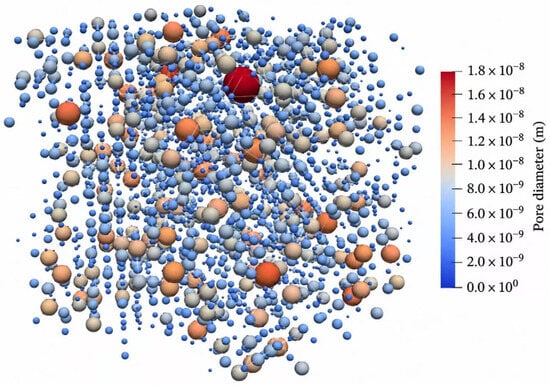
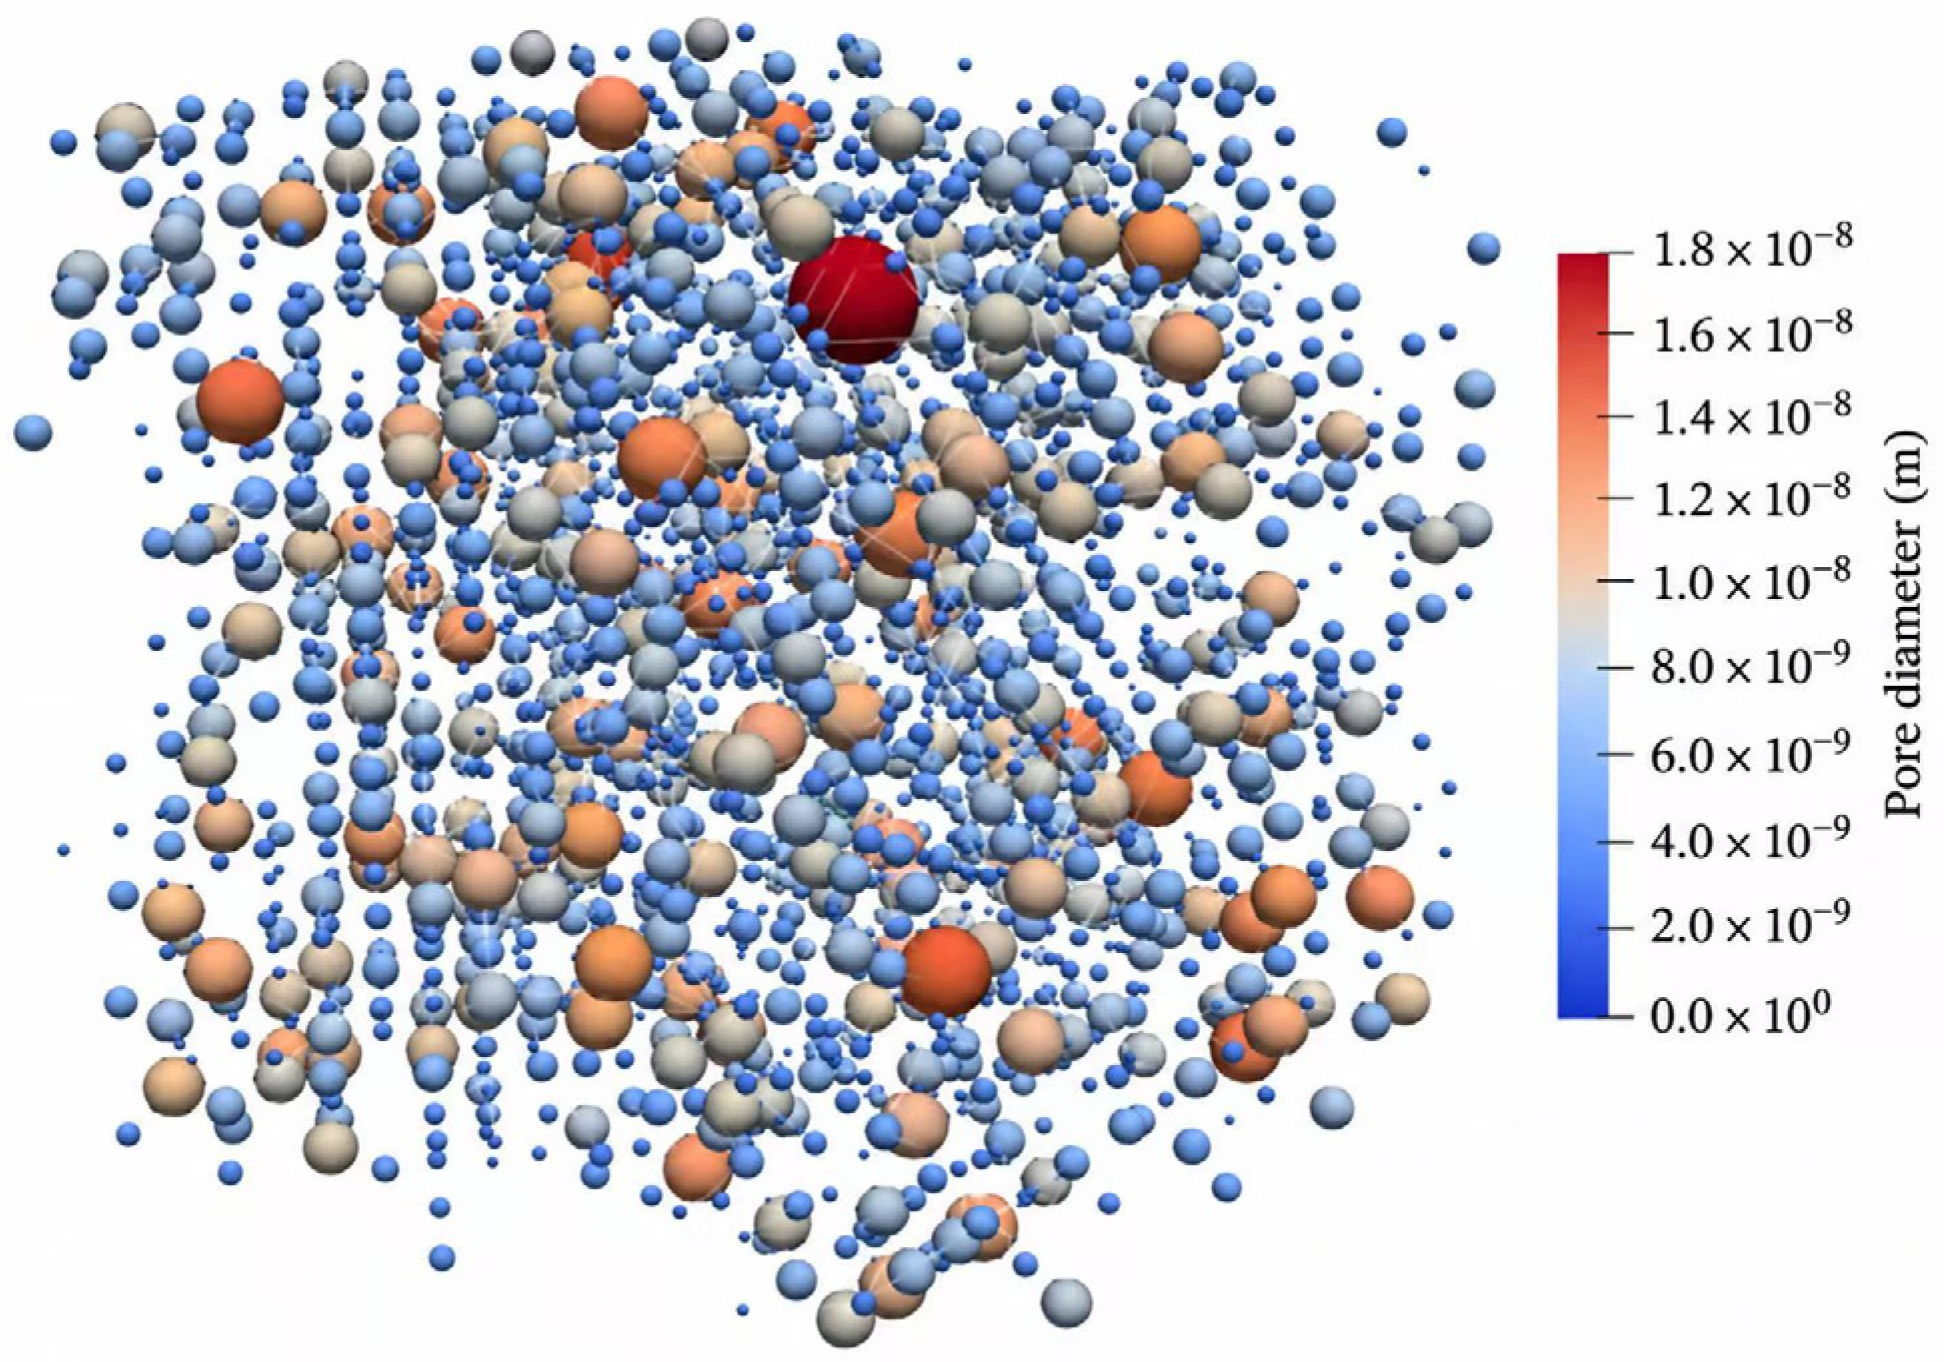
The fixed-reference stochastic calculation uses a 70 × 70 × 70 nearest-neighbour cubic lattice. The nominal lattice contains 343,000 sites. A single predeclared random deletion sequence is applied for each seed, while the inlet and outlet planes remain fixed. The target mean coordination number is z = 4. The pore-centre spacing is 16.67 nm, giving an inlet–outlet length of 1150.23 nm for N = 70. Pore diameters are sampled independently from the shifted Weibull distribution, and each throat diameter is 0.25 times the smaller adjacent pore diameter. The pressure levels were set as follows: the pressure-response curves use 0.5–7.5 MPa, the structural comparisons use 1.5, 3.5, 5.5, and 7.5 MPa, and the N = 70 stochastic ensemble uses 3.5 MPa. The concentration boundaries are cin = 1 mol m−3 and cout = 0 mol m−3 with zero lateral normal flux. The resulting network is shown in Figure 3. The fixed-reference parameters are summarized in Table 1.
Figure 3.
Conceptual pore-scale network of the coal matrix.
Table 1.
Reference simulation parameters.
The reference distribution uses t0 = 4 nm, λ = 5 nm, and β = 2. The Weibull variable is the physical pore diameter d in nm; t0 and λ are the location and scale parameters in the same units, whereas β is dimensionless. Diameters are generated independently by inverse-transform sampling of Equation (15). Each throat has circular-equivalent diameter dt,ij = 0.25 min(di,dj) and length lij = sij, where sij is the pore-centre separation. Throat volume and capillary entry pressure use this equivalent diameter consistently.
Here, d, t0 and λ are expressed in nm, whereas β is dimensionless.
2.5. Model Validation
The Pittsburgh and Madrid methane-diffusion pressure series reported by Smith and Williams [3] provide five observations per coal (Table 2). For each series, a fixed network representation is combined with a coal-specific local transport relation. Three observations are used for calibration, and two higher-pressure observations are withheld for comparison.
Table 2.
Experimental pressure-dependent methane diffusivities for Pittsburgh and Madrid coal [3].
A local diameter dependence is motivated by the Knudsen limit, in which wall collisions yield a diffusivity proportional to diameter at fixed temperature. Bulk-gas diffusion has an approximately inverse pressure dependence, and a linear pressure term provides a local approximation over a bounded interval. Yang and Liu [20] combined Knudsen and bulk contributions in their treatment of coal diffusion. Adsorption, loading, and coal chemistry also affect molecular mobility in nanometre pores [11,12], as illustrated by the self-diffusivities in Table 3. The reference local coefficient is given by Equation (4).
Table 3.
Molecular-simulation self-diffusivities for different coal representations.
For Pittsburgh coal, the calibration pressures are approximately 0.11, 0.15, and 0.21 MPa, and the withheld pressures are 0.35 and 0.52 MPa. For Madrid coal, the corresponding sets are 0.09, 0.12, and 0.17 MPa and 0.23 and 0.33 MPa. The two withheld observations for each coal assess the calibrated model at pressures above the calibration interval. Mean relative error (MRE) is used here to denote mean absolute relative error, calculated as follows:
In Equation (16), Dcalc,i and Dexp,i are the calculated and experimental coefficients at the same condition. N = 3, 2, and 5 for the calibration, withheld, and pooled subsets, respectively, for each coal. For the correlation–simulation comparison, Dexp,i is replaced by Dsim,i and N = 160.
2.6. Sensitivity Analysis
The one-factor-at-a-time analysis uses CN = 2, 3, 4, 5, and 6; Weibull location t0 = 2, 3, 4, 5, and 6 nm; scale λ = 2, 3, 4, 5, and 6 nm; and shape β = 1.0, 1.5, 2.0, 2.5, and 3.0. All structural sweeps use the 70 × 70 × 70 reference lattice. The fixed-reference stochastic calculation uses z = 4, p = 3.5 MPa, t0 = 4 nm, λ = 5 nm and β = 2, as stated in Table 1. Pressure-response curves contain 40 points between 0.5 and 7.5 MPa, and structural cross-sections are evaluated at 1.5, 3.5, 5.5, and 7.5 MPa. The location-parameter sweep additionally uses t0 = 1.2, 2.2, 3.2, 4.2, and 5.2 nm. Saturation is evaluated along the discrete invasion sequence from Sw = 1 to 0 under λ = 5 nm, t0 = 4 nm, β = 2, and p = 0.5 MPa.
Each sweep changes one control parameter within the specified network family. Varying a Weibull parameter changes the diameter statistics and the prescribed local conductance, whereas varying CN changes topology. The experimental pressure series were used for coal-specific calibration, whereas the structural sweeps were used to examine parameter trends within the specified network family.
The calculation follows the OpenPNM v3.6.4 network and transport framework [43]. A seeded generator constructs the topology and pore diameters. Throat geometry defines the conductance matrix and capillary-entry sequence. Gas occupancy is updated by invasion percolation, Sw is computed from the occupied volumes, and an inlet–outlet connectivity search selects conducting elements. The steady nodal problem is solved with SciPy v1.18.1 sparse direct factorization. A realization is retained when the concentration solution is finite, the inlet flux is positive, the domain length is positive, and the cross-sectional area is valid. The same checks are used for the N = 70 ensemble.
2.7. Independent Realizations and Network-Size Test
To quantify variability caused by random network generation, we evaluated the initial lattice side lengths N = 10, 30, 50, and 70, with 50 independent seeds at each size. The fixed-reference calculation used N = 70, z = 4, p = 3.5 MPa, t0 = 4 nm, λ = 5 nm, β = 2, and a throat factor of 0.25. The same seed indices 0–49 were used at all four sizes. The two-sided 95% confidence interval for the mean was calculated from the sample standard deviation.
The size test and the fixed-reference ensemble were analysed separately under fixed reference settings.
3. Results
3.1. Calibration and Withheld Pressure-Series Checks
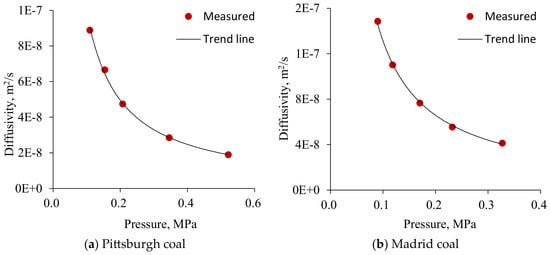
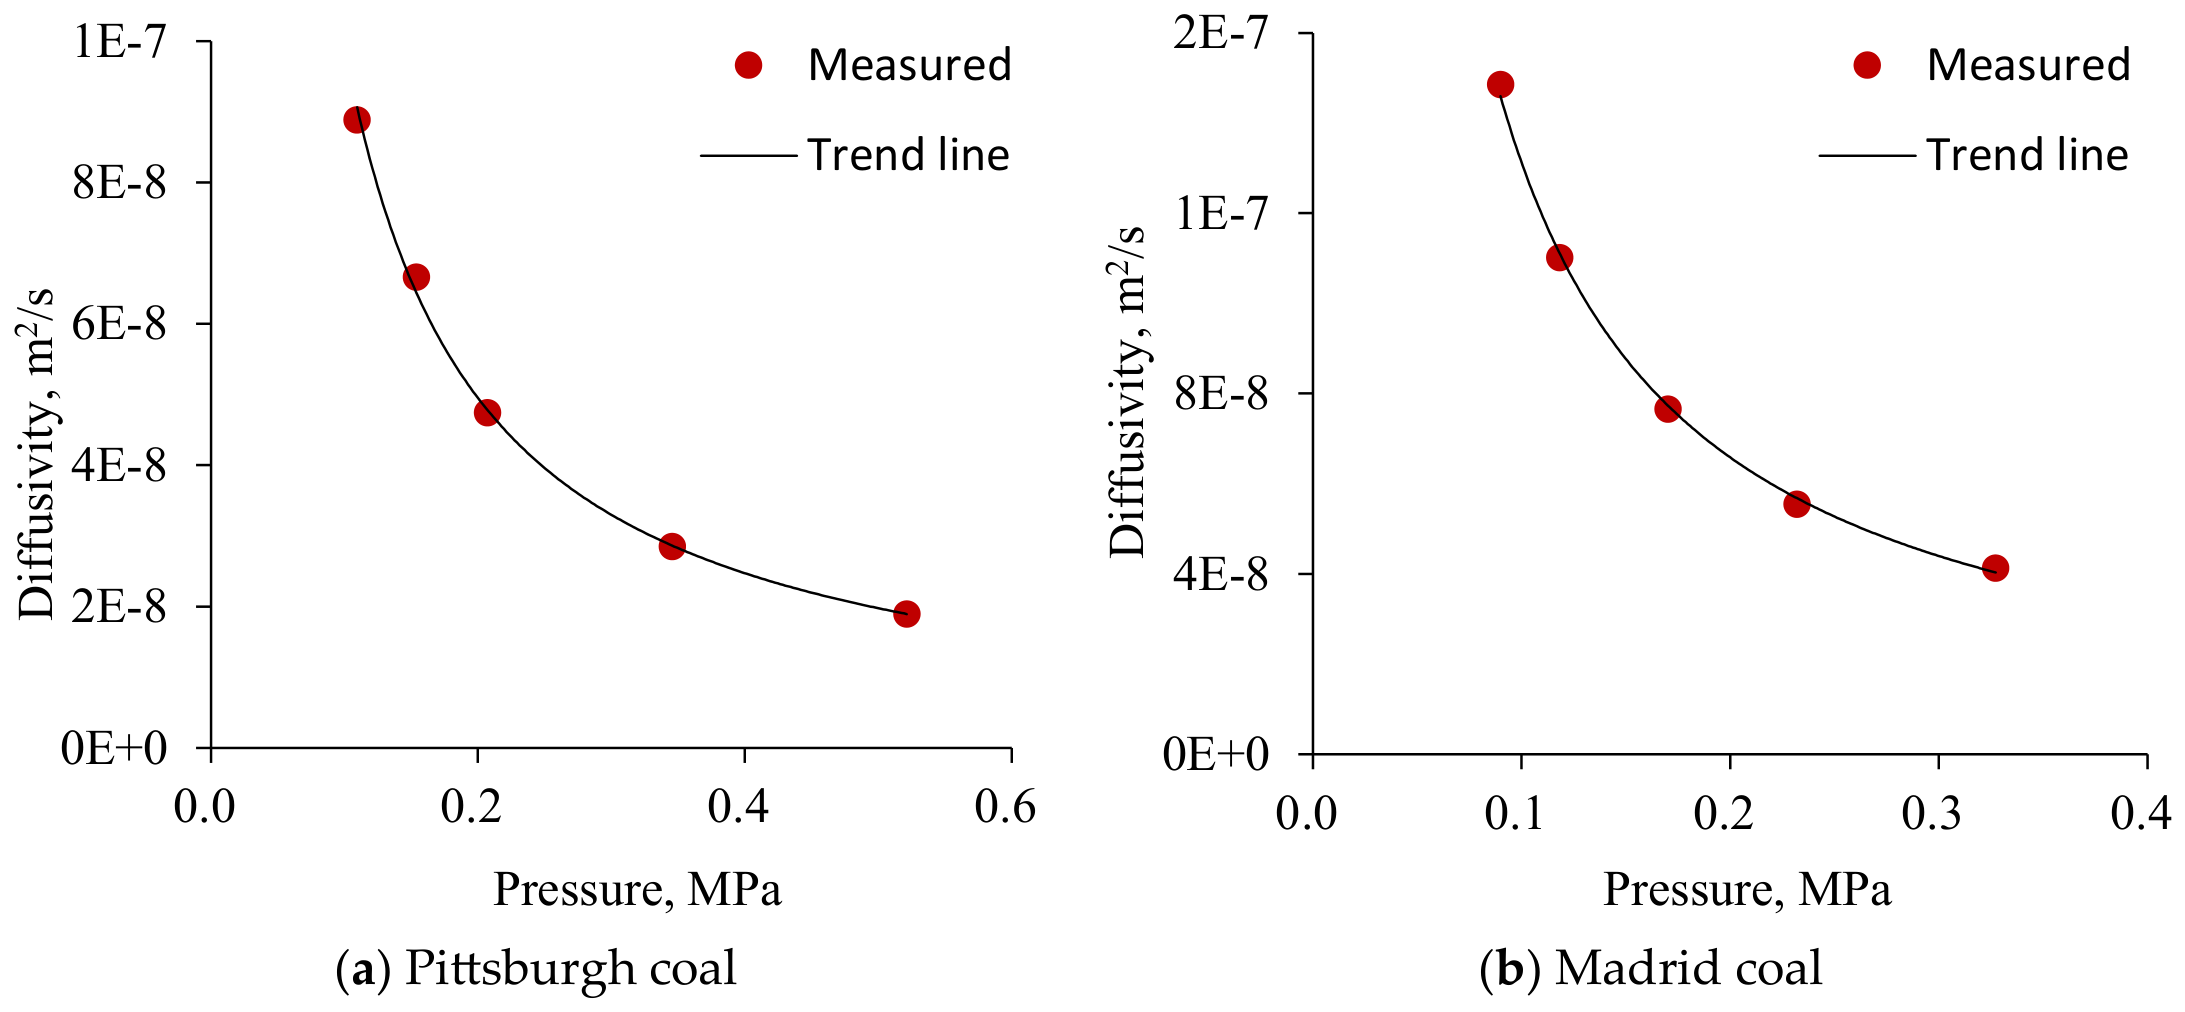
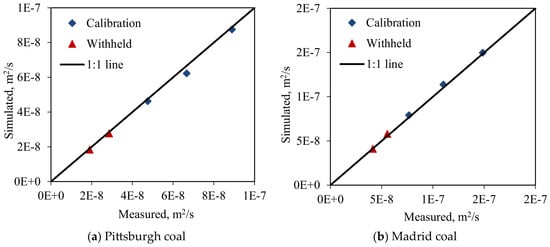
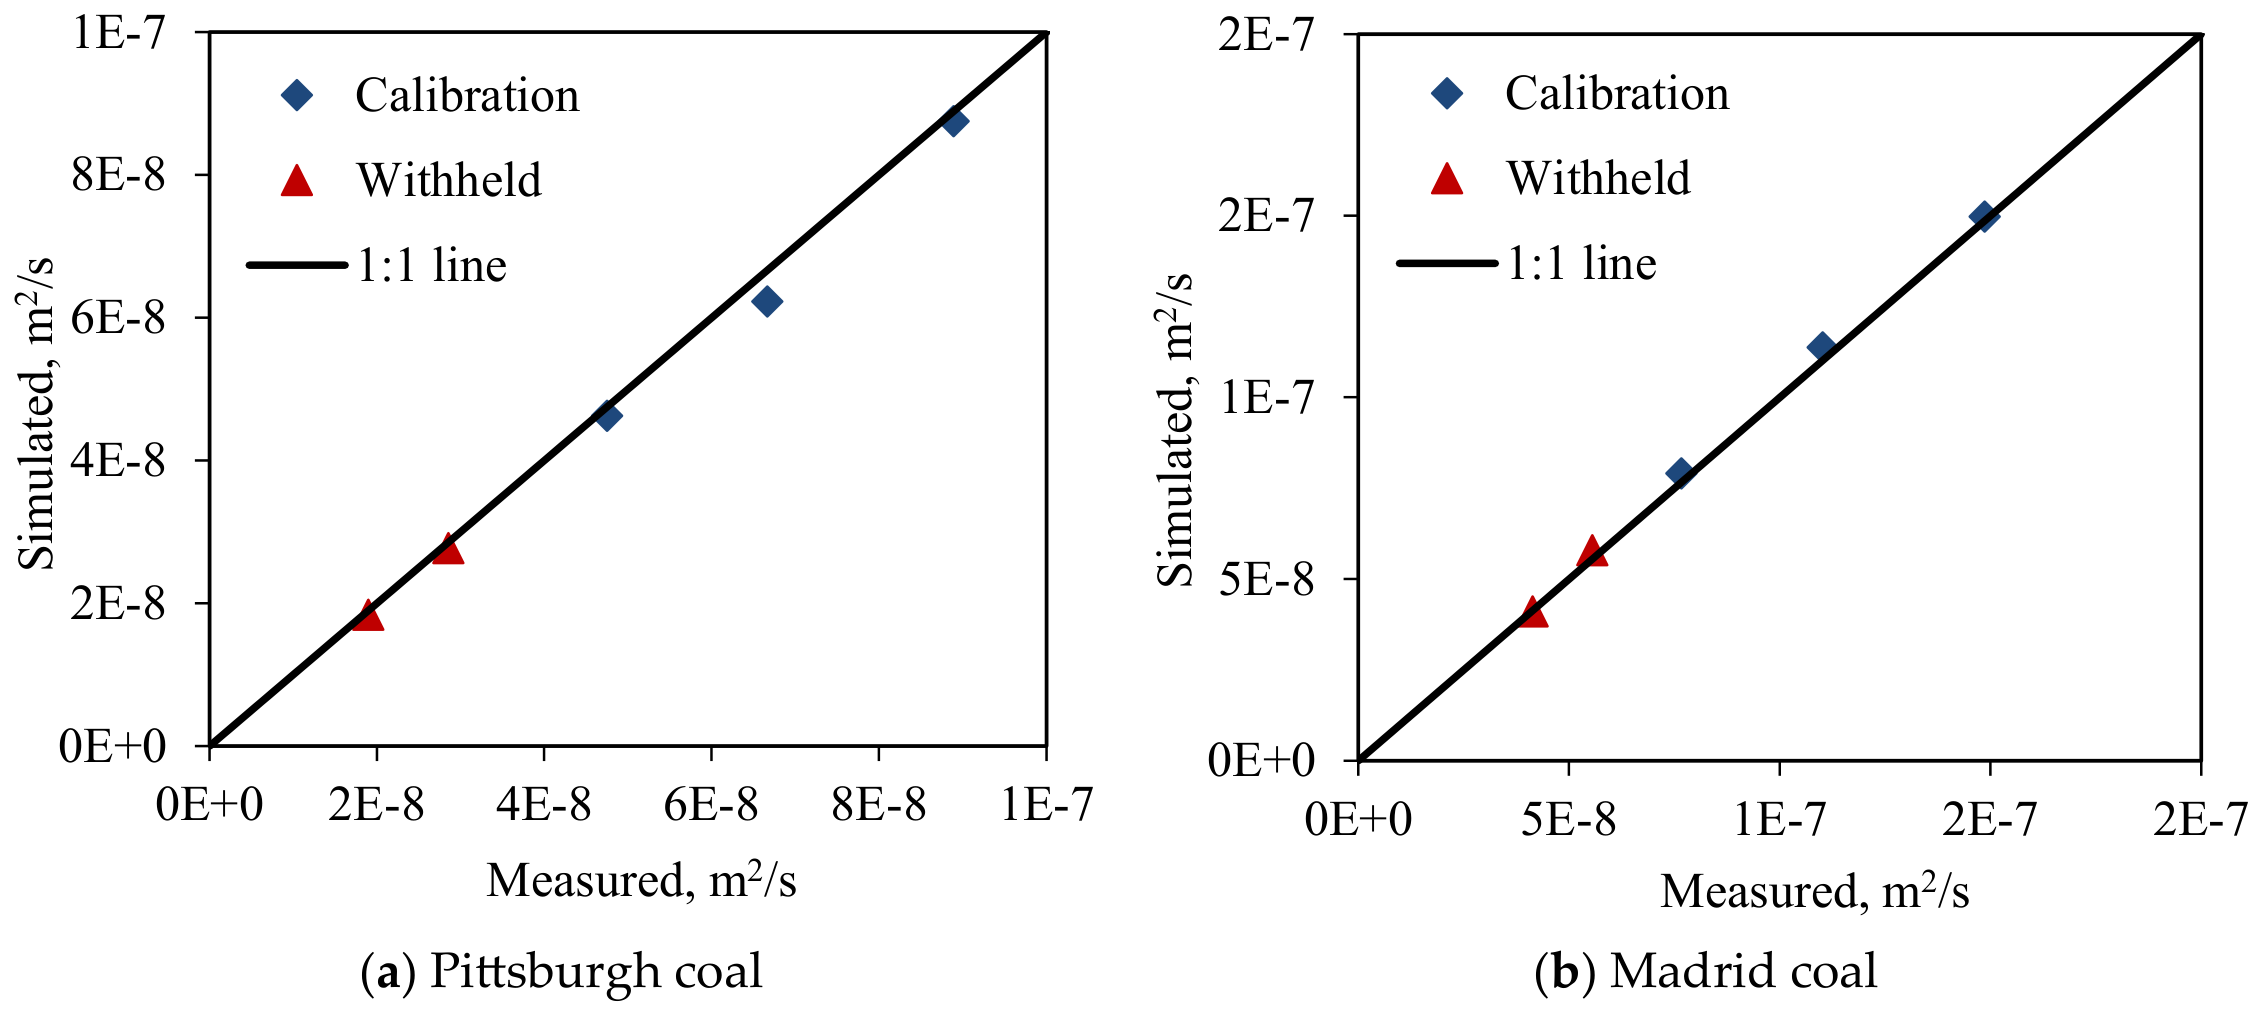
Both experimental series show decreasing diffusivity with increasing pressure (Figure 4). A fixed network with a coal-specific local transport relation captures this trend. Figure 5 compares the three calibration points and the two withheld points for each coal.
Figure 4.
Measured methane effective diffusivity De (m2 s−1) versus pressure p (MPa) for (a) Pittsburgh and (b) Madrid coal [3]; five observations are shown for each coal.
Figure 5.
Simulated versus measured effective diffusivity De (m2 s−1) for (a) Pittsburgh and (b) Madrid coal [3]. Each panel contains three calibration and two withheld points. The diagonal is the 1:1 line; the pressure partition is specified in Section 2.5.
For Pittsburgh coal, MRE is 3.56% for calibration (N = 3), 2.89% for the withheld points (N = 2), and 3.29% across all five observations. For Madrid coal, the corresponding values are 2.49%, 2.49%, and 2.49%. The withheld observations extend each comparison to pressures above the calibration interval.
Random Realization and Network-Size Tests
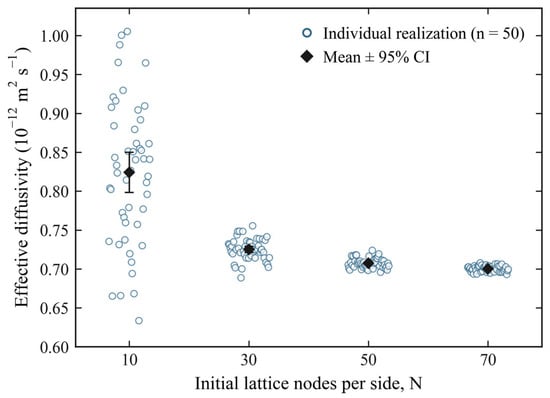
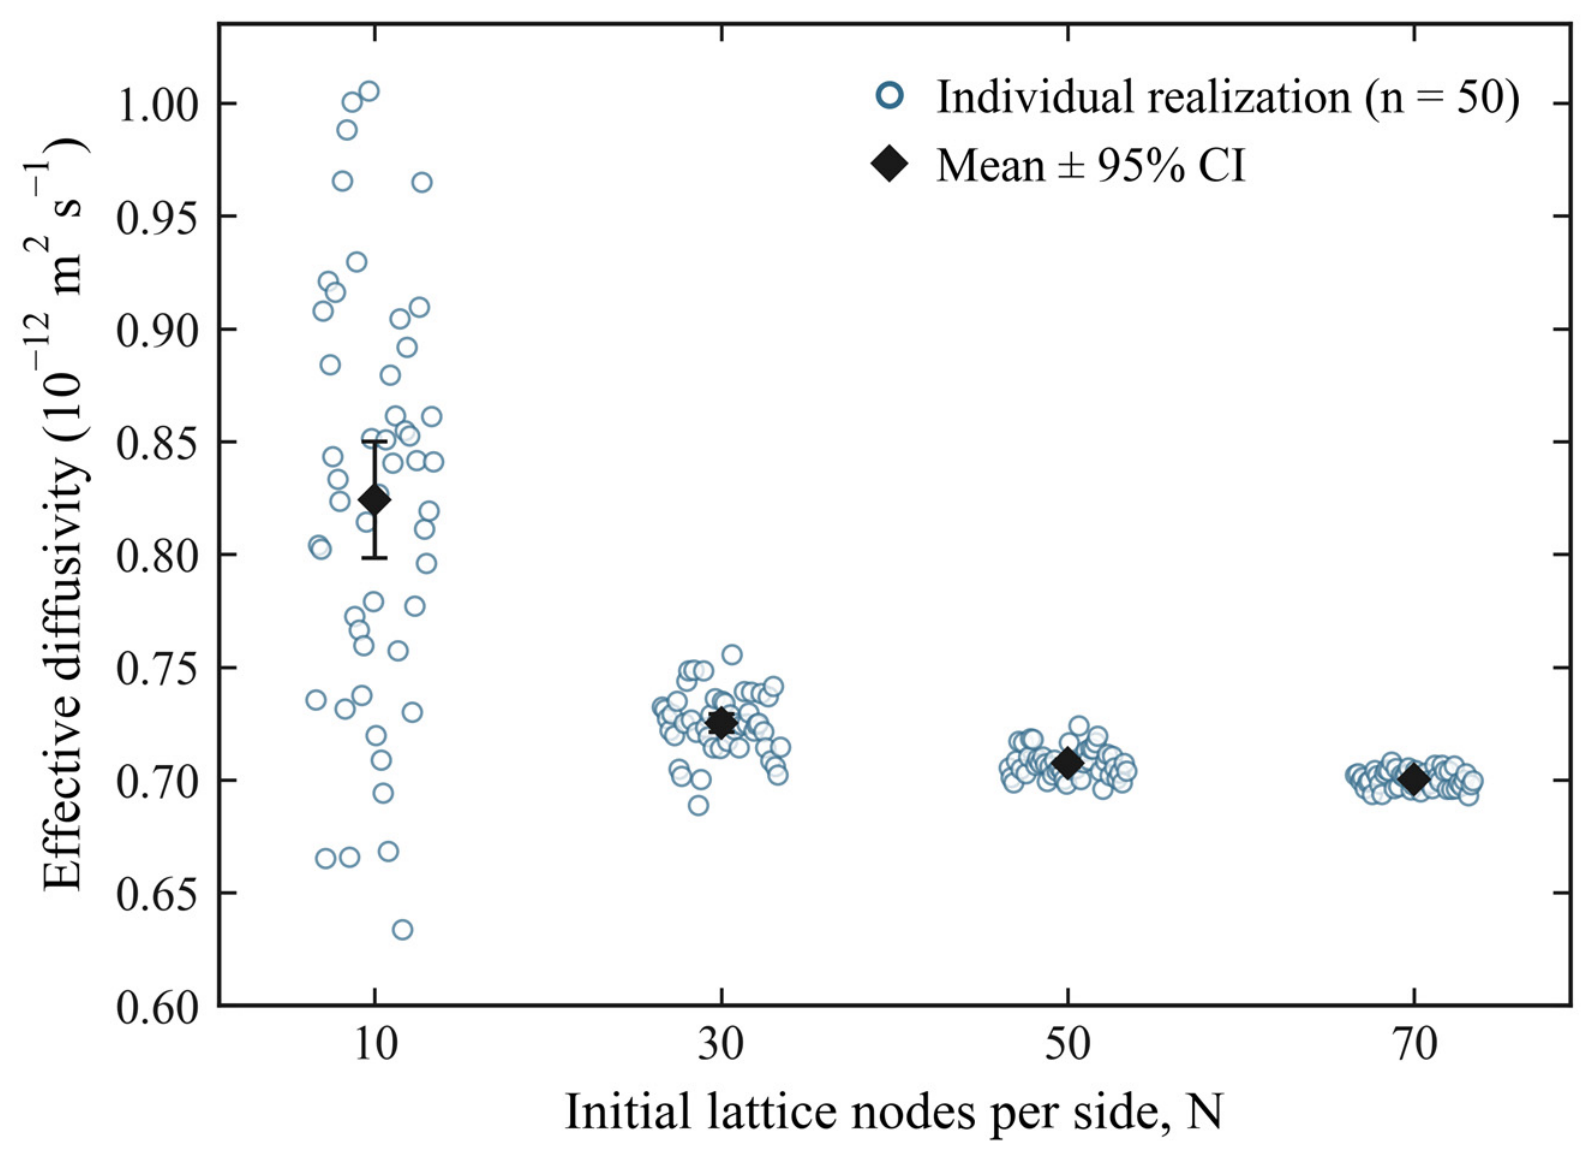
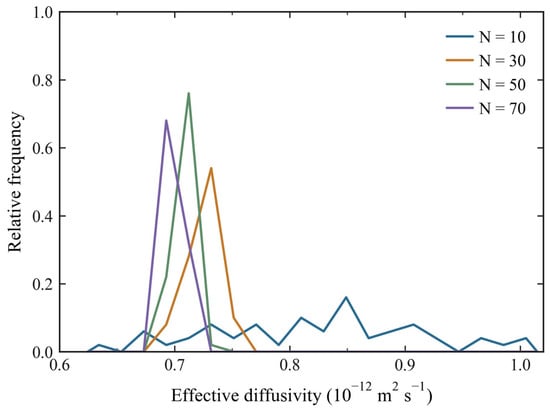
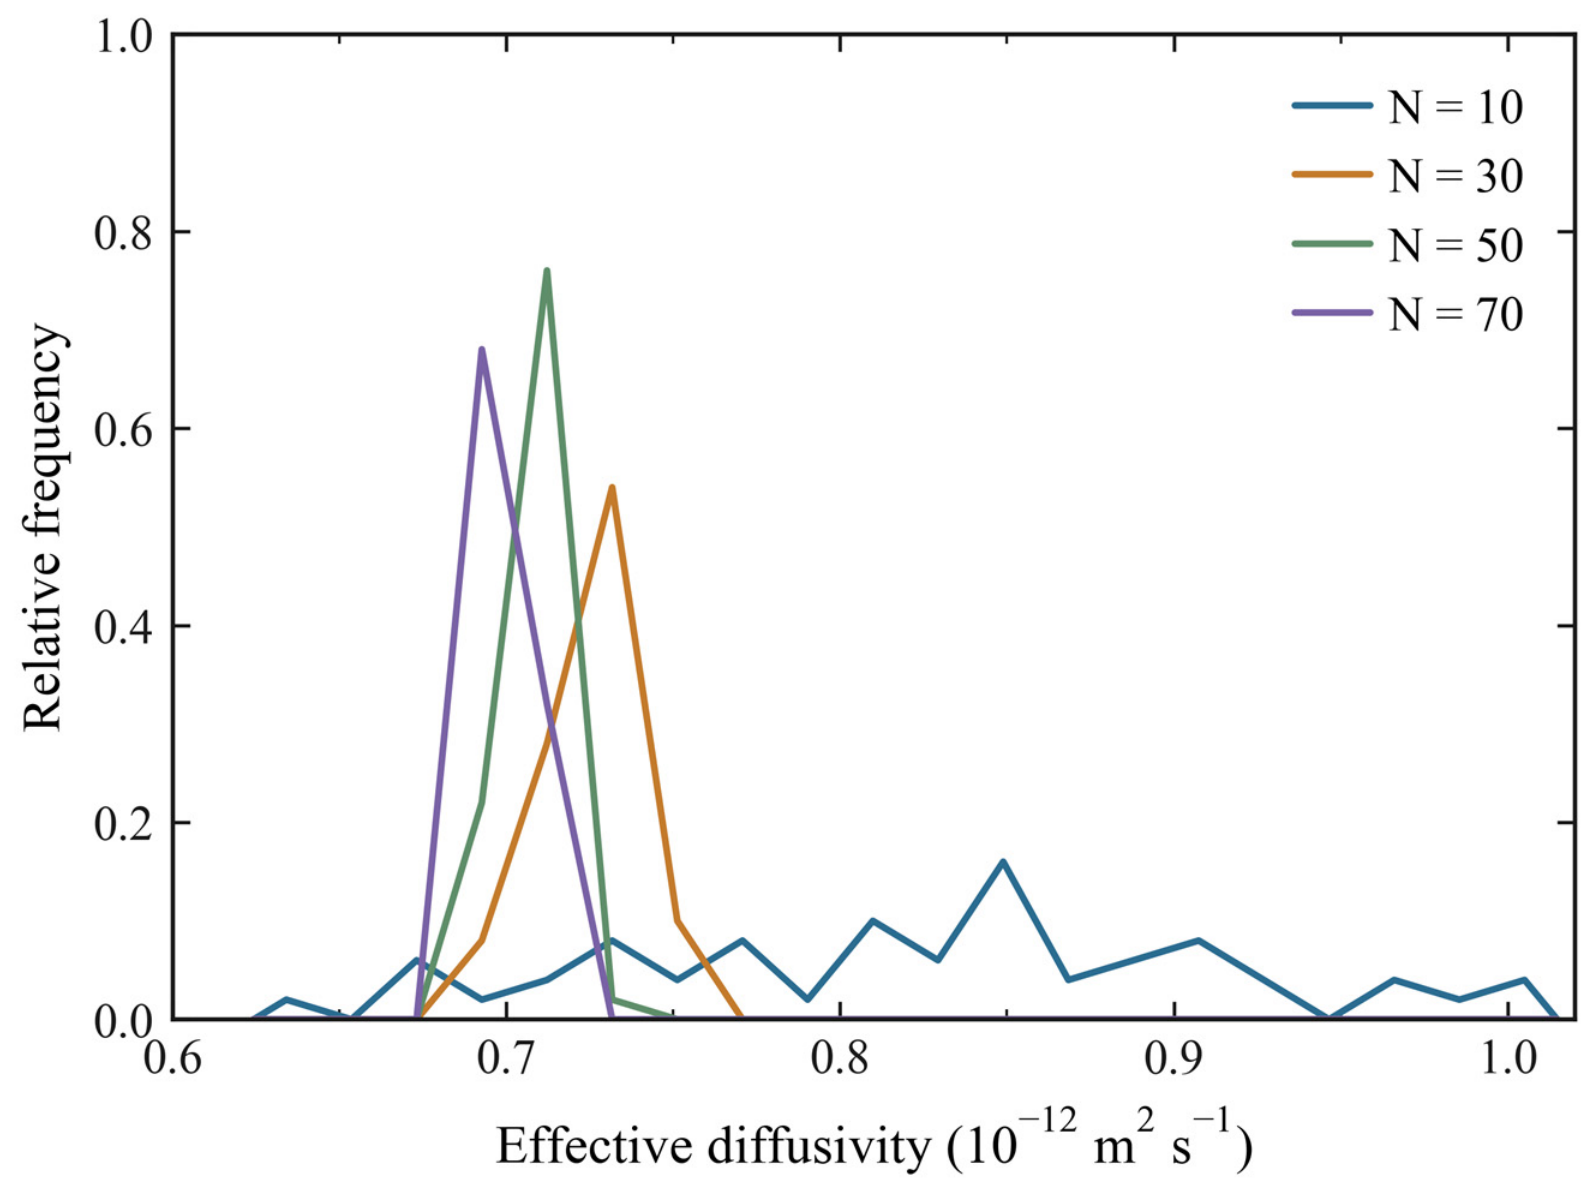
The network-size test used N = 10, 30, 50, and 70 with 50 independent realizations at each size (Figure 6). In units of 10−12 m2 s−1, the mean effective diffusivities were 0.82404, 0.72523, 0.70748, and 0.70039, with coefficients of variation of 11.03%, 1.90%, 0.90%, and 0.54%, respectively. The corresponding two-sided 95% confidence intervals for the mean were [0.79821, 0.84987], [0.72132, 0.72915], [0.70567, 0.70928], and [0.69932, 0.70146].
Figure 6.
Effective diffusivity for 50 independent realizations at initial lattice side lengths N = 10, 30, 50, and 70. Open circles show individual realizations; diamonds show means with two-sided 95% confidence intervals.
Figure 7 shows the empirical relative-frequency curves for the same 50 seed-indexed realizations at each lattice size on a common bin grid. The distribution narrows as N increases, consistent with the reduced realization-to-realization variability shown in Figure 6.
Figure 7.
Empirical relative-frequency curves of effective diffusivity for 50 independent realizations at N = 10, 30, 50, and 70. Curves use a common bin grid and relative-frequency normalization.
3.2. Structural Controls on Effective Diffusivity
3.2.1. Coordination Number
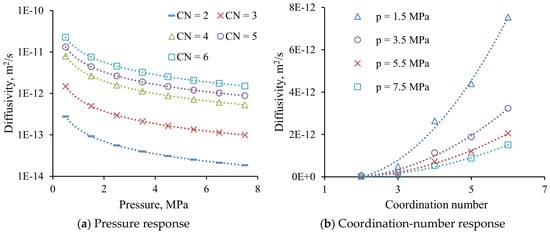
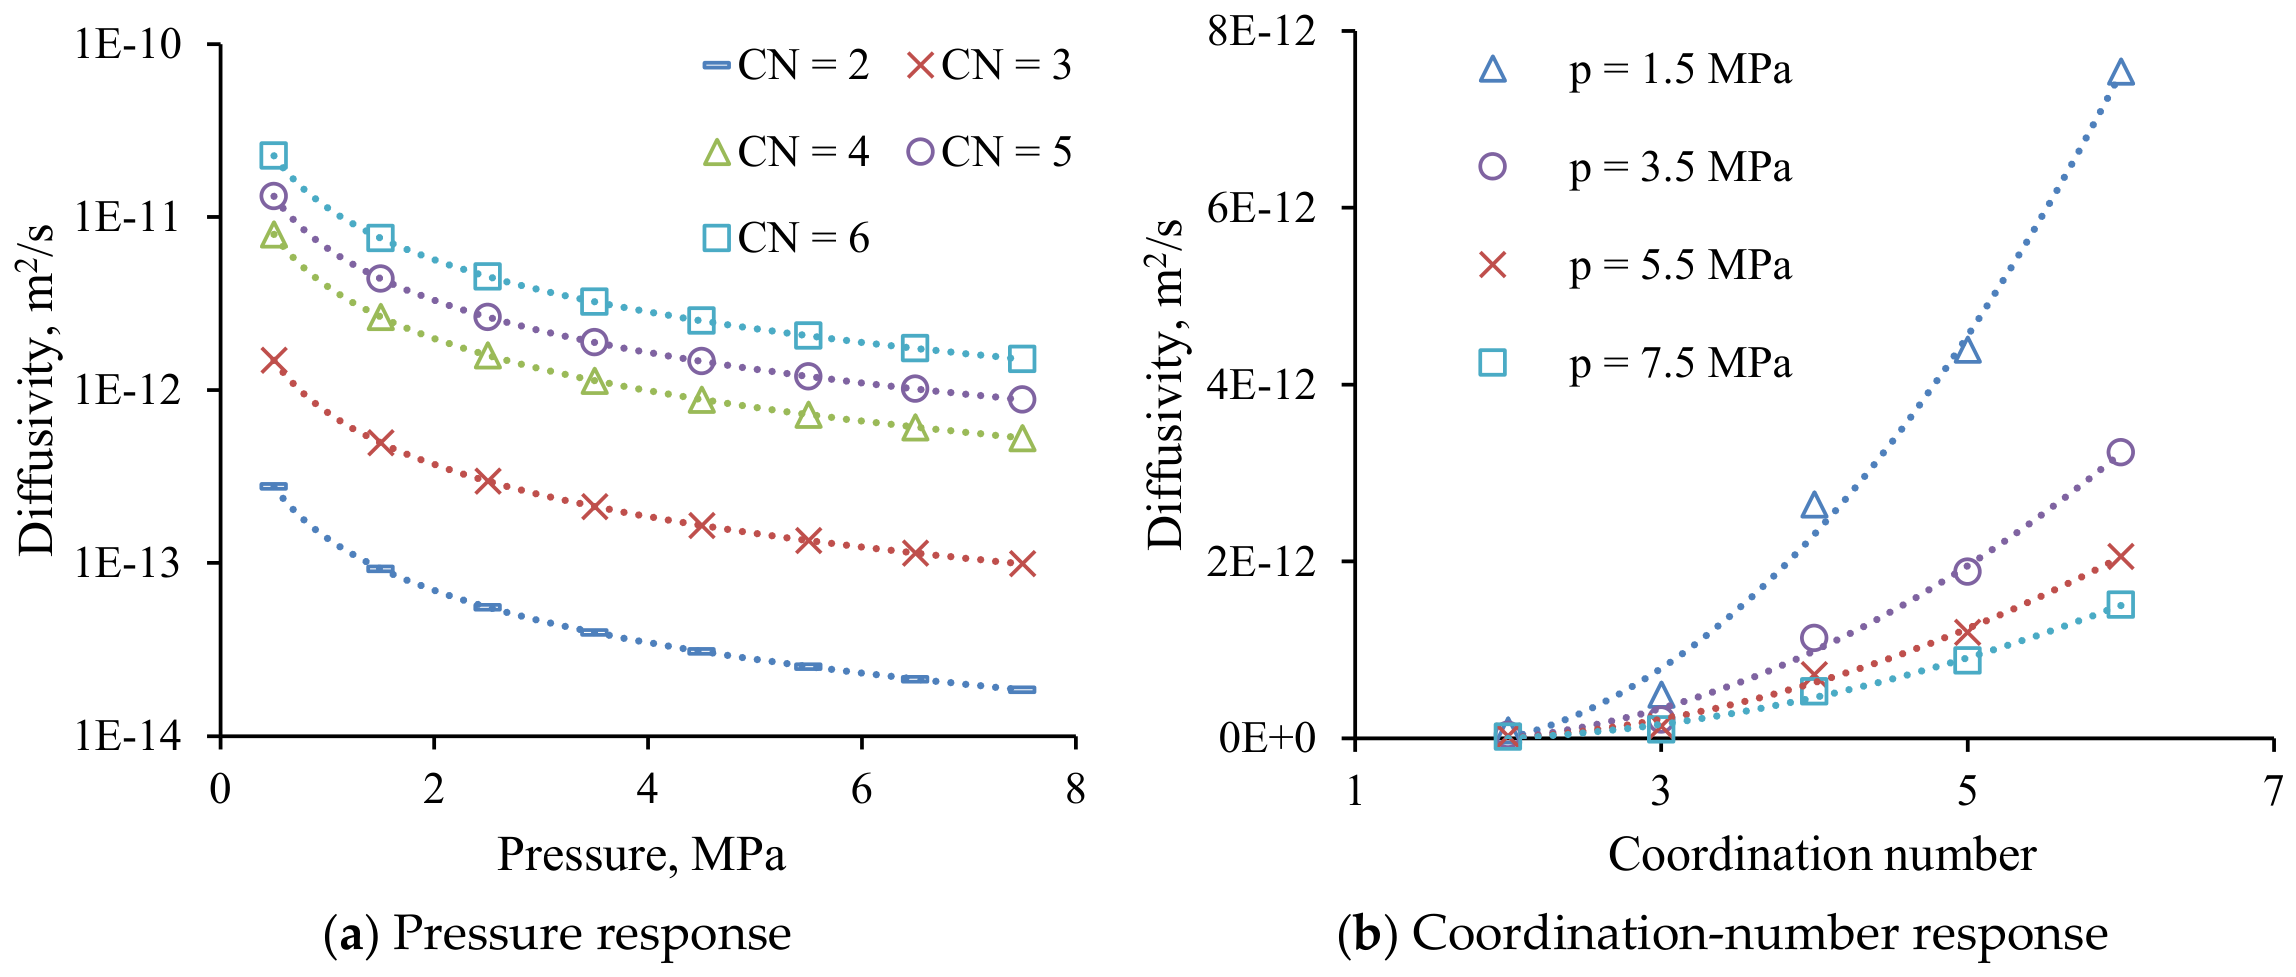
Mean coordination number describes pore connectivity. A higher coordination number supplies more parallel routes between the inlet and outlet and reduces the probability that one low-conductance throat controls the spanning pathway. Consequently, the calculated effective diffusivity increases with coordination number within the investigated network configurations (Figure 8). Pressure reduces the coefficient along each structural curve, but it does not reverse the ranking among networks. The result indicates that porosity alone may be insufficient to describe transport capacity because networks with similar pore volume can behave differently when their connectivity differs.
Figure 8.
Effective diffusivity De (m2 s−1) versus (a) pressure p = 0.5–7.5 MPa for mean coordination numbers CN = 2, 3, 4, 5, and 6 and (b) CN at p = 1.5, 3.5, 5.5, and 7.5 MPa. CN is dimensionless.
3.2.2. Weibull Location Parameter
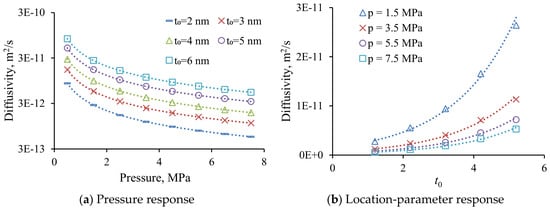
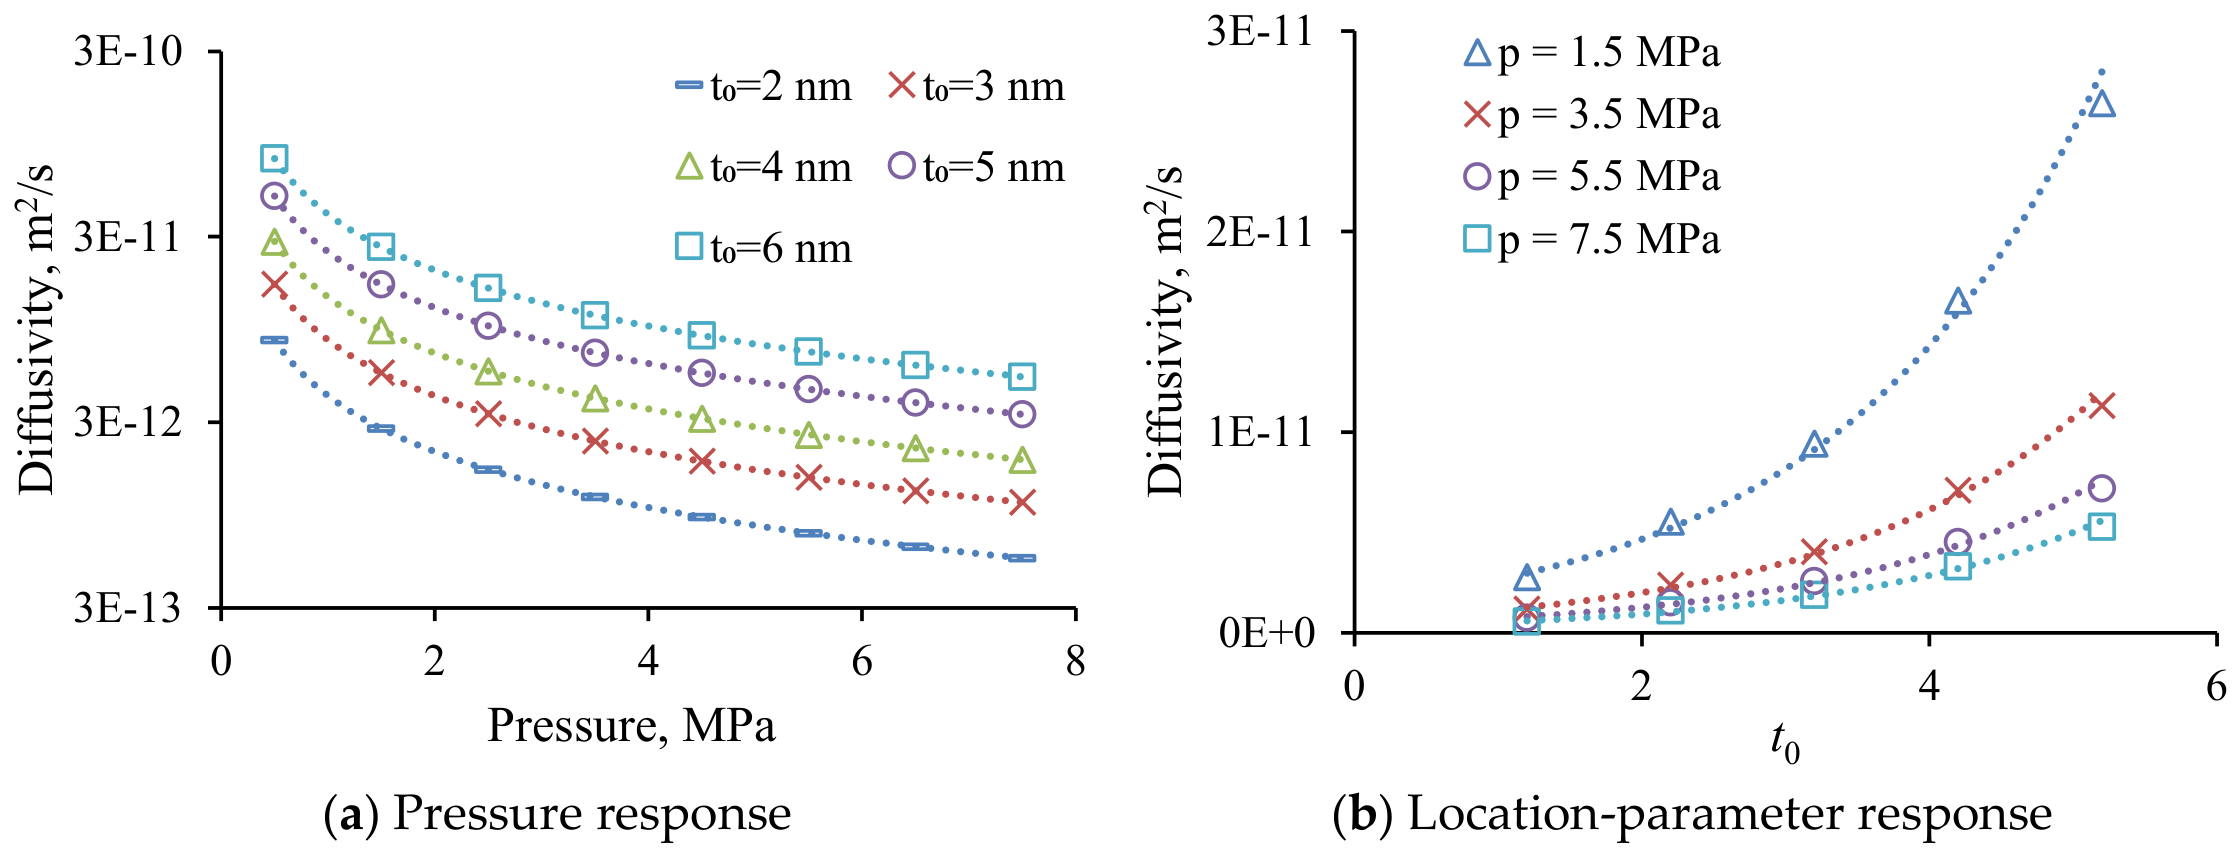
The location parameter controls the lower bound of the pore-size distribution. Increasing this parameter shifts the pore-size distribution toward larger pores, enlarges the minimum conducting cross-section, and increases the prescribed local diffusivity. The network coefficient therefore increases strongly with the location parameter (Figure 9). The increase is approximately exponential over the investigated range, whereas the pressure response remains negative for each fixed location parameter.
Figure 9.
Effective diffusivity De (m2 s−1) versus Weibull location t0 (nm) and pressure p (MPa). (a) p = 0.5–7.5 MPa at t0 = 2, 3, 4, 5, and 6 nm. (b) t0 = 1.2, 2.2, 3.2, 4.2, and 5.2 nm at p = 1.5, 3.5, 5.5, and 7.5 MPa.
3.2.3. Weibull Scale Parameter
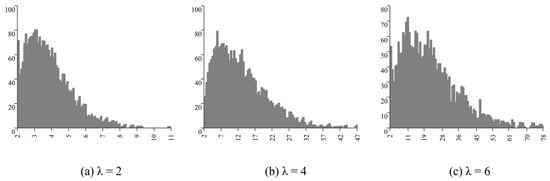
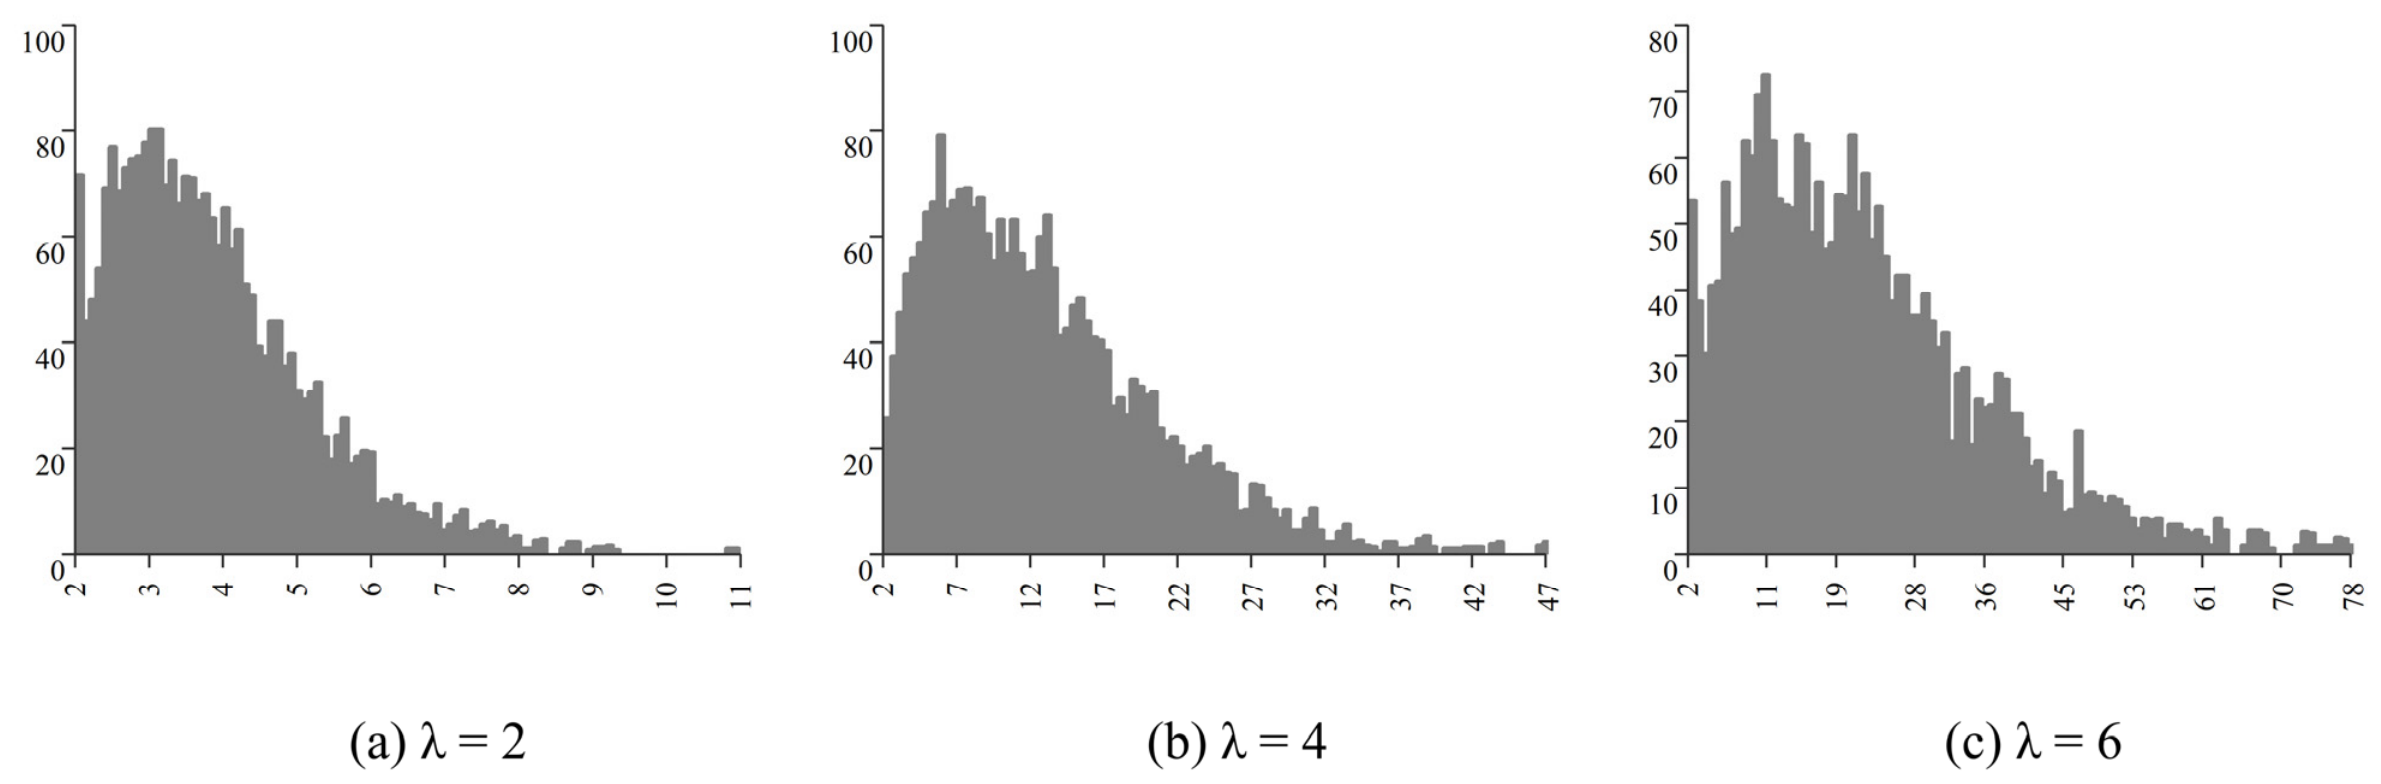
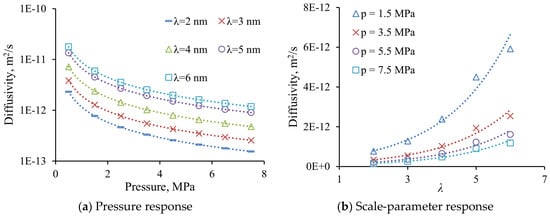
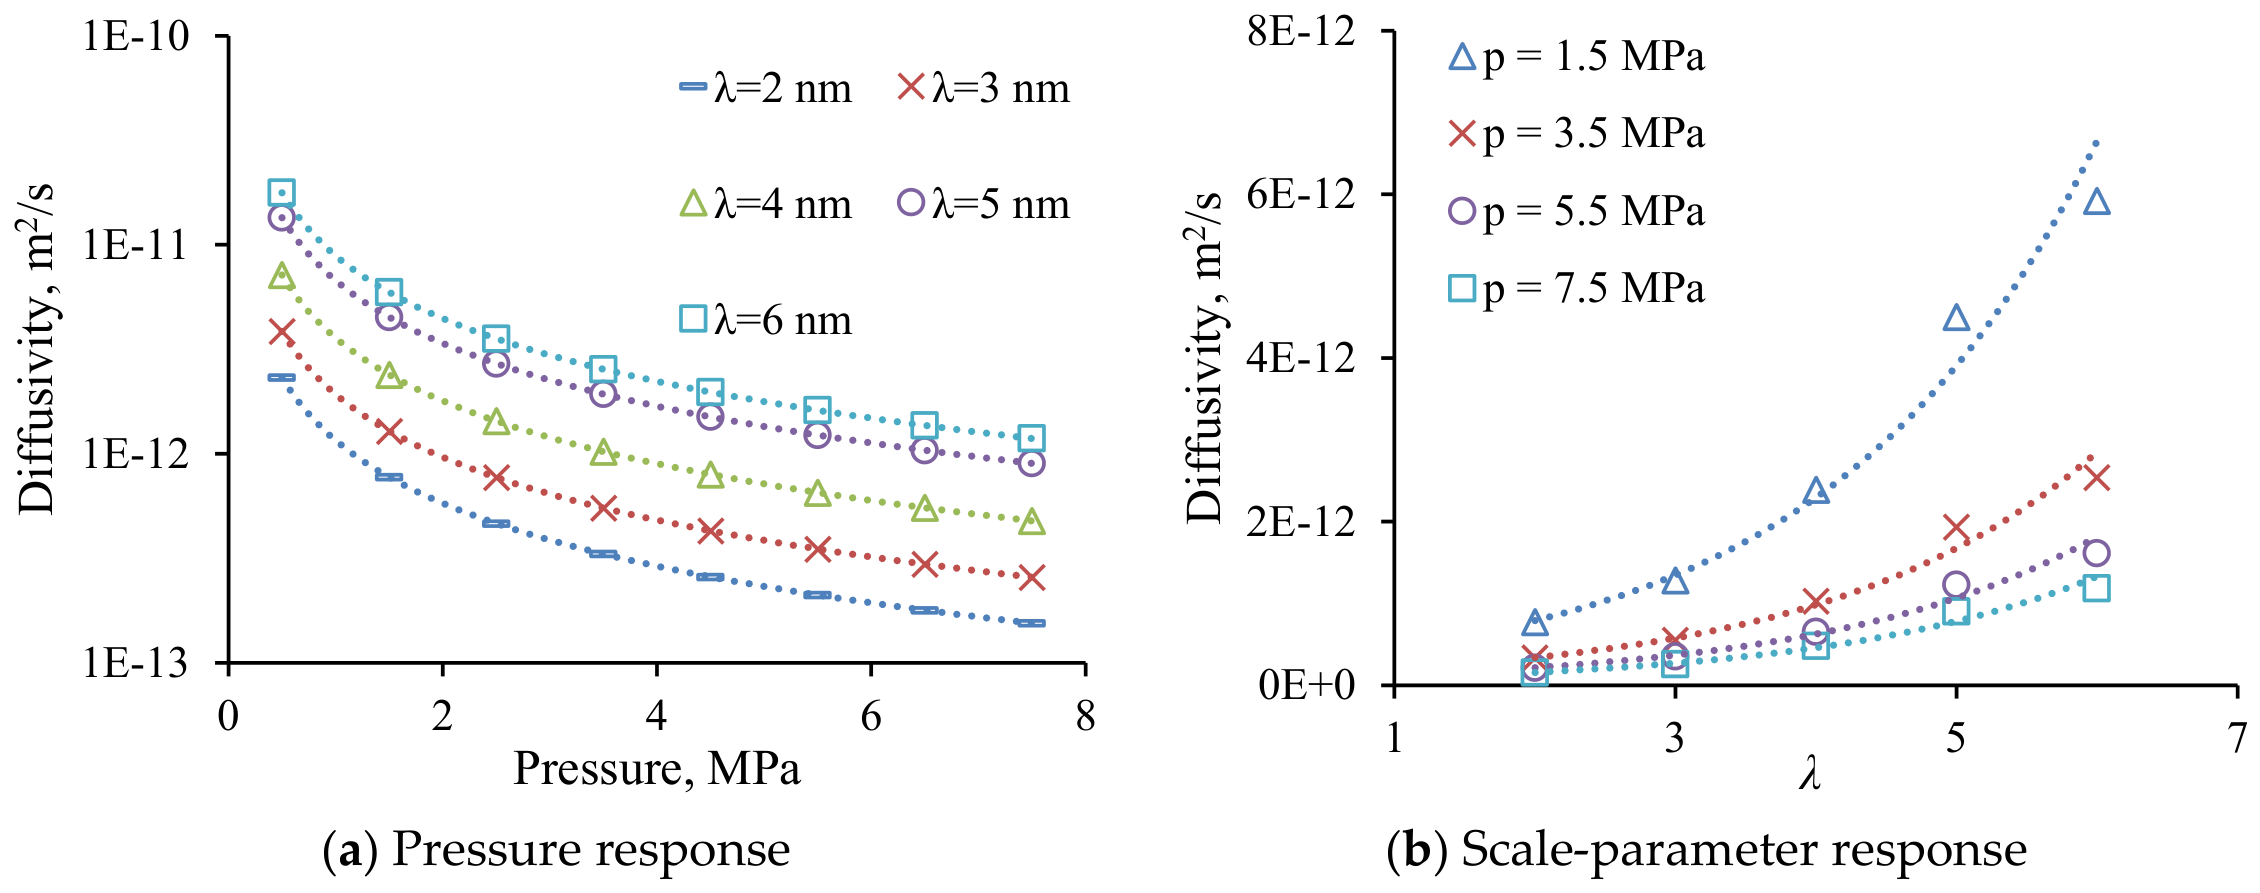
The scale parameter broadens the pore-size distribution (Figure 10), thereby increasing structural heterogeneity. A broader distribution can create both large conducting elements and narrow bottlenecks. For the tested parameter range, effective diffusivity increased with the scale parameter, reflecting the combined effects of pore geometry and the prescribed local mobility. The corresponding effective-diffusivity responses are shown in Figure 11.
Figure 10.
Statistical pore-diameter distributions at Weibull scale parameters λ = 2 nm, 4 nm, and 6 nm. The scale parameter λ is expressed in nm.
Figure 11.
Effective diffusivity De (m2 s−1) versus (a) pressure p = 0.5–7.5 MPa for Weibull scale λ = 2–6 nm and (b) λ at p = 1.5, 3.5, 5.5, and 7.5 MPa. Geometry and prescribed local mobility both change across scale settings.
3.2.4. Weibull Shape Parameter
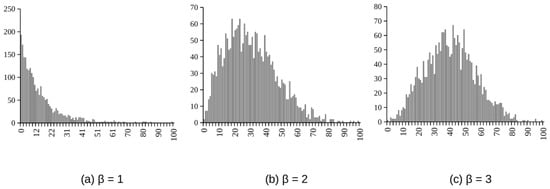
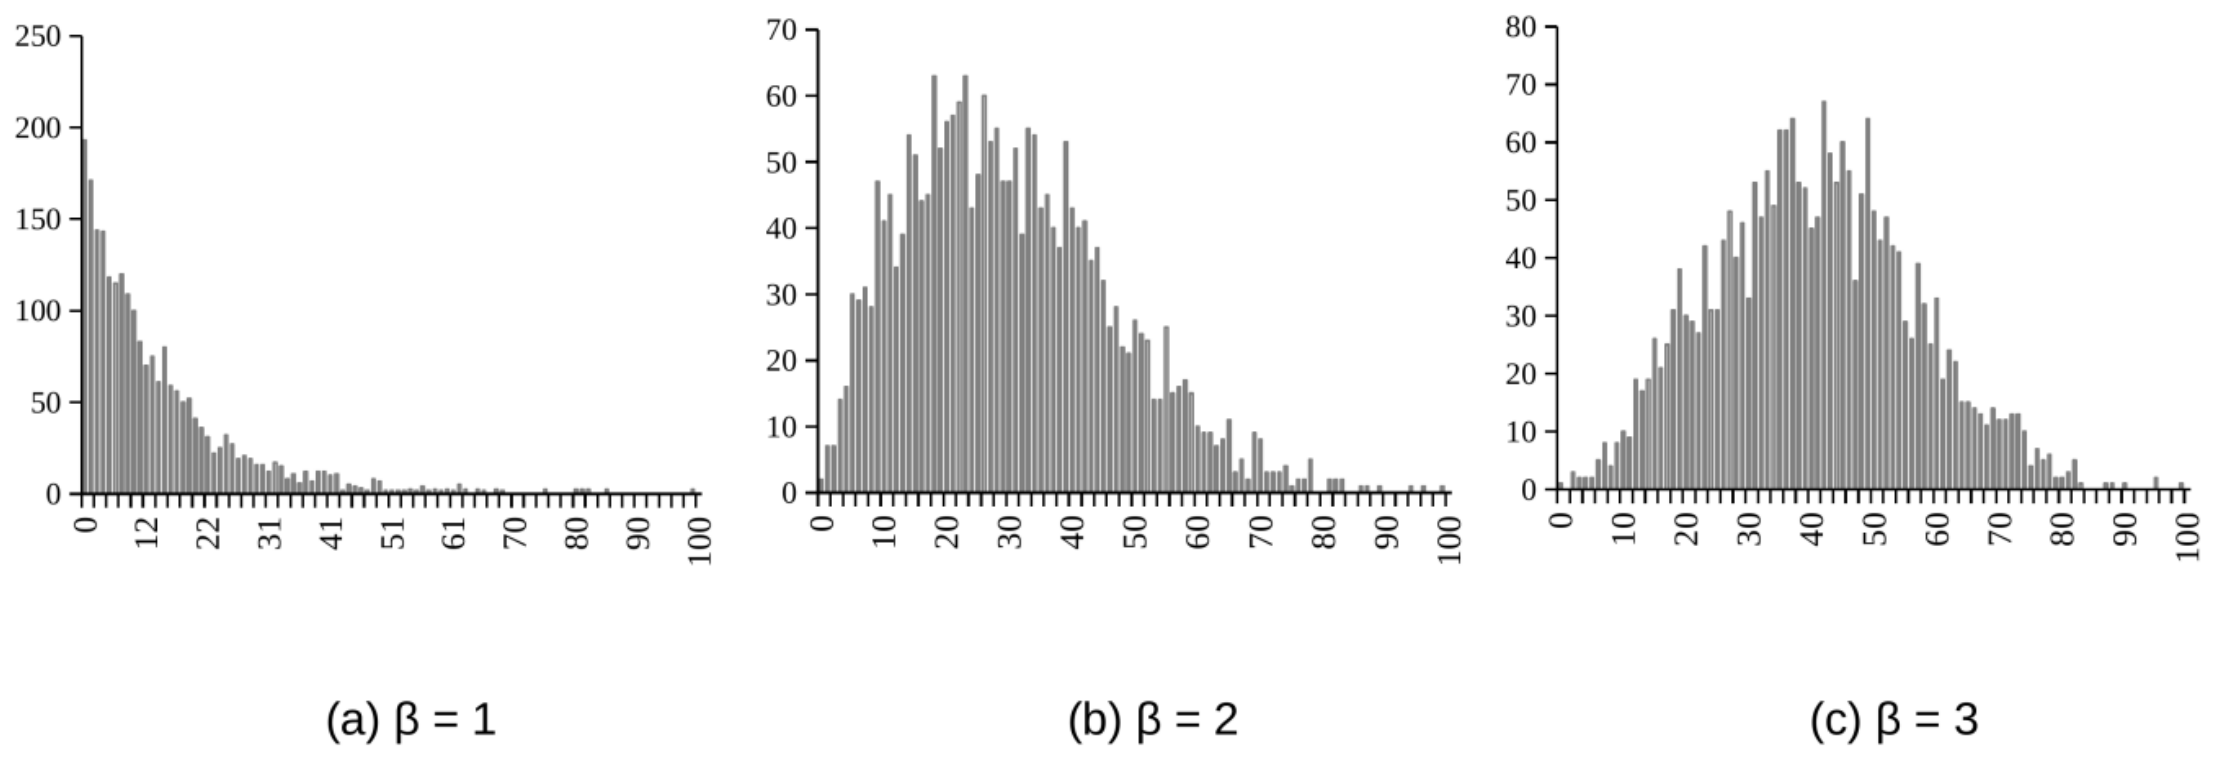
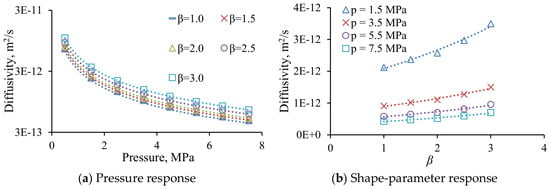
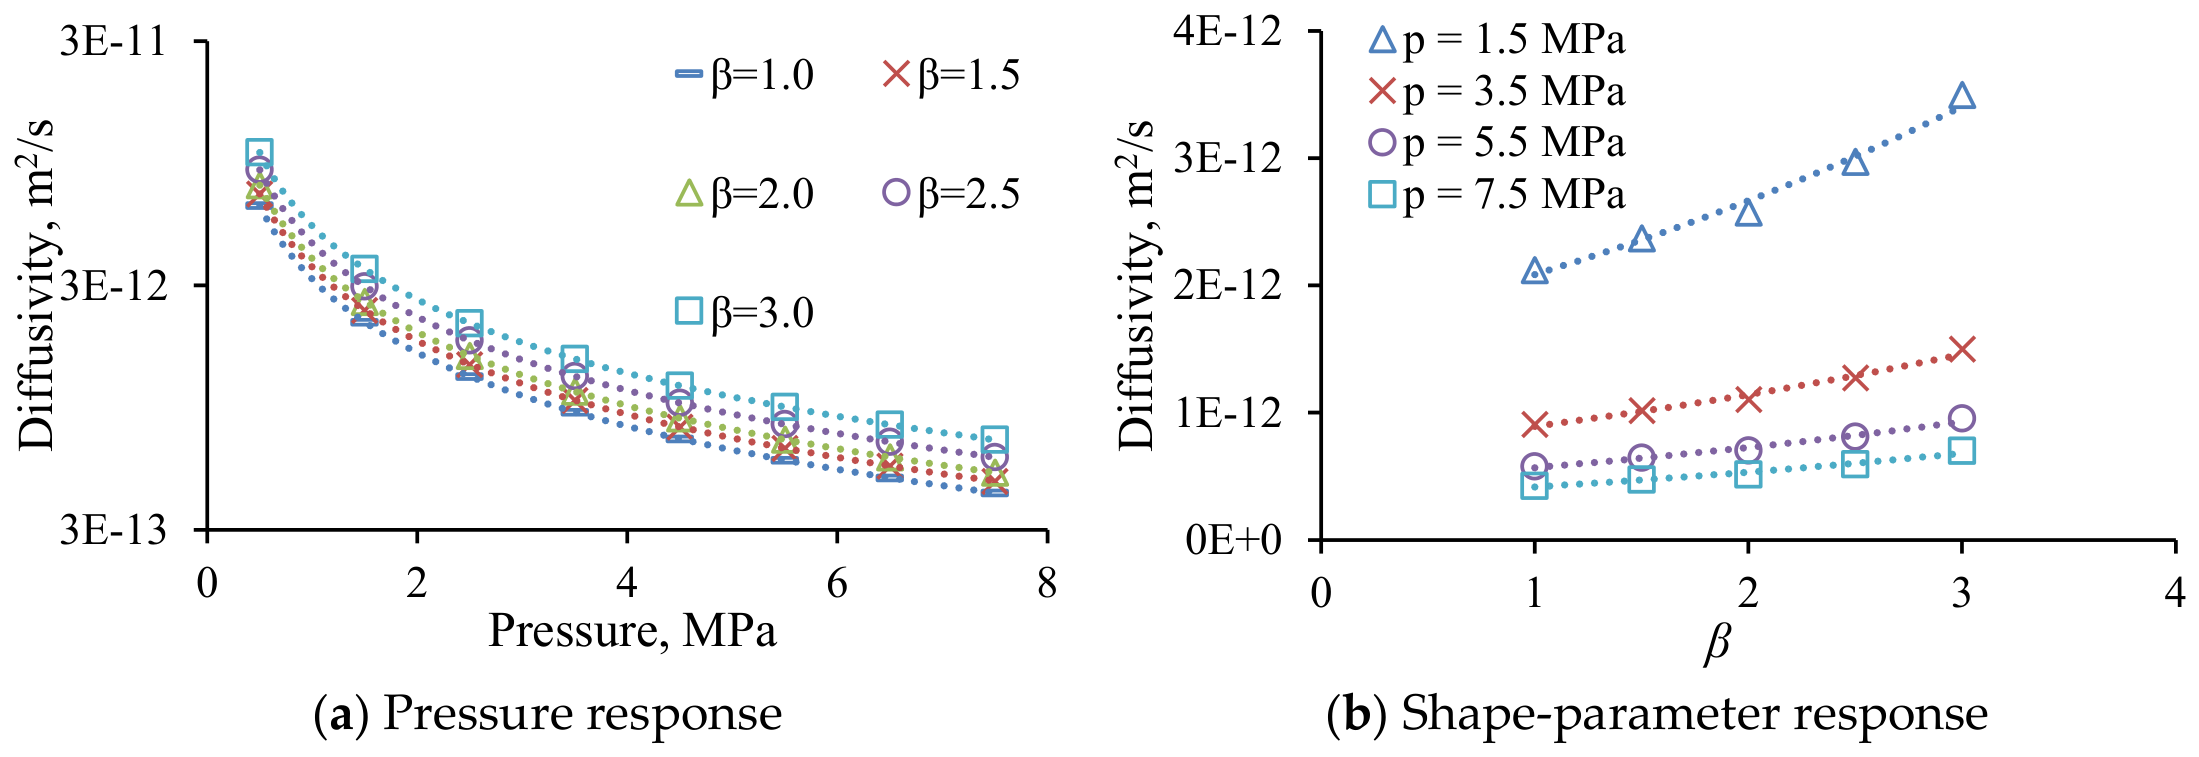
Increasing β changes the skewness and concentration of the Weibull distribution (Figure 12). The mean physical pore diameter is E[d] = t0 + λΓ(1 + 1/β). Effective diffusivity increases across the investigated shape settings (Figure 13), reflecting the combined response of network geometry and local mobility.
Figure 12.
Model pore-diameter distributions for Weibull shape parameters (a) β = 1, (b) β = 2, and (c) β = 3. The shape parameter is dimensionless and changes skewness.
Figure 13.
Effective diffusivity De (m2 s−1) versus (a) pressure p = 0.5–7.5 MPa for β = 1.0, 1.5, 2.0, 2.5, and 3.0 and (b) β at p = 1.5, 3.5, 5.5, and 7.5 MPa. β is the dimensionless Weibull shape parameter.
3.3. Water Saturation and Loss of the Gas-Filled Pathway
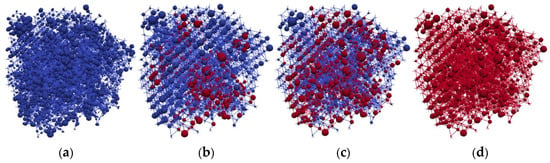
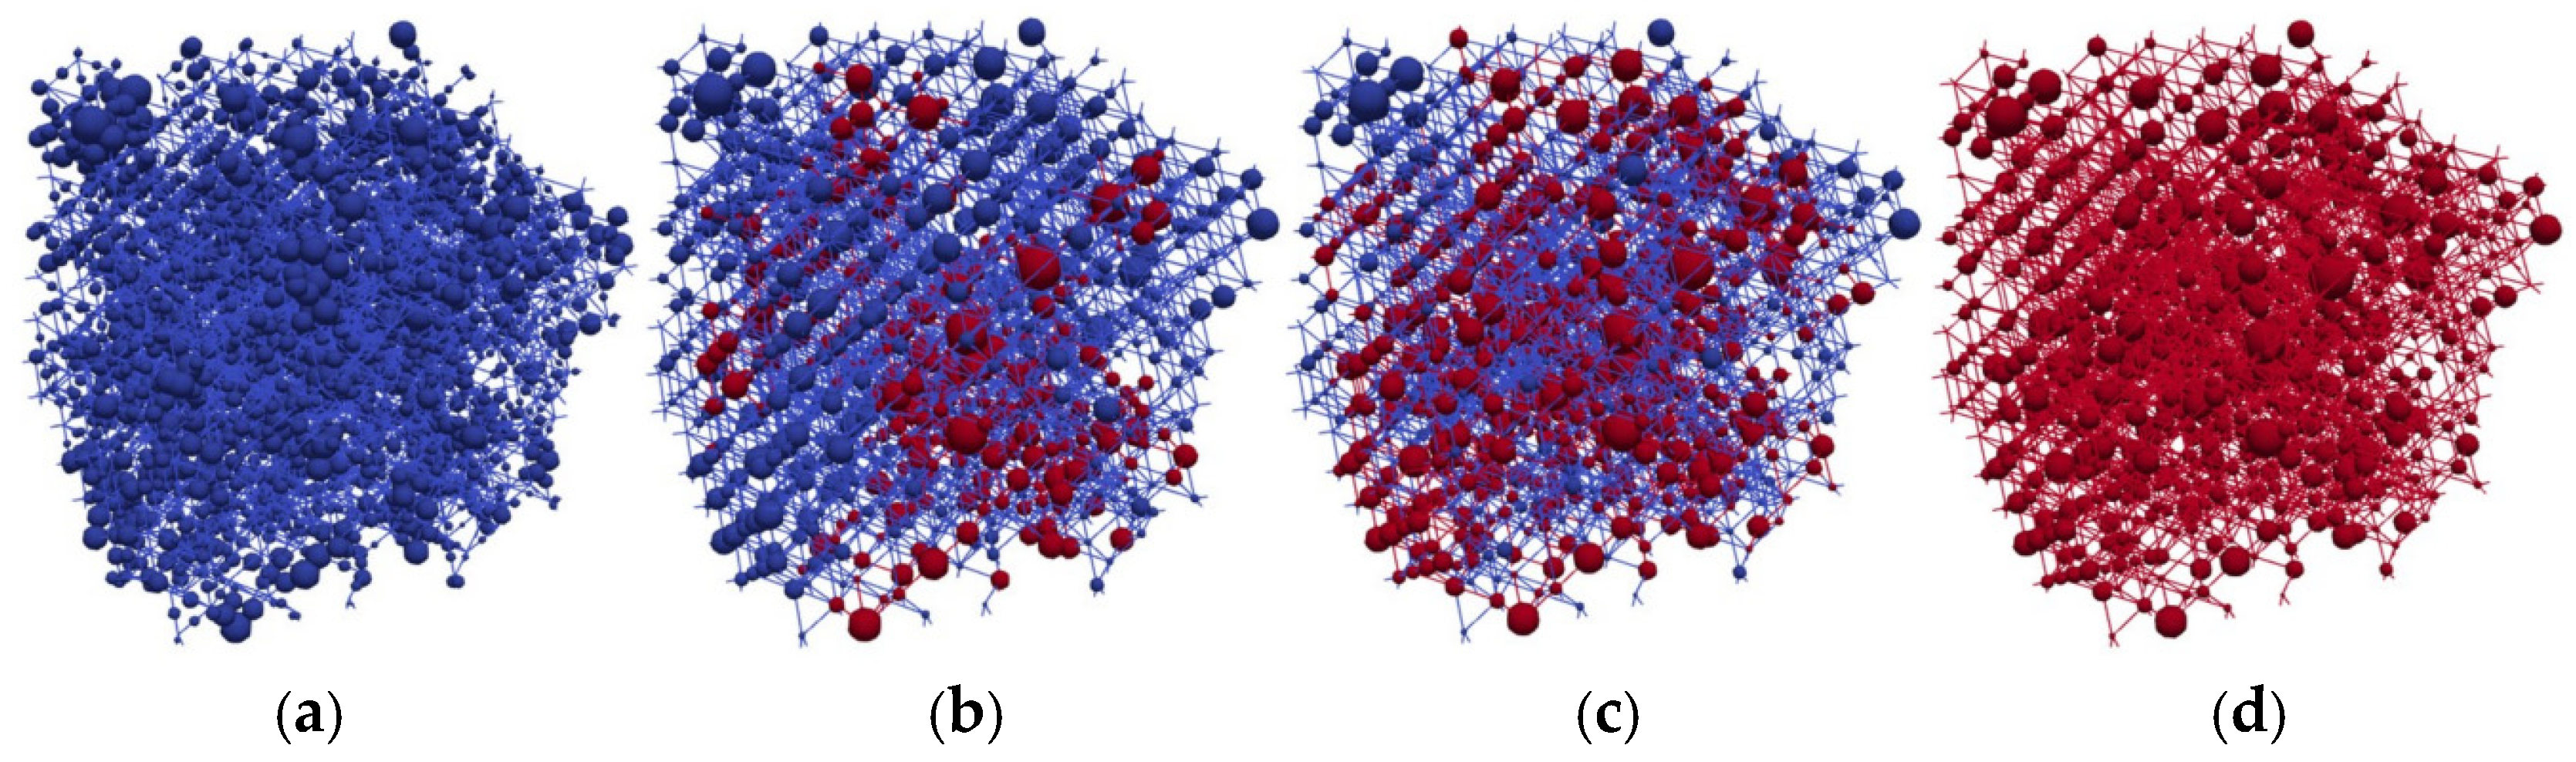
Invasion percolation produces spatially organized gas–water occupancy. Gas accesses low-entry-pressure throats that are connected to the inlet, rather than filling all large throats independently of accessibility. Figure 14 illustrates four occupancy states. Sw = 1 denotes a fully water-filled network, and Sw = 0 is the fully gas-filled limiting state of the idealized displacement. Water saturation is a volume fraction; occupancy describes the phase assigned to an individual element.
Figure 14.
Gas–water occupancy at water saturation (a) Sw = 1.0, (b) 0.7, (c) 0.3, and (d) 0.0. Red denotes gas and blue water. Sw is the water-filled fraction of total pore–throat void volume.
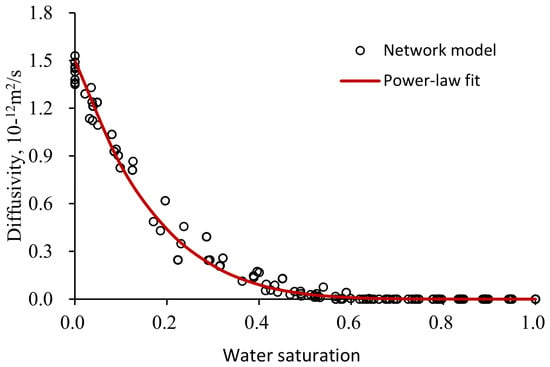
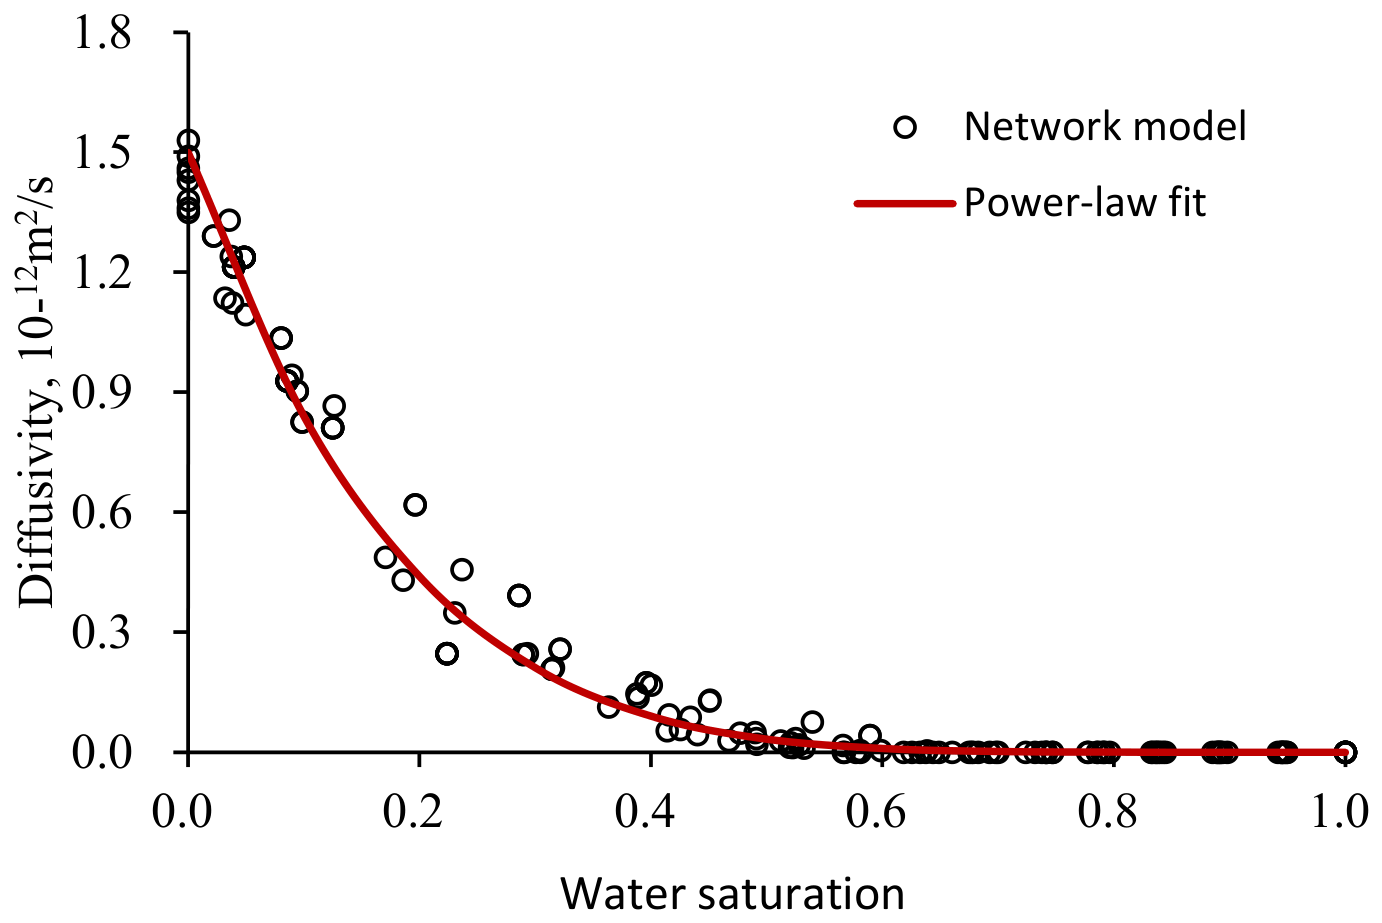
For λ = 5 nm, t0 = 4 nm, β = 2, and p = 0.5 MPa, effective diffusivity declines sharply as water saturation increases (Figure 15). Near Sw = 0.58, the gas-connected contribution is small. For one simulated curve, De/De(Sw = 0) = 0.0031 at Sw = 0.5806. This near-zero level depends on the selected network. Equation (17) describes the attenuation of diffusivity, while an explicit connectivity check determines whether a gas pathway spans the network.
Figure 15.
Effective diffusivity versus water saturation Sw for λ = 5 nm, t0 = 4 nm, β = 2, and p = 0.5 MPa. The ordinate is in 10−12 m2 s−1. Open symbols show eight network traces. The red curve is De = (1.5 × 10⁻¹² m2 s−1) (1 − Sw)5.5.
3.4. Dynamic Diffusion Correlation
The saturation response generated by each invasion sequence was represented by the power-law relation
where Dmax = De(Sw = 0), and n is a dimensionless attenuation exponent. The curve in Figure 15 has Dmax = 1.5 × 10⁻¹² m2 s−1 and n = 5.5.
ACE estimates data-adaptive transformations of the response and predictors without prescribing their functional forms in advance, which allows nonlinear combined effects to be represented in an additive relation [44,45]. Feng, Zhang, and colleagues [46] used this approach to relate methane sorption capacity to coal composition, vitrinite reflectance, and temperature. In the present study, ACE is used to represent the combined effects of network structure, pressure, and water saturation over the simulated domain. The transformed relationship is
with dimensionless response and predictors defined by
For gas-connected observations with De > 0, θ and φj denote the response and predictor transformations, and ε is the residual. The reference quantities are Dref = 1 m2 s−1 and p0 = 1 MPa. CN and β are dimensionless, whereas t0 and λ are reported in nm. Structural and pressure levels are specified in Section 2.6; the saturation response is represented separately by Equation (17).
For a fixed coal structure, a separate phenomenological pressure–saturation relation can be written as
where a has units of m2 s−1, b and n are dimensionless, and p0 = 1 MPa. Equation (20) is equivalent to De = A(p0/p)(1 − Sw)n, with A = a exp(b). The reference parameterization fixes b = 0 and sets a = 7.5 × 10⁻¹³ m2 s−1 and n = 5.5, giving De = 1.5 × 10⁻¹² m2 s−1 at p = 0.5 MPa and Sw = 0. This normalization links the pressure–saturation relation to the dry endpoint of Figure 15. A spanning-gas pathway is required when the relation is used in a reservoir model.
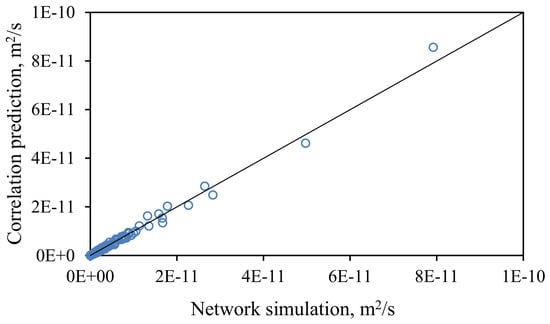
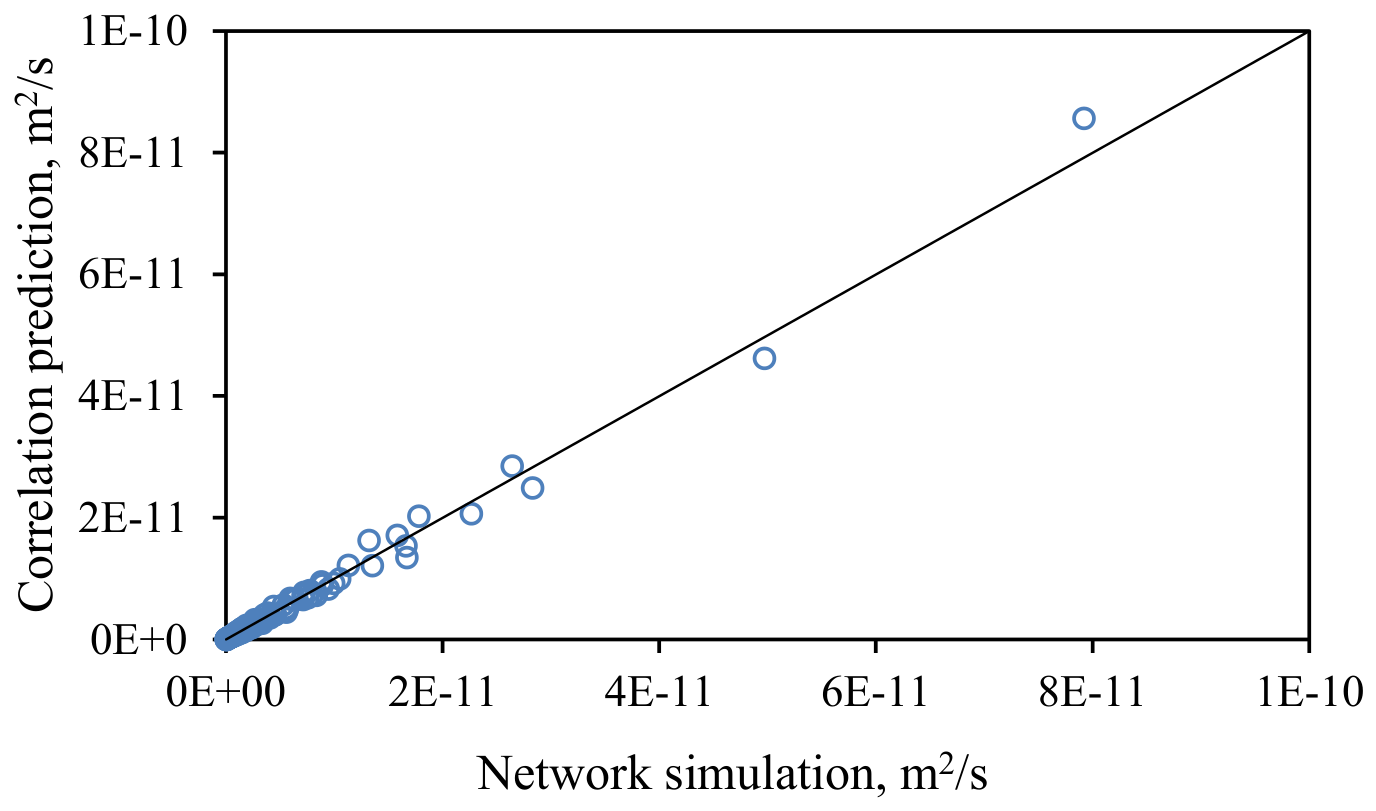
The correlation–simulation comparison in Figure 16 contains 160 pairs and gives MRE = 9.66%, RMSE = 8.66 × 10⁻¹³ m2 s−1, and R2 = 0.9895, where R2 = 1−Σ(Dpred − Dsim)2/Σ(Dsim − mean(Dsim))2. The mean signed residual is −2.73 × 10⁻¹⁴ m2 s−1, and relative residuals range from −19.49% to 23.36%.
Figure 16.
Correlation-predicted versus network-simulated effective diffusivity (m2 s−1), with 160 pairs. The diagonal denotes equality; MRE = 9.66% and R2 = 0.9895.
The practical use of a state-dependent coefficient is to update matrix–cleat transfer when pressure and water saturation change while a calibrated structure remains fixed. For reservoir use, the relation is coupled to a reservoir mass balance, adsorption storage, and a spanning-gas condition. It is applied within the calibrated parameter domain.
4. Discussion
4.1. Why Pore Structure and Connectivity Must Be Retained
The simulations distinguish local methane mobility from the connectivity of the conducting network. Equation (3) increases local conductance with throat area and decreases it with length, while Equations (2), (4), and (6) combine those local values through the topology of the whole network. This separation demonstrates why mean pore size or porosity alone may be insufficient to describe effective diffusivity in heterogeneous coal matrices. A network containing several parallel spanning paths is less sensitive to an individual bottleneck than a sparsely connected network, even if both have similar pore volume.
The positive responses to the Weibull location, scale, and shape parameters are consistent within the specific parameterisation adopted in this study. In each case, parameter variation modifies the pore-size distribution and consequently affects both local conductance and the prescribed local diffusivity. The effect of heterogeneity depends on the network architecture, including bottlenecks that can restrict access to larger pores. Application to a particular coal requires structural calibration.
A statistical network represents a specified pore architecture and must be paired with measured pore-size and transport parameters for application to a particular coal. Chemical processing can alter pore structure and sorption behaviour; for example, humic-acid extraction from lignite has been reported to modify these properties [47]. Parameters obtained from untreated coal should therefore not be transferred directly to processed material.
4.2. Pressure Dependence and Coal-Specific Calibration
The Smith–Williams comparison and the numerical sweeps exhibit decreasing diffusivity with pressure [3]. Coal diffusion studies incorporating pressure-dependent molecular and Knudsen contributions support this type of response under specified conditions [19,20,21,22,23]. Other measurements and molecular calculations report different trends [5,11,15,18,24,25]. Pressure sensitivity depends on the coefficient definition, loading, confinement, and coal structure; agreement with one trend does not select a unique mechanism. The sign and slope of a local empirical pressure term must consequently remain coal- and interval-specific.
The ideal Knudsen relation motivates a positive diameter dependence when wall collisions dominate. At high pressure, changes in mean free path, adsorbed population, and surface transport can alter the pressure response. Equation (4) is applied over the pore-size and pressure ranges specified in Section 2.2 and Section 2.6.
4.3. Water Saturation as a Topological Variable
Water changes the volume and connectivity of gas-filled pathways. The curve in Figure 15 describes attenuation of gas-connected diffusion, while the connectivity check identifies loss of a spanning-gas pathway. Dissolved-gas diffusion, adsorbed methane, and wetting films are outside this coefficient.
The exponent n describes saturation sensitivity for a specified network configuration. Throat geometry, wettability, trapping, and correlations between neighbouring pore sizes influence the invasion pattern and can therefore change this exponent. The near-zero level observed for the present configuration reflects both the occupied pore volume and the connectivity of the remaining gas-filled paths.
4.4. Reservoir Use and Model Limitations
For reservoir applications, structural calibration describes the matrix network, while pressure and water saturation enter a separately calibrated transport closure. Reservoir use combines this closure with adsorption storage, transient mass balance, and a cleat-flow model.
The model separates local mobility from gas-pathway accessibility within a statistical representation of the coal matrix. Its scope is isothermal diffusion through gas-connected elements at fixed geometry. Adsorbed-phase transport, liquid films, stress-dependent deformation, and transient adsorption–desorption require additional constitutive relations. Applying the framework to a reservoir therefore requires coal-specific structural and transport parameters alongside the reservoir mass balance.
Matrix diffusivity governs gas supply to the cleats, whereas permeability governs subsequent fracture flow. Both properties may evolve during production. Coupling Equation (20) with a cleat-permeability model in a reservoir simulator requires distinct state variables and validation for the two transport processes.
5. Conclusions
A statistical pore–throat framework combining steady-state diffusion and invasion percolation was used to examine state-dependent methane diffusivity. Dynamic prediction refers to repeated evaluation at changing pressure and saturation, with geometry fixed during each solve.
- For the Pittsburgh and Madrid series, mean absolute relative errors are 3.29% and 2.49% across five observations per coal, and 2.89% and 2.49% for the two withheld observations. These comparisons quantify the coal-specific pressure response after calibration.
- Connectivity and pore-size statistics exert distinct structural controls. Within the investigated network configurations and parameter ranges, increasing coordination number and the Weibull location, scale, and shape parameters increased effective diffusivity. Pressure reduced diffusivity for every calibrated network within the tested range.
- For the simulated configuration (λ= 5 nm, t0 = 4 nm, β = 2, and p = 0.5 MPa), gas-connected diffusion is strongly suppressed near Sw = 0.58 (Figure 15).
- ACE provides a framework for nonlinear structural responses through fitted transformations. The 160-pair correlation comparison gives MRE = 9.66% and R2 = 0.9895. The pressure–saturation relation uses dimensionless pressure and a separate gas-connectivity condition.
The framework distinguishes local conductance from gas-pathway accessibility and provides a basis for updating matrix diffusivity as reservoir pressure and water saturation evolve.
Author Contributions
Conceptualization, J.Z. and Q.F.; methodology, J.Z.; software, J.Z., and K.Y.; validation, J.Z., K.Y., and X.Y.; formal analysis, J.Z. and K.Y.; investigation, J.Z.; resources, Q.F., S.W., and Z.J.; data curation, J.Z. and K.Y.; writing—original draft preparation, J.Z.; writing—review and editing, K.Y., X.Y., Q.F., S.W., and Z.J.; visualization, J.Z. and K.Y.; supervision, Q.F.; project administration, Q.F. All authors have read and agreed to the published version of the manuscript.
Funding
This research was funded by the National Science and Technology Major Project of China (Enrichment Patterns and Exploration-Development Technologies of Coalbed Methane in Major Basins of Overseas Areas, Grant No. 2025ZD1403904) and the National Natural Science Foundation of China (Grant No. 52474068).
Data Availability Statement
Experimental comparison values are provided in Table 2. Numerical values underlying the plots are available from the corresponding author upon reasonable request.
Conflicts of Interest
The authors declare no conflicts of interest.
References
- Zhao, W.; Cheng, Y.; Pan, Z.; Wang, K.; Liu, S. Gas diffusion in coal particles: A review of mathematical models and their applications. Fuel 2019, 252, 77–100. [Google Scholar] [CrossRef] [Scilit]
- Thimons, E.D.; Kissell, F.N. Diffusion of methane through coal. Fuel 1973, 52, 274–280. [Google Scholar] [CrossRef] [Scilit]
- Smith, D.M.; Williams, F.L. Diffusion models for gas production from coal: Determination of diffusion parameters. Fuel 1984, 63, 256–261. [Google Scholar] [CrossRef] [Scilit]
- Busch, A.; Gensterblum, Y.; Krooss, B.M.; Littke, R. Methane and carbon dioxide adsorption–diffusion experiments on coal: Upscaling and modeling. Int. J. Coal Geol. 2004, 60, 151–168. [Google Scholar] [CrossRef] [Scilit]
- Xu, H.; Tang, D.; Zhao, J.; Li, S.; Tao, S. A new laboratory method for accurate measurement of the methane diffusion coefficient and its influencing factors in the coal matrix. Fuel 2015, 158, 239–247. [Google Scholar] [CrossRef] [Scilit]
- Baatar, L.; Mostaghimi, P.; Yuan, M.; Armstrong, R.T.; Adler, L.; Canbulat, I.; Si, G.; Gaidarov, B.; Jing, Y. Multiscale measurements of gas diffusion coefficient of coal using counter-diffusion and image-based methods. Int. J. Coal Geol. 2023, 265, 104155. [Google Scholar] [CrossRef] [Scilit]
- An, F.; Jia, H.; Feng, Y. Effect of stress, concentration and temperature on gas diffusion coefficient of coal measured through a direct method and its model application. Fuel 2022, 312, 122991. [Google Scholar] [CrossRef] [Scilit]
- Lu, X.; Armstrong, R.T.; Mostaghimi, P. Analysis of gas diffusivity in coal using micro-computed tomography. Fuel 2020, 261, 116384. [Google Scholar] [CrossRef] [Scilit]
- Cheng, M.; Fu, X.; Kang, J.; Chen, Z.; Tian, Z. Effect of water on methane diffusion in coal under temperature and pressure: A LF-NMR experimental study on successive depressurization desorption. Fuel 2022, 324, 124578. [Google Scholar] [CrossRef] [Scilit]
- Hu, H.; Li, X.; Fang, Z.; Wei, N.; Li, Q. Small-molecule gas sorption and diffusion in coal: Molecular simulation. Energy 2010, 35, 2939–2944. [Google Scholar] [CrossRef] [Scilit]
- Zhao, Y.; Feng, Y.; Zhang, X. Molecular simulation of CO2/CH4 self- and transport diffusion coefficients in coal. Fuel 2016, 165, 19–27. [Google Scholar] [CrossRef] [Scilit]
- Hu, H.; Du, L.; Xing, Y.; Li, X. Detailed study on self- and multicomponent diffusion of CO2–CH4 gas mixture in coal by molecular simulation. Fuel 2017, 187, 220–228. [Google Scholar] [CrossRef] [Scilit]
- Yu, S.; Jiang, B.; Wei, C.; Dai, X.; Quan, F.; Hou, C.; Cheng, G. A review on the application of molecular dynamics to the study of coalbed methane geology. Front. Earth Sci. 2021, 9, 775497. [Google Scholar] [CrossRef] [Scilit]
- Fetisov, V.; Gonopolsky, A.M.; Mazlova, E.A.; Behbahani, R.M.; Davardoost, H. Thermodynamic Modeling and Emission Assessment of Coalbed Methane Utilization in Power Generation: A Case Study from Russia. Environ. Model. Assess. 2026, 31, 159–170. [Google Scholar] [CrossRef] [Scilit]
- Yan, J.; Meng, Z.; Li, G. Diffusion characteristics of methane in various rank coals and the control mechanism. Fuel 2021, 283, 118959. [Google Scholar] [CrossRef] [Scilit]
- Song, H.; Lin, B.; Zhong, Z.; Liu, T. Experimental study on methane diffusion kinetics in three typical metamorphic coals. Fuel 2022, 311, 122601. [Google Scholar] [CrossRef] [Scilit]
- Fang, X.; Liu, D.; Zhou, Y.; Liu, X.; Cai, Y. Factors influencing methane diffusion behaviors in micro-nano coal pores: A comprehensive study. Front. Earth Sci. 2023, 17, 71–86. [Google Scholar] [CrossRef] [Scilit]
- Meng, Y.; Li, Z. Experimental study on diffusion property of methane gas in coal and its influencing factors. Fuel 2016, 185, 219–228. [Google Scholar] [CrossRef] [Scilit]
- Wang, Y.; Liu, S. Estimation of pressure-dependent diffusive permeability of coal using methane diffusion coefficient: Laboratory measurements and modeling. Energy Fuels 2016, 30, 8968–8976. [Google Scholar] [CrossRef] [Scilit]
- Yang, Y.; Liu, S. Estimation and modeling of pressure-dependent gas diffusion coefficient for coal: A fractal theory-based approach. Fuel 2019, 253, 588–606. [Google Scholar] [CrossRef] [Scilit]
- Yi, M.; Wang, L.; Cheng, Y.; Wang, C.; Hu, B. Calculation of gas concentration-dependent diffusion coefficient in coal particles: Influencing mechanism of gas pressure and desorption time on diffusion behavior. Fuel 2022, 320, 123973. [Google Scholar] [CrossRef] [Scilit]
- Liu, Q.; Li, Z.; Wang, E.; Wang, D.; Feng, X. Pressure-dependent characteristics of the diffusion coefficient during the gas desorption process in coal cuttings: Numerical modelling and analysis. Int. J. Heat Mass Transf. 2024, 220, 125029. [Google Scholar] [CrossRef] [Scilit]
- Wang, K.; Wang, Y.; Xu, C.; Xu, Z.; Guo, H.; Xu, J. A new pressure-based gas diffusion coefficient model: Modeling, verification and analysis. J. Clean. Prod. 2025, 496, 144961. [Google Scholar] [CrossRef] [Scilit]
- Wang, L.; Chen, X.; Song, Y.; Qi, L. Experimental investigation on diffusion coefficients of CH4 in coal under high-temperature and -pressure conditions. ACS Omega 2020, 5, 25634–25646. [Google Scholar] [CrossRef] [Scilit]
- Gao, T.; Han, Q.; Deng, C.; Zhang, H. Experimental study on the properties of gas diffusion in various rank coals under positive pressure. ACS Omega 2023, 8, 10618–10628. [Google Scholar] [CrossRef] [Scilit]
- Charrière, D.; Pokryszka, Z.; Behra, P. Effect of pressure and temperature on diffusion of CO2 and CH4 into coal from the Lorraine basin (France). Int. J. Coal Geol. 2010, 81, 373–380. [Google Scholar] [CrossRef] [Scilit]
- Tang, X.; Li, Z.; Ripepi, N.; Louk, A.K.; Wang, Z.; Song, D. Temperature-dependent diffusion process of methane through dry crushed coal. J. Nat. Gas Sci. Eng. 2015, 22, 609–617. [Google Scholar] [CrossRef] [Scilit]
- Pan, Z.; Connell, L.D.; Camilleri, M.; Connelly, L. Effects of matrix moisture on gas diffusion and flow in coal. Fuel 2010, 89, 3207–3217. [Google Scholar] [CrossRef] [Scilit]
- Feng, X.; Deng, S.; Liu, Q.; Kong, X.; Zhang, X. Moisture content modulates pressure-dependent gas diffusion in coal particles: Mechanistic insights. Int. J. Heat Mass Transf. 2025, 252, 127455. [Google Scholar] [CrossRef] [Scilit]
- Song, H.; Li, B.; Li, J.; Li, W. Effects of moisture on gas transient and pseudo-steady diffusion characteristics in coal: Implications for CO2-enhanced coalbed methane recovery. Chem. Eng. J. 2026, 535, 175571. [Google Scholar] [CrossRef] [Scilit]
- Wang, K.; Zang, J.; Feng, Y.; Wu, Y. Effects of moisture on diffusion kinetics in Chinese coals during methane desorption. J. Nat. Gas Sci. Eng. 2014, 21, 1005–1014. [Google Scholar] [CrossRef] [Scilit]
- Liu, T.; Lin, B.; Fu, X.; Gao, Y.; Kong, J.; Zhao, Y.; Song, H. Experimental study on gas diffusion dynamics in fractured coal: A better understanding of gas migration in in-situ coal seam. Energy 2020, 195, 117005. [Google Scholar] [CrossRef] [Scilit]
- Lanetc, Z.; Zhuravljov, A.; Jing, Y.; Armstrong, R.T.; Mostaghimi, P. Coupling of transient matrix diffusion and pore network models for gas flow in coal. J. Nat. Gas Sci. Eng. 2021, 88, 103741. [Google Scholar] [CrossRef] [Scilit]
- Fatt, I. The network model of porous media. I. Capillary pressure characteristics. Trans. AIME 1956, 207, 144–159. [Google Scholar] [CrossRef] [Scilit]
- Chatzis, I.; Dullien, F.A.L. Modelling pore structure by 2-D and 3-D networks with application to sandstones. J. Can. Pet. Technol. 1977, 16, 97–108. [Google Scholar] [CrossRef] [Scilit]
- Wilkinson, D.; Willemsen, J.F. Invasion percolation: A new form of percolation theory. J. Phys. A Math. Gen. 1983, 16, 3365–3376. [Google Scholar] [CrossRef] [Scilit]
- Huang, X.; Bandilla, K.W.; Celia, M.A. Multi-physics pore-network modeling of two-phase shale matrix flows. Transp. Porous Media 2016, 111, 123–141. [Google Scholar] [CrossRef] [Scilit]
- Man, P.F.; Mastrangelo, C.H.; Burns, M.A.; Burke, D.T. Microfabricated capillarity-driven stop valve and sample injector. In Proceedings of the IEEE Micro Electro Mechanical Systems (MEMS 98), Heidelberg, Germany, 25–29 January 1998; pp. 45–50. [Google Scholar] [CrossRef] [Scilit]
- Zhang, J.; Feng, Q.; Zhang, X.; Zhang, X.; Yuan, N.; Wen, S.; Wang, S.; Zhang, A. The use of an artificial neural network to estimate natural gas/water interfacial tension. Fuel 2015, 157, 28–36. [Google Scholar] [CrossRef] [Scilit]
- Liu, Y.; Feng, Y.; Zhang, X. Molecular dynamics simulation of gas diffusion behaviour in coal. In Proceedings of the National Engineering Thermophysics Conference, Beijing, China, 23–25 October 2015. (In Chinese) [Google Scholar]
- Han, J. Molecular Simulation of Gas Adsorption, Desorption and Diffusion in Water-Bearing Coal Seams. Master’s Thesis, Southwest Petroleum University, Chengdu, China, 2015. (In Chinese) [Google Scholar]
- Jing, W. Molecular Simulation of Methane Adsorption and Diffusion in Tectonically Deformed Coal. Master’s Thesis, Taiyuan University of Technology, Taiyuan, China, 2010. (In Chinese) [Google Scholar]
- Gostick, J.; Aghighi, M.; Hinebaugh, J.; Tranter, T.; Hoeh, M.A.; Day, H.; Spellacy, B.; Sharqawy, M.H.; Bazylak, A.; Burns, A.; et al. OpenPNM: A Pore Network Modeling Package. Comput. Sci. Eng. 2016, 18, 60–74. [Google Scholar] [CrossRef] [Scilit]
- Breiman, L.; Friedman, J.H. Estimating optimal transformations for multiple regression and correlation. J. Am. Stat. Assoc. 1985, 80, 580–598. [Google Scholar] [CrossRef]
- Wang, D.; Murphy, M. Estimating optimal transformations for multiple regression using the ACE algorithm. J. Data Sci. 2004, 2, 329–346. [Google Scholar] [CrossRef] [Scilit]
- Feng, Q.; Zhang, J.; Zhang, X.; Shu, C.; Wen, S.; Wang, S.; Li, J. The use of alternating conditional expectation to predict methane sorption capacity on coal. Int. J. Coal Geol. 2014, 121, 137–147. [Google Scholar] [CrossRef] [Scilit]
- Melnykov, A.; Miroshnichenko, D.; Karnozhytskyi, P.P.; Zhylina, M.; Karnozhytskyi, P.V.; Ozolins, J.; Lypko, Y.; Shved, M.; Pyshyev, S. Clean technologies for the brown coal use: Studying the sorption properties of lignite after the humic acids extraction. Clean. Eng. Technol. 2026, 32, 101211. [Google Scholar] [CrossRef] [Scilit]

Disclaimer/Publisher’s Note: The statements, opinions and data contained in all publications are solely those of the individual author(s) and contributor(s) and not of MDPI and/or the editor(s). MDPI and/or the editor(s) disclaim responsibility for any injury to people or property resulting from any ideas, methods, instructions or products referred to in the content. |
© 2026 by the authors. Licensee MDPI, Basel, Switzerland. This article is an open access article distributed under the terms and conditions of the Creative Commons Attribution (CC BY) license.