


Abstract
This work presents a mechanistic modeling approach for simulating methane emissions from triethylene glycol (TEG) dehydrators used in oil & gas (O&G) operations. The model was developed as a modular component of the Mechanistic Air Emissions Simulator (MAES) tool, incorporating species-specific absorption and emission dynamics through two-level, second-order polynomial regression (PR) models trained on ProMax simulation data: (1) species-level regression models that track the transfer rates of individual gas species within the dehydrator unit streams, and (2) outlet flow stream regression models that predict the fraction of inlet gas distributed among the outlet streams of the dehydrator unit. These behaviors were characterized over a range of glycol circulation ratios, wet gas pressures, and temperatures. The model was validated using root mean square error (RMSE) analysis. The species-level PR achieved low root mean square error (RMSE) values (<0.03) for light hydrocarbon species across all dehydrator components, ranging from 0.0009 for methane to 0.029 for normal pentane. Similarly, the outlet-level PR yielded RMSE values below 0.002 for the dry gas fraction, 0.001 for the flash tank fraction, and 0.002 for the still vent fraction, demonstrating strong agreement between predicted and reference ProMax values. When deployed at field facilities, the model significantly improved MAES-simulated dehydrator emissions, revealing that gas-assisted glycol pump emissions are the dominant contributors to both dehydrator-level and site-level methane emissions under uncontrolled conditions. Further analysis of the 154 dehydrator units reported by operators under the AMI 2024 project showed that 54 units (31%) used gas-driven glycol pumps, of which 6 units (11%) operated with uncontrolled flash tanks, and 22 units (40.7%) were identified as potentially oversized. Of the six dehydrator units with uncontrolled gas-assisted pumps, pump emissions accounted for 90.25% of total dehydrator emissions and 63.10% of total site-level emissions. These findings highlight substantial opportunities for emissions mitigation through equipment upgrades.
1. Introduction
Produced natural gas (NG) often contains water vapor, which, aside from reducing the gas’s heating value, can cause significant operational challenges, such as corrosion and hydrate formation [1,2,3,4,5,6]. To prevent these problems and comply with pipeline quality standards—in the United States (U.S.) limited to 4–7 pounds of water per million standard cubic feet of gas [7,8,9]—the water vapor is removed through natural gas dehydration [4,10] using dehydrator units installed at NG processing facilities. This process ensures equipment and pipeline integrity, maintains flow assurance, and reduces unplanned downtime, maintenance, and operating costs [11].
Dehydrators achieve water removal through absorption, commonly using TEG as the desiccant [12]. Alternative desiccants, including ethylene glycol (EG), diethylene glycol (DEG), molecular sieves, and silica gel [13], have been applied in specific contexts but are less prevalent due to the superior efficiency and regeneration characteristics of TEG [3,12]. During operation, a portion of the NG is co-absorbed with the water vapor into the glycol and subsequently released as emissions when the pressure is reduced [14] or during glycol regeneration. Additional emissions arise from the use of gas-assisted glycol pumps, which circulate glycol through the dehydrator unit, and from stripping gas [15], when it is employed to enhance glycol regeneration efficiency and purity. Collectively, glycol dehydrators are recognized sources of methane emissions, the dominant constituent of NG, primarily through still column vents and flash tank emissions [16,17,18,19,20].
Methane is a potent greenhouse gas with a global warming potential 82.5 times greater than carbon dioxide over a 20-year period, contributing significantly to climate change [21,22,23]. In the U.S., methane (CH4) emissions are regulated by the Environmental Protection Agency (EPA) [24] and associated programs such as National Emission Standards for Hazardous Air Pollutants (NESHAP) [25], owing to their significant influence on climate and air quality. Consequently, the continuous monitoring and control of these emissions are essential to mitigate their environmental and health impacts.
Methane mitigation in the oil and gas sector represents one of the most immediate opportunities for reducing greenhouse gas emissions due to methane’s high global warming potential and relatively short atmospheric lifetime. While long-term decarbonization strategies such as carbon capture, utilization, and storage (CCUS) aim to reduce carbon dioxide emissions from large stationary sources, near-term reductions in methane emissions can provide rapid climate benefits and complement broader carbon management strategies [26]. Improving the accuracy of methane emissions quantification from equipment such as glycol dehydrators, therefore, contributes to global greenhouse gas mitigation efforts alongside long-term carbon management initiatives.
Additionally, with advancements in CH4 detection technologies, such as satellites [27,28], and increasing demands for transparency in emissions reporting, reducing these emissions has become critical not only to help companies meet internal environmental goals but also to improve operational efficiency, enhance market access, and support a positive public reputation [29,30,31,32,33].
Emissions from dehydrators are substantial [15], with EPA inventories attributing 12–17 billion cubic feet (Bcf) of CH4 annually to dehydrators and glycol pumps in U.S. production and gathering sector [34,35]. Despite their scale, and dehydrators industrial relevance, there is limited publicly available literature detailing how glycol absorbs individual NG species under varying dehydration conditions. Most of the existing data remains locked within proprietary commercial software, posing a significant barrier to transparency and accessibility. This data gap limits not only broader understanding and innovation in emissions modeling and mitigation but also the ability to validate reported emissions. Furthermore, gaining a deeper process-level understanding enables identification of operational improvements and mitigation opportunities.
Popular tools such as Glycalc [36] and ProMax BRE [37] are commonly used to estimate emissions from dehydrators and are permitted by the EPA for regulatory reporting under Method 1 in Subpart W [37,38] for larger dehydrators of throughput ≥ 0.4 MMscfd. However, both tools come with key limitations. Glycalc, although open source, is no longer actively maintained, which restricts its long-term reliability. ProMax BRE, on the other hand, is a closed-source commercial software that requires operators to purchase a license, limiting accessibility and transparency. A primary limitation in applying both tools for emissions estimation is the treatment of dehydrators as isolated units. This simplification overlooks process dynamics, reducing the ability to represent variable operating conditions and failure events, which can lead to misrepresentation of emissions driven by fluctuations in gas throughput or failures occurring upstream or within the dehydrator unit. Nevertheless, these tools remain useful for understanding the absorption behavior of various NG species in glycol under different operating conditions, such as temperature and pressure. This understanding forms the foundation of the present work on implementing a dehydrator model within MAES.
MAES simulates CH4 and other air emissions from O&G facilities with high resolution, up to 1 s, effectively capturing spatiotemporal variability in emission behavior [39,40,41]. The tool integrates two core modeling approaches to couple O&G equipment within emissions simulations: (1) traditional inventory models that rely on emission factors and activity data, and (2) mechanistic models that use state machines to dynamically track equipment operating states and fluid flows. The mechanistic approach offers a more representative and process-informed estimation of emissions, improving accuracy over conventional annualized factor-based methods. It further employs Monte Carlo (MC) methods to account for uncertainty and statistical variability in emissions and equipment behavior. For a detailed classification of specific models employing either traditional or mechanistic approaches, see Santos et al. (2025, Table S-5 in the Supplementary Materials) [40].
Prior to this work, MAES relied on a simplified heater model [41,42] to estimate emissions from dehydrators. While functional for baseline estimates, this approach overlooked key emission sources, most notably the gas-assisted glycol pump, and lacked the mechanistic fidelity needed to represent the dynamic operation of dehydrators accurately. As a result, significant dehydrator emissions were either underestimated or omitted entirely.
This study presents a mechanistic, state-machine-based dehydrator model parameterized by species-specific absorption curves derived from ProMax simulations. The remainder of this paper is structured as follows: Section 2 outlines the methodology used to generate absorption and emission rate curves and fit polynomial regression models. Section 3 presents and discusses the simulation results, emphasizing key trends, model performance, practical applications, and model limitations. Finally, Section 4 summarizes the main findings and discusses their implications for emissions estimation. Throughout this study, the symbols CH4 and C1 are used interchangeably to denote methane.
2. Methods
2.1. Overview
This section describes the development of a mechanistic model for simulating emissions from dehydrators at O&G sites. The model incorporates key process parameters and emission sources simulated in ProMax to enable equipment-level resolution, prior to integration into MAES. This section is organized into the following subsections: dehydrator unit configuration and operational conditions (Section 2.2), ProMax simulation setup (Section 2.3), effects of flow rate on methane absorption (Section 2.4), regression modeling (Section 2.5), integration of the dehydrator model into MAES (Section 2.6), and model validation (Section 2.7).
2.2. Dehydrator Unit Configuration and Operational Conditions
Gas dehydration can be accomplished through two primary methods: absorption, which uses liquid desiccants, and adsorption, which relies on solid media [6,12]. Among these, absorption is the most widely employed technique in NG processing. Common liquid absorbents include EG, DEG, and TEG. Of these, TEG is mostly used [43] due to its favorable thermophysical properties and its ability to be regenerated to a high degree of purity, enabling efficient and cost-effective water removal [44].
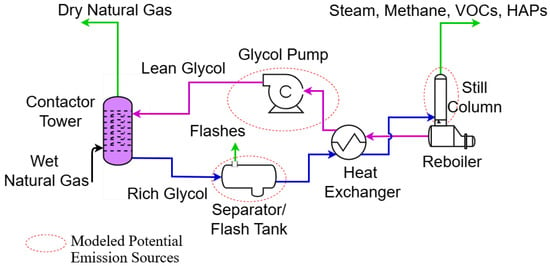
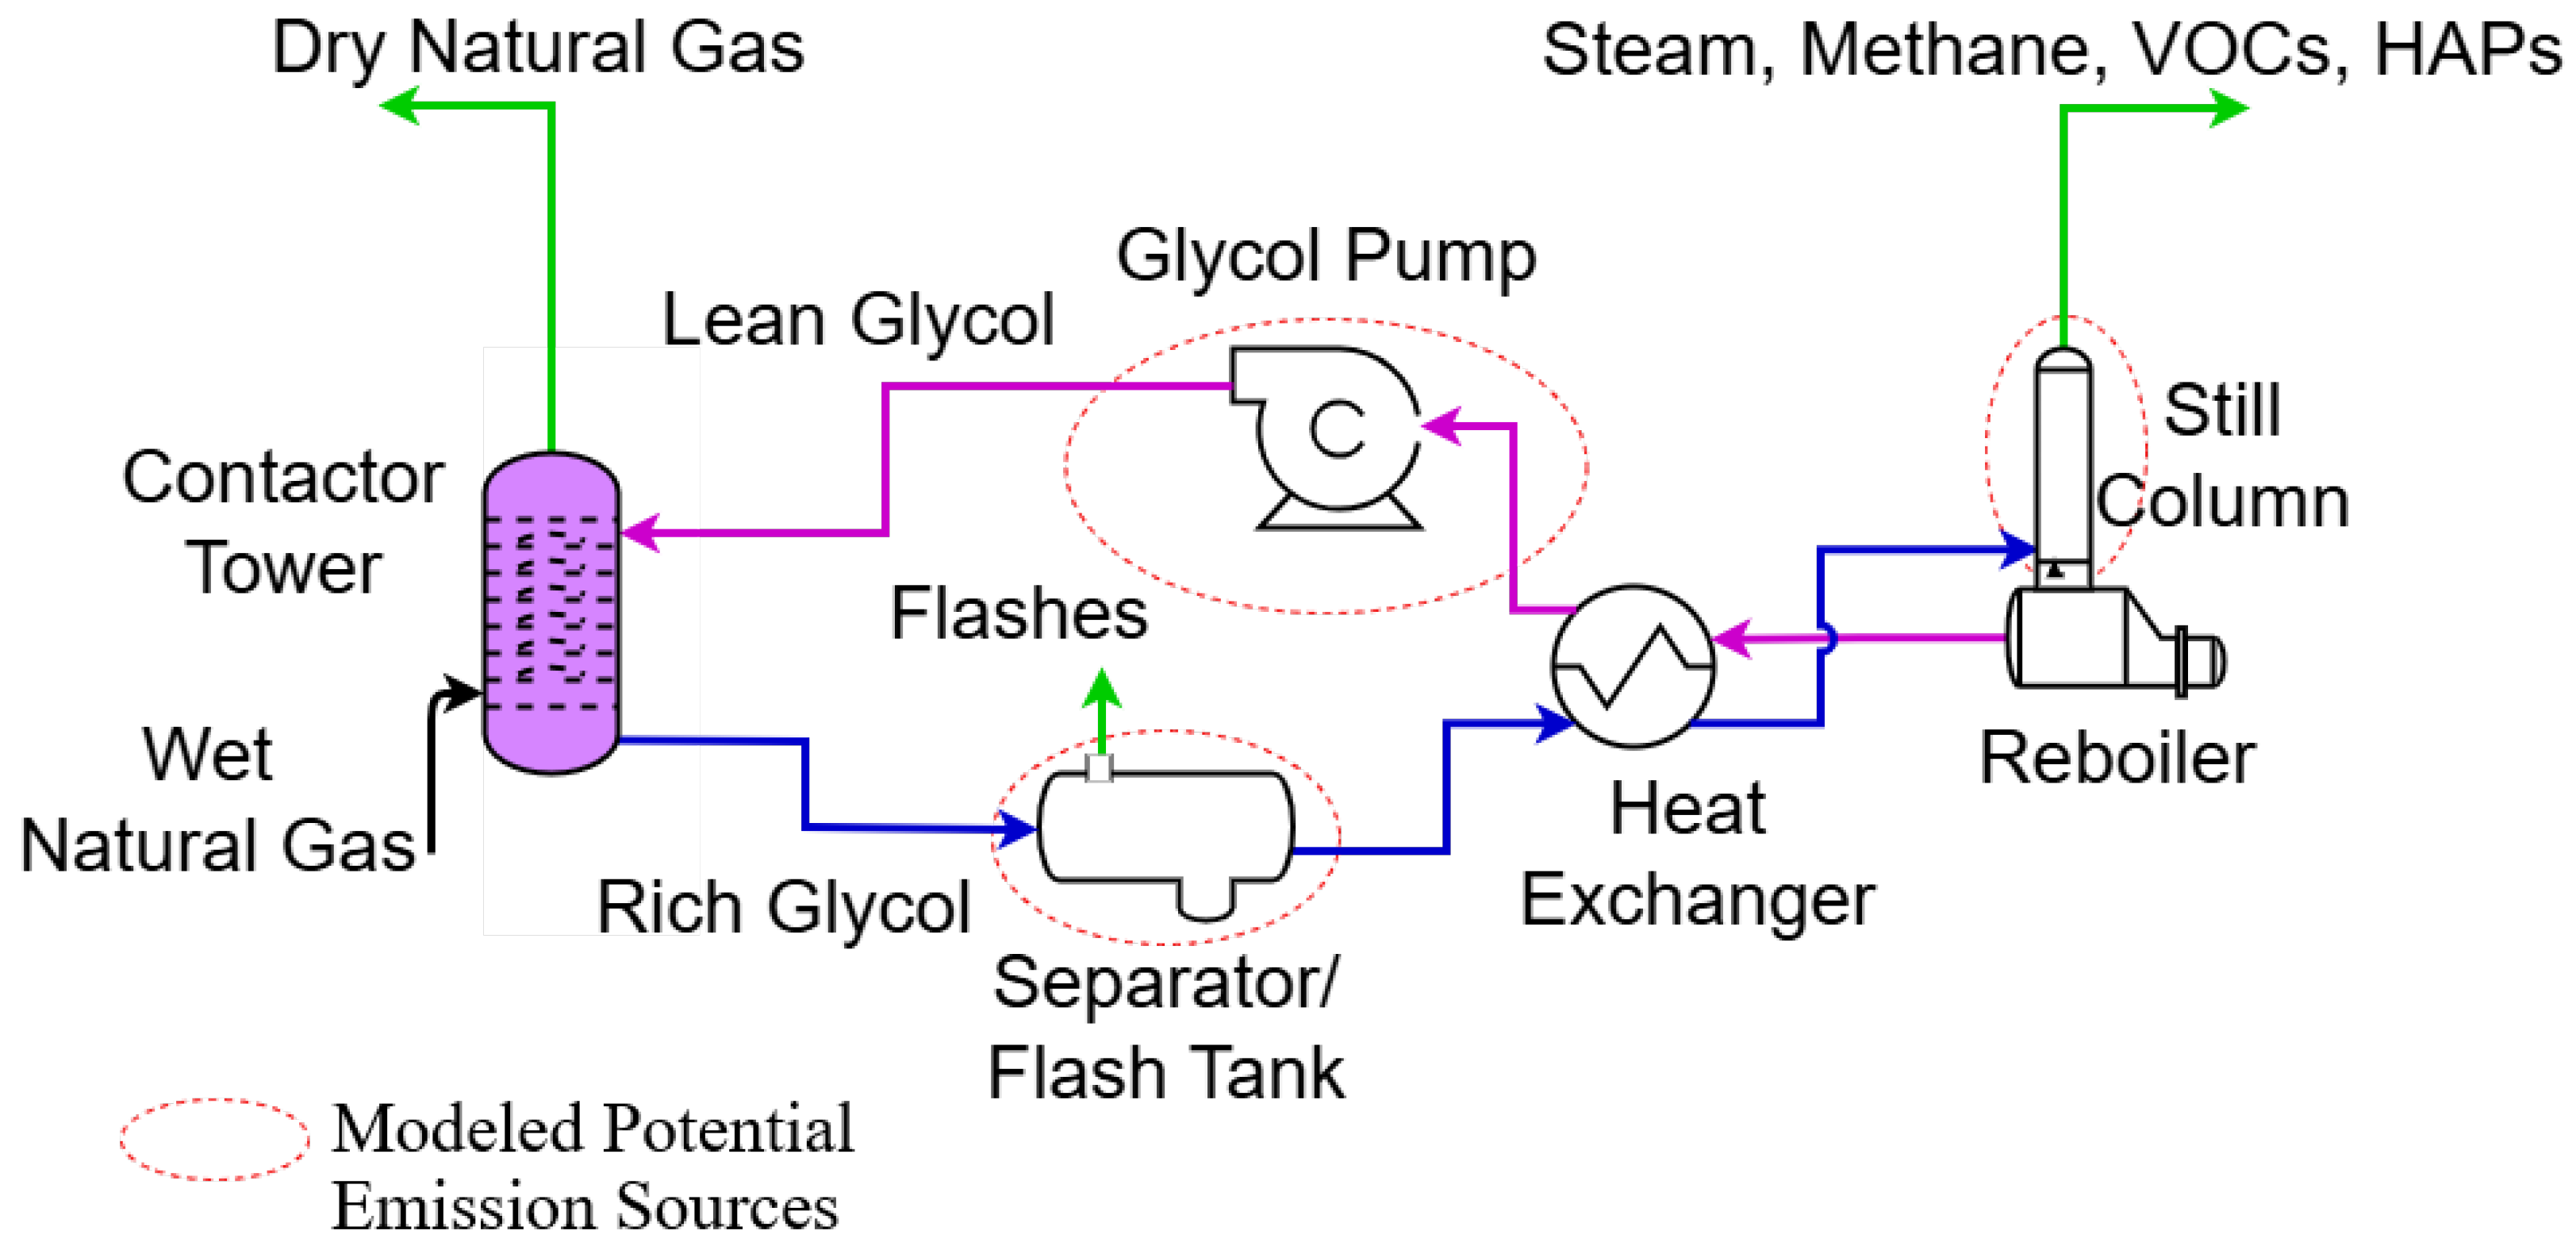
The main components of a conventional glycol dehydration system include a contactor tower, reboiler, heat exchanger, glycol pump (gas-assisted, air-driven, or electric-powered), and, optionally, a flash tank, as illustrated in Figure 1. The figure also highlights potential emission sources (circled in red), in addition to component leaks commonly associated with a dehydrator unit.
Figure 1.
Dehydrator Unit showing major dehydrator unit components and potential main emissions sources circled in dotted red.
The dehydration process begins in the contactor tower, where wet NG flows counter-current to lean TEG, allowing the glycol to absorb water vapor [45]. The contactor typically operates at pressures between 600 and 1000 psig and temperatures ranging from 90 to 100 °F to optimize absorption efficiency [43]. Gas temperatures above 140 °F hinder dehydration, as the gas holds onto water vapor more tightly and reduces mass transfer to the glycol. Conversely, temperatures below 40 °F increase glycol viscosity, limiting its capacity to absorb water. Therefore, maintaining gas temperatures within an optimal range is critical.
From the contactor tower, the dried gas exits through the top, while the water-rich glycol is routed from the bottom to the reboiler for regeneration. The rich glycol may pass through a flash tank, where a portion of the absorbed gas flashes off at reduced pressures, typically 40–100 psig, before entering the reboiler. Flash tanks can recover up to 90% of the absorbed gas [46], which may then be reused, vented, or flared.
In the reboiler, water is boiled off from the glycol. Because water boils at 212 °F and TEG begins to degrade at approximately 440 °F (with a boiling point near 550 °F), the reboiler typically operates between 212 °F and 400 °F to balance effective water removal with glycol preservation. The resulting steam, together with residual absorbed gas components such as CH4, exits through the still column above the reboiler.
To improve efficiency, a heat exchanger is used to transfer heat from the hot, regenerated lean glycol to the cooler, rich glycol. This process conserves energy and lowers the temperature of the lean glycol to better match the inlet wet gas stream, thereby reducing foaming and minimizing glycol losses through entrainment in the gas phase. Simultaneously, it raises the temperature of the rich glycol, decreasing the energy required in the reboiler to boil off water from the glycol. Ideally, the temperature difference between the contactor inlet gas and the lean glycol should be maintained within 10–15 °F to minimize glycol losses and prevent the formation of liquid hydrocarbons, which can impair the dehydration process.
Glycol pumps provide the pressure needed to return lean glycol to the top of the contactor. In gas-assisted pumps, a portion of the wet gas is used to drive the pump piston. The assist gas mixes with the rich glycol and flashes off in the flash tank as the pressure is reduced or is boiled off with the steam during glycol regeneration.
Finally, stripping gas, commonly sourced from a NG stream, can be injected into the reboiler to enhance the removal of water from the glycol at reduced temperatures. Stripping gas reduces the partial pressure of water vapor in the reboiler’s vapor space. By lowering the mole fraction of water in the vapor phase, it reduces the partial pressure of water vapor (Dalton’s law of partial pressures) [47,48], which enhances water removal even at lower temperatures [49,50]. This technique enables achieving lean-glycol purities of up to 99.95% at typical reboiler temperatures [49,51]. In contrast, systems without stripping gas achieve a purity of up to 98.8% [50]. The injected gas is released, along with other emissions, through the still column with the steam during regeneration.
2.3. ProMax Simulation Setup
ProMax is a process simulation software tool used to model and optimize processes in gas processing, refining, and chemical facilities [52]. It integrates different equations of state, such as the Peng-Robinson and Soave-Redlich-Kwong (SRK) equations of state, to understand gas behavior under different operating conditions [53]. ProMax, as a modeling tool, allows users to model different processes, but also has predesigned common processes such as the amine tool for removal of acid gases from NG and the dehydration tool for the NG dehydration process. The dehydration tool with the Peng-Robinson environment was used in this study to examine the absorption behavior of gas species [37] in TEG. ProMax simulation results were used to examine the mass transfer of NG species and the volumetric distribution of gas across the dehydrator outlet streams, namely the dry gas, flash tank vapor, and still vent stream. This understanding facilitates modeling of dehydrator emissions from two primary points: (1) the flash tank, if present, and (2) the still column (vent) [54].
To set up the simulations, the ProMax Scenario Tool [55] was used to define and systematically vary three parameters that primarily influence gas absorption behavior: glycol circulation ratio, wet gas pressure, and temperature. The selected parameter ranges were guided by the operational characteristics of glycol dehydrators and the EPA-recommended circulation ratio described in Section 2.2. Specifically, the circulation ratio ranged from 1 to 7 gal/lb of water removed, in 0.5 intervals. Each circulation ratio was simulated at three wet gas temperatures, (77 °F, 95 °F, and 122 °F), and for three wet gas pressures (400 psia, 800 psia, and 1200 psia). This full factorial combination resulted in 117 distinct simulation scenarios (13 circulation ratios × 3 temperatures × 3 pressures). Each combination of these variables constituted a unique simulation case. Lean glycol temperature at the contactor was maintained 10 °F above the inlet wet natural gas while glycol regeneration in the reboiler was maintained at 400 °F to remain below the TEG degradation threshold of 440 °F and above the 212 °F water boiling temperature. The wet gas was assumed to be water-saturated, with its composition given in Table 1. This setup ensured uniform coverage of operational variability and allowed for reliable polynomial regression fitting across all pressure-temperature-flow conditions.
Table 1.
Mole fraction composition (%) of the inlet wet gas stream.
The inlet wet gas composition in Table 1 was held constant to isolate the effects of circulation ratio, pressure, and temperature on absorption behavior and to enable consistent regression fitting across the designed operating space. In practice, gas composition varies across facilities and can influence absorption, particularly through changes in heavier hydrocarbon and acid gas fractions that affect vapor–liquid partitioning and solvent loading. Sensitivity of model outputs to broader composition variability is identified as a limitation of this work and a recommended direction for future study.
Methane (C1) and ethane (C2) absorption mass flow rates were plotted to examine their mass transfer behavior in TEG under varying inlet gas temperatures, pressures, and glycol circulation ratios. The gas flow rate was maintained at 0.5 million standard cubic feet per day (MMscfd) across all simulations. C1 and C2 were selected for detailed curve fitting because C1 is the primary greenhouse gas of concern, and C2 plays a key role in distinguishing anthropogenic from biogenic emission sources in top-down approaches [56,57,58,59].
C1 and C2 absorption rates were calculated as:
This approach was extended to all other gas species by running equivalent ProMax simulations while systematically varying process conditions. For each case, the gas total mass flow rates and species mass fractions were recorded for four primary streams: inlet wet gas, dry gas (post-contactor), flash tank vapor, and still vent. These data enabled the tracking of species-specific absorption in TEG at the contactor and quantification of emissions from the flash tank and still column. At each set of simulation parameters, the absorption or emission rate of the species at a given process stage was calculated using the generalized expression in Equation (2), which extends the formulation introduced in Equation (1) by relating the mass flow rate of outlet streams to that of the inlet wet gas.
where:
- is the transfer ratio (%) of species i at stage s,
- is the mass flow rate of species i at stage s,
- is the mass flow rate of species i in the wet gas stream (inlet),
- represents the dry gas (contactor outlet), flash tank, or still vent streams.
Each transfer ratio calculated using Equation (2) represents the fraction of a given species from the inlet wet gas stream that appears in a specific outlet stream (dry gas , flash tank, or still vent) for each simulation parameter set, thereby supporting a mass balance assessment across the dehydration process.
2.4. Effects of Flow Rate on Methane Absorption
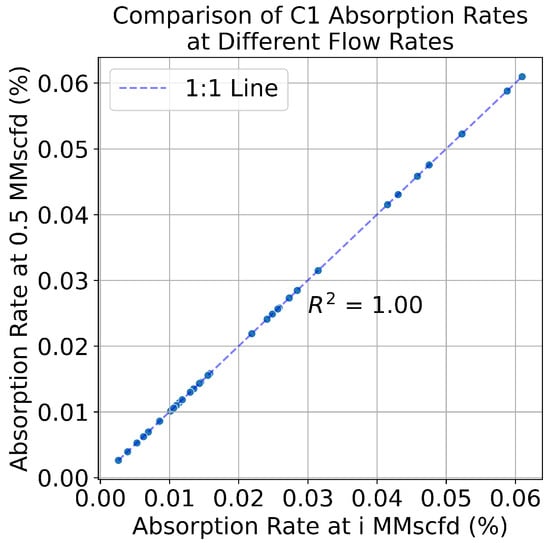
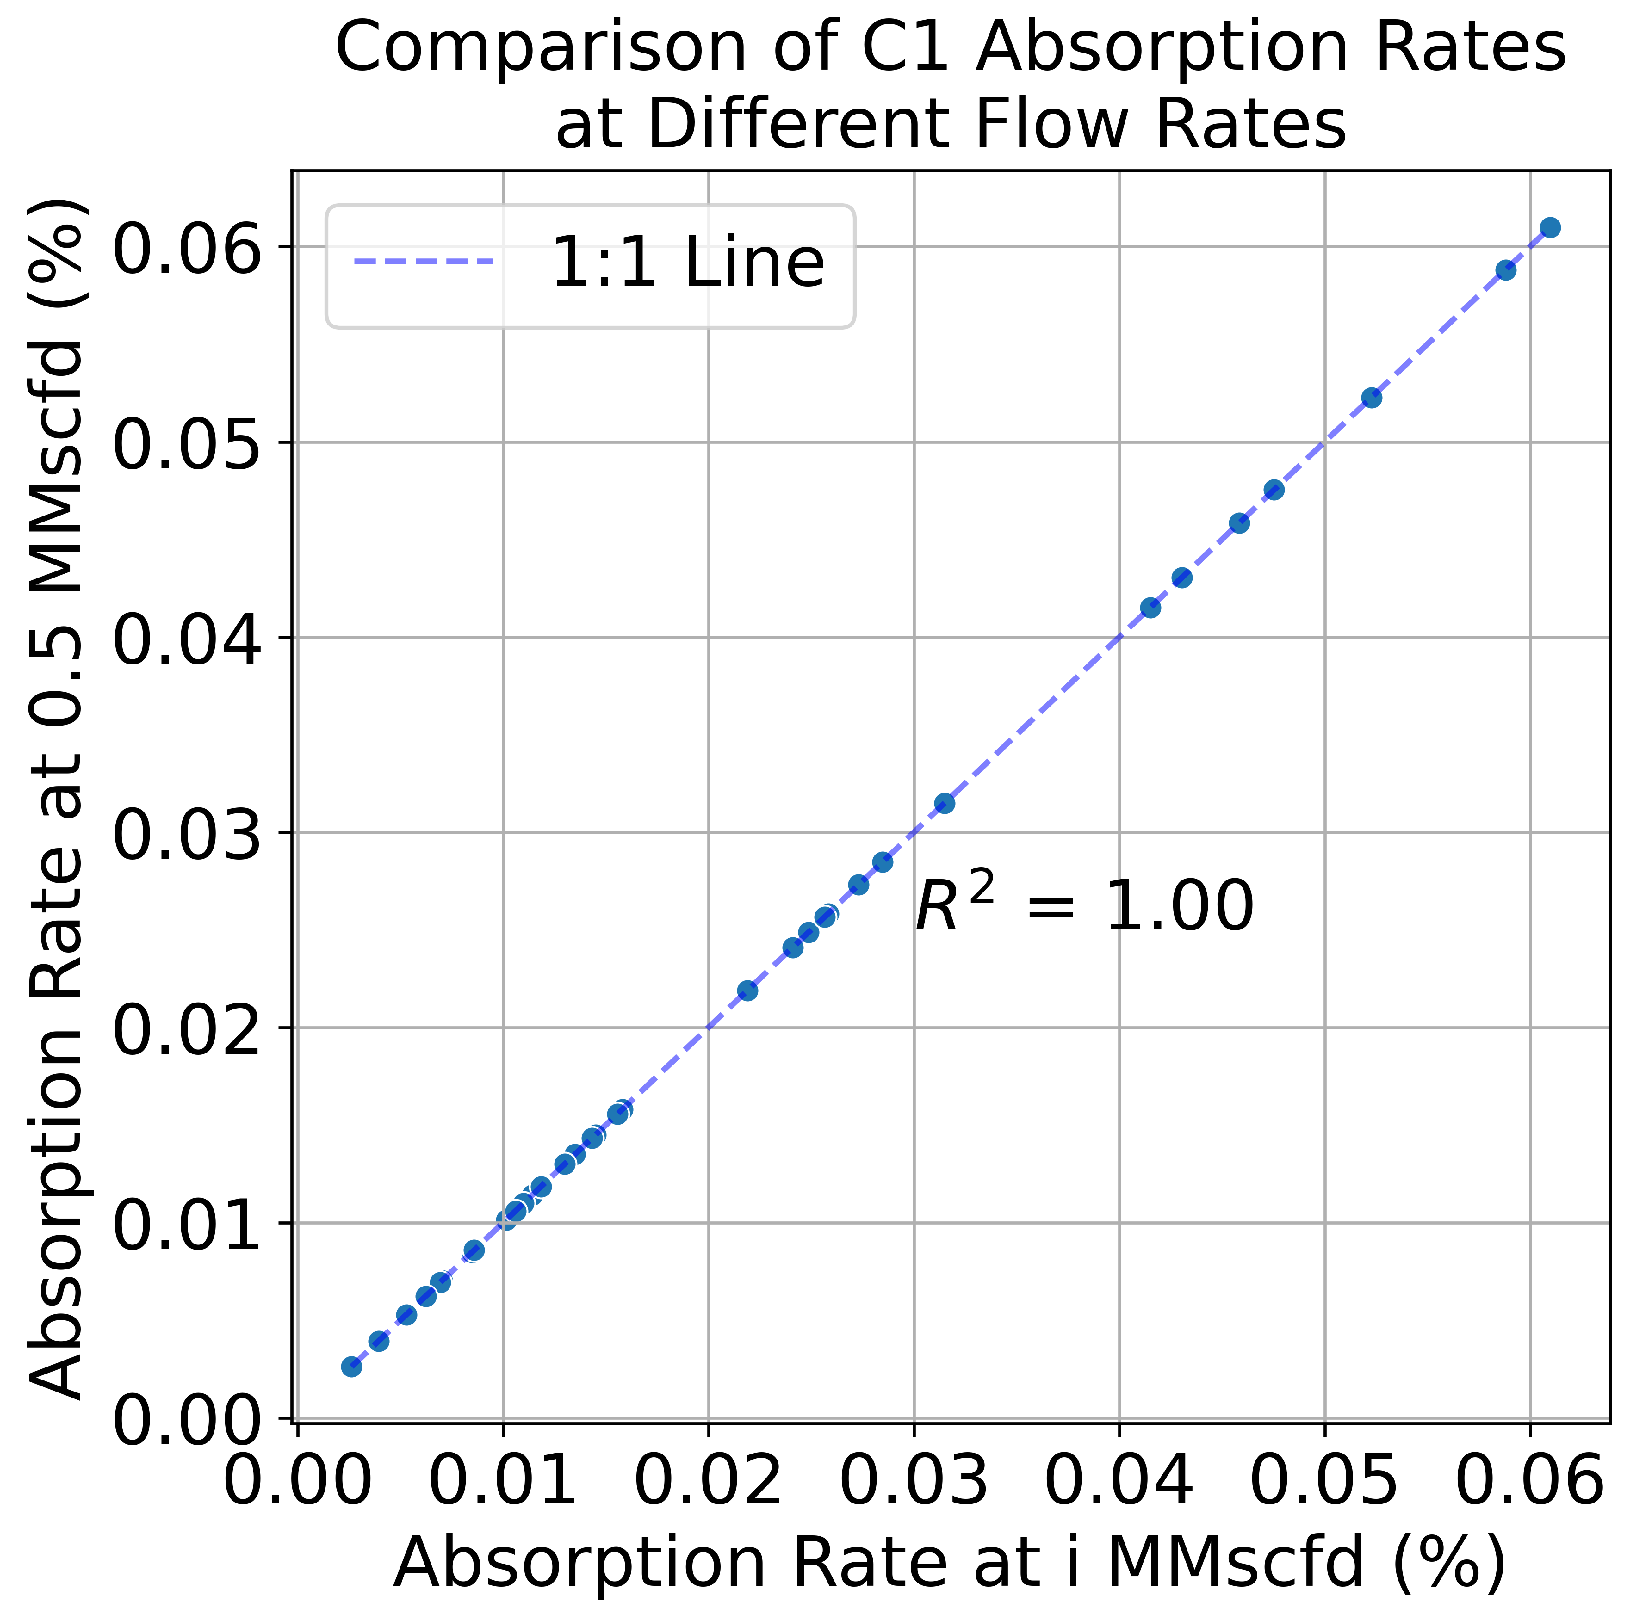
While Equation (2) considers circulation ratio, temperature, and pressure as the primary variables, the influence of gas flow rate on species absorption was also evaluated. To this end, a set of ProMax simulations were conducted to determine whether changes in gas flow rate affects C1 absorption rates, while keeping all other parameters constant, i.e., pressure, temperature, and glycol circulation ratio. This assessment informs the dehydrator model design assumption: absorption behavior is flow-independent. The analysis was conducted by running ProMax simulations under matched operating conditions, using a fixed gas flow rate of 0.5 MMscfd and a set of 36 randomly selected flow rate variables ranging from 2.9 to 17.5 MMscfd. For each scenario, the inlet and outlet C1 mass flow rates were recorded, and the absorption rates were computed using Equation (1).
Due to the absence of site-specific information regarding the actual number of trays or packing height in the contactor tower, the absorber was modeled using three theoretical equilibrium stages under steady-state conditions. This selection is supported by the analysis of [60], who demonstrated that, at typical industrial circulation rates of approximately 3 gallons per pound (gal/lb) of water removed, a three-equilibrium-stage contactor operates virtually at equilibrium with the inlet glycol. Increasing stage count beyond three provides diminishing improvement in residual water removal, while one- or two-stage configurations require substantially higher circulation rates to approach equilibrium. Since the primary industrial objective of glycol dehydration is the removal of water vapor to meet pipeline dew point specifications, three theoretical stages provide a representative and efficient equilibrium-based approximation in the absence of detailed internal design data. However, the present study did not explicitly evaluate the sensitivity of the regression model coefficients to variations in theoretical stage count or equivalent packing height. Therefore, we acknowledged this as a limitation of this work on the generated regression models.
2.5. Regression Modeling
A second-order polynomial regression (PR) was selected because it provided prediction accuracy comparable to higher-order models while maintaining a compact analytical form with only ten coefficients. Higher-order polynomials introduced additional terms with negligible improvement in predictive performance and increased model complexity.
2.5.1. Species Regression Models
Second-order PR models were fitted to the stage transfer ratios calculated from Equation (2), using 70% of the simulation parameter sets selected at random. For each species and each dehydration outlet stage, namely, the dry gas stream, flash tank emission, and still vent, an independent PR model given by Equation (3) was developed. The remaining 30% of data was reserved for model testing and validation.
where:
- is the predicted stage transfer ratio (%) of species i at stage s, computed from the PR model;
- is the intercept, (the constant term);
- , T, and P represent the lean glycol circulation ratio, the inlet wet gas temperature, and pressure at the contactor, respectively;
- through are regression coefficients fitted for species i in stage s.
2.5.2. Outlet Fluid Flows Regression Models
ProMax simulations were conducted to evaluate how inlet wet gas is partitioned across the three vapor-phase outlet streams of the dehydrator unit: dry gas, flash tank emissions, and still vent. A fixed inlet gas flow rate of 1 thousand standard cubic feet per day (Mscfd), (≈415.7 standard cubic feet per hour (scfh)) was used. For each simulation case, the vapor flow rates at each outlet were recorded in scfh. The percentage fraction of each outlet stream was then computed as the ratio of the vapor outlet flow rate to the inlet wet gas vapor flow rate, multiplied by 100:
where s refers to each outlet stream: dry gas, flash tank emissions, and still vent.
For each parameter set, absorption rates were used to develop three separate second-order PR models corresponding to the contactor, flash tank, and still column stages. Seventy percent of the dataset, randomly selected, was used for model training, while the remaining thirty percent was reserved for model testing to evaluate out-of-sample predictive performance.
The generated PR model uses three operational parameters: glycol circulation ratio (), wet gas temperature (T), and wet gas pressure (P). The input terms used in the regression model are:
For each outlet stream s, the flow fraction is computed as:
where are the fitted polynomial coefficients for outlet s (dry gas, flash tank, or still vent), and are the evaluated polynomial terms based on the current operating conditions.
The sum of the three outlet fractions is expected to equal to one. This data-driven approach enables the model to dynamically estimate dry gas flow (sales gas), flash tank emissions and still vent releases from the dehydrator unit under varying real world operating conditions.
2.6. MAES—Dehydrator Model Integration
The dehydrator model is designed to model emissions mechanistically as described in Section S1 of the Supplementary Information (SI). Similar to traditional MAES models, mechanistic models require three critical input files: site-specific operational data, preprocessed gas composition files, and a site configuration schematic. The operational data captures site throughput and equipment-level details, including state transition probabilities where applicable. Gas composition files are tailored to each facility and generated in advance to enhance simulation efficiency. The gas composition files reflect how gas properties evolve as the gas flows through interconnected equipment, accounting for changes in downstream conditions such as temperature and pressure. Site configuration schematics illustrate the flow of fluid between the equipment. These inputs enable MAES to simulate emissions dynamically and accurately along the process stream. The dehydrator model input parameters are described in the SI, Section S2. The model calculates gas composition at each dehydrator outlet using the species-specific absorption or emission rates from Equation (3) and the overall outlet flow fractions from Equation (5).
For each outlet stream s (i.e., dry gas, flash tank, still vent) and species i, the outlet mass concentration is computed as:
where
- : absorption or emission rate for species i in outlet stream s, expressed as a dimensionless fraction;
- : mass concentration of species i in the inlet gas stream, in units of kg/scf;
- : volumetric flow fraction of the inlet gas that exits through outlet stream s, also dimensionless.
This equation calculates the normalized mass of species i per unit volume of outlet stream s (in kg/scf), accounting for the portion of each species directed to outlet s and the corresponding fraction of the total inlet gas volume discharged through that stream.
Outlet Gas Streams from the Dehydrator Model
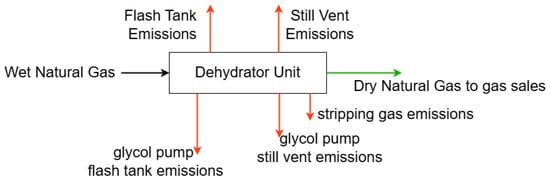
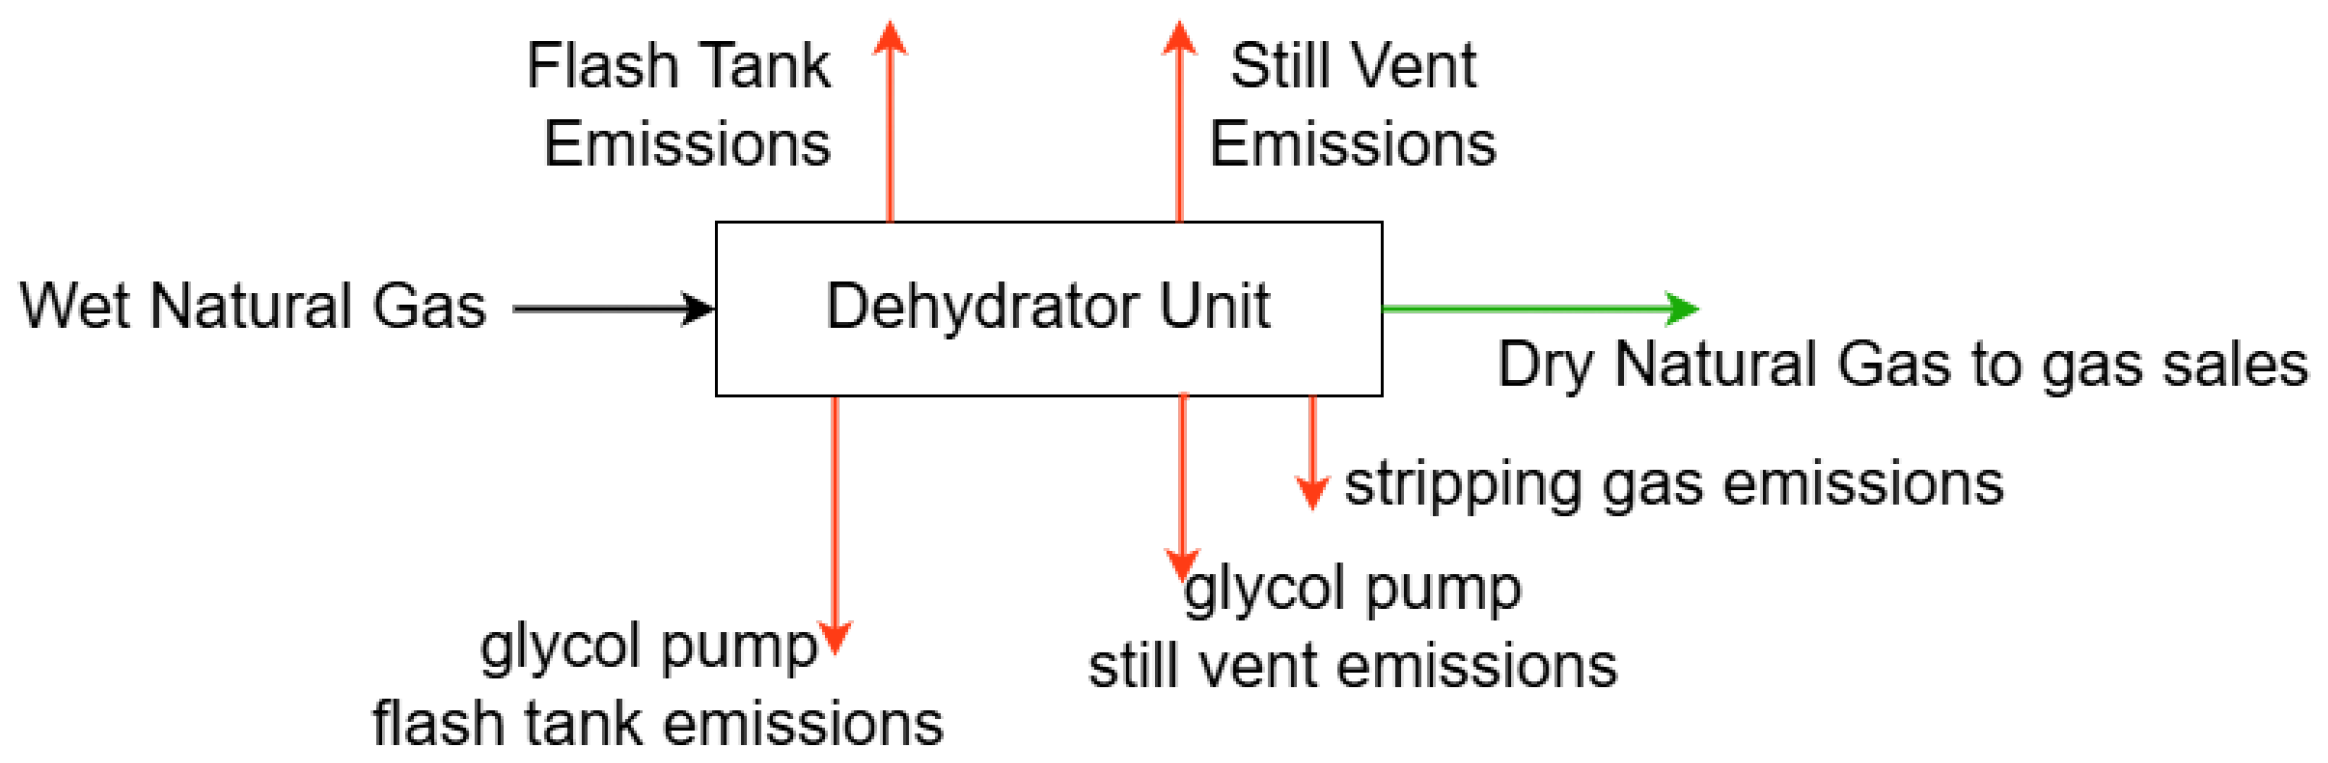
The glycol dehydrator model simulates multiple outlet gas streams, as illustrated in Figure 2 and as described below. The stream names in parentheses correspond to the designated flow identifiers within the MAES framework. The first three streams arise from the contactor tower, where the wet gas interacts with TEG and Equation (5) is applied to calculate them:
Figure 2.
Schematic of a dehydrator unit showing primary outflows of the model. The flash tank and still vent represent the main emission points in the dehydration process, excluding fugitive leaks.
- i
- Dry Gas (gas_sales): The dehydrated methane-rich gas that exits the contactor tower and is sent to gas sales. This is the primary product stream and excludes any volume used to power gas-assisted glycol pumps.
- ii
- Flash Tank Flashes (flash_tank_flashes): Hydrocarbons released from the rich glycol stream due to depressurization in the flash tank. This stream captures emissions separated from the glycol after leaving the contactor.
- iii
- Still Vent Emissions (still_vent_emissions): Hydrocarbons absorbed alongside water vapor in the contactor and later released from the still column during glycol regeneration as the rich glycol is heated and water is boiled off.
Additional emission streams are incorporated based on auxiliary processes and control configurations:
- iv
- Glycol Pump Flash Tank Emissions (glycol_pump_flash_tank_emissions): Emissions from gas-assisted glycol pumps, routed to the flash tank if one is present.
- v
- Glycol Pump Still Vent Emissions (glycol_pump_still_vent_emissions): If no flash tank is installed, the gas-assisted pump emissions are redirected to the still vent.
- vi
- Stripping Gas Emissions (stripping_gas_emissions): Emissions from any stripping gas introduced during glycol regeneration and vented through the still column with the steam.
If emission control devices are connected to the flash tank, still vent, or both, the model reroutes the corresponding outlet flows to the appropriate control devices. Flash tank vapors, for instance, may be reused as reboiler fuel [61]. In such cases, since the model does not simulate emissions from reboiler fuel consumption, these flows are routed to flares, where specified destruction efficiencies are applied to estimate the resulting emissions.
2.7. Model Validation
To validate the performance of the PR models, 30% of the dataset, reserved during the training phase, was used for testing. This validation applied to both the species absorption models (3) and the outlet flow fraction models (5). Model accuracy was evaluated by calculating the RMSE between the PR model predictions and the corresponding ProMax results.
Normalized root mean square error (NRMSE) was also computed to provide a scale-independent assessment of model performance. In this study, NRMSE was normalized using the range of the observed values, defined as , where and represent the maximum and minimum values in the dataset, respectively. This normalization reflects prediction error relative to the full variability of the data and enables consistent comparison of predictive accuracy across model outputs with different magnitudes, including both species absorption rates and outlet flow fractions.
3. Results and Discussion
3.1. Absorption Curve Fits
Understanding NG species absorption rates, particularly for C1 and C2, is essential because the gas absorbed by TEG is ultimately released during glycol regeneration. The absorbed gas serves as a direct source of emissions, occurring at the flash tank, the still vent, or both. Therefore, accurately modeling absorption behavior under varying pressures, temperatures, and glycol circulation ratios is critical to predicting dehydrator emissions in MAES.
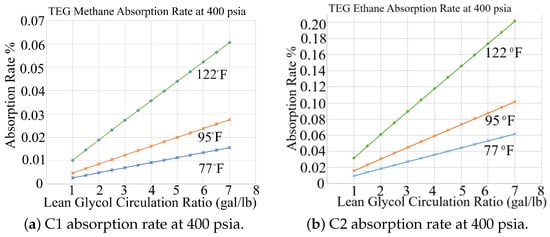
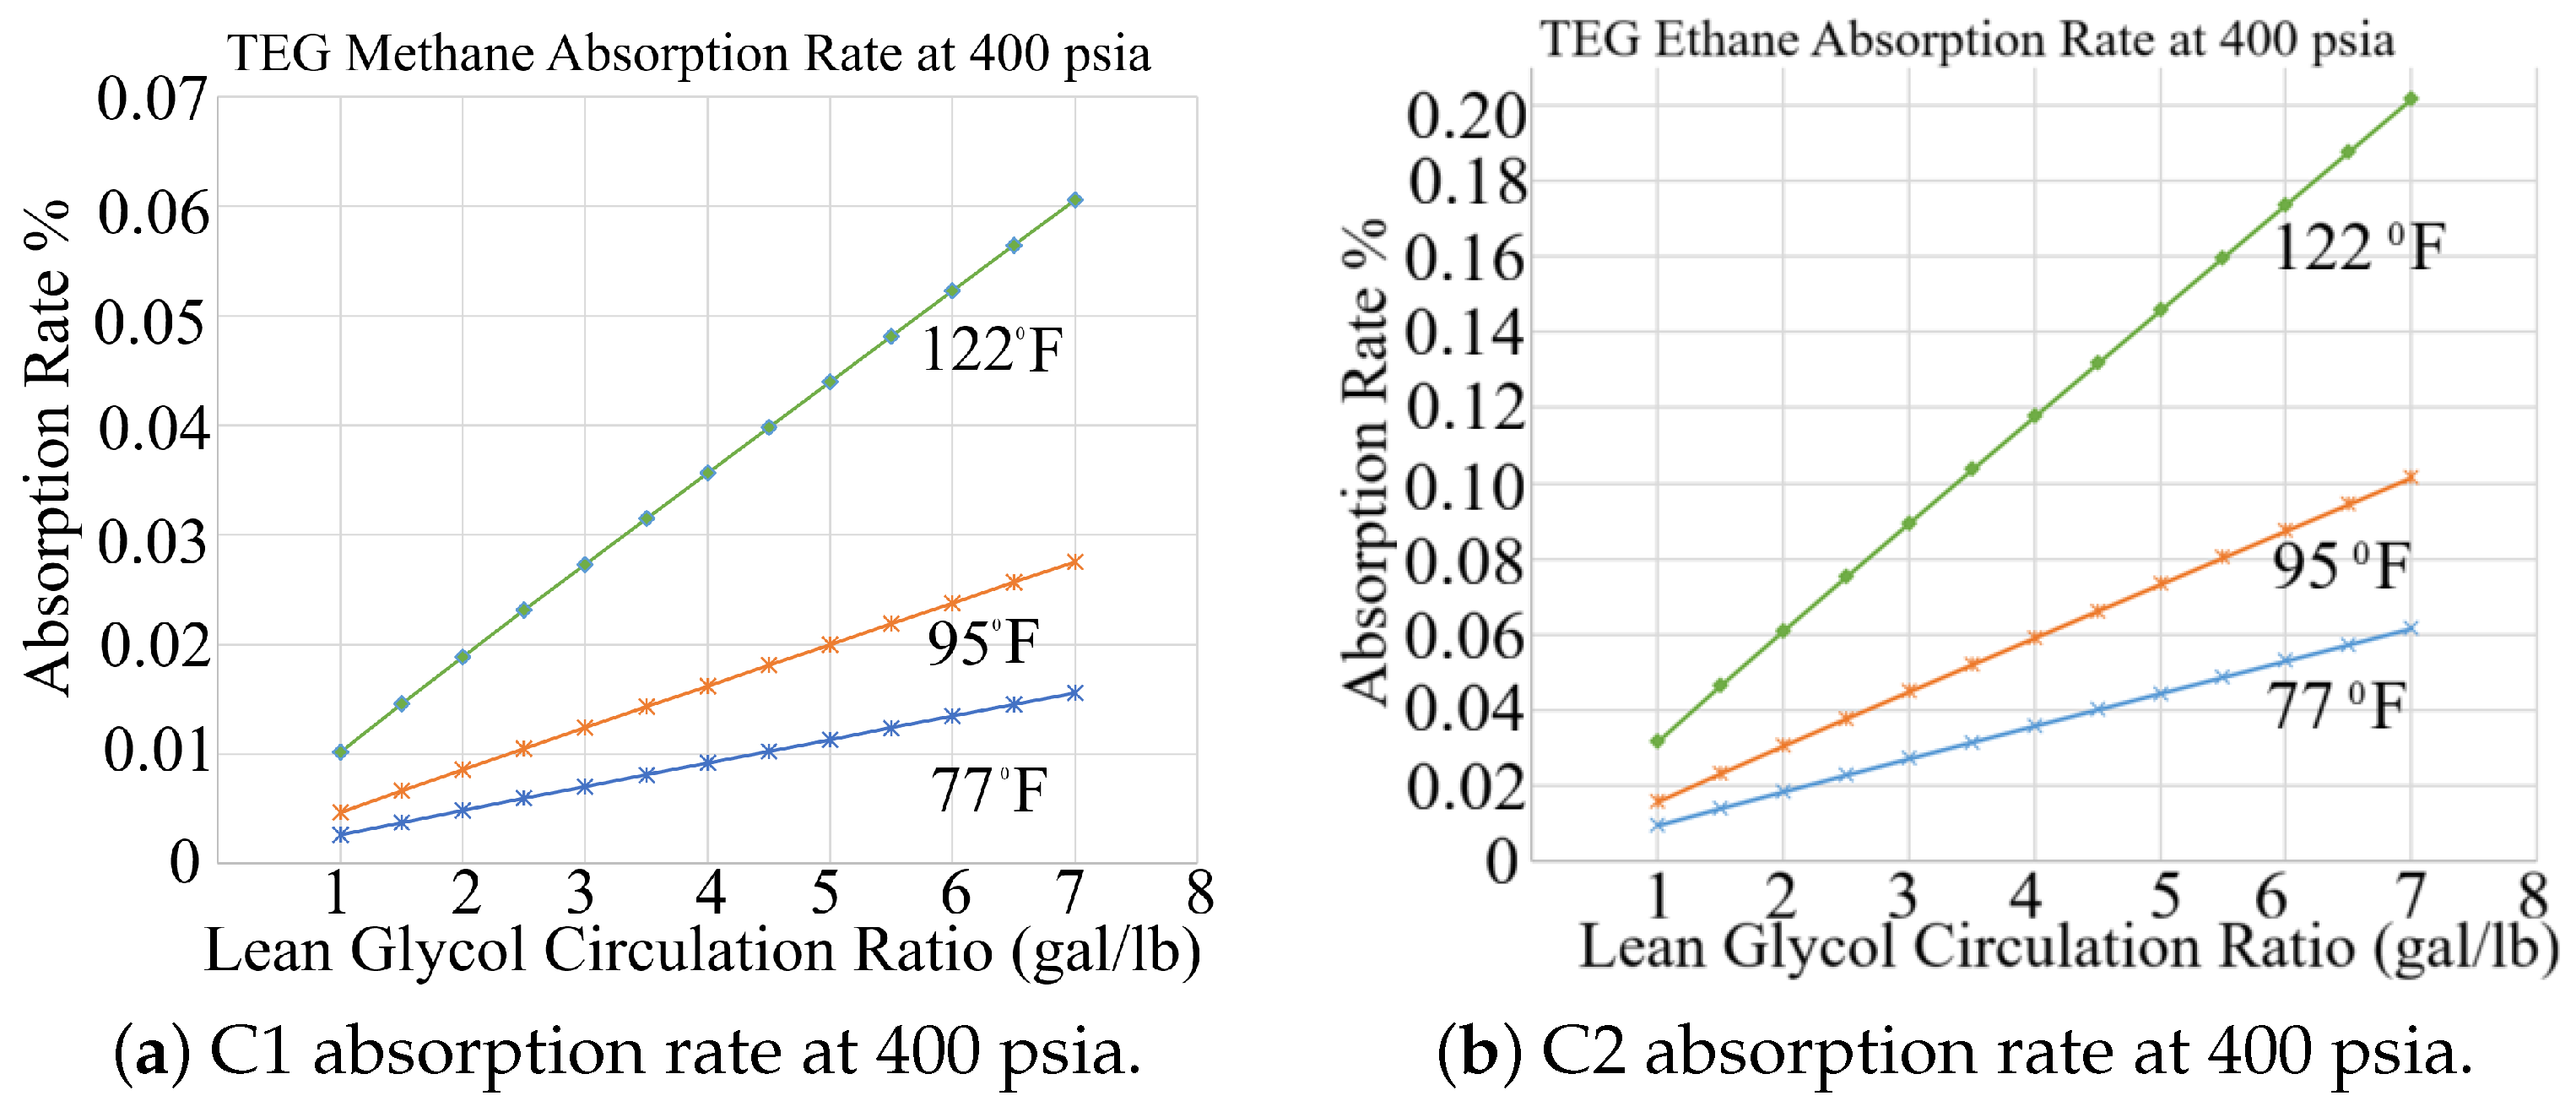
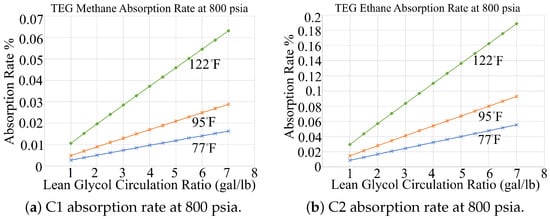
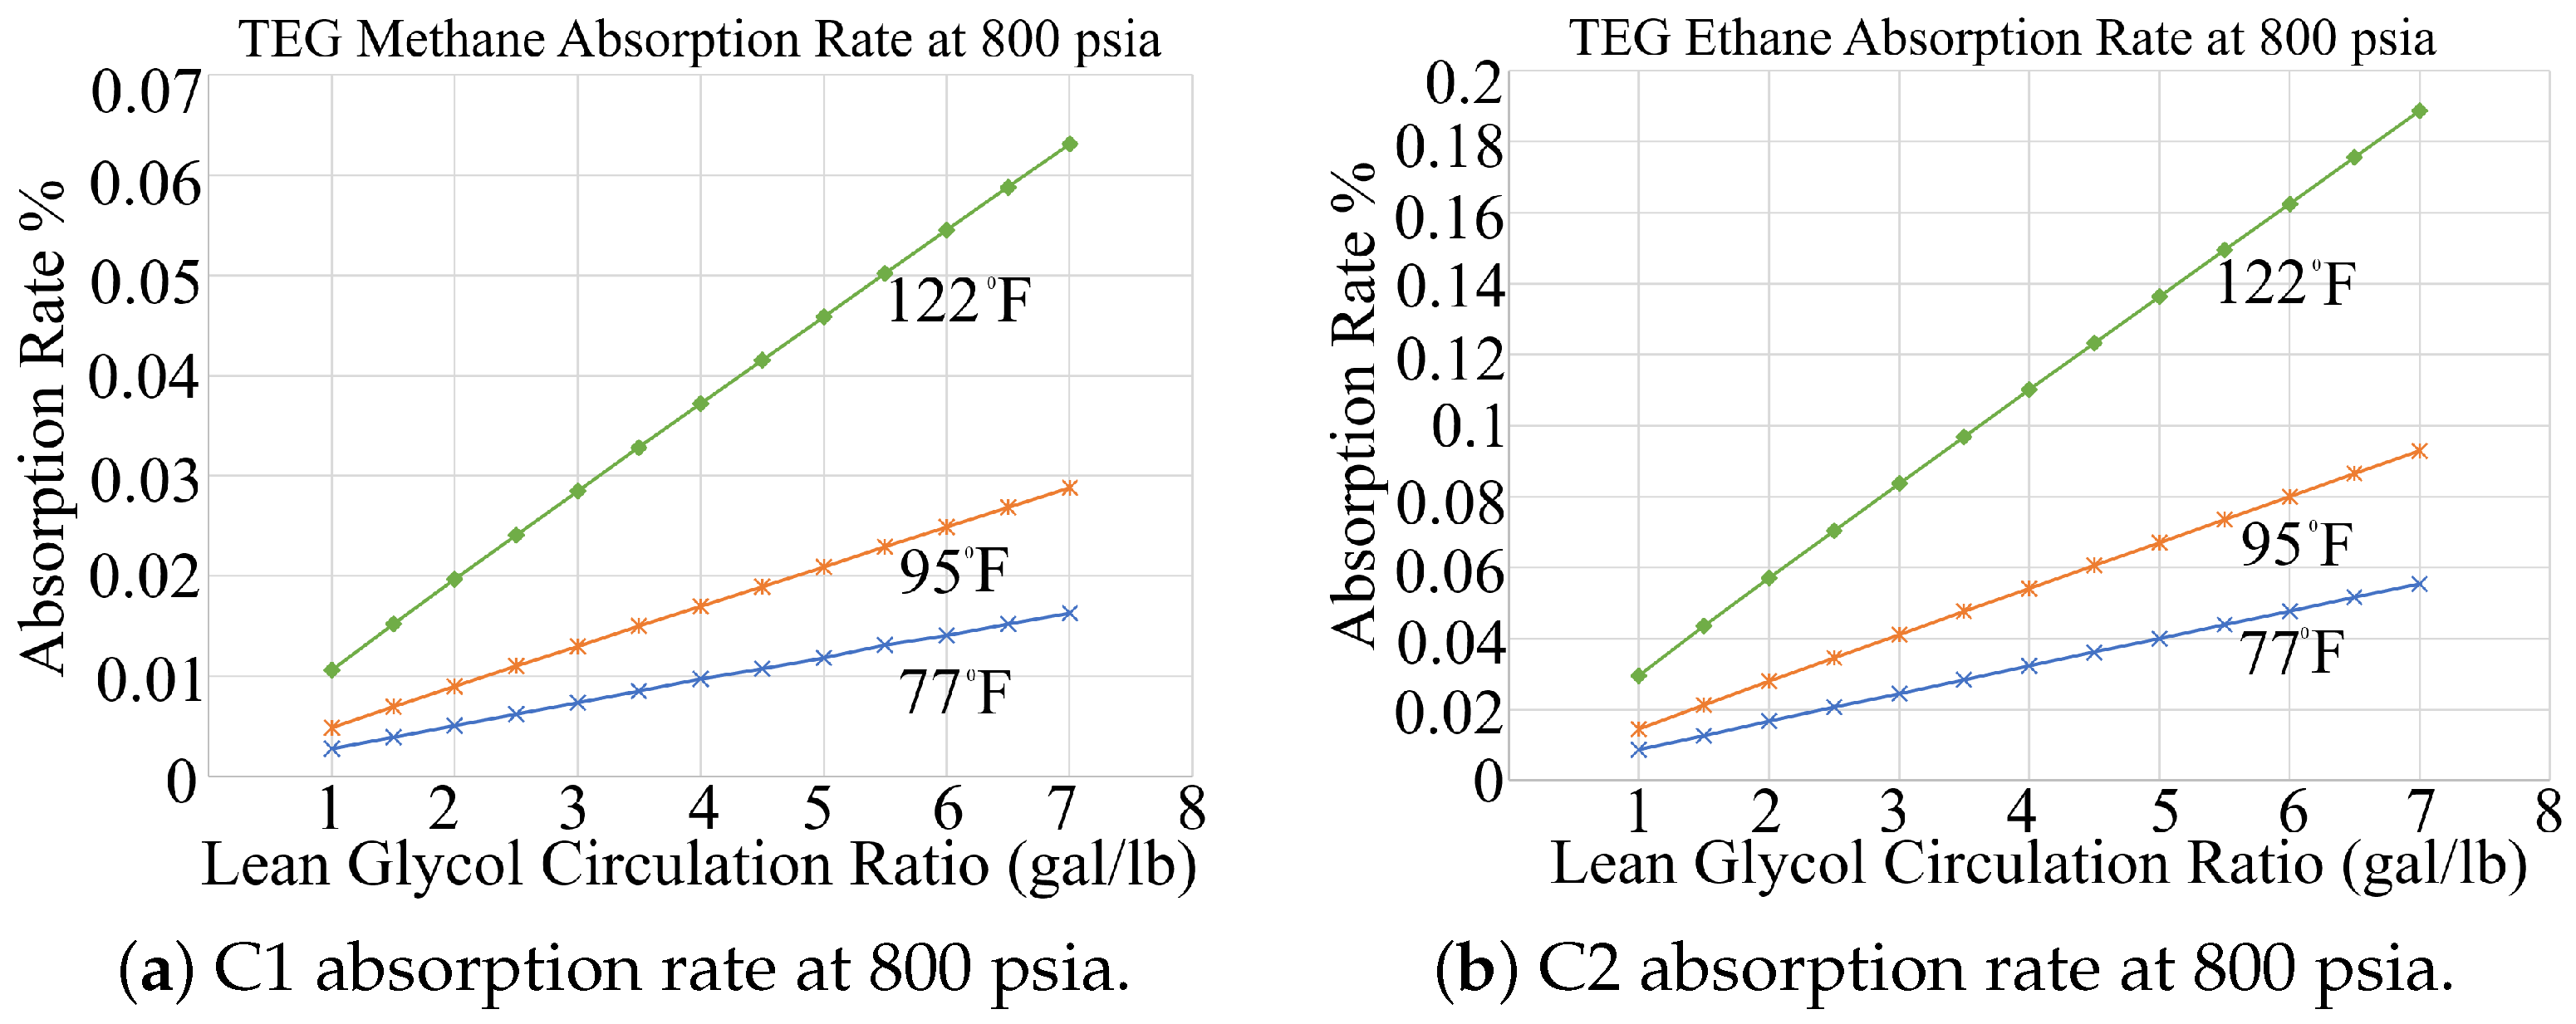
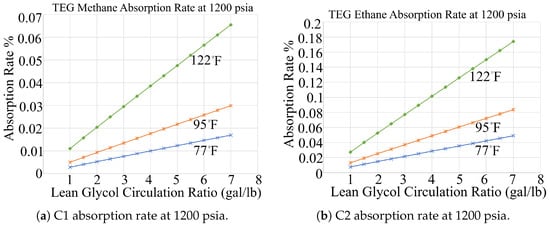
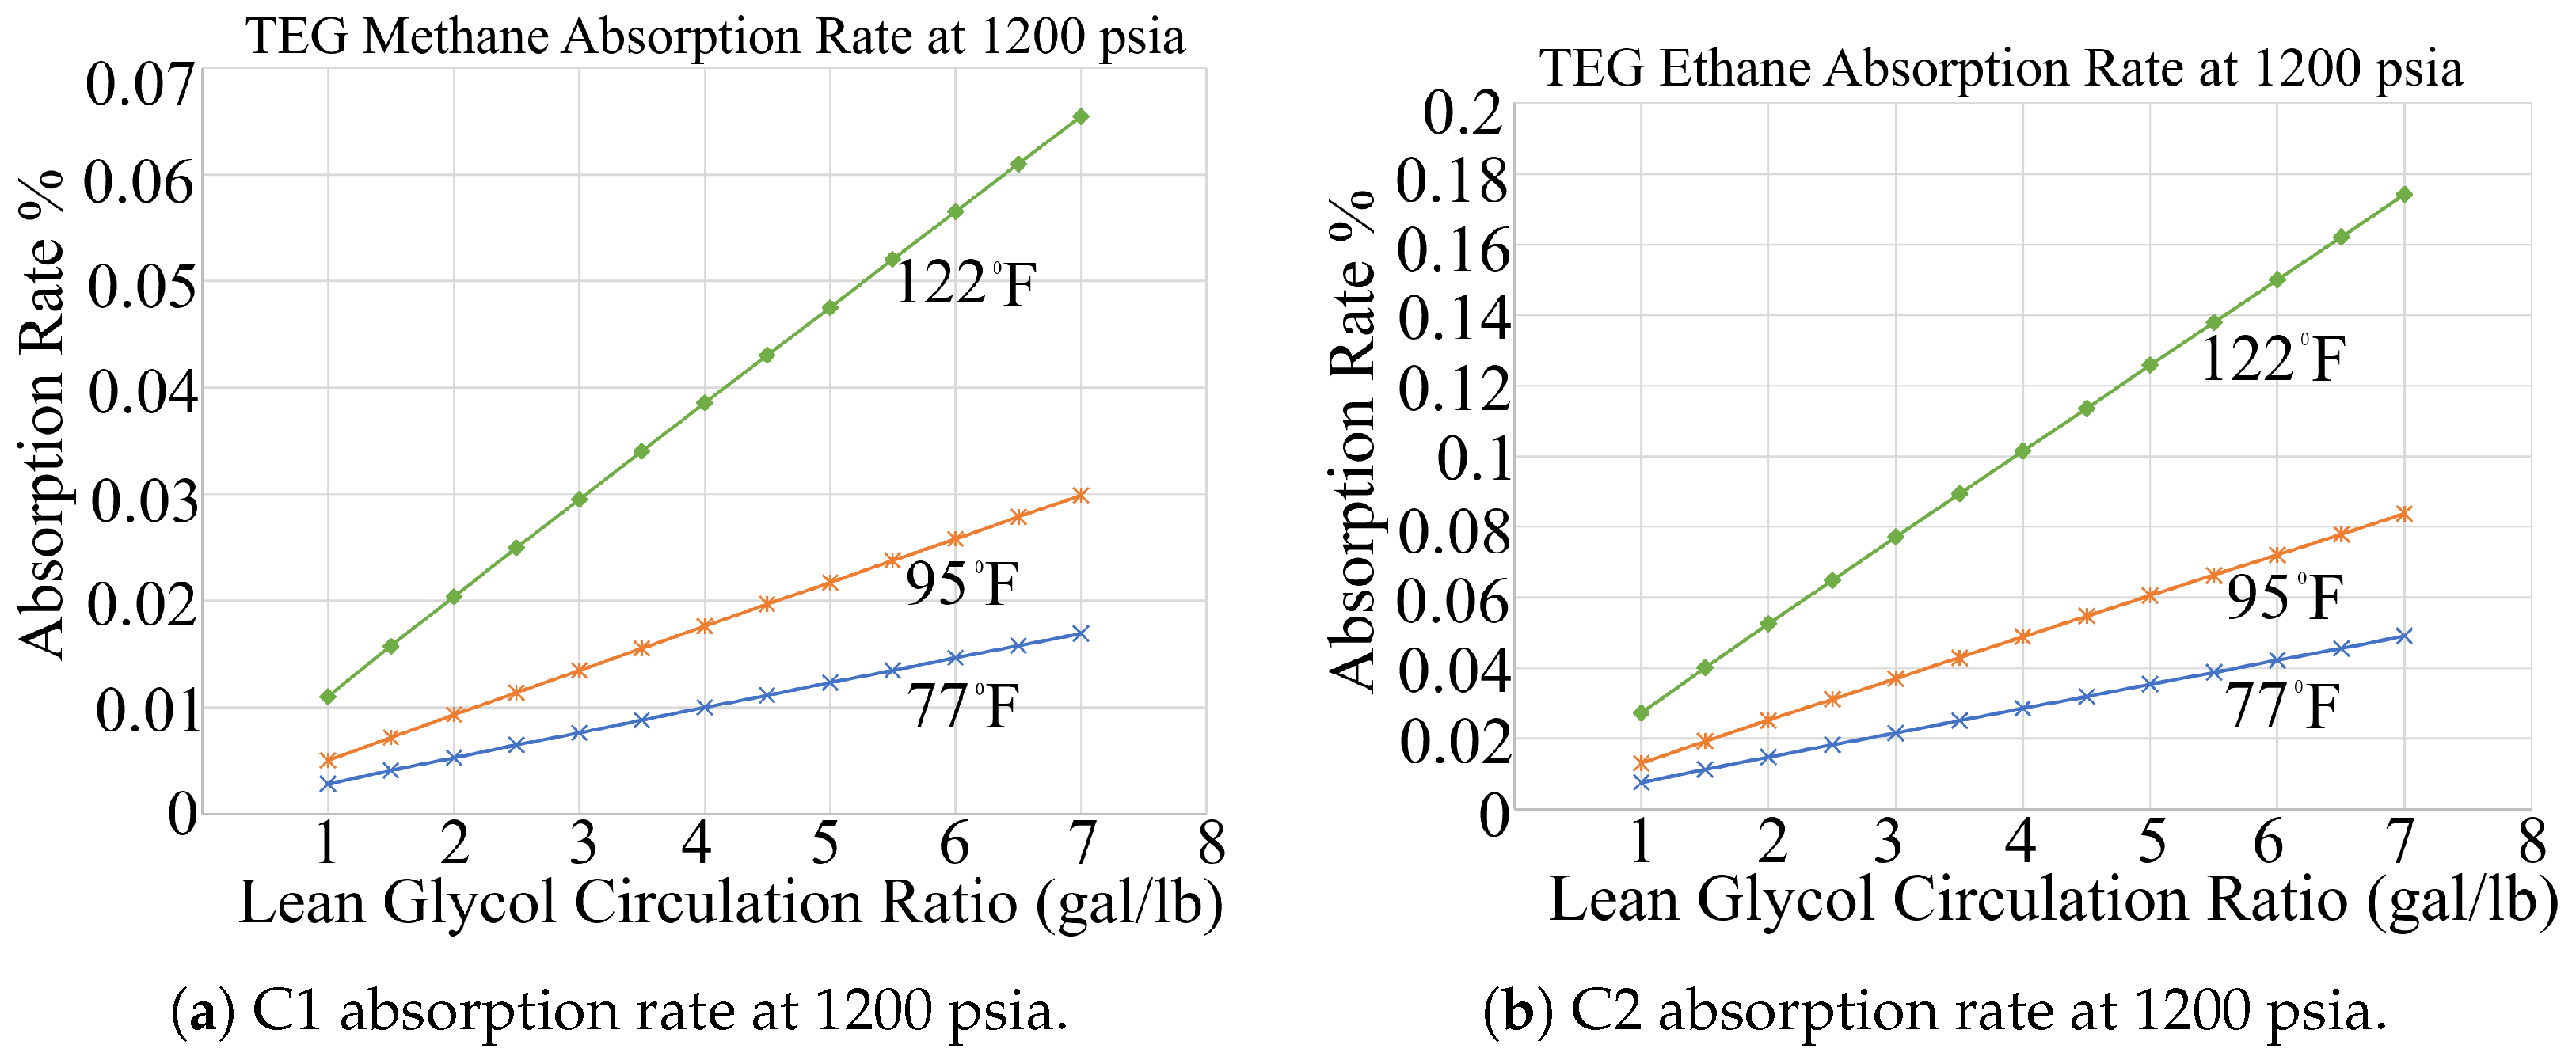
Figure 3, Figure 4 and Figure 5 illustrate the calculated absorption rates of C1 and C2 by TEG using ProMax across three operating pressures: 400 psia (Figure 3a,b), 800 psia (Figure 4a,b), and 1200 psia (Figure 5a,b). In all cases, C2 exhibits significantly higher absorption rates than C1, consistent with the fact that hydrocarbon solubility in TEG increases with molecular weight [62]. Absorption generally increases with higher glycol circulation ratios and temperatures for both species, however, their pressure responses differ. For C1, absorption increases with pressure due to enhanced gas solubility under compression as illustrated in Figure 3a, Figure 4a and Figure 5a. For C2, absorption slightly decreases at higher pressures, likely due to approaching saturation limits or competing phase behavior as seen in Figure 3b, Figure 4b and Figure 5b. C1 remains far from saturation even at elevated pressures, allowing its solubility to continue increasing, whereas C2 may begin to saturate under the same conditions [62].
Figure 3.
Simulated absorption rates of (a) C1 and (b) C2 in TEG at 400 psia across three operating temperatures (77 °F, 95 °F, and 122 °F). Absorption increases with glycol circulation ratio and temperature, with C2 consistently exhibiting higher solubility than C1.
Figure 4.
Simulated absorption rates of (a) C1 and (b) C2 in TEG at 800 psia. At this intermediate pressure, C1 absorption increases with temperature and circulation ratio, whereas C2 absorption decreases. Across all operating conditions, C2 remains substantially more soluble than C1.
Figure 5.
Simulated absorption behavior of (a) C1 and (b) C2 in TEG at 1200 psia. At this elevated pressure, C1 absorption increases under all conditions, whereas C2 absorption decreases. C2 remains considerably more soluble than C1, representing the upper bound of absorption behavior modeled in MAES.
These results characterize the sensitivity of hydrocarbon absorption to operating conditions and directly support the calibration of the MAES dehydrator model. The simulation outputs inform species-specific absorption behavior, enabling more accurate prediction of emissions released during dehydration processes. This understanding is essential for both improving emissions estimates and optimizing dehydration system performance in real-world field applications. The trends also justify the use of multivariate polynomial equations to approximate the absorption behavior of NG species across varying operating conditions.
3.2. Effects of Flow Rate on Methane Absorption Rate
Figure 6 shows that, when all other simulation parameters are held constant, variations in inlet gas flow rate within the tested range have a negligible effect on the C1 absorption rate (R2 = 1.0). This result supports the modeling assumption that flow-rate sensitivity is negligible within the simulated operating envelope. However, this assessment does not extend to extreme flow conditions where contactor hydrodynamics and mass-transfer limitations may become significant.
Figure 6.
Effect of flow rate on C1 absorption rate. Gas flow rates, (i), were varied from 2.9 to 17.5 MMscfd, with a fixed baseline case at 0.5 MMscfd as described in Section 2.4.
Therefore, absorption behavior is driven primarily by thermodynamic conditions (pressure and temperature) and solvent interactions (circulation rate and contact time).
3.3. Polynomial Regression (PR) Models Validation
Performance of the second-order PR models in the MAES dehydrator model was evaluated by comparing predicted absorption and emission rates with ProMax simulation outputs. The focus was on the outlet flow fractions and species-level behavior across the three primary dehydrator components: the contactor tower, flash tank, and still vent. Species validation was performed for light hydrocarbons (C1–C5), heavier species (C6–C9), and inorganics (H2S, CO2, and N2).
As shown in Table 2 and Table 3, the resulting RMSE values are consistently low, confirming the model’s ability to capture the non-linear absorption and emission behavior across a wide range of operating conditions.
Table 2.
RMSE values for light hydrocarbons (C1 to NC5) across dehydrator components.
Table 3.
RMSE values for heavier hydrocarbons and inorganics (C6 to N2).
Table 4 and Table 5 show that the regression models demonstrated strong agreement with the ProMax simulation results. For lighter hydrocarbons (C1–C5), values were generally below 3% in the contactor and flash tank stages and below 4% in the still vent stage. For heavier hydrocarbons (C6–C9), values remained below 17% in the contactor and below 10% and 8% in the flash tank and still vent stages, respectively. Inorganic species (H2S, CO2, and N2) exhibited similarly low prediction errors, with values typically below 3% across all stages. These results indicate that model prediction errors remain small relative to the variability of the simulated operating conditions and demonstrate consistent performance across both major and trace components.
Table 4.
values for light hydrocarbon species across processing stages.
Table 5.
values for heavier hydrocarbons and non-hydrocarbon species across processing stages.
The slightly higher prediction errors observed for heavier hydrocarbon species are primarily associated with their low concentrations in the gas phase, where even small absolute deviations between predicted and simulated values can result in relatively larger normalized errors.
The fitted equations were applied to generate facility-specific gas composition (GC) files that describe species-level absorption at the contactor and emissions at the flash tank and still vent. These pre-processed GC files are input into MAES, improving computational efficiency by eliminating the need for real-time species calculations during simulation runs.
The outlet flow fractions were similarly modeled using pressure, temperature, and glycol circulation ratio, and the PR models in Equation (5) validated against ProMax output. Table 6 shows that these outflow models also achieve low RMSE and NRMSE values, further supporting their use in MAES.
Table 6.
RMSE and for outlet fluid flow fractions (gas sales, flash tank emissions, and still vent emissions).
In addition to error metrics, uncertainty in model predictions arises primarily when the regression equations are applied outside the parameter space used during model calibration. Within the simulated operating envelope, the low RMSE and NRMSE values indicate strong agreement between the polynomial regression models and the ProMax simulation results, suggesting limited predictive uncertainty.
However, when model inputs fall outside the calibrated ranges of circulation ratio, temperature, or pressure, the regression equations may involve extrapolation, which introduces additional uncertainty. Under such conditions, prediction errors may increase because the polynomial relationships were derived from simulations within a bounded operating domain. Therefore, model predictions outside the calibrated parameter space should be interpreted cautiously, and expanding the training domain to include additional operating conditions represents an important direction for future work.
To ensure physical consistency, if any of the three primary calculated outlet stream fractions, , from Equation (5) are negative, an outcome that may occur under extreme operating conditions, default average values from Table 7 are substituted. These default values are computed as the mean fractions obtained from the ProMax simulation dataset used to generate the polynomial regression models (5).
Table 7.
Average outlet stream fractions from ProMax simulations.
This scenario may arise when operating conditions, e.g., the circulation ratio, fall outside the range for which the model was trained. Since the dry gas fraction is just below 1, and the flash tank and still vent fractions are small positive values, the PR model may slightly overestimate the dry gas fraction (i.e., ≥1) and underestimate the others (i.e., <0), particularly the still vent fraction. These deviations reflect extrapolation beyond the model’s calibrated domain and are corrected by substituting with the average values. This ensures mass balance consistency.
3.4. Model Application
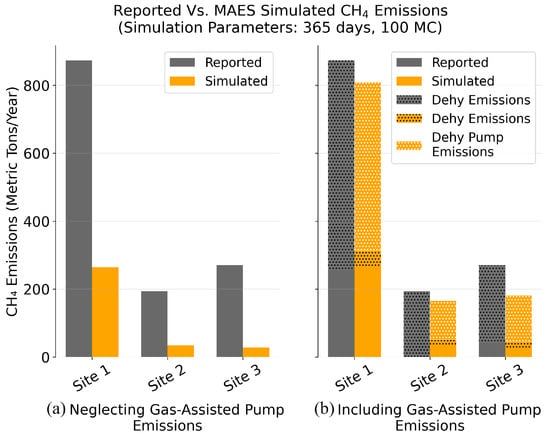
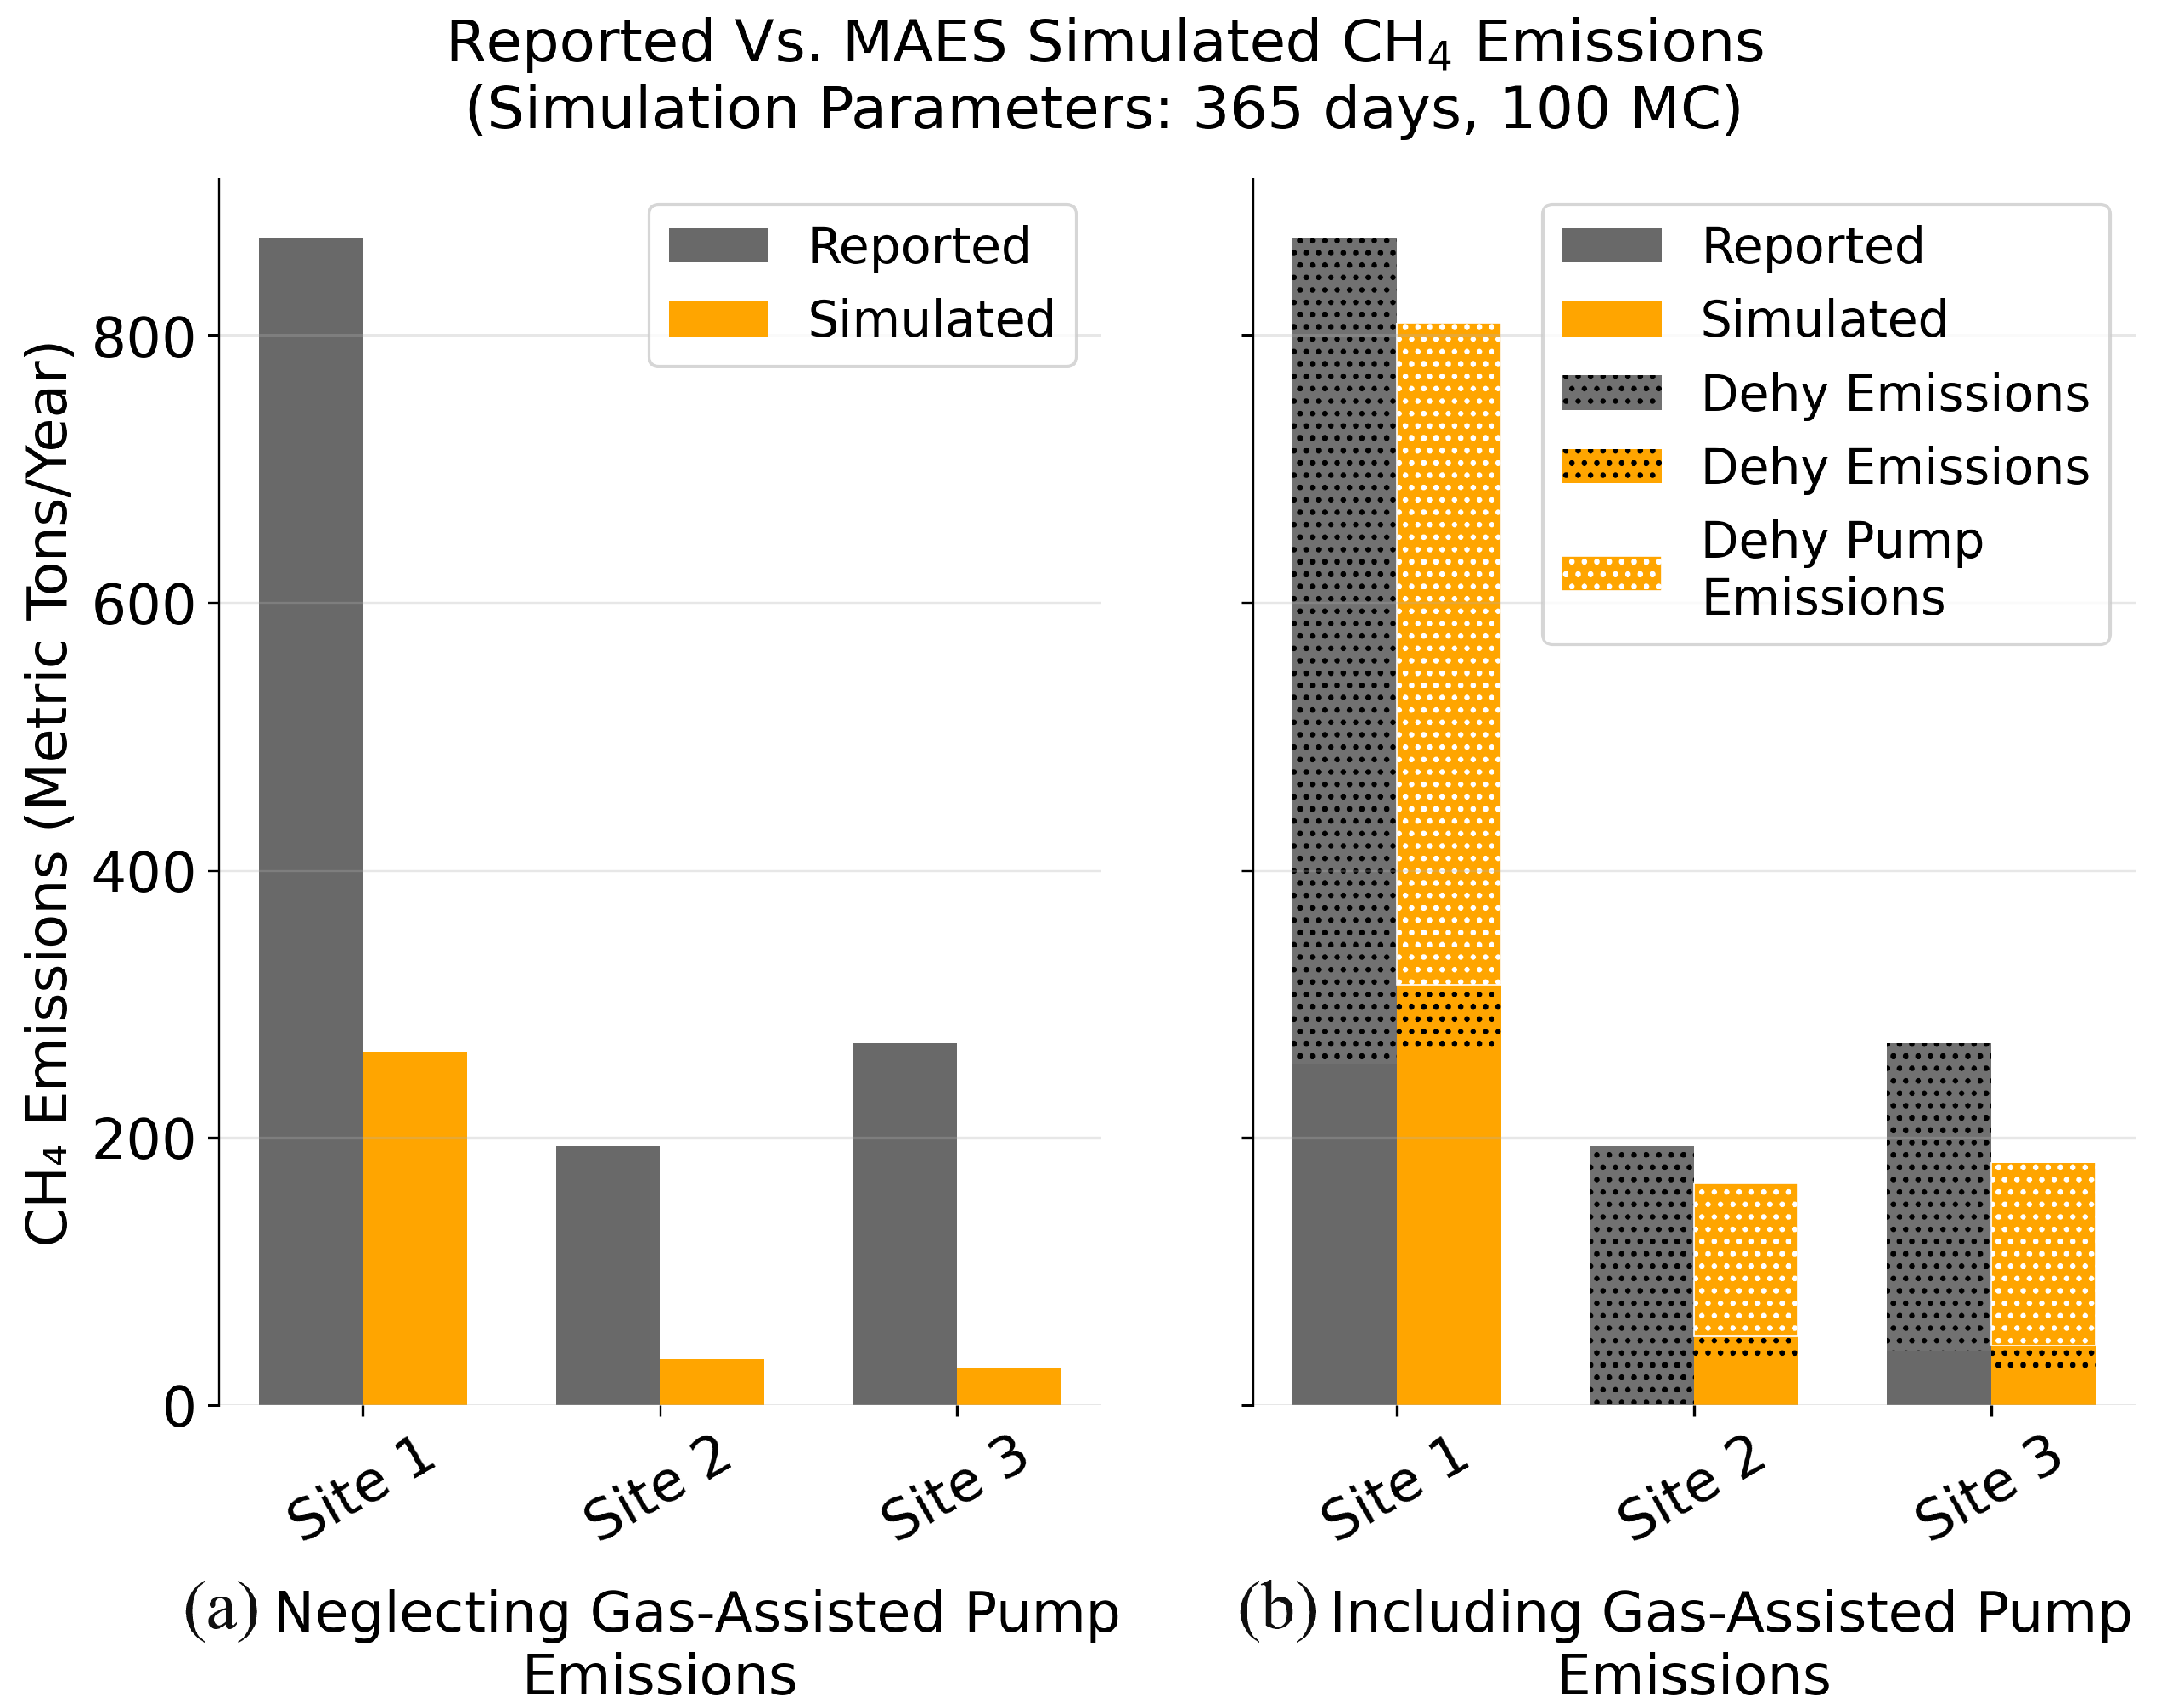
The dehydrator model was first applied in the AMI 2024 Project [63], where MAES was used to simulate measurement-informed inventories for midstream O&G facilities in the Appalachian Basin. For the scope of this paper, the model was deployed at sites operating TEG dehydrators to evaluate its performance under real-world field conditions. This application marked the model’s first large-scale use in an operational inventory setting and enabled direct comparison with reported emissions data. Importantly, it expanded MAES’s capabilities to simulate emissions arising from key dehydrator processes, including absorption of gas species into glycol, emissions resulting from the use of gas-assisted pumps, and the injection of stripping gas during glycol regeneration. This enabled a more comprehensive assessment of dehydrator contributions to total site CH4 emissions. Figure 7 compares reported and simulated emissions for three midstream sites in the basin [63]: (a) with and (b) without the gas pump dehydrator model.
Figure 7.
Comparison of reported and MAES-simulated CH4 emissions for three midstream facilities under two modeling scenarios: (a) MAES dehydrator model neglecting gas-assisted pump emissions, and (b) the model with gas-assisted pump emissions included, explicitly highlighting hatched dehydrator emissions. Each subplot displays reported emissions (gray bars) alongside simulated emissions (orange bars) for each site.
In Figure 7a, MAES significantly underestimates site-level CH4 emissions due to neglecting gas-assisted pump emissions. Once these emissions are incorporated, as shown in Figure 7b, simulated emissions more closely align with reported values across all three facilities. In Figure 7b, the simulated bars are further decomposed using hatched patterns to represent emissions from the dehydrator unit, with a white-hatched overlay indicating the portion attributable to gas-assisted glycol pump operations. The black-hatched portions of the reported bars represent total dehydrator emissions, which include both gas-assisted pump emissions and emissions from gas absorbed in the contactor tower. These results highlight the importance of incorporating a fully characterized dehydrator model within MAES to improve emissions estimates at facilities equipped with gas-assisted glycol pumps.
Despite the improved agreement observed in Figure 7b, MAES-simulated methane emissions remain lower than reported values across the three sites. This difference arises in part from differences in modeling approaches. Reported emissions often rely on static estimates derived from wellhead gas compositions, whereas the MAES framework dynamically simulates gas behavior as it flows through interconnected equipment, capturing compositional changes along the process stream.
Another important factor influencing the observed discrepancy is the unusually high glycol circulation ratios reported at these facilities, namely 18.3, 31.5, and 71.6 gal/lb of water removed for Sites 1, 2, and 3, respectively. These values are well above both the EPA-recommended range of 3–5 gal/lb [64] and the model’s calibrated range of 1–7 gal/lb. The circulation ratios observed at these facilities therefore exceed the parameter space used during regression model development, indicating that the simulations involve extrapolation beyond the calibrated domain. Under such conditions, the polynomial regression model may underestimate absorption-driven emissions because the relationship between circulation ratio and hydrocarbon absorption becomes increasingly nonlinear at high solvent flow rates.
While the exact contribution of extrapolation error cannot be directly quantified without additional high-circulation-ratio simulations, the systematic underprediction observed in Figure 7b is consistent with this limitation. Importantly, these extreme circulation ratios are themselves indicative of operational inefficiencies, as they substantially exceed recommended operating practices. Consequently, the model results should be interpreted as conservative estimates of emissions under these atypical operating conditions. Expanding the regression training domain to include higher circulation ratios represents an important direction for future work.
Contribution of Glycol Pumps to Dehydrator Emissions
Operational site data from the AMI 2024 Project revealed that out of 174 modeled dehydrator units across five study partners, 54 units (31.0%) used gas-assisted glycol pumps [63]. Among these, 6 units (11.1%) had uncontrolled flash tanks, and 22 units (40.7%) were identified as potentially oversized, defined here as operating with circulation ratios above 7 gal/lb, which significantly exceeds the EPA-recommended range of 3–5 gal/lb and can amplify emissions. Oversizing is primarily a legacy design issue; pumps were originally sized to handle peak production rates, but as throughput declined over time, these higher-capacity pumps remained in place. This results in pumps operating with circulation ratios well above the EPA-recommended 3–5 gal/lb range [64], with some facilities exceeding 80 gal/lb due to pump designs that require a minimum circulation rate [65]. These high circulation rates increase CH4 absorption and enhance the uptake of more soluble aromatic hydrocarbons, such as benzene, toluene, ethylbenzene, and xylene (BTEX) compounds, into the glycol, which are subsequently released during regeneration. Oversized pumps exacerbate this issue by maintaining unnecessarily high circulation rates, requiring additional gas to operate, and thereby compounding total emissions. As shown in Section S3 of the SI, for the six units with uncontrolled flash tanks, 90.25% of total dehydrator emissions were attributed to gas-assisted glycol pump emissions, with site-level contributions ranging from 83.2% to 92.4%. When compared to overall site emissions, pump-related emissions accounted for an average of 63.1%, underscoring a key opportunity for targeted CH4 mitigation.
These findings highlight two important insights:
- 1.
- Replacing gas-assisted pumps with instrument-air or electric-driven pumps could immediately eliminate a major source of dehydrator emissions.
- 2.
- Implementing emission control devices on flash tanks and still vent columns, or reusing the flashed gas, can potentially reduce overall site emissions by 63%.
3.5. Model Limitations
The current dehydrator model, while effective for simulating steady-state emissions, is subject to some limitations. First, it does not capture failure modes or upset conditions, such as gas-assisted pump malfunctions, that can to significantly impact emissions. For example, during the 2024 AMI campaign, a dehydrator failure event was observed emitting 138 kg/hr [63], highlighting the influence of rare upset events on total emissions. This is equivalent to a failure rate of 0.00143678 based on quarterly scans on 174 dehydrator units over four quarters. Additional data are needed to incorporate these failure rates into the model to more accurately represent dehydrator malfunction emissions.
The model was calibrated using ProMax-generated data and operates within a validated glycol circulation range of 1–7 gal/lb of water removed. Facilities with operating conditions outside this range, may exhibit model extrapolation errors. In addition, because the model relies exclusively on ProMax simulations for calibration, any biases or simplifications inherent in ProMax could propagate into the model’s predictions.
The model also omits emissions from fuel combustion in the reboiler, a non-trivial source of CO2, as well as potential CH4 slip. Future development should incorporate this feature to capture additional emission sources from dehydrator units and improve understanding of their overall contribution.
4. Conclusions
This study developed and validated a mechanistic, facility-specific model for estimating methane and hydrocarbon emissions from TEG dehydration units in midstream O&G operations. The MAES dehydrator model integrates species-level absorption and emission regressions, state-machine logic, and detailed flash and still vent modeling to simulate emissions under realistic operating conditions.
ProMax simulations further demonstrated that methane and ethane absorption rates are independent of gas throughput, as it serves only as a scaling factor for total absorbed mass. While higher throughput increases the absolute quantity of gas absorbed, the absorption rate for each species remains unchanged under the same pressure, temperature, and glycol circulation conditions. This validates the use of flow-independent polynomial regression models. The interaction of the wet inlet gas with lean glycol at the contactor tower results in an average dry gas fraction of 0.9995568 exiting the top of the tower, with corresponding average fractions of 0.0002856 at the flash tank and 0.0001450 at the still column. The flash tank and still vent fractions represent the primary sources of dehydrator emissions in the absence of gas pumps and stripping gas, and contribute directly to CH4 release if not routed to appropriate control devices.
When applied to midstream facilities in the 2024 AMI project, the model closely aligned with reported emissions and provided critical source-level insights. Gas-assisted glycol pumps were confirmed as the dominant contributor, accounting for 90.25% of total dehydrator-related emissions and 63.10% of total site-level emissions under uncontrolled conditions. The analysis also revealed that 40.7% of the gas-assisted pumps operated with circulation ratios exceeding the EPA-recommended range of 3–5 gal/lb, with some facilities reporting circulation ratios greater than 80 gal/lb. Elevated circulation rates increase the absorption of methane and BTEX compounds into the glycol, which are subsequently released during the regeneration process, while providing little additional benefit in reducing the water content of the dry gas.
Equipment upgrades and operational improvements present significant opportunities for reducing emissions from glycol dehydration systems. Based on the findings of this study and EPA guidance, several engineering measures are recommended. First, glycol circulation rates should be optimized to operate within the EPA-recommended range of 3–5 gal/lb to minimize unnecessary hydrocarbon absorption during dehydration. Second, uncontrolled flash tanks should be retrofitted with vapor recovery units or combustion control devices to capture methane and BTEX emissions prior to atmospheric release. Implementing these measures can significantly reduce emissions while maintaining effective dehydration performance.
In addition to process-level optimization of dehydrator operations, comprehensive methane mitigation across natural gas facilities requires systematic management of fugitive emissions from equipment components. Leak detection and repair programs, supported by advances in detection technologies and targeted maintenance strategies, have demonstrated significant potential to reduce methane emissions from valves, connectors, and other equipment components in oil and gas systems. These approaches complement the process-level emission reduction strategies identified in this study and together support more effective facility-wide methane mitigation efforts [66].
Limitations of this study include the reliance on steady-state ProMax simulations rather than field measurements, which may not fully capture operational variability or transient upset conditions. The model was developed within a defined operating envelope for circulation ratio, temperature, and pressure; therefore, its predictive capability is intended for interpolation within the simulated parameter space rather than extrapolation beyond these conditions. In addition, the absorber was represented using three theoretical equilibrium stages due to the absence of detailed site-specific tower design data (e.g., packing height or tray count). Although prior studies suggest that three equilibrium stages approximate typical industrial performance under common circulation rates, deviations may occur for systems with substantially different internal configurations. The current framework also does not explicitly quantify uncertainty intervals in the regression predictions and does not include fuel combustion emissions associated with the reboiler burner. Despite these limitations, the use of pre-fitted species regression models enables transparent, computationally efficient, and reproducible simulations that can be scaled across multiple dehydration facilities, addressing key transparency and accessibility gaps present in many existing proprietary emission estimation tools.
Future work will focus on incorporating failure modes, refining fuel-use estimates, expanding the circulation ratio range in ProMax simulations to enable new PR model fits, and investigating the impact of glycol purity on absorption rates.
Supplementary Materials
The following supporting information can be downloaded at: https://www.mdpi.com/article/10.3390/fuels7020021/s1. Figure S1: Mechanistic dehydrator model state-machine architecture showing a persistent operating state; Figure S2: Simulated methane emissions from dehydrator units highlighting contributions from gas-assisted glycol pumps; Table S1: Description of input parameters for the mechanistic TEG dehydrator emissions model.
Author Contributions
J.M., A.S., and G.D. contributed to the conceptualization; J.M., A.S., and P.V. developed the methodology; J.M. and A.S. performed the validation; J.M., A.S., and K.S. conducted the formal analysis; J.M. and A.S. prepared the original draft; J.M., A.S., K.S., and P.V. contributed to the review and editing; A.S. and D.Z. supervised the work; and A.S. and D.Z. acquired the funding. All authors have read and agreed to the published version of the manuscript.
Funding
This material is based upon work supported by the Department of Energy under Award Number DE-FE0032311.
Data Availability Statement
The original contributions presented in this study are included in this article; further inquiries can be directed to the corresponding author.
Acknowledgments
This study was conducted as part of the AMI 2024 project and supported by the Department of Energy under Award Number DE-FE0032311 in collaboration with EEMDL. The authors would like to appreciate the participating operators and the entire EEMDL team for their valuable support and collaboration. All individuals acknowledged have provided consent for inclusion in this section.
Conflicts of Interest
This report was prepared as an account of work sponsored by an agency of the United States Government. Neither the United States Government nor any agency thereof, nor any of their employees, makes any warranty, express or implied, or assumes any legal liability or responsibility for the accuracy, completeness, or usefulness of any information, apparatus, product, or process disclosed, or represents that its use would not infringe privately owned rights. Reference herein to any specific commercial product, process, or service by trade name, trademark, manufacturer, or otherwise does not necessarily constitute or imply its endorsement, recommendation, or favoring by the United States Government or any agency thereof. The views and opinions of authors expressed herein do not necessarily state or reflect those of the United States Government or any agency thereof.
References
- Hammerschmidt, E.G. Formation of gas hydrates in natural gas transmission lines. Ind. Eng. Chem. 1934, 26, 851–855. [Google Scholar] [CrossRef] [Scilit]
- Hammerschmidt, E.G. Preventing and removing gas hydrate formations in natural gas pipe lines. Oil Gas J. 1939, 37, 66–72. [Google Scholar]
- U.S. Environmental Protection Agency. Glycol Dehydrators. 2023. Available online: https://www.epa.gov/natural-gas-star-program/glycol-dehydrators (accessed on 3 July 2025).
- Gas Processors Suppliers Association. GPSA Engineering Data Book, 14th ed.; Section 20, Hydrates in Natural Gas Systems; Gas Processors Suppliers Association: Tulsa, OK, USA, 2011. [Google Scholar]
- National Research Council; Division on Earth and Life Studies; Board on Earth Sciences and Resources; Committee on Earth Resources; Committee on Assessment of the Department of Energy’s Methane Hydrate Research and Development Program: Evaluating Methane Hydrate as a Future Energy Resource. Realizing the Energy Potential of Methane Hydrate for the United States; National Academies Press: Washington, DC, USA, 2009. [Google Scholar]
- Carroll, J. Natural Gas Hydrates: A Guide for Engineers; Gulf Professional Publishing: Houston, TX, USA, 2020. [Google Scholar]
- Mountain West Pipeline, LLC. FERC Gas Tariff Second Revised Volume No. 1. 2022. Available online: https://www.mwpipe.com/mwpipe/pdf/MWP-TARIFF.pdf (accessed on 26 August 2025).
- Northern Natural Gas Company. Gas Quality Requirements. 2025. Available online: https://www.northernnaturalgas.com/infopostings/GasQuality/Pages/Requirements.aspx (accessed on 26 August 2025).
- Empire Pipeline, Inc. FERC Gas Tariff First Revised Volume No. 1. 2020. Available online: https://informationalpostings.natfuel.com/empire/docs/empiretariff.pdf (accessed on 26 August 2025).
- Office of Oil and Gas, Energy Information Administration. Natural Gas Processing: The Crucial Link Between Natural Gas Production and Its Transportation to Market; Technical Report; U.S. Energy Information Administration: Washington, DC, USA, 2006. [Google Scholar]
- Yang, Y.; Huang, F.; Kang, S. Mechanism of Penetration Rate Improvement in Hot Dry Rock Under the Coupling of Impact Load and Confining Pressure Release. Reserv. Sci. 2026, 2, 52–64. [Google Scholar] [CrossRef] [Scilit]
- Kidnay, A.J.; Parrish, W.R.; McCartney, D.G. Fundamentals of Natural Gas Processing; CRC Press: Boca Raton, FL, USA, 2019. [Google Scholar]
- Jechura, J. Gas Dehydration. 2019. Available online: https://people.mines.edu/jjechura/wp-content/uploads/sites/120/2019/02/CBEN408_08_Dehydration.pdf (accessed on 26 August 2025).
- Kimray, Inc. Gas Dehydration System Overview. Available online: https://kimray.com/training/gas-dehydration-system-overview (accessed on 3 July 2025).
- Myers, D. Methane Emissions from the Natural Gas Industry; Glycol Dehydrators. Final Report, March 1991–April 1996. Technical Report; Radian Corp.: Austin, TX, USA, 1996; Volume 14. [Google Scholar]
- Kirchgessner, D.A.; Lott, R.A.; Cowgill, R.M.; Harrison, M.R.; Shires, T.M. Estimate of methane emissions from the US natural gas industry. Chemosphere 1997, 35, 1365–1390. [Google Scholar] [CrossRef] [Scilit] [PubMed]
- U.S. Environmental Protection Agency. Methane Emissions from the Natural Gas Industry; Volume 14: Glycol Dehydrators. Technical Report EPA-600/R-96-080n; U.S. Environmental Protection Agency, Office of Air and Radiation: Washington, DC, USA, 1996. [Google Scholar]
- U.S. Environmental Protection Agency. Methane Emissions from the Natural Gas Industry; Volume 15: Gas-Assisted Glycol Pumps. Technical Report EPA-600/R-96-080o; U.S. Environmental Protection Agency, Office of Air and Radiation: Washington, DC, USA, 1996. [Google Scholar]
- Climate and Clean Air Coalition (CCAC); Oil and Gas Methane Partnership (OGMP). Technical Guidance Document 5: Glycol Dehydrators; Technical Report; United Nations Environment Programme: Nairobi, Kenya, 2017. [Google Scholar]
- Alberta Energy Regulator. Manual 015: Estimating Methane Emissions; Technical Report; Alberta Energy Regulator: Calgary, AB, Canada, 2023. [Google Scholar]
- Forster, P.; Storelvmo, T.; Armour, K.; Collins, W.; Dufresne, J.L.; Frame, D.; Lunt, D.J.; Mauritsen, T.; Palmer, M.D.; Watanabe, M.; et al. The Earth’s Energy Budget, Climate Feedbacks, and Climate Sensitivity. In Climate Change 2021: The Physical Science Basis. Contribution of Working Group I to the Sixth Assessment Report of the Intergovernmental Panel on Climate Change; Masson-Delmotte, V., Zhai, P., Pirani, A., Connors, S.L., Péan, C., Berger, S., Caud, N., Chen, Y., Goldfarb, L., Gomis, M.I., et al., Eds.; Cambridge University Press: Cambridge, UK; New York, NY, USA, 2021; pp. 923–1054. [Google Scholar] [CrossRef] [Scilit]
- Environmental Defense Fund. Methane: A Crucial Opportunity in the Climate Fight. 2023. Available online: https://www.edf.org/climate/methane-crucial-opportunity-climate-fight (accessed on 8 July 2025).
- Climate and Clean Air Coalition. Methane. 2023. Available online: https://www.ccacoalition.org/short-lived-climate-pollutants/methane (accessed on 8 July 2025).
- U.S. Environmental Protection Agency. U.S. Environmental Protection Agency. 2025. Available online: https://www.epa.gov/ (accessed on 26 August 2025).
- U.S. Environmental Protection Agency. National Emission Standards for Hazardous Air Pollutants Compliance Monitoring. 2025. Available online: https://www.epa.gov/compliance/national-emission-standards-hazardous-air-pollutants-compliance-monitoring (accessed on 26 August 2025).
- Dumitrache, L.; Suditu, S.; Branoiu, G.; Neagu, D.; Alecu, M.D. Carbon Management and Storage for Oltenia: Tackling Romania’s Decarbonization Goals. Sustainability 2025, 17, 6793. [Google Scholar] [CrossRef] [Scilit]
- Jacob, D.J.; Turner, A.J.; Maasakkers, J.D.; Sheng, J.; Sun, K.; Liu, X.; Chance, K.; Aben, I.; McKeever, J.; Frankenberg, C. Satellite observations of atmospheric methane and their value for quantifying methane emissions. Atmos. Chem. Phys. 2016, 16, 14371–14396. [Google Scholar] [CrossRef] [Scilit]
- Jacob, D.J.; Varon, D.J.; Cusworth, D.H.; Dennison, P.E.; Frankenberg, C.; Gautam, R.; Guanter, L.; Kelley, J.; McKeever, J.; Ott, L.E.; et al. Quantifying methane emissions from the global scale down to point sources using satellite observations of atmospheric methane. Atmos. Chem. Phys. Discuss. 2022, 2022, 11255–11274. [Google Scholar] [CrossRef] [Scilit]
- European Union. Regulation (EU) 2024/1787 of the European Parliament and of the Council of 13 June 2024 on Methane Emissions Reduction in the Energy Sector and Amending Regulation (EU) 2019/942; European Union: Brussels, Belgium, 2024. [Google Scholar]
- MiQ. MiQ Standard: The Methane Emissions Performance Standard for the Oil and Gas Industry. 2021. Available online: https://miq.org/the-technical-standard/ (accessed on 30 September 2025).
- United Nations Environment Programme. OGMP 2.0 Framework for Reducing Methane Emissions. 2020. Available online: https://www.unep.org (accessed on 1 April 2025).
- The Intergovernmental Panel on Climate Change (IPCC). 2019 Refinement to the 2006 IPCC Guidelines for National Greenhouse Gas Inventories. 2024. Available online: https://www.ipcc.ch/report/2019-refinement-to-the-2006-ipcc-guidelines-for-national-greenhouse (accessed on 1 April 2025).
- Stern, J.; Olczak, M. EU Methane Import Requirements: Can a Regulation Change How and from Where the EU Buys Gas? Energy Transition Insight ET 44; Oxford Institute for Energy Studies: Oxford, UK, 2025. [Google Scholar]
- U.S. Environmental Protection Agency. Methane Emissions from Natural Gas Dehydrators; Technical Report; Durango, CO Case Study; EPA Natural Gas STAR Program: Washington, DC, USA, 2007. [Google Scholar]
- U.S. Environmental Protection Agency. Reducing Methane Emissions from Dehydrators; Technical Report; Vernal, UT Case Study; EPA Natural Gas STAR Program: Washington, DC, USA, 2010. [Google Scholar]
- Gas Technology Institute. GRI-GLYCALC Software Version 4.0. 2023. Available online: https://www.gti.energy/gri-glycalc-software-version-4-0/ (accessed on 8 July 2025).
- Bryan Research & Engineering, LLC. ProMax Glycol Dehydration Emissions. Available online: https://www.bre.com/ProMax-Glycol-Dehydration-Emissions.aspx (accessed on 3 July 2025).
- U.S. Environmental Protection Agency. Subpart W Final Rule: Overview and Implementation Guidance. 2024. Available online: https://www.epa.gov/system/files/documents/2024-07/subpartwrulewebinar_july2024.pdf (accessed on 3 July 2025).
- Mollel, W.; Zimmerle, D.; Santos, A.; Hodshire, A. Using Prototypical Oil and Gas Sites to Model Methane Emissions in Colorado’s Denver-Julesburg Basin Using a Mechanistic Emission Estimation Tool. ACS ES&T Air 2025, 2, 723–735. [Google Scholar] [CrossRef] [Scilit]
- Santos, A.; Mollel, W.; Duggan, G.P.; Hodshire, A.; Vora, P.; Zimmerle, D. Using Measurement-Informed Inventory to Assess Emissions in the Denver-Julesburg Basin. ACS ES&T Air 2025, 2, 1598–1611. [Google Scholar] [CrossRef] [Scilit]
- Mollel, W.; Mdigo, J.; Santos, A.; Vora, P.; Duggan, J.; Zimmerle, D. MAES Study Sheet Guide; Technical report; Mountain Scholar Repository; Colorado State University Libraries: Fort Collins, CO, USA, 2024. [Google Scholar]
- Santos, A.; Mdigo, J.; Hodshire, A.; Zimmerle, D.; Ravikumar, A.P. Beyond Snapshots: Bridging the Gaps between Aerial Surveys and Temporally Resolved Inventory Models. Colorado State University: Fort Collins, CO, USA, 2026; manuscript in progress.
- Trueba, L., Jr.; Gaston, T.; Brackin, J.; Miller, J.; You, B.H. Effective strategies to reduce triethylene glycol consumption in natural gas processing plants. Case Stud. Chem. Environ. Eng. 2022, 5, 100196. [Google Scholar] [CrossRef] [Scilit]
- Al-aswed, A.A.h. Natural Gas Dehydration Process by Mono & Tri-Ethylene-Glycol. Transportation 2017, 29, 33. [Google Scholar]
- Bahadori, A.; Vuthaluru, H.B. Simple methodology for sizing of absorbers for TEG (triethylene glycol) gas dehydration systems. Energy 2009, 34, 1910–1916. [Google Scholar] [CrossRef] [Scilit]
- U.S. Environmental Protection Agency. Install Flash Tank Separators in Glycol Dehydrators; Technical Report; Natural Gas STAR Program, U.S. EPA: Washington, DC, USA, 2006. [Google Scholar]
- Dalton, J. Experimental essays, on the constitution of mixed gases; on the force of steam or vapour from water and other liquids in different temperatures, both in a Torricellian vacuum and in air; on evaporation; and on the expansion of elastic fluids by heat. Mem. Lit. Philos. Soc. Manch. 1802, 5, 535–602. [Google Scholar]
- Smith, J.M.; Van Ness, H.C.; Abbott, M.M. Introduction to Chemical Engineering Thermodynamics, 7th ed.; McGraw-Hill: New York, NY, USA, 2005. [Google Scholar]
- Kohl, A.L.; Nielsen, R. Gas Purification; Elsevier: Amsterdam, The Netherlands, 1997. [Google Scholar]
- Neagu, M.; Cursaru, D.L. Technical and economic evaluations of the triethylene glycol regeneration processes in natural gas dehydration plants. J. Nat. Gas Sci. Eng. 2017, 37, 327–340. [Google Scholar] [CrossRef] [Scilit]
- Kimray, Inc. Glycol Regeneration: 5 Ways to Maximize Glycol Purity. 2023. Available online: https://kimray.com/training/glycol-regeneration-5-ways-maximize-glycol-purity (accessed on 9 July 2025).
- Bryan Research & Engineering, LLC. Bryan Research & Engineering (BRE). 2025. Available online: https://www.bre.com/ (accessed on 9 July 2025).
- Dustman, T.; Drenker, J.; Bergman, D.; Bullin, J.A. An Analysis and Prediction of Hydrocarbon Dew Points and Liquids in Gas Transmission Lines. In Proceedings of the 85th GPA Annual Convention, Gas Processors Association, Dallas, TX, USA, 5–8 March 2006. [Google Scholar]
- Kirchgessner, D.A.; Richards, R.G.; Heath, F.; Smith, R.D. Advanced dehydrator design recovers gas, reduces emissions. Oil Gas J. 2004, 102, 52–61. [Google Scholar]
- Bryan Research & Engineering, LLC. ProMax Scenario Tool. 2023. Available online: https://www.bre.com/Blog/ProMax-Scenario-Tool.aspx (accessed on 9 July 2025).
- Allen, D. Attributing atmospheric methane to anthropogenic emission sources. Accounts Chem. Res. 2016, 49, 1344–1350. [Google Scholar] [CrossRef] [Scilit] [PubMed]
- Lowry, D.; Fisher, R.E.; France, J.L.; Coleman, M.; Lanoisellé, M.; Zazzeri, G.; Nisbet, E.G.; Shaw, J.T.; Allen, G.; Pitt, J.; et al. Environmental baseline monitoring for shale gas development in the UK: Identification and geochemical characterisation of local source emissions of methane to atmosphere. Sci. Total Environ. 2020, 708, 134600. [Google Scholar] [CrossRef] [Scilit] [PubMed]
- Daley, H.M.; Dickerson, R.R.; Stratton, P.R.; He, H.; Ren, X.; Koss, A.; Brewer, A.; Baidar, S.; Hmiel, B.; Bon, D.; et al. Methane and Ethane Emission Rates, Intensities, and Trends: Aircraft Mass Balance Insights over the Denver-Julesburg Basin, Fall 2021. J. Geophys. Res. Atmos. 2025. [Google Scholar] [CrossRef] [Scilit]
- Ngulat, M.; Santos, A.; Hodshire, A.L.; Vaughn, T.; Daley, H.M.; Dickerson, R.R.; Weibring, P.; Richter, D.; Walega, J.; Fried, A.; et al. Significant Reduction in Ethane Emissions in the Denver-Julesburg Basin From 2015 to 2021 From Oil and Natural Gas Operations. JGR Atmos. 2025. [Google Scholar] [CrossRef] [Scilit]
- Hernandez-Valencia, V.N.; Hlavinka, M.W.; Bullin, J. Design glycol units for maximum efficiency. In Proceedings of the Annual Convention-Gas Processors Association; Gas Processors Association: Tulsa, OK, USA, 1992; p. 310. [Google Scholar]
- U.S. Environmental Protection Agency. Flash Tank Separators. 2023. Available online: https://www.epa.gov/natural-gas-star-program/flash-tank-separators (accessed on 14 July 2025).
- de Oliveira Cavalcanti Filho, V.; Chapoy, A.; Burgass, R. Phase behavior in natural gas+ glycol systems, Part 1: tri (ethylene glycol)(TEG) and its aqueous solutions. J. Chem. Eng. Data 2021, 66, 4075–4093. [Google Scholar] [CrossRef] [Scilit]
- Mdigo, J.; Santos, A.; Ravikumar, A.; Zimmerle, D. Using Mechanistic Air Emissions Simulator Model to Develop Methane Measurement-Informed Inventory for Midstream Oil and Gas Facilities in the Appalachian Basin. Colorado State University: Fort Collins, CO, USA, 2026; manuscript in preparation.
- U.S. Environmental Protection Agency. Optimizing Glycol Circulation Rates in Glycol Dehydrators; Technical Report; Natural Gas STAR Program: Washington, DC, USA, 2006. [Google Scholar]
- Kimray, Inc. How to Calculate Your Glycol Circulation Rate to Determine Your Kimray Glycol Pump Speed. 2021. Available online: https://kimray.com/sites/default/files/uploads/training-demos/How%20to%20Calculate%20Glycol%20Circulation%20Rate.pdf (accessed on 26 August 2025).
- Suditu, S.; Dumitrache, L.; Branoiu, G.; Dragut, S.; Eparu, C.N.; Stan, I.G.; Prundurel, A.P. A Case Study on Advanced Detection and Management of Fugitive Methane Emissions in the Romanian Oil and Gas Sector. Sustainability 2025, 17, 11359. [Google Scholar] [CrossRef] [Scilit]

Disclaimer/Publisher’s Note: The statements, opinions and data contained in all publications are solely those of the individual author(s) and contributor(s) and not of MDPI and/or the editor(s). MDPI and/or the editor(s) disclaim responsibility for any injury to people or property resulting from any ideas, methods, instructions or products referred to in the content. |
© 2026 by the authors. Licensee MDPI, Basel, Switzerland. This article is an open access article distributed under the terms and conditions of the Creative Commons Attribution (CC BY) license.