


Abstract
Background: Obesity is strongly associated with type 2 diabetes, but clinical and metabolic characteristics vary among adults with obesity. This cross-sectional study evaluated whether routinely available nonglycemic variables could classify biochemically defined diabetes status at the time of evaluation. Methods: This retrospective study included 351 adults with obesity, comprising 185 with diabetes and 166 without diabetes. Diabetes was defined by two fasting plasma glucose measurements ≥ 126 mg/dL obtained on separate occasions or an HbA1c value ≥ 6.5%. Complete numerical fasting glucose and HbA1c values were not retained as continuous variables in the analytical database, and insulin-related measures were unavailable. Multivariable logistic regression and four machine learning classifiers were evaluated. Results: Participants with diabetes were older, more frequently male, and more frequently had hypertension, fatty liver, and prior cardiovascular interventions. They had higher triglyceride and CRP concentrations, lower LDL-C concentrations, and no statistically significant difference in HDL-C. Age, hypertension, fatty liver, and LDL-C were associated with diabetes status in the multivariable model. Gradient Boosting and Random Forest showed similar discrimination (AUC-ROC = 0.807 and 0.803, respectively), with overlapping confidence intervals. Conclusions: The models classified prevalent diabetes status within this cohort using variables other than the glycemic criteria used to define the outcome. They were not designed to predict incident diabetes or progression from obesity to diabetes. The findings are exploratory and require external validation before clinical application.
1. Introduction
Obesity and type 2 diabetes mellitus are closely related metabolic disorders and major contributors to the global burden of noncommunicable diseases. In adults, obesity is conventionally defined as a body mass index (BMI) of at least 30 kg/m2 and is associated with diabetes, cardiovascular disease, and metabolic dysfunction-associated steatotic liver disease [1,2]. Nevertheless, diabetes is not present in all adults with obesity, reflecting substantial cross-sectional heterogeneity in metabolic phenotype.
Differences in diabetes status among adults with obesity may be associated with insulin resistance, impaired pancreatic β-cell function, visceral and ectopic fat accumulation, genetic susceptibility, and lifestyle-related factors [3,4,5]. C-reactive protein (CRP) is a routinely available marker of systemic inflammation and may provide additional complementary descriptive information when assessed together with demographic, clinical, and metabolic variables.
Multivariable logistic regression is useful for estimating adjusted cross-sectional associations and generating clinically interpretable odds ratios. Machine learning classifiers may complement regression by identifying nonlinear patterns and interactions among variables without requiring all functional forms to be prespecified. Penalized methods such as LASSO logistic regression can reduce model complexity and support predictor selection, whereas Random Forest and Gradient Boosting accommodate nonlinear classification patterns [6,7]. Although machine learning methods have been widely studied for diabetes prediction, the present analysis addresses classification of already established diabetes status rather than prediction of future disease.
Consequently, the present cross-sectional study aimed to evaluate whether routinely available demographic, clinical, familial, conventional lipid, anthropometric, and inflammatory variables could classify biochemically defined prevalent diabetes status among adults with obesity. It was not designed to predict incident diabetes, estimate future diabetes risk, assess progression from obesity to diabetes, quantify glycemic control, or diagnose previously unrecognized diabetes. Characteristics of patients with and without diabetes were compared, adjusted associations with diabetes status at evaluation were estimated using multivariable logistic regression, and the internally cross-validated classification performance of Logistic Regression, LASSO Logistic Regression, Random Forest, and Gradient Boosting was compared. Model interpretation was descriptive and was not intended to establish etiologic predictor importance.
2. Materials and Methods
2.1. Study Design and Population
This retrospective cross-sectional study included adult patients with obesity evaluated at the Department of Diabetes, Nutrition and Metabolic Diseases of “Medica–Sfânta Maria” Hospital, Sibiu, Romania, between January 2023 and December 2025. The study was approved by the institutional Ethics Committee (approval no. 64/16 December 2025). A total of 351 participants were included, of whom 166 did not have diabetes and 185 had diabetes. Obesity was defined as a BMI ≥ 30 kg/m2. Diabetes status was verified from the medical record and required biochemical support consisting of either two fasting plasma glucose measurements ≥ 126 mg/dL obtained on separate occasions or an HbA1c value ≥ 6.5%. Medication use alone was not used as the diagnostic criterion. Although fasting plasma glucose and HbA1c supported classification, their complete numerical values were not retained as continuous variables in the analytical database. Fasting insulin, C-peptide, and indices of insulin resistance or β-cell function were not routinely available. Therefore, heterogeneity in glycemic control, diabetes duration, treatment, and residual β-cell function could not be characterized.
2.2. Variables and Descriptive Analysis
The prespecified analytical variables were age, sex, smoking, alcohol consumption, stress, hypertension, fatty liver, previous cardiovascular interventions, family history of diabetes, family history of obesity, family history of cardiovascular disease, BMI, total cholesterol, HDL-cholesterol (HDL-C), LDL-cholesterol (LDL-C), triglycerides (TG), and CRP. Self-reported physical activity was recorded in four ordinal categories and reported descriptively. It was not included in the regression or machine learning models because it was derived retrospectively from nonstandardized self-report, the extreme categories were very sparse (only 1 of 167 individuals without diabetes reported sedentary activity, versus 23 of 184 individuals with diabetes; and no individuals without diabetes, versus 2 individuals with diabetes, reported vigorous activity), and its measurement reliability was considered insufficient for multivariable modeling. This decision was based on measurement quality and category sparsity rather than the observed between-group p-value; nevertheless, exclusion may have left residual confounding and is acknowledged as a limitation. Fasting plasma glucose and HbA1c were used to define the outcome and were therefore not used as predictors. Lipid-lowering treatment, including statins, ezetimibe, PCSK9 inhibitors, and other agents, was not systematically captured and could not be incorporated into the analysis.
Continuous variables were reported as mean ± standard deviation or median and interquartile range, depending on distribution, and categorical variables as frequencies and percentages. Age was compared between groups using Welch’s independent-samples t-test, while BMI, lipid parameters, and CRP were compared using the Mann–Whitney U test, given their skewed distributions, because of skewed distributions, given their skewed distributions. Categorical variables were compared using the chi-square test. After exclusion of four records with biologically implausible HDL-C values, the analytical dataset of 351 participants contained complete observations for diabetes status and all 17 predictors used in the regression and machine learning models; therefore, no imputation was performed. Physical-activity data were complete but were used only descriptively. A two-sided p-value < 0.05 was considered statistically significant.
2.3. Multivariable Logistic Regression
A multivariable binary logistic regression model was fitted to estimate adjusted associations with prevalent diabetes status at evaluation. All 17 candidate predictors were entered simultaneously, without data-driven variable selection. Odds ratios are reported with 95% confidence intervals and p-values; odds ratios for total cholesterol, HDL-C, LDL-C, and TG are expressed per 10 mg/dL increase, and those for age, BMI, and CRP per one-unit increase. Because triglycerides and CRP were markedly right-skewed, linearity of the association between each continuous predictor and the logit of diabetes was formally assessed using the Box–Tidwell test, in which a predictor-by-log(predictor) interaction term was added to the multivariable model; a statistically significant interaction term was taken to indicate departure from linearity. Multicollinearity was assessed using variance inflation factors (VIF), and overall model fit was evaluated using the likelihood-ratio test against an intercept-only null model and McFadden’s pseudo-R2. Given the number of candidate predictors relative to the sample size, estimates may be unstable despite the absence of marked multicollinearity. No clinically prespecified interactions were tested. Although the Box–Tidwell test formally assessed the linearity assumption, a significant departure from linearity was subsequently detected for CRP (Section 3.2); the linear term for this predictor was nonetheless retained in the reported model, and flexible nonlinear terms (e.g., splines) were not fitted to correct for this. Consequently, some residual model misspecification for CRP, and potentially for unmodeled interactions, cannot be excluded.
2.4. Machine Learning Models and Internal Validation
Four supervised classification models were evaluated—Logistic Regression, LASSO (L1-penalized) Logistic Regression, Random Forest, and Gradient Boosting—using the same 17 candidate predictors.
Model performance was assessed using nested stratified cross-validation. The outer loop consisted of five stratified folds used to generate out-of-fold predictions. Within each outer training fold, three-fold stratified inner cross-validation was used to optimize the hyperparameters of LASSO Logistic Regression, Random Forest, and Gradient Boosting via grid search, selecting the configuration that maximized mean inner-fold AUC-ROC. The hyperparameter search spaces were for LASSO, regularization parameter C ∈ {0.03, 0.10, 0.30, 1.00, 3.00}; for Random Forest, 250 trees with maximum depth ∈ {3, 5, None} and minimum samples per leaf ∈ {2, 5}; and for Gradient Boosting, number of estimators ∈ {75, 125}, learning rate ∈ {0.05, 0.10}, and maximum depth ∈ {1, 2}. Logistic Regression was not tuned. The selected hyperparameter configuration was then refitted on the entire outer-training partition and evaluated once, on the corresponding held-out outer fold, to generate that fold’s out-of-fold predictions; no data from the held-out outer fold contributed to model selection or fitting at any stage.
Continuous predictors were standardized (zero mean, unit variance) using parameters estimated exclusively within each outer training fold and applied to the corresponding test fold; binary predictors were retained in their original form. All preprocessing and hyperparameter-optimization steps were restricted to the training data of each outer fold, to prevent information leakage.
2.5. Model Performance and Interpretation
Pooled out-of-fold predictions were used to calculate AUC-ROC, accuracy, sensitivity, specificity, precision, F1-score, and Brier score for each model. AUC-ROC was treated as the primary, threshold-independent measure of discrimination, given the substantial prevalence of diabetes in this cohort. Classification metrics (accuracy, sensitivity, specificity, precision, F1-score) were additionally reported at a probability threshold of 0.50 for classification, a conventional default value that was not optimized for clinical decision-making; these metrics are therefore presented as secondary, descriptive measures rather than as evidence of clinical utility. Fold-level metrics are also reported separately (Supplementary Table S1) to illustrate the variability observed across folds.
ROC curves were generated from the pooled out-of-fold probabilities, and 95% confidence intervals for AUC-ROC were estimated using 2000 bootstrap resamples of these predictions. Because these predictions derive from models trained on overlapping outer-fold training sets, this resampling procedure does not repeat the full nested cross-validation and therefore does not fully capture the dependence between out-of-fold predictions or the additional uncertainty arising from model selection and development; the reported intervals should be interpreted with this limitation in mind. Calibration was evaluated using decile-based calibration curves together with the Brier score.
Gradient Boosting achieved a marginally higher AUC-ROC and a lower Brier score than Random Forest, but the 95% confidence intervals for AUC-ROC overlapped substantially between the two models, suggesting comparable discrimination between the two approaches in this cohort. Gradient Boosting was selected for further interpretation on the basis of its marginally higher AUC-ROC and lower Brier score, the two primary performance measures defined in this study; compatibility with SHAP TreeExplainer analysis was a practical consideration but was not, by itself, the basis for this choice, since Random Forest is also compatible with TreeExplainer. For this step only, Gradient Boosting was refitted on the entire dataset (n = 351) using the hyperparameter configuration most frequently selected during nested cross-validation (125 estimators, learning rate = 0.10, maximum depth = 2), with continuous predictors standardized using means and standard deviations estimated from the complete dataset and binary predictors encoded as 0/1, consistent with the preprocessing used during cross-validation. This refitted model, and its interpretation, is descriptive and distinct from the models used to estimate out-of-fold performance, because it was both trained and interpreted on the same observations, the resulting predictor rankings should not be interpreted as validated estimates of predictor importance, independent association, or causal effect.
SHAP (SHapley Additive exPlanations, TreeExplainer) was used to assess the contribution and direction of individual predictors to the refitted Gradient Boosting model’s predictions, and permutation-based feature importance (30 repeats) was additionally calculated as the mean decrease in AUC-ROC after randomly permuting each predictor.
As a separate exploratory analysis, LASSO Logistic Regression was refitted on the entire dataset, with the regularization parameter selected through a dedicated five-fold cross-validation; retained predictors were those with non-zero standardized coefficients. This analysis, like the SHAP-based interpretation, is descriptive and distinct from the performance-evaluation procedure.
2.6. Software
All analyses were performed using Python version 3.13.5 (Python Software Foundation, Wilmington, DE, USA), with pandas 3.0.2, NumPy 2.4.4, SciPy 1.17.1, statsmodels 0.15.0, scikit-learn 1.8.0, SHAP 0.52.0, and Matplotlib 3.10.8.
3. Results
3.1. Characteristics of the Study Population
A total of 351 individuals with obesity were included in the analysis, following the exclusion of four cases with biologically implausible HDL-cholesterol values. The sample comprised 185 individuals with diabetes and 166 without diabetes. Baseline characteristics according to diabetes status are presented in Table 1.
Table 1.
Baseline characteristics of the study population.
Individuals with diabetes were significantly older (62.59 ± 10.95 vs. 52.79 ± 13.47 years, p < 0.001) and were more frequently male (43.8% vs. 28.3%, p = 0.004). Hypertension, fatty liver disease, and previous cardiovascular interventions were all significantly more prevalent among individuals with diabetes (p ≤ 0.002 for all). Median triglyceride and CRP concentrations were higher, and median LDL-C concentrations were lower, in the diabetes group (all p < 0.001). Median HDL-C was numerically lower among individuals with diabetes, 46.95 mg/dL (IQR 38.60–54.90), than among those without diabetes, 49.46 mg/dL (IQR 39.66–57.59); this difference was not statistically significant (p = 0.121). These group medians should not be interpreted as indicating uniformly normal HDL-C concentrations in all participants. Self-reported stress and a family history of obesity were more common among individuals without diabetes (p = 0.001 and p = 0.016, respectively), and physical-activity level differed significantly between groups (p < 0.001). No significant between-group differences were found for smoking, alcohol consumption, family history of diabetes or cardiovascular disease, BMI, total cholesterol, or HDL-C.
3.2. Multivariable Logistic Regression Analysis
The results of the multivariable logistic regression analysis are presented in Table 2. All 17 candidate predictors were entered simultaneously; the ratio of events (185 individuals with diabetes) to predictors was approximately 11:1, close to the conventional minimum threshold recommended for stable coefficient estimation, and results should be interpreted with this constraint in mind. Increasing age was associated with higher odds of diabetes (adjusted OR = 1.06 per year, 95% CI: 1.03–1.09, p < 0.001). Hypertension (adjusted OR = 2.01, 95% CI: 1.07–3.78, p = 0.029) and fatty liver (adjusted OR = 2.08, 95% CI: 1.19–3.61, p = 0.010) were each associated with approximately two-fold higher odds of diabetes. Higher LDL-C was inversely associated with diabetes (adjusted OR = 0.88 per 10 mg/dL, 95% CI: 0.78–0.999, p = 0.029). Because information on lipid-lowering treatment (e.g., statins, ezetimibe, PCSK9 inhibitors) was not available and could not be incorporated as a covariate, this unexpected cross-sectional association may reflect unmeasured treatment effects or other residual confounding, and should not be interpreted as a protective biological effect. No other predictor reached statistical significance after adjustment.
Table 2.
Multivariable logistic regression analysis for the presence of diabetes.
The overall model was statistically significant (likelihood-ratio test χ2 = 106.5, df = 17, p < 0.001; McFadden pseudo-R2 = 0.219). Multicollinearity was not a concern (maximum variance inflation factor = 3.3, for total cholesterol). The Box–Tidwell test indicated a significant departure from linearity in the logit for CRP (p < 0.001), suggesting that its association with diabetes status may not be adequately captured by a linear term; this should be considered when interpreting the corresponding odds ratio. No significant departure from linearity was detected for the remaining continuous predictors, including age, BMI, total cholesterol, HDL-C, LDL-C, and triglycerides (all p ≥ 0.065), supporting the linearity assumption underlying their reported odds ratios. Given the number of predictors relative to sample size, potential interaction effects between predictors were not evaluated.
3.3. Performance of the Machine Learning Models
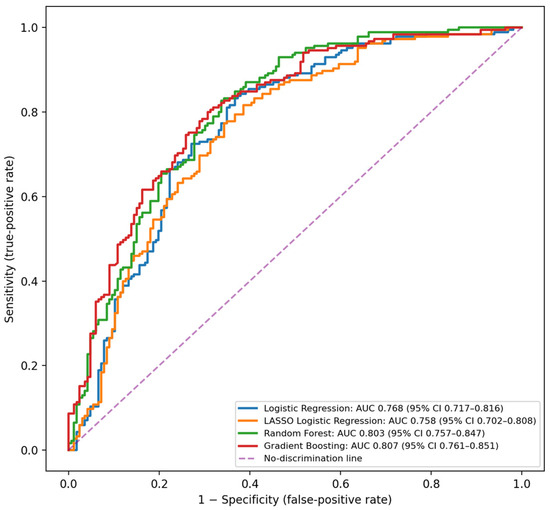
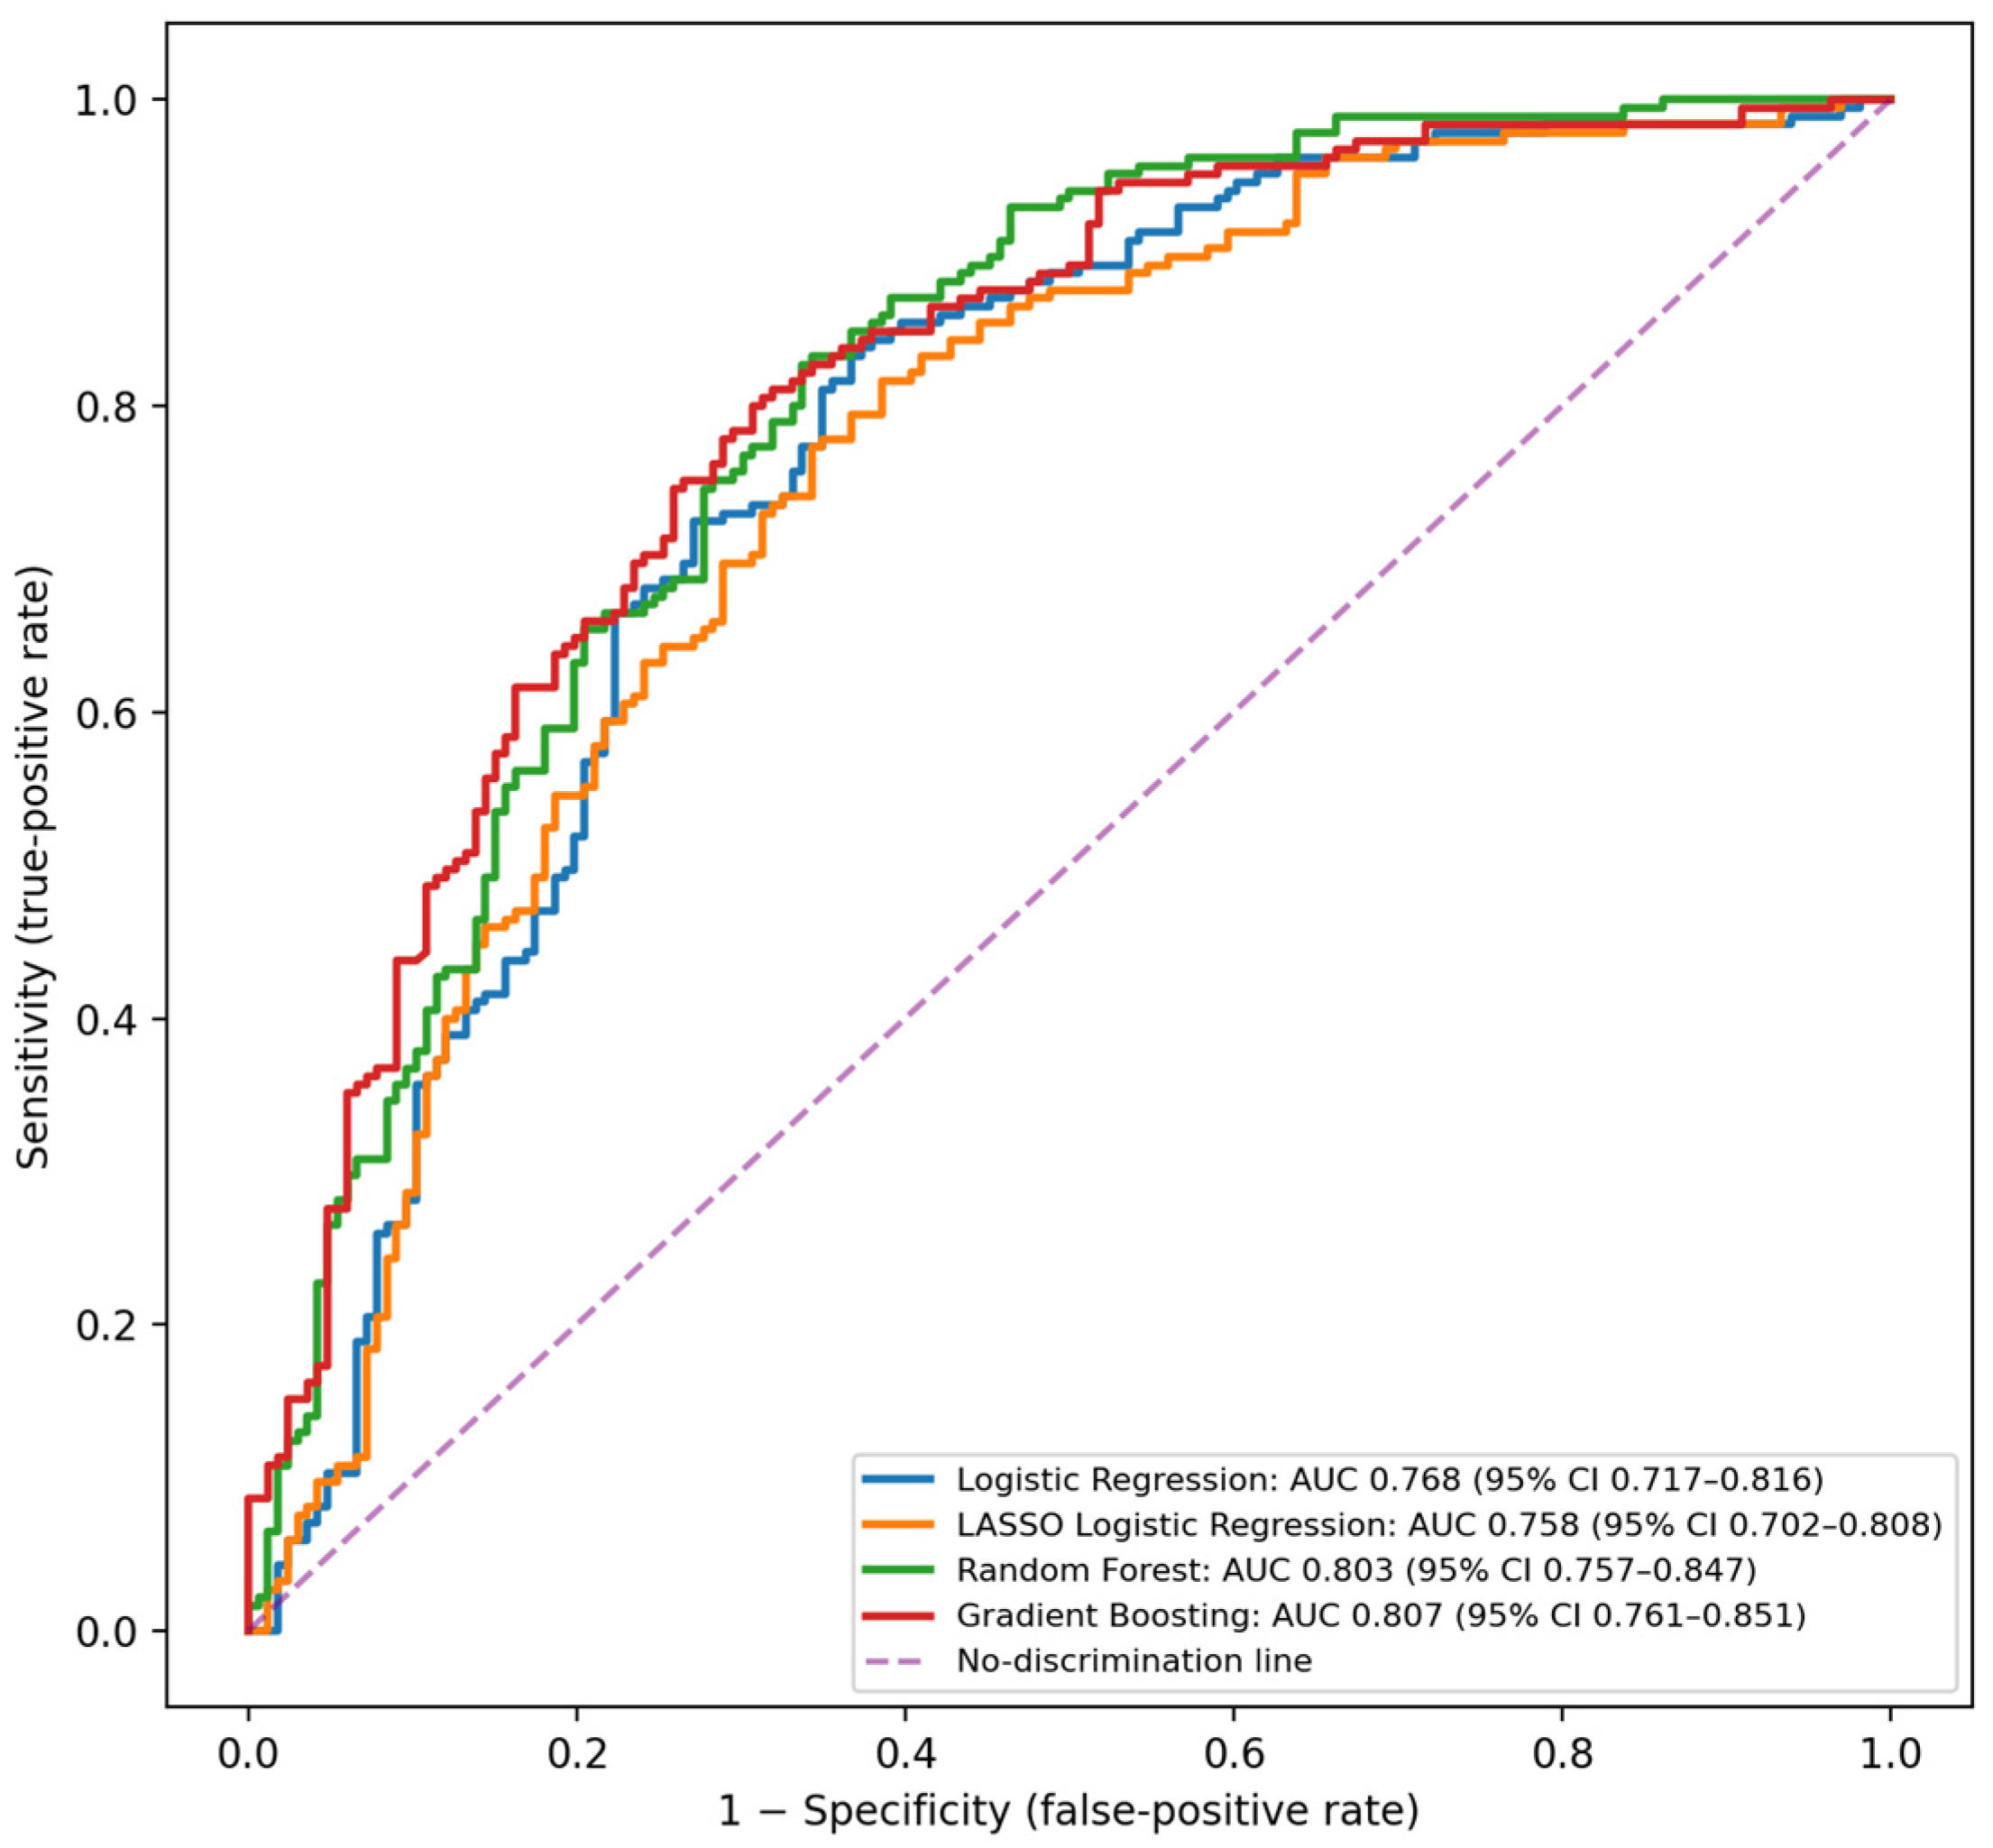
Logistic Regression, LASSO Logistic Regression, Random Forest, and Gradient Boosting were compared using nested stratified cross-validation (5 outer folds; 3-fold inner cross-validation for hyperparameter tuning, AUC-ROC criterion), with standardization and hyperparameter selection performed exclusively within each training fold. Pooled out-of-fold performance is shown in Table 3 and Figure 1. Gradient Boosting and Random Forest showed the highest discrimination (AUC-ROC = 0.807 and 0.803, respectively), followed by Logistic Regression (0.768) and LASSO Logistic Regression (0.758); the confidence intervals of all four models overlapped substantially, indicating no statistically clear superiority of one algorithm. Performance varied considerably across the five outer folds (Supplementary Table S1). This fold-to-fold variation is reported descriptively; with only five outer folds and approximately 70 individuals per test fold, the present design does not allow the contribution of finite-sample composition to be statistically separated from that of model instability, and the reported variation should not be attributed to either cause without further evidence. This should be considered when interpreting point estimates.
Table 3.
Internally cross-validated performance for classification of prevalent diabetes status among adults with obesity.
Figure 1.
ROC curves of the evaluated machine learning models, based on pooled out-of-fold predicted probabilities. AUC-ROC values and 95% bootstrap confidence intervals are shown in the legend.
3.4. Calibration and Probabilistic Performance
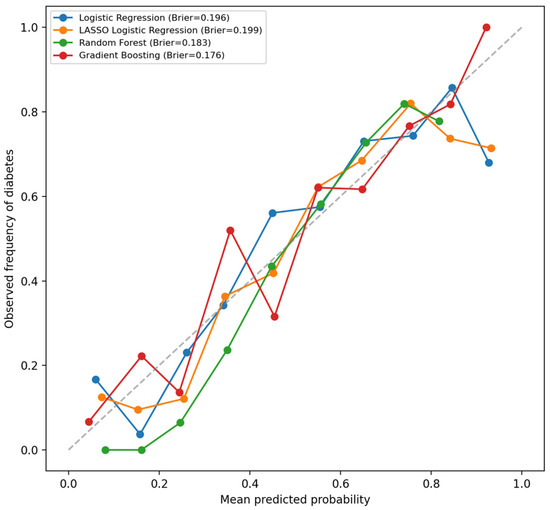
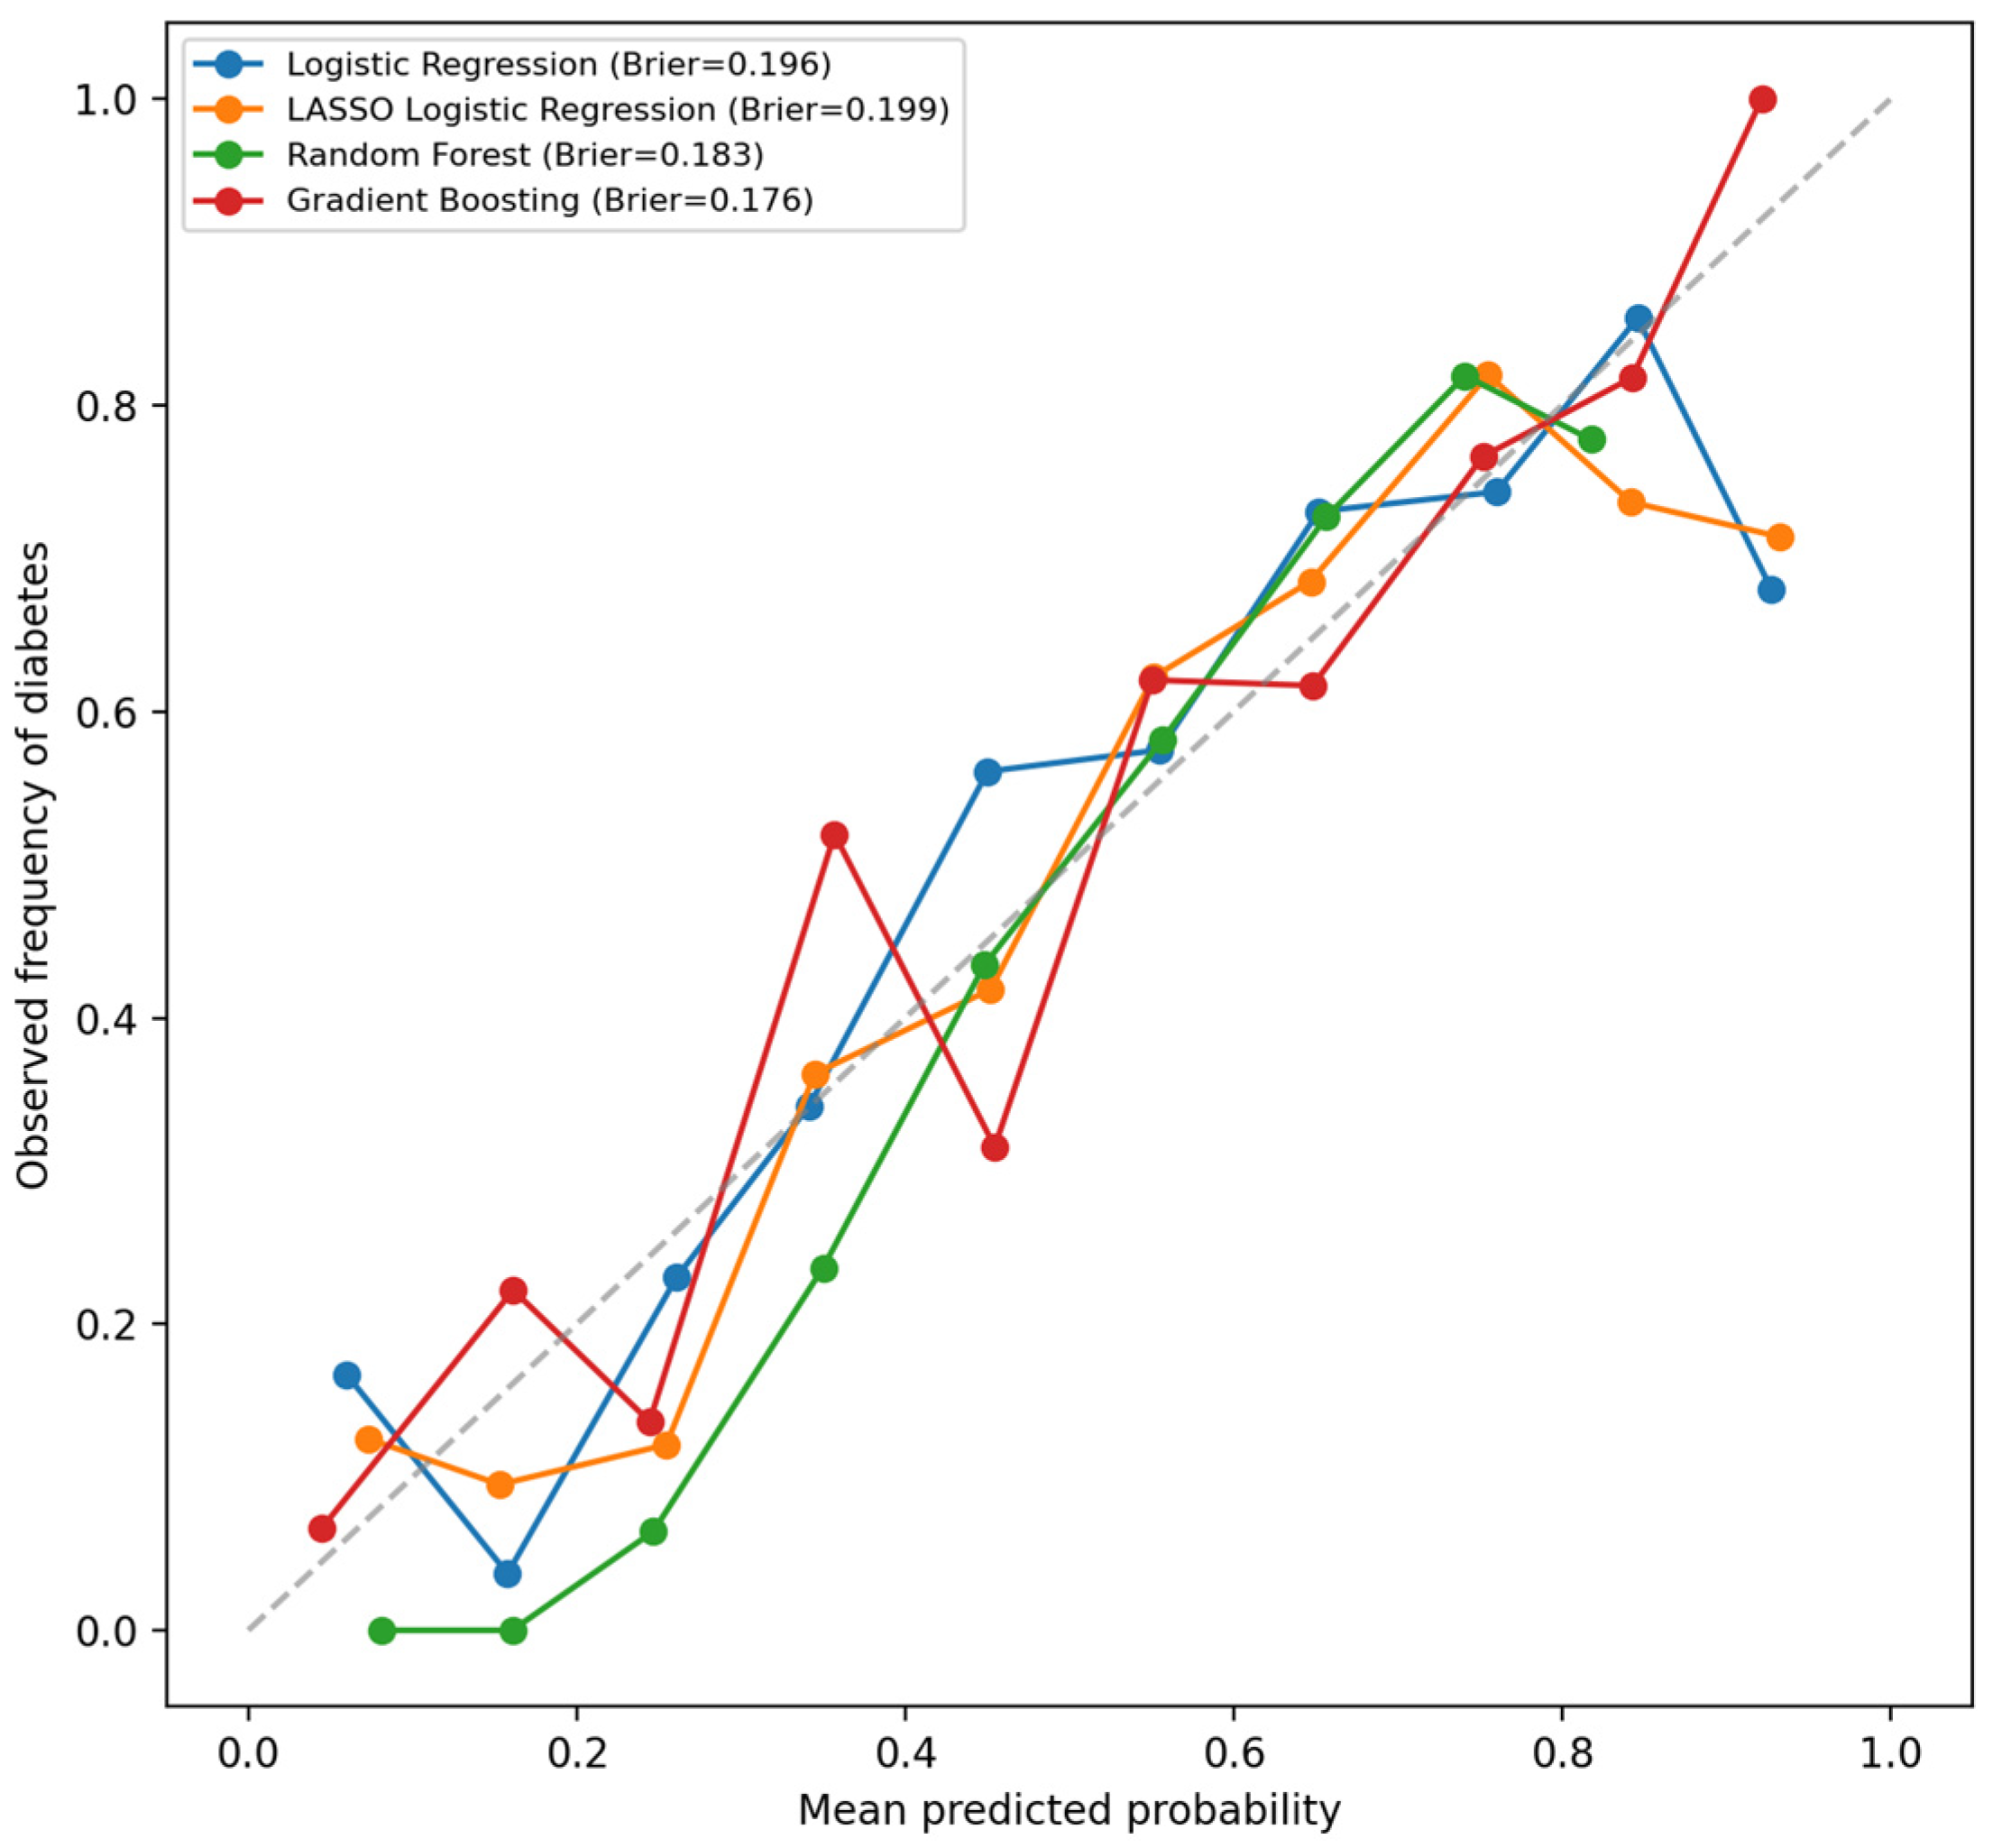
Decile-based calibration curves are shown descriptively in Figure 2. For all four models, the curves followed the diagonal of perfect calibration broadly but non-monotonically, with visible deviations across the middle and upper deciles, particularly for Logistic Regression and Gradient Boosting; this descriptive pattern should be interpreted with caution given the modest number of observations per decile. Gradient Boosting had the lowest Brier score (0.176, 95% CI 0.155–0.197), followed by Random Forest (0.183, 95% CI 0.169–0.199), Logistic Regression (0.196, 95% CI 0.174–0.220), and LASSO Logistic Regression (0.199, 95% CI 0.180–0.218). The 95% confidence intervals for Brier score, obtained from 2000 bootstrap resamples of the pooled out-of-fold predictions, overlapped substantially across all four models; these small apparent differences should therefore not be interpreted as evidence of established calibration superiority for any model.
Figure 2.
Calibration curves of the evaluated machine learning models, based on pooled out-of-fold predicted probabilities. The dashed diagonal represents perfect calibration.
3.5. Descriptive Interpretation of the Full-Dataset Gradient Boosting
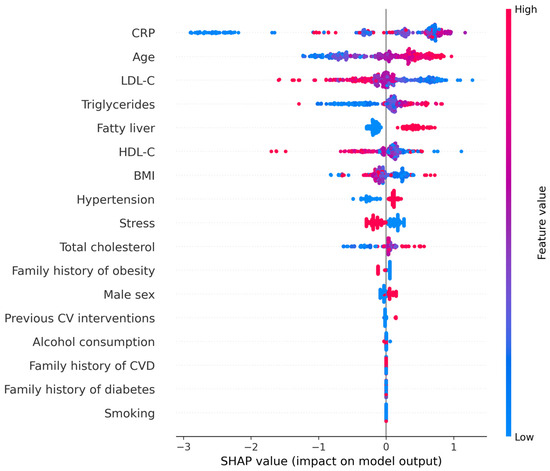
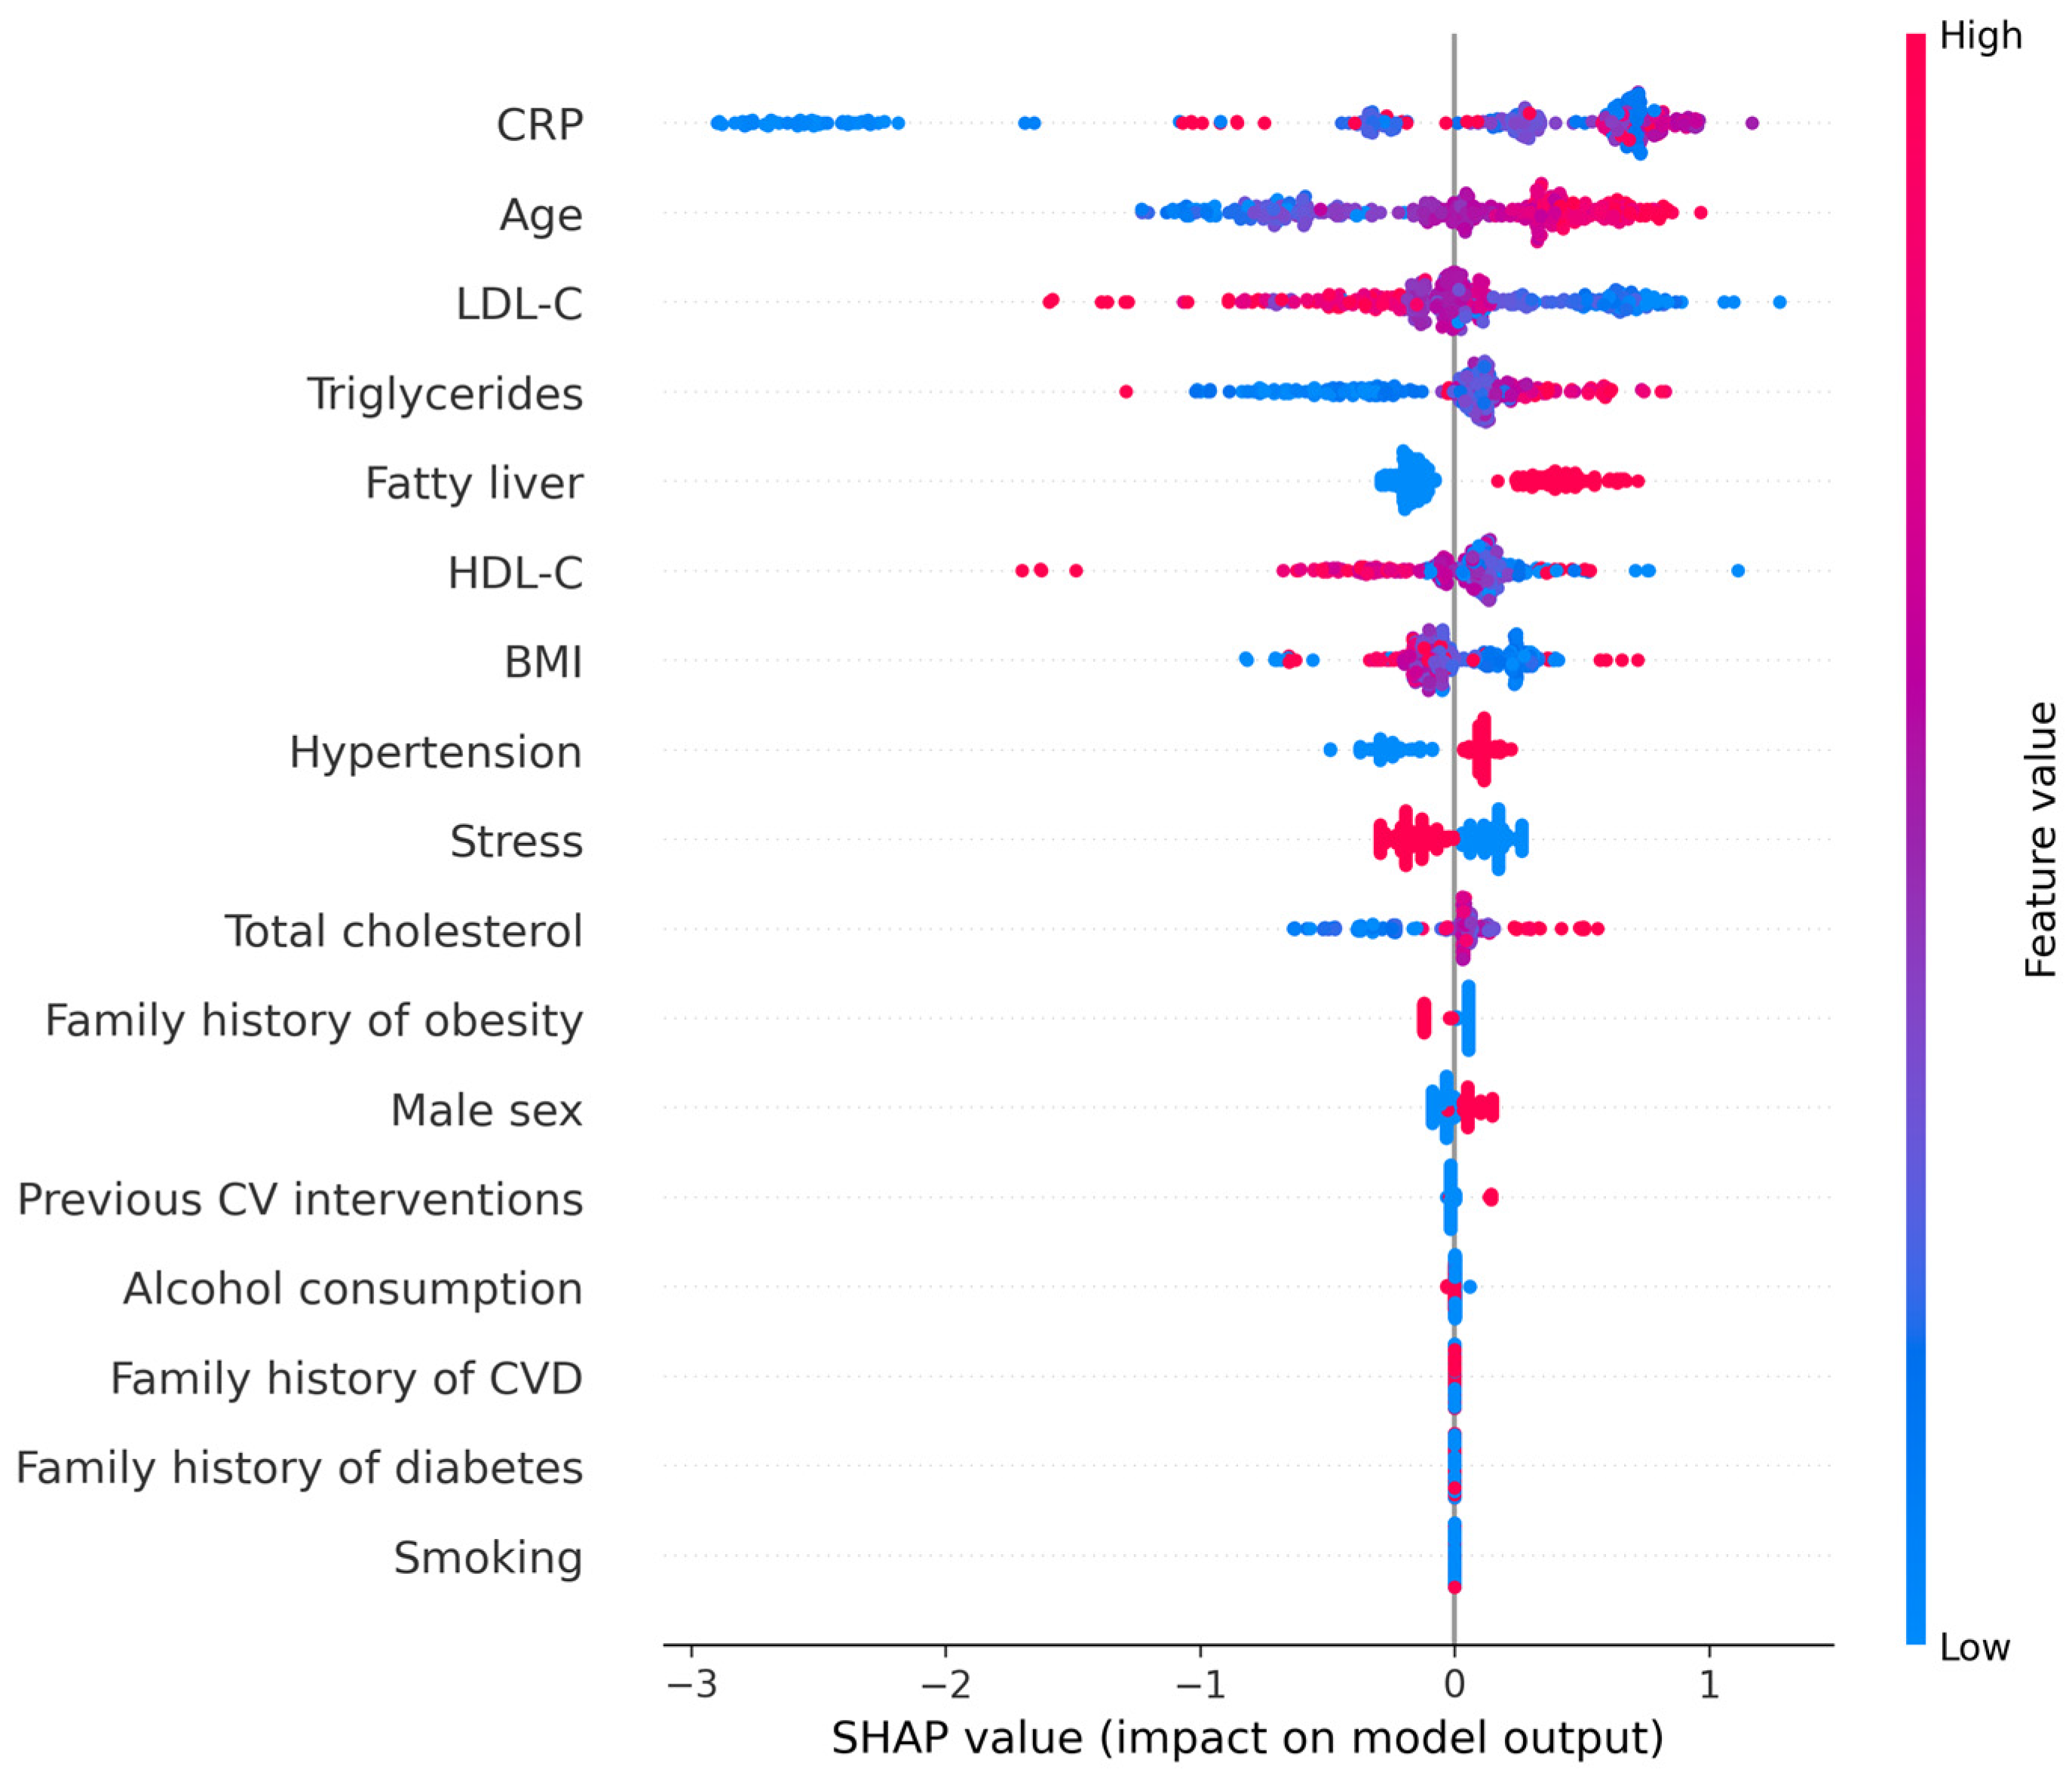
SHAP analysis (Figure 3) identified CRP, age, LDL-C, and triglycerides as the predictors with the greatest overall contribution to model output. The association between CRP and model output was markedly non-linear: low CRP values (blue) were concentrated at strongly negative SHAP values, whereas high CRP values (red) were distributed across a narrower and more variable range of positive SHAP values, consistent with the departure from logit-linearity detected for this predictor in Section 3.2. Age showed an approximately monotonic, positive association, with higher values (red) consistently shifting predictions toward diabetes and lower values (blue) shifting predictions toward its absence. LDL-C showed the inverse pattern, with lower values (blue) associated with positive SHAP values and higher values (red) associated with negative SHAP values, consistent with the inverse association observed in the logistic regression model (Section 3.2). Triglycerides followed a similar, though less pronounced, positive association with model output. Fatty liver disease showed a clear binary separation, with presence of the condition (red) associated with positive SHAP values and its absence (blue) associated with values near or below zero. HDL-C showed a less consistent pattern, with substantial overlap between low and high values around zero. Hypertension, stress, BMI, and total cholesterol contributed visibly smaller and more variable SHAP values, and the remaining predictors (family history variables, smoking, alcohol consumption, previous cardiovascular interventions, and sex) showed SHAP values concentrated near zero, indicating a limited overall contribution to model output. Permutation importance produced a broadly concordant ranking, with CRP, age, and LDL-C showing the largest reductions in AUC-ROC when permuted (Supplementary Figure S1). Because this model was both trained and interpreted on the same 351 observations, these rankings are an apparent, model-specific description that may be affected by overfitting, predictor dependence, and sample-specific structure; they should not be interpreted as validated estimates of predictor importance, independent association, or causal effect.
Figure 3.
SHAP summary plot for the refitted Gradient Boosting model. Predictors are ordered by overall contribution to model output; positive values shift predictions toward diabetes, negative values toward its absence. Point color reflects feature value (blue = low, red = high).
4. Discussion
Despite the well-established relationship between obesity and type 2 diabetes, metabolic phenotype is highly heterogeneous among adults with obesity, indicating that excess adiposity alone does not account for the observed differences in diabetes status [8]. This heterogeneity represents an important clinical challenge, as individuals with comparable degrees of obesity may exhibit markedly different metabolic phenotypes and different prevalence of type 2 diabetes [9]. In the present study, adults with obesity and diabetes were characterized by a distinct cardiometabolic phenotype, including older age, a higher prevalence of arterial hypertension, fatty liver, previous cardiovascular disease, and a more adverse inflammatory and metabolic profile, cross-sectional correlates of diabetes status at evaluation that do not establish temporal sequence, etiologic risk factors, or progression from obesity to diabetes. These findings emphasize that diabetes is associated with progressive cardiometabolic dysfunction rather than with an isolated disturbance of glucose metabolism. Furthermore, the comparable internally cross-validated discrimination of Random Forest and Gradient Boosting suggests that routinely available clinical and biochemical variables may capture relevant information about this phenotype when their interactions are considered simultaneously; however, the overlapping confidence intervals between models and the absence of external validation preclude claims of comparative superiority or clinical accuracy.
Age emerged as one of the strongest independent correlates of diabetes, consistent with the well-recognized effects of aging on metabolic homeostasis [10]. Progressive β-cell dysfunction, reduced insulin secretory capacity, and the cumulative effects of chronic insulin resistance contribute to the increasing incidence of type 2 diabetes mellitus with advancing age [11]. Aging is further characterized by chronic low-grade inflammation, mitochondrial dysfunction, unfavorable changes in body composition, and reduced metabolic flexibility, all of which contribute to progressive impairment of glucose homeostasis [12]. Therefore, chronological age represents more than a demographic characteristic, serving as an integrated surrogate marker of cumulative metabolic stress, biological aging, and progressive cardiometabolic dysfunction [13]. The independent association observed in the present study is therefore biologically plausible and consistent with current understanding of diabetes pathophysiology.
Hypertension and fatty liver also remained independently associated with diabetes, highlighting their close relationship with systemic insulin resistance and cardiometabolic dysfunction. Rather than representing isolated comorbidities, obesity and type 2 diabetes are manifestations of interconnected cardiometabolic dysfunction driven by shared pathophysiological mechanisms, including endothelial dysfunction, chronic activation of the renin–angiotensin–aldosterone system, ectopic lipid accumulation, oxidative stress, and persistent low-grade inflammation [14]. Hepatic steatosis is increasingly recognized as a hallmark of systemic metabolic dysfunction, closely associated with hepatic insulin resistance, impaired glucose homeostasis, and an increased risk of type 2 diabetes [15]. Similarly, the higher prevalence of previous cardiovascular disease among participants with diabetes further supports the concept that diabetes develops within a broader continuum of progressive vascular and metabolic injury. Collectively, these findings further support the concept that metabolic dysfunction and cardiovascular disease are biologically interconnected processes that collectively drive cardiometabolic risk in individuals with obesity [16].
The higher TG and CRP concentrations observed in participants with diabetes further characterize the inflammatory and metabolic disturbances accompanying disease progression at the univariate level, although neither remained an independent correlate after multivariable adjustment. Hypertriglyceridemia reflects increased hepatic very-low-density lipoprotein (VLDL) production and impaired TG-rich lipoprotein clearance, both of which are hallmark features of insulin resistance and ectopic lipid accumulation [17]. At the same time, elevated CRP serves as a surrogate marker of chronic low-grade systemic inflammation, reflecting the persistent inflammatory milieu that characterizes obesity-associated metabolic dysfunction and insulin resistance [18]. The SHAP-based analysis (Section 3.4) further indicated a non-linear relationship between CRP and predicted diabetes status, consistent with the departure from logit-linearity formally detected for this predictor in the multivariable model (Section 2.3). Increasing evidence indicates that adipose tissue inflammation, dysregulated adipokine secretion, and activation of pro-inflammatory cytokine signaling pathways contribute to progressive insulin resistance, impaired insulin signaling, and β-cell dysfunction [19]. However, because fasting insulin, C-peptide, indices of insulin resistance, and longitudinal glycemic measurements were unavailable, the present data cannot directly quantify insulin resistance, β-cell dysfunction, or the transition from obesity without diabetes to type 2 diabetes. Together, these findings support the concept that chronic low-grade metabolic inflammation plays a central role in the transition from metabolically uncomplicated obesity to overt type 2 diabetes mellitus [20].
In contrast, LDL-C demonstrated an inverse association with diabetes status after multivariable adjustment. Participants with diabetes had a lower median LDL-C concentration than those without diabetes (123.00 vs. 135.80 mg/dL), but this should not be interpreted as a protective biological effect or as evidence of a favorable cardiovascular risk profile. Conventional LDL-C concentration does not characterize LDL particle number, apolipoprotein B concentration, or the proportion of small, dense LDL particles. Furthermore, lipid-lowering treatment was not systematically recorded. Differences in cardiovascular risk management or lipid-lowering exposure are possible explanations, particularly because participants with diabetes were older and more frequently had hypertension and previous cardiovascular interventions; however, this explanation cannot be confirmed from the available data. The inverse association should therefore be regarded as an unexpected and potentially confounded cross-sectional finding requiring confirmation in cohorts with detailed medication and lipoprotein information. Consequently, the observed association is more likely to represent treatment-related or measurement-related confounding than an intrinsic feature of diabetes pathophysiology, and should be regarded as an unexpected, potentially confounded cross-sectional finding requiring confirmation in cohorts with detailed medication and lipoprotein information.
Beyond the biological interpretation of individual correlates, the present study demonstrates the potential value of machine learning approaches for integrating the complexity of cardiometabolic disease. The comparable, internally cross-validated performance of Random Forest and Gradient Boosting suggests that diabetes classification may benefit from the simultaneous integration of multiple routinely available clinical variables, enabling the identification of complex, non-linear relationships that may not be captured when predictors are evaluated individually [21]; however, in the absence of external validation and given the overlapping AUC-ROC confidence intervals between models, this should be regarded as a preliminary observation rather than an established finding. SHAP analysis of the refitted Gradient Boosting model identified predictors broadly concordant with those retained in the multivariable regression model, although the SHAP rankings reflect an apparent, model-specific description derived from a model both trained and interpreted on the same observations, and should not be interpreted as validated or causally independent predictor importance [22]. Thus, explainable machine learning approaches should be viewed as complementary to conventional statistical analyses and clinical judgment, providing an additional tool for individualized cardiometabolic phenotyping rather than replacing established clinical reasoning [23].
Several limitations should be acknowledged when interpreting these findings. The retrospective cross-sectional design limits the ability to determine the temporal sequence between obesity-related metabolic abnormalities and diabetes, thereby precluding causal inference. Furthermore, the single-center setting may limit the generalizability of the findings to other populations. The fold-to-fold variability in model performance across cross-validation folds (Supplementary Table S1) may reflect both finite-sample composition and model instability; the present analysis cannot statistically separate these sources, and this should be considered when interpreting the reported point estimates. Although Random Forest and Gradient Boosting demonstrated comparable internally cross-validated discrimination, independent external validation remains necessary before their incorporation into routine clinical practice. Lipid-lowering treatment was not systematically recorded, limiting interpretation of the inverse LDL-C association; physical activity was excluded from modeling because it was retrospectively self-reported in sparse ordinal categories, and residual confounding from both sources remains possible. Although linearity in the logit was formally assessed using the Box–Tidwell test, a significant departure from linearity was detected for CRP, and clinically prespecified interactions were not tested, so residual model misspecification cannot be excluded. Although diabetes status was established using two fasting plasma glucose measurements ≥ 126 mg/dL on separate occasions or HbA1c ≥ 6.5%, the complete numerical glucose and HbA1c values were not retained as continuous variables in the analytical database. Fasting insulin, C-peptide, and indices of insulin resistance or β-cell function were also unavailable. Consequently, the study could not compare the degree of glycemic control, quantify insulin resistance, assess residual insulin secretion, or characterize different stages of β-cell dysfunction. Nevertheless, the study has important strengths, including the detailed clinical and biochemical characterization of adults with obesity, the direct comparison of conventional statistical and machine learning approaches, and the incorporation of explainable AI to improve model transparency. Taken together, these findings demonstrate that diabetes in obesity is cross-sectionally associated with the integration of multiple clinical and metabolic features rather than with any single isolated correlate. Combining conventional statistical methods with explainable machine learning approaches provides complementary insights into the heterogeneity of obesity and represents a promising strategy for advancing individualized diabetes phenotyping, pending external validation.
5. Conclusions
In this cohort of adults with obesity, biochemically defined prevalent diabetes status was associated with a distinct cardiometabolic phenotype characterized by older age, a higher prevalence of hypertension, fatty liver disease, and previous cardiovascular interventions, together with a more adverse inflammatory and lipid profile (higher triglyceride and CRP concentrations, lower LDL-C concentrations, and no statistically significant difference in HDL-C). Multivariable logistic regression identified age, hypertension, fatty liver, and LDL-cholesterol as cross-sectional correlates of diabetes status at evaluation, not as independent etiologic risk factors, while nested cross-validation showed that Random Forest and Gradient Boosting achieved numerically higher discrimination than conventional logistic regression, although the overlapping 95% confidence intervals for AUC-ROC preclude a claim of statistically meaningful superiority, either between the two machine learning models or over logistic regression. SHAP analysis further indicated that the refitted Gradient Boosting model’s predictions were driven predominantly by CRP, age, LDL-C, triglycerides, and fatty liver disease, in general agreement with the multivariable regression findings. Because this model was both trained and interpreted on the same observations, these rankings describe model behavior within this sample and do not establish etiologic predictor importance.
These results suggest that routinely available demographic, clinical, and biochemical variables, when analyzed jointly rather than in isolation, may meaningfully support the classification of adults with obesity according to their prevalent diabetes status. These findings do not identify risk factors for developing diabetes, estimate future diabetes likelihood, characterize progression from obesity to diabetes, or establish clinical diagnostic utility; the evaluated models should be considered exploratory classifiers of an already established outcome, not prospective risk-prediction tools. Explainable machine learning approaches, such as SHAP, may help translate complex classification models into clinically interpretable information, complementing rather than replacing conventional statistical analysis and clinical judgment. Given the retrospective, single-center design and the moderate sample size, these findings should be regarded as hypothesis-generating; prospective external validation—incorporating continuous glycemic measures, diabetes duration and treatment, lipid-lowering therapy, standardized physical-activity assessment, and prespecified assessment of nonlinearities and interactions—is required before these models can be considered for clinical decision support in the management of obesity-related diabetes.
Supplementary Materials
The following supporting information can be downloaded at: https://www.mdpi.com/article/10.3390/endocrines7040057/s1, Table S1: Performance of the evaluated machine learning models across the five outer cross-validation folds (n = 351); Figure S1: Permutation-based feature importance for the refitted Random Forest model, calculated as the decrease in AUC-ROC after predictor permutation (30 repeats).
Author Contributions
Conceptualization, C.C.S., N.A.P. and M.C.T.; methodology, C.C.S. and M.C.T.; software, N.A.P.; validation, N.A.P., M.C.T. and F.G.G.; formal analysis, C.C.S., N.A.P. and M.C.T.; investigation, C.C.S., O.D.B., A.L.P., D.A.D., L.S. and A.M.A.; resources, O.D.B., A.L.P., D.A.D. and L.S.; data cu-ration, C.C.S., D.A.D. and A.M.A.; writing—original draft preparation, C.C.S., N.A.P. and A.M.A.; writing—review and editing, M.C.T., F.G.G., C.M., A.B. and M.P.P.; visualization, F.G.G., C.M., A.B. and M.P.P.; supervision, M.C.T. and F.G.G.; project administration, F.G.G. and L.S. All authors have read and agreed to the published version of the manuscript.
Funding
This research received no external funding.
Institutional Review Board Statement
The study was conducted in accordance with the Declaration of Helsinki and was approved by the Ethics Committee of “Medica–Sfânta Maria” Hospital, Sibiu, Romania (approval no. 64/16 December 2025).
Data Availability Statement
The original contributions presented in this study are included in the article/Supplementary Material. Further inquiries can be directed to the corresponding authors.
Conflicts of Interest
The authors declare no conflicts of interest.
References
- Celletti, F.; Farrar, J.; De Regil, L. World Health Organization Guideline on the Use and Indications of Glucagon-Like Peptide-1 Therapies for the Treatment of Obesity in Adults. JAMA 2026, 335, 434. [Google Scholar] [CrossRef] [Scilit] [PubMed]
- Bajaj, M.; McCoy, R.G.; Balapattabi, K.; Bannuru, R.R.; Bellini, N.J.; Bennett, A.K.; Beverly, E.A.; Briggs Early, K.; ChallaSivaKanaka, S.; Echouffo-Tcheugui, J.B.; et al. Obesity and Weight Management for the Prevention and Treatment of Diabetes: Standards of Care in Diabetes–2026. Diabetes Care 2026, 49, S166–S182. [Google Scholar] [CrossRef] [Scilit] [PubMed]
- Kahn, S.E.; Cooper, M.E.; Del Prato, S. Pathophysiology and Treatment of Type 2 Diabetes: Perspectives on the Past, Present, and Future. Lancet 2014, 383, 1068–1083. [Google Scholar] [CrossRef] [Scilit] [PubMed]
- Kahn, S.E.; Hull, R.L.; Utzschneider, K.M. Mechanisms Linking Obesity to Insulin Resistance and Type 2 Diabetes. Nature 2006, 444, 840–846. [Google Scholar] [CrossRef] [Scilit] [PubMed]
- Kahn, S.E. The Relative Contributions of Insulin Resistance and Beta-Cell Dysfunction to the Pathophysiology of Type 2 Diabetes. Diabetologia 2003, 46, 3–19. [Google Scholar] [CrossRef] [Scilit] [PubMed]
- Deberneh, H.M.; Kim, I. Prediction of Type 2 Diabetes Based on Machine Learning Algorithm. Int. J. Environ. Res. Public Health 2021, 18, 3317. [Google Scholar] [CrossRef] [Scilit] [PubMed]
- Silva, K.D.; Lee, W.K.; Forbes, A.; Demmer, R.T.; Barton, C.; Enticott, J. Use and Performance of Machine Learning Models for Type 2 Diabetes Prediction in Community Settings: A Systematic Review and Meta-Analysis. Int. J. Med. Inform. 2020, 143, 104268. [Google Scholar] [CrossRef] [Scilit] [PubMed]
- Schulze, M.B.; Stefan, N. Metabolically Healthy Obesity: From Epidemiology and Mechanisms to Clinical Implications. Nat. Rev. Endocrinol. 2024, 20, 633–646. [Google Scholar] [CrossRef] [Scilit] [PubMed]
- Neeland, I.J.; Poirier, P.; Després, J.-P. Cardiovascular and Metabolic Heterogeneity of Obesity. Circulation 2018, 137, 1391–1406. [Google Scholar] [CrossRef] [Scilit] [PubMed]
- Petersen, M.C.; Shulman, G.I. Mechanisms of Insulin Action and Insulin Resistance. Physiol. Rev. 2018, 98, 2133–2223. [Google Scholar] [CrossRef] [Scilit] [PubMed]
- DeFronzo, R.A. From the Triumvirate to the Ominous Octet: A New Paradigm for the Treatment of Type 2 Diabetes Mellitus. Diabetes 2009, 58, 773–795. [Google Scholar] [CrossRef] [Scilit] [PubMed]
- Franceschi, C.; Garagnani, P.; Parini, P.; Giuliani, C.; Santoro, A. Inflammaging: A New Immune–Metabolic Viewpoint for Age-Related Diseases. Nat. Rev. Endocrinol. 2018, 14, 576–590. [Google Scholar] [CrossRef] [Scilit] [PubMed]
- López-Otín, C.; Blasco, M.A.; Partridge, L.; Serrano, M.; Kroemer, G. Hallmarks of Aging: An Expanding Universe. Cell 2023, 186, 243–278. [Google Scholar] [CrossRef] [Scilit] [PubMed]
- Mechanick, J.I.; Farkouh, M.E.; Newman, J.D.; Garvey, W.T. Cardiometabolic-Based Chronic Disease, Addressing Knowledge and Clinical Practice Gaps. J. Am. Coll. Cardiol. 2020, 75, 539–555. [Google Scholar] [CrossRef] [Scilit] [PubMed]
- Eslam, M.; Sanyal, A.J.; George, J.; Sanyal, A.; Neuschwander-Tetri, B.; Tiribelli, C.; Kleiner, D.E.; Brunt, E.; Bugianesi, E.; Yki-Järvinen, H.; et al. MAFLD: A Consensus-Driven Proposed Nomenclature for Metabolic Associated Fatty Liver Disease. Gastroenterology 2020, 158, 1999–2014.e1. [Google Scholar] [CrossRef] [Scilit] [PubMed]
- Powell-Wiley, T.M.; Poirier, P.; Burke, L.E.; Després, J.-P.; Gordon-Larsen, P.; Lavie, C.J.; Lear, S.A.; Ndumele, C.E.; Neeland, I.J.; Sanders, P.; et al. Obesity and Cardiovascular Disease: A Scientific Statement from the American Heart Association. Circulation 2021, 143, e984–e1010. [Google Scholar] [CrossRef] [Scilit] [PubMed]
- Ginsberg, H.N.; Packard, C.J.; Chapman, M.J.; Borén, J.; Aguilar-Salinas, C.A.; Averna, M.; Ference, B.A.; Gaudet, D.; Hegele, R.A.; Kersten, S.; et al. Triglyceride-Rich Lipoproteins and Their Remnants: Metabolic Insights, Role in Atherosclerotic Cardiovascular Disease, and Emerging Therapeutic Strategies—A Consensus Statement from the European Atherosclerosis Society. Eur. Heart J. 2021, 42, 4791–4806. [Google Scholar] [CrossRef] [Scilit] [PubMed]
- Hotamisligil, G.S. Inflammation, Metaflammation and Immunometabolic Disorders. Nature 2017, 542, 177–185. [Google Scholar] [CrossRef] [Scilit] [PubMed]
- Donath, M.Y.; Shoelson, S.E. Type 2 Diabetes as an Inflammatory Disease. Nat. Rev. Immunol. 2011, 11, 98–107. [Google Scholar] [CrossRef] [Scilit] [PubMed]
- Blüher, M. Metabolically Healthy Obesity. Endocr. Rev. 2020, 41, bnaa004. [Google Scholar] [CrossRef] [Scilit] [PubMed]
- Beam, A.L.; Kohane, I.S. Big Data and Machine Learning in Health Care. JAMA 2018, 319, 1317–1318. [Google Scholar] [CrossRef] [Scilit] [PubMed]
- Topol, E.J. High-Performance Medicine: The Convergence of Human and Artificial Intelligence. Nat. Med. 2019, 25, 44–56. [Google Scholar] [CrossRef] [Scilit] [PubMed]
- Kelly, C.J.; Karthikesalingam, A.; Suleyman, M.; Corrado, G.; King, D. Key Challenges for Delivering Clinical Impact with Artificial Intelligence. BMC Med. 2019, 17, 195. [Google Scholar] [CrossRef] [Scilit] [PubMed]

Disclaimer/Publisher’s Note: The statements, opinions and data contained in all publications are solely those of the individual author(s) and contributor(s) and not of MDPI and/or the editor(s). MDPI and/or the editor(s) disclaim responsibility for any injury to people or property resulting from any ideas, methods, instructions or products referred to in the content. |
© 2026 by the authors. Licensee MDPI, Basel, Switzerland. This article is an open access article distributed under the terms and conditions of the Creative Commons Attribution (CC BY) license.