


Abstract
The echelle spectrometer utilizes an echelle grating as the primary dispersive element, combined with a prism or planar grating for cross-dispersion, to form a two-dimensional spectral image on an area-array Charge-Coupled Device (CCD). Compared with traditional spectrometers, this configuration provides superior spectral resolution, broader wavelength coverage, enhanced transient direct-reading capability, and higher energy throughput within a similar footprint. However, the use of area-array detectors significantly increases system cost, limiting adoption in cost-sensitive applications. To reduce cost while maintaining performance, we introduce a digital micromirror device (DMD) as a spatial light modulator to replace the traditional area-array detector, paired with a highly sensitive photomultiplier tube (PMT) for signal acquisition. The designed system operates across a wavelength range of 270 to 800 nm within a compact footprint of approximately 307 mm × 210 mm × 150 mm. The focused spot is accurately positioned on the DMD surface across the entire band, with the root mean square (RMS) spot radius smaller than a single micromirror’s size. Spectral information is efficiently coupled into the PMT via a focusing mirror by selectively flipping the DMD micromirrors for detection.
1. Introduction
Spectrometers are vital tools for spectral analysis, widely used in agriculture, biology, medicine, aerospace, industry, environmental protection, and energy development [1,2], playing crucial roles in scientific research and engineering. With advancing technology and expanding application requirements, there is a continuous demand for improved spectrometer performance, especially in terms of spectral resolution. Echelle spectrometers offer high resolution, broad wavelength coverage, high energy throughput, and rapid full-band transient direct-reading capabilities within a compact form factor, making them well-suited for applications that require high resolution and sensitivity. Their core structure combines an echelle grating (primary dispersion) with a prism or planar grating (secondary dispersion) based on cross-dispersion principles to form a two-dimensional spectrum on an area-array CCD.
In 1949, Harrison [3] at MIT first proposed the echelle grating, featuring low groove density and high diffraction orders. Subsequent research explored various methods for detecting the two-dimensional spectra from cross-dispersion. Tousey et al. [4] used a microphotometer, while Spectra Metrics Inc. (SMI) [5,6,7] employed multiple photomultiplier tubes (PMTs) by adjusting the angle between the echelle grating and prism to select wavelengths. Since area-array CCDs emerged in the 1980s, they have become the primary detector for echelle spectrometers, notably after Torr et al. [8] designed the first such instrument in 1988. Domestic research in China started later, with institutions like the Changchun Institute of Optics, Fine Mechanics and Physics (CIOMP) [9,10], Tianjin University [11,12,13], and the Beijing Central Iron and Steel Research Institute [14] conducting relevant studies, predominantly using area-array detectors.
However, CCDs exhibit low quantum efficiency in the ultraviolet (UV) region, challenging the broad-band response needs of echelle spectrometers. Although intensified CCD (ICCD) or scientific CMOS (sCMOS) can improve UV response, their high cost increases system price significantly. To optimize the cost-performance ratio, we propose a novel echelle spectrometer architecture that integrates a digital micromirror device (DMD) as a spatial light modulator and a highly sensitive PMT as the detector, replacing the conventional area-array detector to achieve a balance between high performance and cost efficiency. This scheme’s feasibility is verified by optical simulation software.
2. Calculation of Key Echelle Spectrometer Parameters
2.1. Specifications
The core component parameters were designed and optimized (Table 1) to meet the requirements for high-precision spectral analysis.
Table 1.
Design parameters of the echelle spectrometer.
2.2. Echelle Grating
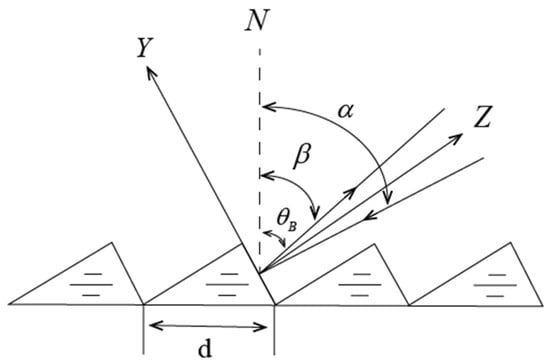
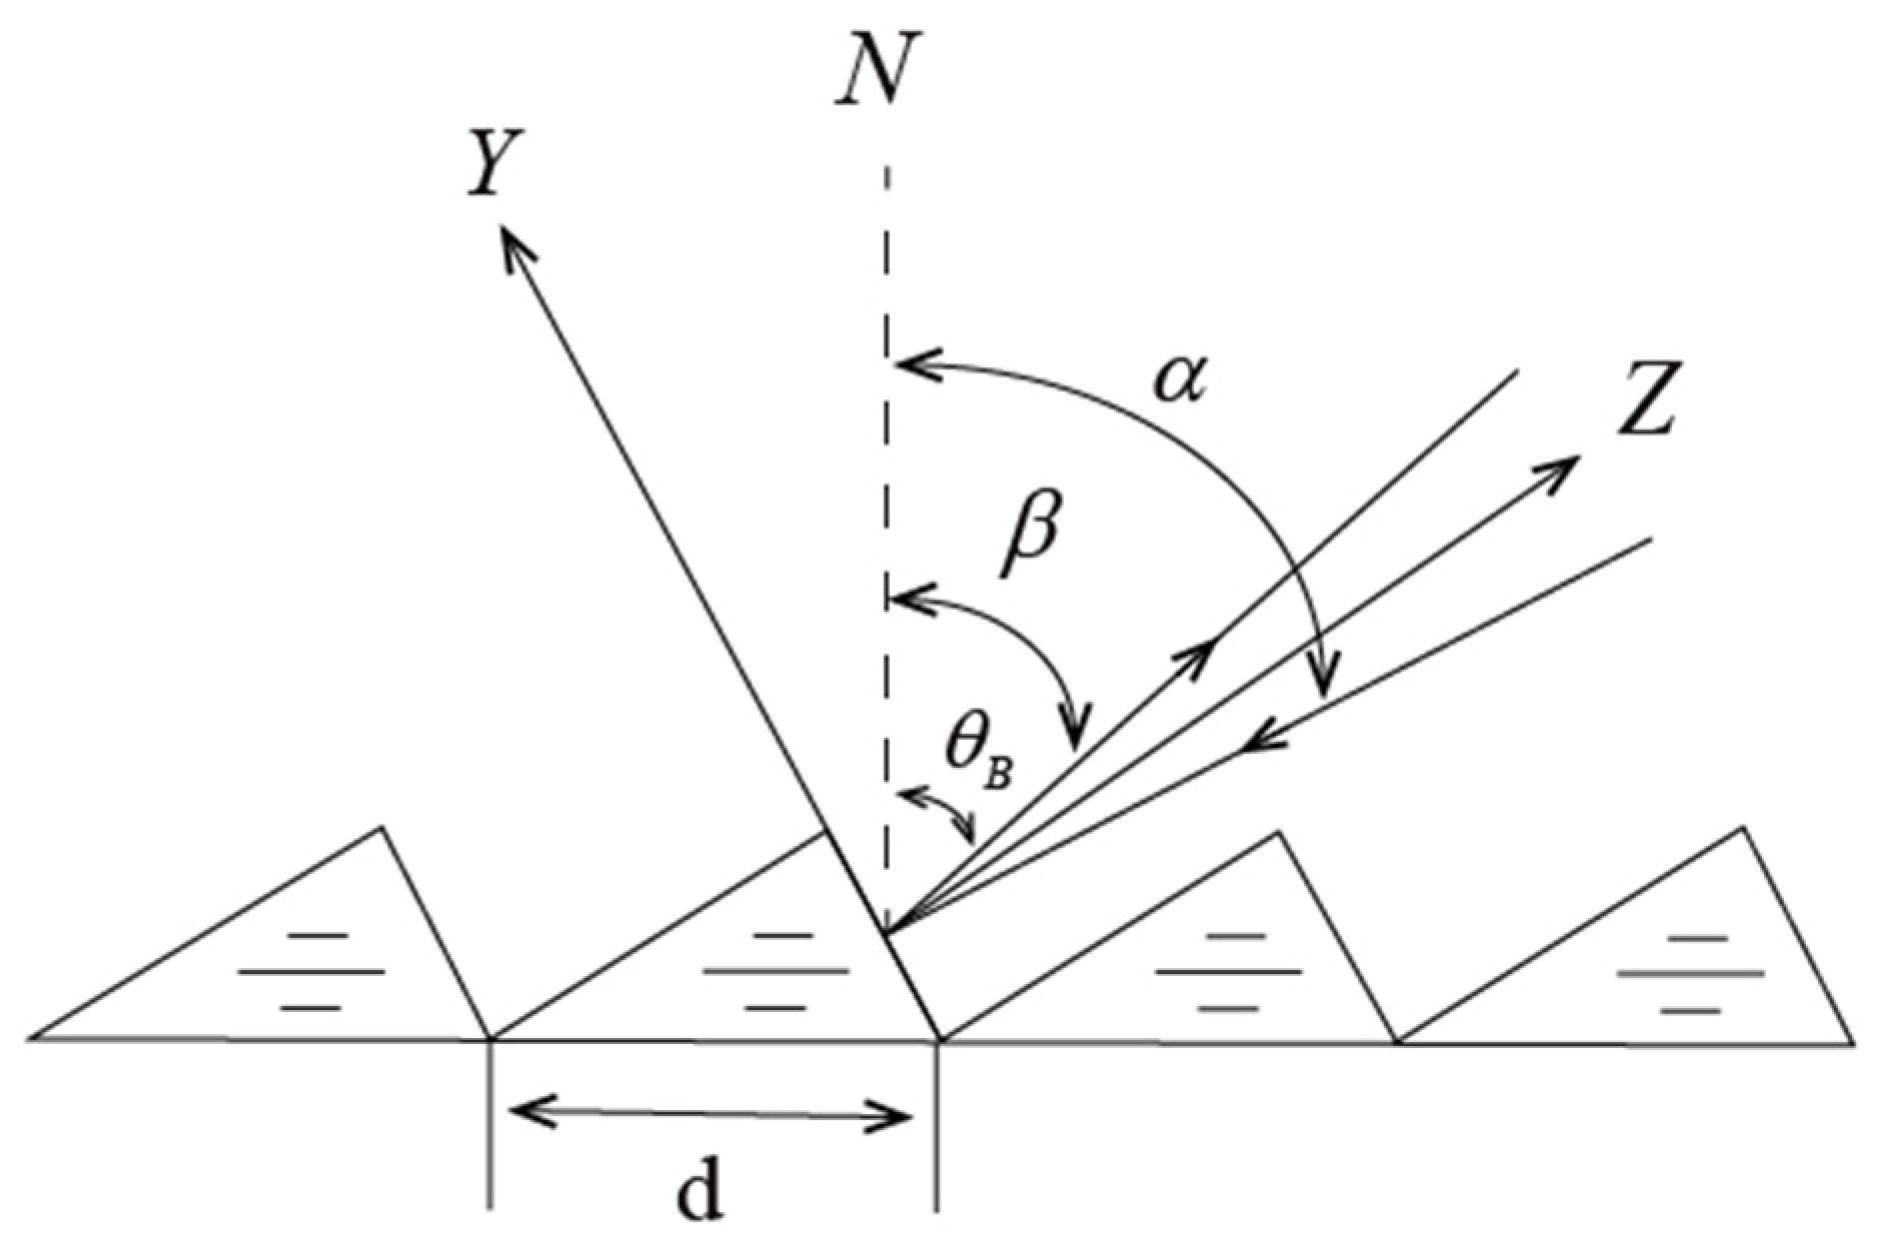
An echelle grating is a blazed grating with low groove density (tens per millimeter), contrasting sharply with conventional gratings (hundreds to thousands per millimeter). Figure 1 shows its structure in the Y–Z plane: N is the normal, is the blaze angle, is the incidence angle, is the diffraction angle, and d is the grating constant.
Figure 1.
Schematic of the echelle grating.
Its dispersion follows the grating equation shown below:
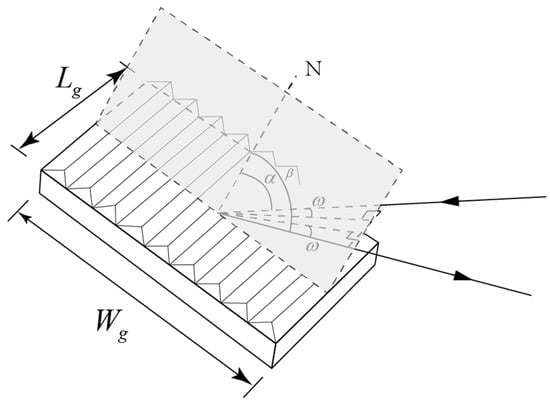
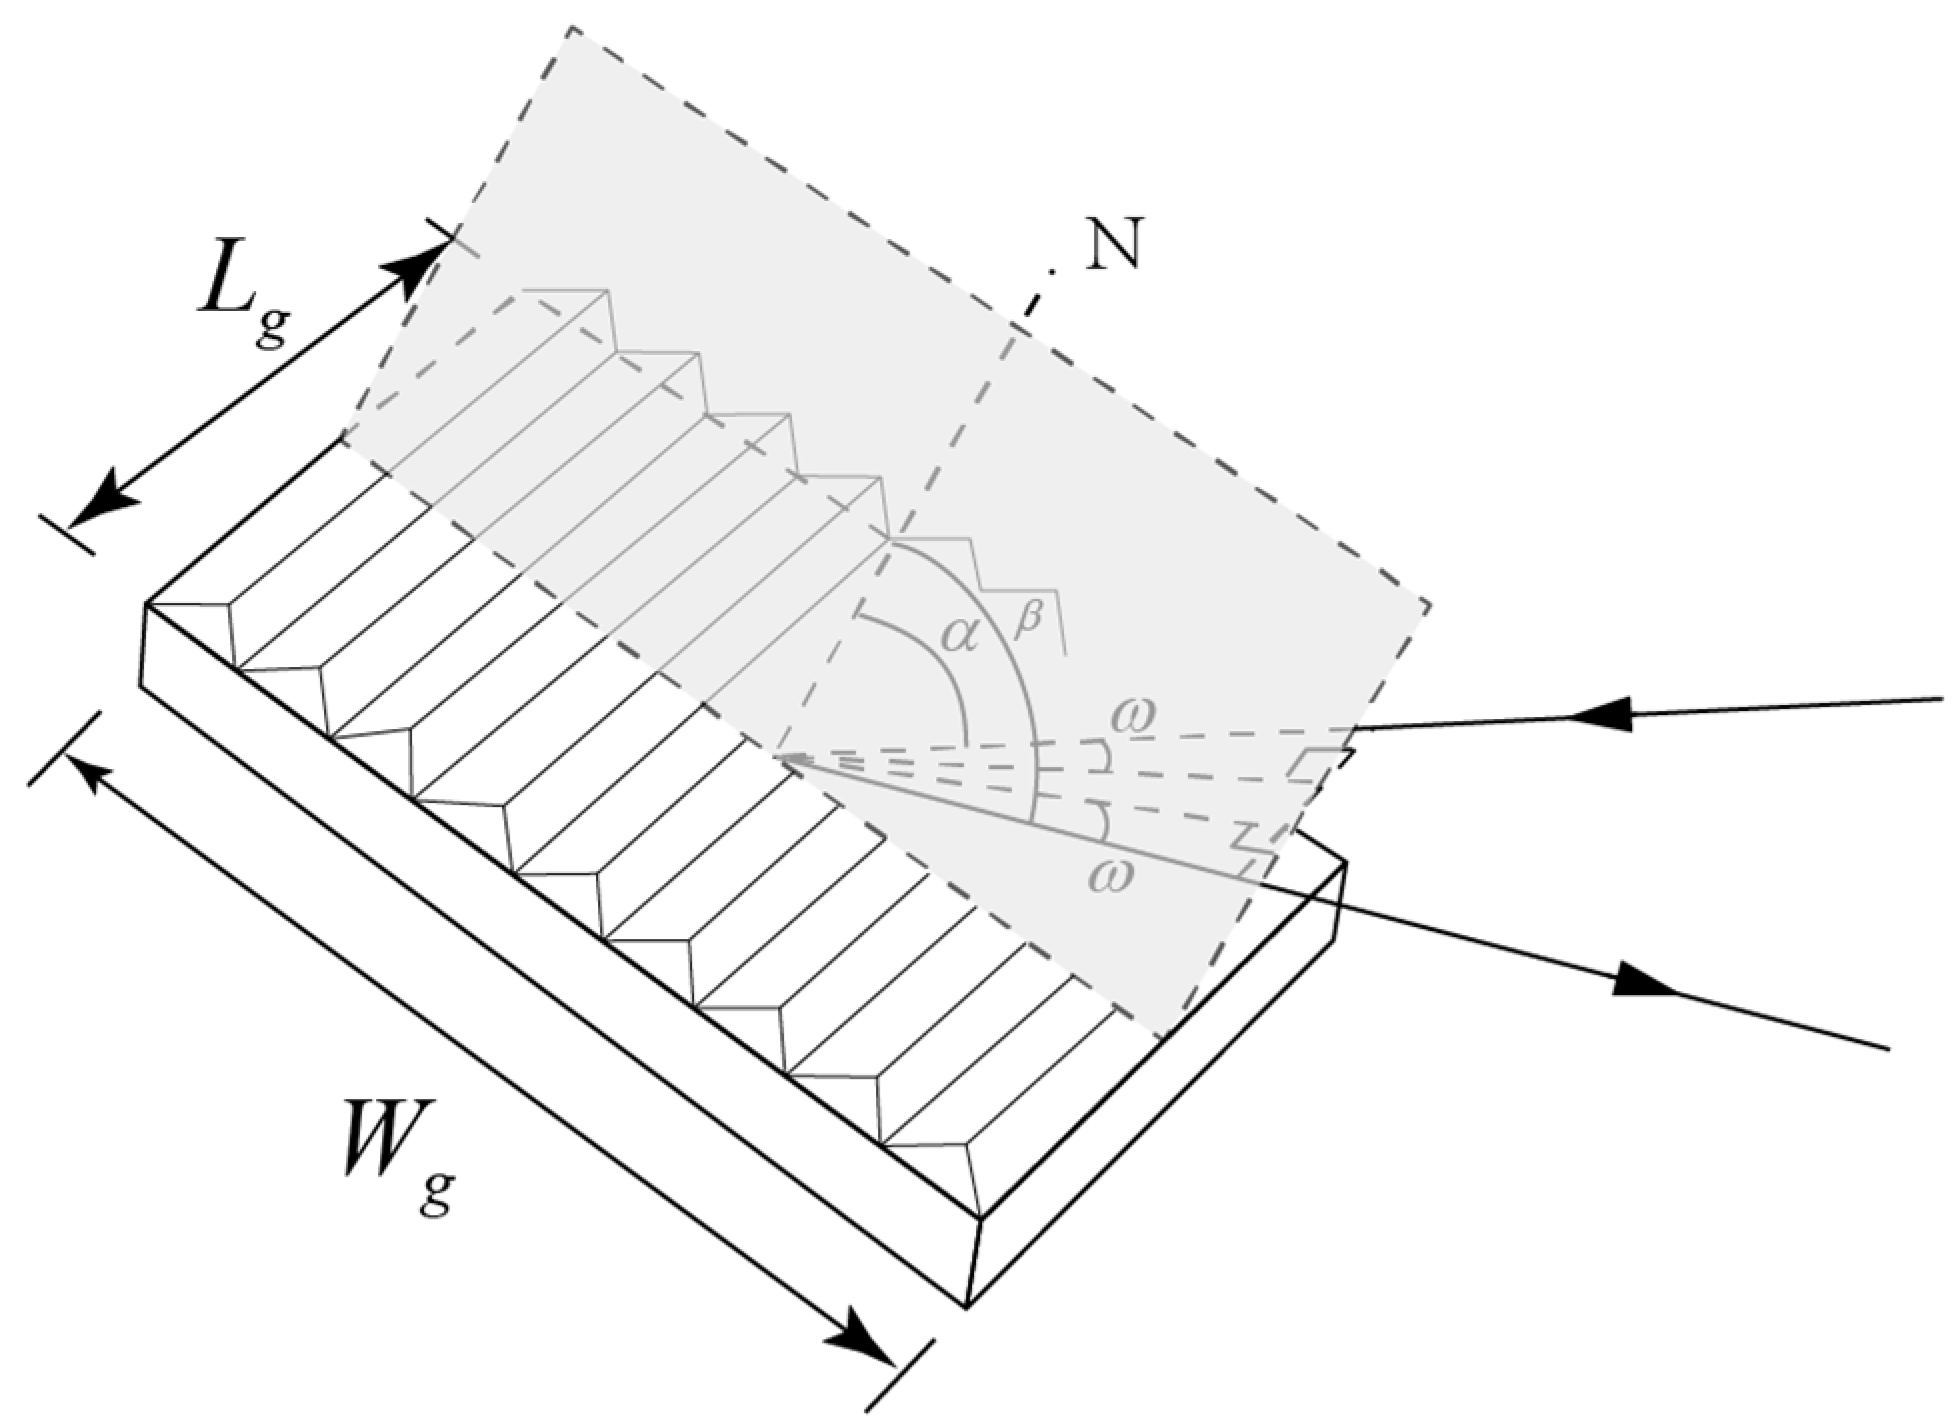
Typically employed with large blaze angles and high diffraction orders (m ranging from tens to hundreds), the design often adheres to the Littrow condition () to maximize efficiency. Practically, a small offset angle is introduced (Figure 2, no principal section dispersion), modifying Equation (1) to form the following equation:
Figure 2.
Dispersion outside the principal section of an echelle grating.
For small , its properties approximate a grating with constant . Angular dispersion and linear dispersion are derived from Equation (1):
where is the system focal length. High and yield high dispersion.
The free spectral range (FSR), the wavelength interval between overlapping orders, is shown below:
where is the central wavelength. The FSR upper and lower limits are as follows:
2.3. Secondary Dispersive Element
Operating near the Littrow maintains high efficiency across the band, but minimal change in angles with wavelength causes order overlap. Cross-dispersion separates orders. Common secondary elements are planar gratings (can produce multiple orders, adding stray light, suited for large instruments) and prisms (no multiple orders, reduce stray light, but cause nonuniform order distribution in the 2D spectrum due to nonlinear dispersion [15]. For our compact design, a prism was selected.
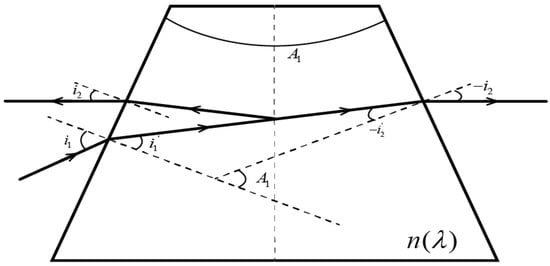
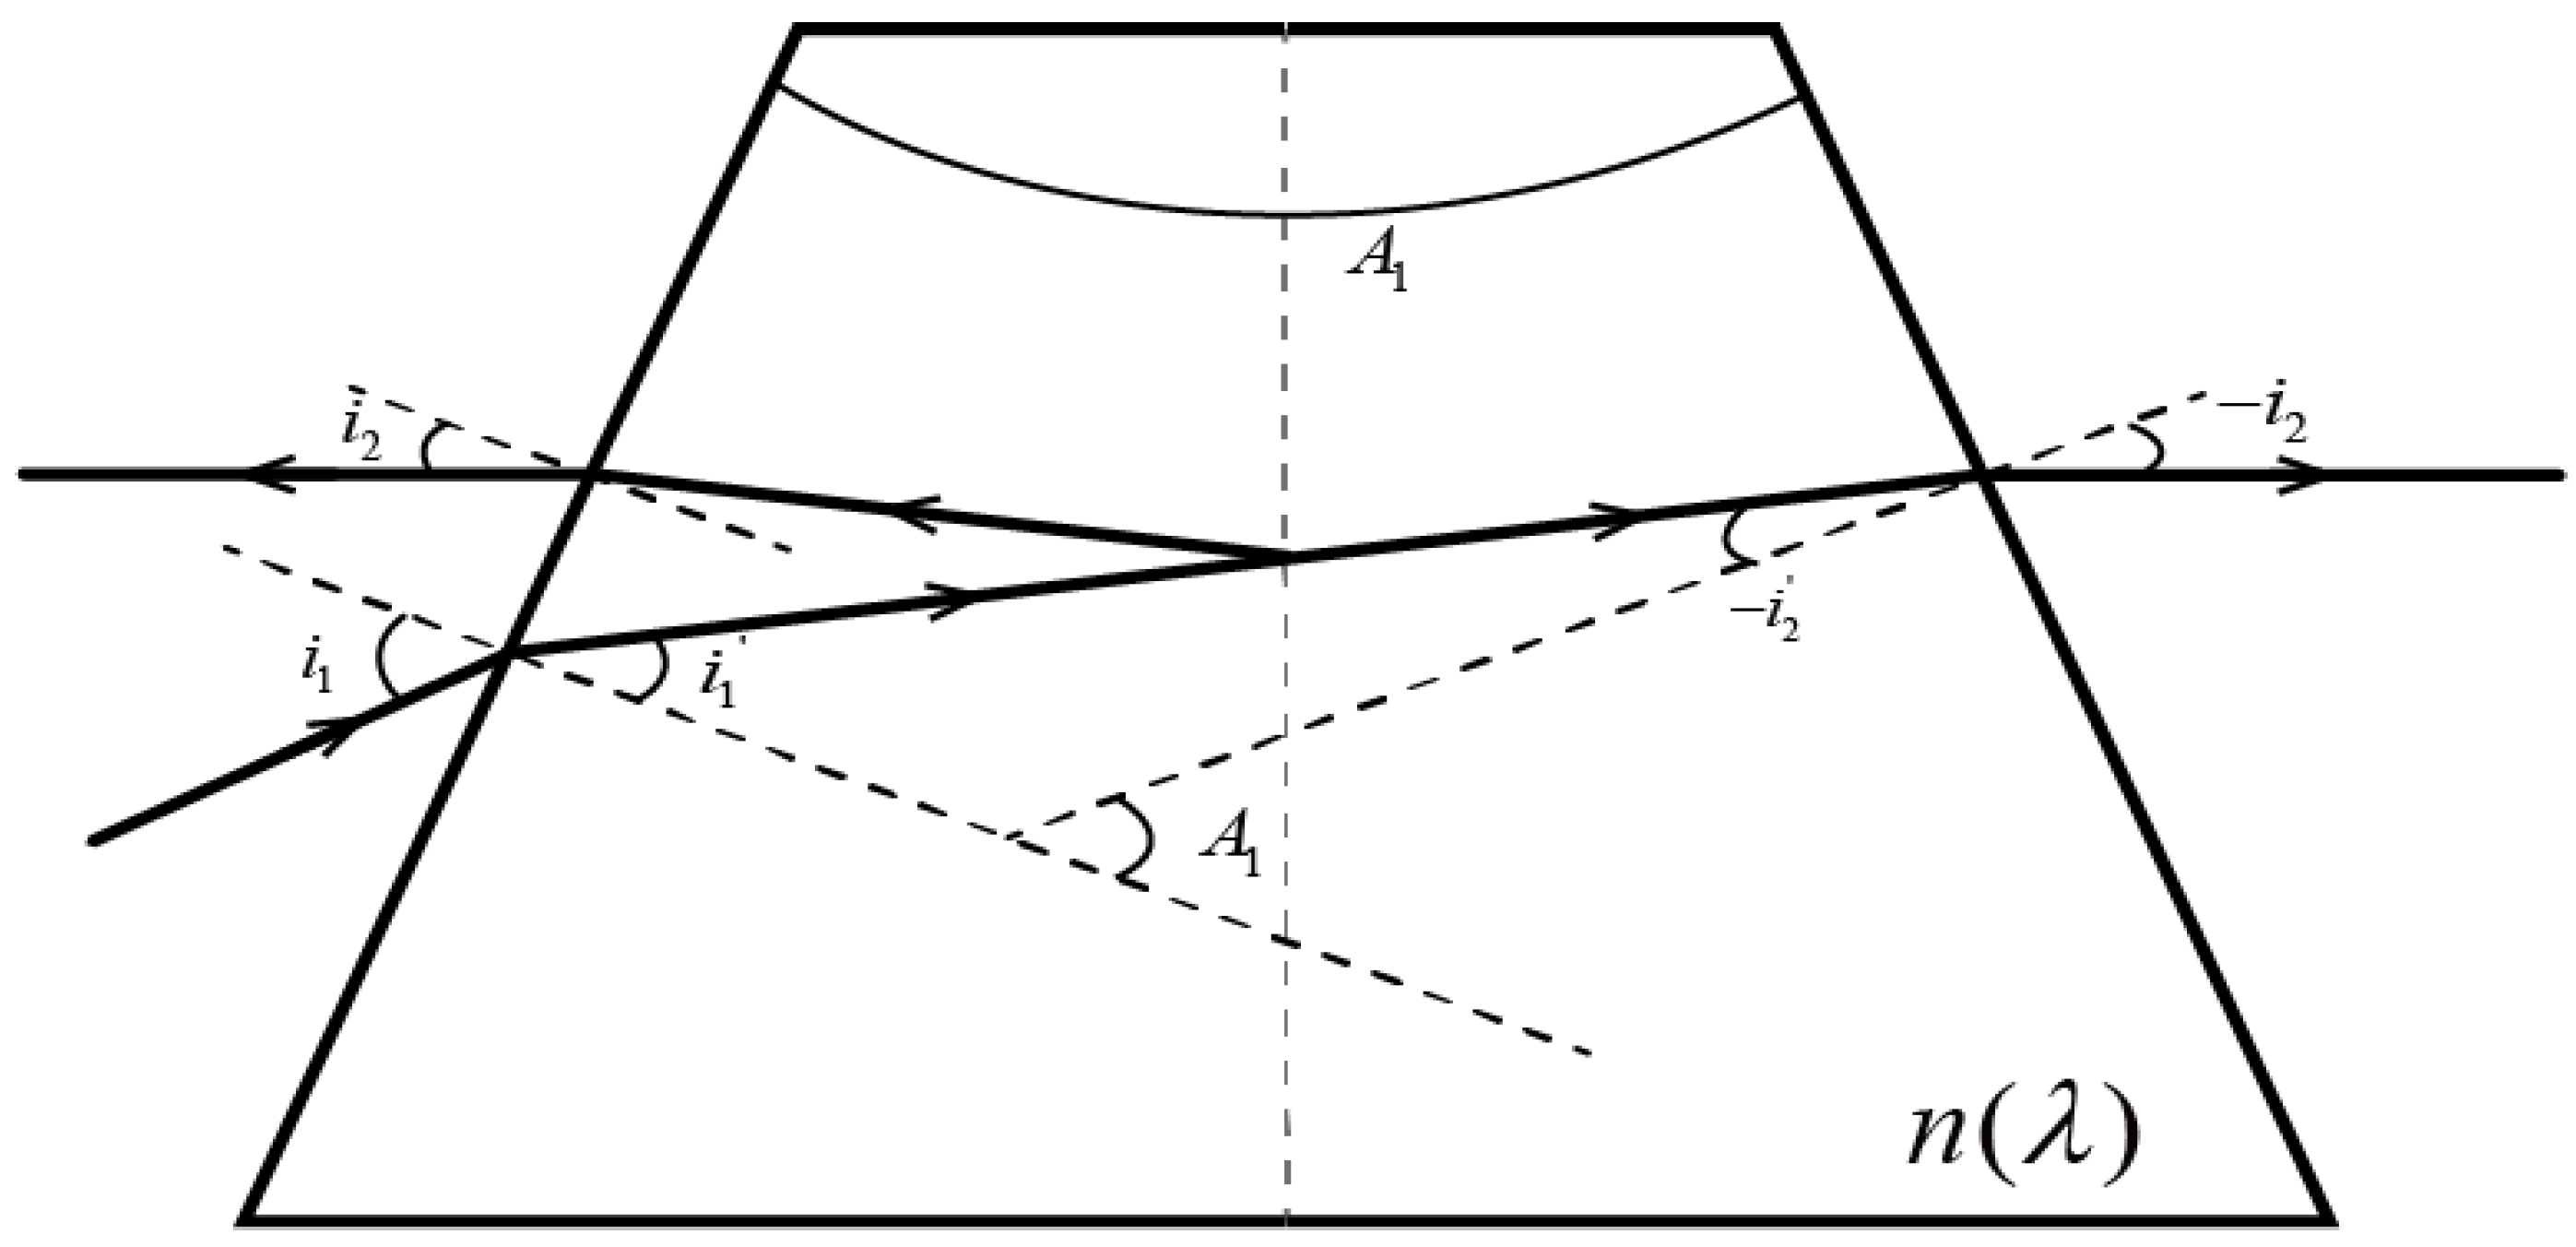
A reflective single prism was chosen. Unfolding its reflective surface models it as a transmissive prism with apex angle , where is the original apex angle (Figure 3). Here, is the incidence angle, is the exit angle, and is the material refractive index.
Figure 3.
Light path schematic for a single reflective prism.
Sign convention: Light travels left to right. Clockwise rotation from the normal gives positive angles; counterclockwise, negative. Apex angle upward is positive; downward, negative.
According to refraction laws and geometry, the following expressions can be obtained:
Solving yields :
Using trigonometric identities, the final expression is shown below:
Refractive index uses the Sellmeier 1 formula, as shown below:
where are coefficients. The deviation angle is , and the dispersion width is . With system f and DMD size, parameters like , and are determined.
2.4. Two-Dimensional Spectrum
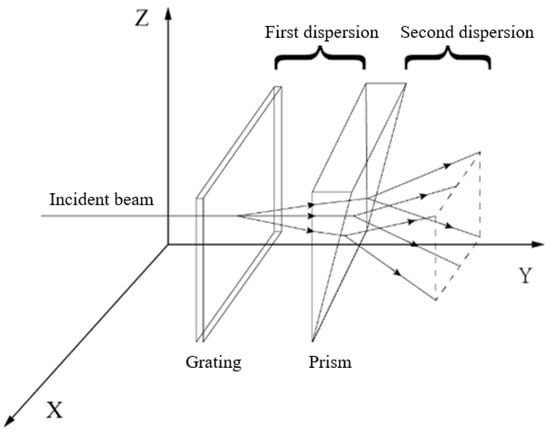
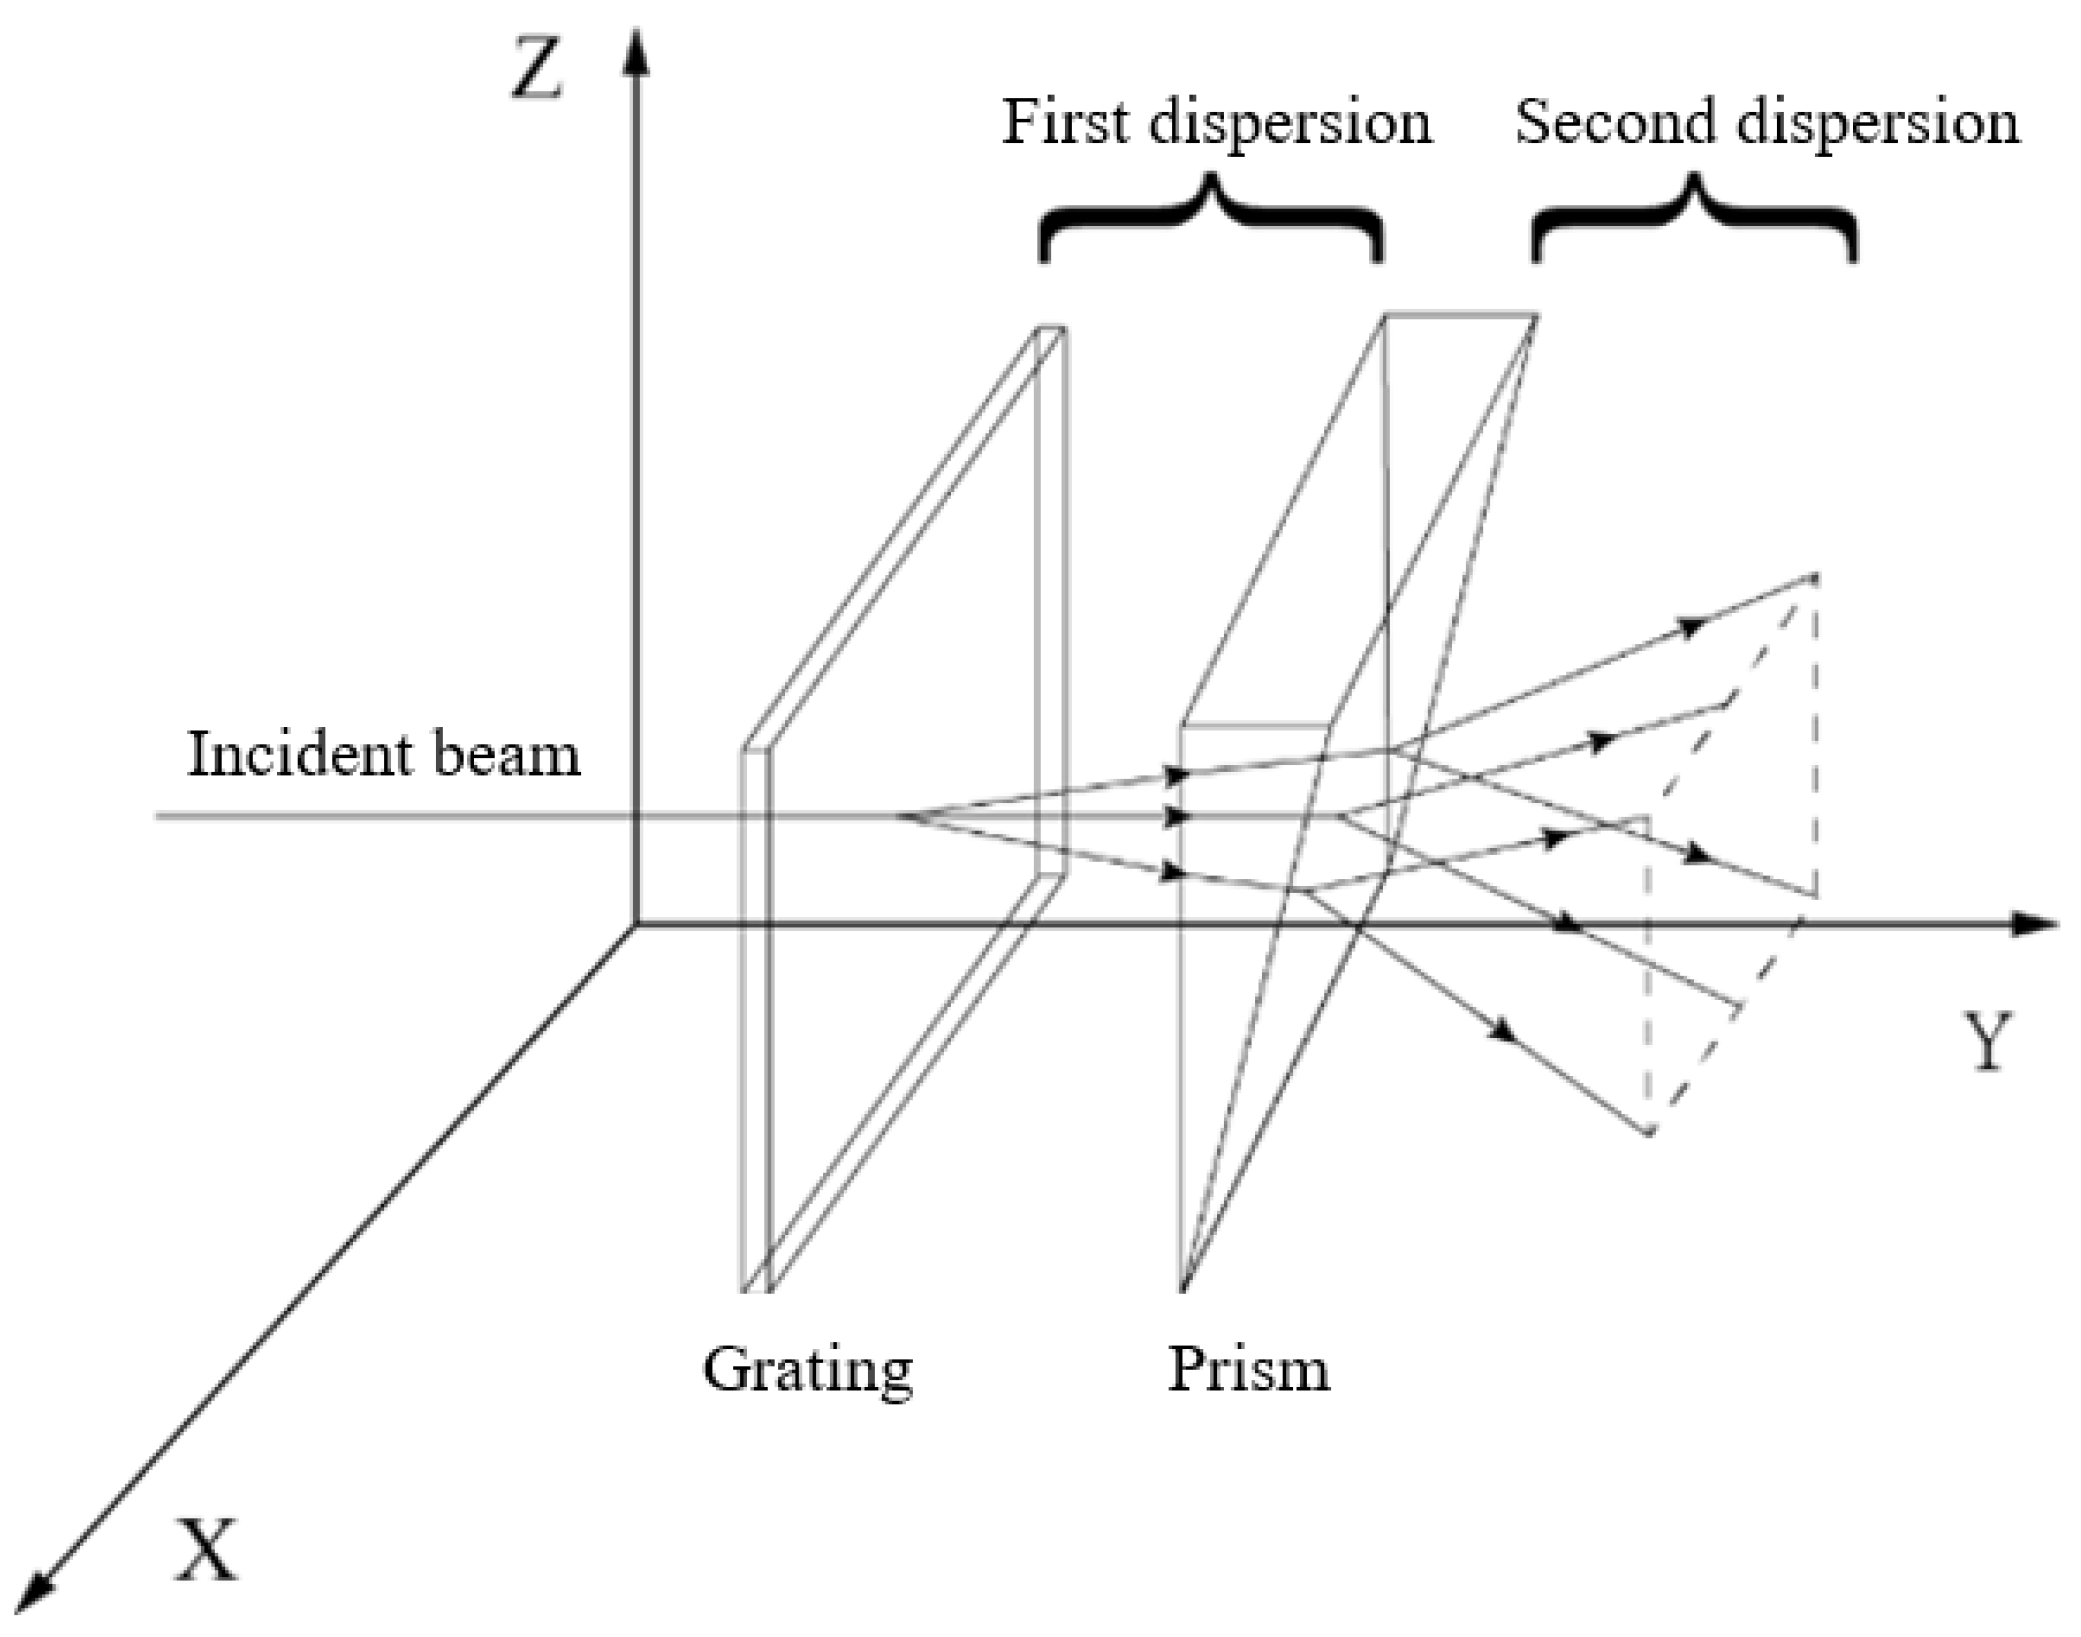
A transverse disperser (prism) perpendicular to the echelle dispersion direction produces the 2D spectrum (cross-dispersion principle, Figure 4). The echelle grating disperses in XY and the prism in YZ, forming the spectrum on the image plane (Figure 5).
Figure 4.
Cross-dispersion principle schematic.
Figure 5.
Two-dimensional spectral map of an echelle spectrometer.
Each line in Figure 5 represents the image area for all wavelengths in one order (highest efficiency region). Short wavelengths are on the top; long wavelengths, bottom. The FSR fans out: narrower for higher orders (shorter ), wider for lower orders (longer ). FSRs connect end-to-end .
Design must consider dispersion in both primary (echelle) and transverse (prism) directions.
For the primary direction, each order’s FSR width must be less than the detector length ():
For the transverse direction, the total spread of all orders must be less than the detector width. The total transverse width is:
where are the max and min deviation angles of all orders’ central wavelengths. Thus, the prism’s angular spread is constrained by f and the transverse CCD size.
3. Optical Design
3.1. Front-End Design with DMD
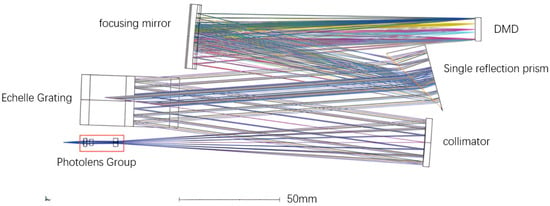
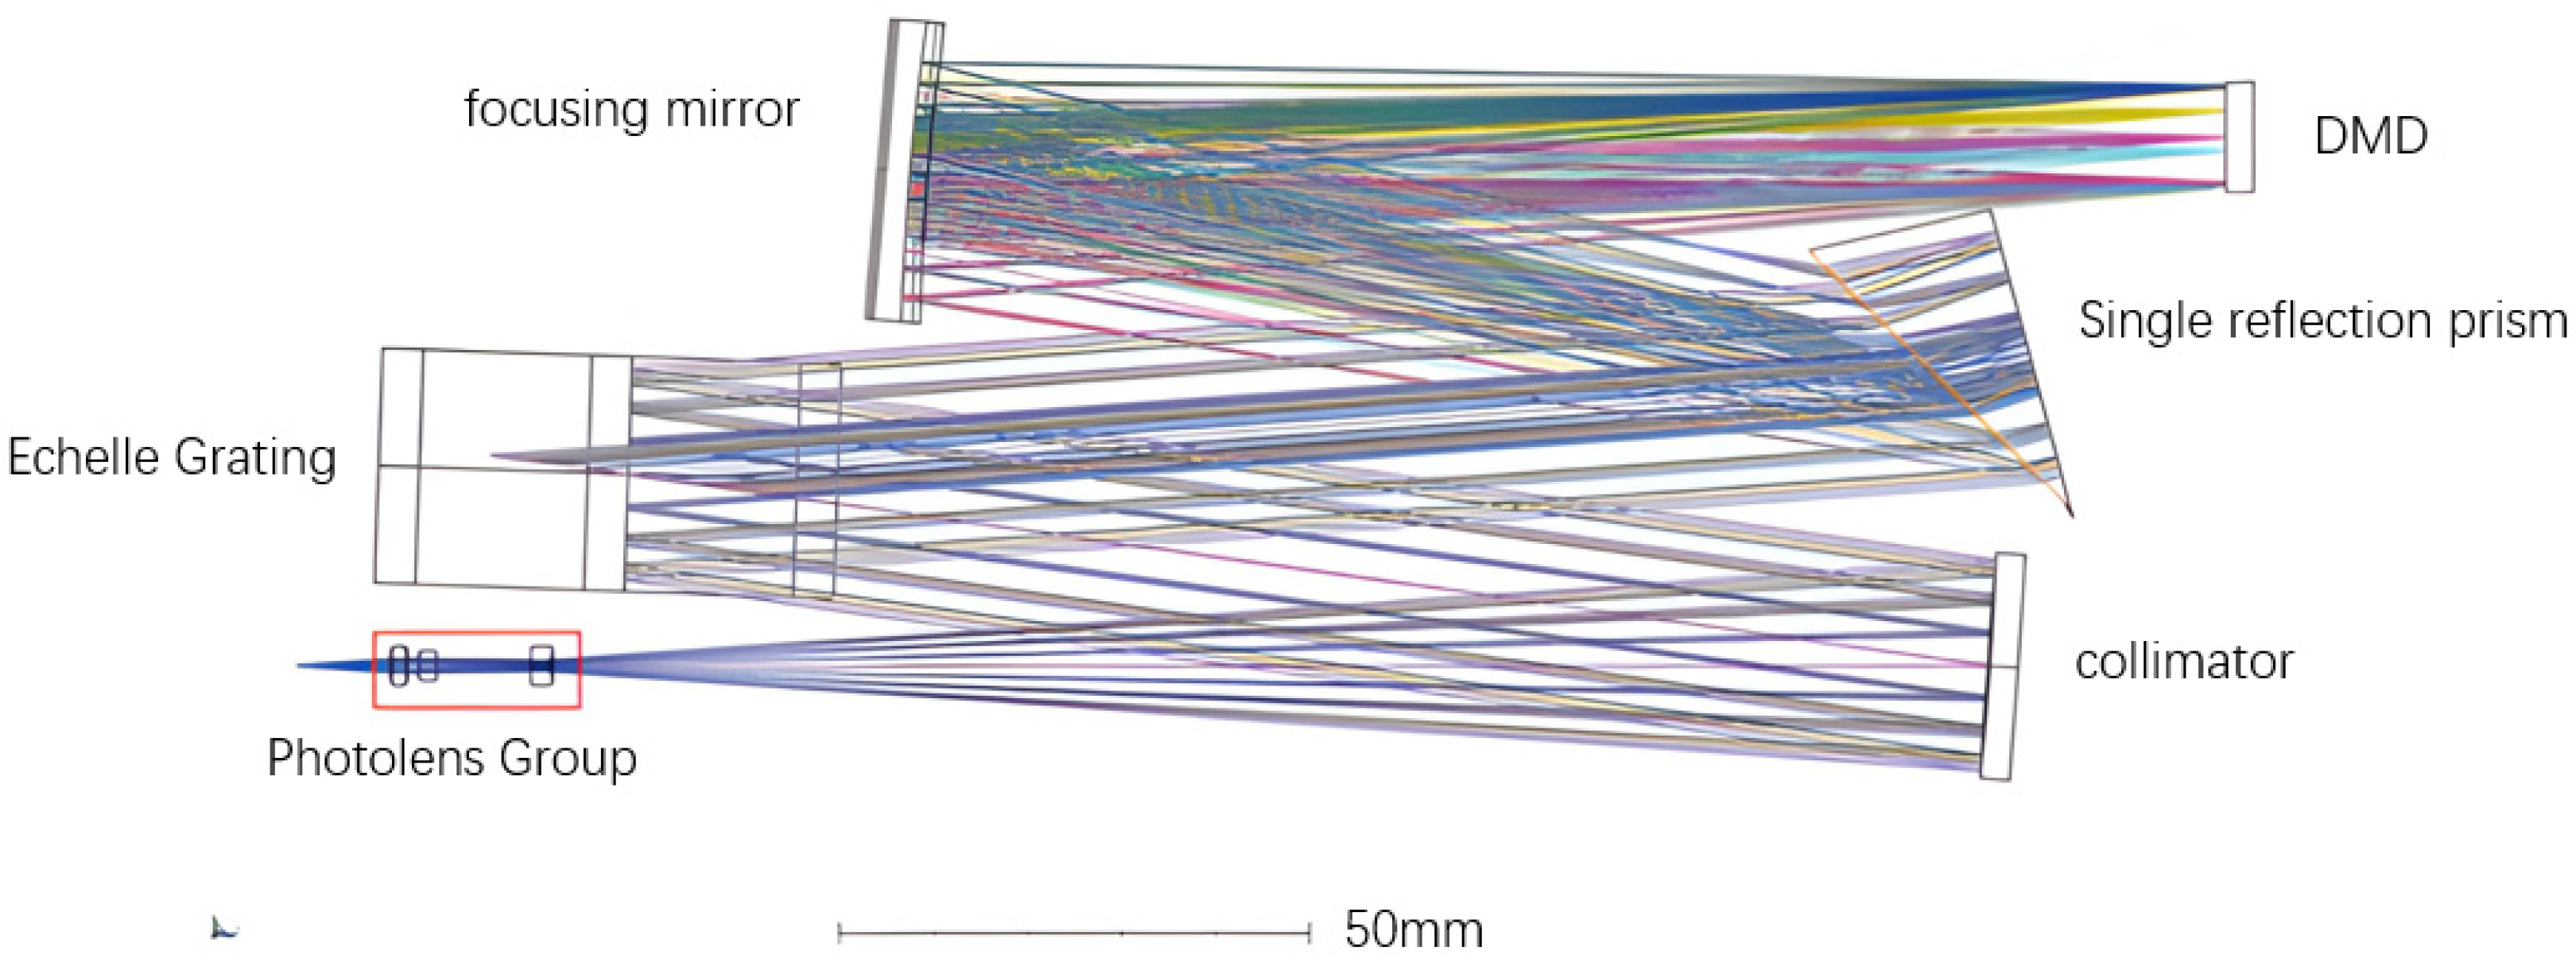
The optical layout of the spectrometer is shown in Figure 6. Light from the entrance aperture (located at the lower left in the figure) is first collimated by a spherical mirror. The collimated beam then illuminates the echelle grating, which provides primary dispersion in the horizontal plane. A prism oriented perpendicular to the grating dispersion direction acts as the cross-disperser, separating the overlapping spectral orders in the vertical direction. Finally, the dispersed light is focused onto the DMD target surface by a spherical focusing mirror. The system has an effective focal length and operates with an aperture ratio determined by the diameters and focal lengths of the spherical mirrors.
Figure 6.
Optical path design of the DMD echelle spectrometer. Light enters from the lower left corner (entrance aperture), propagates to the collimating mirror, is dispersed by the echelle grating and prism in sequence, and is finally focused onto the DMD surface at the upper right.
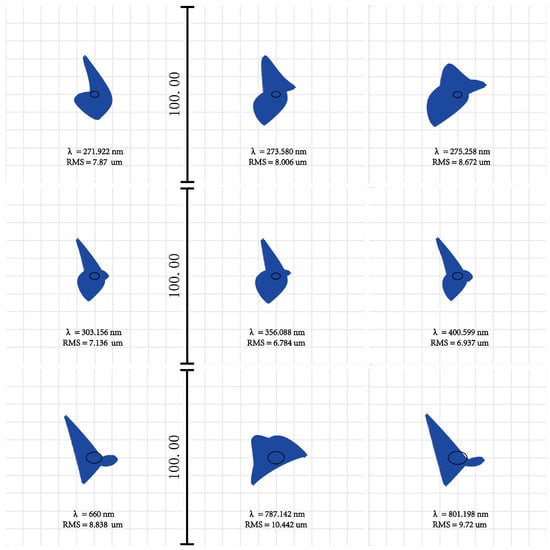
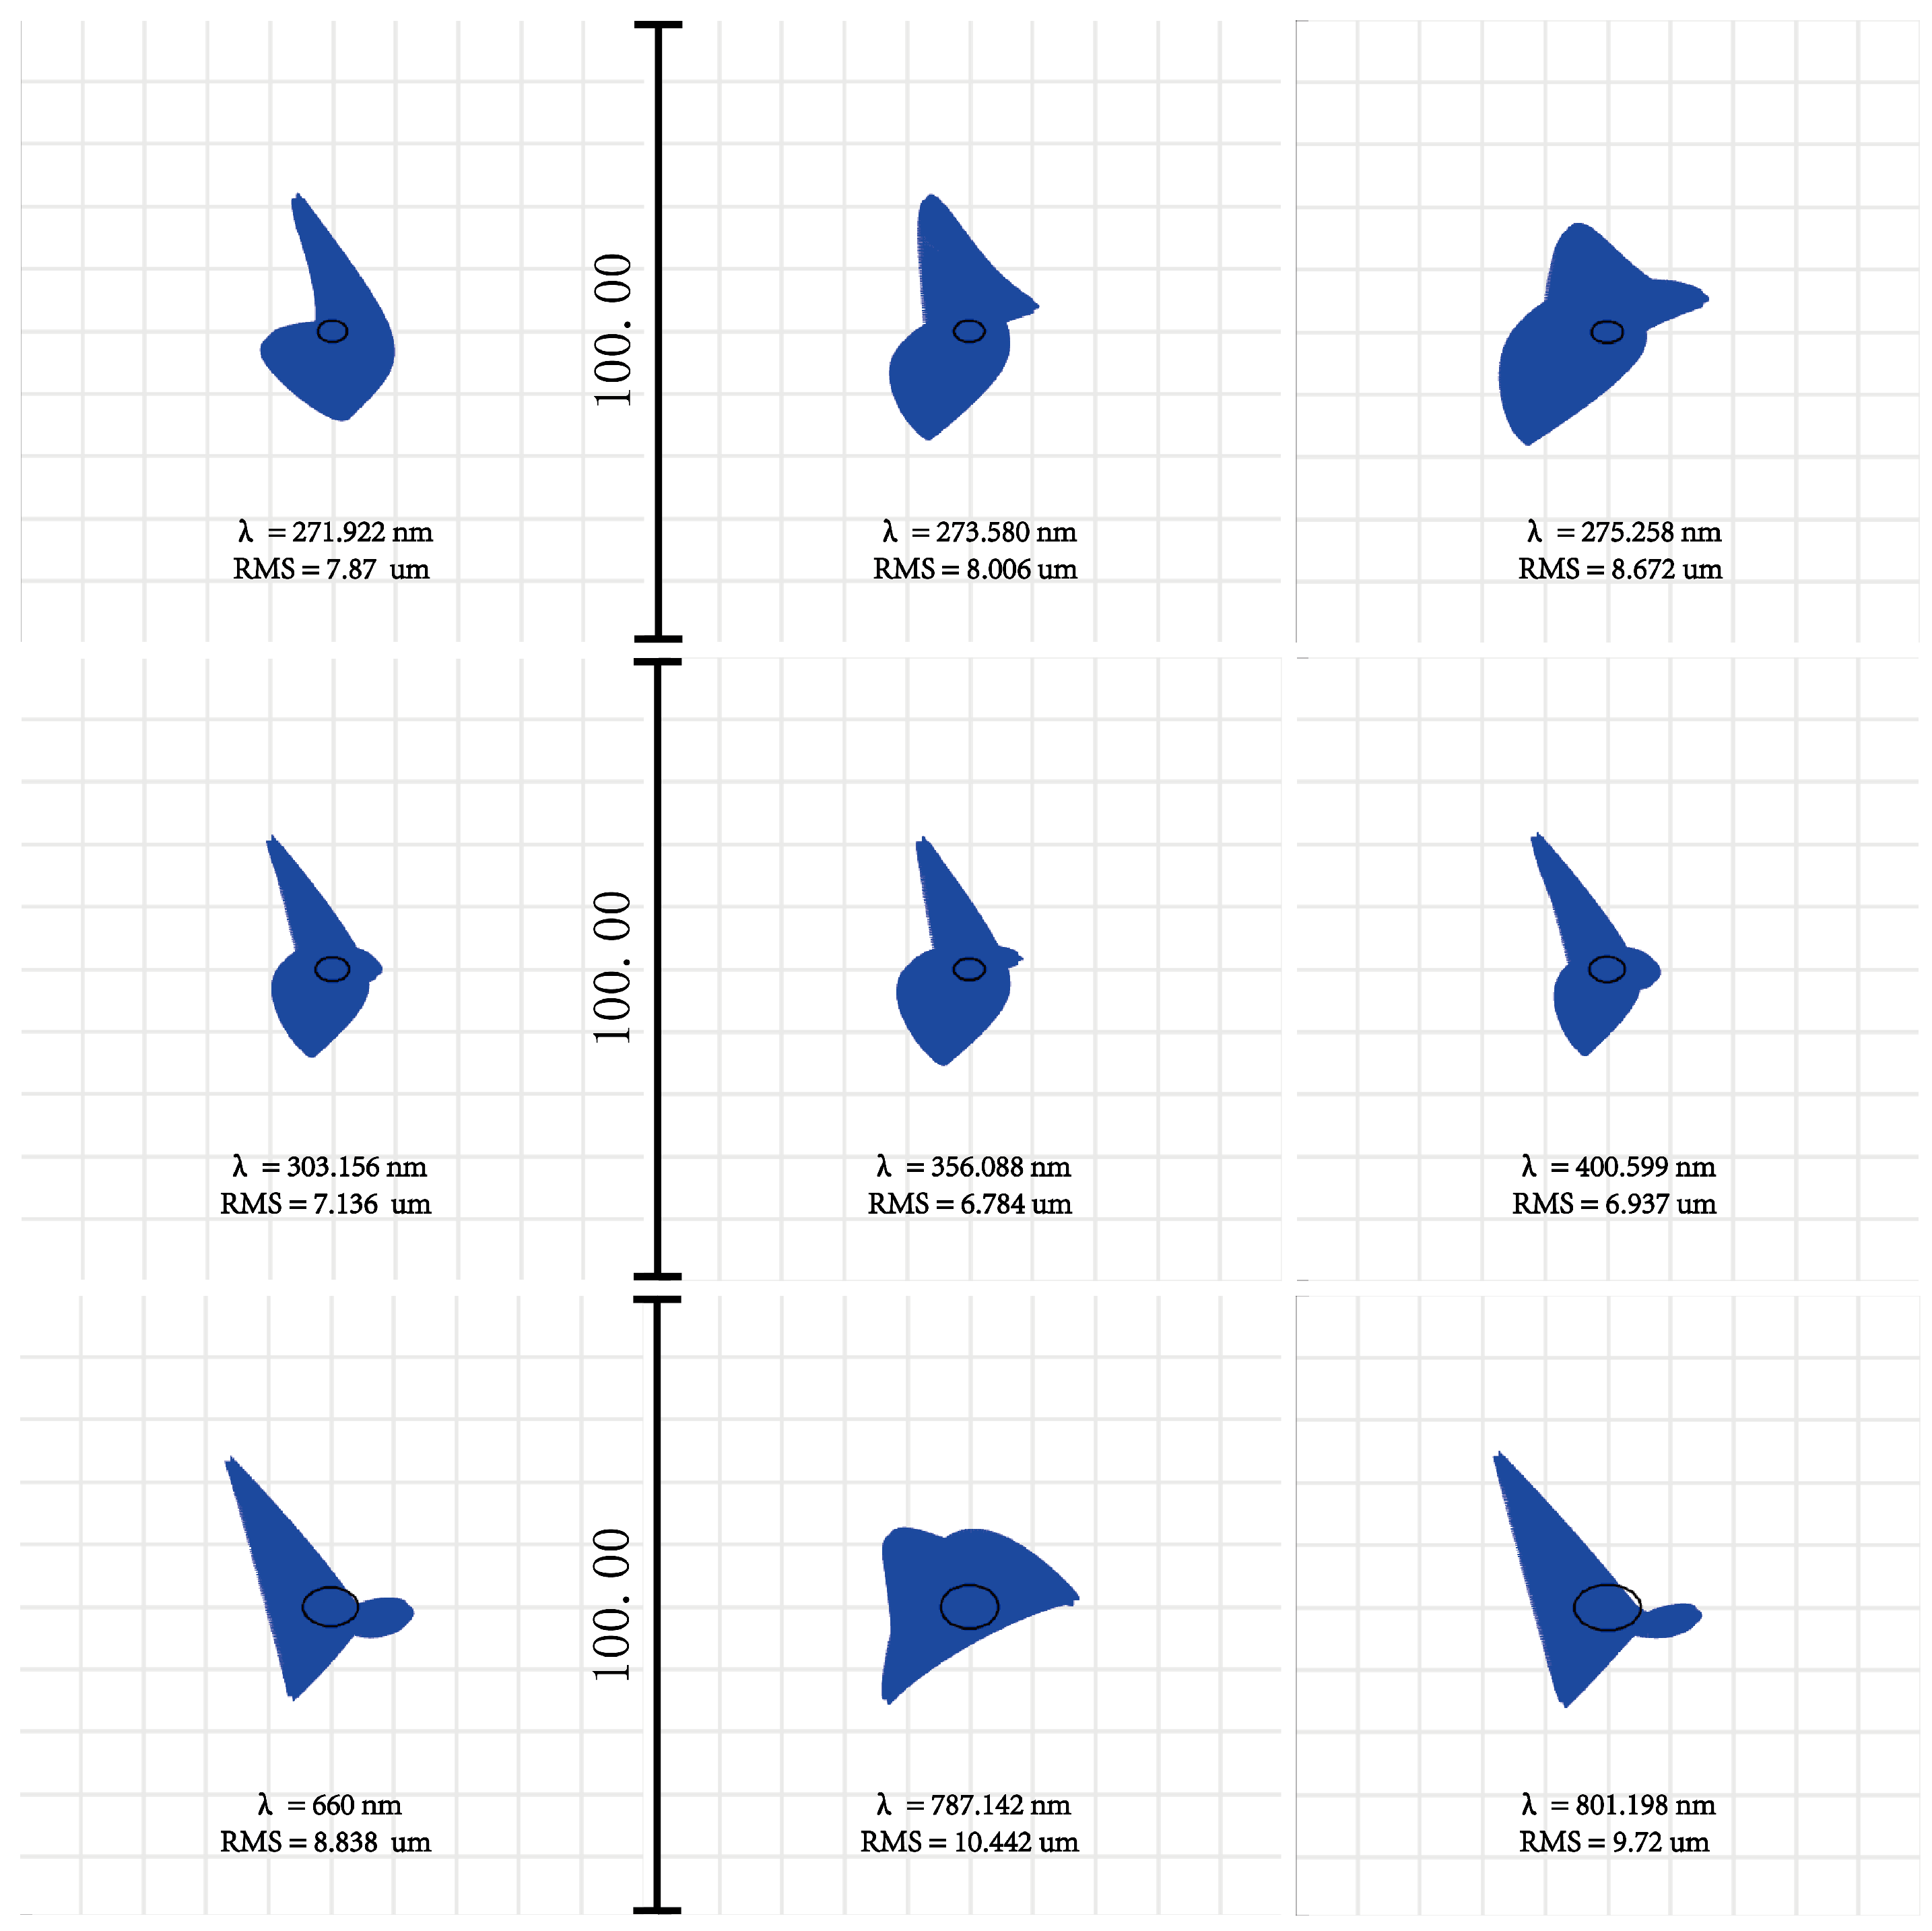
The calculated optical parameters were imported into simulation software for system optimization and performance evaluation. Since an echelle spectrometer is a non-imaging system designed for spectral analysis rather than image formation, conventional imaging quality metrics such as the modulation transfer function (MTF) are not applicable. Instead, the primary figure of merit is the ability to focus each wavelength onto a single DMD micromirror. Therefore, the DMD target surface was used as the reference plane, and the system was optimized to achieve an RMS spot radius smaller than the individual DMD pixel size of 10.8 μm for all wavelengths across the operating range. Key parameters (grating offset angle, collimator off-axis angle) were fixed; the imaging group, spherical collimator, and spherical focus mirror were variables for global optimization via least squares. The final optical layout is shown in Figure 6.
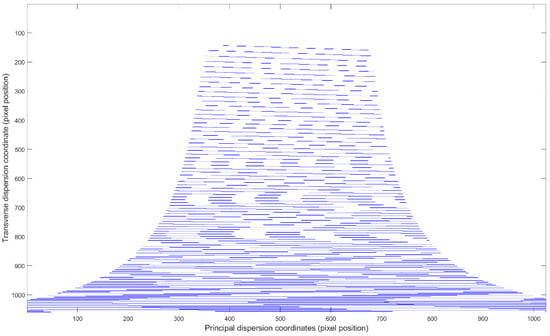
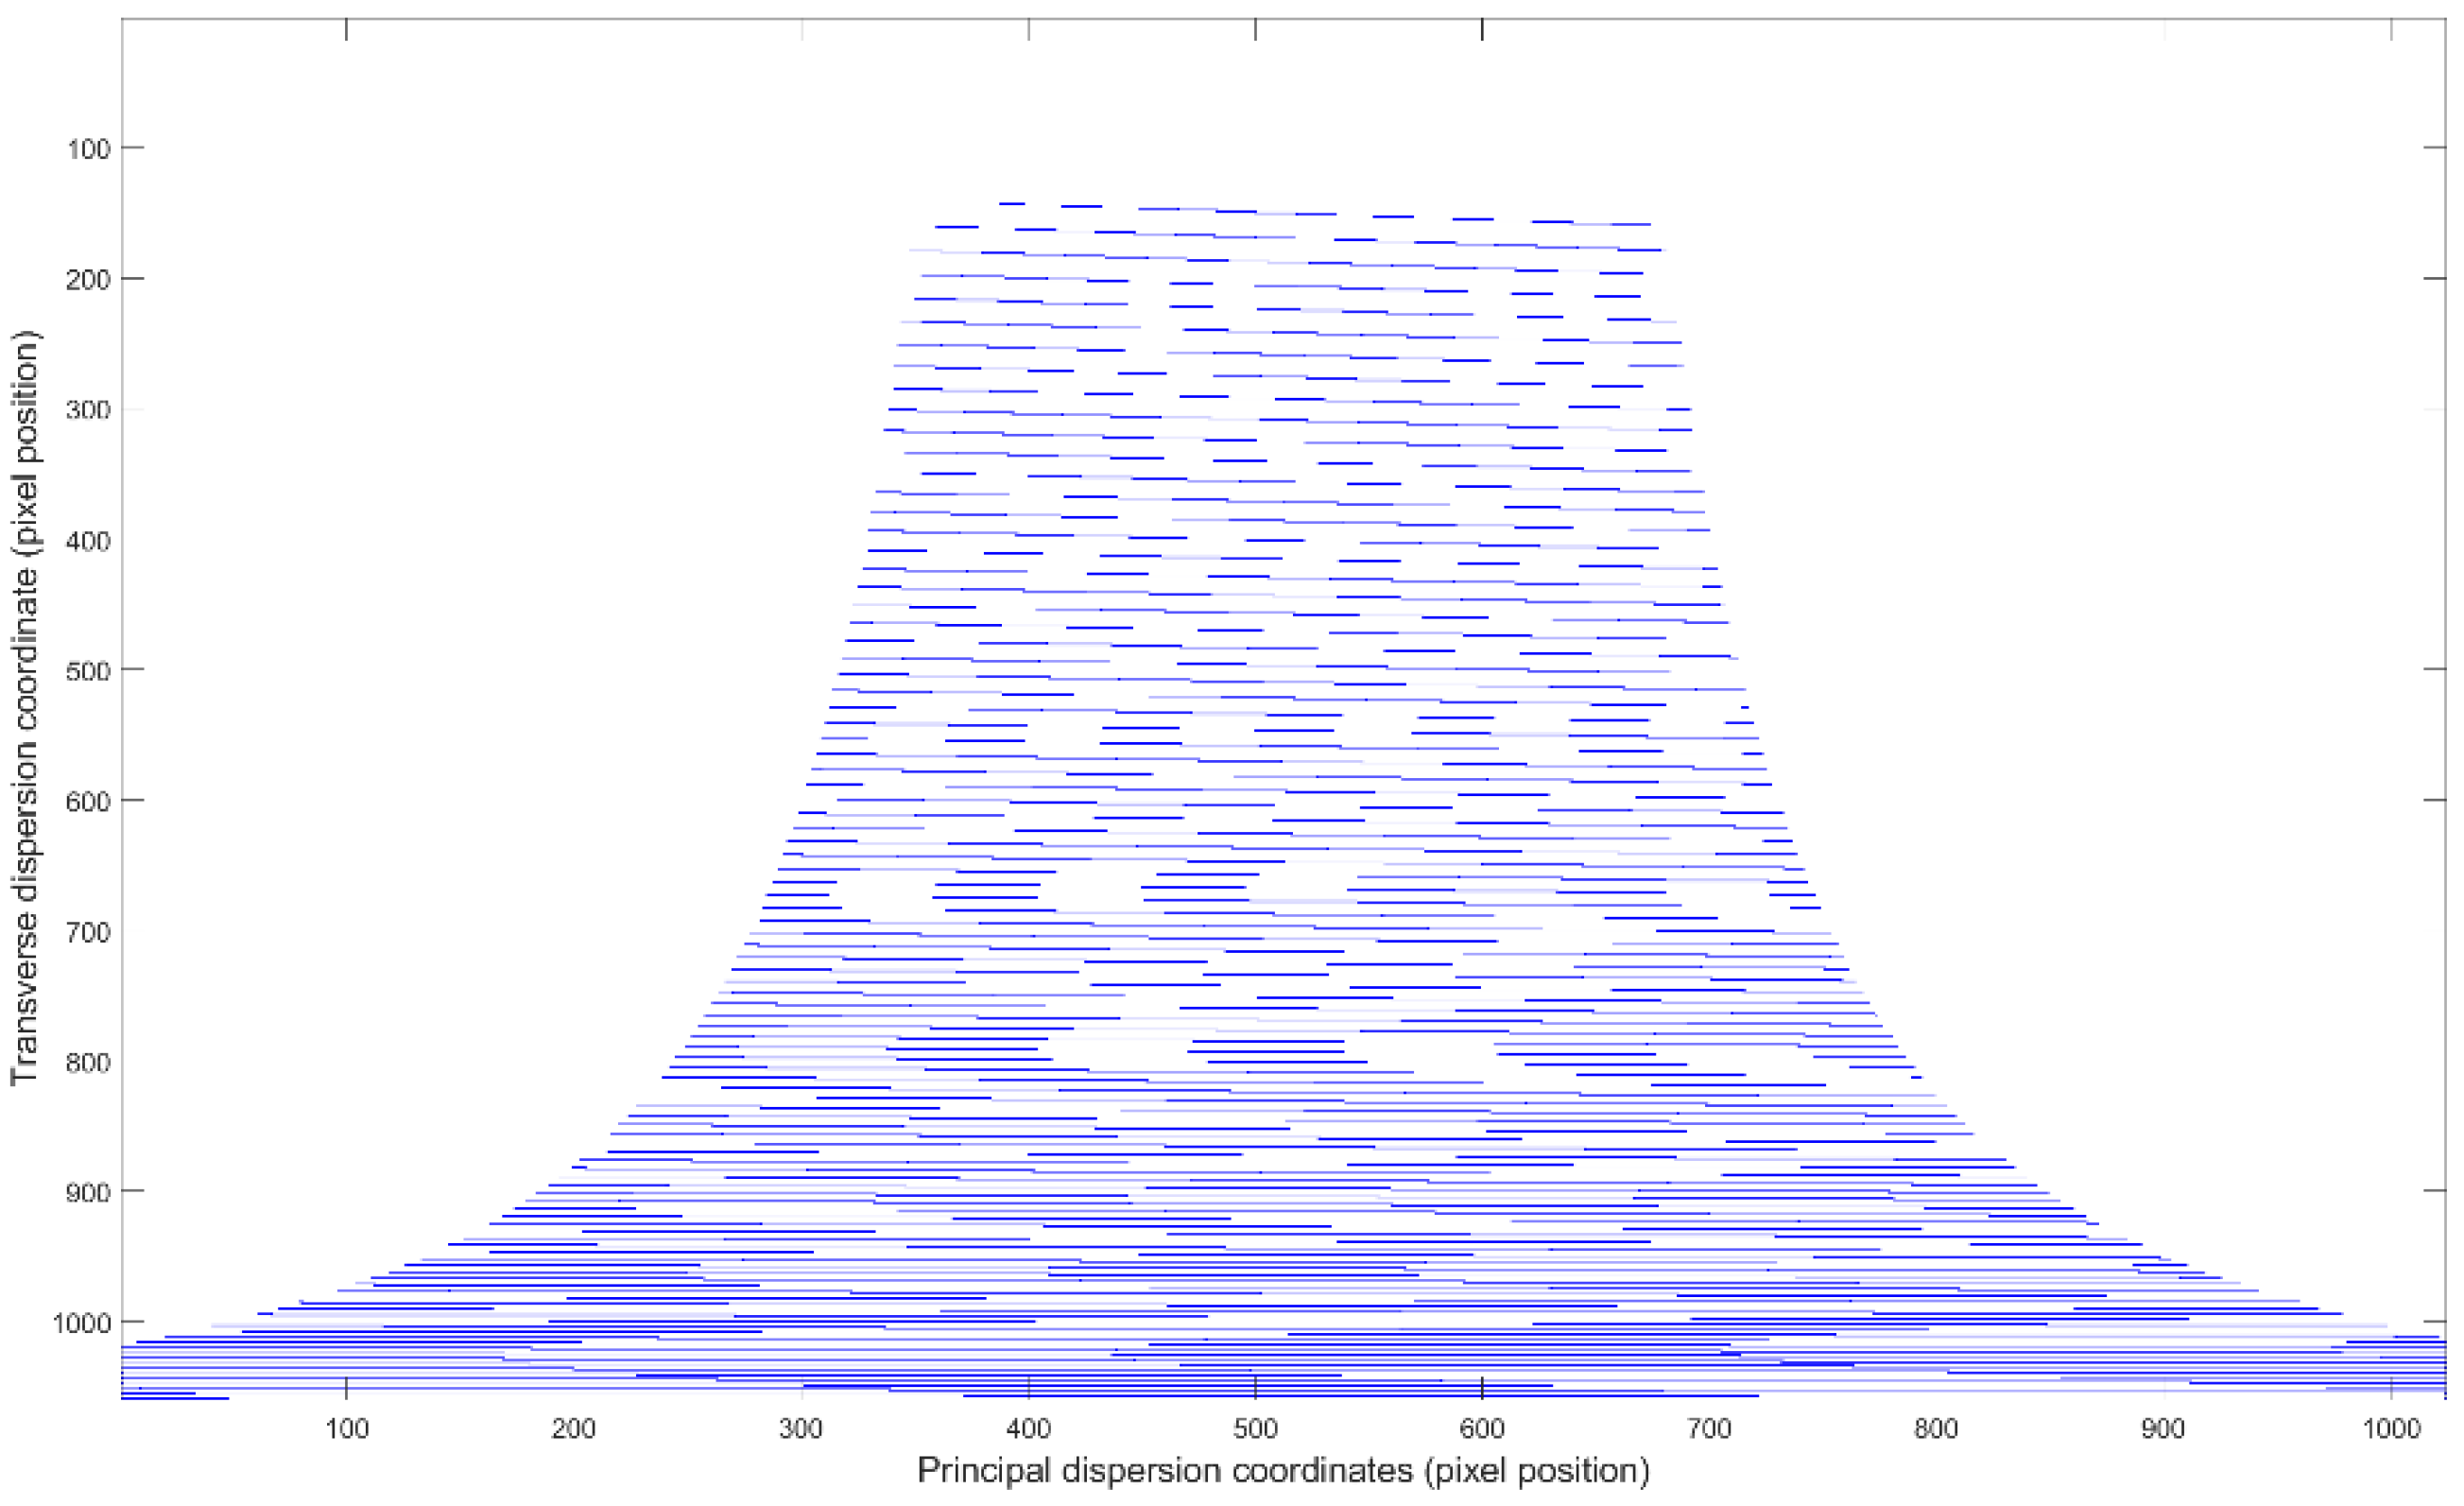
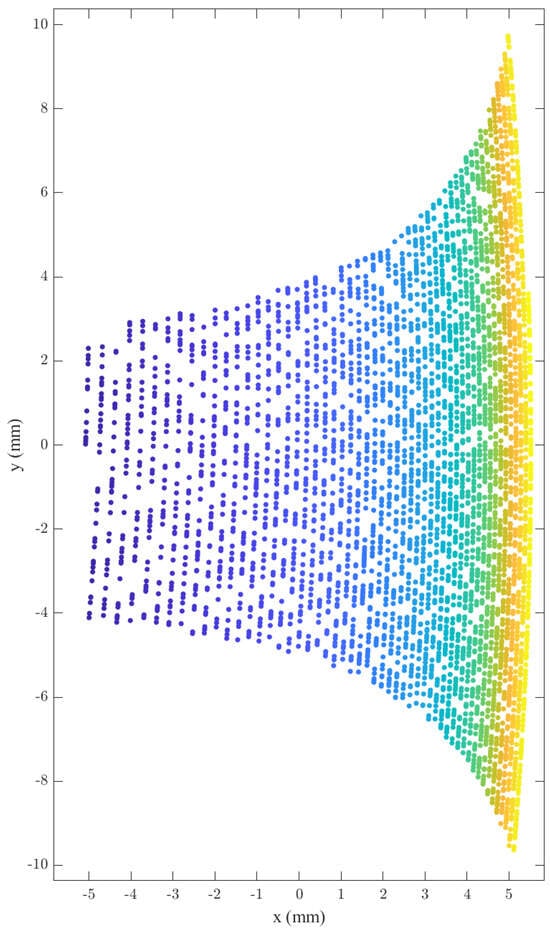
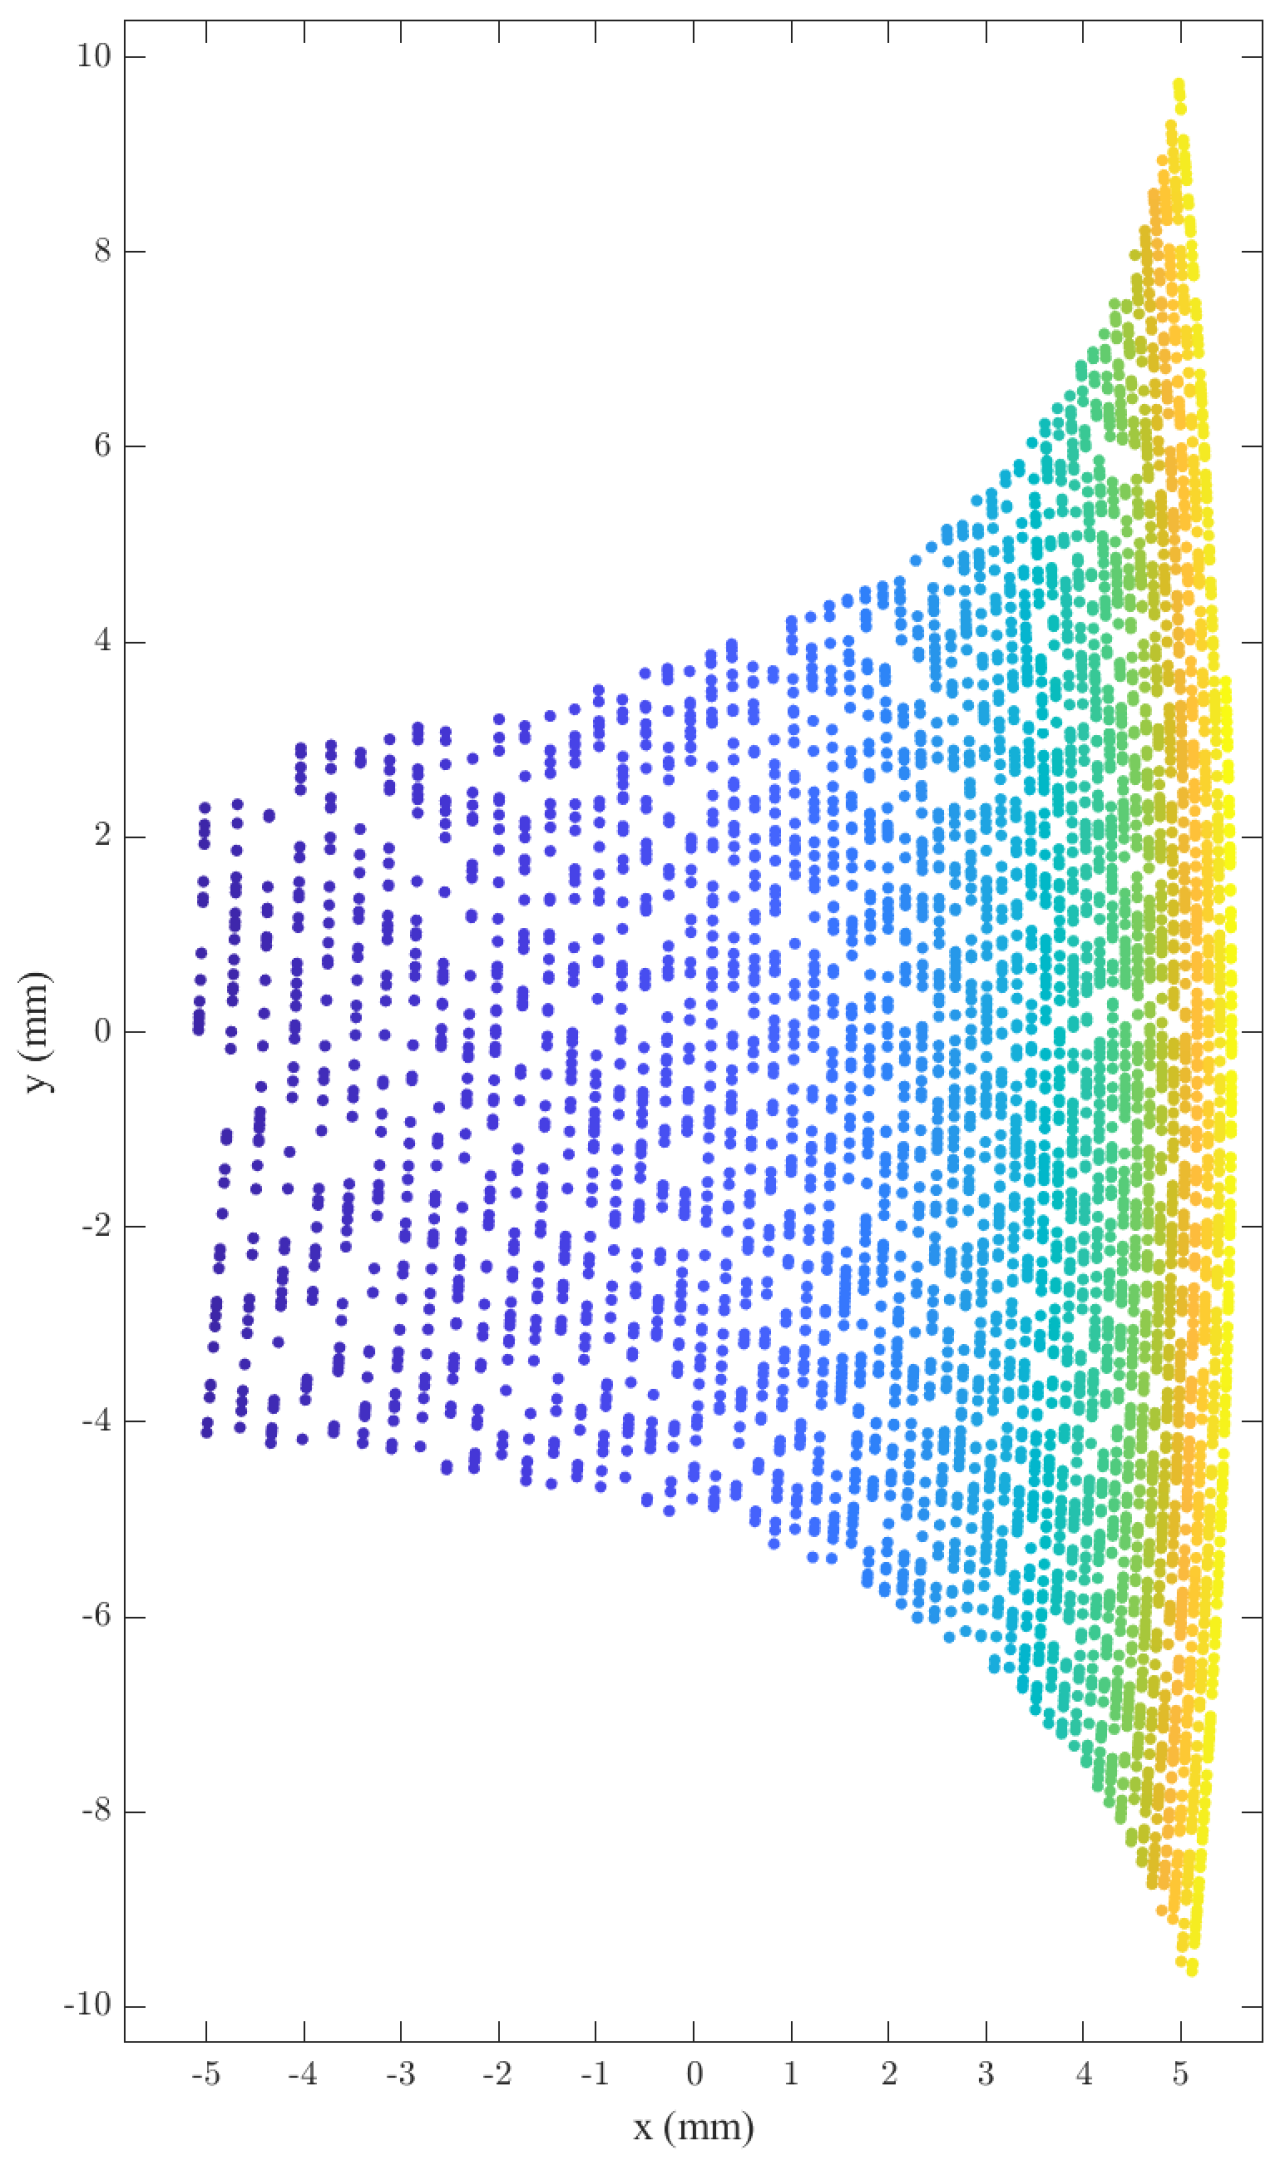
As shown in Figure 7, the RMS spot radius is smaller than the DMD pixel size across the entire spectral range, indicating well-corrected optical aberrations. Ray tracing different wavelengths maps their spatial positions, constructing the 2D spectrum for 270–800 nm (Figure 8) to analyze spatial distribution and line characteristics per order. All spectral lines fall within the DMD area. The spectral lines within each order exhibit a curved shape, which is attributed to two factors: the inherent nonlinear dispersion of the prism and the conical diffraction effect introduced by the small offset angle of the echelle grating. This curvature is a characteristic feature of cross-dispersed echelle spectrometers and must be accounted for in wavelength calibration. Prism dispersion is stronger at shorter wavelengths. The separation is assessed based on the long-wave interval: the spot centers for order 28 ( and order 29 ( are approximately 9 pixels apart, confirming effective order separation across the spectral band.
Figure 7.
Spot diagram on the DMD target surface. The scale bar labeled “100.00” corresponds to 100 μm, providing a reference for the spot size relative to the DMD pixel dimensions.
Figure 8.
Theoretical two-dimensional spectrum on the DMD target surface. Different colors represent different diffraction orders.
3.2. Design with PMT and DMD
The DMD modulates light but cannot detect it. A highly sensitive PMT is used for detection. The DMD (invented by Hornbeck at TI in 1987) contains millions of micromirrors in a rectangular array, each rotatable ±12° around its diagonal for selective reflection. The PMT is a high-sensitivity vacuum detector with excellent response from UV to NIR, suitable for weak light detection.
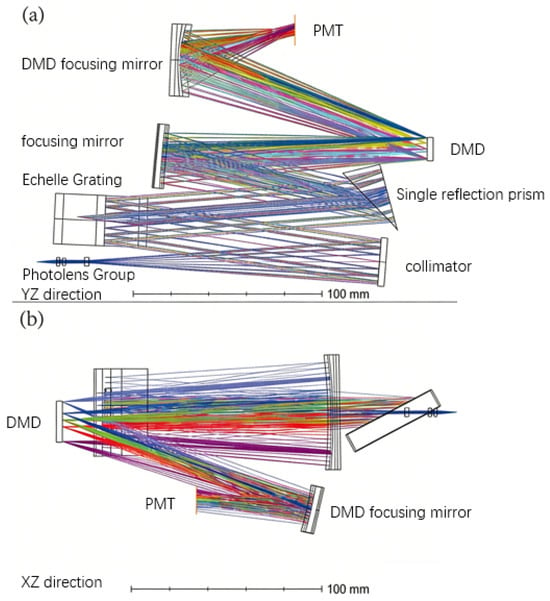
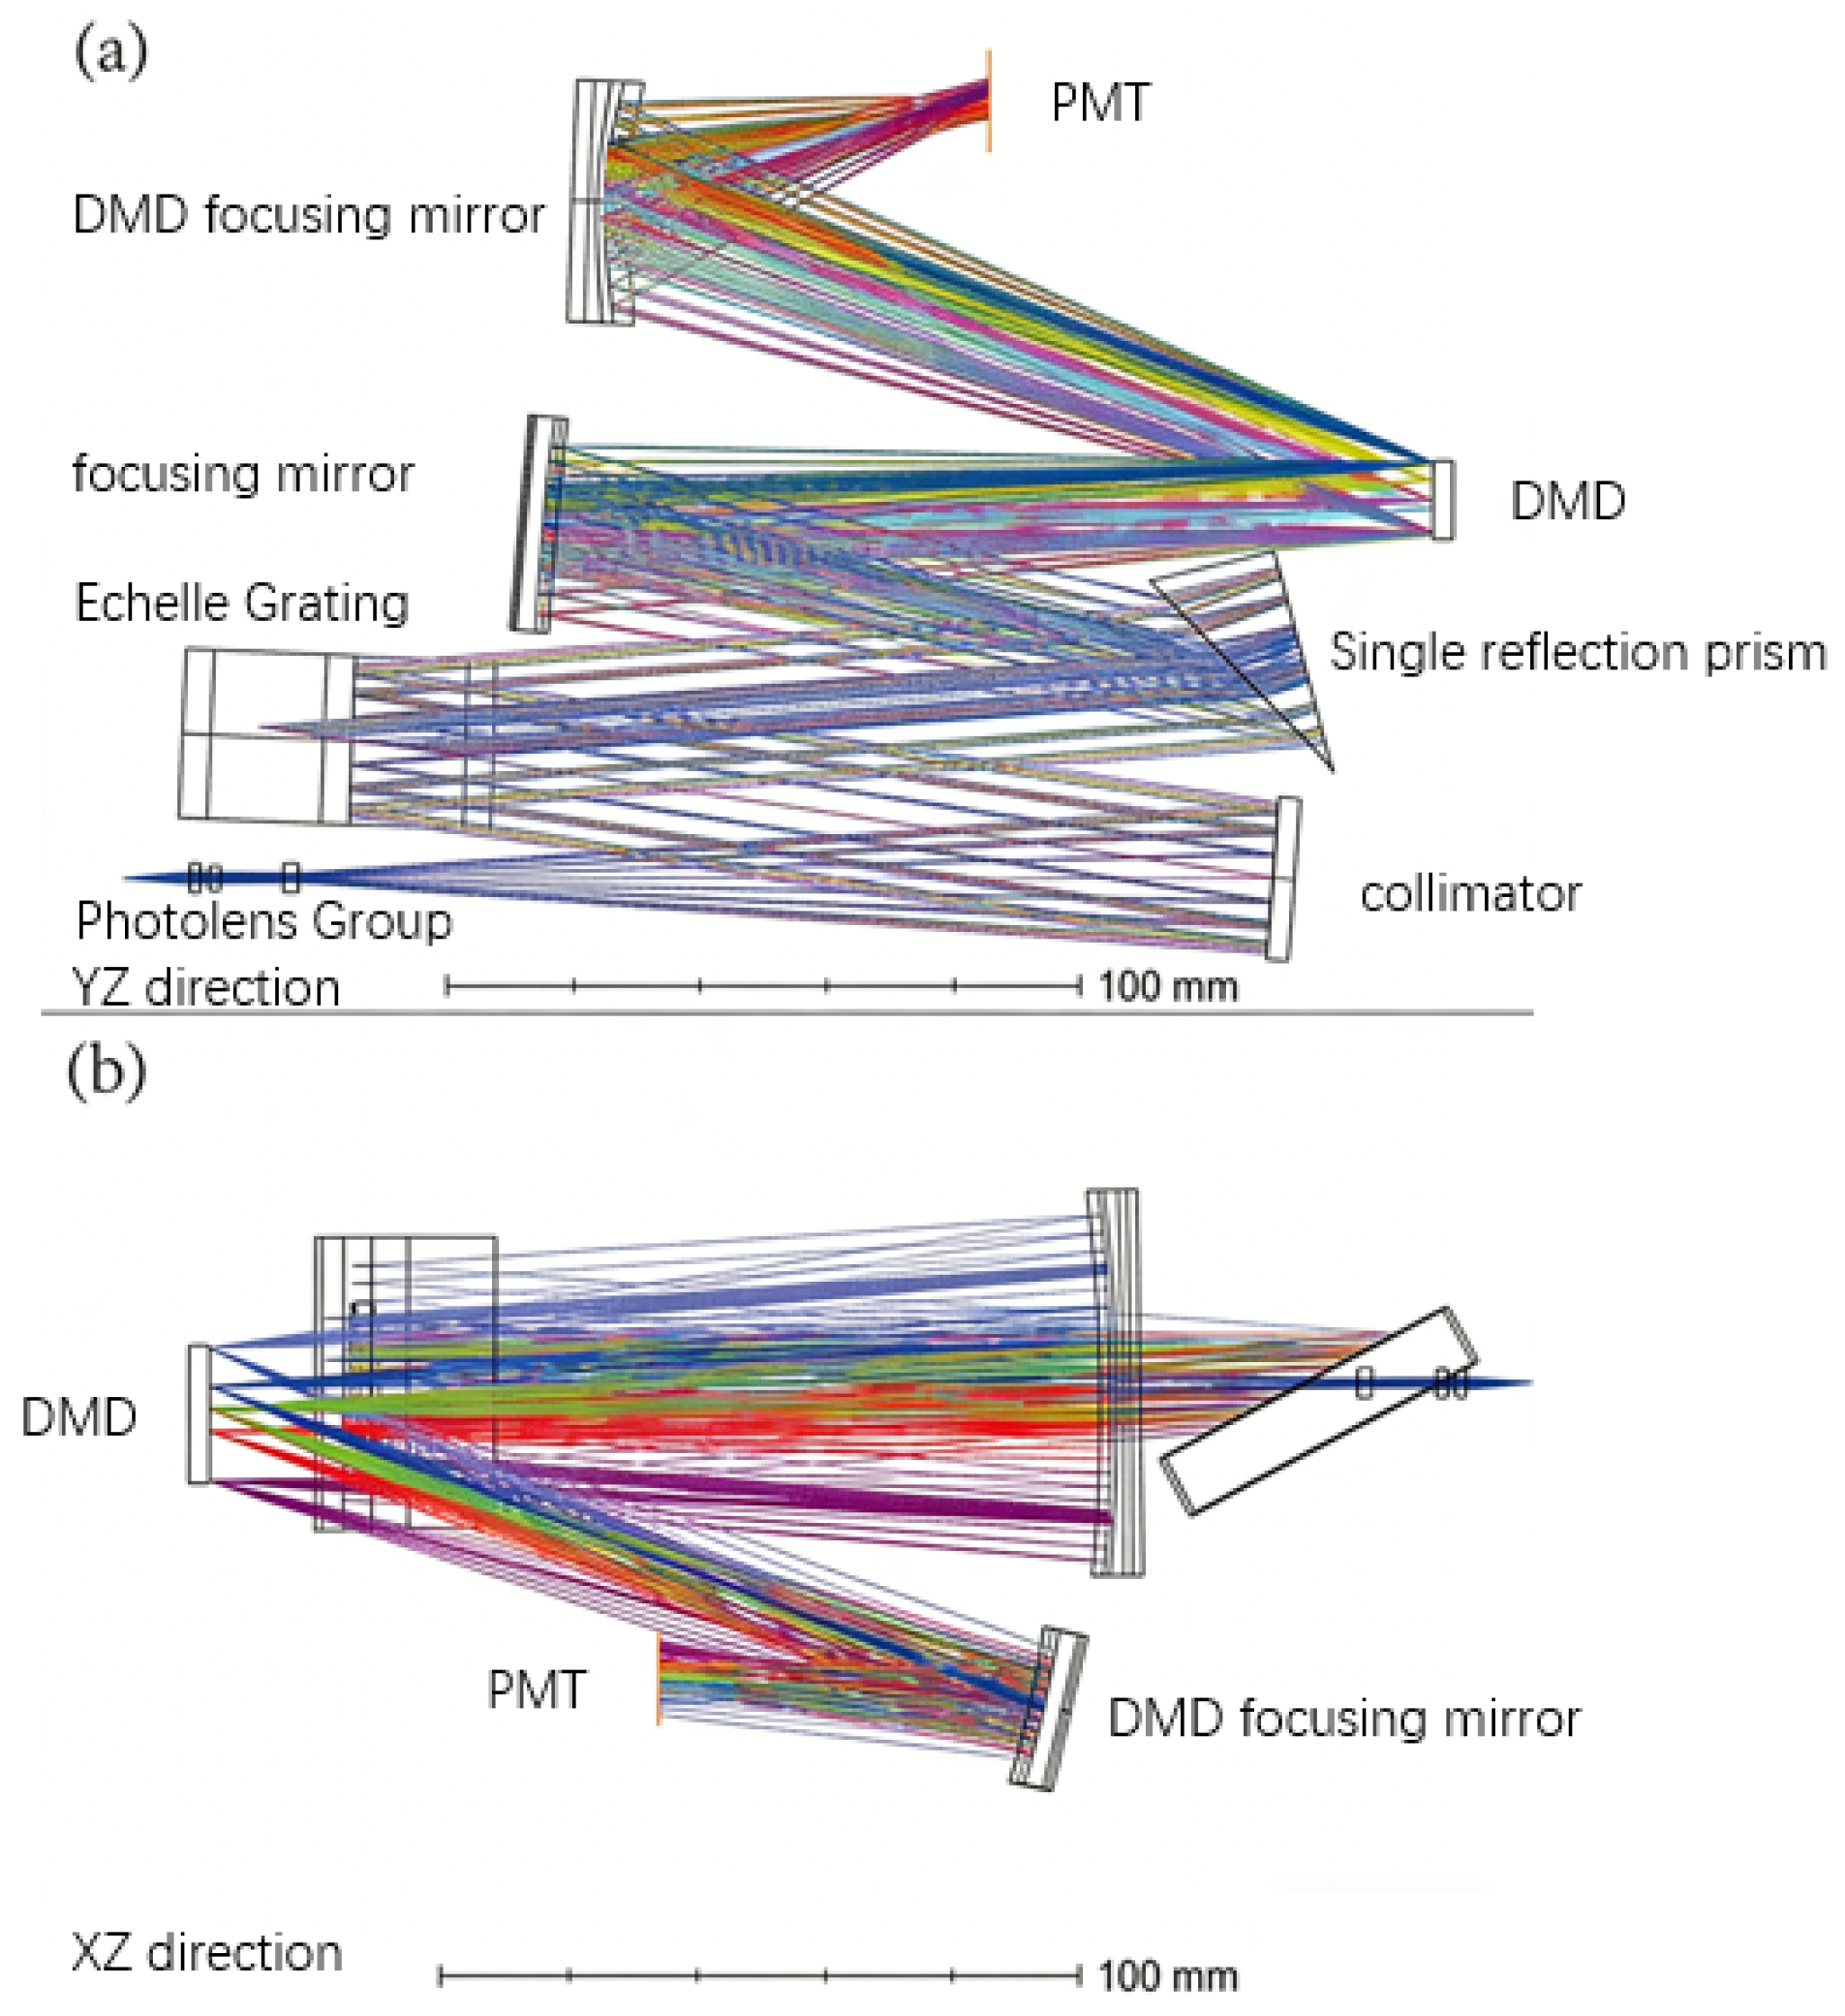
The DMD was installed upright (not rotated 45°) to maximize use of its surface, making both DMD and PMT off-axis in X and Y, increasing design complexity. A large PMT (Hamamatsu H7827, Ø15 mm active area) and a spherical focusing mirror couple light from the DMD to the PMT efficiently (Figure 9). Although smaller PMTs typically offer lower dark noise, a larger active area simplifies the optical coupling from the DMD by relaxing alignment tolerances. The DMD output beam can have a certain divergence and positional uncertainty; a 15 mm diameter PMT ensures that all spectrally selected beams are captured without significant vignetting, which is critical for maintaining system throughput and measurement stability. Therefore, the Hamamatsu H7827 PMT with a 15 mm active area was selected as a practical compromise between collection efficiency and noise performance.
Figure 9.
Optical schematic of the DMD + PMT echelle spectrometer; (a) Y–Z view, (b) X–Z view. Different colors are used to better distinguish different optical configurations (Y–Z view and X–Z view) and to visually separate the ray traces corresponding to different diffraction orders and wavelengths.
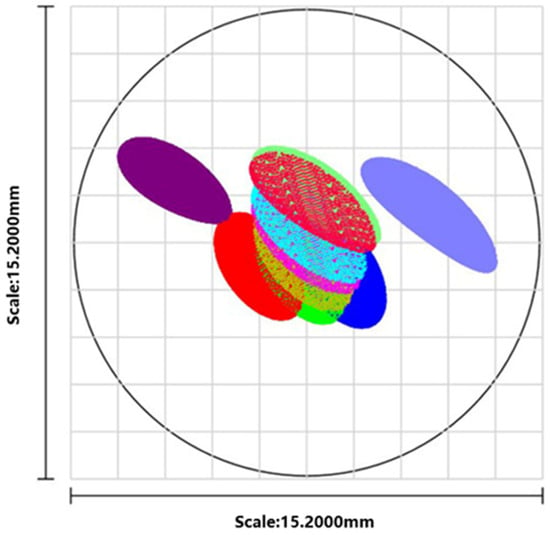
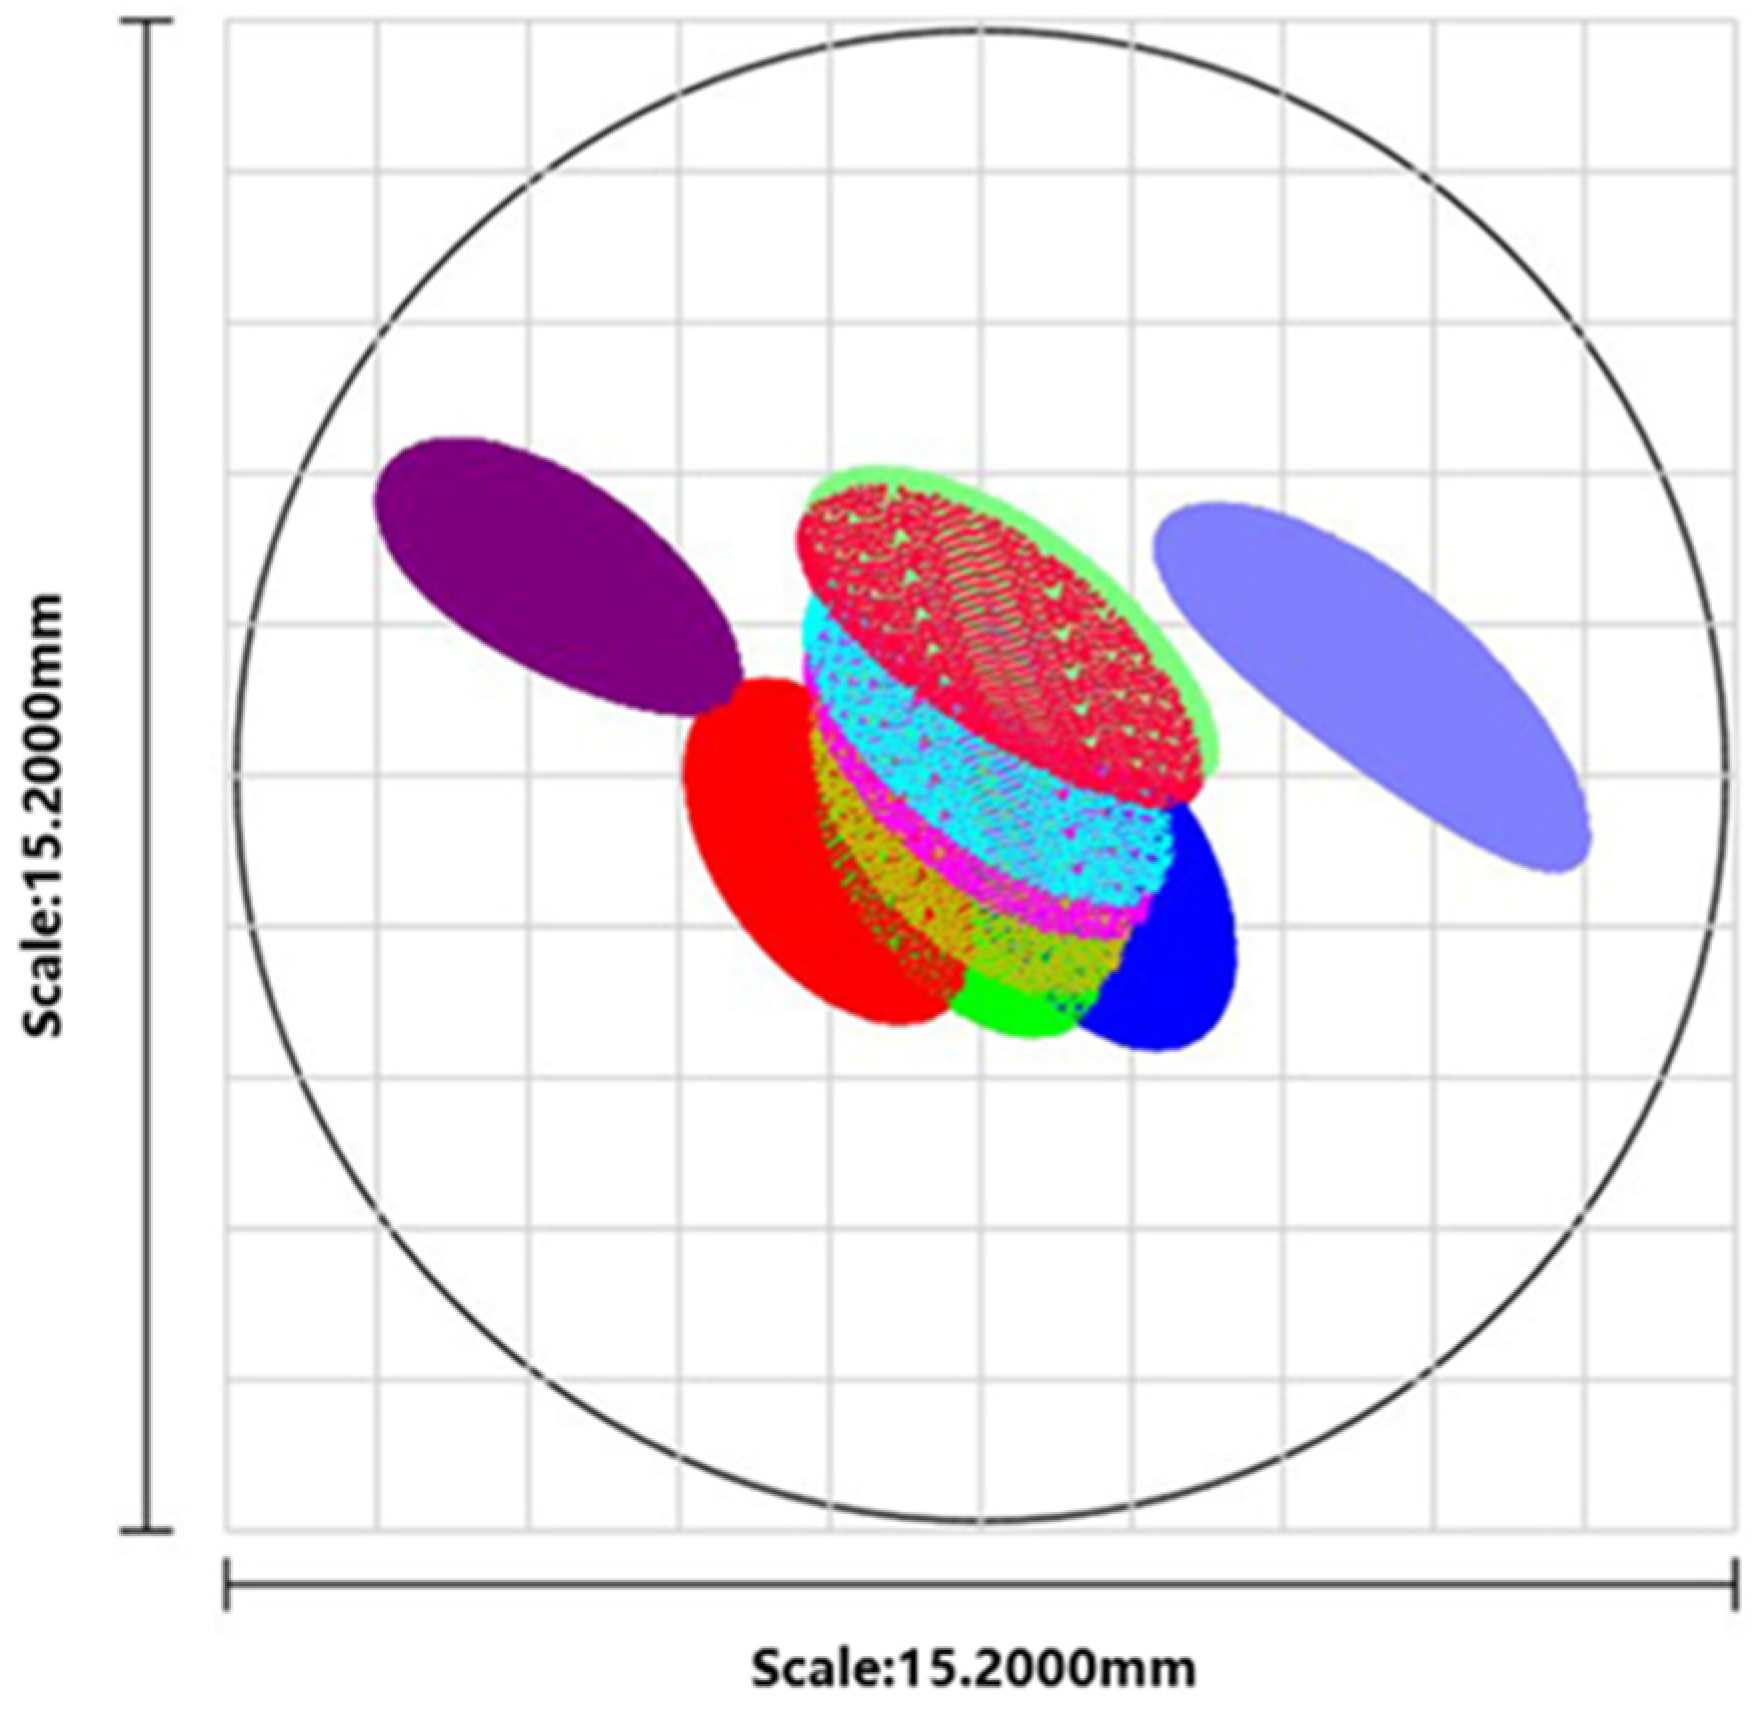
Ray tracing for nine wavelengths (center, upper, lower limits of the max, center, and min orders) confirmed spots fall within the PMT area and are smaller than its diameter (Figure 10), ensuring all signals are received. It is important to note that the PMT itself is not wavelength-selective; it responds to all light incident on its active area. Therefore, to obtain a complete spectrum, the DMD must be programmed to sequentially direct light corresponding to different wavelengths or diffraction orders onto the PMT. This is achieved by controlling the ±12° tilt states of individual micromirrors: mirrors in the +12° state reflect their assigned wavelength toward the focusing mirror and PMT, while mirrors in the −12° state direct light to an optical trap to reduce system stray light.
Figure 10.
Full-wavelength ray traces on the PMT target surface. The colors of the ray traces correspond to those used in Figure 9.
By scanning the DMD pattern—either point by point, line by line, or zone by zone—and synchronizing the mirror switching with the PMT readout, a time-series signal is generated. This signal can then be reconstructed into a complete two-dimensional spectral map, with each time point corresponding to a specific wavelength or order.
This configuration effectively turns the DMD + PMT combination into an electrically tunable bandpass filter, offering flexibility for spectral selection.
3.3. Prototype Build
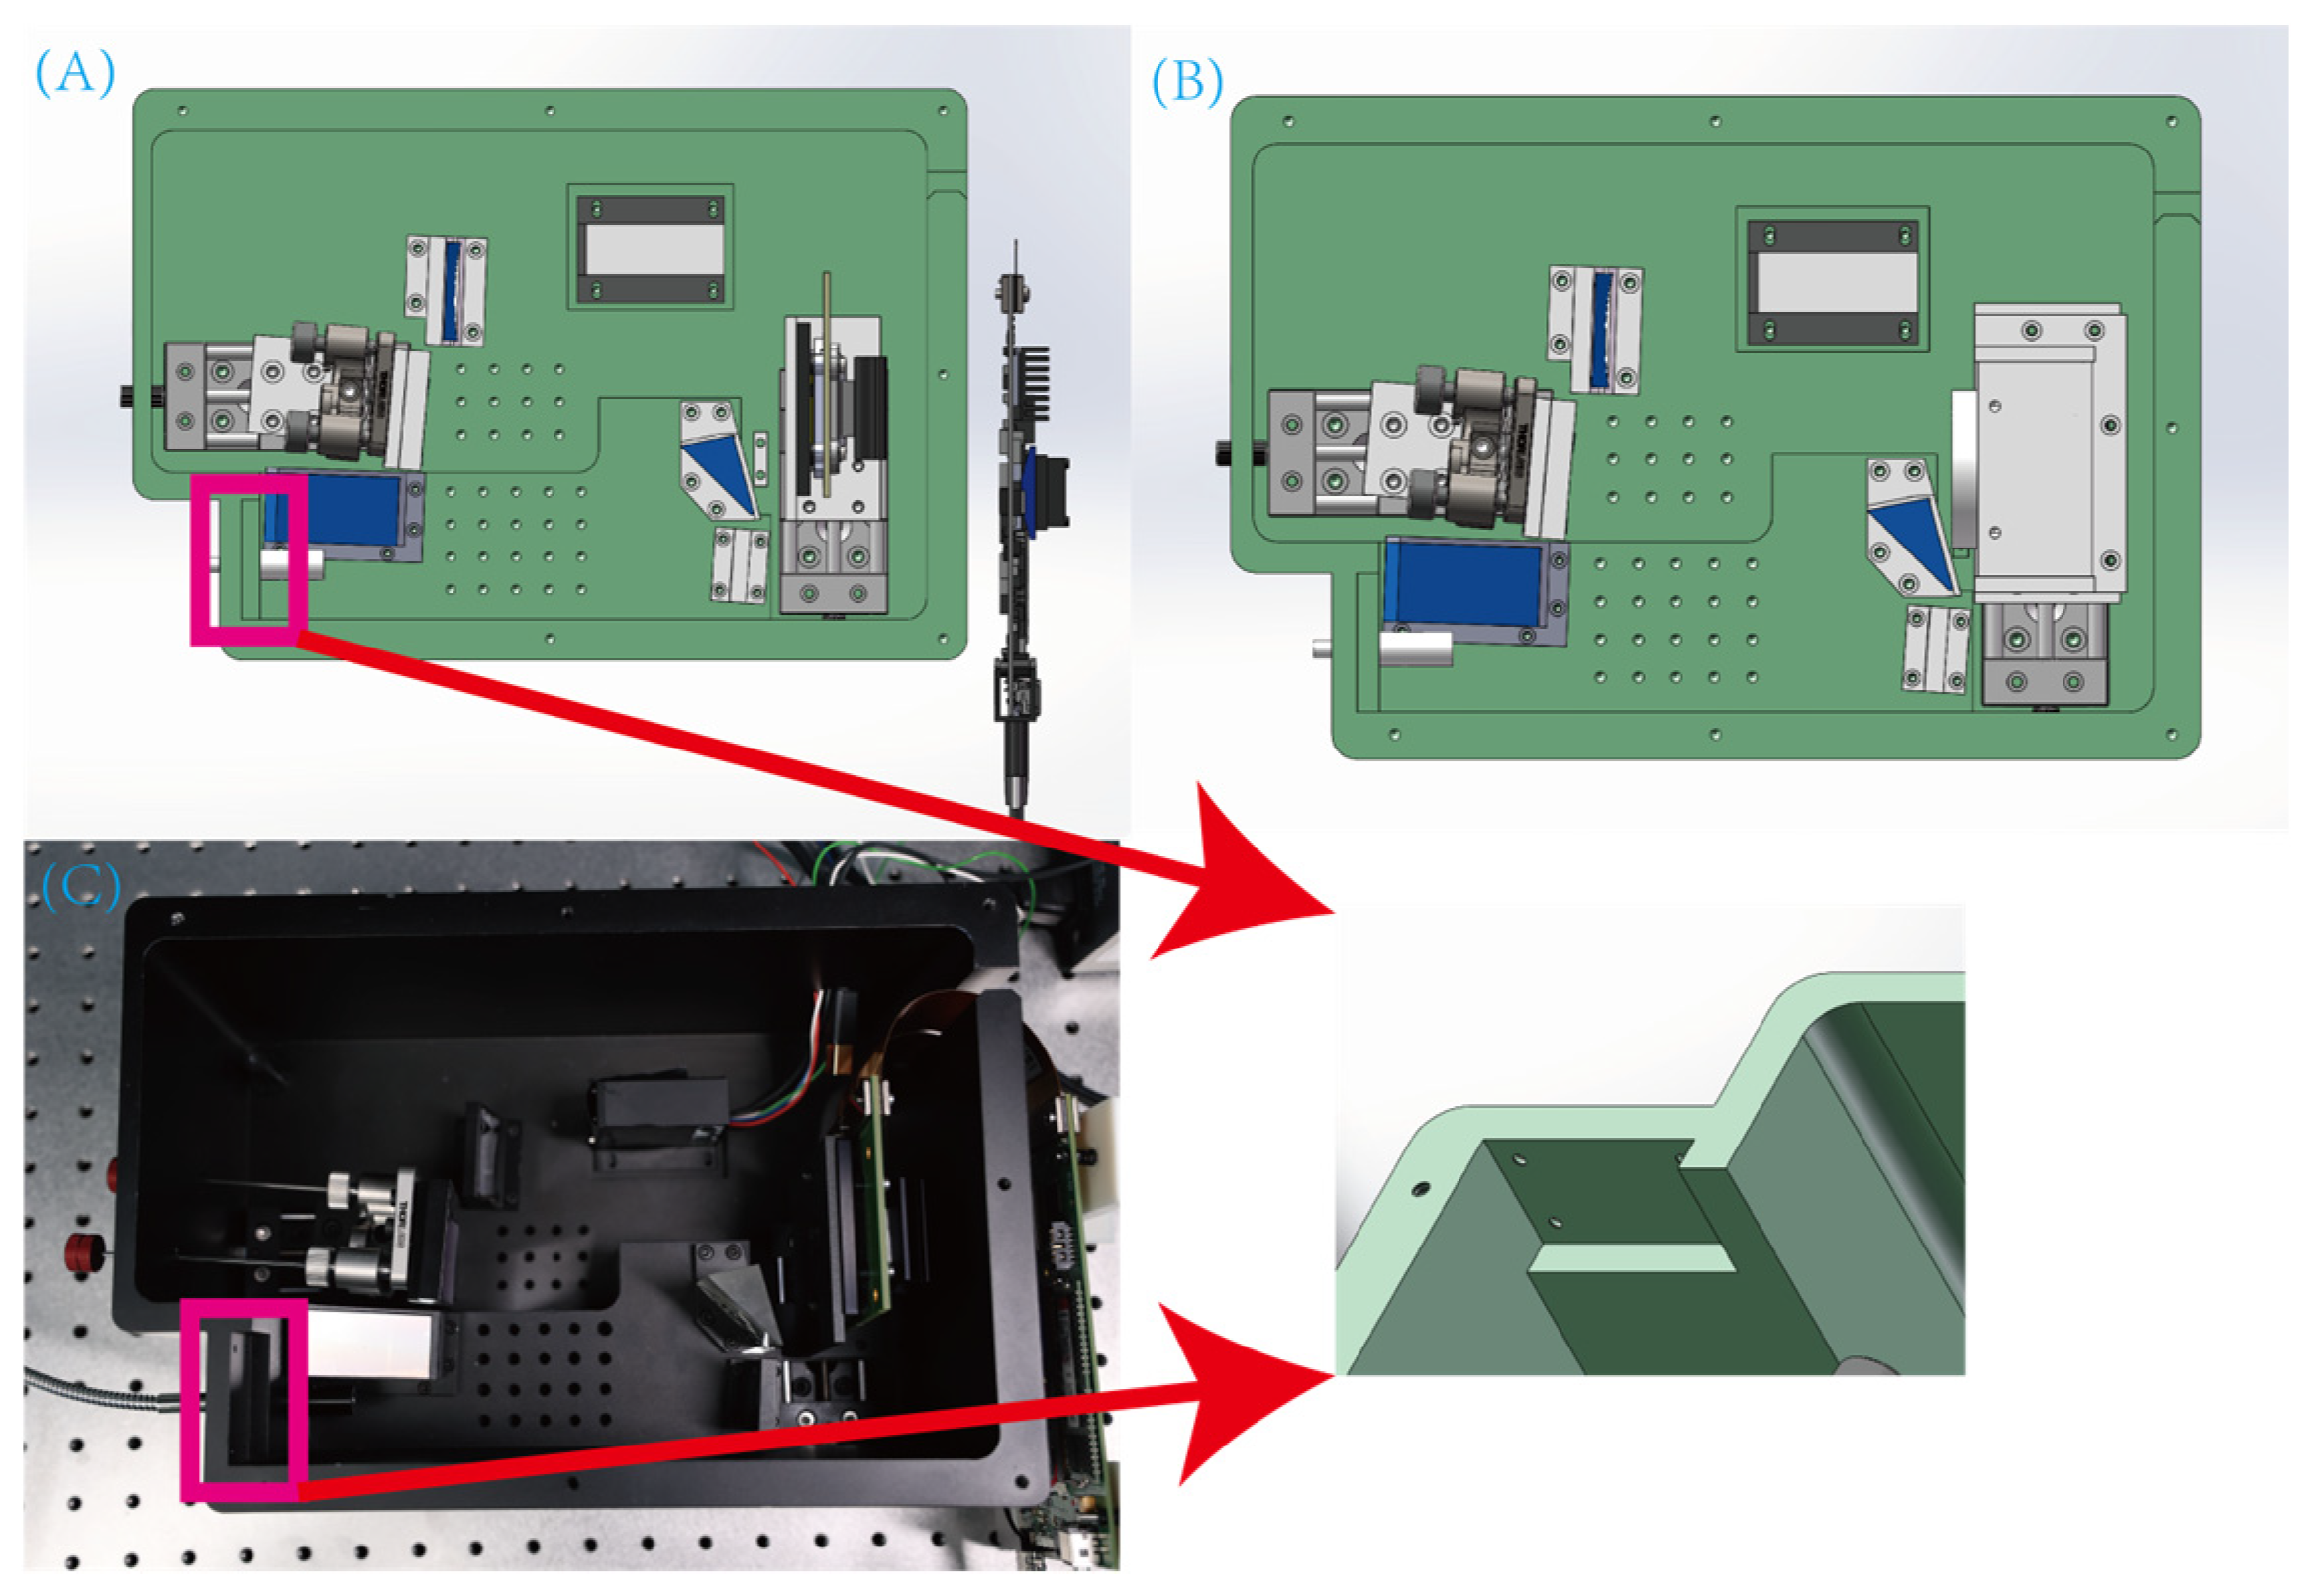
Mechanical design followed the optical design. Initially, a CCD was installed at the DMD position for spectral alignment and debugging, later replaced by the DMD + PMT assembly for measurement.
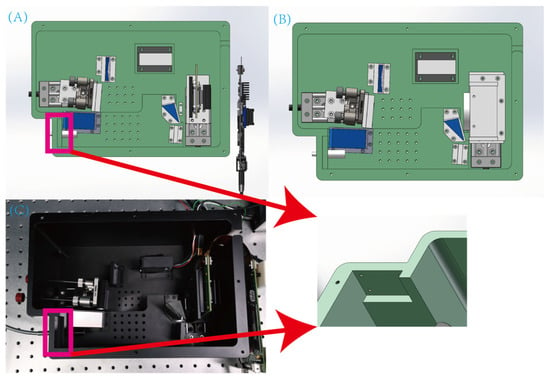
The DMD’s ±12° states cause stray light. The PMT’s high sensitivity demands stringent stray light control. Mechanical design included simulation analysis for the −12° state, providing a structural gap at the stray light focus for an optical trap (Figure 11).
Figure 11.
Mechanical structure of the spectrometer; (A) DMD + PMT assembly design with a structural gap reserved at the stray light focus for an optical trap (indicated by the arrow), (B) CCD assembly design and (C) photograph of the assembled prototype.
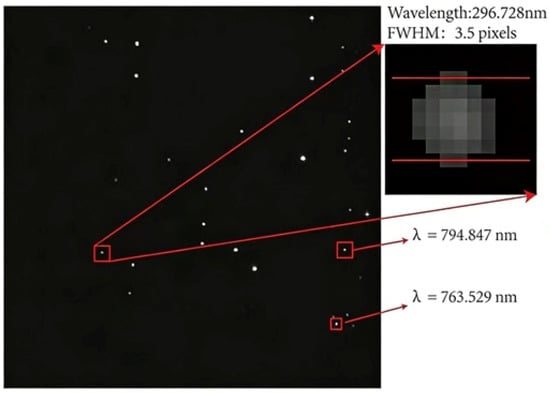
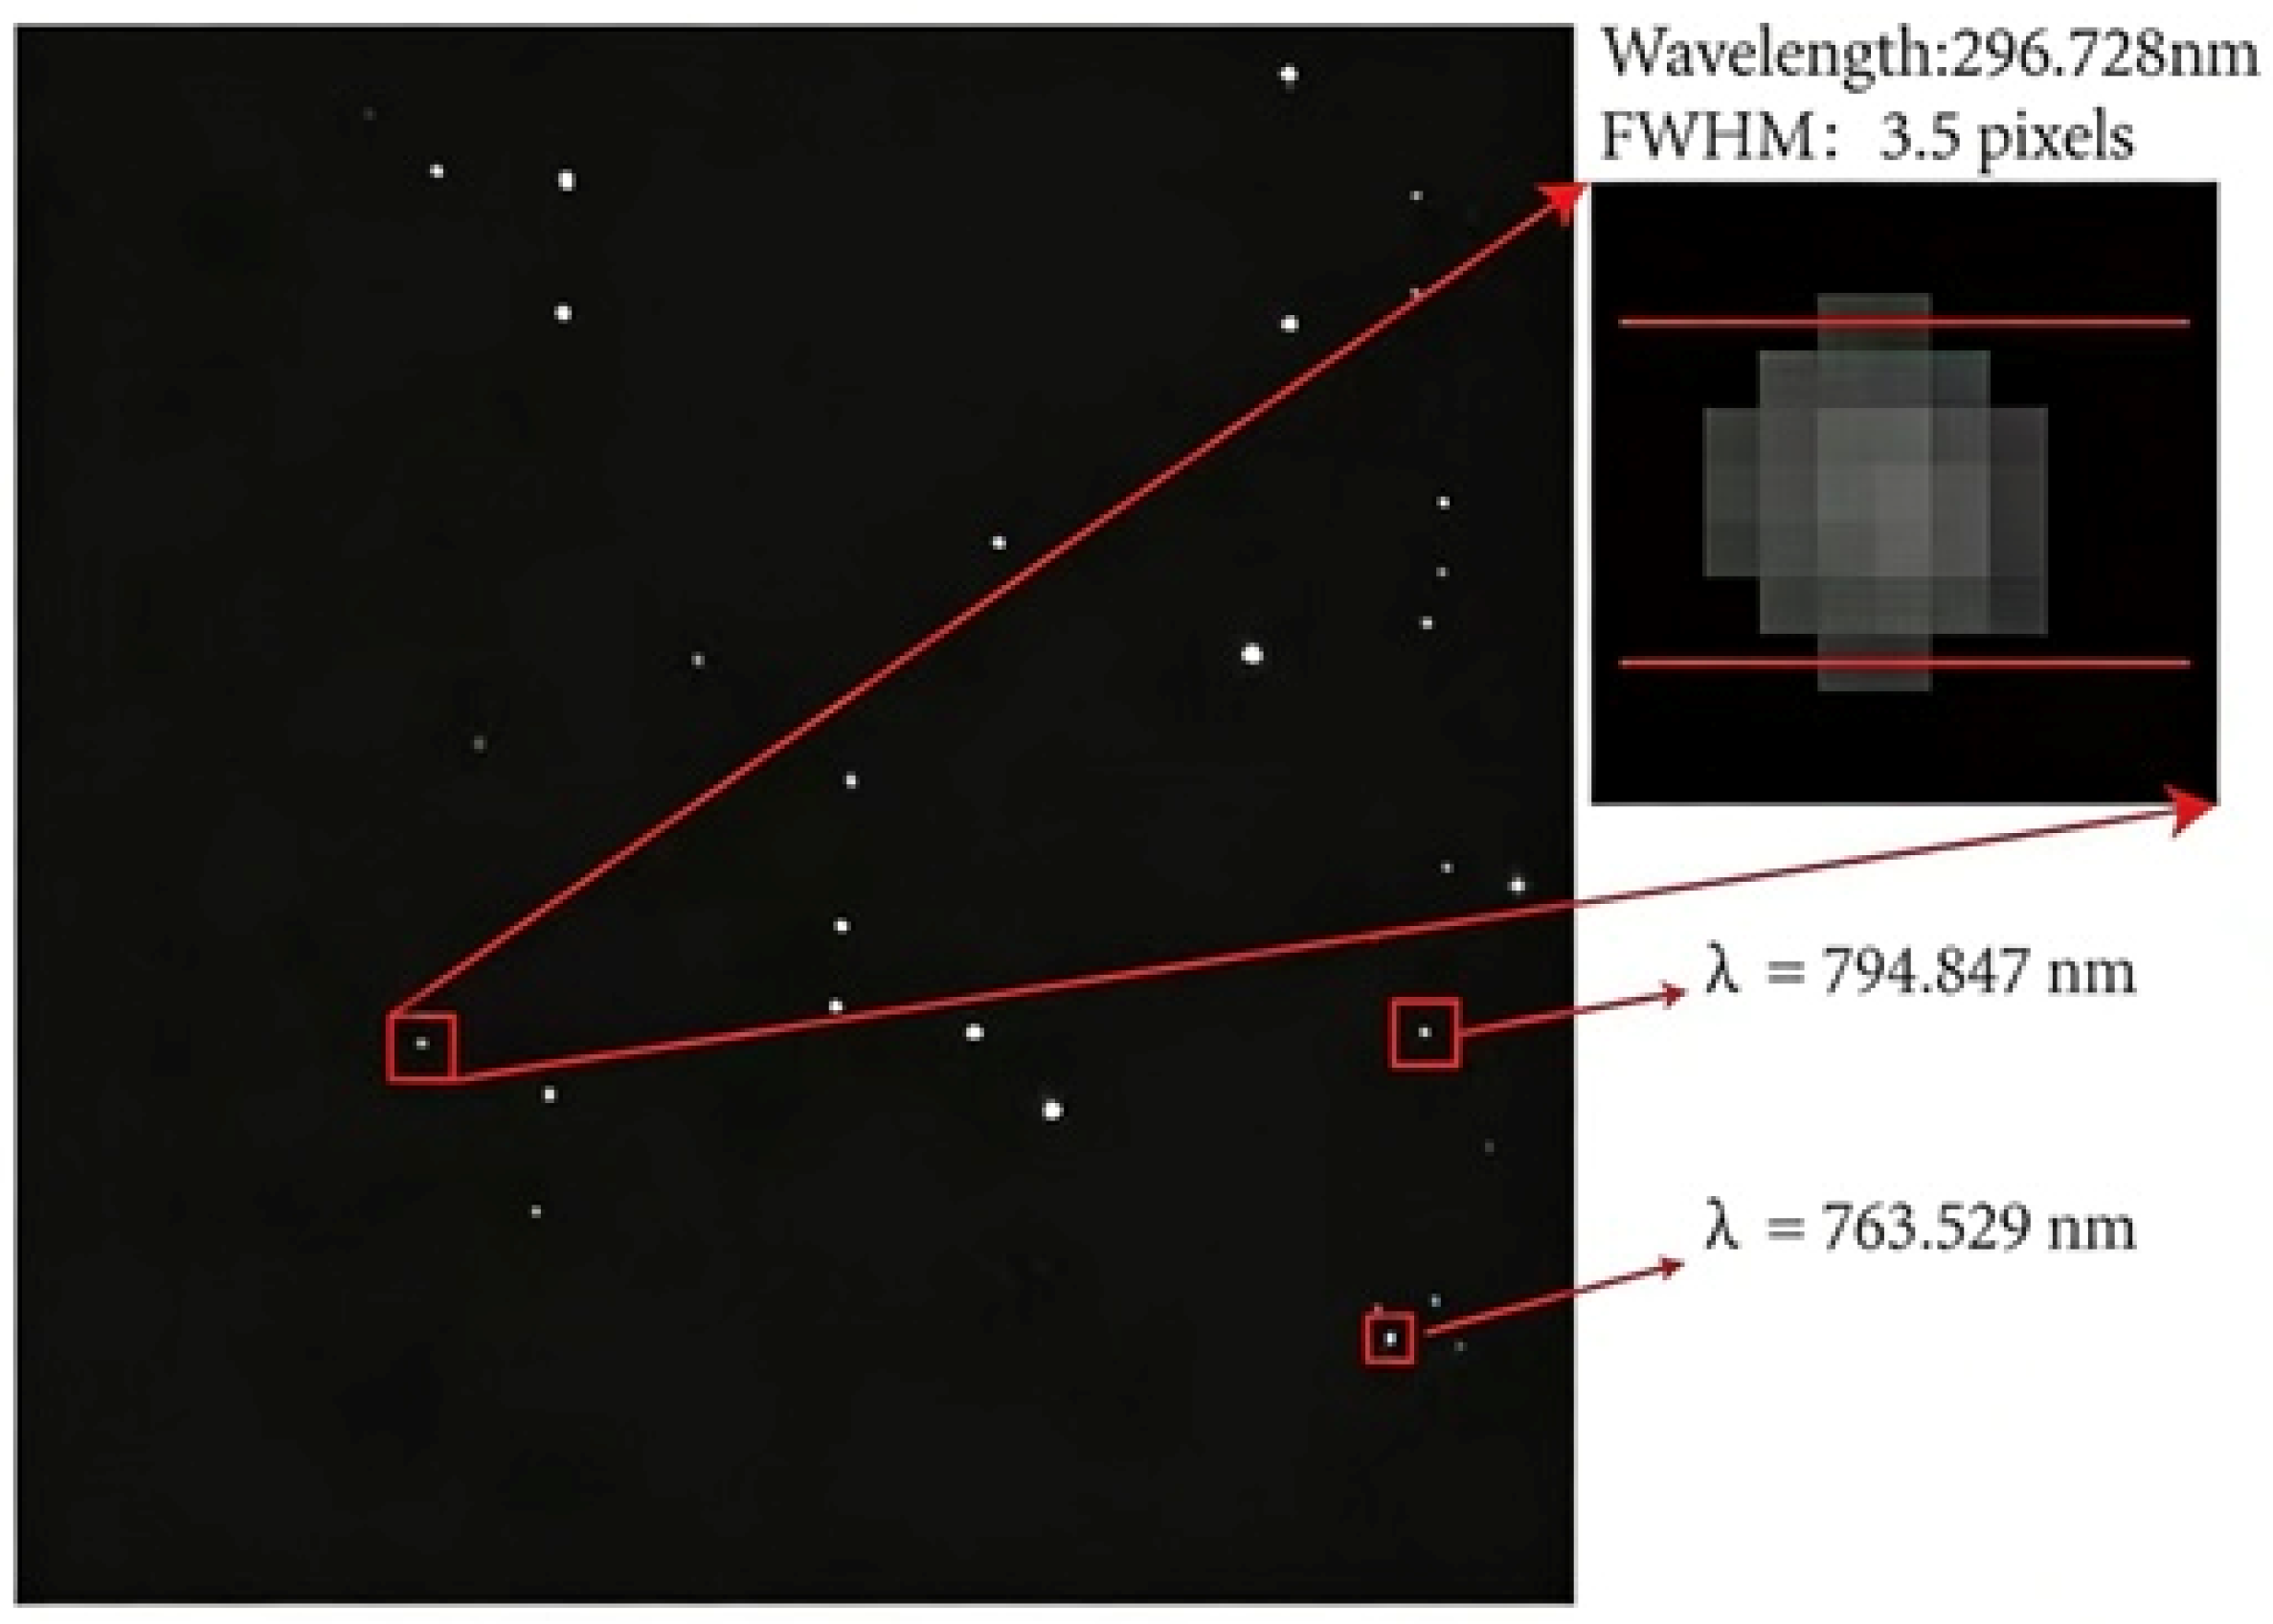
Performance testing with the CCD showed an actual range of ~268.5 to 823.2 nm, meeting specs. Mercury lamp tests at 296.728 nm showed a full width at half maximum (FWHM) of ~3.5 pixels (Figure 12). Based on the simulated central wavelength spacing, the spectral resolution at this wavelength is estimated to be ~40 pm.
Figure 12.
Mercury lamp test spectrum on the CCD image plane. Key emission lines at 296.728 nm, 763.529 nm, and 794.847 nm are visible. The 296.728 nm line has an FWHM of ~3.5 pixels, corresponding to a spectral resolution of ~40 pm.
4. Discussion
We analyzed the core optics and cross-dispersion principles of echelle spectrometers. Based on echelle grating parameters, we quantitatively studied the dispersion characteristics and structural parameters of a reflective single prism, determining the main design parameters. Cost considerations were incorporated into the design: spherical mirrors were employed for collimation and focusing to reduce manufacturing complexity and cost. Furthermore, the DMD + PMT combination replaced the area-array detector, substantially lowering costs while preserving performance. Optical simulation verified the scheme maintains high performance. Prototype tests confirmed a 270 to 800 nm range and ~40 pm resolution at 296 nm. The proposed structure facilitates high-resolution broadband spectral analysis without the need for an area-array detector, demonstrating both feasibility and practical engineering value.
Author Contributions
Conceptualization, L.Y. and Y.Z.; methodology, J.L. and Y.Z.; software, R.Z.; validation, D.L., Y.W. and R.Z.; formal analysis, J.L.; investigation, J.L., D.L. and R.Z.; resources, L.Y.; data curation, J.L.; writing—original draft preparation, J.L.; writing—review and editing, L.Y. and Y.Z.; visualization, J.L.; supervision, L.Y.; project administration, L.Y.; funding acquisition, L.Y. All authors have read and agreed to the published version of the manuscript.
Funding
This research was jointly funded by the National Natural Science Foundation of China (NSFC), grant number 62305320; and the Zhejiang University Student Science and Technology Innovation Activity Plan (Xinmiao Talent Program), grant number 2024R409A016. The APC was funded by the authors.
Data Availability Statement
The data presented in this study are available on request from the corresponding author. The data are not publicly available due to their ongoing use in further research and project collaboration.
Acknowledgments
The authors would like to extend our sincere thanks to the colleagues at the laboratory for their valuable discussions and technical assistance during the experimental phase of this work.
Conflicts of Interest
The authors declare no conflicts of interest. The funders had no role in the design of the study; in the collection, analyses, or interpretation of data; in the writing of the manuscript; or in the decision to publish the results.
Abbreviations
The following abbreviations are used in this manuscript:
| CCD | Charge-Coupled Device |
| DMD | Digital Micromirror Device |
| PMT | Photomultiplier Tube |
| UV | Ultraviolet |
References
- Abbasi, H.; Guzman, R.; Cattin, P.C.; Zam, A. All-fiber-optic LIBS system for tissue differentiation: A prospect for endoscopic smart laser osteotomy. Opt. Lasers Eng. 2022, 148, 106765. [Google Scholar] [CrossRef] [Scilit]
- Zhang, B.; Sun, C.; Yu, X.; Chen, F.; Wang, L.; Rao, Y.; Sun, T.; Zhao, Y.-Y.S.; Yu, J. Sensitive and accurate determination of nitrogen in simulated Martian soil and environment with LIBS spectrum fusion and regression based on neural network. Spectrochim. Acta B At. Spectrosc. 2023, 206, 106708. [Google Scholar] [CrossRef] [Scilit]
- Harrison, G.R. The production of diffraction gratings: II. The design of echelle gratings and spectrographs. J. Opt. Soc. Am. 1949, 39, 522–528. [Google Scholar] [CrossRef] [Scilit]
- Tousey, R.; Purcell, J.D.; Garrett, D.L. An echelle spectrograph for middle ultraviolet solar spectroscopy from rockets. Appl. Opt. 1967, 6, 365–372. [Google Scholar] [CrossRef] [Scilit] [PubMed]
- Boumans, P.W.J.M.; Vrakking, J.J.A.M. High-resolution spectroscopy using an echelle spectrometer with predisperser-II. Analytical optimization for inductively coupled plasma atomic emission spectrometry. Spectrochim. Acta B At. Spectrosc. 1984, 39, 1261–1290. [Google Scholar] [CrossRef] [Scilit]
- Boumans, P.W.J.M.; Vrakking, J.J.A.M. High-resolution spectroscopy using an echelle spectrometer with predisperser-III. A study of line wings as a major contribution to the background in line-rich spectra emitted by an inductively coupled plasma. Spectrochim. Acta B At. Spectrosc. 1984, 39, 1291–1305. [Google Scholar] [CrossRef] [Scilit]
- Boumans, P.W.J.M.; Vrakking, J.J.A.M. High-resolution spectroscopy using an echelle spectrometer with predisperser—I. Characteristics of the instrument and approach for measuring physical line widths in an inductively coupled plasma. Spectrochim. Acta B At. Spectrosc. 1984, 39, 1239–1260. [Google Scholar] [CrossRef] [Scilit]
- Torr, M.R.; Torr, D.G. Imaging spectrometer for high resolution measurements of stratospheric trace constituents in the ultraviolet. Appl. Opt. 1988, 27, 619–626. [Google Scholar] [CrossRef] [Scilit] [PubMed]
- Tang, Y.; Song, N.; Bayanheshig; Cui, J.; Chen, J. Optical design of cross-dispersed echelle spectrograph. Opt. Precis. Eng. 2010, 18, 1989–1995. [Google Scholar]
- Ning, C.L.; Qi, X.D.; Chen, S.J.; Cui, J.C. Optical design and performance analysis of light and small echelle spectrograph. Spectrosc. Spect. Anal. 2012, 32, 3406–3410. [Google Scholar]
- Li, Y.; Duan, F.; Fu, X.; Huang, T. Optical design of small high resolution echelle spectrograph. Chin. J. Sens. Actuators 2017, 30, 1139–1144. [Google Scholar]
- Zhang, Y.; Duan, W.; Li, W. Design of echelle spectrometer with a three-mirror anastigmat system. J. Tianjin Univ. Sci. Technol. 2022, 55, 519–526. [Google Scholar]
- Duan, W. Research on Optical Path of Full-Spectrum High-Resolution Echelle Grating Spectrograph. Master’s Thesis, Tianjin University, Tianjin, China, 2020. [Google Scholar]
- Cao, H.; Zhao, Y.; He, M.; Wang, W.; Wang, C. Design of small-size high resolution echelle grating spectrometer with divided spectral coverage. Acta Opt. Sin. 2018, 38, 35–41. [Google Scholar] [CrossRef] [Scilit]
- Zhou, Y.; Yin, L.; Sun, Y.; Chen, J.; Xu, Y.; Han, L.; Cui, T.; Wang, L. A uniform dispersion design method for echelle spectrometer. Opt. Commun. 2025, 582, 131657. [Google Scholar] [CrossRef] [Scilit]

Disclaimer/Publisher’s Note: The statements, opinions and data contained in all publications are solely those of the individual author(s) and contributor(s) and not of MDPI and/or the editor(s). MDPI and/or the editor(s) disclaim responsibility for any injury to people or property resulting from any ideas, methods, instructions or products referred to in the content. |
© 2026 by the authors. Licensee MDPI, Basel, Switzerland. This article is an open access article distributed under the terms and conditions of the Creative Commons Attribution (CC BY) license.