


Abstract
In this work, the load-dependent indentation response of as-built Inconel 718 produced by direct laser deposition was studied, followed by local mapping around a single surface-intersecting pore. A working load of 100 mN was selected because the indentation modulus approached a depth-independent plateau and the penetration depth was substantially larger than the measured surface roughness. At this load, the reference matrix response was HIT = 2.69 ± 0.26 GPa and EIT = 160 ± 11 GPa. An equivalent contact radius ac was calculated from the projected contact area, and pore-edge distance was normalized as ξ = s/ac. For the reference response, ac ≈ 3.44 µm and the first numerically defined position at s = 20 µm corresponded to ξ ≈ 5.8. Robust regression of 56 individual measurements showed no statistically resolved dependence of EIT on ξ, whereas a small negative HIT slope was observed and interpreted cautiously because of directional variability. The analysis is restricted to this single pore and to ξ ≥ 5.8; the immediate pore-edge regime was not experimentally resolved. The contact-scale normalization provides a reproducible framework for interpreting local indentation data near a geometrical defect without treating the two-dimensional pore-area fraction as bulk porosity.
1. Introduction
Heat-resistant metallic materials used in aerospace and power-engineering applications must retain a combination of strength, thermal stability, and processability. Property modification by thermal cycling and localized thermal or cryogenic treatment remains relevant for steels [1,2,3], while current alloy development also targets high-temperature strength at extreme service temperatures [2]. Inconel 718 (IN718) is one of the most widely used nickel-based superalloys in this context, although its high strength and low thermal conductivity complicate machining and other post-processing operations [4].
Additive manufacturing (AM) expands the design space for such alloys but introduces strong spatial variability in microstructure and mechanical response. Localized indentation has been used for residual-stress assessment in engineering components [5], while mechanical characterization of AM materials covers cryogenic products [6], static and cyclic deformation of IN718 [7], microstructure and properties of selectively melted IN718 [8], fatigue anisotropy [9], and process-dependent IN718 microstructures [10]. At the same time, reliable characterization must account for manufacturing flaws [11], structural monitoring requirements [12], the limited representativeness of non-standard tensile specimens [13], strain-rate and work-hardening effects [14], and the broad scatter in reported mechanical properties of additively manufactured IN718 [15]. Related studies on laser processing [16], fatigue of additively manufactured steels [17], and IN718 produced by selective laser melting [18] further demonstrate that local mechanical response cannot be interpreted independently of manufacturing history.
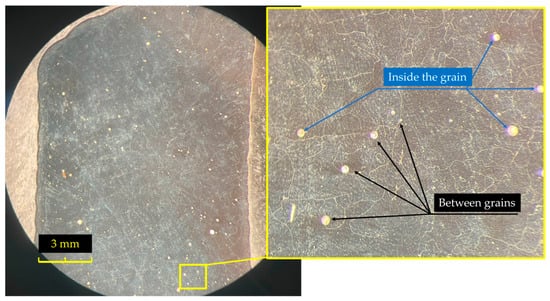
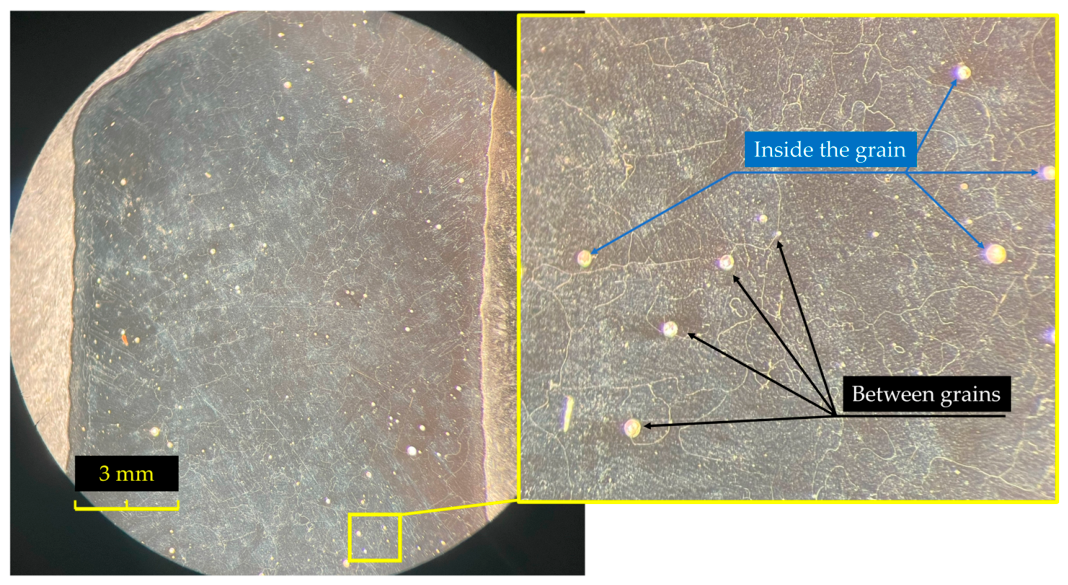
Pores are among the most important geometrical heterogeneities in additively manufactured metals. Their morphology, distribution, and formation mechanisms depend on the local thermal and material-transfer conditions during manufacturing [19,20]. Finite-element studies have shown that pore defects can perturb local thermal and stress fields in additively manufactured IN718 [21], while X-ray tomography studies emphasize that a single scalar porosity value does not fully describe defect severity [22]. The mechanical influence of an individual pore also depends on its size, shape, position, and relation to the loaded volume; embedded spherical pores, for example, alter tensile response in a geometry-dependent manner [23]. Moreover, pores can form both between the boundaries of the fused elements and within the layer [10], as shown in Figure 1.
Figure 1.
IN718 sample surface with pores at different locations.
Mechanical characterization is only one part of the broader problem of local-material-state assessment. Electrophysical surface diagnostics, including high-voltage testing of coatings and delamination [24,25] and controllable plasma-based probe approaches [26], respond to different physical observables. They are therefore complementary to, rather than substitutes for, methods that directly probe local deformation resistance.
The instrumented indentation test (IIT) is especially useful when a local response must be resolved at micro- and sub-microscales. Indentation-based approaches have been proposed for anisotropy characterization in laser powder bed fusion parts [27] and have demonstrated sensitivity to changes caused by hydrogenation [28], thermal history [29], nanoscale deformation instabilities in additively manufactured superalloys [30], and local microstructural orientation in additively manufactured stainless steel [31,32]. Dynamic and static indentation have also been used to monitor local plastic deformation [33] and to characterize porous materials [34,35].
The measured indentation response is additionally influenced by the material and process state. Atomistic simulations and experimental studies of IN718 demonstrate sensitivity to cooling history and microstructure [36,37], while studies of selectively melted structural elements [38], surface preparation [39], recycled AM powders [40,41], and grain orientation in individual powder particles [42] illustrate the multiscale nature of the problem. The Nanoscan-4D+ platform has previously been used for instrumented indentation characterization with experimental and numerical analysis [43]. Indentation-derived mechanical parameters have also been used in engineering correlations [44], whereas post-build heat treatment of IN718 significantly modifies its structure and impact response [45,46].
Indentation itself also modifies the local-material state. The imposed contact generates a localized elastoplastic deformation field and residual deformation, while the residual imprint may exhibit pile-up or sink-in. Recent experiments on Vickers hardness measurement of steel surfaces directly demonstrate pronounced pile-up around indentation-produced dimples [47]. Such effects are relevant because pile-up or sink-in changes the actual contact geometry and can bias contact-area-based mechanical parameters; this limitation is also consistent with the general Oliver–Pharr contact-area framework [48]. Consequently, the measured response reflects both the pre-existing local-material state and deformation generated by the indentation process.
Consequently, the novelty of a local indentation study cannot be based simply on applying hardness testing to an AM alloy. Within the directly relevant studies reviewed above, indentation has primarily been used to characterize hardness/modulus distributions, anisotropy, microstructural state, temperature effects, or correlations with conventional mechanical properties. The present work instead treats one isolated surface-intersecting pore as a contact-mechanics case study and parameterizes the measurement position using the dimensionless contact-scale ratio ξ = s/ac. For the investigated case, the apparent pore diameter is approximately 232 µm, whereas the equivalent contact radius at the selected working load is approximately 3.44 µm. The investigated normalized-distance interval is ξ ≈ 5.8 … 81.4. If the pore free surface measurably perturbs the indentation response over this range, a systematic change in unloading stiffness and/or hardness would be expected; conversely, the response should increasingly reflect the surrounding matrix as the distance grows.
The present work therefore has two objectives: (i) to establish a mechanically justified working load for IIT of the investigated as-built IN718 surface from the load-dependent response, surface-roughness condition, and an independent Vickers-hardness cross-check; and (ii) to determine whether the investigated surface-intersecting pore produces a resolvable local micromechanical perturbation over the experimentally sampled distance range when the pore-edge distance is normalized by the indentation contact radius. The global pore-area fraction is treated only as a descriptor of the analyzed cross-section and not as an experimental variable. The local analysis is explicitly considered a single-pore case study rather than a statistical characterization of the pore population.
2. Materials and Methods
2.1. Materials
The investigated specimen was fabricated from heat-resistant IN718 by direct laser deposition (DLD) by technology from [45]. The confirmed laser power for the investigated build was 1200 W. The material was tested in the as-built condition, without post-build heat treatment. Because manufacturing parameters were not varied in the present study, the deposition route is treated as a fixed manufacturing history rather than as an independent factor in the analysis.
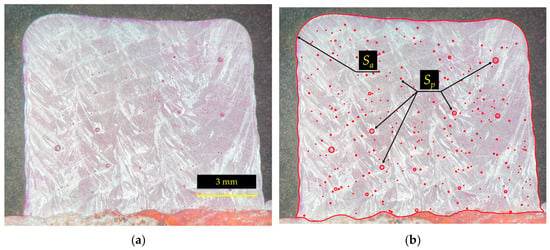
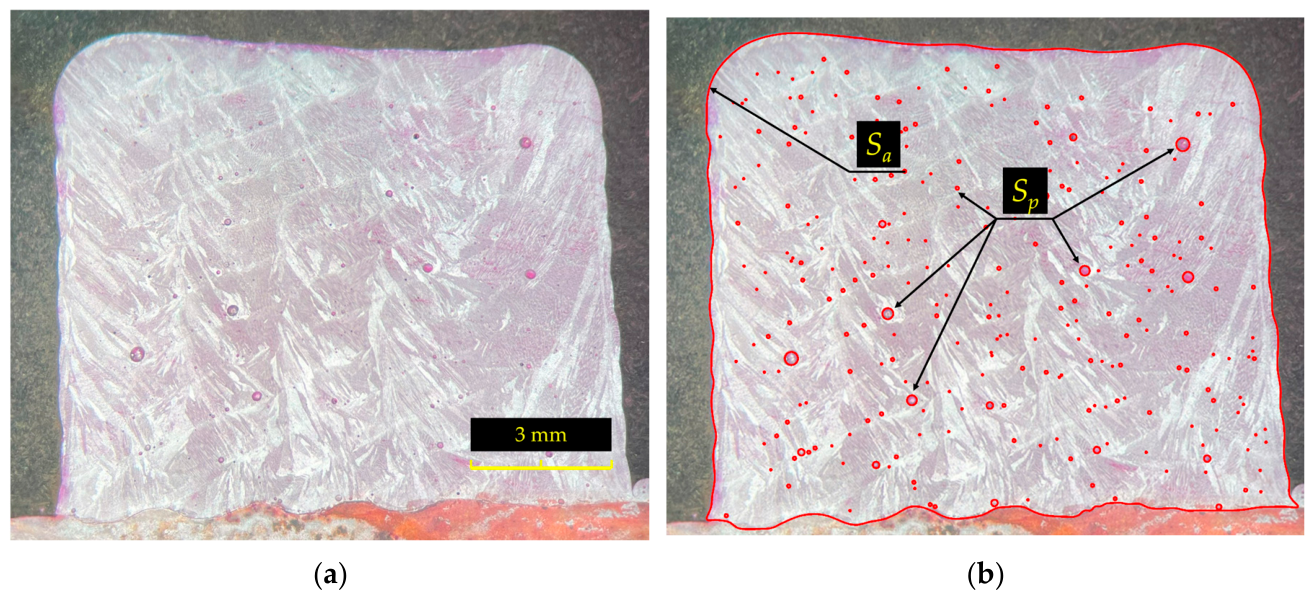
A metallographic cross-section was used for optical evaluation of pores (Figure 2). The analyzed surface area Sa and the areas occupied by surface-intersecting pore sections Sp were segmented from the optical image. The reported pore fraction is therefore a two-dimensional area fraction on the analyzed cross-section, PA, and must not be interpreted as a directly measured volume porosity of the bulk material. It was calculated as
where Sa is the total analyzed cross-sectional area, Sp,i is the segmented area of the i-th pore section, and Np is the number of segmented pore sections.
Figure 2.
Sample surface with pores: (a) after etching; (b) image segmentation used to determine the two-dimensional pore-area fraction.
For the analyzed cross-section, PA = 0.795%. This value is used only to describe the specimen state. The distribution of pores was non-uniform and the optical result is inherently dependent on the selected cross-section. The individual pore investigated in detail later in the study was exposed by the polished cross-section and had an apparent diameter of approximately 232 µm. Its formation mechanism was not independently identified; accordingly, it is treated here as a geometrical surface-intersecting void, without attributing it to a specific gas, keyhole, lack-of-fusion, or shrinkage mechanism. The pore was selected because its boundary was clearly resolved, sufficient surrounding material was available for measurements in four directions, and no other visually identifiable pores were located in its immediate vicinity. The latter criterion reduced the probability that an indentation intended to characterize the selected pore would simultaneously interact with a neighboring surface defect. The selected pore is not assumed to be statistically representative of the overall pore population.
2.2. Methods
Vickers hardness was used as an independent reference for the deformation resistance of the investigated surface. Measurements were performed with a PMT-3M hardness tester at HV0.2 (0.2 kgf, 1.962 N). Five measurements were used to calculate the mean value and standard deviation (SD). The Vickers result is used below only as an approximate independent scale cross-check and not as a direct validation of HIT.
The indentation hardness HIT and indentation modulus EIT were evaluated using the Oliver–Pharr framework [48]. Comparable local nanomechanical characterization has also been applied to additively manufactured alloys produced by directed-energy deposition routes [49]. The indentation hardness is defined by the maximum applied load Pmax and the projected contact area Ap:
The reduced modulus Er was obtained from the contact stiffness S, defined from the initial unloading slope and the projected contact area. For a non-axisymmetric indenter, β represents the geometry correction factor:
The specimen indentation modulus EIT was then calculated from the reduced modulus considering the elastic properties of the diamond indenter:
For an ideal Berkovich tip, Ap = 24.5 × hᴄ2, where hc is the contact depth. In the present measurements, however, a calibrated projected-area function obtained on fused quartz was used rather than assuming the ideal geometry over the full depth range. The calibration software represented the depth-dependent area function in the standard form Ap(hc)= C0hc2 + C1hc + C2hc(1/2) + … and applied the calibrated function at each contact depth. The Berkovich geometry correction factor was β = 1.034. The elastic modulus and Poisson ratio of the diamond indenter were Ei = 1170 GPa and νi = 0.07, respectively; the specimen Poisson ratio was taken as νs = 0.30, a conventional value for metallic IN718 in the present modulus evaluation. The procedures were performed within the framework of ISO 14577-1 [50].
Instrumented indentation was performed with the mechanical-testing module of a Nanoscan-4D+ scanning nanohardness tester (FSBI TISNCM, Moscow, Russia), a platform previously used for instrumented indentation measurements [43]. A diamond Berkovich indenter was used. Surface roughness was measured with a Hommel Tester T1000 (manufacturer JENOPTIK (Hommel-Etamic, Villingen-Schwenningen, Germany) profilometer at three randomly selected locations on the polished specimen surface; an evaluation length of 4 mm was used for each profile. The characteristic arithmetic mean roughness was Ra = 0.014 µm. Each indentation used a 5 s loading segment, a 1 s hold at Pmax, and a 5 s unloading segment. Contact stiffness was determined from a fit to the unloading portion between approximately 95% and 20% of Pmax. Instrument compliance and thermal-drift effects were treated using the standard calibration and correction procedures of the instrument evaluation workflow; no additional user-defined post-processing correction was introduced.
Residual-indent topography suitable for quantitative pile-up/sink-in correction was not available from the experimental dataset. Consequently, no independent topography-based correction of Ap was performed, and this is considered a limitation of the Oliver–Pharr evaluation. Data were not rejected on the basis of the resulting HIT or EIT magnitude. No additional manual post hoc rejection was applied by the authors after successful processing of the load–displacement curves by the instrument workflow. In the pore-proximity dataset, the low Line 4 value at s = 160 µm was therefore retained in the primary statistical analysis and treated separately only in the sensitivity analysis.
2.3. Experimental Sequence and Normalized Pore Distance
The experimental program comprised three stages. First, a load-dependent series was performed over Pmax = 1 … 400 mN to identify the range in which the calculated properties became sufficiently stable relative to indentation depth. All load levels used the same 5 s loading, 1 s hold, and 5 s unloading schedule. With a linear 5 s loading ramp, the absolute nominal loading rate Pmax/5 ranged from 0.2 to 80 mN/s. Second, a constant-load reference map was acquired at the selected working load using a 20 × 18 measurement grid (360 indentations) within the approximately 200 × 180 µm mapping region; the nominal measurement pitch was about 10 µm. Third, the same working load was used along four lines extending away from the selected pore, with a nominal 20 µm spacing between consecutive points.
The four directions were selected with respect to the additive-manufacturing orientation. Directions 1 and 2 were approximately parallel to the deposited layer and were measured in opposite senses. Directions 3 and 4 were approximately aligned with the build direction; Direction 4 followed the positive build direction, whereas Direction 3 was oriented oppositely. Identical instrumental conditions were maintained for all four lines: Pmax = 100 mN, 5 s loading, 1 s hold, 5 s unloading, the same Berkovich indenter, the same polished surface condition, and the same nominal point spacing.
To compare the pore-edge distance with the mechanical length scale of indentation, an equivalent circular contact radius ac was introduced from the calibrated projected contact area:
The pore-edge distance s was then normalized as
The normalized parameter ξ is used only as a reproducible contact-scale ratio. It does not imply that the complete elastoplastic interaction zone is circular or limited to ac, and ac is not interpreted as a plastic-zone radius. A quantitative plastic-zone dimension was not assigned because such an estimate would require a constitutive model calibrated for the local AM IN718 state together with assumptions regarding strain hardening, residual stress, anisotropy, and the three-dimensional pore geometry. Such an experimental–numerical determination is outside the scope of the present single-pore study and is identified as a subject for future work. The first measurement row in the original pore-line dataset did not contain a numerical pore-edge distance and was therefore excluded from ξ-based calculations.
2.4. Statistical Analysis
Direction-averaged pore-proximity values are reported as mean ± SD for visualization. Because the four measurement directions showed substantial variability, the primary distance-dependent analysis was additionally performed using all 56 individual measurements corresponding to the 14 numerically defined pore-edge distances. Robust linear regression with Tukey bisquare weighting was used, with measurement direction included as a categorical factor. Regression coefficients are reported with 95% confidence intervals, and statistical significance was assessed at α = 0.05. Influential observations were evaluated using externally studentized residuals and Cook’s distance; |ri| > 3 and Di > 4/N were used as influence flags (N is the total number of observations included in a particular statistical analysis). Flagged observations were not automatically removed from the primary robust regression. The direction-averaged least-squares fits, including the sensitivity analysis excluding the Line 4 measurement at s = 160 µm, are retained in figures to visualize the influence of this observation.
3. Results and Discussion
3.1. Vickers Hardness
The Vickers hardness of the as-built specimen was HV0.2 = 256 with SD = 17 (6.6%). Load and indentation number are known to influence measured microhardness in IN718 [51]. More generally, hardness and fracture response depend on thermal history [52], and additively manufactured IN718 exhibits process-dependent microstructural and mechanical behavior [53]. The reference value is therefore used here only for the investigated specimen state and not as a universal IN718 hardness.
3.2. Load-Dependent Indentation Response and Selection of the Working Load
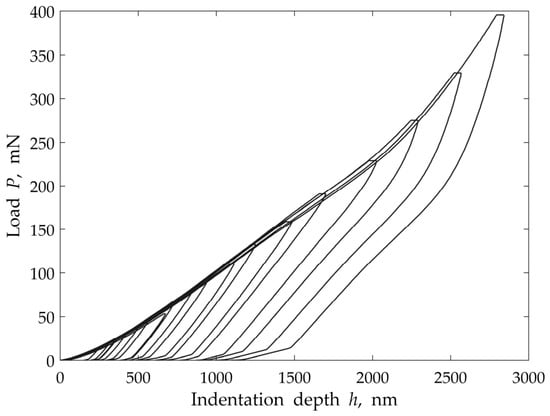
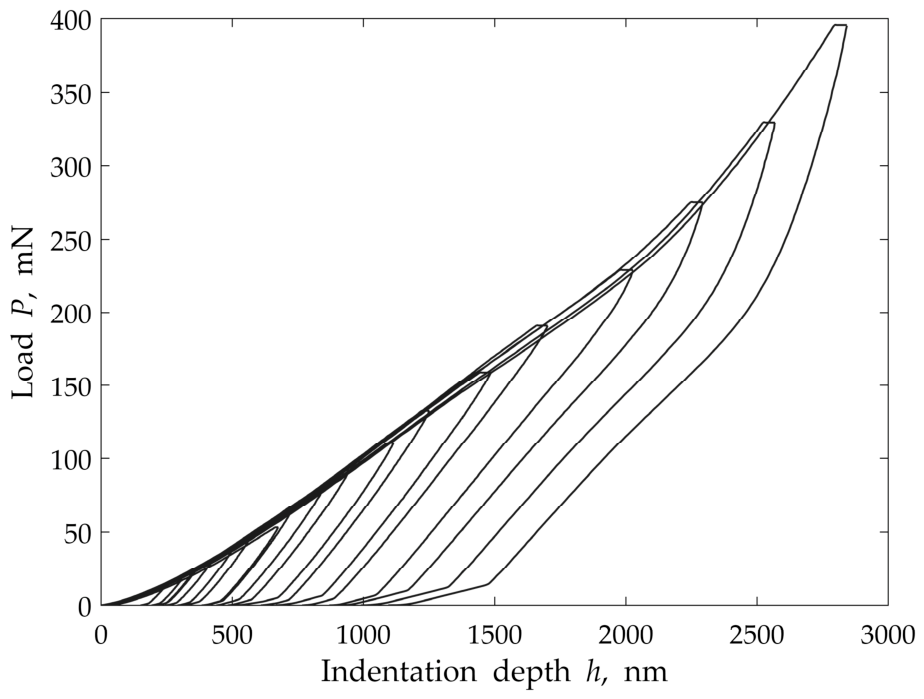
The load–displacement curves measured over Pmax = 1 … 400 mN are shown in Figure 3. At low loads, both the calculated hardness and modulus varied strongly with penetration depth. Such scale dependence is consistent with the broader sensitivity of indentation measurements to local microstructure and time-dependent deformation in additively manufactured materials [54] and can become especially pronounced in porous or heterogeneous systems [55].
Figure 3.
Indentation diagrams at loads Pmax = 1 … 400 mN.
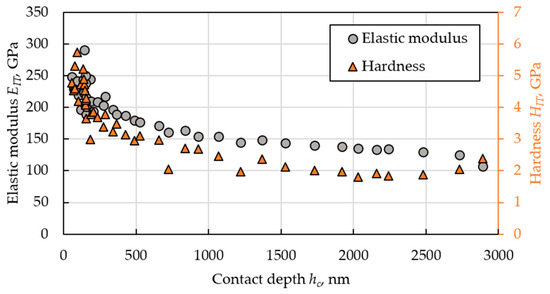
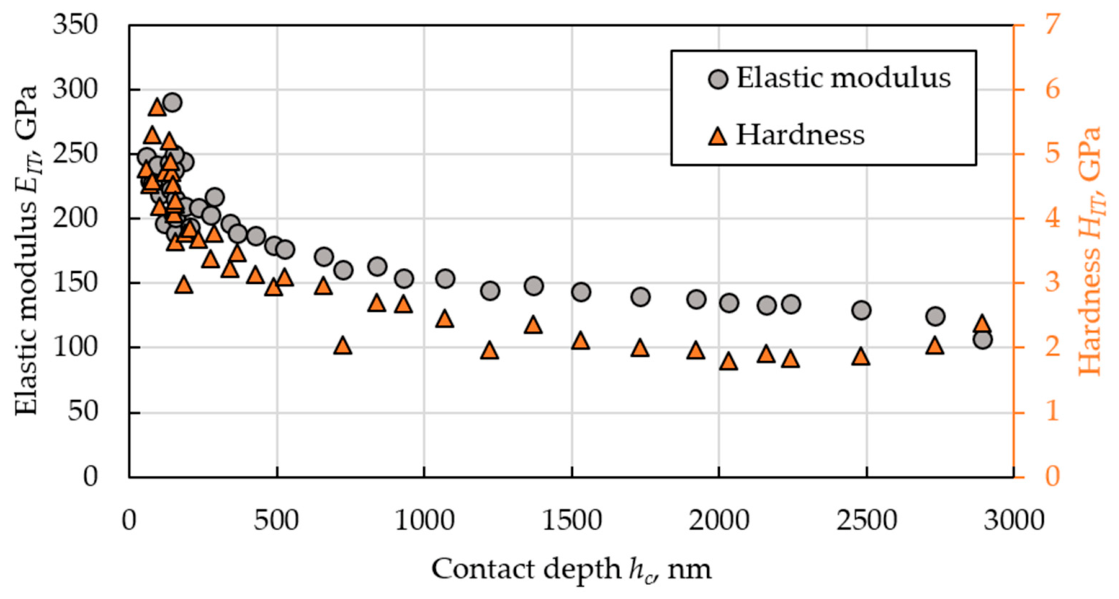
Figure 4 summarizes the calculated indentation modulus and hardness as functions of contact depth. Published nanoindentation data show that additively manufactured IN718 may differ from conventionally produced material [56], while high-throughput spherical indentation studies demonstrate that indentation-derived properties can be compared with conventional mechanical tests when the test scale and methodology are controlled [57]. The elastic response of IN718 is also temperature-dependent [58]; however, the present work concerns only room-temperature quasi-static indentation. Direct comparison with elastic moduli obtained by ultrasonic techniques was not used as a validation criterion because such measurements involve a different measurement chain and require their own metrological support [59]. Material-specific porosity–property relationships reported for porous alloys likewise cannot be transferred directly to the present cross-sectional pore geometry [60].
Figure 4.
Indentation results as a function of contact depth in the load-dependent series.
Nanoindentation has been used to resolve local mechanical properties in additively manufactured Ti-6Al-4V [61] and other AM alloys, but interpretation requires attention to the contact geometry. Sinking-in and piling-up can alter the effective contact area [62], and strain hardening can influence the mechanical parameters reconstructed from an indentation curve [63]. Hardness is also frequently correlated with yield strength [64], while spatial hardness changes can reflect genuine microstructure–property gradients [65]. Heat treatment can further modify fatigue and mechanical response in additively manufactured alloys [66]. These factors reinforce the need to define the working scale experimentally rather than assuming that a single low-load test is representative of the bulk material.
In the present data, EIT approached a plateau after an indentation depth of approximately 500 nm, corresponding to Pmax above roughly 50 mN. At Pmax = 100 mN, the mean hmax was 1103 ± 46 nm and hmax/Ra ≈ 79, so the penetration scale was substantially larger than the measured surface roughness. The equivalent Vickers number was retained only as an approximate scale cross-check: using the geometrical conversion HVeq = 94.495HIT for HIT in GPa gives HVeq ≈ 254 at HIT = 2.69 GPa, close to the independently measured HV0.2 = 256 ± 17. Because HIT and conventional Vickers hardness use different contact-area definitions, this numerical agreement is not treated as validation of the IIT result. A grain- or melt-pool-scale characteristic length was not independently measured in the present experiment; therefore, the working-load selection can be linked quantitatively to penetration depth, surface roughness, and contact size, but not to a directly measured microstructural feature size. On this basis, 50 … 150 mN is treated as an adequate working range for the investigated material–surface–instrument configuration, and Pmax = 100 mN was selected as the working load for subsequent mapping. This value is not claimed to be a universal or instrument-independent optimum.
The load-dependent series also changes the absolute loading rate because Pmax varies while the loading duration remains 5 s. Accordingly, the results are interpreted as a load/depth-dependent response under a fixed loading-time protocol rather than as a pure indentation-size-effect experiment. Nevertheless, the normalized loading history P/Pmax versus time was identical at every load. Under the self-similar approximation P ∝ h2, the normalized indentation rate scales as one half of the normalized load rate; at the end of the linear loading segment (5 s) this gives an approximate value of about 0.1 s−1. This estimate suggests that large changes in normalized strain-rate history were not imposed by the protocol, but an exact strain-rate history cannot be reconstructed because the original time-resolved P(t) and h(t) data are unavailable.
3.3. Constant-Load Mapping of the Reference Matrix Response
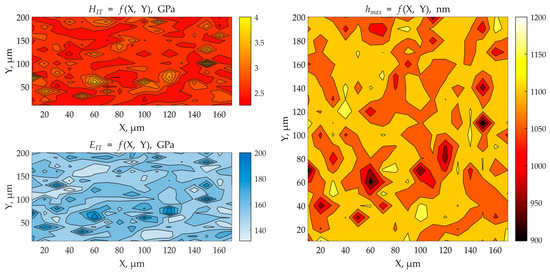
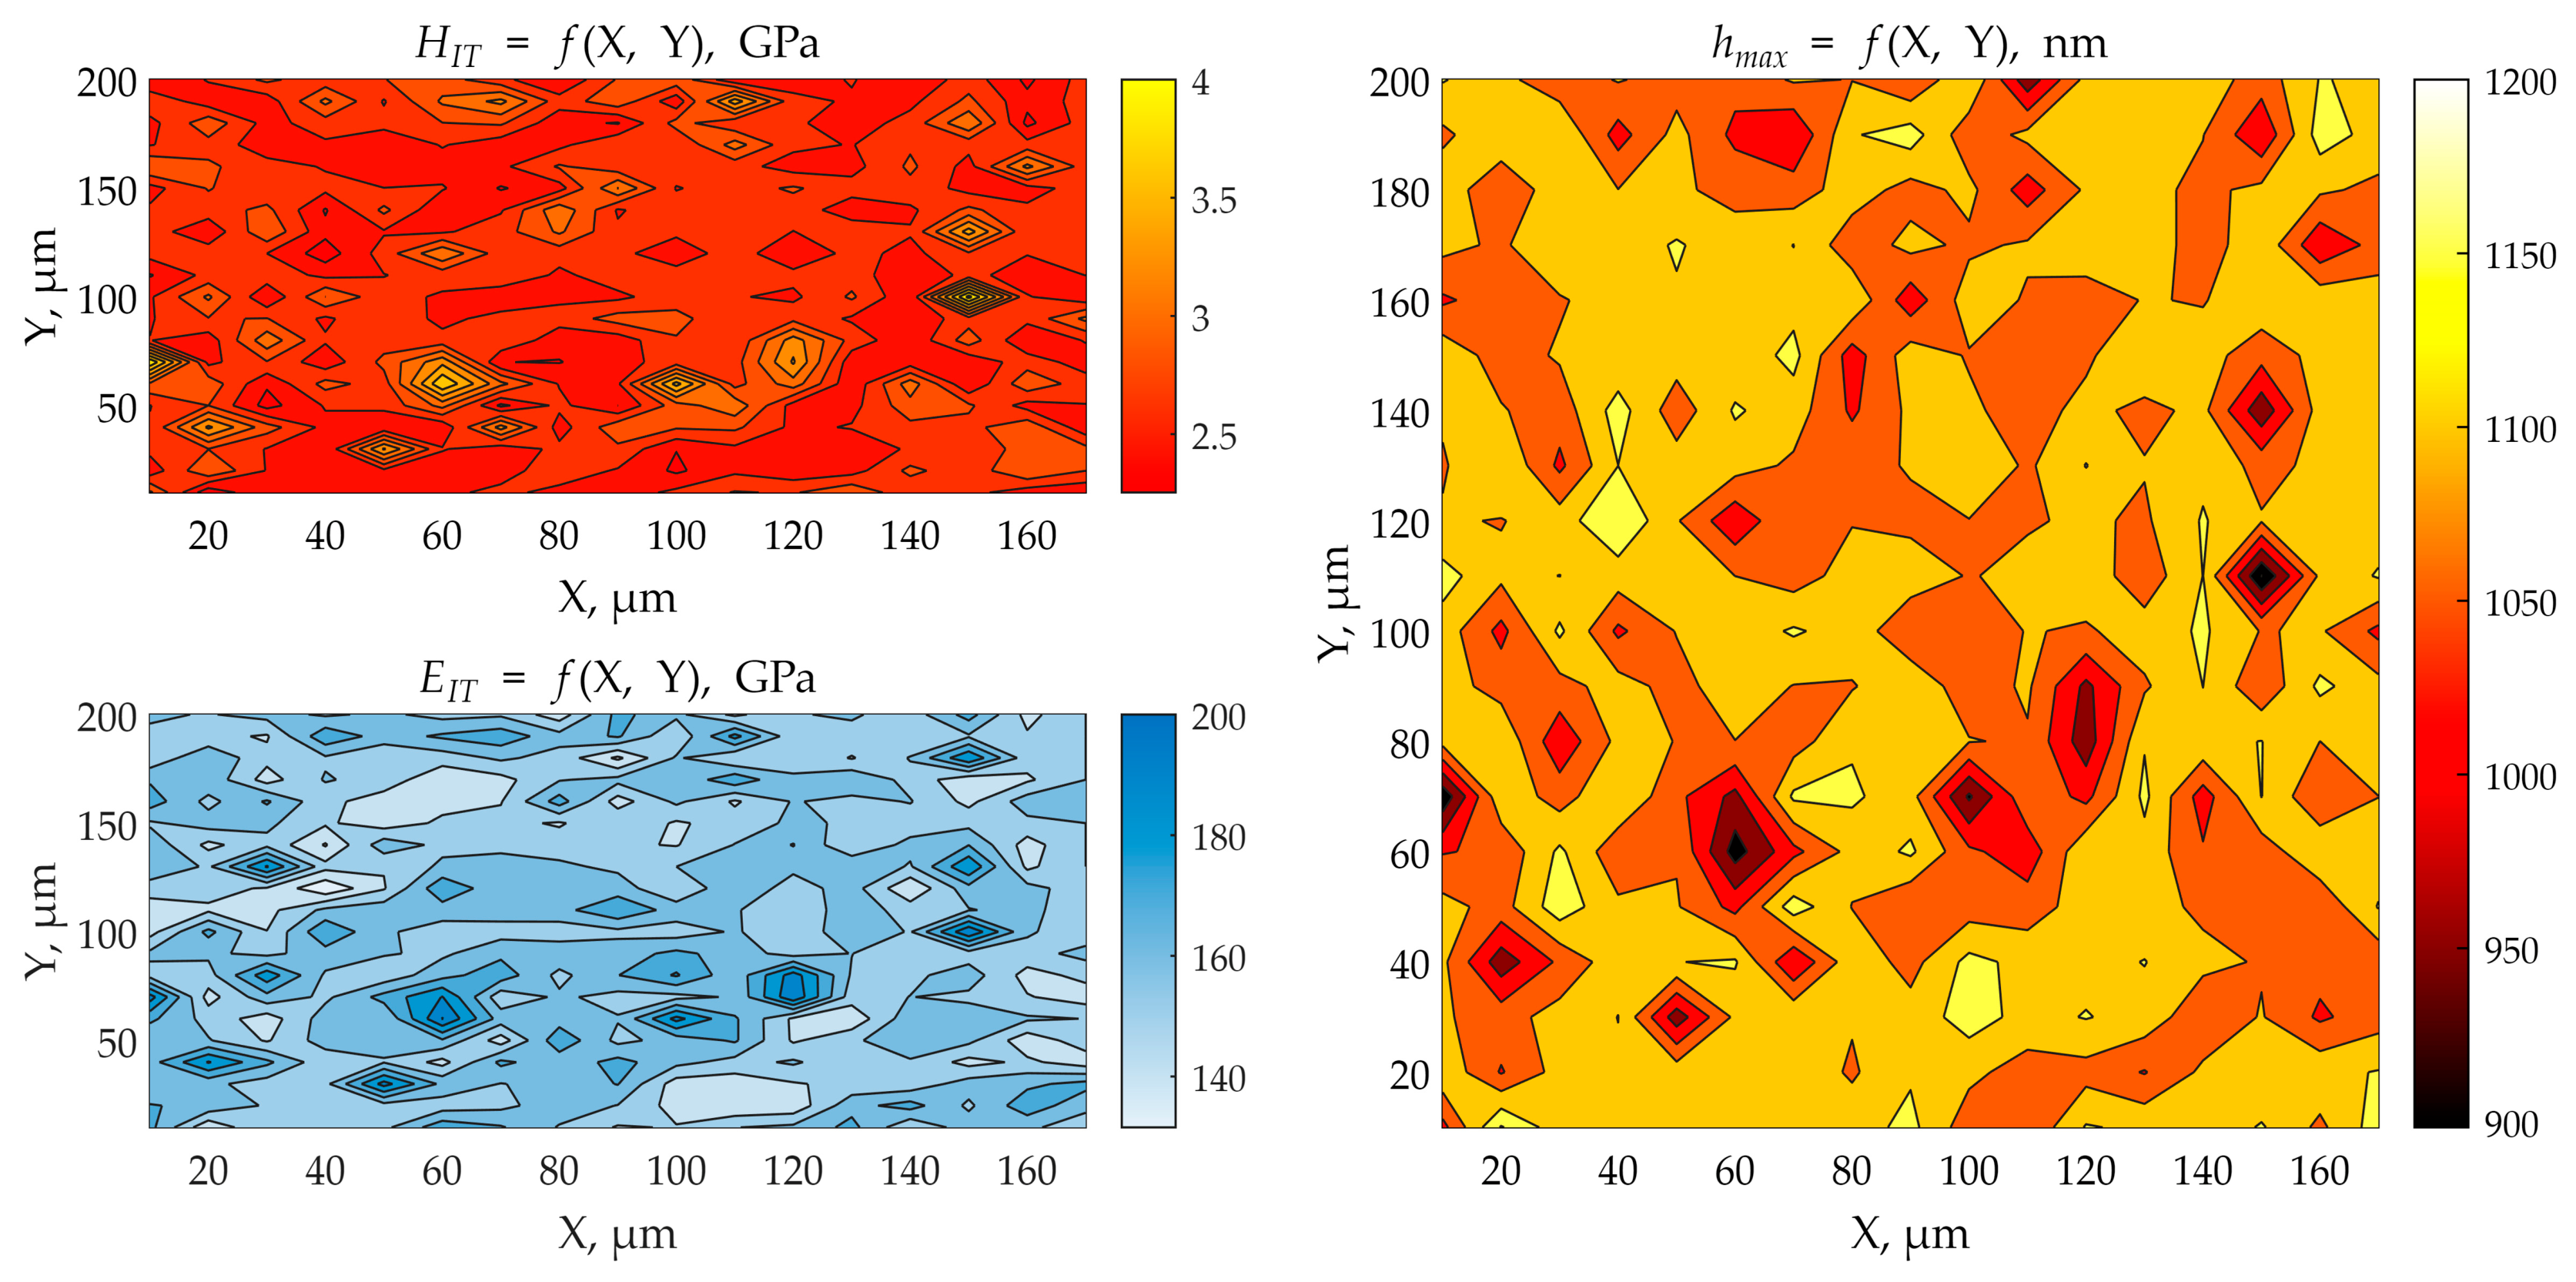
At Pmax = 100 mN, a 200 × 180 µm grid with 10 µm spacing (360 indentations) was measured to characterize the local matrix response independently of the selected pore. The property maps are shown in Figure 5.
Figure 5.
Spatial maps of indentation hardness HIT, indentation modulus EIT, and maximum penetration depth hmax at the working load Pmax = 100 mN.
The mean indentation modulus was EIT = 160 ± 11 GPa (SD = 6.9%), and the mean indentation hardness was HIT = 2.69 ± 0.26 GPa (SD = 9.7%). The mean maximum indentation depth was 1103 ± 46 nm. The hmax/Ra ratio was therefore approximately hmax/Ra ≈ 79, indicating that the penetration scale was substantially larger than the measured arithmetic roughness. The map scatter is interpreted as the baseline local variability of the investigated matrix at this working scale. It should not be used as proof of instrument validity by itself, because HIT, EIT, contact depth, and stiffness are derived from the same load–displacement record.
3.4. Local Micromechanical Response near the Surface-Intersecting Pore
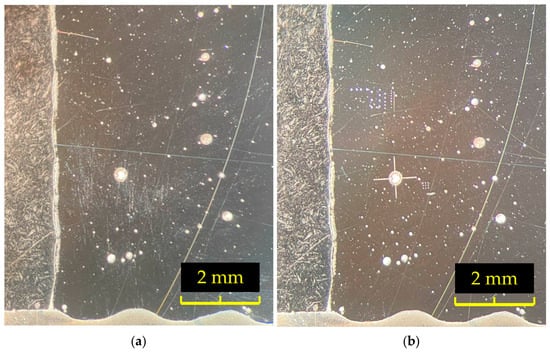
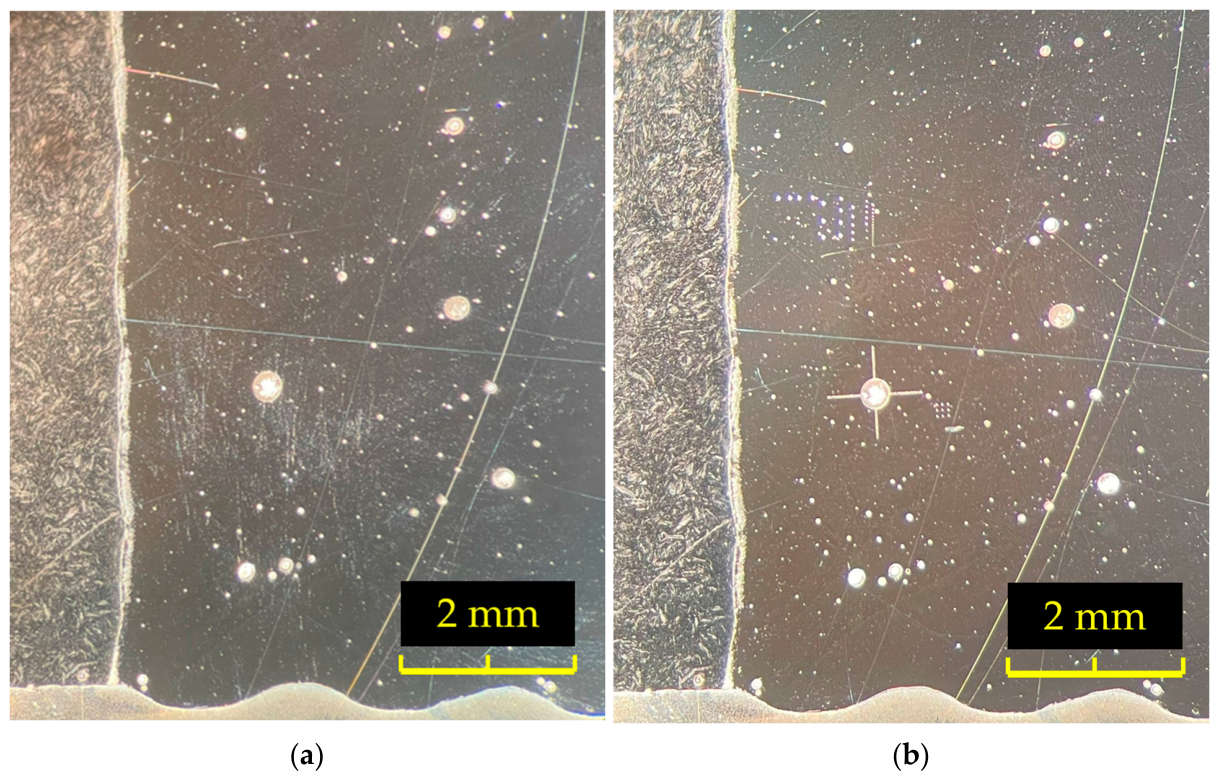
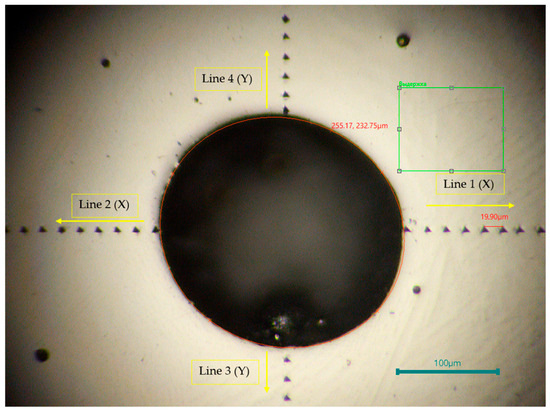
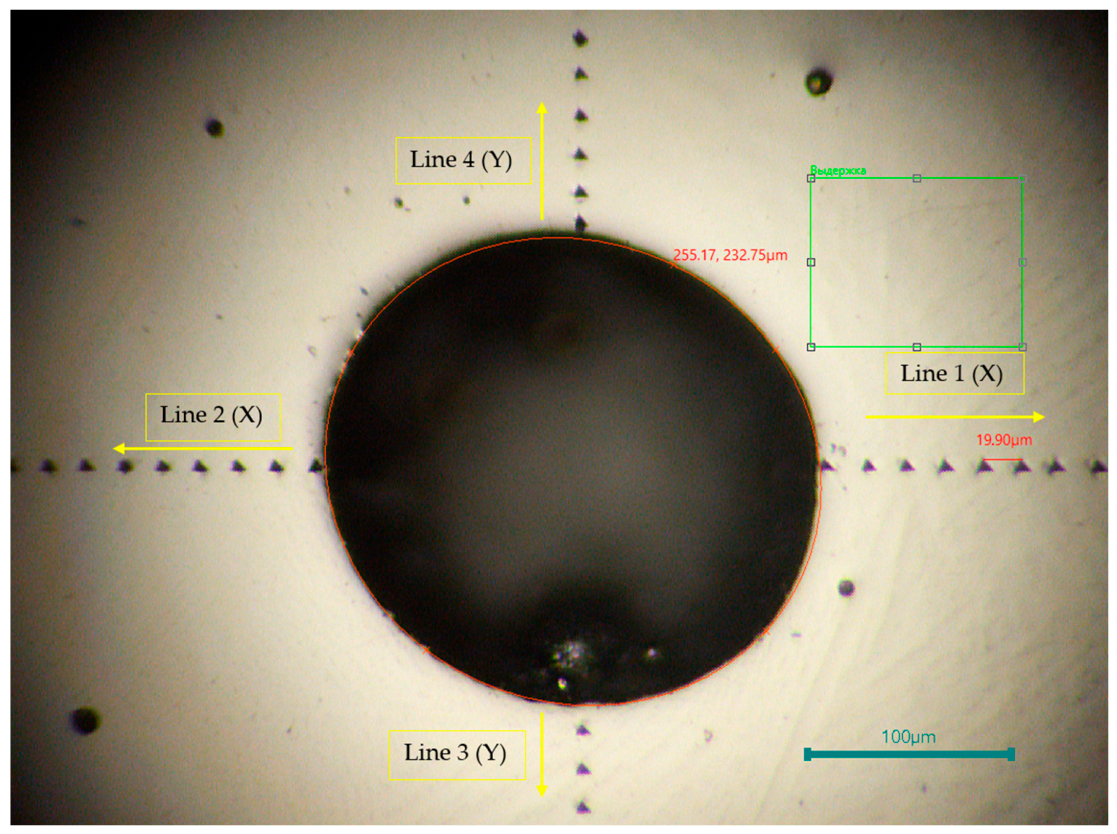
The pore selected for local analysis had an apparent diameter of approximately 232 µm on the polished cross-section (Figure 6). Its origin was not independently established. The pore was deliberately chosen in a region with no other visually identifiable pores immediately adjacent to the four measurement lines, reducing the probability that a neighboring surface defect would contribute to the measured response. Indentation can be sensitive to residual stress [5], and a pore free surface can in principle perturb the local stress state; nevertheless, the present measurements do not directly determine residual stress or the composition of any gas that may have existed during pore formation. The mechanical interpretation below is therefore restricted to the geometrical proximity of this single free surface and the measured indentation response.
Figure 6.
Sample surface region containing the selected pore: (a) before local indentation; (b) after indentation.
Measurements were performed along four directions with a nominal spacing of 20 µm (Figure 7). Directions 1 and 2 were approximately parallel to the deposited layer and Directions 3 and 4 approximately followed the build axis in opposite senses. The numerical distance s refers to the reported distance from the pore edge to the indentation position. The nearest row in the original dataset was not assigned a numerical distance and is therefore shown separately but is not included in ξ-based calculations.
Figure 7.
Four-direction measurement scheme around the selected surface-intersecting pore.
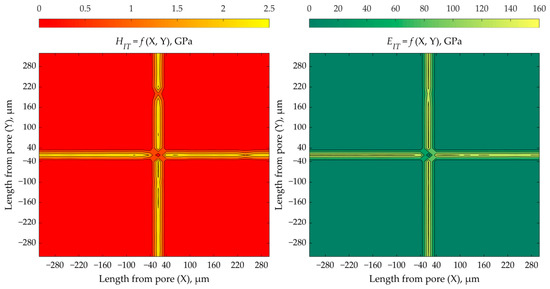
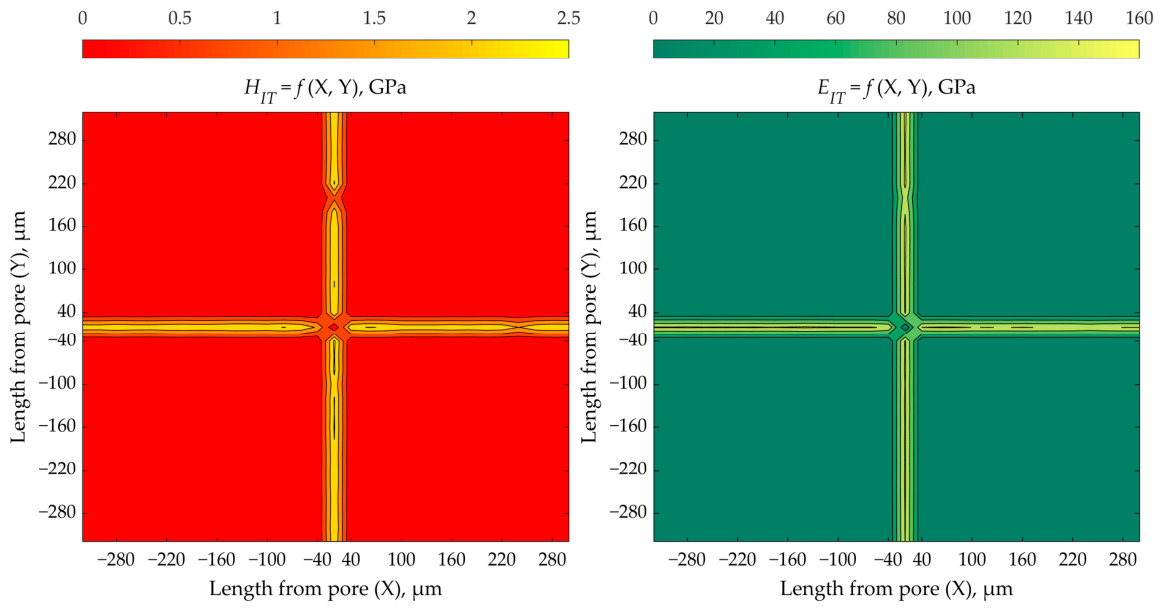
The summarized results of the mechanical property evaluation are shown in Figure 8.
Figure 8.
Maps of hardness and elastic-modulus distribution relative to the selected pore.
For Pmax = 100 mN and the baseline mean HIT = 2.69 GPa, Equation (2) gives Ap = 37.2 µm2. The corresponding equivalent contact radius from Equation (5) is ac = 3.44 µm. The pore radius is therefore approximately Rp/ac = 33.7. For the first numerically defined distance s = 20 µm and ξ = 5.8; at 40, 100, 160, and 280 µm, ξ = 11.6, 29.1, 46.5, and 81.4, respectively, as is shown in Table 1. Thus, the numerically defined measurements begin at approximately 5.8 equivalent contact radii from the pore edge. This does not place the first point in the immediate ξ ≲ 1 pore-edge regime; however, on the scale of the pore itself, s/Rp ≈ 20/116 ≈ 0.17, so the first defined position remains geometrically close to the pore boundary. The present experiment therefore addresses whether a pore-related perturbation remains detectable several contact radii into the surrounding matrix rather than resolving the immediate contact-pore interaction regime.
Table 1.
Direction-averaged pore-proximity data and normalized distance.
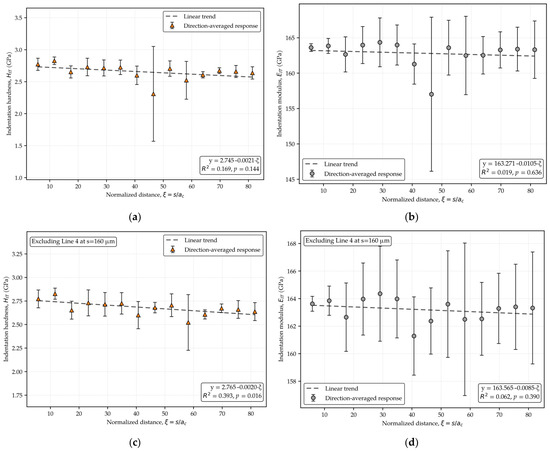
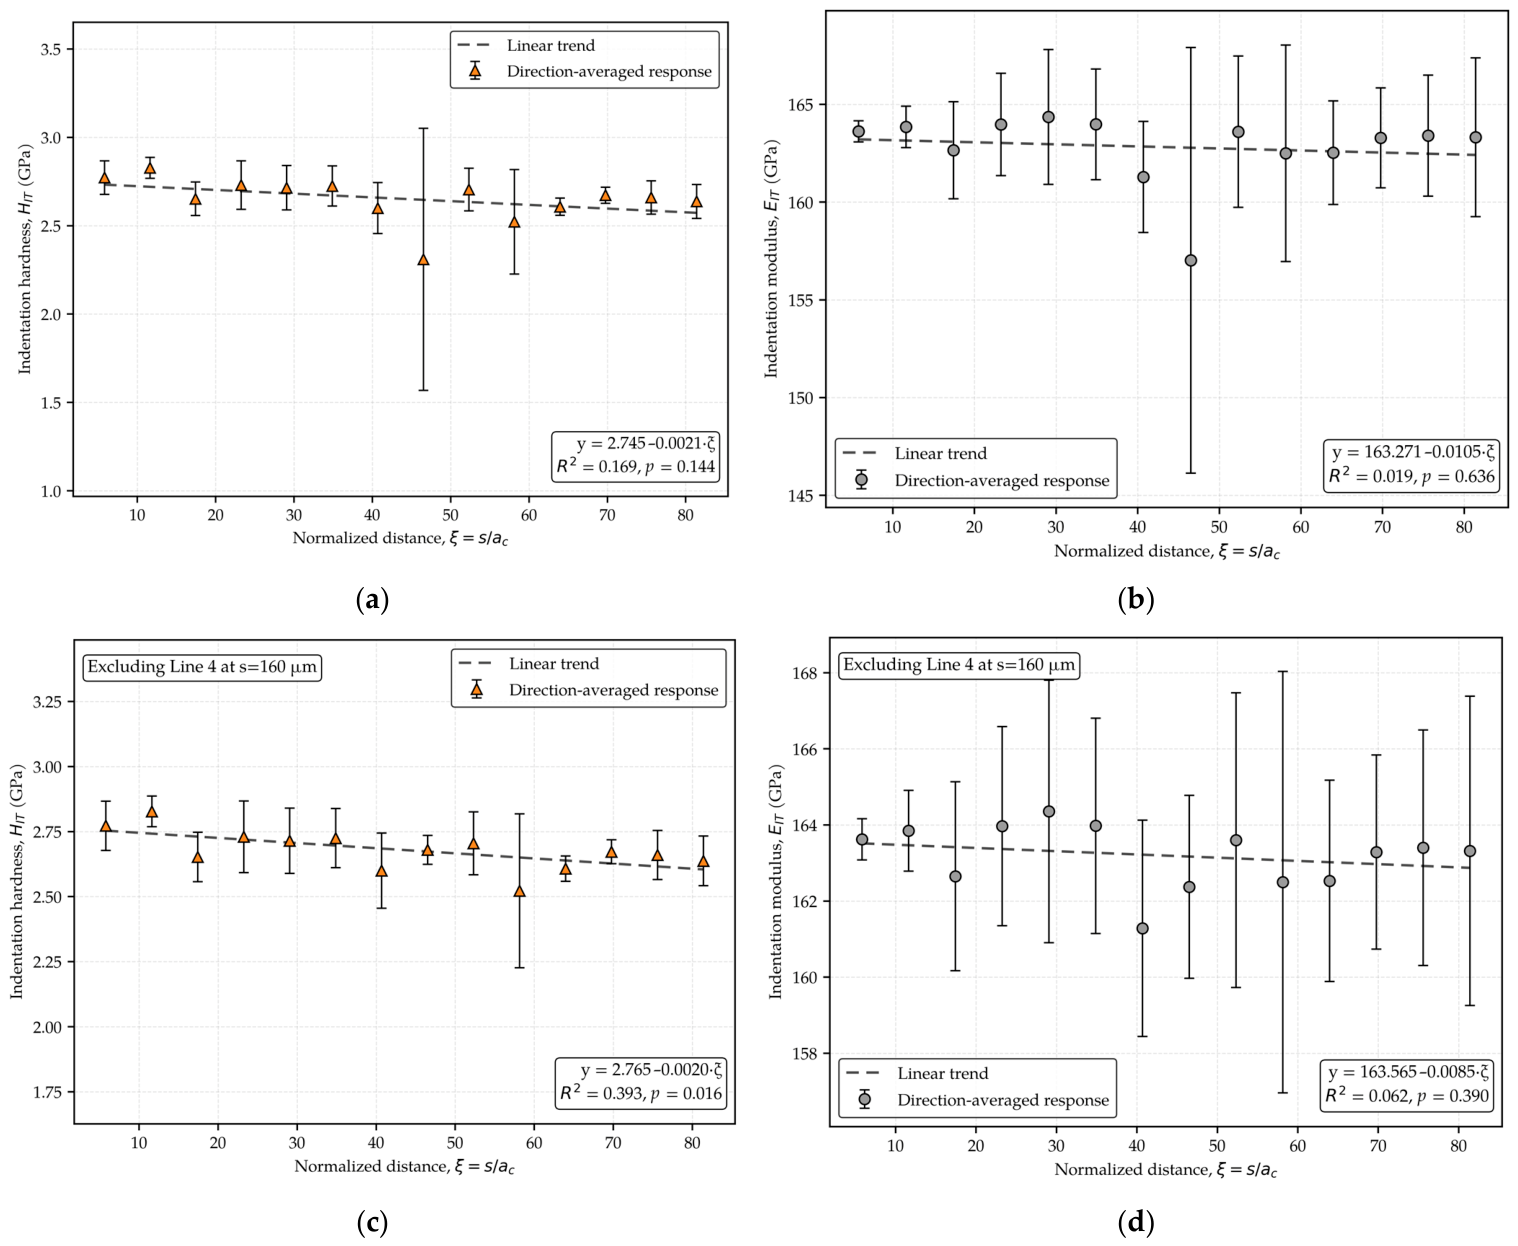
The direction-averaged data are shown in Figure 9 to visualize the magnitude of directional variability. The error bars overlap substantially at many adjacent distances, demonstrating that changes associated with measurement direction and local matrix heterogeneity are comparable to, or larger than, weak distance-dependent changes. For this reason, the primary statistical interpretation was based on all 56 individual measurements using robust regression with direction included as a categorical factor. The robust HIT slope was −0.00196 GPa per unit ξ (95% CI: −0.00286 to −0.00106; p < 0.001), whereas the robust EIT slope was −0.0030 GPa per unit ξ (95% CI: −0.0201 to 0.0142; p = 0.734). Thus, no statistically resolved dependence of EIT on pore-edge distance was detected. The small negative HIT slope is opposite to the simple expectation of a low near-pore hardness followed by recovery with increasing distance and is therefore interpreted cautiously as evidence that directional/local-material variability contributes strongly to the hardness response.
Figure 9.
Direction-averaged mechanical response as a function of normalized pore-edge distance ξ = s/ac: (a) indentation hardness, all data; (b) indentation modulus, all data; (c) indentation hardness after excluding the Line 4 measurement at s = 160 µm (sensitivity analysis); (d) indentation modulus after excluding the same measurement (sensitivity analysis). Error bars represent the standard deviation across the included measurement directions; dashed lines show least-squares linear fits. The primary statistical inference reported in the text is based on robust regression of the individual measurements.
For transparency and comparison with the original direction-averaged analysis, Figure 9a,b retains the least-squares fits using all direction-averaged values: HIT = 2.745 − 0.0021ξ (R2 = 0.169, p = 0.144) and EIT = 163.271 − 0.0105ξ (R2 = 0.019, p = 0.636). Because Line 4 at s = 160 µm yielded anomalously low values (HIT = 1.20 GPa and EIT = 140.96 GPa), Figure 9c,d is retained as a sensitivity analysis in which only this single observation is omitted and the direction-averaged value at s = 160 µm is recalculated from Lines 1–3. The corresponding fits are HIT = 2.765 − 0.0020ξ (R2 = 0.393, p = 0.016) and EIT = 163.565 − 0.0085ξ (R2 = 0.062, p = 0.390). The marked change in the hardness fit demonstrates why manual point removal is not used for the primary inference.
The effective-stiffness interpretation follows directly from the Oliver–Pharr framework. If the pore substantially reduced the mechanical support within the indentation interaction volume, the unloading stiffness S would be expected to decrease, which in turn would lower the apparent reduced modulus and the calculated indentation modulus. However, ac characterizes the projected contact scale and not the complete elastoplastic zone. Therefore, ξ = 5.8 cannot be interpreted as proof of complete mechanical separation from the pore. Rather, the absence of a resolved EIT dependence over ξ ≈ 5.8 … 81.4 indicates that a systematic pore-related reduction in apparent elastic stiffness was not detectable within the experimentally sampled range.
The measured variations should therefore be separated conceptually into intrinsic/local-material contributions and geometry/contact-analysis contributions. The former include build-direction or crystallographic heterogeneity, local strain hardening, pre-existing residual stress, and possible subsurface defects. The latter include proximity to the pore free surface, uncertainty in the projected contact area, surface roughness, load/depth dependence, and possible pile-up or sink-in. Because these contributions were not independently resolved in the present experiment, local changes in HIT or EIT are not attributed uniquely to the pore unless they are consistent with both the expected contact-mechanics trend and the measured distance dependence.
The Line 4 point at s = 160 µm deserves special attention. In normalized form this position corresponds to ξ ≈ 46.5, i.e., many contact radii from the pore edge. Objective influence diagnostics identified this observation as highly influential: the externally studentized residual exceeded |3| for both HIT and EIT, and Cook’s distance was approximately 0.62, compared with the conventional influence threshold 4/N ≈ 0.071 for N = 56. The observation was nevertheless retained in the primary robust regression. Attributing the local reduction directly to pore-edge compliance is not mechanically justified at this distance; local microstructural heterogeneity, a subsurface defect, or an individual measurement anomaly remain plausible alternatives. The without-Line-4 panels in Figure 9 are therefore presented only as a sensitivity analysis.
3.5. Scope and Limitations of the Inference
The present study does not establish a general dependence of IN718 mechanical properties on porosity. It is restricted to one manufacturing state, one polished cross-section, and one deliberately isolated surface-intersecting pore; the reported PA = 0.795% is a two-dimensional pore-area fraction rather than measured bulk volume porosity. The local results should therefore be interpreted as a single-pore case study. The experiment does not resolve the immediate ξ ≲ 1 pore-edge regime, does not provide a three-dimensional pore geometry, and does not independently determine residual stress or the complete indentation plastic-zone dimensions. A quantitative plastic-zone model would require a constitutive description calibrated for the local AM IN718 state and assumptions concerning strain hardening, anisotropy, residual stress, and three-dimensional pore morphology; this is beyond the scope of the present study and should be addressed in dedicated experimental–numerical work. The study also does not include residual-indent topography for direct pile-up/sink-in correction or time-resolved data for an exact indentation strain-rate history. Multiple pores, controlled strain-rate experiments, and measurements at smaller normalized distances require a separate experimental campaign and are proposed for future work.
4. Conclusions
This work examined the load/depth-dependent instrumented indentation response of as-built DLD IN718 and reinterpreted local measurements around a surface-intersecting pore in terms of contact-scale distance. The main conclusions are:
- For the investigated material–surface–instrument configuration, the low-load response was strongly depth-dependent and EIT approached a stable region above approximately 500 nm. The range 50 … 150 mN was therefore treated as an adequate working range, and Pmax = 100 mN was selected for mapping. At this load hmax/Ra ≈ 79. The HV0.2 result was retained only as an approximate independent scale cross-check, not as a direct validation of HIT.
- At Pmax = 100 mN, the reference matrix response was HIT = 2.69 ± 0.26 GPa and EIT = 160 ± 11 GPa. The corresponding projected contact area was approximately 37.2 µm2 and the equivalent contact radius was ac ≈ 3.44 µm. The reported PA = 0.795% describes only the two-dimensional pore-area fraction of the analyzed cross-section and is not interpreted as bulk volume porosity.
- For the investigated single surface-intersecting pore, the numerically defined measurements covered ξ ≈ 5.8 … 81.4. Robust analysis of all 56 individual measurements showed no statistically resolved EIT dependence on ξ. A small negative HIT slope was observed, but its sign and the substantial directional scatter do not support a simple near-pore softening followed by recovery with distance.
- The conclusions concerning pore proximity are restricted to this single pore and to the sampled distance range. The immediate ξ ≲ 1 region, multiple pore sizes/morphologies, controlled strain-rate effects, complete plastic-zone dimensions, and direct pile-up/sink-in measurements were not experimentally resolved and should be addressed in future experimental–numerical studies. Within these limitations, ξ = s/ac provides a reproducible contact-scale descriptor for comparing pore-edge distance with the indentation contact size.
Author Contributions
Conceptualization, conducting experimental studies, K.D.; sample preparation, instrumentation and methodological equipment, A.I.; methodology, editing, A.U.; processing experimental results, writing, A.K. All authors have read and agreed to the published version of the manuscript.
Funding
The research was carried out within the state assignment of the Ministry of Science and Higher Education of the Russian Federation (FSRW-2026–0003 Investigation of the processes of integrated subsoil development and deep processing of georesources).
Institutional Review Board Statement
Not applicable.
Informed Consent Statement
Not applicable.
Data Availability Statement
The raw data supporting the conclusion of this article will be made available by the author on request.
Conflicts of Interest
The authors declare no conflicts of interest.
Abbreviations
The following abbreviations are used in this manuscript:
| IN718 | Inconel 718 |
| AM | Additive manufacturing |
| IIT | Instrumented indentation test |
| DLD | Direct laser deposition |
| SD | Standard deviation |
References
- Kuskov, V.B.; Iliin, E.S. Using of thermal cycling to improve the strength properties of steel. CIS Iron Steel Rev. 2024, 27, 60–65. [Google Scholar] [CrossRef] [Scilit]
- Yurchenko, N.; Mirontsov, V.; Mishunina, E.; Kochura, E.; Stepanov, N. A novel refractory complex concentrated alloy with ultra-high strength at 1200 °C. Scr. Mater. 2026, 271, 116982. [Google Scholar] [CrossRef] [Scilit]
- Maksarov, V.V.; Nguyen, V.D.; Khalimonenko, A.D.; Shishkin, P.V. Technological support of workpiece surface quality based on local cryogenic impact during processing of austenitic steels. Chernye Met. 2024, 9, 82–87. [Google Scholar] [CrossRef] [Scilit]
- Liu, C.; Wan, M.; Zhang, W.; Yang, Y. Chip formation mechanism of Inconel 718: A review of models and approaches. Chin. J. Mech. Eng. 2021, 34, 34. [Google Scholar] [CrossRef] [Scilit]
- Niu, J.; Tian, P.; Sun, S.; Zhang, Y.; Song, G.; Song, Q.; Li, Q.; Hu, N.; Li, F. Non-destructive hardness indentation measurement of residual stress on large aerospace forged components at the engineering site based on impact hardness tester. Materials 2024, 17, 3436. [Google Scholar] [CrossRef] [Scilit] [PubMed]
- Ermakov, S.B.; Ermakov, B.S.; Vologzhanina, S.A.; Sleptsov, O.I. Investigation of material properties for cryogenic products produced by additive manufacturing techniques. Metallurgist 2023, 67, 644–651. [Google Scholar] [CrossRef] [Scilit]
- Babentsova, L.P.; Antsiferova, I.V. The mechanical properties of the IN718 alloy under static and cyclic deformation. Mod. Sci. Intensive Technol. 2019, 6, 14–19. [Google Scholar] [CrossRef] [Scilit]
- Gryaznov, M.Y.; Shotin, S.V.; Chuvildeev, V.N. Physico-mechanical properties and structure of Inconel 718 alloy obtained by selective laser melting technology. Vestn. Lobachevsky Univ. Nizhni Novgorod 2014, 4, 46–51. [Google Scholar]
- Solberg, K.; Hovig, E.W.; Sørby, K.; Berto, F. Directional fatigue behaviour of maraging steel grade 300 produced by laser powder bed fusion. Int. J. Fatigue 2021, 149, 106229. [Google Scholar] [CrossRef] [Scilit]
- Amato, K.N.; Gaytan, S.M.; Murr, L.E.; Martinez, E.; Shindo, P.W.; Hernandez, J.; Collins, S.; Medina, F. Microstructures and mechanical behavior of Inconel 718 fabricated by selective laser melting. Acta Mater. 2012, 60, 2229–2239. [Google Scholar] [CrossRef] [Scilit]
- Aleshin, N.P.; Murashov, V.V.; Evgenov, A.G.; Grigoriev, M.V.; Shchipakov, N.A.; Vasilenko, S.A.; Krasnov, I.S. The classification of flaws of metal materials synthesized by the selective laser melting method and the capabilities of nondestructive testing methods for their detection. Russ. J. Nondestruct. Test. 2016, 52, 38–43. [Google Scholar] [CrossRef] [Scilit]
- Yujra Rivas, E.; Vyacheslavov, A.V.; Gogolinskiy, K.; Sapozhnikova, K.; Taymanov, R. Deformation monitoring systems for hydroturbine head-cover fastening bolts in hydroelectric power plants. Sensors 2025, 25, 2548. [Google Scholar] [CrossRef] [Scilit] [PubMed]
- Paraschiv, A.; Matache, G.; Condruz, M.R.; Dobromirescu, C. Assessment of additive manufactured IN625 tensile strength based on nonstandard specimens. Materials 2023, 16, 4930. [Google Scholar] [CrossRef] [Scilit] [PubMed]
- Khodabakhshi, F.; Matache, G.; Condruz, M.R.; Dobromirescu, C. Microstructure, strain-rate sensitivity, work hardening, and fracture behavior of laser additive manufactured austenitic and martensitic stainless steel structures. Mater. Sci. Eng. A 2019, 756, 545–561. [Google Scholar] [CrossRef] [Scilit]
- Hosseini, E.; Popovich, V.A. A review of mechanical properties of additively manufactured Inconel 718. Addit. Manuf. 2019, 30, 100877. [Google Scholar] [CrossRef] [Scilit]
- Efimov, A.E.; Uspenskaya, V.D.; Motrich, A.A. Improving the quality of processing articles made of low-alloy ferrite-pearlite steels using concentrated laser emission. Chernye Met. 2024, 9, 77–81. [Google Scholar] [CrossRef] [Scilit]
- Karabulut, B.; Ruan, X.; MacDonald, S.; Dobrić, J.; Rossi, B. Fatigue of wire arc additively manufactured components made of unalloyed S355 steel. Int. J. Fatigue 2024, 184, 108317. [Google Scholar] [CrossRef] [Scilit]
- Pedash, A.A.; Lysenko, N.A.; Klochikhin, V.V.; Shylo, V.G. Structure and properties of specimens made from Inconel 718 by the selective laser melting process. Aviat. Space Eng. Technol. 2017, 8, 46–54. [Google Scholar]
- Zhou, H.; Su, H.; Guo, Y.; Yang, P.; Liu, Y.; Shen, Z.; Zhao, D.; Liu, H.; Huang, T.; Guo, M.; et al. Formation and evolution mechanisms of pores in Inconel 718 during selective laser melting: Meso-scale modeling and experimental investigations. J. Manuf. Process. 2022, 81, 202–213. [Google Scholar] [CrossRef] [Scilit]
- Jiang, X.; Shen, W.; Jiang, L.; Qin, H. Effects of particle size distribution and impact speed on printing quality in direct energy deposition. Manuf. Lett. 2022, 33, 521–526. [Google Scholar] [CrossRef] [Scilit]
- Meng, G.; Zhang, J.; Li, J.; Jiang, Z.; Gong, Y.; Zhao, J. Impact of pore defects on laser additive manufacturing of Inconel 718 alloy based on a novel finite element model: Thermal and stress evaluation. Opt. Laser Technol. 2023, 167, 109782. [Google Scholar] [CrossRef] [Scilit]
- du Plessis, A.; Yadroitsava, I.; Yadroitsev, I. Effects of defects on mechanical properties in metal additive manufacturing: A review focusing on X-ray tomography insights. Mater. Des. 2020, 187, 108385. [Google Scholar] [CrossRef] [Scilit]
- Meng, L.X.; Ben, D.D.; Yang, H.J.; Ji, H.B.; Lian, D.L.; Zhu, Y.K.; Chen, J.; Yi, J.L.; Wang, L.; Yang, J.B.; et al. Effects of embedded spherical pore on the tensile properties of a selective laser melted Ti6Al4V alloy. Mater. Sci. Eng. A 2021, 815, 141254. [Google Scholar] [CrossRef] [Scilit]
- Syasko, V.; Musikhin, A.; Gnivush, I. Improvement of methods and devices for multi-parameter high-voltage testing of dielectric coatings. Coatings 2024, 14, 427. [Google Scholar] [CrossRef] [Scilit]
- Syasko, V.; Musikhin, A.; Gnivush, I.; Stepanova, M.; Vinogradova, A. Rolled waterproofing coating delamination detection by high-voltage testing. Coatings 2026, 16, 648. [Google Scholar] [CrossRef] [Scilit]
- Mustafaev, A.S.; Grabovskiy, A.Y.; Sukhomlinov, V.S.; Shtoda, E.V. A universal triode-based plasma device with controllable electrokinetic characteristics. J. Appl. Phys. 2026, 139, 153302. [Google Scholar] [CrossRef] [Scilit]
- Shrivastava, A.; Subramaniyan, A.K.; Rao, S.; Nagesha, B.K. How to characterise the anisotropy of laser powder bed fusion-processed parts? Towards a surrogate, non-destructive indentation-based approach. J. Manuf. Process. 2024, 118, 128–153. [Google Scholar] [CrossRef] [Scilit]
- Popov, G.G.; Bolobov, V.I.; Oparina, A.O.; Shvets, A.O. Effect of hydrogenation on hardness of metallic materials used in oil and gas industry. Int. J. Eng. 2025, 38, 295–303. [Google Scholar] [CrossRef] [Scilit]
- Tsukanov, D.V.; Smirnova, D.L.; Petkova, A.P.; Shtertser, V.V. Modeling of cooling mode during hardening of a large-sized rotor blank made of Cr-Ni-Mo-V steel. Chernye Met. 2024, 9, 29–36. [Google Scholar] [CrossRef] [Scilit]
- Rowe, R.A.; Tajyar, A.; Munther, M.; Johanns, K.E.; Allison, P.G.; Momeni, K.; Davami, K. Nanoscale serration characteristics of additively manufactured superalloys. J. Alloys Compd. 2021, 854, 156723. [Google Scholar] [CrossRef] [Scilit]
- Uddin, M.J.; Ramirez-Cedillo, E.; Mirshams, R.A.; Siller, H.R. Nanoindentation and electron backscatter diffraction mapping in laser powder bed fusion of stainless steel 316L. Mater. Charact. 2021, 174, 111047. [Google Scholar] [CrossRef] [Scilit]
- England, J.; Uddin, M.J.; Ramirez-Cedillo, E.; Karunarathne, D.; Nasrazadani, S.; Golden, T.D.; Siller, H.R. Nanoindentation hardness and corrosion studies of additively manufactured 316L stainless steel. J. Mater. Eng. Perform. 2022, 31, 6795–6805. [Google Scholar] [CrossRef] [Scilit]
- Gromyka, D.S.; Gogolinsky, K.V.; Shchiptsova, E.K.; Alekhnovich, V.V. Possibility evaluation of monitoring areas of local plastic deformation during fatigue wear of metal structures using the dynamic instrumented indentation method. Int. J. Eng. 2026, 39, 104–111. [Google Scholar] [CrossRef] [Scilit]
- Chen, Z.; Wang, X.; Bhakhri, V.; Giuliani, F.; Atkinson, A. Nanoindentation of porous bulk and thin films of La0.6Sr0.4Co0.2Fe0.8O3-δ. Acta Mater. 2013, 61, 5720–5734. [Google Scholar] [CrossRef] [Scilit]
- Li, L.; Li, Z.; Cao, M.; Tang, Y.; Zhang, Z. Nanoindentation and porosity fractal dimension of calcium carbonate whisker reinforced cement paste after elevated temperatures (up to 900 °C). Fractals 2021, 29, 2140001. [Google Scholar] [CrossRef] [Scilit]
- Islam, T.; Aziz, S.A.; Fardin, S.; Faiyad, A.; Motalab, M. Atomistic study on the cooling rate induced mechanical properties variations in additively manufactured Inconel 718. In Proceedings of the ASME International Mechanical Engineering Congress and Exposition (IMECE 2023), New Orleans, LA, USA, 29 October–2 November 2023; Volume 4: Advanced Materials: Design, Processing, Characterization and Applications; ASME: New York, NY, USA, 2023. [Google Scholar] [CrossRef] [Scilit]
- Schneider, J.; Farris, L.; Nolze, G.; Reinsch, S.; Cios, G.; Tokarski, T.; Thompson, S. Microstructure evolution in Inconel 718 produced by powder bed fusion additive manufacturing. J. Manuf. Mater. Process. 2022, 6, 20. [Google Scholar] [CrossRef] [Scilit]
- Zhukov, A.S.; Madin, V.V.; Barakhtin, B.K.; Perevislov, S.N.; Kuznetsov, P.A. Study of the structure and the destruction surface of the dampers manufactured by selective laser melting. Mater. Sci. Forum 2023, 1084, 61–66. [Google Scholar] [CrossRef] [Scilit]
- Pryakhin, E.I.; Pribytkova, D.A. The influence of the quality of surface preparation of pipes for heating networks on their corrosion resistance during operation in underground conditions. Chernye Met. 2023, 11, 97–102. [Google Scholar] [CrossRef] [Scilit]
- Gorji, N.E.; O’Connor, R.; Brabazon, D. X-ray tomography, AFM and nanoindentation measurements for recyclability analysis of 316L powders in 3D printing process. Procedia Manuf. 2020, 47, 1113–1116. [Google Scholar] [CrossRef] [Scilit]
- Gorji, N.E.; O’Connor, R.; Brabazon, D. XPS, SEM, AFM, and nano-indentation characterization for powder recycling within additive manufacturing process. IOP Conf. Ser. Mater. Sci. Eng. 2021, 1182, 012025. [Google Scholar] [CrossRef] [Scilit]
- Sousa, B.C.; Walde, C.E.; Champagne, V.K.; Cote, D.L. Initial observation of grain orientation dependent nanoindentation hardness of Al 6061 gas-atomized powder. Int. J. Metall. Met. Phys. 2020, 5, 050. [Google Scholar] [CrossRef] [Scilit] [PubMed]
- Vinogradova, A.A.; Gogolinskiy, K.V.; Doronin, K.I.; Shchiptsova, E.K.; Melnikova, A.V. HDPE properties evaluation via instrumented indentation: Experimental and computer simulation approach. Appl. Mech. 2025, 6, 29. [Google Scholar] [CrossRef] [Scilit]
- Shchipachev, A.M.; Alekhin, A.I. Determining the endurance limit of oil and gas steels based on software-assisted indentation testing results. Int. J. Eng. 2026, 39, 668–676. [Google Scholar] [CrossRef] [Scilit]
- Rashkovets, M.V.; Kislov, N.G.; Nikulina, A.A.; Klimova-Korsmik, O.G. Effect of heat treatment on the structure, phase composition and impact toughness of Inconel 718 alloy under additive manufacturing. Photonics Russ. 2021, 15, 568–575. [Google Scholar] [CrossRef] [Scilit]
- Protatskaya, A.A.; Sharipova, S.R. The effect of heat treatment on the structure of SLM Inconel 718 alloy. Mater. Technol. Des. 2022, 4, 46–51. [Google Scholar] [CrossRef] [Scilit]
- Davoodi, F.; Guglielmi, P.; Palumbo, G.; Carbone, G. Experimental evaluation of 100Cr6 steel microindented surfaces under lubricated nonconformal point contacts. Adv. Eng. Mater. 2026, 28, e202500646. [Google Scholar] [CrossRef] [Scilit]
- Oliver, W.C.; Pharr, G.M. Measurement of hardness and elastic modulus by instrumented indentation: Advances in understanding and refinements to methodology. J. Mater. Res. 2004, 19, 3–20. [Google Scholar] [CrossRef]
- Suresh, T.; Landes, S.; Letcher, T.; Prasad, A.; Gradl, P.; Ellis, D. Nanomechanical characterization of additive manufactured GRCop-42 alloy developed by directed energy deposition methods. In Proceedings of the ASME International Mechanical Engineering Congress and Exposition (IMECE 2020), Virtual Conference, 16–19 November 2020; Volume 4: Advances in Aerospace Technology; ASME: New York, NY, USA, 2020. [Google Scholar] [CrossRef] [Scilit]
- ISO 14577-1:2015; Metallic Materials-Instrumented Indentation Test for Hardness and Materials Parameters-Part 1: Test Method. International Organization for Standardization: Geneva, Switzerland, 2015.
- Mohamad, N.F.; Kasim, M.S.; Akmal, M.; Hafiz, M.S.A.; Mohamed, S.B. The effects of indentation loading force and number of indentations on the microhardness variation for Inconel 718. Int. J. Recent Technol. Eng. 2019, 8, 980–983. [Google Scholar] [CrossRef] [Scilit]
- Shakhnazarov, K.Y.; Rafikov, A.R. The influence of hardening heat treatment modes on the crack propagation resistance of 5H2SMF die steel. Front. Mater. Technol. 2025, 2, 95–101. [Google Scholar] [CrossRef] [Scilit]
- Jeyaprakash, N.; Yang, C.H.; Ramkumar, K.R. Microstructural, mechanical and wear behaviour of Inconel 718 produced through laser powder bed fusion additive manufacturing. Mater. Sci. Technol. 2021, 37, 326–337. [Google Scholar] [CrossRef] [Scilit]
- Peng, H.; Fang, W.; Dong, C.; Yi, Y.; Wei, X.; Luo, B.; Huang, S. Nano-mechanical properties and creep behavior of Ti6Al4V fabricated by powder bed fusion electron beam additive manufacturing. Materials 2021, 14, 3004. [Google Scholar] [CrossRef] [Scilit] [PubMed]
- Kasyap, S.S.; Senetakis, K. Application of nanoindentation in the characterization of a porous material with a clastic texture. Materials 2021, 14, 4579. [Google Scholar] [CrossRef] [Scilit] [PubMed]
- Wang, H.; Dhiman, A.; Ostergaard, H.E.; Zhang, Y.; Siegmund, T.; Kruzic, J.J.; Tomar, V. Nanoindentation-based properties of Inconel 718 at elevated temperatures: A comparison of conventional versus additively manufactured samples. Int. J. Plast. 2019, 120, 380–394. [Google Scholar] [CrossRef] [Scilit]
- Courtright, Z.S.; Leclerc, N.P.; Kim, H.N.; Kalidindi, S.R. Critical comparison of spherical microindentation, small punch test, and uniaxial tensile testing for selective laser melted Inconel 718. Appl. Sci. 2021, 11, 1061. [Google Scholar] [CrossRef] [Scilit]
- Fukuhara, M.; Sanpei, A. Elastic moduli and internal frictions of Inconel 718 and Ti-6Al-4V as a function of temperature. J. Mater. Sci. Lett. 1993, 12, 1122–1124. [Google Scholar] [CrossRef] [Scilit]
- Shikhov, A.I.; Gogolinsky, K.V.; Zubarev, A.S.; Smorodinsky, Y.G.; Kopytina, D.V.; Vinogradova, A.A. Analysis of the requirements for metrological support of methods and means of ultrasound control. Russ. J. Nondestruct. Test. 2025, 61, 280–294. [Google Scholar] [CrossRef] [Scilit]
- Galimzyanov, B.N.; Nikiforov, G.A.; Anikeev, S.G.; Artyukhova, N.V.; Mokshin, A.V. A unified empirical equation for determining the mechanical properties of porous NiTi alloy: From nanoporosity to microporosity. Crystals 2023, 13, 1656. [Google Scholar] [CrossRef] [Scilit]
- Gong, X.; Lydon, J.; Chou, K. Microstructural analysis and nanoindentation characterization of Ti-6Al-4V parts from electron beam additive manufacturing. In Proceedings of the ASME International Mechanical Engineering Congress and Exposition (IMECE 2014), Montreal, QC, Canada, 14–20 November 2014; Volume 2A: Advanced Manufacturing; ASME: New York, NY, USA, 2014. [Google Scholar] [CrossRef] [Scilit]
- Bandyopadhyay, P.P.; Chicot, D.; Kumar, C.S.; Decoopman, X.; Lesage, J. Influence of sinking-in and piling-up on the mechanical properties determination by indentation: A case study on rolled and DMLS stainless steel. Mater. Sci. Eng. A 2013, 576, 126–133. [Google Scholar] [CrossRef] [Scilit]
- Doronin, K.I.; Gogolinskiy, K.V.; Umanskii, A.S. Influence of strain hardening on the results of calculating the material mechanical properties via the instrumented indentation test. Int. Rev. Model. Simul. 2025, 18, 340–349. [Google Scholar] [CrossRef] [Scilit]
- Busby, J.T.; Hash, M.C.; Was, G.S. The relationship between hardness and yield stress in irradiated austenitic and ferritic steels. J. Nucl. Mater. 2005, 336, 267–278. [Google Scholar] [CrossRef] [Scilit]
- Mao, K.; Wang, H.; Wu, Y.; Tomar, V.; Wharry, J.P. Microstructure-property relationship for AISI 304/308L stainless steel laser weldment. Mater. Sci. Eng. A 2018, 721, 234–243. [Google Scholar] [CrossRef] [Scilit]
- Lee, D.-G.; Choi, Y. Effect of heat treatments on fatigue properties of Ti-6Al-4V alloy fabricated by EBM additive manufacturing. MATEC Web Conf. 2020, 321, 03027. [Google Scholar] [CrossRef] [Scilit]

Disclaimer/Publisher’s Note: The statements, opinions and data contained in all publications are solely those of the individual author(s) and contributor(s) and not of MDPI and/or the editor(s). MDPI and/or the editor(s) disclaim responsibility for any injury to people or property resulting from any ideas, methods, instructions or products referred to in the content. |
© 2026 by the authors. Licensee MDPI, Basel, Switzerland. This article is an open access article distributed under the terms and conditions of the Creative Commons Attribution (CC BY) license.