


Abstract
Triply periodic minimal surface (TPMS) structures offer smooth, interconnected flow channels and are promising as additively manufactured flow-equalizing inserts for local inert-gas delivery systems. This study used pore-resolved simulations to analyze argon transport through Diamond (D), Gyroid (G), and Primitive (P) TPMS architectures. Equivalent flow resistance was assessed via pressure drop-based permeability metrics, and outlet-flow uniformity was measured with a velocity uniformity index. The impacts of porosity, unit-cell size, wall thickness, and topology were examined, recognizing their coupled nature. Higher porosity enhances gas throughput but slightly improves outlet uniformity. Larger unit cells significantly lower hydraulic resistance and boost permeability but tend to create preferred flow paths, reducing uniformity. Thicker walls decrease effective flow area and increase viscous resistance. Among the configurations studied, G-type topology offers the best balance between gas throughput and outlet-flow uniformity. Based on permeability and uniformity rankings, G-type structures with high porosity and medium-to-large unit cells are promising for future device evaluations. This work is an idealized, single-component numerical study, without considering external Ar-air mixing, oxygen levels, thermal effects, manufacturing variations, or experimental validation. Therefore, the identified parameter space should be viewed as a hydrodynamic screening outcome rather than a definitive engineering design for shielding performance.
1. Introduction
Driven by the growing demand for lightweight, high-strength, and multifunctional metallic parts in aerospace, biomedical engineering, and related sectors, metal additive manufacturing has become increasingly important [1]. In open or semi-open forming setups that use arc or laser heat sources, highly reactive alloys such as Al-Zn-Mg-Cu [2] are highly sensitive to the stability of the local inert atmosphere. Without adequate shielding, defects such as porosity and cracking can occur, significantly degrading the mechanical properties of the finished components [3].
Current shielding concepts, including tent-style global shields [4], laminar-flow local shields [5], and asymmetrical local shielding nozzles [6], help reduce exposure to oxygen and hydrogen. However, these approaches often struggle with high gas consumption, uneven flow distribution, or edge entrainment issues [7]. Therefore, optimizing local shielding structures to achieve low-resistance gas transport and uniform coverage while using a limited argon supply has become a primary focus. In addition to experimental methods, computational fluid dynamics (CFD) has proven to be a valuable tool for designing shielding gas systems and analyzing local flow behavior [8,9].
Recently, triply periodic minimal surface (TPMS) structures have attracted growing interest due to their smooth, continuous surfaces, interconnected 3D channels, and high compatibility with additive manufacturing techniques [10,11,12]. These features make TPMS designs ideal for applications requiring a balance of flow capacity, uniform flow, and ease of manufacturing, such as biomedical scaffolds [13], fluid engineering components [14], and heat transfer devices [15]. Given their complex geometry and prominent curved surfaces, traditional machining techniques cannot fabricate TPMS structures precisely. Instead, they primarily rely on additive manufacturing methods such as laser powder bed fusion (LPBF) or wire arc additive manufacturing (WAAM) [16,17,18].
For example, gradient-porous scaffolds have been developed to meet the mechanical and permeability requirements of natural bone [19]. Gyroid-based ceramic structures have been shown to improve heat-transfer uniformity and reduce temperature fluctuations by 29% [20]. Additively manufactured TPMS structures also exhibit superior mechanical properties compared to traditional lattice structures [21]. Zhang et al. [22] used an LPBF-fabricated I-Graph-Wrapped Package-type TPMS structure to achieve low-frequency vibration isolation. Oh et al. [23] enhanced TPMS heat exchanger designs via additive manufacturing, incorporating boundary filters that reduced pressure drop by 85% and more than doubled heat transfer efficiency compared to standards. Lin et al. [24] constructed a three-channel heat exchanger with TPMS plates, improving heat transfer, stabilizing flow, and balancing flow distribution, resulting in a 31–35% pressure drop compared with solid structures.
Bobbert et al. [25] demonstrated that additively manufactured metallic TPMS porous structures can combine advantageous topology, mechanical strength, and transport properties. Recently, Gajetti et al. [26] studied the hydrodynamic behavior of Gyroid and Diamond TPMS structures in viscous-to-mildly inertial flow regimes. Nonetheless, research on TPMS structures for medium transport applications remains limited, particularly when using argon as the working fluid and designing for local shielding or flow-equalizing units. Notably, the combined effects of topology, porosity, unit-cell size, and wall thickness on gas permeability and outlet-flow uniformity remain incompletely understood.
Permeability is an important measure of a porous structure’s ability to transmit fluid, while outlet-flow uniformity indicates how consistently gas velocity is distributed across the exit plane. Both are closely linked to the geometric features of TPMS structures. Research on traditional porous media, such as lattices, honeycombs, and sintered porous materials, has demonstrated that factors such as pore size, porosity, variable-cross-section channels, and structural parameters significantly influence flow resistance and transport behavior [27,28]. These results suggest that a similar relationship between geometry and performance should exist for TPMS-based gas delivery structures. However, the underlying mechanisms may differ due to their periodic surfaces and complex three-dimensional connectivity.
In this study, Diamond (D), Gyroid (G), and Primitive (P) TPMS structures were selected as representative topologies. By developing three-dimensional fluid models, steady laminar argon flow was simulated within the explicit fluid domain. Equivalent permeability was obtained from the pressure-drop/flow-rate relationship. Outlet-flow uniformity was evaluated using a velocity uniformity index. In the intended application, the TPMS component acts as a porous flow-equalizing insert or outlet diffuser situated between an upstream argon plenum and the discharge plane of a local shielding device. The current numerical model only captures the internal argon flow through this porous insert and does not account for the external atmosphere or the downstream Ar-air mixing region. Consequently, this work aims to develop structure–transport relationships and a screening-level permeability-uniformity framework for TPMS inserts, rather than directly predicting oxygen levels or shielding effectiveness. External factors such as entrainment, Ar-air multicomponent diffusion, thermal convection, surface roughness, manufacturing deviations, and experimental validation are planned for future device-level analyses.
2. Materials and Methods
2.1. TPMS Structure Modeling
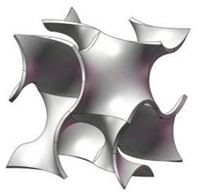
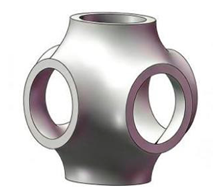
TPMS geometries are characterized by implicit trigonometric equations, whose continuous periodic surfaces create interconnected flow channels. Surface morphology and the network of periodic channels strongly influence gas transport and spatial redistribution within complex porous structures. Table 1 provides the implicit functions for the three TPMS structures.
Table 1.
Implicit functions and representative unit cells of three TPMS topologies.
The isosurface is given by φ(x, y, z) = C, the isosurface is given by φ(x, y, z) = C, where the level-set constant C was kept fixed in the present study. The dimensionless coordinates are defined as X = 2απx, Y = 2βπy, and Z = 2γπz, where α, β, and γ are constants related to the unit-cell sizes along each axis. This work employs sheet-based TPMS architectures. A solid region with finite thickness is created from the implicit TPMS function by defining two offset level sets around the mid-surface and keeping the region between them. The offset or threshold parameter is fine-tuned to achieve the desired wall thickness and porosity. The pore space is then extracted as the fluid domain with resolved pores. The actual porosity (φ) used in CFD analysis is calculated directly from the resulting geometry, rather than assumed from the nominal level-set value. It is defined as the ratio of void volume to the apparent total volume of the porous structure, as shown in Equation (1).
where Vvoid is the pore volume, Vsolid is the volume of the solid skeleton, and Vtotal is the apparent volume of the TPMS structure, including both pores and solid material. Because the same porosity can correspond to different channel shapes across TPMS topologies, the relative wall thickness (t/L) is also reported as a dimensionless geometric descriptor, where L represents unit-cell length, and t denotes wall thickness.
2.2. Numerical Simulation of Fluid Performance
2.2.1. Methods
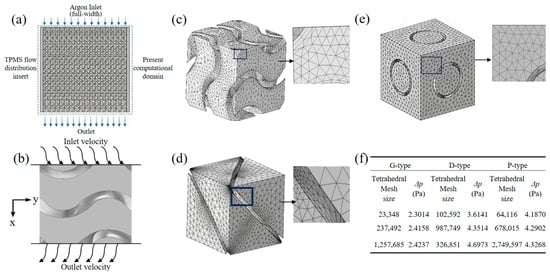
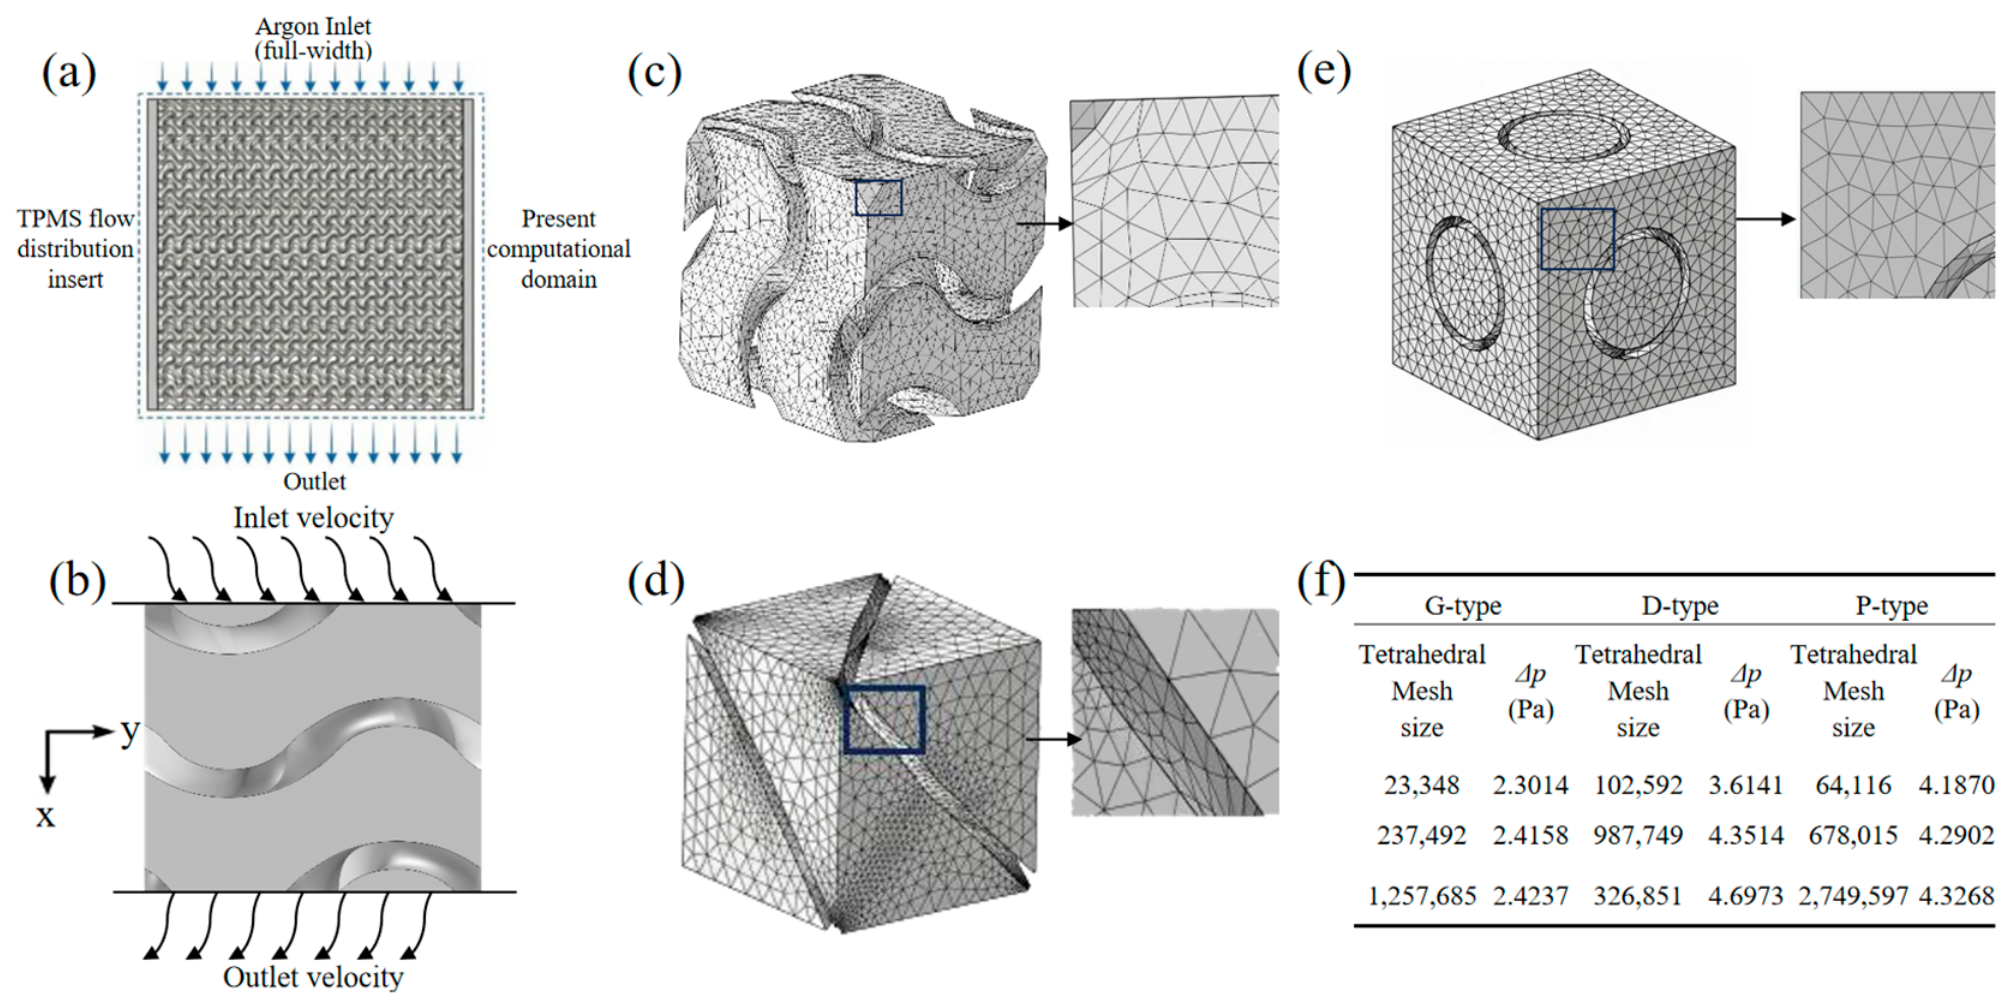
The device-level schematic in Figure 1a shows the intended position of the TPMS insert and clearly identifies the part that is included in the calculated domain. The TPMS investigated in this work is neither a standalone nozzle nor a simple porous plate, but rather serves as a porous flow-distribution insert positioned between the gas inlet and outlet within the device. After argon enters the TPMS region, it splits and redistributes through the periodic interconnected channels to improve the outlet velocity distribution.
Figure 1.
(a) Device-level schematic showing the intended position of TPMS insert; (b) boundary conditions used in flow model; (c–e) tetrahedral mesh of G-, D-, and P-type TPMS structures; (f) mesh-independence analysis.
The numerical model was developed using COMSOL 6.2. It solved single-phase, steady laminar Navier–Stokes equations directly within the pore-resolved fluid domain. The equivalent permeability was then derived from the pressure drop and flow rate. The working fluid was 99.99% pure argon at ambient conditions of 293 K and 1 atm. The dynamic viscosity of argon is μ = 2.2624 × 10⁻⁵ Pa·s, and its density is ρ = 1.673 kg/m3. An inlet velocity of 0.127 m/s was selected based on a practical shielding-gas flow rate of approximately 15 L/min at the device scale. This value was assigned to the open pore area and remained constant throughout the simulation.
This work employs idealized periodic TPMS unit-cell models. For the G-, D-, and P-type structures, the computational domain contains one complete periodic unit in each direction. The mean flow direction is defined as the +x direction, as schematically shown in Figure 1b from an example of a G-type structure. The inlet and outlet are located at the x = 0 and x = L planes, respectively. The inlet velocity was set perpendicular to the inlet plane. The apparent cross-sectional area perpendicular to the mean flow direction is defined as A = L2, and the height of the porous region is H = L. A zero-gauge pressure of 0 Pa is applied at the outlet. Periodic boundary conditions are applied on the lateral boundaries. The solid surfaces were treated using a no-slip boundary condition to represent the interaction between the fluid and the TPMS walls. These dimensions represent the geometric scale of an idealized periodic computational domain, not the overall physical size of an actual local shielding device. Meanwhile, the absolute values of pressure drop and permeability in this study should be regarded as idealized numerical results, because the relative trends, topological rankings, and uniformity comparisons are more robust. Future device-level simulations should include appropriately sized free-flow regions to reduce boundary-induced uncertainty.
To verify numerical reliability, we performed a mesh-independence analysis on the three TPMS structures with 60% porosity and a 1 mm unit-cell length. As shown in Figure 1c–f, the pressure drop increased with mesh refinement. When the mesh was refined from medium to fine, the pressure drop (ΔP) varied only slightly by approximately 0.04%, 0.10%, and 0.08% for the G-, D-, and P-type structures, respectively. This indicates that further mesh refinement has a limited influence on the computational results. Consequently, a medium-density mesh was used in subsequent simulations to optimize accuracy and computational efficiency. For the medium mesh, the average element quality of the tetrahedral mesh is approximately 0.6783, the minimum element quality is approximately 0.10–0.20, and the minimum element size is approximately 0.0187 mm. The steady-state solution uses a relative tolerance of 10−3. Convergence is achieved when the solver’s relative error estimate satisfies the specified tolerance and the flow-field variables no longer exhibit noticeable changes. Consistent solver settings and convergence criteria were applied to all cases.
2.2.2. Key Performance Metrics
To focus on how geometric structure affects transport behavior, the following assumptions were made. Argon was modeled as an incompressible Newtonian fluid; heat transfer, gravity, and wall roughness were ignored; the pore space was fully connected and gas-filled; and all solid walls adhered to the no-slip condition. The equivalent permeability was determined using Darcy’s law, as shown in Equation (2),
where K is the equivalent permeability (m2), H is the structure height (m), μ denotes the dynamic viscosity (Pa·s), Q stands for the volumetric flow rate (m3/s), A represents the whole cross-sectional area L·L (m2), v is the superficial gas velocity (m/s), which concerns the whole cross-sectional area, and ΔP is the pressure drop between the inlet and outlet (Pa). To calculate the Darcy superficial velocity, Q is first obtained by integrating the normal velocity over the open inlet boundary. Based on the total apparent cross-sectional area of the TPMS, A = L2, the Darcy superficial velocity is defined as v = Q/A.
To verify that the investigated configurations operate within the Darcy regime, the pore Reynolds number was evaluated for all simulation cases. Following the established literature [26,29,30,31], the pore Reynolds number is defined as:
where dh is the hydraulic diameter of the TPMS channels. The hydraulic diameter was calculated as , where Vf is the fluid volume, and Aw is the wetted surface area within the unit cell. The calculated Reynolds numbers for all configurations range from approximately 0.9 to 27.4, as summarized in Supplementary Table S1.
In addition, we examined the linearity of the pressure drop versus superficial velocity relationship by simulating multiple velocities (0.04, 0.08, 0.127, 0.17, and 0.22 m/s) for selected configurations spanning a large parameter space. As shown in Supplementary Figure S1, the pressure drop increases linearly with superficial velocity in most cases, confirming that Darcy’s law applies. However, for configurations with large unit-cell lengths, weak inertial effects appear when the unit-cell length reaches 5 mm. The deviations from Darcy’s law are relatively small for these extreme cases. Therefore, the permeability values reported herein are designated as “Darcy-equivalent permeabilities” in the present work. Since the inertial term may contribute to the total pressure drop, future work incorporating the full Forchheimer formulation may be warranted to accurately describe pressure-drop behavior at high flow rates or with very large cell sizes.
The study assessed gas-transport behavior using pressure drop and velocity-field morphology. Pressure drop indicates flow resistance and the energy required for gas delivery, while the velocity field shows primary flow paths, high-speed areas, and zones of low or stagnant flow. To evaluate permeability and flow uniformity, we analyzed the velocity distribution at the outlet plane and the internal velocity vectors.
Outlet-flow uniformity was assessed with the uniformity index (UI), as introduced by Li et al. [32]. This metric measures the variation between local and average velocity across a sampling plane, reflecting how effectively the porous component provides consistent gas coverage at the outlet. In the numerical post-processing, we did not pre-set a finite number of discrete sampling points. Instead, the area integral operator is used to statistically evaluate the velocity field over the entire outlet fluid cross-section. Equation (4) defines the outlet mean velocity.
The uniformity index (UI, ) is described by Equation (5) in the continuous area as
where Aout is the pore cross-sectional area of the outlet fluid, V is the magnitude of the local velocity vector at any position on the outlet plane, and is the mean velocity across the outlet plane. This method ensures that the entire outlet fluid region participates in the uniformity evaluation, avoiding the influence of the number and distribution of discrete sampling points on the results. The UI value ranges from 0 to 1. A higher value indicates a more uniform outlet velocity distribution, while a lower value suggests flow concentration in local low-resistance channels. This metric allows for quantitative comparison of gas-distribution performance across different topologies and geometric parameters.
3. Results and Discussion
3.1. Effects of Porosity and Unit-Cell Length on Permeability and Uniformity
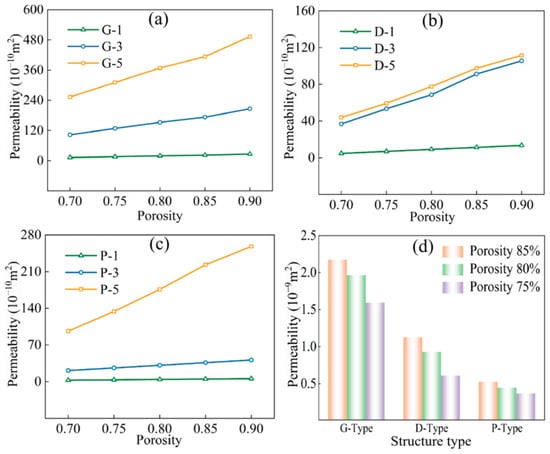
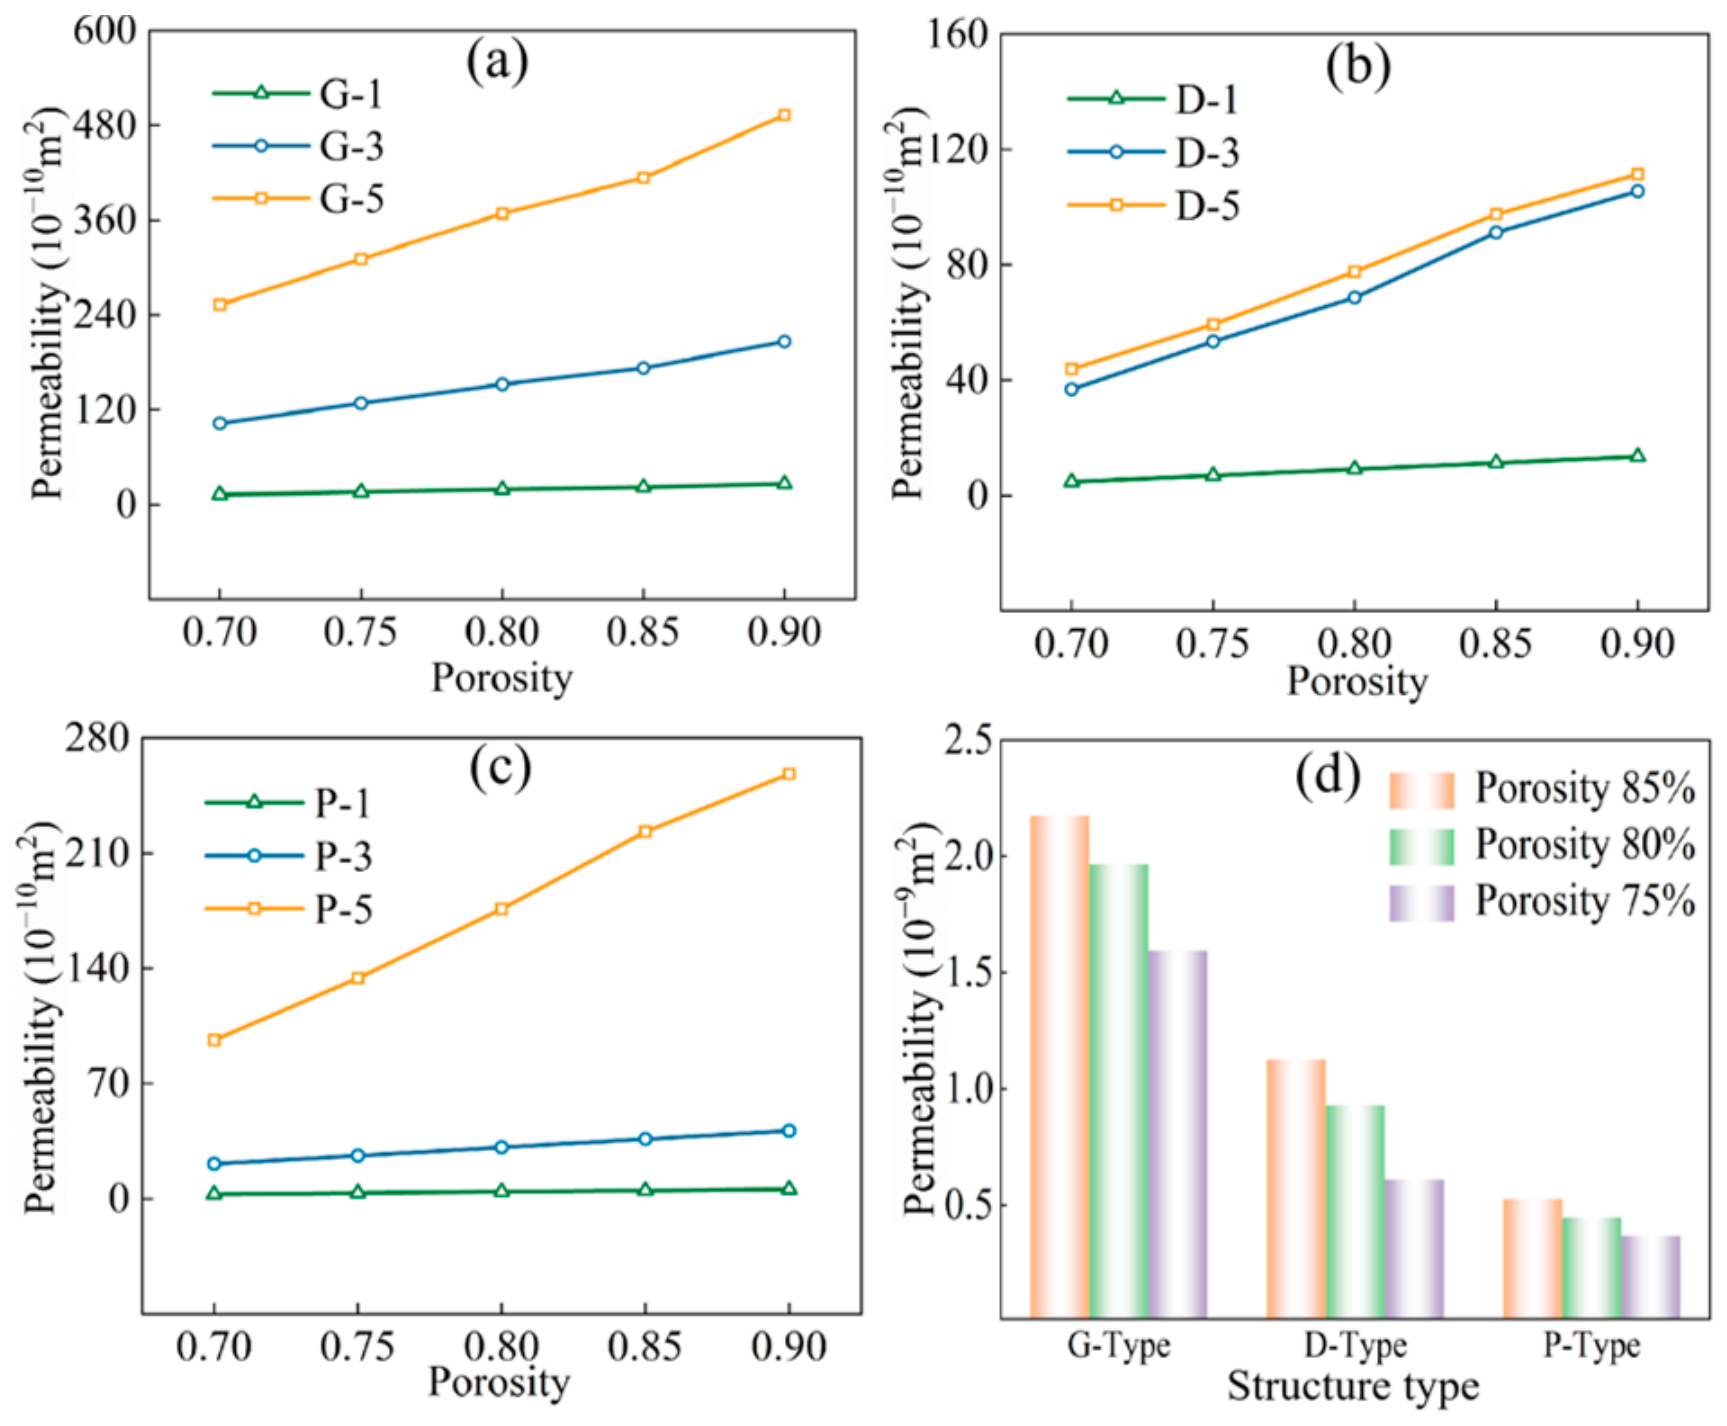
As demonstrated in Figure 2a–c, permeability in all three TPMS topologies increases with higher porosity and larger unit-cell lengths, with the unit-cell length having a particularly significant influence. At 85% porosity, increasing the unit-cell length from 1 mm to 5 mm boosted the permeability of G-, D-, and P-type structures by 1799.1%, 762.8%, and 4359.1%, respectively. These results imply that larger unit-cell lengths can substantially enhance gas transport. Figure 2d compares the three topologies at a 1 mm unit-cell length. When porosity decreases from 85% to 75%, permeability drops by approximately 26.8%, 38.9%, and 30.5% for G-, D-, and P-type structures, respectively. At 1 mm unit-cell length and 85% porosity, the permeabilities of D- and P-type structures are 48.1% and 77.0% lower than those of G-type. Overall, G-type structures exhibit superior permeability within the tested parameters.
Figure 2.
Effects of unit-cell length and porosity on permeability of three TPMS structures: (a–c) G-, D-, and P-type structures, respectively, where 1, 3, and 5 denote unit-cell length in millimeters; (d) comparison of permeability among three structures at a unit-cell length of 1 mm.
The permeability improvement with porosity can be attributed to increased effective flow space and reduced channel resistance. Increasing the unit-cell length further amplifies the channel-scale effect, causing the permeability curves for different cell lengths to separate more clearly. More importantly, the G-type structure contains continuous channels with relatively smooth transitions, which favor overall gas transport. In contrast, the D-type structure has a more complex channel network, where local contraction and branching introduce additional resistance. The P-type structure shows relatively low permeability at small cell length, but its permeability increases markedly under large cell length and high porosity. Therefore, TPMS permeability is governed by the combined effects of porosity, unit-cell length, and topology; porosity alone is insufficient as a design criterion. Upon experimental measurements, Santos et al. [33] studied the permeability of three TPMS structures within a porosity range of 50–80%, showing that the Darcy permeability ranged from 10−10 to 10−9 m2, with the topological ranking G > P > D. These findings were supported by the combined experimental and numerical investigation conducted by Castro et al. [34]. The consistent topological ranking and comparable order of magnitude of permeability provide qualitative and quantitative support for the present numerical results. This comparison serves as a literature-based consistency check rather than a direct validation, which still requires future experimental verification using argon.
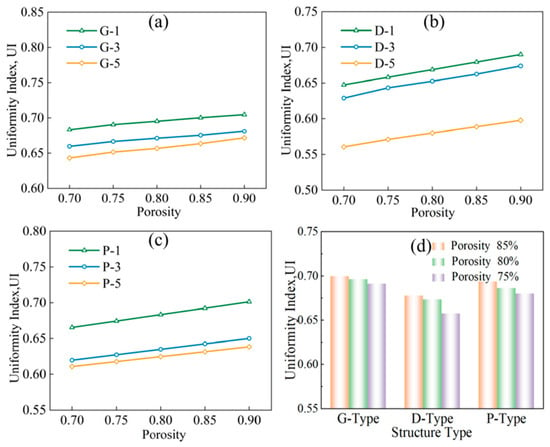
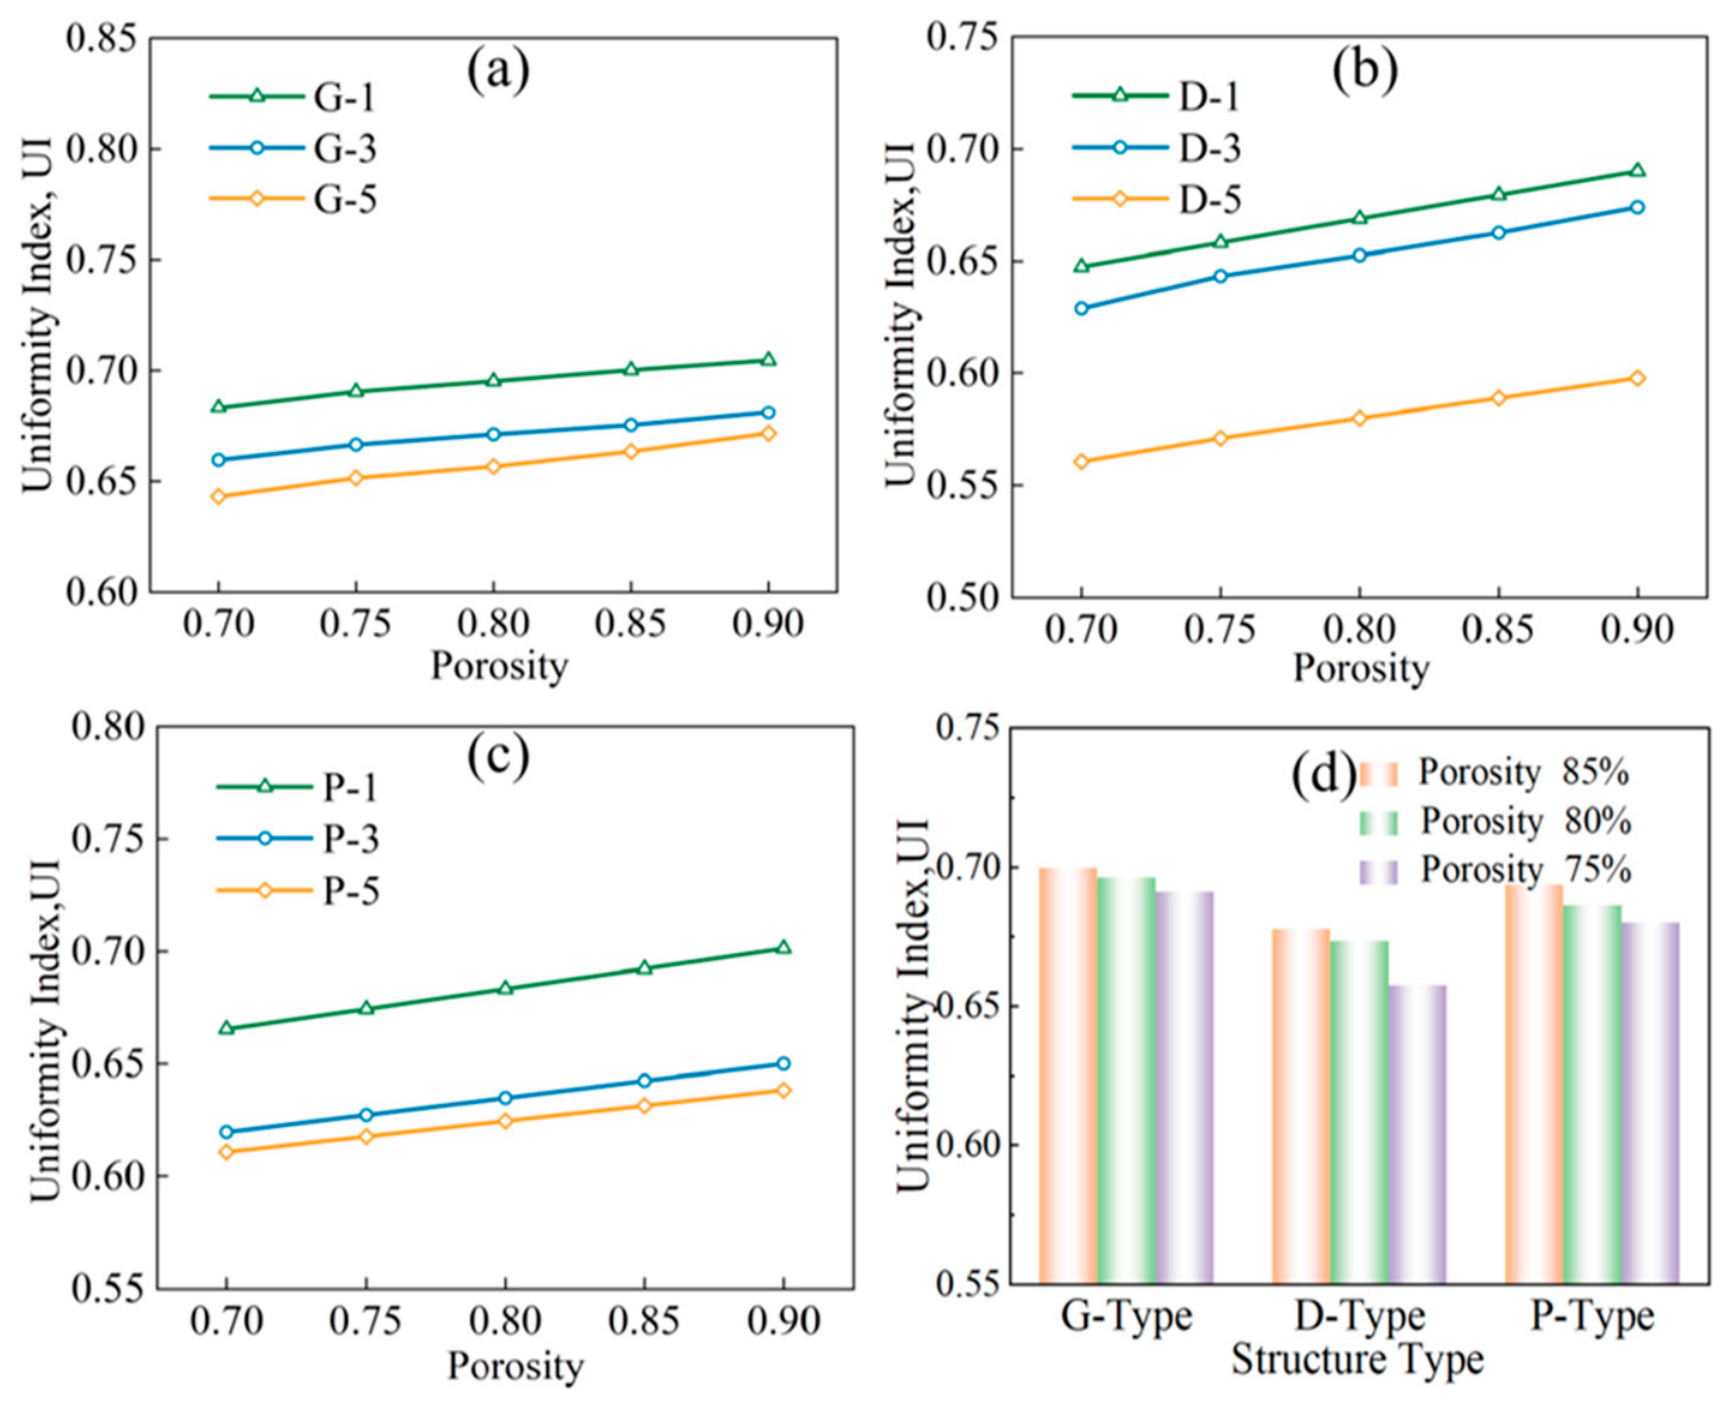
As depicted in Figure 3a–c, the uniformity index across all three TPMS structures increased only slightly with higher porosity, suggesting that porosity has a relatively stable but limited impact on outlet-flow uniformity. Conversely, the unit-cell length exerted a more significant influence. At 85% porosity, increasing the unit-cell length from 1 mm to 5 mm decreased the uniformity index of G-, D-, and P-type structures by 5.3%, 13.3%, and 7.2%, respectively. This indicates that a larger unit-cell length reduces the consistency of the outlet velocity field, with the D-type structure being most sensitive to scale changes. Figure 3d compares the effects of porosity at a fixed unit-cell length of 1 mm. When porosity went from 75% to 85%, the uniformity index increased only about 1.4%, 3.2%, and 2.7% for G-, D-, and P-type structures, respectively. At 85% porosity, the uniformity of D- and P-type structures was 3.0% and 1.1% lower than that of the G-type, respectively. Overall, the G-type structure demonstrated superior uniformity and stability within the tested porosity and unit-cell length ranges.
Figure 3.
Effects of unit-cell length and porosity on outlet-flow uniformity of three TPMS structures: (a–c) G-, D-, and P-type structures, respectively, where 1, 3, and 5 denote unit-cell length in millimeters; (d) comparison of outlet-flow uniformity among three structures at a unit-cell length of 1 mm.
The slight variation in uniformity with porosity suggests that increasing porosity expands local flow space without greatly changing the flow-rate distribution among outlet channels. By contrast, increasing the unit-cell length heightens differences at the channel scale, allowing gas to flow more easily through low-resistance paths, leading to high-speed main flows and stagnant or slower areas. This diminishes the spatial uniformity of outlet velocities. The similar position of the G-type uniformity curves across various unit-cell lengths indicates a more stable flow distribution. In contrast, the D-type structure shows a clearer decline in uniformity at larger unit-cell lengths, indicating that its complex channels are more prone to developing preferential flow paths. For the P-type structure, the overall decline in uniformity with increasing unit-cell length suggests that larger channels disrupt the balance among multiple pathways.
3.2. Effects of Wall Thickness on Permeability and Uniformity
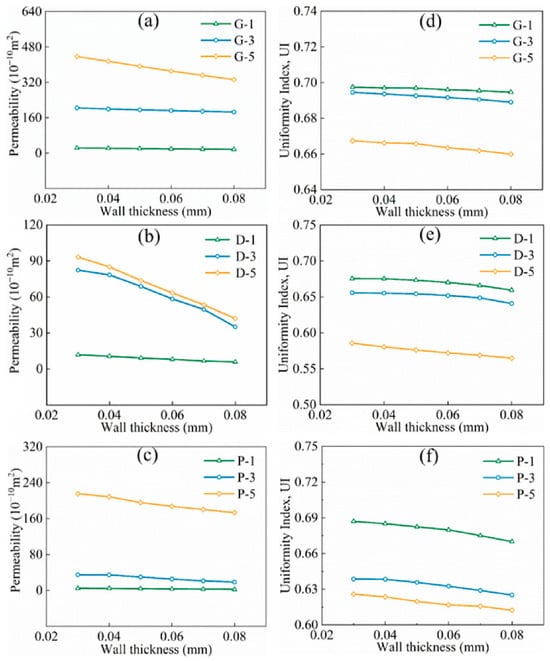
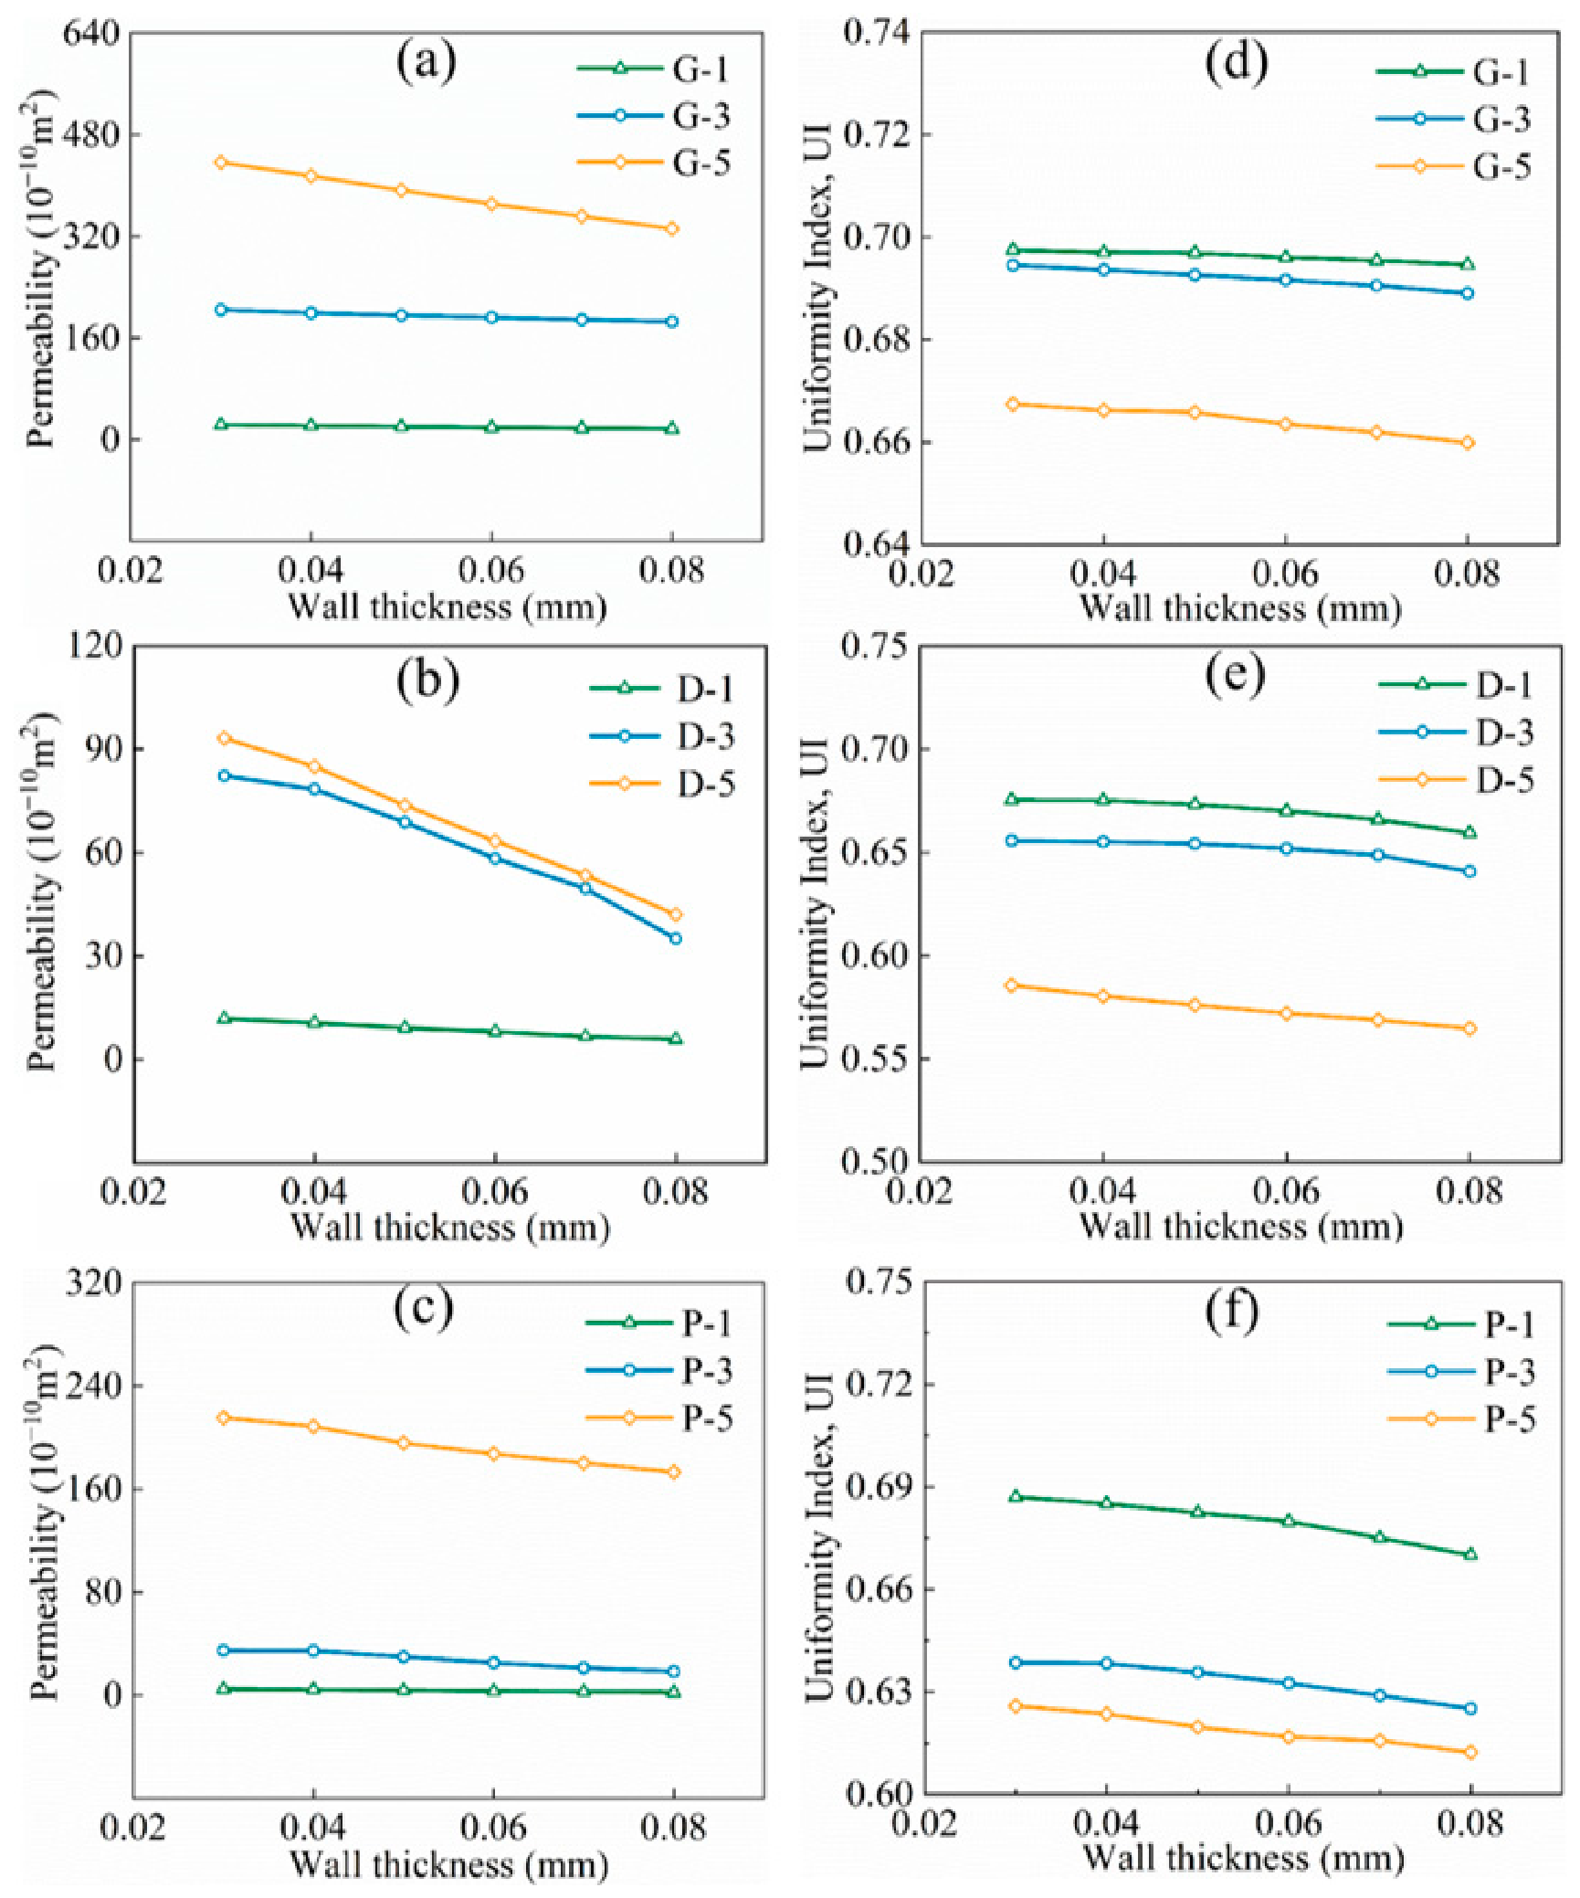
As shown in Figure 4a–f, increasing wall thickness decreased both permeability and uniformity index across all three TPMS structures, with permeability being more sensitive to changes in wall thickness. The maximum permeability reductions for the G-, D-, and P-type structures were about 24.4%, 57.3%, and 48.6%, respectively. The D-type structure showed the greatest decrease, indicating that its gas-transmission capability is most strongly influenced by wall thickness. Notably, the permeability of the D-type structure at a unit-cell length of 3 mm was similar to that at 5 mm, unlike the G- and P-type structures, which showed higher permeability at a 5 mm unit-cell length. This suggests a stronger relationship between unit-cell length and wall thickness in the D-type topology. The largest reductions in the uniformity index for the G-, D-, and P-type structures were approximately 1.1%, 3.4%, and 2.5%, respectively, implying that wall-thickness changes primarily affect flow resistance and have a more limited effect on the uniformity of the outlet velocity distribution.
Figure 4.
Effects of wall thickness on flow performance of three TPMS structures: (a–c) permeability of the G-, D-, and P-type structures, respectively; (d–f) outlet-flow uniformity index of G-, D-, and P-type structures, respectively.
Increasing wall thickness reduces the effective flow cross-section and increases local viscous resistance, which significantly lowers permeability. It also enhances resistance differences among channels, causing gas to favor low-resistance areas and slightly decreasing the uniformity index. The G-type structure exhibits smooth permeability and uniformity curves, suggesting that its continuous channels help buffer against resistance variations caused by wall-thickness changes. In contrast, the D-type structure, with its more complex flow path, is more sensitive to wall-thickness changes, especially in local contraction and branching areas, which affects flow capacity. The P-type structure can sustain high permeability even at larger unit-cell lengths, but the flow tends to concentrate locally at the outlet, making velocity distribution more uneven.
3.3. Synergistic Effects of Multiple Structural Factors
Supplementary Table S2 provides the correspondence among unit-cell length, wall thickness, porosity, pressure drop, permeability, and uniformity index for all cases included in the approximately 75% porosity series across the three TPMS topologies. The results show that porosity, unit-cell size, and wall thickness all affect how TPMS structures conduct gases. However, these factors are interconnected geometric variables. Relying on porosity alone to evaluate structures does not fully capture the actual flow behavior of TPMS porous media. For a given topology, porosity mainly depends on unit-cell size, wall thickness, and surface spatial distribution. Different topologies, even with the same porosity, can vary greatly in channel connectivity, tortuosity, local contraction or expansion, and wall-area distribution.
Table 2 presents the relationship between unit-cell length and wall thickness for three TPMS structures at about 75% porosity. As the unit-cell length increases from 1 mm to 6 mm, the wall thickness across all structures grows nearly proportionally, with porosity remaining relatively stable within 0.7502–0.7509. This suggests that, at nearly constant porosity, the key factor is not absolute wall thickness or unit-cell length alone, but the ratio of wall thickness to unit-cell length, defined as relative wall thickness (t/L). According to Table 2, these ratios are approximately 0.080 for G-, 0.066 for D-, and 0.054 for P-type structures. Different topologies thus require different relative wall thickness to maintain the same porosity. Compared with D- and P-type structures, the G-type topology requires walls about 21% and 48% thicker, respectively, at the same porosity. This variation reflects distinctions in surface-area density, solid-skeleton distribution, and channel openness among different TPMS topologies. Equal porosity does not guarantee identical channel shapes, flow resistance, or outlet-flow patterns.
Table 2.
Correspondence between unit-cell length and wall thickness for three TPMS topologies at a porosity of approximately 75%.
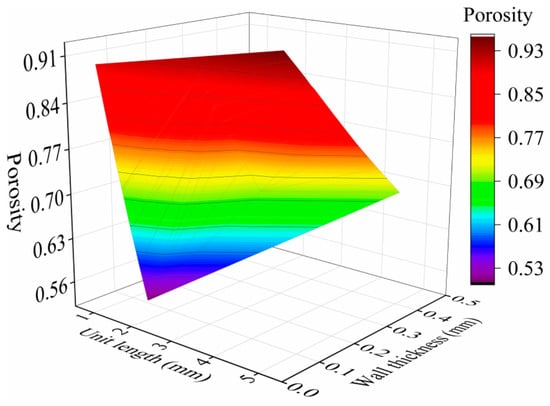
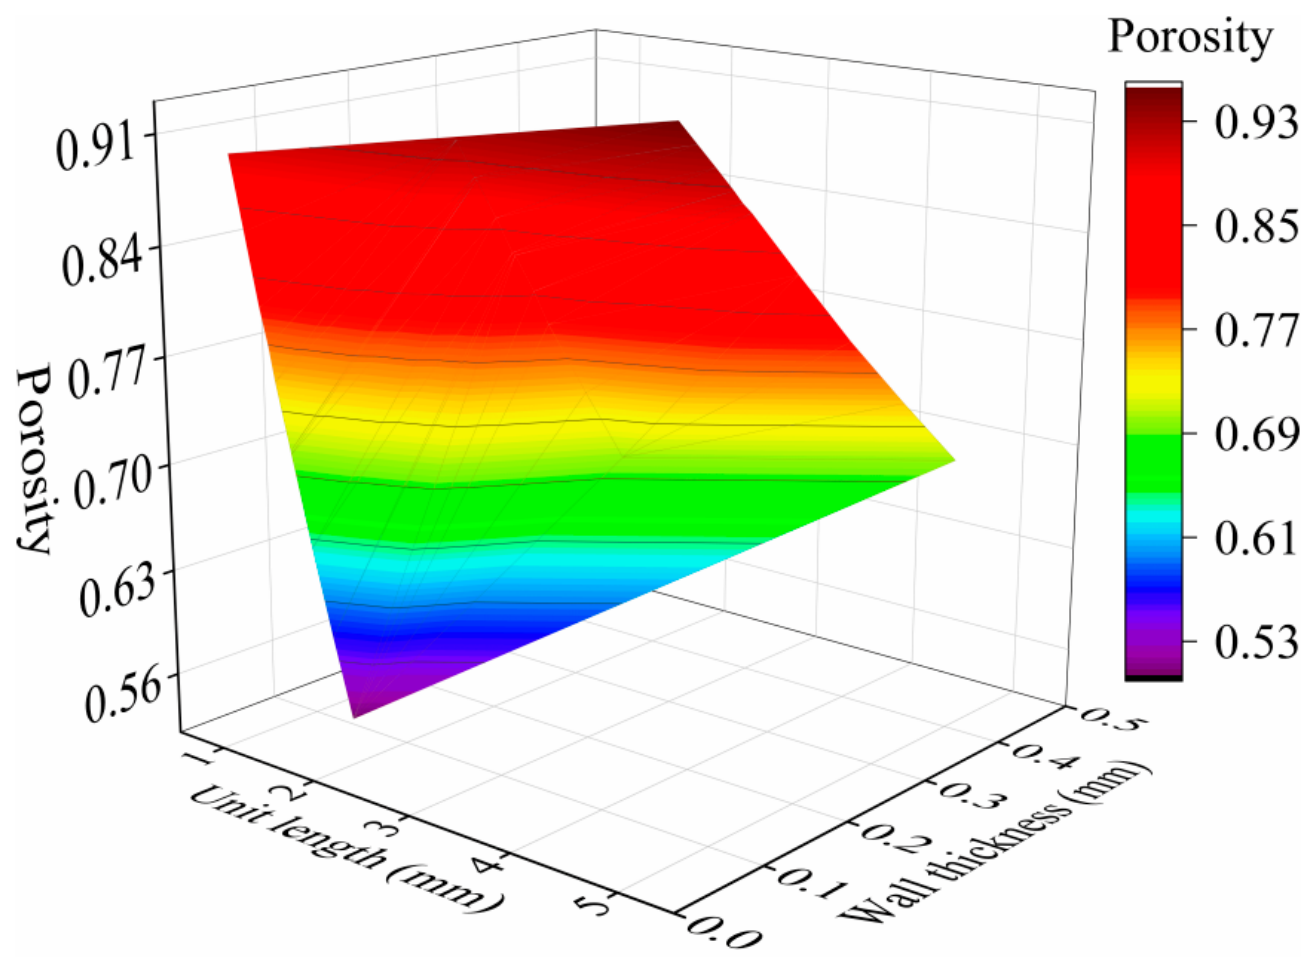
Figure 5 illustrates that among wall thickness, unit-cell length, and porosity, porosity is most influenced by changes in wall thickness. As wall thickness increases, porosity decreases substantially because the solid skeleton expands, compressing the pore space. Conversely, unit-cell length has less impact on porosity, especially when relative wall thickness varies only slightly. Therefore, TPMS designs should not solely aim to increase unit-cell length to boost porosity or decrease wall thickness to improve permeability. Instead, they should consider the combined effects of wall thickness, unit-cell length, and the distribution of topological surfaces. For gas-transport applications, reducing wall thickness can enhance porosity and reduce flow resistance, but excessively thin walls may be limited by LPBF fabrication constraints, structural stability, and surface roughness. Increasing the unit-cell length can also create larger open channels, but it may weaken the structure’s ability to distribute flow evenly.
Figure 5.
Variation in porosity under synergistic influence of multiple geometric parameters.
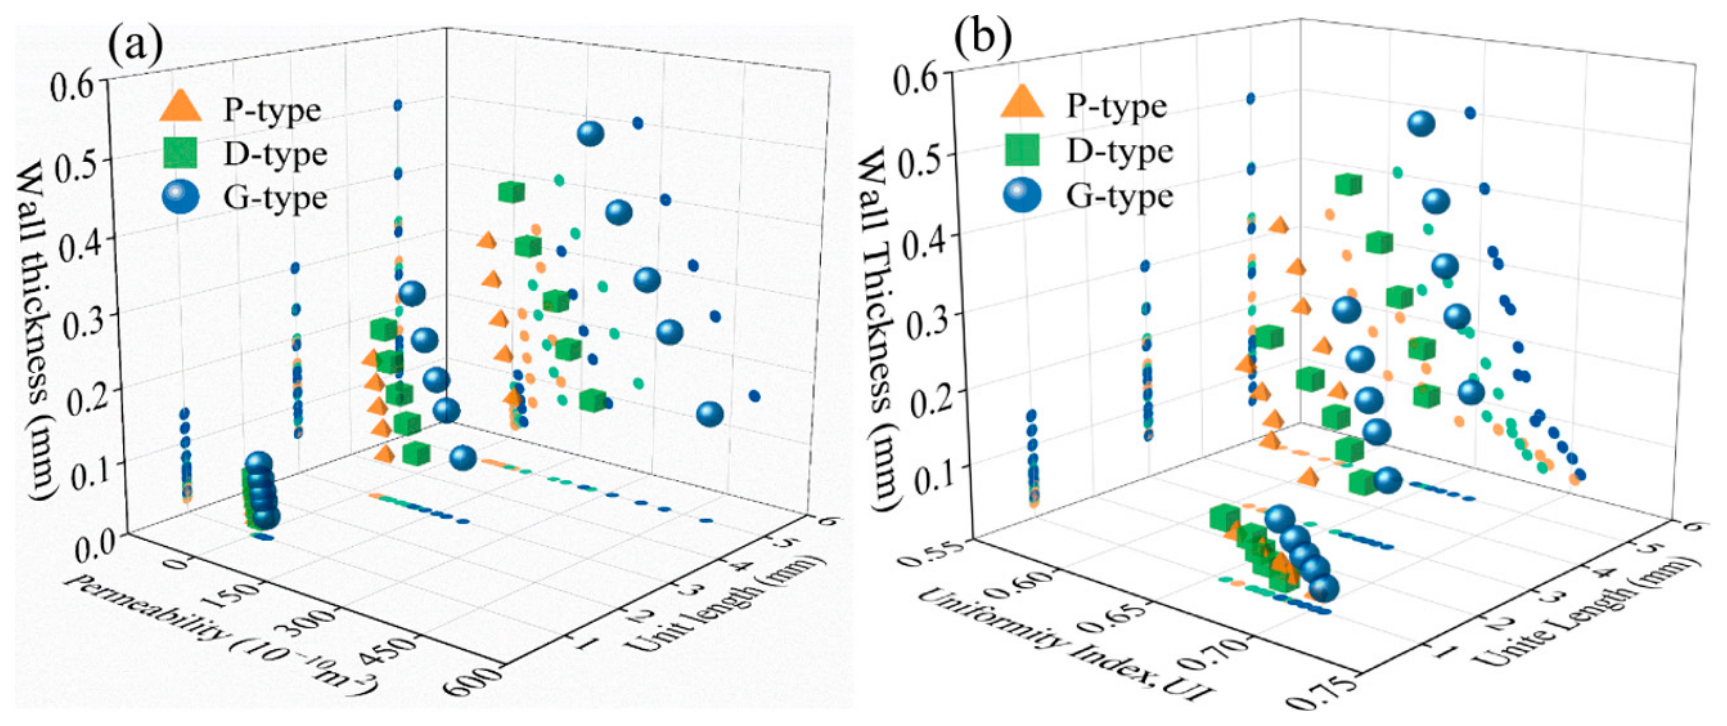
Figure 6 further illustrates how multiple parameters jointly influence flow performance. Compared to single-factor curves, the data points in Figure 6a exhibit a much wider spread along the permeability axis, indicating that permeability is highly responsive to specific combinations of geometric parameters. Generally, larger unit-cell lengths, smaller wall thicknesses, and higher porosity correlate with increased permeability due to a larger effective flow area, decreased local contraction losses, and reduced wall-induced viscous shear resistance. However, higher permeability does not automatically mean more uniform flow. Although the variation in the uniformity index in Figure 6b is less pronounced than that of permeability, notable differences persist across topologies and scale combinations. This suggests that outlet-flow uniformity is more affected by the flow-splitting mode, differences in inter-channel resistance, and the tendency to develop preferred flow paths. Specifically, as the unit-cell length increases, local low-resistance channels are more likely to govern gas transport, creating high-speed jets in some regions and stagnant or low-speed zones in others, thereby reducing the consistency of the outlet velocity distribution.
Figure 6.
Coupled effects of unit-cell length, wall thickness, and topology on TPMS flow performance: (a) permeability index; (b) uniformity index.
Table 2 and Figure 5 and Figure 6 collectively show that the fluid-transport efficiency of TPMS structures depends on the interplay of porosity, unit-cell length, wall thickness, and topology. Porosity mainly influences the overall available space for gas flow; unit-cell length affects channel size and the likelihood of forming preferred paths; wall thickness determines the effective flow area and local viscous resistance; and topology impacts channel tortuosity, branching patterns, and flow redistribution. Consequently, optimizing TPMS for shielding devices should focus on balancing these factors, rather than simply maximizing porosity or permeability. An ideal design integrates appropriate geometry to ensure ample gas throughput, stable flow distribution, and high outlet uniformity. The G-type structure shows greater robustness because its smooth, interconnected channels yield lower permeability and smaller uniformity fluctuations with parameter changes. In contrast, the D-type is more sensitive to the interaction between wall thickness and unit-cell length, whereas the P-type can attain high permeability under large-cell and high-porosity conditions but tends to cause outlet-velocity concentration. Hence, G-type TPMS is better suited as a local argon-shielding flow guide where both transport efficiency and flow uniformity are desired. However, because thicker walls are necessary to maintain the same porosity, the G-type structure may be less optimal for extreme lightweight applications.
3.4. Internal Flow-Field Characteristics
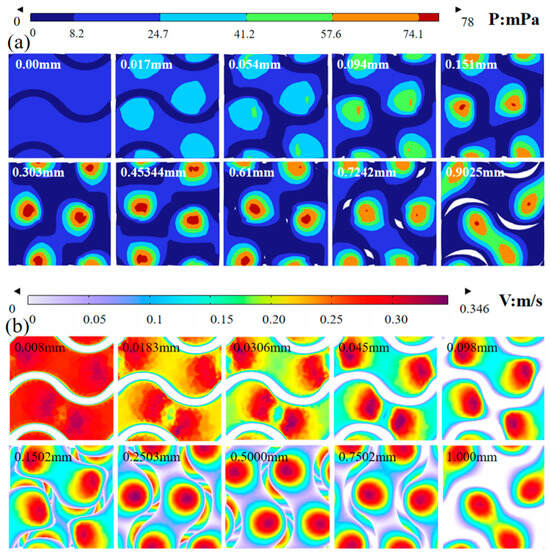
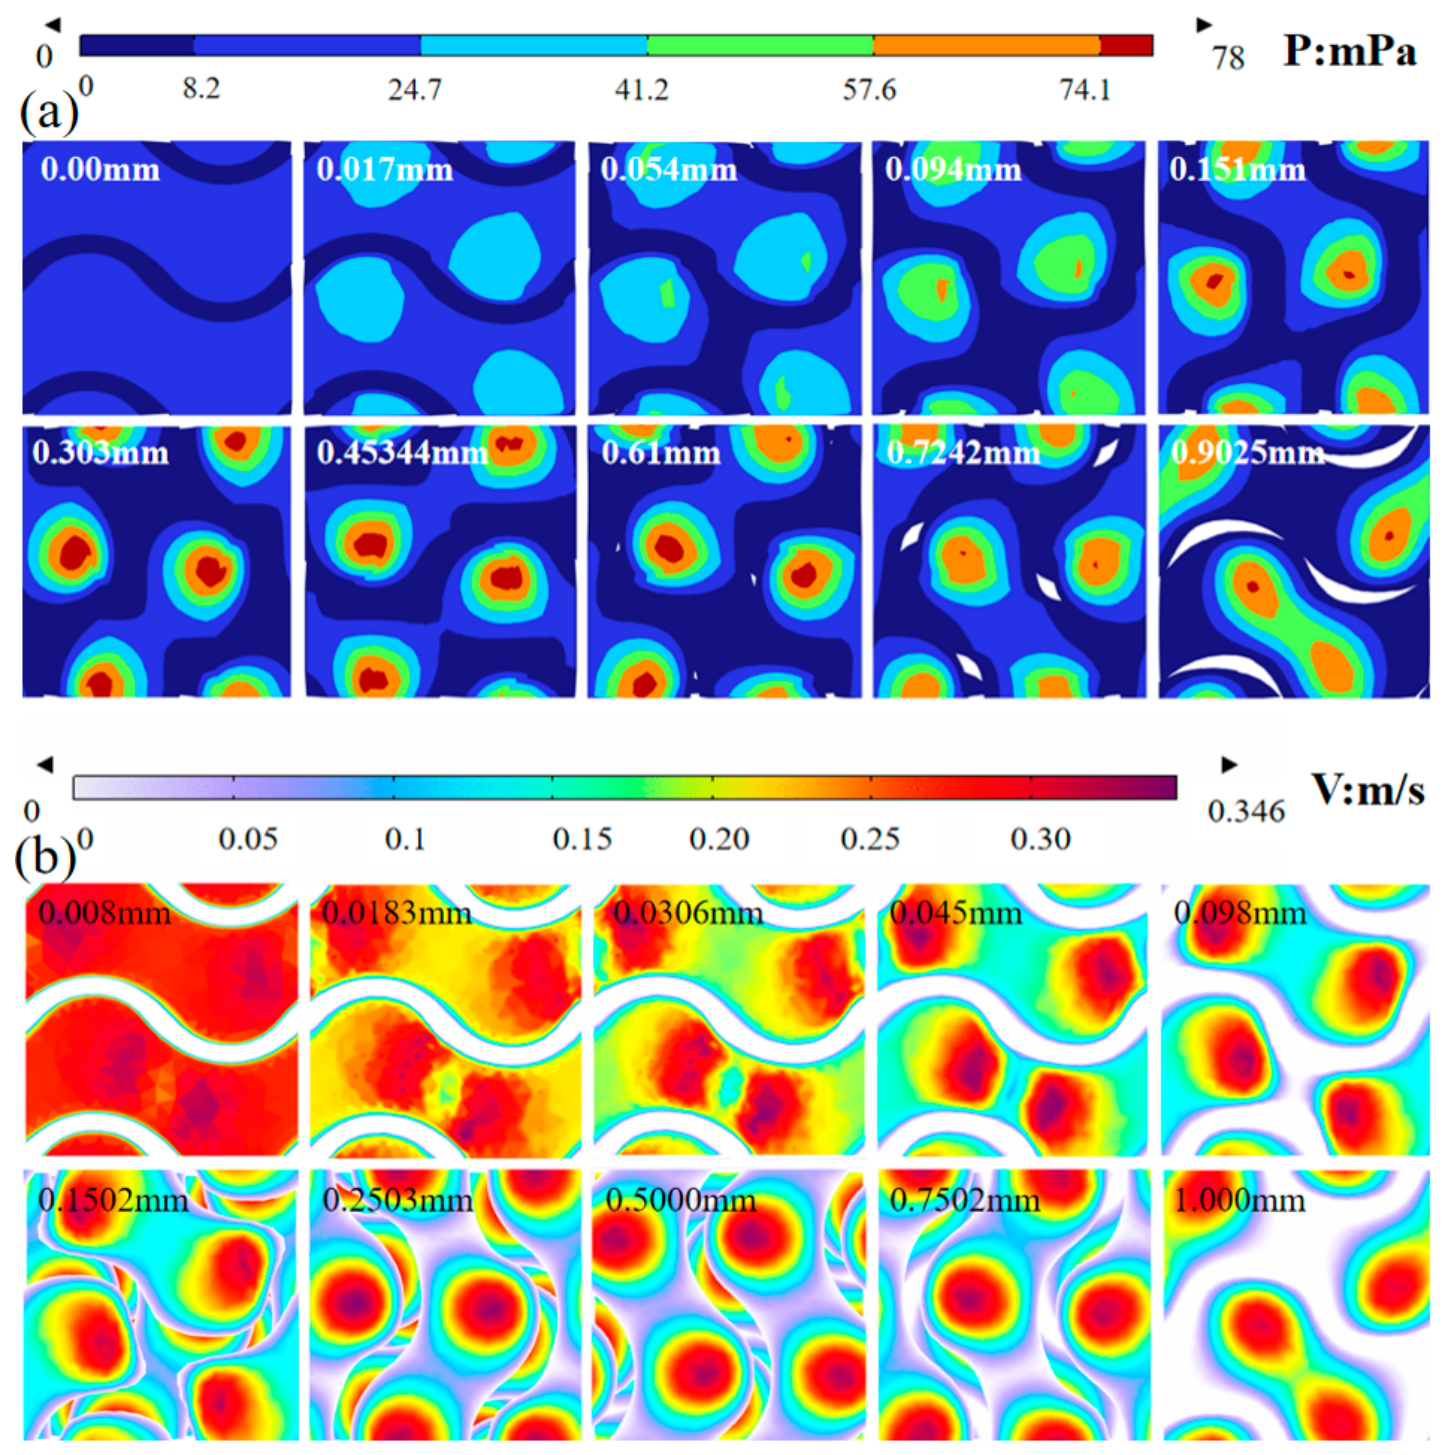
The G-type TPMS structure shows promising potential for local shielding applications. Figure 7 illustrates the internal pressure and velocity distributions within the G-type structure at 80% porosity and a 1 mm unit-cell length, with cross-sections along the flow path from 0 mm to 1.00 mm. As shown in Figure 7a, the static pressure decreases in the streamwise direction, consistent with the pressure loss required to overcome viscous shear and local form resistance within the TPMS channels. At the inlet, the flow must overcome both channel-contraction effects and wall-induced viscous resistance, which primarily cause the pressure drop. Because of the TPMS’s complex curved surfaces and periodic channels, the local pressure field shows pronounced spatial non-uniformity along the flow direction. High-pressure zones gradually form and tend to concentrate around regions with sharp curvature or channel contractions, becoming relatively pronounced near x = 0.3 mm. Subsequently, the location and extent of these high-pressure regions are redistributed and gradually become more dispersed. This indicates that the local pressure distribution does not simply change monotonically along the flow direction. Instead, it exhibits spatial evolution characteristics closely related to the geometric features of the TPMS. Within the periodic network, the pressure field exhibits a repeated spatial pattern associated with the periodic channel geometry. Near the outlet, residual local pressure nonuniformity corresponds to channels with different hydraulic resistance and is accompanied by local variations in outlet velocity.
Figure 7.
Evolution of internal flow field in G-type TPMS structure at different streamwise cross-sections: (a) pressure distribution; (b) velocity-magnitude distribution. Values marked in each panel indicate the distance of each section from the starting position in millimeters.
The velocity-field distribution in Figure 7b closely aligns with the pressure-field evolution. Flow velocity is higher at the inlet. As the fluid moves into the internal channels, high-speed zones form primarily along the main flow paths, while speeds near the curved walls remain low due to the no-slip boundary condition. As the flow progresses, the velocity field exhibits a consistent periodic pattern, indicating that the unit-cell structure effectively governs the gas flow and the distribution of local resistance.
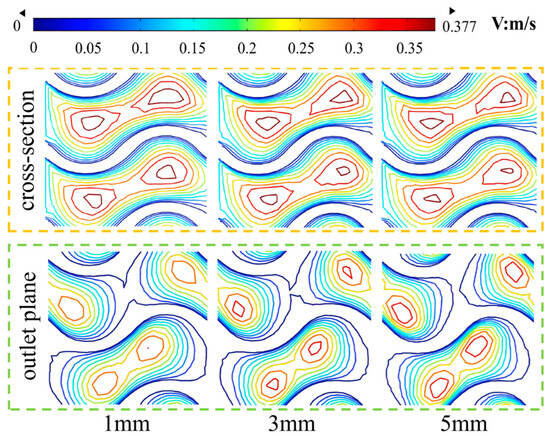
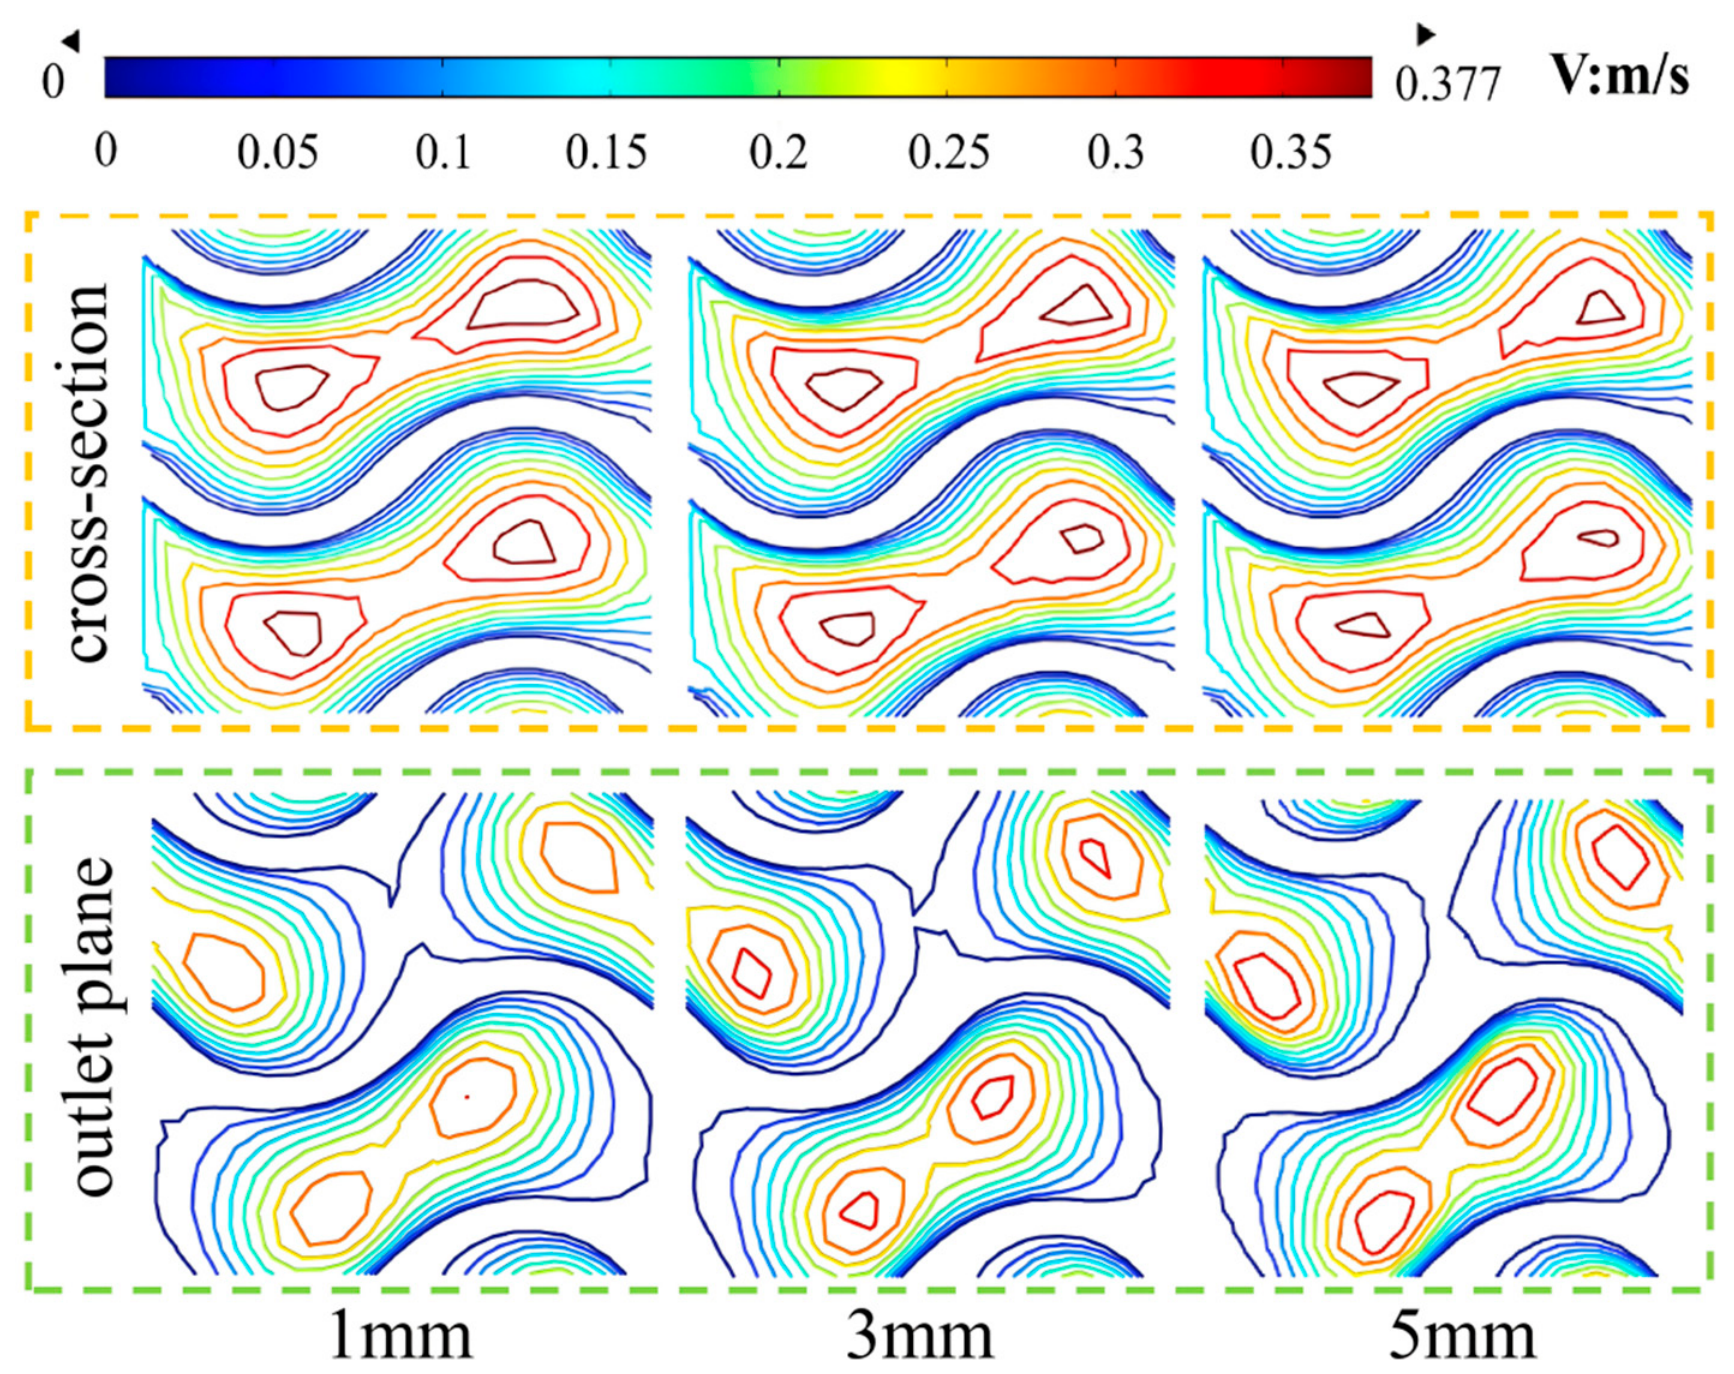
Figure 8 shows the velocity contours on the transverse cross-section and outlet plane of G-type TPMS structures with various unit-cell lengths. As the unit-cell length increases, the velocity pattern on the transverse cross-section remains relatively stable, suggesting that the internal flow within the main channel is minimally affected by changes in cell size. However, at the outlet plane, the velocity distribution becomes more focused as the unit-cell length increases. The number and size of high-speed regions increase, and the velocity differences across areas become more distinct. This is because different unit-cell sizes create varied channel geometries and wall-thickness combinations, affecting local resistance and directing flow toward low-resistance paths. Smaller, more uniform cells promote a more even distribution of flow among multiple channels, leading to a more consistent outlet flow.
Figure 8.
Velocity contours on transverse cross-section and outlet plane of G-type structure at different unit-cell lengths.
3.5. Determination of the TPMS Parameter Window
Excessively low permeability results in high pressure drops and impedes gas delivery, making it difficult to cover the target area quickly. Conversely, too high permeability can cause gas to concentrate along low-resistance pathways, leading to high-velocity jets and edge entrainment that compromise the shielding layer’s stability. Therefore, the optimal TPMS flow-equalizing structure should balance two key factors, providing sufficient argon flow and maintaining a uniform outlet velocity.
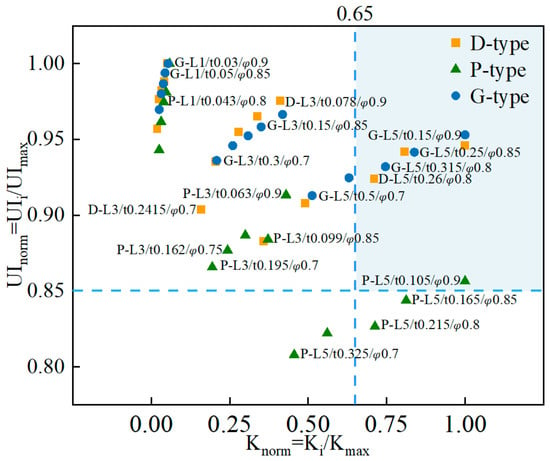
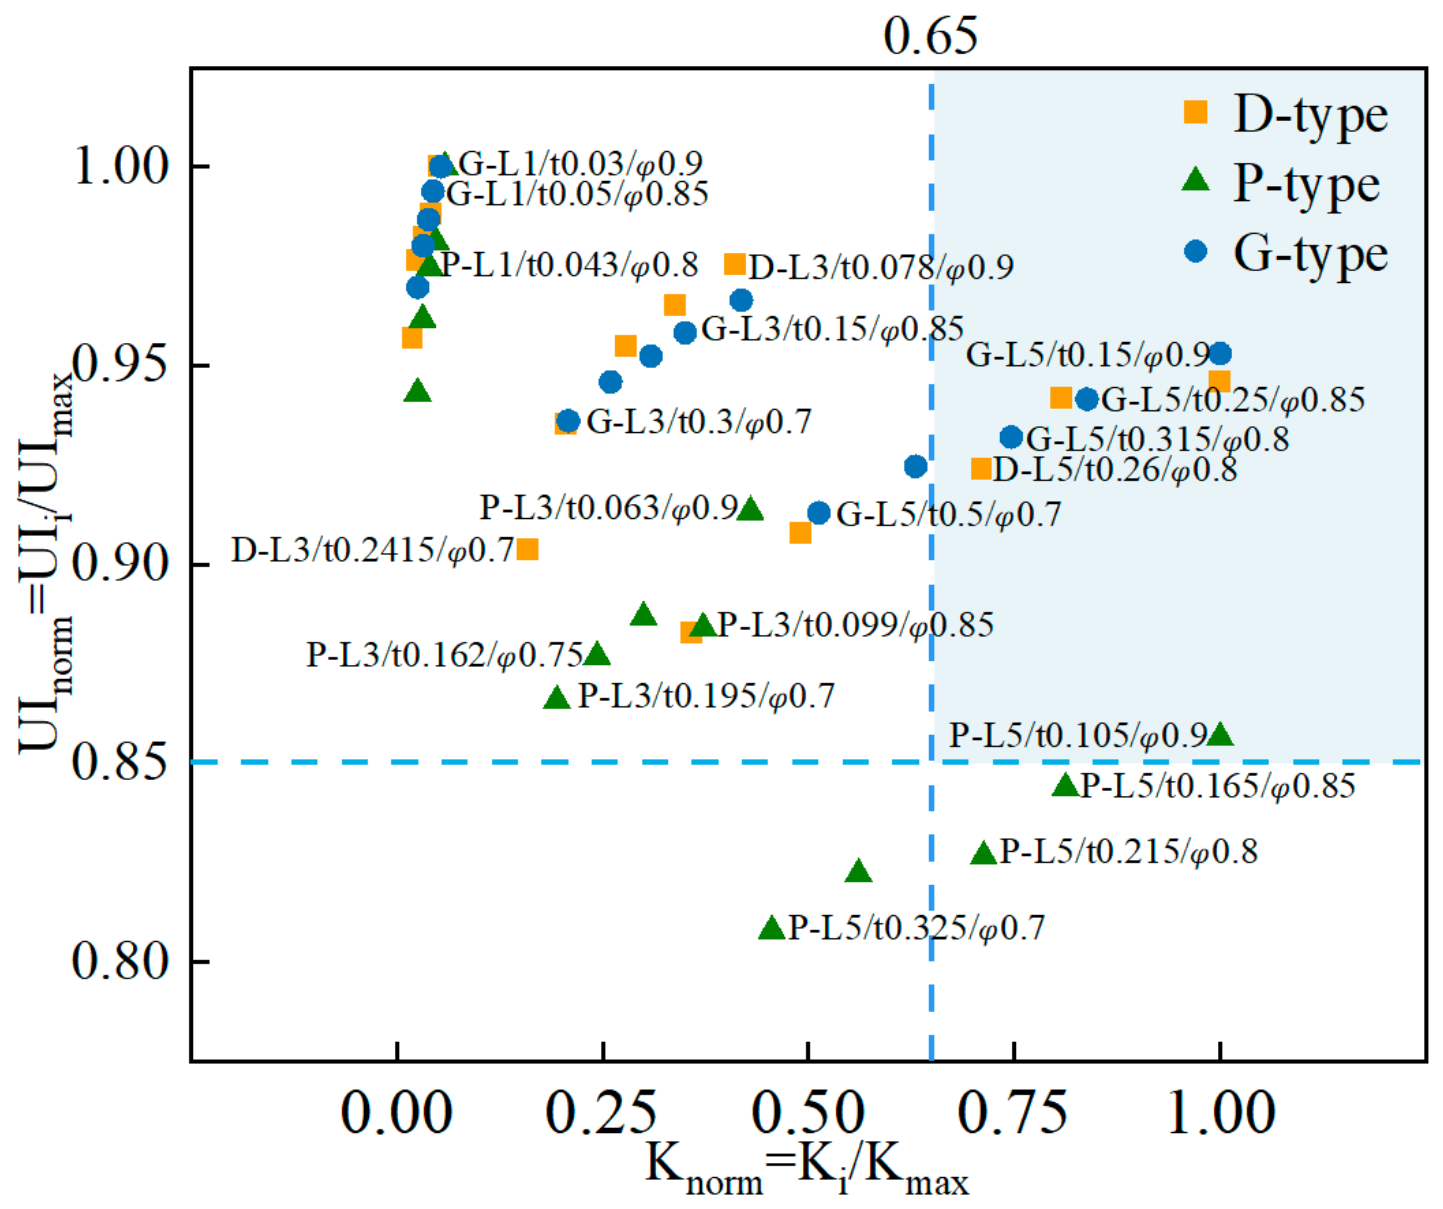
Following this design approach, permeability and outlet uniformity were normalized to develop a standardized K-UI scatter plot and a design-region criterion, illustrated in Figure 9. The horizontal axis displays the normalized permeability, Knorm = Ki/Kmax, indicating the relative gas-transmission ability of each parameter set. The vertical axis shows the normalized uniformity index, UInorm = UIi/UImax, reflecting how closely the outlet-flow field approaches the most uniform state. Unlike separate assessments of permeability or uniformity, the K-UI map simultaneously evaluates both the ease of gas passage through the structure and the uniformity of gas distribution at the outlet. This method more effectively meets the comprehensive needs of local shielding devices, which demand low flow resistance, high stability, and uniform coverage. In this study, the performance parameter (S) was defined as S = (Knorm × UInorm)1/2, and the optimal design space was characterized by Knorm ≥ 0.65 and UInorm ≥ 0.85. Designs within this region are preferred because they exhibit high permeability alongside good outlet-flow uniformity. Narrower selection windows can be identified for more targeted design objectives.
Figure 9.
Normalized K-UI scatter plot and design-region criterion.
Figure 9 demonstrates that different TPMS topologies and parameter configurations occupy distinct regions within the K-UI performance space. Structures with smaller unit-cell lengths generally display high UInorm but low Knorm, indicating strong flow equalization yet limited gas throughput due to smaller channels and increased wall resistance. In contrast, larger unit-cell structures tend to have much higher Knorm, though their UInorm often decreases, reflecting improved gas transmission but more channel preferences and concentrated outlet velocities. Typically, higher porosity architectures achieve a greater Knorm, while improvements in UInorm are modest, implying that porosity primarily affects throughput rather than outlet uniformity. Increasing wall thickness usually reduces Knorm and slightly lowers UInorm, as thicker walls constrict flow channels and increase resistance differences.
The normalized K-UI map is retained as a comparative screening tool rather than as a direct measure of shielding effectiveness. High permeability reduces internal hydraulic resistance, and high UI indicates a more evenly distributed outlet velocity field. These two quantities describe different aspects of the internal flow and should be interpreted jointly. Within the numerical design space examined here, G-type structures occupy the most favorable portion of the K-UI map because they combine relatively high gas throughput capacity with comparatively uniform outlet flow. High-porosity G-type configurations with medium-to-large unit cell lengths, which are approximately 3–5 mm in the present model, are therefore identified as numerically favorable candidates for subsequent device-level evaluation. Its smooth, continuous surfaces and interconnected three-dimensional channels help minimize local contraction losses and enable flow redistribution through multiple paths, preventing excessive velocity peaks at outlets. The D-type structure can also achieve high Knorm values when porosity and cell size are large, but it is more sensitive to uniformity and wall thickness, resulting in a narrower viable parameter range and a less robust design. The P-type structure shows a notable increase in permeability with larger unit-cell length, although some combinations have UInorm values near or below the recommended threshold. This suggests that its large-channel design is more likely to create local high-speed regions and is less capable of maintaining a stable shielding layer. Recent research on hydrodynamics and mass transfer indicates that differences in TPMS topologies depend not only on pore size but also on factors such as tortuosity, the flow-splitting behavior of channel subunits, and pressure loss in low-inertia regions [26].
For local argon shielding, higher permeability does not always mean better protection, as strong preferential channels can lead to local impingement and edge entrainment. Instead, moderate flow resistance combined with more uniform outlet flow helps establish a stable protective layer. This indicates that maintaining a low-oxygen laminar zone is more important than simply increasing the gas flow rate through the shielding nozzle [9]. Supplementary Table S3 provides recommended structural parameters for the considered TPMS topologies, including cell features, permeability, and uniformity index. Although a G-type TPMS structure with 85% porosity, a unit size of 5 mm, and a wall thickness of 0.25 mm is recommended for local shielding devices, this parameter region is not a manufacturing-qualified or experimentally validated shielding design. In particular, the nominal wall thickness must be selected according to the alloy, LPBF process window, dimensional accuracy, surface roughness, power-removal requirements, and mechanical integrity.
Published LPBF work demonstrates that nominal thin TPMS sheets can be fabricated under selected process conditions, but also shows pronounced sensitivity of mechanical response to sheet thickness and scan strategy. Based on recent literature on LPBF of metallic TPMS structures, the generally reliably printable wall thickness is approximately 130–152 μm depending on the material and machine [16,17]. Wall thicknesses below 0.25 mm pose significant challenges for slicing accuracy, layer integrity, and dimensional accuracy. Surface roughness, inherent to additively manufactured components, may also increase flow resistance beyond values predicted by the idealized smooth-wall model. Furthermore, structural requirements such as stiffness, strength, and fatigue resistance impose additional constraints on minimum wall thickness [17]. Therefore, the 0.25 mm wall thickness should be regarded as a numerical candidate derived from the idealized model, rather than a definitive manufacturing prescription. Practical implementation should involve iterative design considering specific machine capabilities, material properties, and structural requirements. Furthermore, the present model does not resolve the external Ar-air mixing layer. Consequently, outlet uniformity should be treated as a hydrodynamic precursor metric that may favor shielding-gas distribution, not as proof of low oxygen concentration or suppression of edge entrainment.
4. Conclusions
This study numerically examined pore-resolved single-component argon transport through D-, G-, and P-type TPMS structures and evaluated the combined effects of topology, porosity, unit-cell length, and wall thickness on hydraulic resistance and outlet-flow uniformity. The principal conclusions are as follows:
- (1)
- Increasing porosity increases the available flow area and decreases hydraulic resistance, whereas its influence on outlet-flow uniformity is comparatively modest. Increasing unit-cell length notably enhances permeability but promotes preferential pathways, causing decreases of 5.3%, 13.3%, and 7.2% in uniformity for the G-, D-, and P-type structures. Increasing wall thickness constricts the effective flow section and raises local viscous resistance. These trends should be interpreted with recognition that porosity, wall thickness, and unit-cell size are geometrically coupled rather than independent.
- (2)
- At comparable porosity, the three TPMS topologies require different relative wall thickness and exhibit different channel connectivity, tortuosity, branching, and local contraction behavior. The G-type structure provides the most favorable compromise between throughput and outlet-flow uniformity within the investigated numerical design space and is comparatively less sensitive to geometric variation than the D- and P-type topologies.
- (3)
- A combined permeability-uniformity framework was used to rank the simulated configurations. High-porosity G-type TPMS structures with medium-to-large unit cells were identified as numerically favorable candidates for further local argon delivery studies. This result is a screening-level hydrodynamic conclusion and should not be interpreted as a fully established engineering design.
- (4)
- The present work is an idealized numerical study of internal single-component argon flow. External Ar-air mixing, oxygen concentration, thermal disturbance, as-built surface roughness, manufacturing deviations, structural qualification, and experimental validation were not included. Future work should therefore couple the TPMS insert with an external multicomponent shielding domain and experimentally validate pressure drop, velocity distribution, and oxygen concentration.
Supplementary Materials
The following supporting information can be downloaded at: https://www.mdpi.com/article/10.3390/applmech7040080/s1, Figure S1: Correlations between superficial velocity (v) and pressure drop (ΔP) under increasing unit-cell lengths: (a–c) G-, D-, and P-type structures in sequence; Table S1: Pore Reynolds numbers and Darcy regime verification; Table S2: Correspondence among unit-cell length, wall thickness, relative wall thickness, porosity, pressure drop, permeability, and uniformity index for three TPMS topologies at a porosity of approximately 75%; Table S3: Recommended structural parameters for TPMS topologies.
Author Contributions
Conceptualization, J.C. and J.G.; methodology, J.M. and J.Z.; software, F.Z. and Z.L.; validation, F.Z. and Y.S.; formal analysis, J.C. and J.Z.; investigation, J.C. and J.M.; resources, J.G.; data curation, J.Z. and Z.L.; writing—original draft preparation, J.C. and J.M.; writing—review and editing, J.G.; visualization, Y.S.; supervision, J.G.; project administration, S.W.; funding acquisition, J.G. and S.W. All authors have read and agreed to the published version of the manuscript.
Funding
This research was funded by the Central Government Guided Local Science and Technology Development Fund Project, grant number 246Z1026G.
Institutional Review Board Statement
Not applicable.
Informed Consent Statement
Not applicable.
Data Availability Statement
The original contributions presented in this study are included in the article. Further inquiries can be directed to the corresponding author.
Conflicts of Interest
Author Shanshan Wang was employed by the company China MCC22 Group Corporation Ltd. The remaining authors declare that the research was conducted in the absence of any commercial or financial relationships that could be construed as a potential conflict of interest.
References
- He, K.; Gu, J.; Wang, Y.; Wang, H.; Li, W.; Xu, Z.; Zheng, C.; Ding, J.; Wang, X.; Wang, S. Achieving High Strength and Super Isotropy via Multiphase Microstructural Engineering and Grain Refinement in Wire Arc Additively Manufactured Al-Cu-Mg Alloy. Mater. Sci. Eng. A 2026, 971, 150524. [Google Scholar] [CrossRef] [Scilit]
- Liu, Y.; Guo, F.; Li, J.; Liu, K.; Wang, J.; Okulov, A.; Sonar, T. Research Progress on Wire Arc Additive Manufactured Al-Zn-Mg-Cu Alloys: Metallurgical Defects, Refining Grains, Enhancing Mechanical Properties. Mater. Des. 2025, 253, 114005. [Google Scholar] [CrossRef] [Scilit]
- Sous, F.; Herrig, T.; Bergs, T.; Karges, F.; Feiling, N.; Zeis, M. Electrochemical Defect Analysis of Additive Manufactured Components. J. Eng. Gas Turbines Power 2022, 144, 011001. [Google Scholar] [CrossRef] [Scilit]
- Zhou, S.; Zhang, J.; Wang, J.; Yang, G.; Wu, K.; Qin, L. Effect of Oxygen Levels in Tent Shielding Atmosphere on Microstructural and Mechanical Properties of Ti-6Al-4V Fabricated by Wire Arc Additive Manufacturing. J. Mater. Eng. Perform. 2022, 31, 5269–5278. [Google Scholar] [CrossRef] [Scilit]
- Ding, J.; Colegrove, P.; Martina, F.; Williams, S.; Wiktorowicz, R.; Palt, M.R. Development of a Laminar Flow Local Shielding Device for Wire+Arc Additive Manufacture. J. Mater. Process. Technol. 2015, 226, 99–105. [Google Scholar] [CrossRef] [Scilit]
- Ruiz, J.E.; Arrizubieta, J.I.; Lamikiz, A.; Ostolaza, M. Non-Symmetrical Design of Coaxial Nozzle for Minimal Gas Consumption on L-DED Process for Ti6Al4V Reactive Alloy. J. Manuf. Process. 2022, 78, 218–230. [Google Scholar] [CrossRef] [Scilit]
- Wang, L.; Chen, J.; Zhang, S.; Wu, C. Numerical Simulation of Coupled Arc-Droplet-Weld Pool Behaviors During Compound Magnetic Field Assisted Gas Metal Arc Welding. AIP Adv. 2021, 11, 065221. [Google Scholar] [CrossRef] [Scilit]
- Bernauer, C.; Meinzinger, L.; Zapata, A.; Zhao, X.F.; Baehr, S.; Zaeh, M.F. Design and Investigation of a Novel Local Shielding Gas Concept for Laser Metal Deposition with Coaxial Wire Feeding. Appl. Sci. 2023, 13, 5121. [Google Scholar] [CrossRef] [Scilit]
- Zhang, J.; Su, B.; Wang, H.; Shi, T.; Cao, Y. Development of a Coaxial Local Shielding Device for Annular Laser Metal Deposition of Ti6Al4V Reactive Alloy. Opt. Laser Technol. 2025, 180, 111491. [Google Scholar] [CrossRef] [Scilit]
- Yang, G.H.; Li, J.R.; Chi, Z.P.; Wang, Q.H. Design, Flow Characteristics and Thermal Performance Analysis of TPMS-Based Heat Exchangers with SC2-FCC Arrangement. Int. Commun. Heat Mass Transf. 2025, 168, 109459. [Google Scholar] [CrossRef] [Scilit]
- Si, T.; Sun, K.; Zhang, H.; Wang, Q.; Cheng, Z. Lattice-Scale Topology Optimization of TPMS Structure for Heat Transfer. Int. J. Heat Mass Transf. 2025, 251, 127288. [Google Scholar] [CrossRef] [Scilit]
- Chen, X.; Zhang, C.; Chen, Q.; Chen, X.; Li, N. Photocatalytic Performance of 3D-Printed Triply Periodic Minimal Surface Photocatalytic Reactors. Coatings 2025, 15, 953. [Google Scholar] [CrossRef] [Scilit]
- Hatcher, A.; Brierly, G.; Vaquette, C.; Staples, R.; Breik, O.; Ivanovski, S.; Carluccio, D. Bioresorbable TPMS Polymeric Scaffolds for Bone Regeneration. Bioprinting 2025, 50, e00433. [Google Scholar] [CrossRef] [Scilit]
- Al-Ketan, O.; Abu Al-Rub, R.K. Multifunctional Mechanical Metamaterials Based on Triply Periodic Minimal Surface Lattices. Adv. Eng. Mater. 2019, 21, 1900524. [Google Scholar] [CrossRef] [Scilit]
- Reynolds, B.W.; Fee, C.J.; Morison, K.R.; Holland, D.J. Characterisation of Heat Transfer Within 3D Printed TPMS Heat Exchangers. Int. J. Heat Mass Transf. 2023, 212, 124264. [Google Scholar] [CrossRef] [Scilit]
- Shaikh, A.; Griffis, J.; Stebbins, R.; Shahed, K.S.; Saxena, A.; Ross, A.; Manogharan, G. Towards gradient design of TPMS lattices and laser powder bed fusion processing-Role of laser strategies and lattice thickness. Manuf. Lett. 2024, 41, 1046–1054. [Google Scholar] [CrossRef] [Scilit]
- Dyer, K.; Amjadi, M.; Shao, S.; Shamsaei, N.; Molaei, R. Understanding Fatigue of Additively Manufactured TPMS Metallic Metamaterials: Experiments and Modeling. Addit. Manuf. 2025, 111, 104966. [Google Scholar] [CrossRef] [Scilit]
- Simsek, U.; Akbulut, A.; Gayir, C.E.; Basaran, C.; Sendur, P. Modal Characterization of Additively Manufactured TPMS Structures: Comparison Between Different Modeling Methods. Int. J. Adv. Manuf. Technol. 2021, 115, 657–674. [Google Scholar] [CrossRef] [Scilit]
- Xu, Y.; Zhang, S.; Ding, W.; Du, H.; Li, M.; Li, Z.; Chen, M. Additively-Manufactured Gradient Porous Bio-Scaffolds: Permeability, Cytocompatibility and Mechanical Properties. Compos. Struct. 2024, 336, 118021. [Google Scholar] [CrossRef] [Scilit]
- Liu, Z.; Tian, P.; Wu, H. Investigations on Phase-Change Transpiration Cooling Performance of TPMS-Based Ceramic Structures. Appl. Therm. Eng. 2025, 279, 127607. [Google Scholar] [CrossRef] [Scilit]
- Cui, X.; Liu, Y.; Yang, C. Study on Mechanical Properties and Application Analysis of Alumina Ceramic TPMS (Triply Periodic Minimal Surface) Structures. Model. Simul. 2026, 15, 51–59. [Google Scholar]
- Zhang, C.; Qiao, H.; Yang, L.; Ouyang, W.; He, T.; Liu, B.; Yan, C. Vibration Characteristics of Additive Manufactured IWP-Type TPMS Lattice Structures. Compos. Struct. 2024, 327, 117642. [Google Scholar] [CrossRef] [Scilit]
- Oh, S.H.; An, C.H.; Seo, B.; Kim, J.; Park, C.Y.; Park, K. Functional Morphology Change of TPMS Structures for Design and Additive Manufacturing of Compact Heat Exchangers. Addit. Manuf. 2023, 76, 103778. [Google Scholar] [CrossRef] [Scilit]
- Lin, W.; Dong, Z.; Ning, Z.; Sun, S.; Shi, J.; Sun, B.; Cao, Y. Numerical Investigation on the Fluid Flow and Heat Transfer Characteristics of a Three-Fluid TPMS Heat Exchanger. Appl. Therm. Eng. 2026, 2, 129620. [Google Scholar] [CrossRef] [Scilit]
- Bobbert, F.S.L.; Lietaert, K.; Eftekhari, A.A.; Pouran, B.; Ahmadi, S.M.; Weinans, H.; Zadpoor, A.A. Additively Manufactured Metallic Porous Biomaterials Based on Minimal Surfaces: A Unique Combination of Topological, Mechanical, and Mass Transport Properties. Acta Biomater. 2017, 53, 572–584. [Google Scholar] [CrossRef] [Scilit] [PubMed]
- Gajetti, E.; Boccardo, G.; Savoldi, L.; Marocco, L. Hydrodynamic Characterization of Gyroid, Diamond and Split-P Triply Periodic Minimal Surfaces as Porous Medium. Int. J. Heat Mass Transf. 2025, 252, 127439. [Google Scholar] [CrossRef] [Scilit]
- Flórez Mera, J.P.; Chiamulera, M.E.; Mantelli, M.B. Permeability Model of Sintered Porous Media: Analysis and Experiments. Heat Mass Transf. 2017, 53, 3277–3285. [Google Scholar] [CrossRef] [Scilit]
- Habib, A.; Draz, U.; Abbas, A.; Shaker, K.; Nawab, Y.; Seyam, A.F.M.; Umair, M. Influence of Honeycomb Structures on Fluids Transmission and Heat Retention Properties: An Initiative towards Stretchable Weaves. J. Ind. Text. 2024, 54, 109235–110107. [Google Scholar] [CrossRef] [Scilit]
- Vhora, K.; Thévenin, D.; Janiga, G.; Sundmacher, K. CFD Analysis of the Flow in Schwarz-D TPMS Structures for Engineering Applications. Chem. Ing. Tech. 2024, 96, 1683–1696. [Google Scholar] [CrossRef] [Scilit]
- Ma, S.; Tang, Q.; Han, X.; Feng, Q.; Zhen, N. Manufacturability, Mechanical Properties, Mass-transport Properties and Biocompatibility of TPMS Scaffolds Fabricated by Selective Laser Melting. Mater. Des. 2020, 195, 109034. [Google Scholar] [CrossRef] [Scilit]
- Ye, M.; Wang, D.; Wang, L.; Zhang, Y.; Li, X. Optimal Design and Performance Evaluation of Grinding Wheels with Triply Periodic Minimal Surface Lattice Structure. J. Mater. Res. Technol. 2024, 32, 3181–3193. [Google Scholar] [CrossRef] [Scilit]
- Li, T.; Jin, S.; Huang, S.; Liu, W. Evaluation Indices of Flow Velocity Distribution Uniformity: Comparison and Application. Therm. Power Gener. 2013, 42, 60–63. [Google Scholar]
- Santos, J.; Pires, T.; Gouveia, B.P.; Castro, A.P.G.; Fernandes, P.R. On the Permeability of TPMS Scaffolds. J. Mech. Behav. Biomed. Mater. 2020, 110, 103932. [Google Scholar] [CrossRef] [Scilit] [PubMed]
- Castro, A.P.G.; Pires, T.; Santos, J.E.; Gouveia, B.P.; Fernandes, P.R. Permeability versus Design in TPMS Scaffolds. Materials 2019, 12, 1313. [Google Scholar] [CrossRef] [Scilit] [PubMed]


Disclaimer/Publisher’s Note: The statements, opinions and data contained in all publications are solely those of the individual author(s) and contributor(s) and not of MDPI and/or the editor(s). MDPI and/or the editor(s) disclaim responsibility for any injury to people or property resulting from any ideas, methods, instructions or products referred to in the content. |
© 2026 by the authors. Licensee MDPI, Basel, Switzerland. This article is an open access article distributed under the terms and conditions of the Creative Commons Attribution (CC BY) license.