


Highlights
What are the main findings?
- The method captures torsion of geometrically complex rods.
- It resolves stress–strain fields under complex loading paths.
- Five-hole topology localizes stresses near internal contours.
- The Prandtl–Reuss and Mean Curvature models diverge after yielding.
- Torsional stiffness depends on topology and loading history.
- The approach applies to inhomogeneous and perforated rods.
- It supports path-dependent elastoplastic stress analysis.
- Internal contours must be included in stress-function models.
- The model helps assess torsion–tension members more reliably.
Abstract
This paper addresses the elastoplastic torsion and tension of a prismatic bar with a multiply connected circular cross-section containing one central and four symmetrically arranged lateral holes. The relevance of this problem stems from the fact that internal contours alter the shear-stress flow, amplify local gradients, and cause non-uniform development of plastic zones. The study considers a two-parameter loading scenario. It is demonstrated that for the same final combination of axial force and torque under different strain trajectories, the equivalent-stress fields and effective torsional stiffness significantly depend on the loading sequence. The obtained results confirm the necessity of simultaneously considering hole geometry, plastic flow, and loading history when analyzing multiply connected bars.
1. Introduction
The torsion of cylindrical bodies is a classic problem in solid mechanics, holding significant importance in mechanical engineering, the aerospace industry, civil engineering, and other engineering fields. However, for inhomogeneous materials (such as composites, functionally graded materials, and layered structures), analytical solutions are often unavailable, making numerical simulation the primary research tool. Various computational methods exist for analyzing such elements [1,2,3] within the elastic range, including inhomogeneous elements with diverse cross-sections.
The nonlinear behavior of materials can be described by various plasticity theories. Most of these theories originate from specific hypotheses and are based upon phenomenological approaches. Initially, the theory of ideal plasticity was utilized in structural strength calculations, and several solutions based on this approach are available [4].
For boundary value problems that account for material hardening—particularly under multi-parameter loading—computational results obtained from different theories can vary significantly. This variation is largely attributed to the emergence of complex loading paths that cannot be adequately described within the framework of classical approaches. The validity of plasticity theories under two-dimensional (plane) complex loading processes is detailed in previous work [5,6,7].
Recent investigations have addressed several important aspects of the present problem. The influence of internal contours on the torsional response of bars with holes was examined in [8], while elastoplastic torsion of prismatic bars has been studied using analytical, experimental, finite-element, and generalized finite-difference approaches [9,10,11,12,13]. Combined axial–torsional loading has also been investigated for solid rods and material specimens using constitutive, numerical, and experimental approaches [14,15,16,17,18,19,20]. These studies provide an important basis for the analysis of torsion and multiaxial plasticity; however, the effects of cross-sectional topology, loading-path history, and local elastoplastic redistribution have predominantly been examined as separate aspects of the problem.
Within the scope of the available studies, the coupled influence of a multiply connected cross-sectional topology and a non-proportional two-parameter loading history on the evolution of local elastoplastic fields and integral torsional stiffness remains insufficiently quantified. In particular, it is not sufficiently established whether different loading sequences leading to the same terminal combination of axial force N and torque M produce mechanically equivalent local states after the onset of plastic flow. This constitutes the principal scientific gap addressed in the present study.
The five-hole cross-section is therefore introduced as a controlled representative multiply connected topology rather than merely as a geometrically complicated section. The central hole and four symmetrically arranged lateral holes form multiple interacting internal contours and narrow ligaments, creating spatially different conditions for shear-stress transfer and plastic-zone development within the same cross-section. This configuration makes it possible to examine, under identical geometry and material properties, how the M–N, N–M, and proportional loading paths modify local stress redistribution and the subsequent loss of torsional stiffness. The five-hole configuration is treated here as a representative model; quantitative generalization to arbitrary perforated cross-sections is not assumed.
The engineering motivation is associated with perforated torque-transmitting members subjected to combined axial force and torsion in different loading sequences. Once yielding begins, the terminal load pair (N,M) alone may no longer uniquely characterize the mechanical state, because different loading histories can produce different local plastic-strain distributions and different levels of torsional stiffness. The present study therefore examines whether the loading sequence itself becomes an additional governing factor in the post-yield response of multiply connected rods.
Accordingly, the objective of this study is to quantify the influence of a two-parameter loading history on the local elastoplastic response and effective torsional stiffness of a prismatic rod with a multiply connected cross-section. For this purpose, three loading histories—M–N, N–M, and proportional loading—are considered for comparable terminal load states; the evolution of equivalent stresses and local deformation paths in characteristic regions of the cross-section is analyzed; and the predictions of the Prandtl–Reuss formulation are compared with those of the deformation-path-curvature model after yielding. The principal scientific contribution of the study is the coupled assessment of internal-contour topology and loading-path-dependent elastoplasticity through both local stress–strain characteristics and the integral torsional stiffness of the same multiply connected cross-section.
The main objective of the present study is to determine how the sequence of axial force and torque application affects the local elastoplastic response and the effective torsional stiffness of a rod with a multiply connected cross-section. Four specific objectives are considered: (1) to compare the M–N, N–M, and proportional loading paths in order to determine how the loading sequence influences the onset and subsequent development of plastic deformation—this comparison is relevant both to the mechanics of path-dependent plasticity and to the selection of loading sequences in metal forming and mechanical processing; (2) to analyze equivalent stresses and local deformation trajectories at selected characteristic points representing regions where early yielding and pronounced stress redistribution are expected, thereby identifying the parts of the five-hole cross-section that are most sensitive to the loading history; (3) to compare the Prandtl–Reuss and deformation-path-curvature models before and after yielding and assess the extent to which accounting for deformation-path rotation and memory changes the predicted plastic response; and (4) to quantify how the resulting path-dependent redistribution of plastic strains affects the effective torsional stiffness. The scientific contribution of the work is the direct connection established between the loading sequence, local plastic evolution near interacting internal contours, and the integral mechanical response of the same multiply connected rod.
2. Materials and Methods
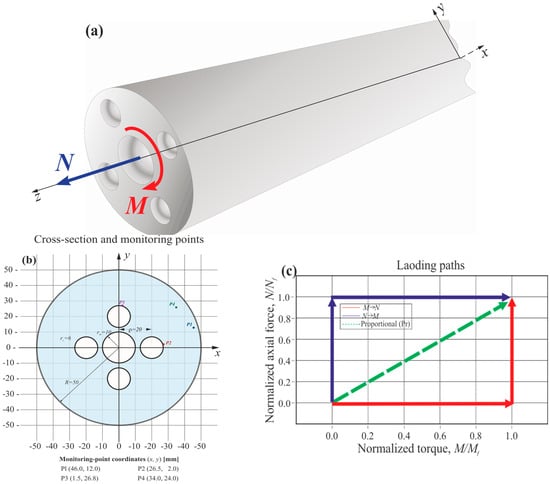
Let us consider a rod with a multiply connected circular cross-section with one central hole and four lateral holes. This geometry is regarded as a model configuration, but it is a representative case. The geometric scheme is shown in Figure 1.
Figure 1.
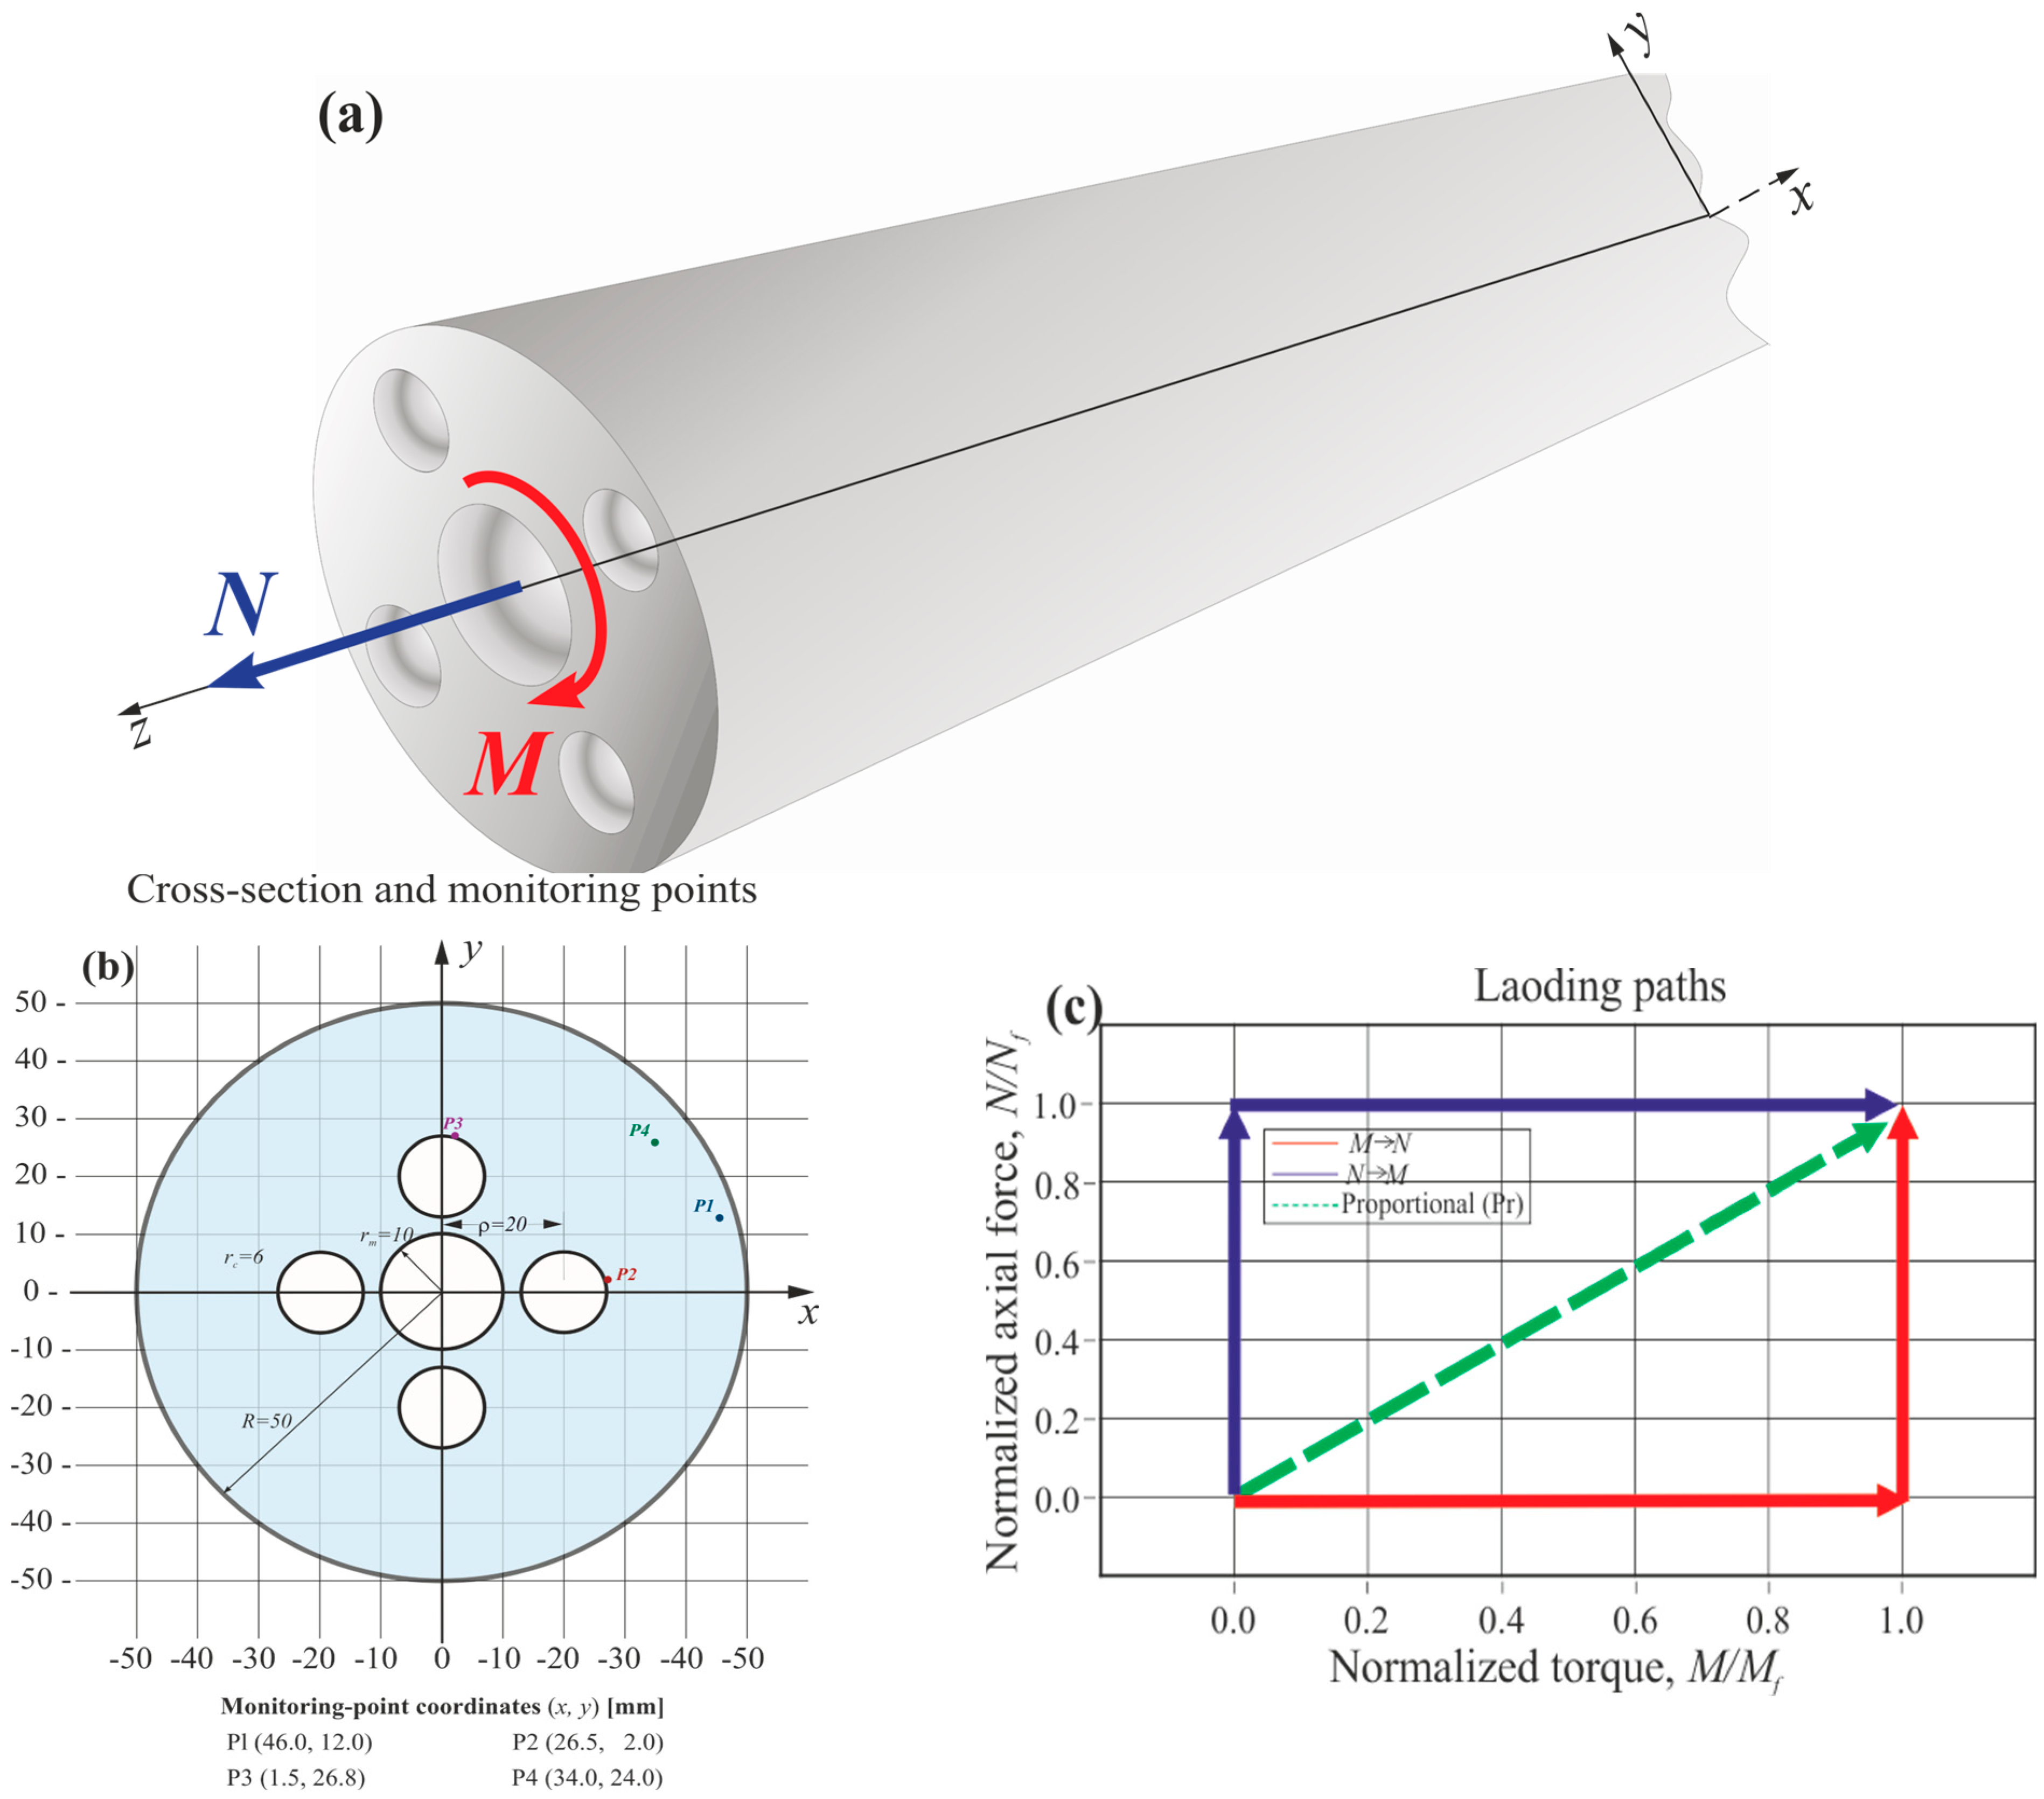
Problem setup and monitoring locations: (a) the prismatic rod subjected to combined axial force N and torque M; (b) geometry of the five-hole multiply connected cross-section and locations of monitoring points P1–P4; (c) schematic representation of the M–N, N–M, and proportional (PR) loading paths.
In the quasistatic formulation, the equations of equilibrium have the form
where σij represents the components of the stress tensor, and bi denotes body forces. The strains are assumed to be small:
The increments of total strains are taken as the sum of the increments of elastic and plastic strains:
The stress intensity and the yield condition are specified by the relations
Here κ denotes the internal hardening variable, while σy(κ) is the current yield stress. The associated flow rule is adopted in the Prandtl–Reuss form:
Under complex multi-parametric loading, the length and curvature of the strain path are introduced as follows:
The fading-memory effect, which reflects the path-dependent behavior of a material and is expressed as vector properties of the material, is taken into account in integral form using the characteristic length of the trace of delay λ:
Let us take constitutive relations for the model that take into account complex loading in the form
Relations (7)–(11) are used here as a path-sensitive extension of gradient plasticity for complex loading [5,6,7]. It is these relations that allow us to describe the difference between M–N and N–M loading after the material enters the plastic region.
The physical origin of this difference is associated with the change in the deformation trajectory during sequential loading. Under the M–N path, torsion first generates the shear-strain components εxz and εyz, after which the axial loading introduces εzz. Under the N–M path, the order is reversed: the axial component develops first, while the subsequent torsion changes the direction of the strain increment in the strain space. Before yielding, this difference has only a limited influence because the response is predominantly elastic. Once plastic flow begins, however, the previously accumulated deformation becomes relevant to the subsequent response. Consequently, the path length s, curvature χ, and fading-memory quantity ϑ(s) introduced in Equations (7)–(11) evolve differently for the two loading histories, leading to different magnitudes and directions of the plastic-strain increments. Thus, identical or comparable terminal values of N and M do not necessarily correspond to the same local elastoplastic state.
Let the axis of the prismatic rod coincide with the z-axis, and let the cross-section occupy the domain A in the (x, y) plane. For a unified description of tension, bending, and torsion, the following kinematic field is used [1,21]:
where ω(x, y) is the warping function, φ(z) is the angle of twist, and θ = dφ/dz is the twist intensity. The active strain components for combined tension and torsion are defined as
For the solution, the Prandtl stress-function approach is used for the Saint-Venant torsion problem [22,23]. The elastoplastic character of the torsion problem is then treated in an incremental numerical form [11,12]. The torsion problem for an elastoplastic rod can be represented through the stress function in terms of additional strains:
3. Numerical Method
All numerical computations were performed using an in-house Python 3.13.9 implementation of the finite-difference method (FDM).
The computational domain is covered by a square grid:
Nodes outside the outer circle and inside the holes are excluded.
The transition to the numerical problem is performed on a structured grid superimposed on the outer bounding rectangle [13]. The complex geometry is represented by a mask of active nodes: for a node belonging to the material, Iij = 1 is assigned, whereas for an external node or a node inside a hole, Iij = 0 is assigned. On this basis, the set of active nodes Ah, the discrete boundary Γh, and the internal active nodes are formed:
Inside the domain, a five-point finite-difference scheme is used in the form
If an adjacent node falls inside a hole or outside the external contour, the corresponding boundary values of the Prandtl stress function are substituted into the scheme. The conditions on the external and internal contours are assumed as follows:
The calculations employ a representative homogeneous isotropic structural-steel-type material. The constitutive description is not intended as a calibration of a particular commercial steel grade; rather, a single reference material is used throughout the study in order to isolate the effects of the loading sequence and deformation-path history. Plastic yielding is governed by the von Mises J2 criterion with the associated Prandtl–Reuss flow rule [24,25]. Post-yield strengthening is represented by the strain-hardening part of a power-law relation of the Steinberg–Cochran–Guinan type [26],
where κ is the accumulated equivalent plastic strain. Only the strain-hardening contribution is retained; pressure, temperature, and strain-rate effects are excluded from the present quasistatic formulation. The parameters β and n therefore serve as constitutive calibration parameters of the reference material. The corresponding tangent-hardening modulus used in the return-mapping correction is evaluated as
until the prescribed limiting flow stress is reached.
At each load increment, an elastic trial state is first constructed from the current strain increment and the plastic variables stored at the previous converged state. The corresponding trial equivalent stress is then tested against the current flow stress . If
the step remains elastic. For , the trial stress lies outside the current yield surface, and a radial return correction is performed. The plastic-multiplier increment is evaluated as
Equation (29) provides the direct numerical link between the nonlinear hardening law and the local return-mapping correction.
After updating the plastic strains, the shear stresses are recovered. The integral characteristics of the cross-section are calculated using discrete analogs of the torque and torsional stiffness:
The coupled problem is solved incrementally at each loading step. The Prandtl finite-difference equation is solved using a red–black successive over-relaxation (SOR) procedure with relaxation parameter ω = 1.72. The SOR iteration is terminated when the maximum absolute change in the stress-function values between successive sweeps satisfies
with a maximum of 900 iterations. The coupling with the elastoplastic constitutive update is controlled by
with at most two outer corrections per load step.
The use of internal holes is motivated by the fact that perforations and internal contours can substantially modify the local stress field and the structural response of metallic elements [8,27]. In torsion problems, membrane and stress-function analogies also show that topology and material layout influence the torsional response [28]. The cross-section is defined as the outer circular domain excluding the central and four lateral holes:
The outer contour, the central hole, and the four lateral holes are described by the following system of circles:
The computations consider a prismatic multiply connected rod subjected to the resultant axial force N and torque M, applied incrementally along the prescribed M–N, N–M, and proportional loading paths. All loading paths start from the unloaded state, N = M = 0. In the M–N path, the torque M is increased first while N = 0 up to the switching state M = 5.482 × 10⁷ N·mm; thereafter, this torque level is retained, and the axial force N is increased. In the N–M path, the axial force is increased first while M = 0 up to N = 2.658 × 10⁶ N; this axial-force level is then retained while the torque is increased. In the proportional (PR) path, N and M are increased simultaneously from zero at a constant ratio M/N = 15.708 mm.
The Prandtl stress function is set to zero on the external contour and to a constant Ck on each internal contour, with Ck determined from the corresponding compatibility conditions. At every load increment, the generalized axial strain and twist rate are determined so that
The reference geometry is R = 50 mm, rm = 10 mm, rc = 6 mm, and ρ = 20 mm. A homogeneous isotropic elastoplastic material is used with G = 80 GPa, ν = 0.30, E = 208 GPa, σy0 = 340 MPa, and nonlinear isotropic hardening σy(κ) = min[σy,max, σy0(1 + βκ)n], where β = 40, n = 0.5, and σmax = 544 MPa (the prescribed upper flow-stress bound used in the present loading program, not a fracture limit). These details are provided in the Materials and Methods section.
The analysis is restricted to monotonic incremental loading through the elastic–plastic transition and into developed plastic flow; unloading/reloading, damage accumulation, crack initiation, and final fracture are not considered.
4. Results
Numerical Verification
To assess the numerical reliability of the proposed formulation, a grid-refinement study was performed using 101 × 101, 141 × 141, and 201 × 201 finite-difference grids under the same imposed M–N deformation history. The 201 × 201 solution was used as the finest-grid reference. As summarized in Table 1 the adopted 141 × 141 grid differs from the finest-grid solution by 2.23% in the maximum equivalent stress and 0.89% in the secant torsional stiffness.
Table 1.
Grid-refinement verification for the five-hole cross-section (θ = 1.8033015388 × 10⁻⁴ mm−1).
The material is considered a homogeneous isotropic elastoplastic metal whose parameters correspond to structural steel near the yield limit. Loading is specified by three paths: first torsion and then tension M–N; first tension and then torsion N–M; and simultaneous proportional increases in M and N. This construction makes it possible to compare states with the same final load values but with different deformation histories.
First, consider the distribution of equivalent stresses. At the early stage of loading, increased values of σeq are concentrated near the outer contour and around the holes. After the onset of plasticity, the isolines become denser in the spaces between cutouts, while the zones of elevated stresses propagate into the cross-section. This means that the holes act not only as cutouts that reduce the area but also as elements that redirect the flow of shear stresses.
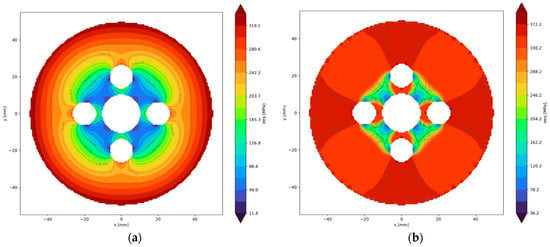
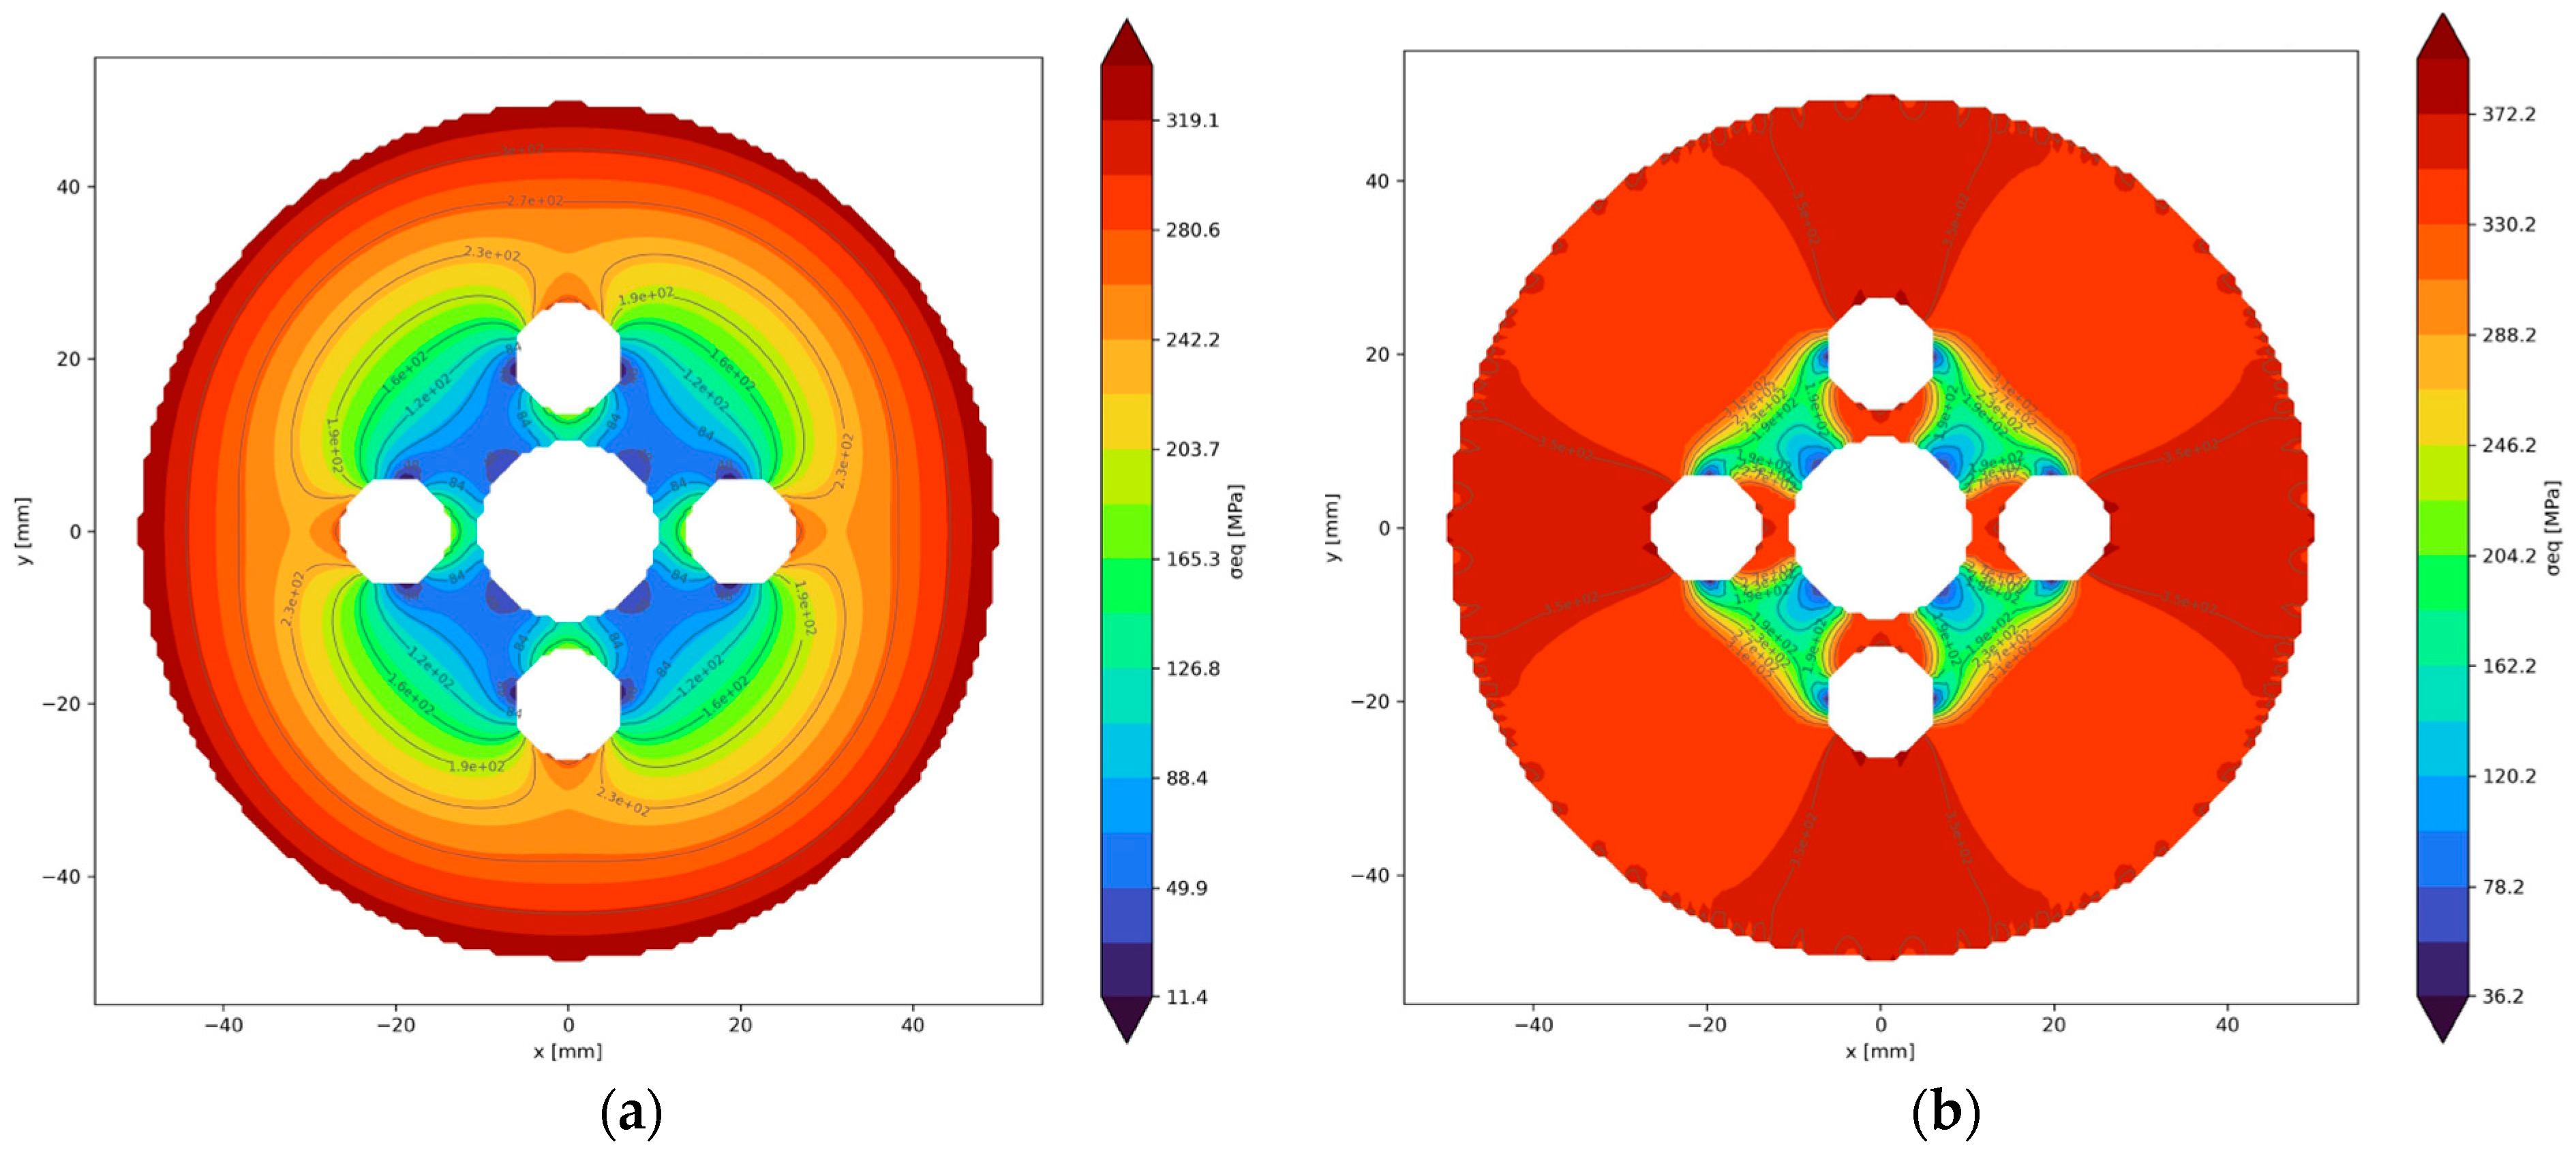
The equivalent-stress fields obtained for the M–N loading sequence at two characteristic loading levels are shown in Figure 2. The comparison makes it possible to trace the transition from stress concentration near the contours to a more developed elastoplastic redistribution in the cutout zones.
Figure 2.
Fields of equivalent stress in the multiply connected cross-section under M–N loading: (a)—initial elastoplastic state; (b)—developed elastoplastic state.
Figure 2 indicates that yielding initiates predominantly in the outer high-stress region. As the loading level increases, elevated equivalent stresses develop around the internal contours, while pronounced stress gradients arise in the narrow ligaments between the holes. These regions become increasingly involved in the development and redistribution of the plastic zones. Thus, although they are not necessarily the locations of first yielding, they remain mechanically significant in governing the subsequent localization and evolution of elastoplastic deformation.
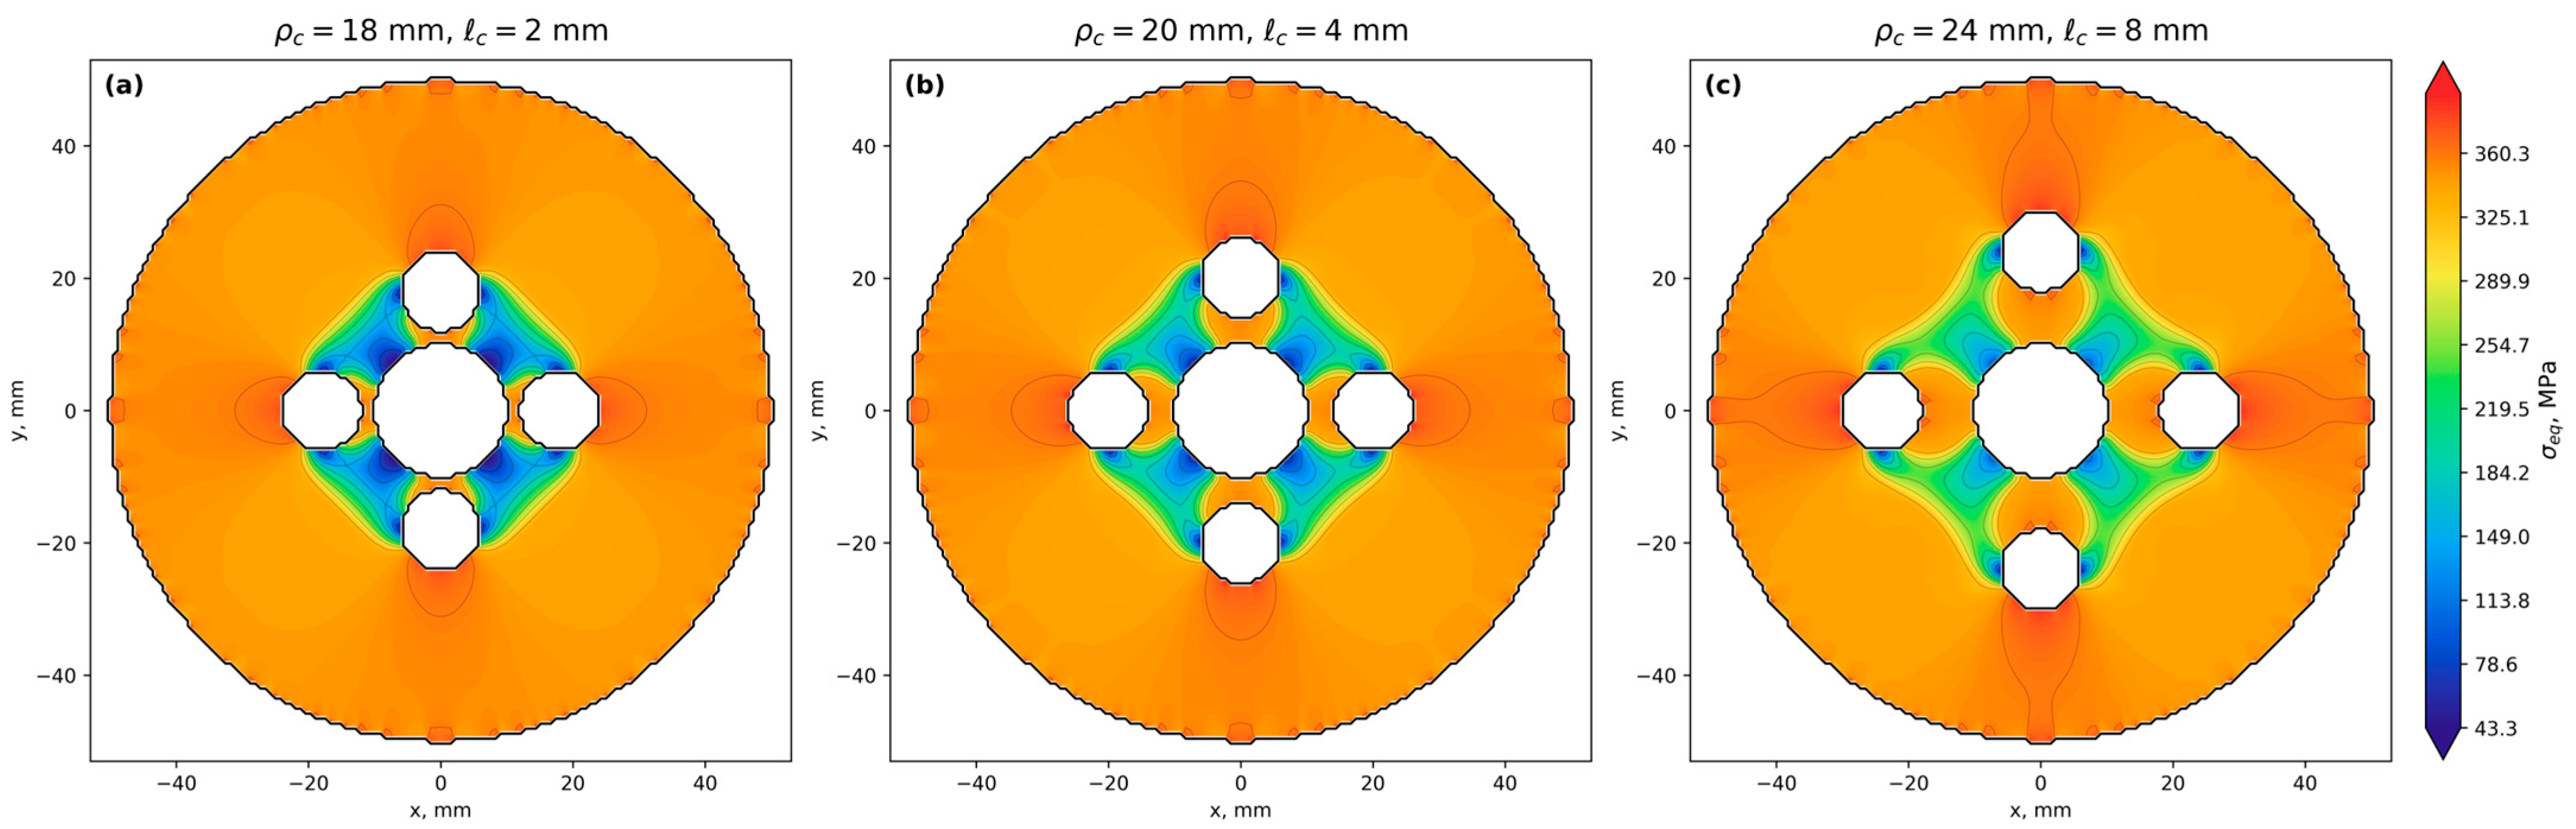
To examine whether this localization pattern is specific to the adopted hole arrangement, an additional geometric sensitivity analysis was performed. The radial position of the four lateral holes was varied as ρc = 18, 20, and 24 mm, corresponding to central-to-lateral ligament widths ℓc = 2, 4, and 8 mm, respectively. The outer radius, hole radii, material properties, 141 × 141 finite-difference grid, constitutive model, and imposed M–N deformation history were kept unchanged. Thus, only the relative position of the internal contours was varied, as illustrated in Figure 3.
Figure 3.
Sensitivity of the equivalent-stress field to the radial position of the lateral holes under the same M–N deformation history: (a) ρc = 18 mm, ℓc = 2 mm; (b) ρc = 20 mm, ℓc = 4 mm; and (c) ρc = 24 mm, ℓc = 8 mm. The same color scale is used for all configurations.
The maximum equivalent stresses were 376.80, 393.36, and 385.12 MPa for ρc = 18, 20, and 24 mm, respectively. Hence, the influence of hole spacing is not monotonic. Changing ρc modifies both the magnitude and localization of the highly stressed regions. From an engineering standpoint, the radial position of the lateral holes therefore acts as a design parameter controlling the balance between peak stress localization and the spatial extent of plastic deformation. The results indicate that stress redistribution near internal contours is a general feature of multiply connected sections, whereas its detailed pattern is configuration-dependent.
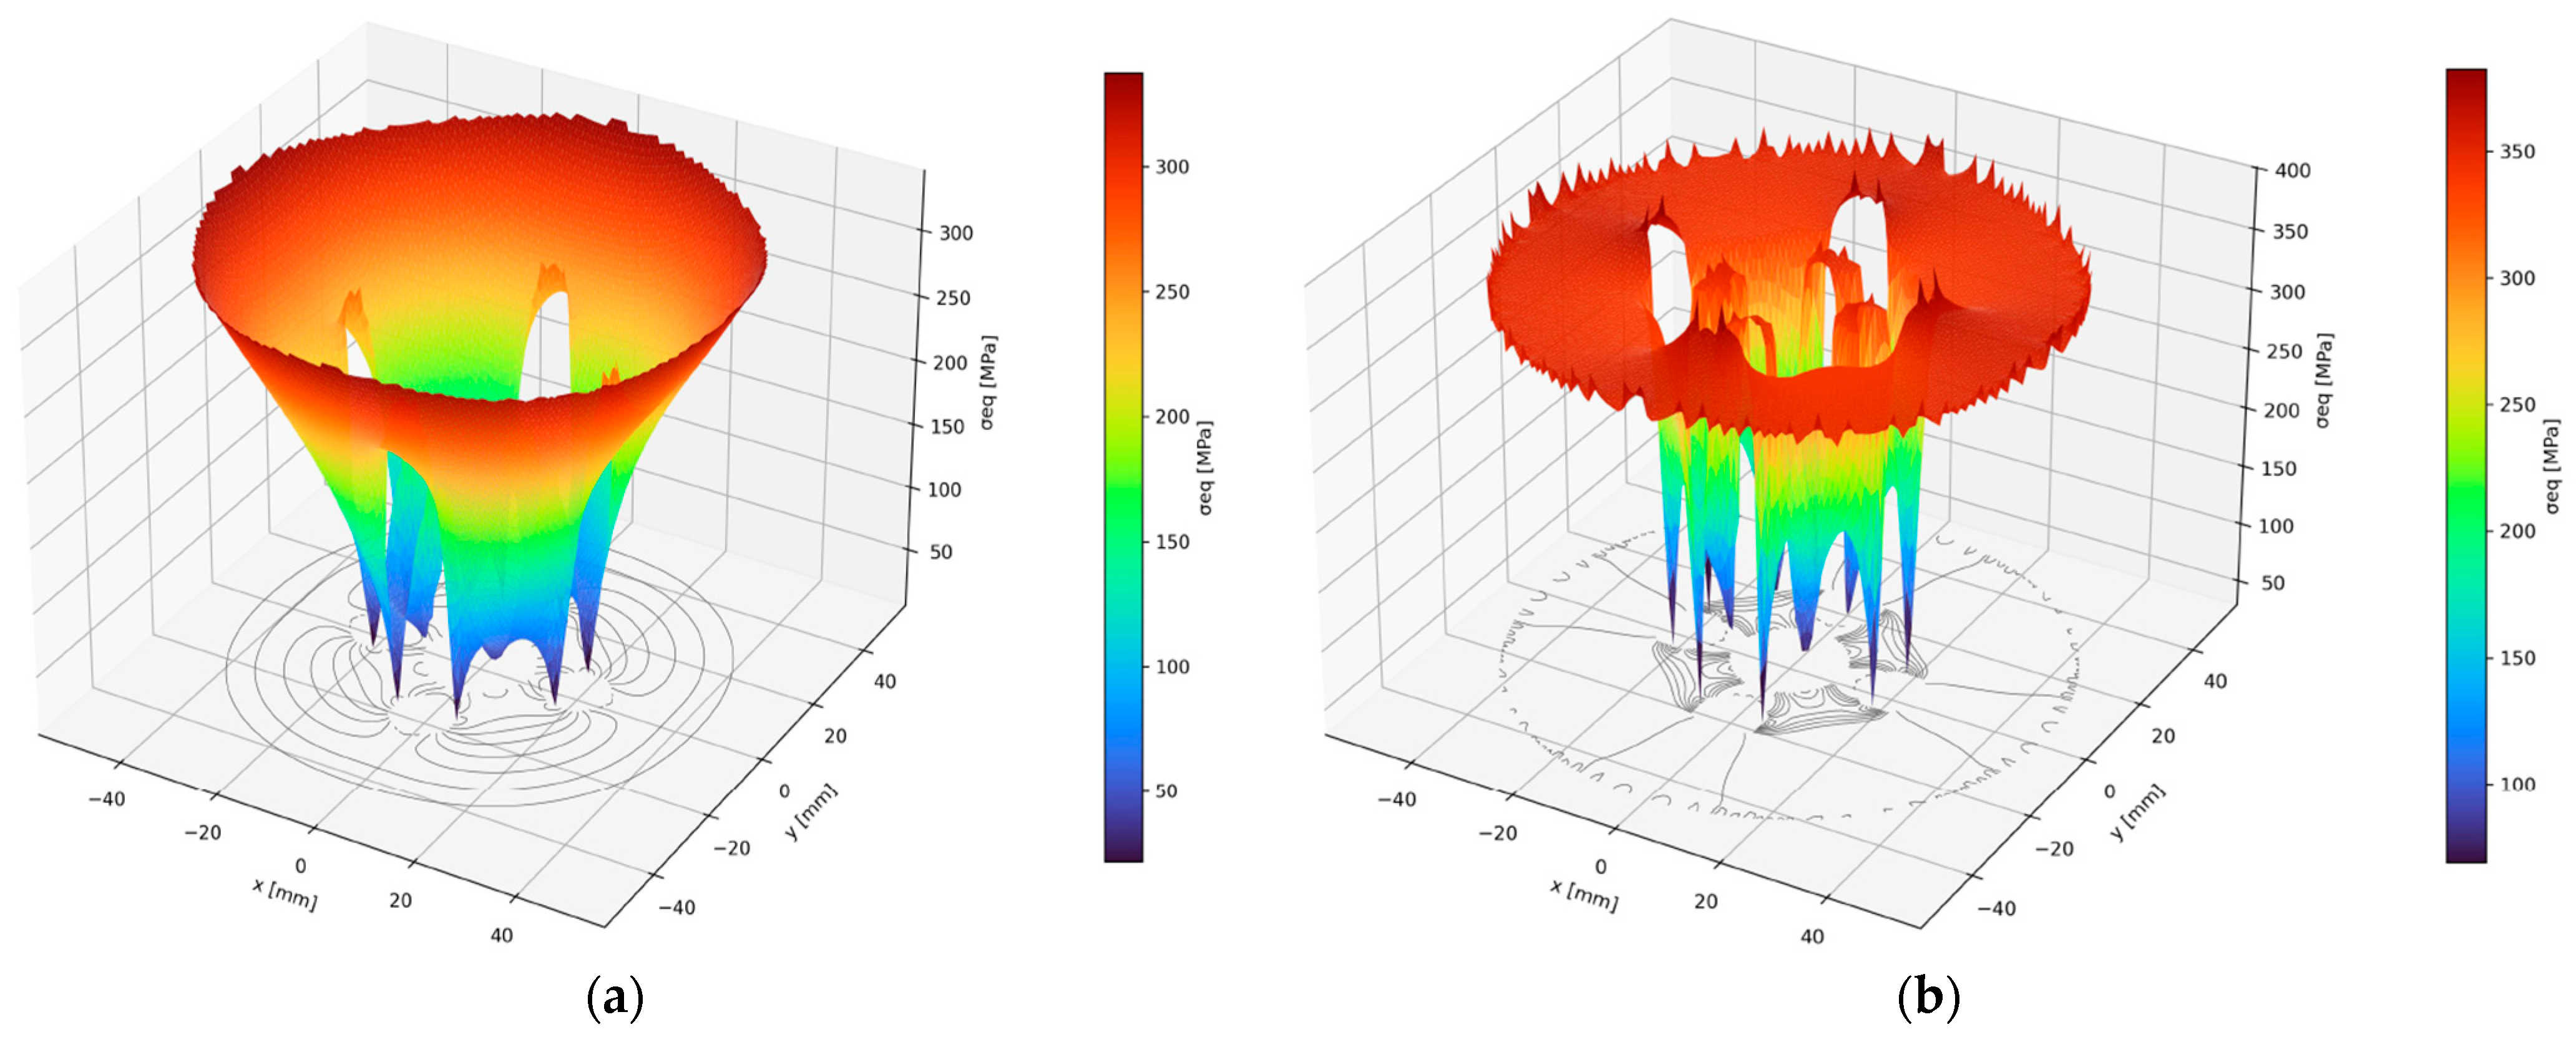
To clarify the development of the equivalent-stress field in spatial form, the N–M loading case is considered in Figure 4.
Figure 4.
Spatial form of the equivalent-stress field under N–M loading: (a) η = 1.00; (b) η = 1.15.
The spatial form in Figure 4 emphasizes the same effect: the σeq field is nonuniform not only in magnitude but also in the character of its local variation around the holes. Therefore, the subsequent analysis is performed not only in terms of integral stiffness but also at selected characteristic points of the cross-section.
The numerical solution is evaluated over the entire active cross-sectional grid (12,360 active nodes for the adopted 141 × 141 discretization), whereas P1–P4 are used only as local monitoring points. They were selected from the full-field solution to represent mechanically distinct response regions rather than global extrema; for example, in the developed plastic M–N state, their equivalent-strain levels span approximately from the 47th to 99.5th percentiles of the full-field distribution.
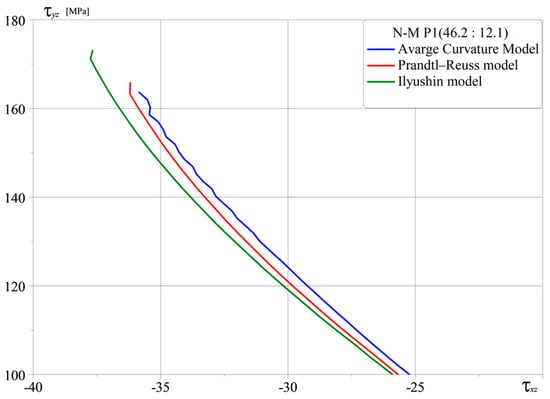
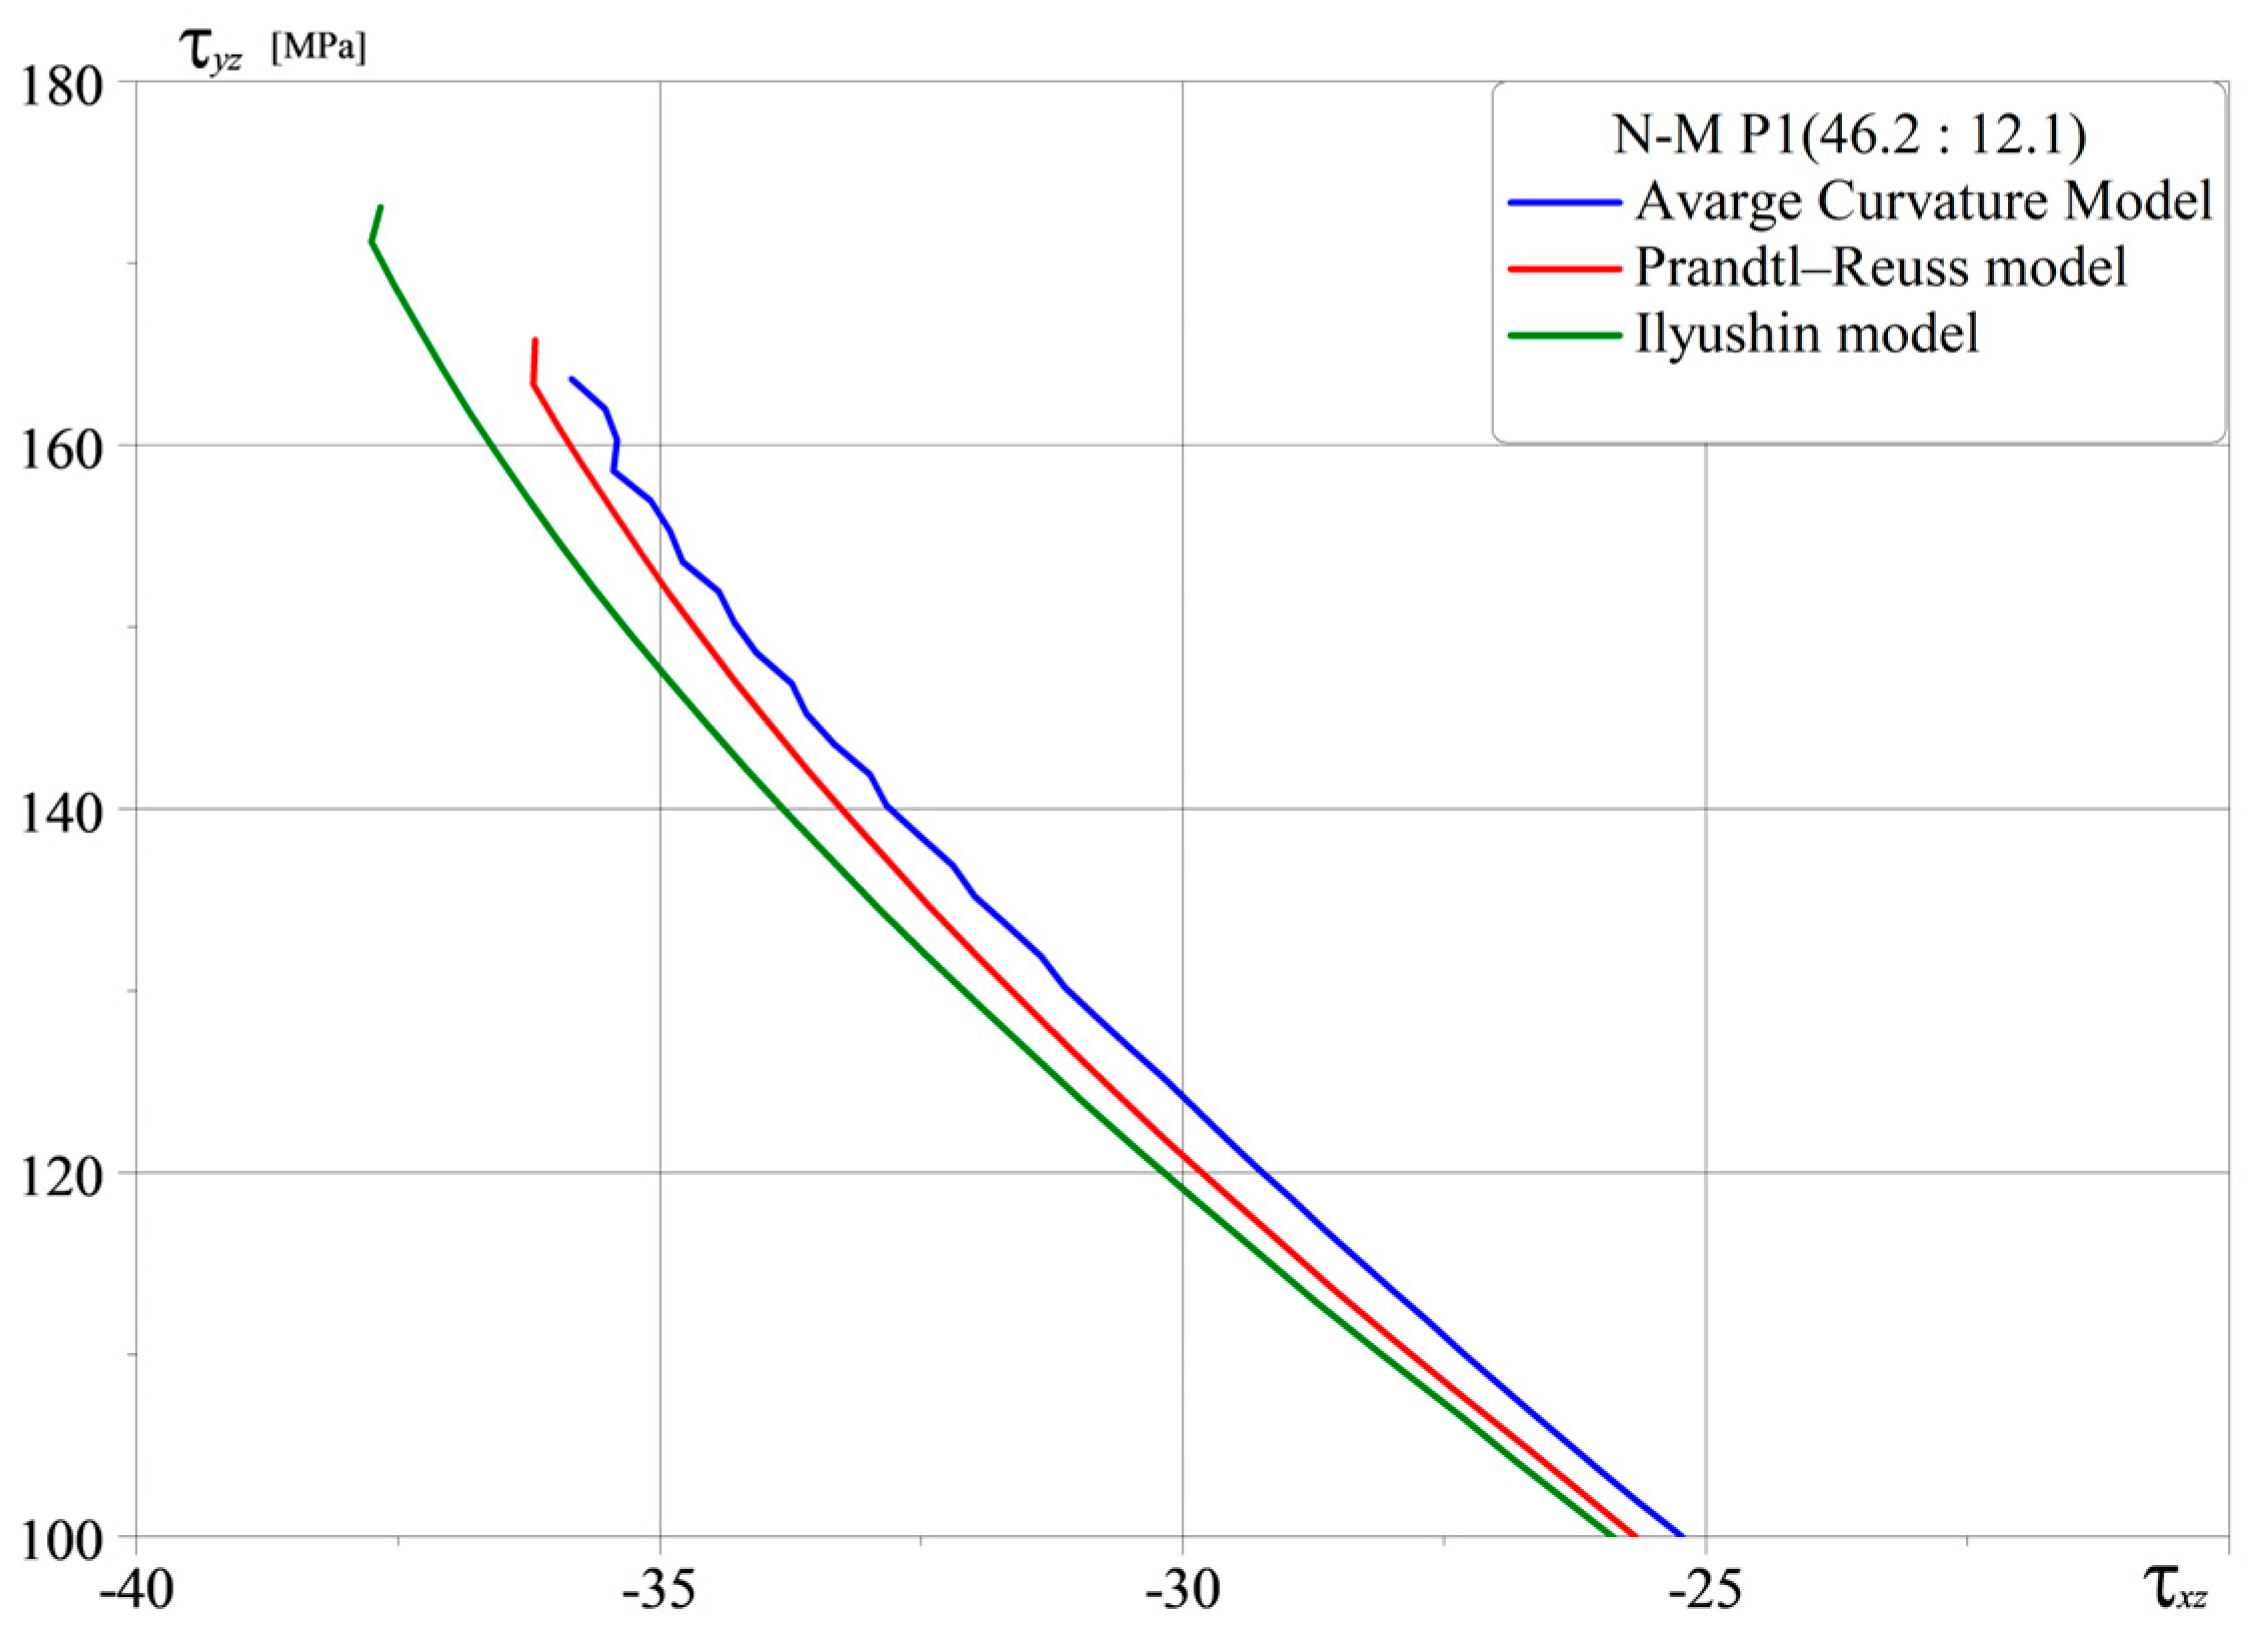
Upon the precise identification of the critical zones exhibiting stress concentration, a comparative evaluation of the various constitutive models is essential to determine their respective fidelity in capturing the localized shear-stress response. To this end, the stress trajectory at the designated monitoring point, P1, is systematically examined, as presented in Figure 5.
Figure 5.
Stress trajectory τxz–τyz at point P1 under N–M loading.
Figure 5 shows that, in the elastic range, the trajectories obtained using the Prandtl–Reuss model and the Avarge Curvature model practically coincide. After the transition to the plastic state, a discrepancy appears. It is associated not with a change in geometry or loading but with the fact that the path model accounts for the rotation of the deformation path and the accumulated memory of the preceding loading segment.
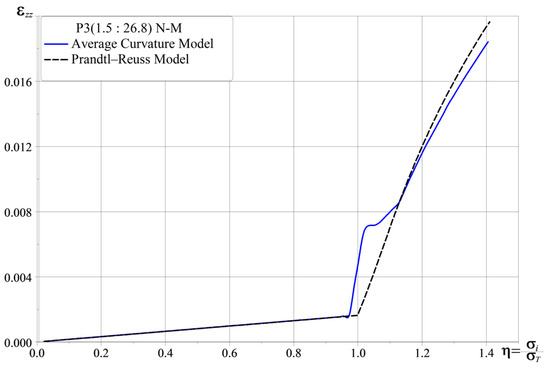
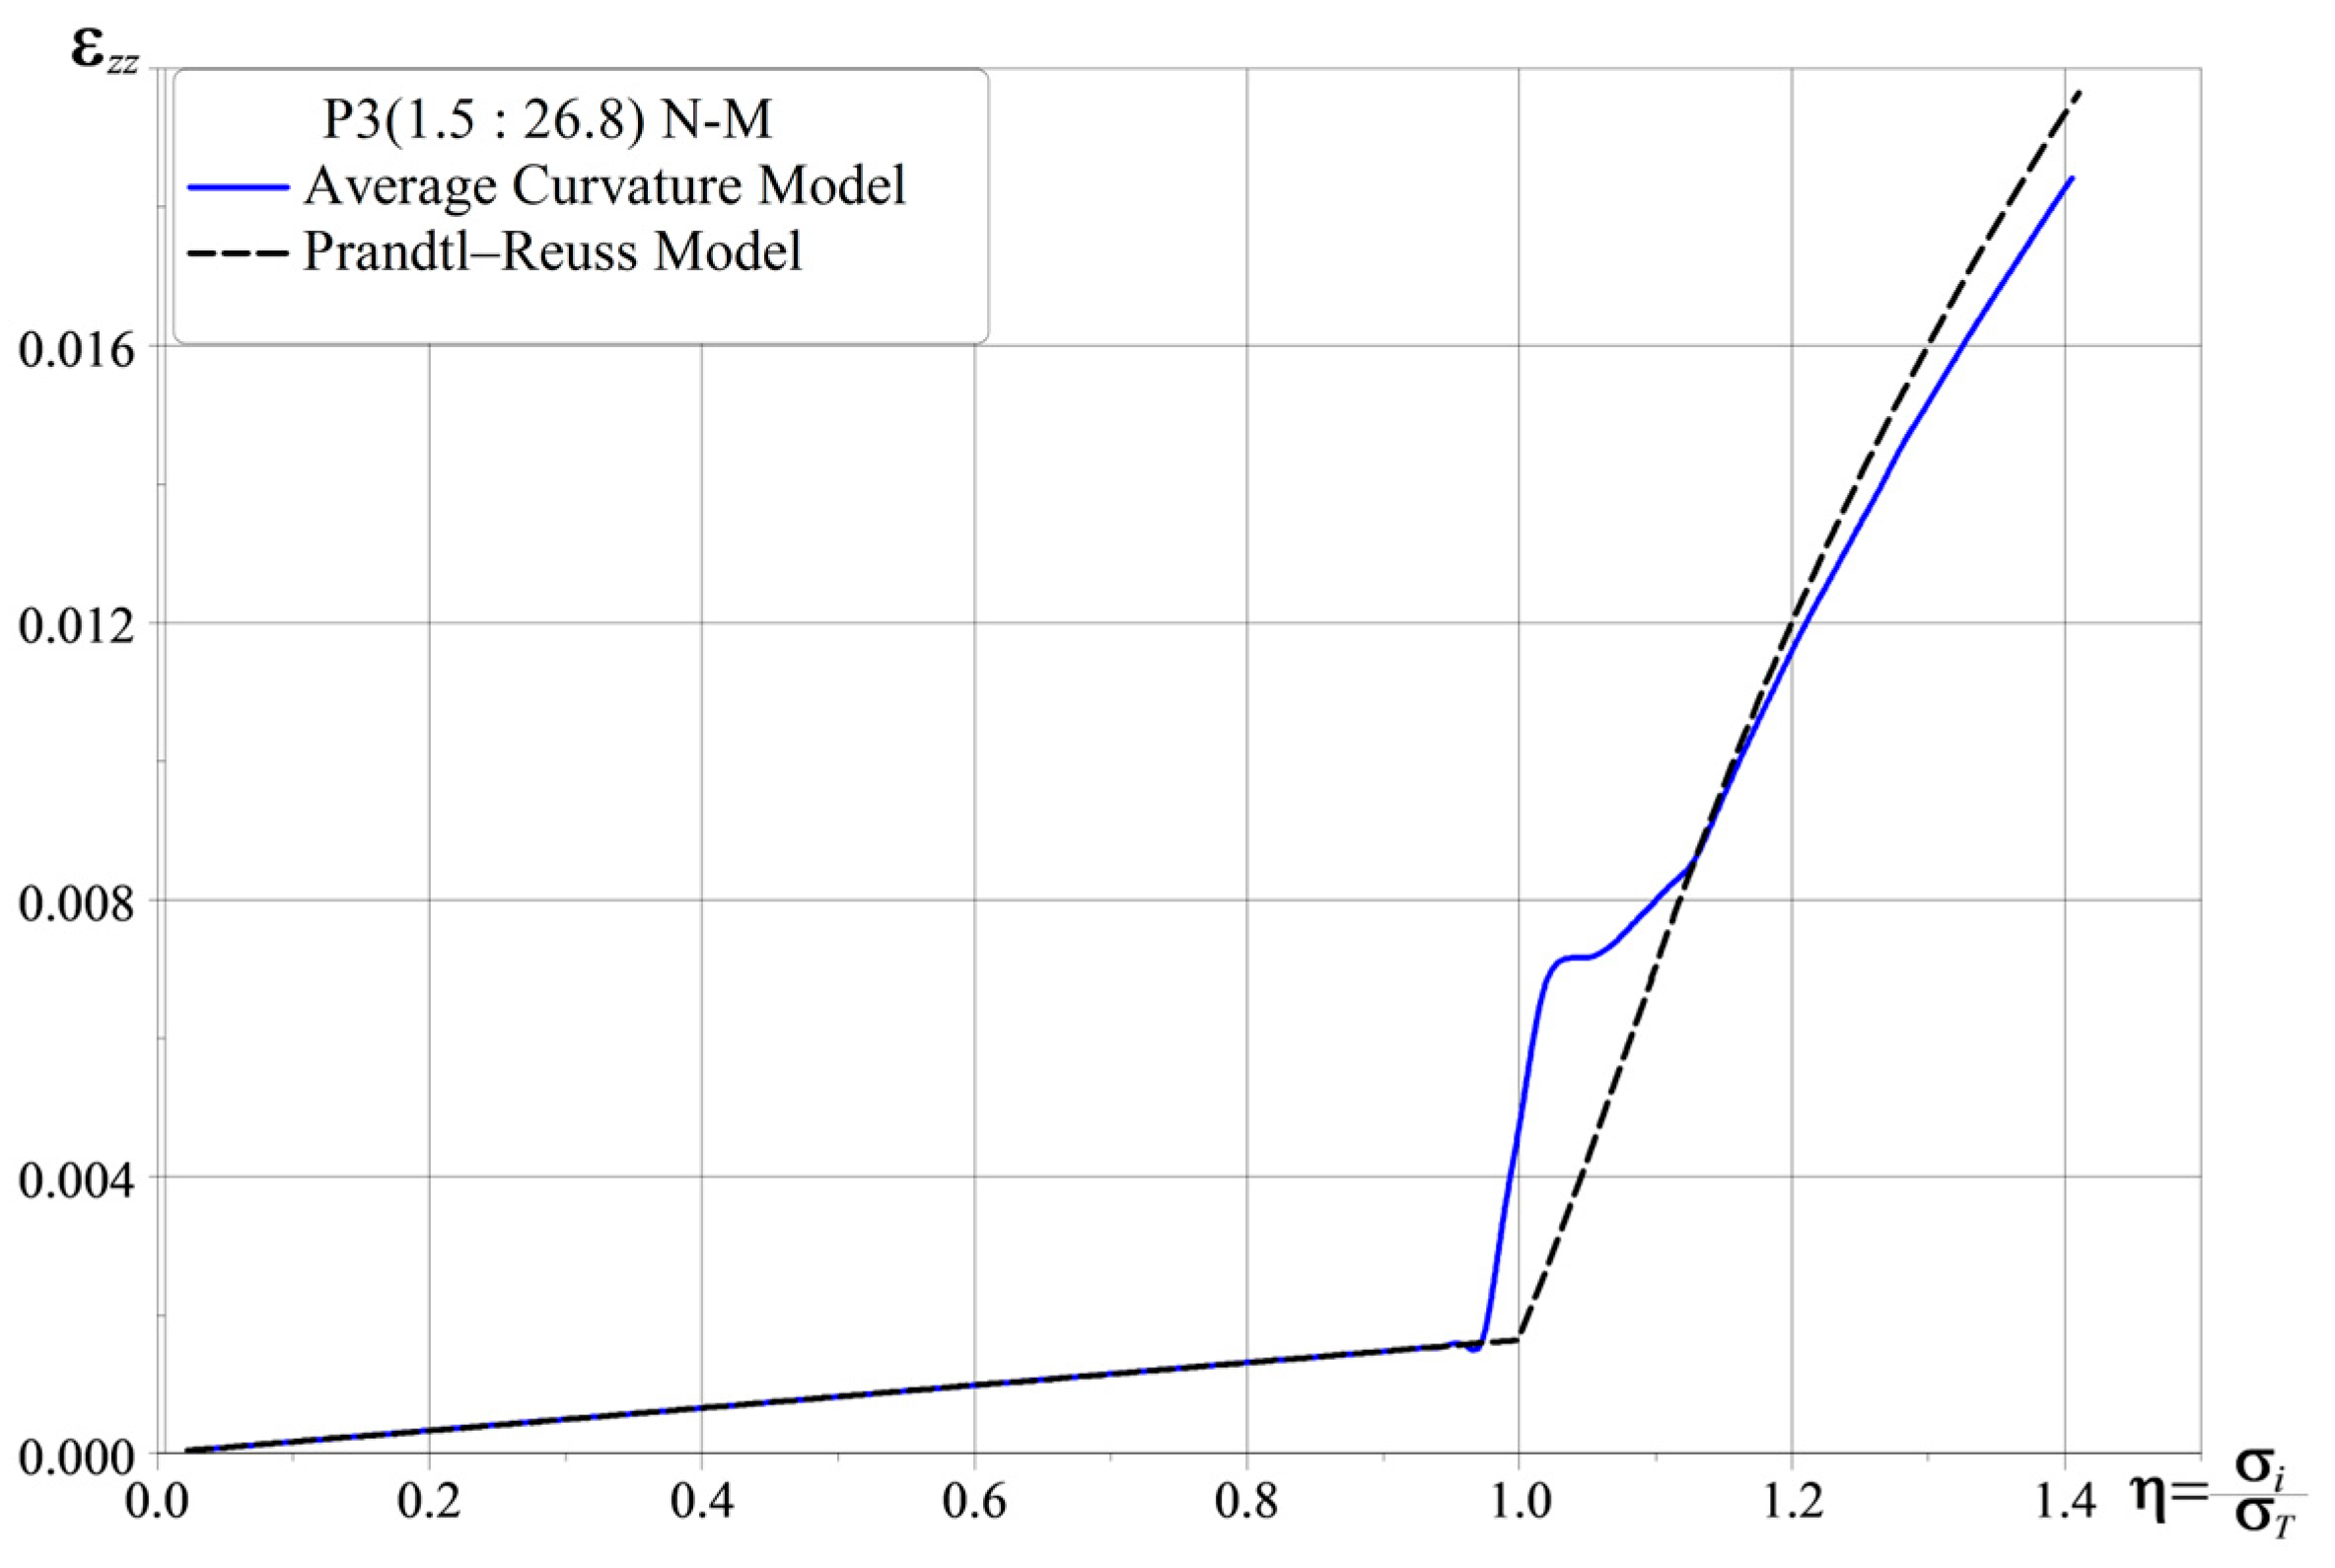
To further compare the Avarge Curvature and PrandtlReuss models, Figure 6 plots the evolution of εzz at P3(1.5, 26.8) against the loading ratio η = σeq/σy.
Figure 6.
Dependence of longitudinal strain on the loading level at a characteristic point.
The transition segment in Figure 6 is an important indicator: before plasticity, the models give similar responses, whereas after plasticity the difference becomes noticeable. Consequently, the influence of path curvature is manifested not in the initial linear stage but precisely when plastic strains begin to redistribute over the cross-section.
Figure 6 shows that the Average Curvature and Prandtl–Reuss predictions remain close before yielding but diverge distinctly after plastic deformation develops. For the same curvature in the plastic range, the Prandtl–Reuss model predicts a higher axial strain εzz than the Average Curvature Model, with the difference reaching approximately 6% near the terminal loading state. This discrepancy indicates that averaging the curvature smooths the local elastoplastic response and therefore slightly underestimates the axial strain compared with the incremental Prandtl–Reuss formulation.
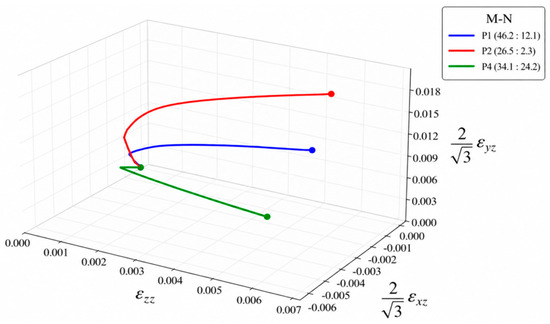
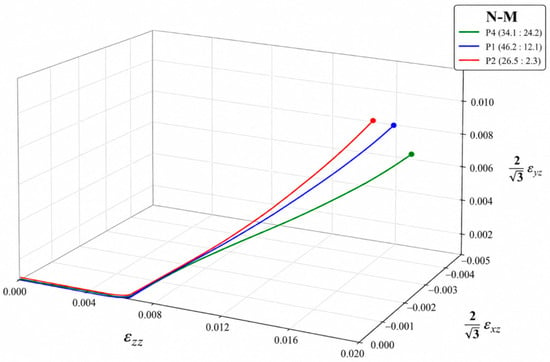
Next, compare the deformation paths at points P1, P2, and P4. These points are located differently with respect to the holes; therefore, the same overall loading level forms different local deformation histories at them.
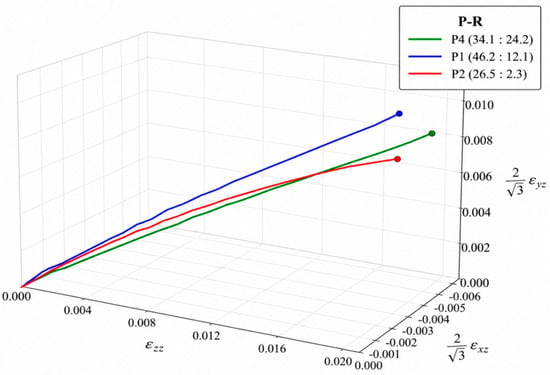
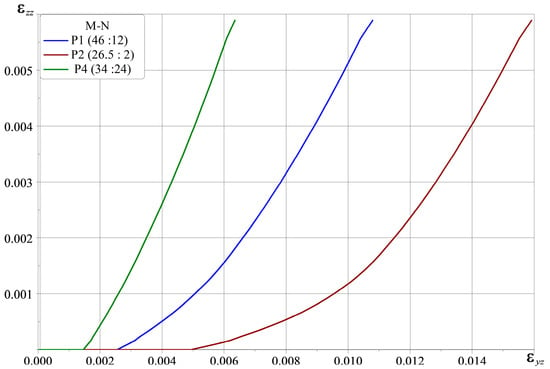
The deformation paths at points P1–P3 for the M–N, N–M, and PR loading sequences are presented in Figure 7, Figure 8 and Figure 9, respectively.
Figure 7.
Deformation paths at points P1, P2, and P4 for the M–N sequence.
Figure 8.
Deformation paths at points P1, P2, and P4 for the N–M sequence.
Figure 9.
Deformation paths at points P1, P2, and P4 under proportional loading.
Comparison of Figure 7, Figure 8 and Figure 9 reveals a fundamental difference between the three scenarios. Under M–N, the shear components develop first, and then the path changes under the action of the longitudinal force. Under N–M, the initial segment is governed by the longitudinal strain, after which torsion drives the trajectory toward the shear components. Under PR, the path remains smoother. Consequently, the final load state by itself does not determine the local response; the order in which the strain components are formed becomes essential.
The sensitivity to the constitutive description also depends strongly on the loading path. At η ≈ 1.4, the difference in εzz between the Average Curvature and Prandtl–Reuss models reaches 6.2% for the N–M path but only 0.9% under proportional loading; the corresponding differences in the equivalent plastic strain at P3 are 5.75% and 0.50%, respectively. This demonstrates that sequential non-proportional loading amplifies deformation-path and memory effects compared with proportional loading.
The local strain response in Figure 10, geometric effect in Figure 11, and path-dependent stiffness degradation in Figure 12 are examined sequentially to assess the combined influence of material, geometry, and loading history.
Figure 10.
Relationship between longitudinal and shear strains at characteristic points of the cross-section.
Figure 11.
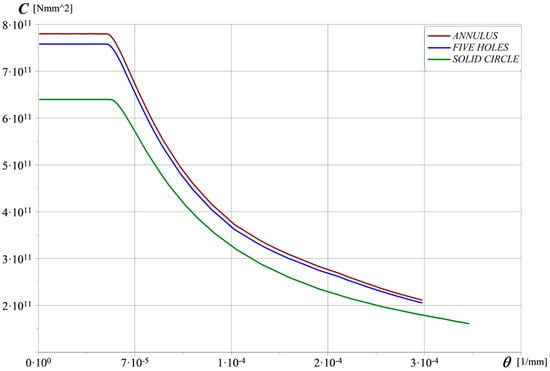
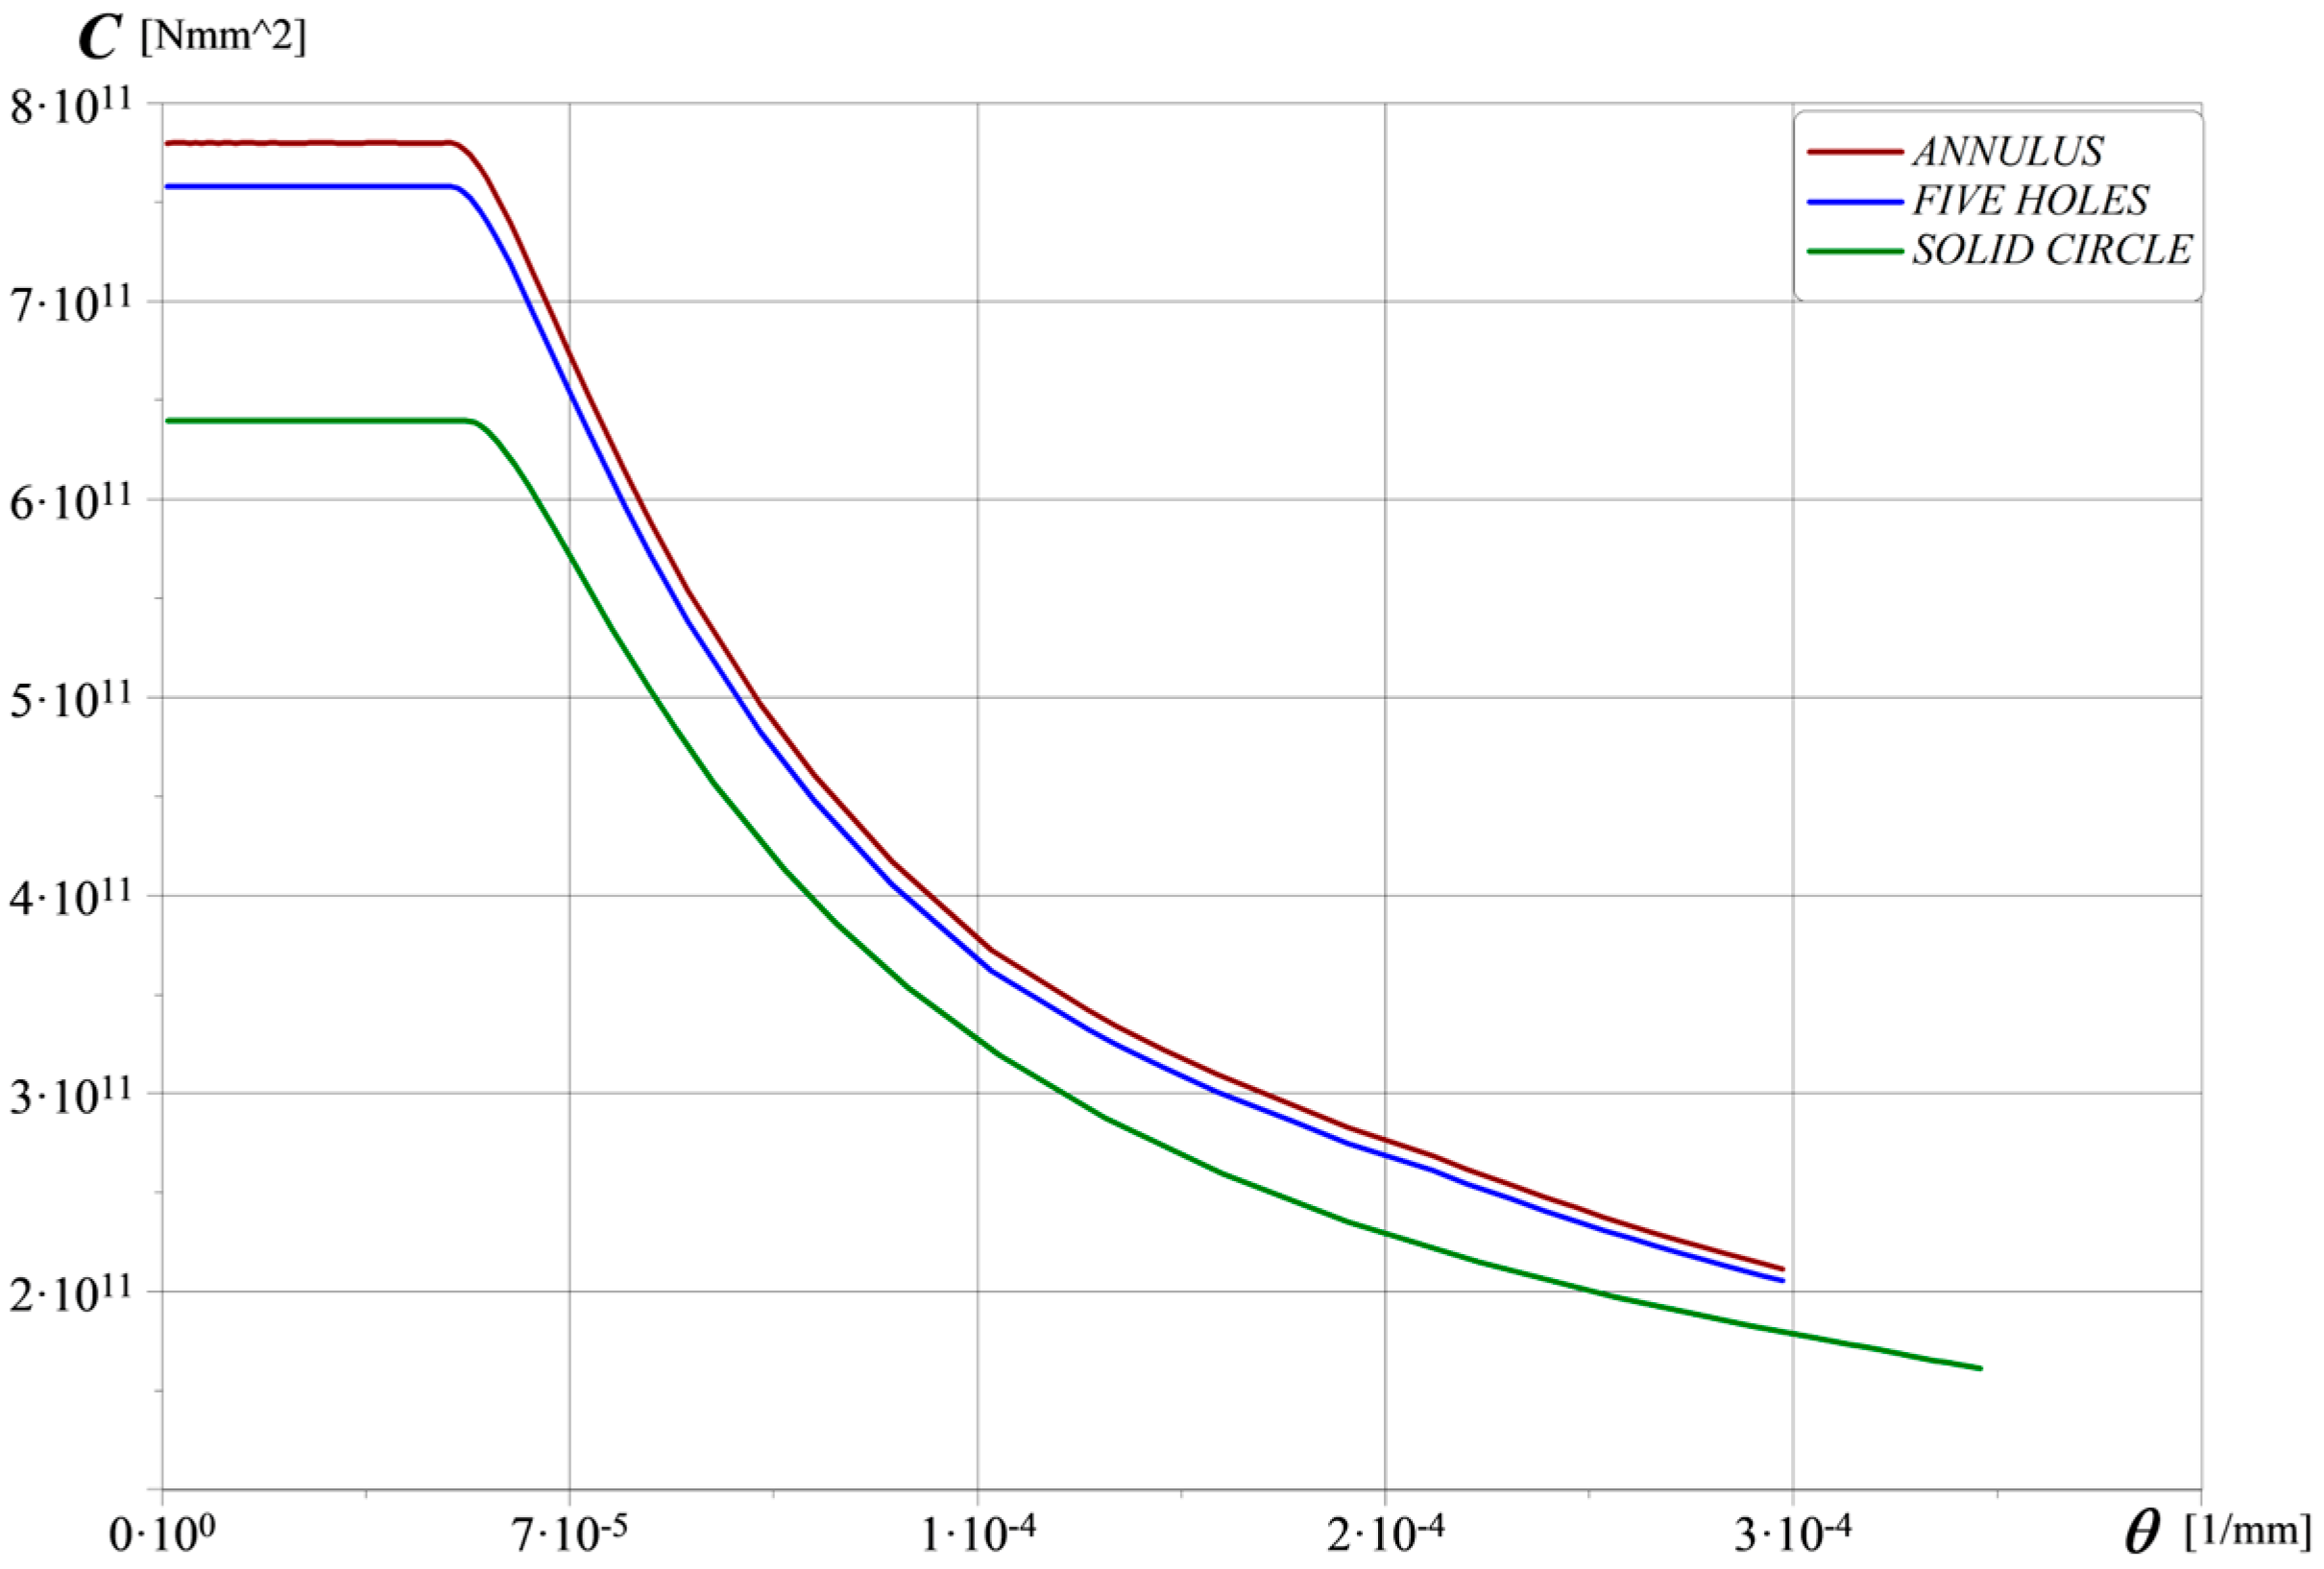
Evolution of torsional stiffness for cross-sections of equal area.
Figure 12.
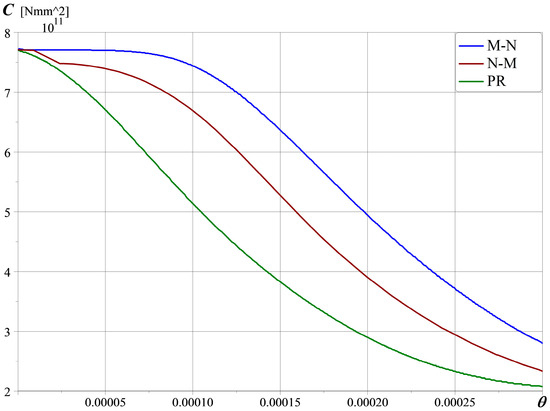
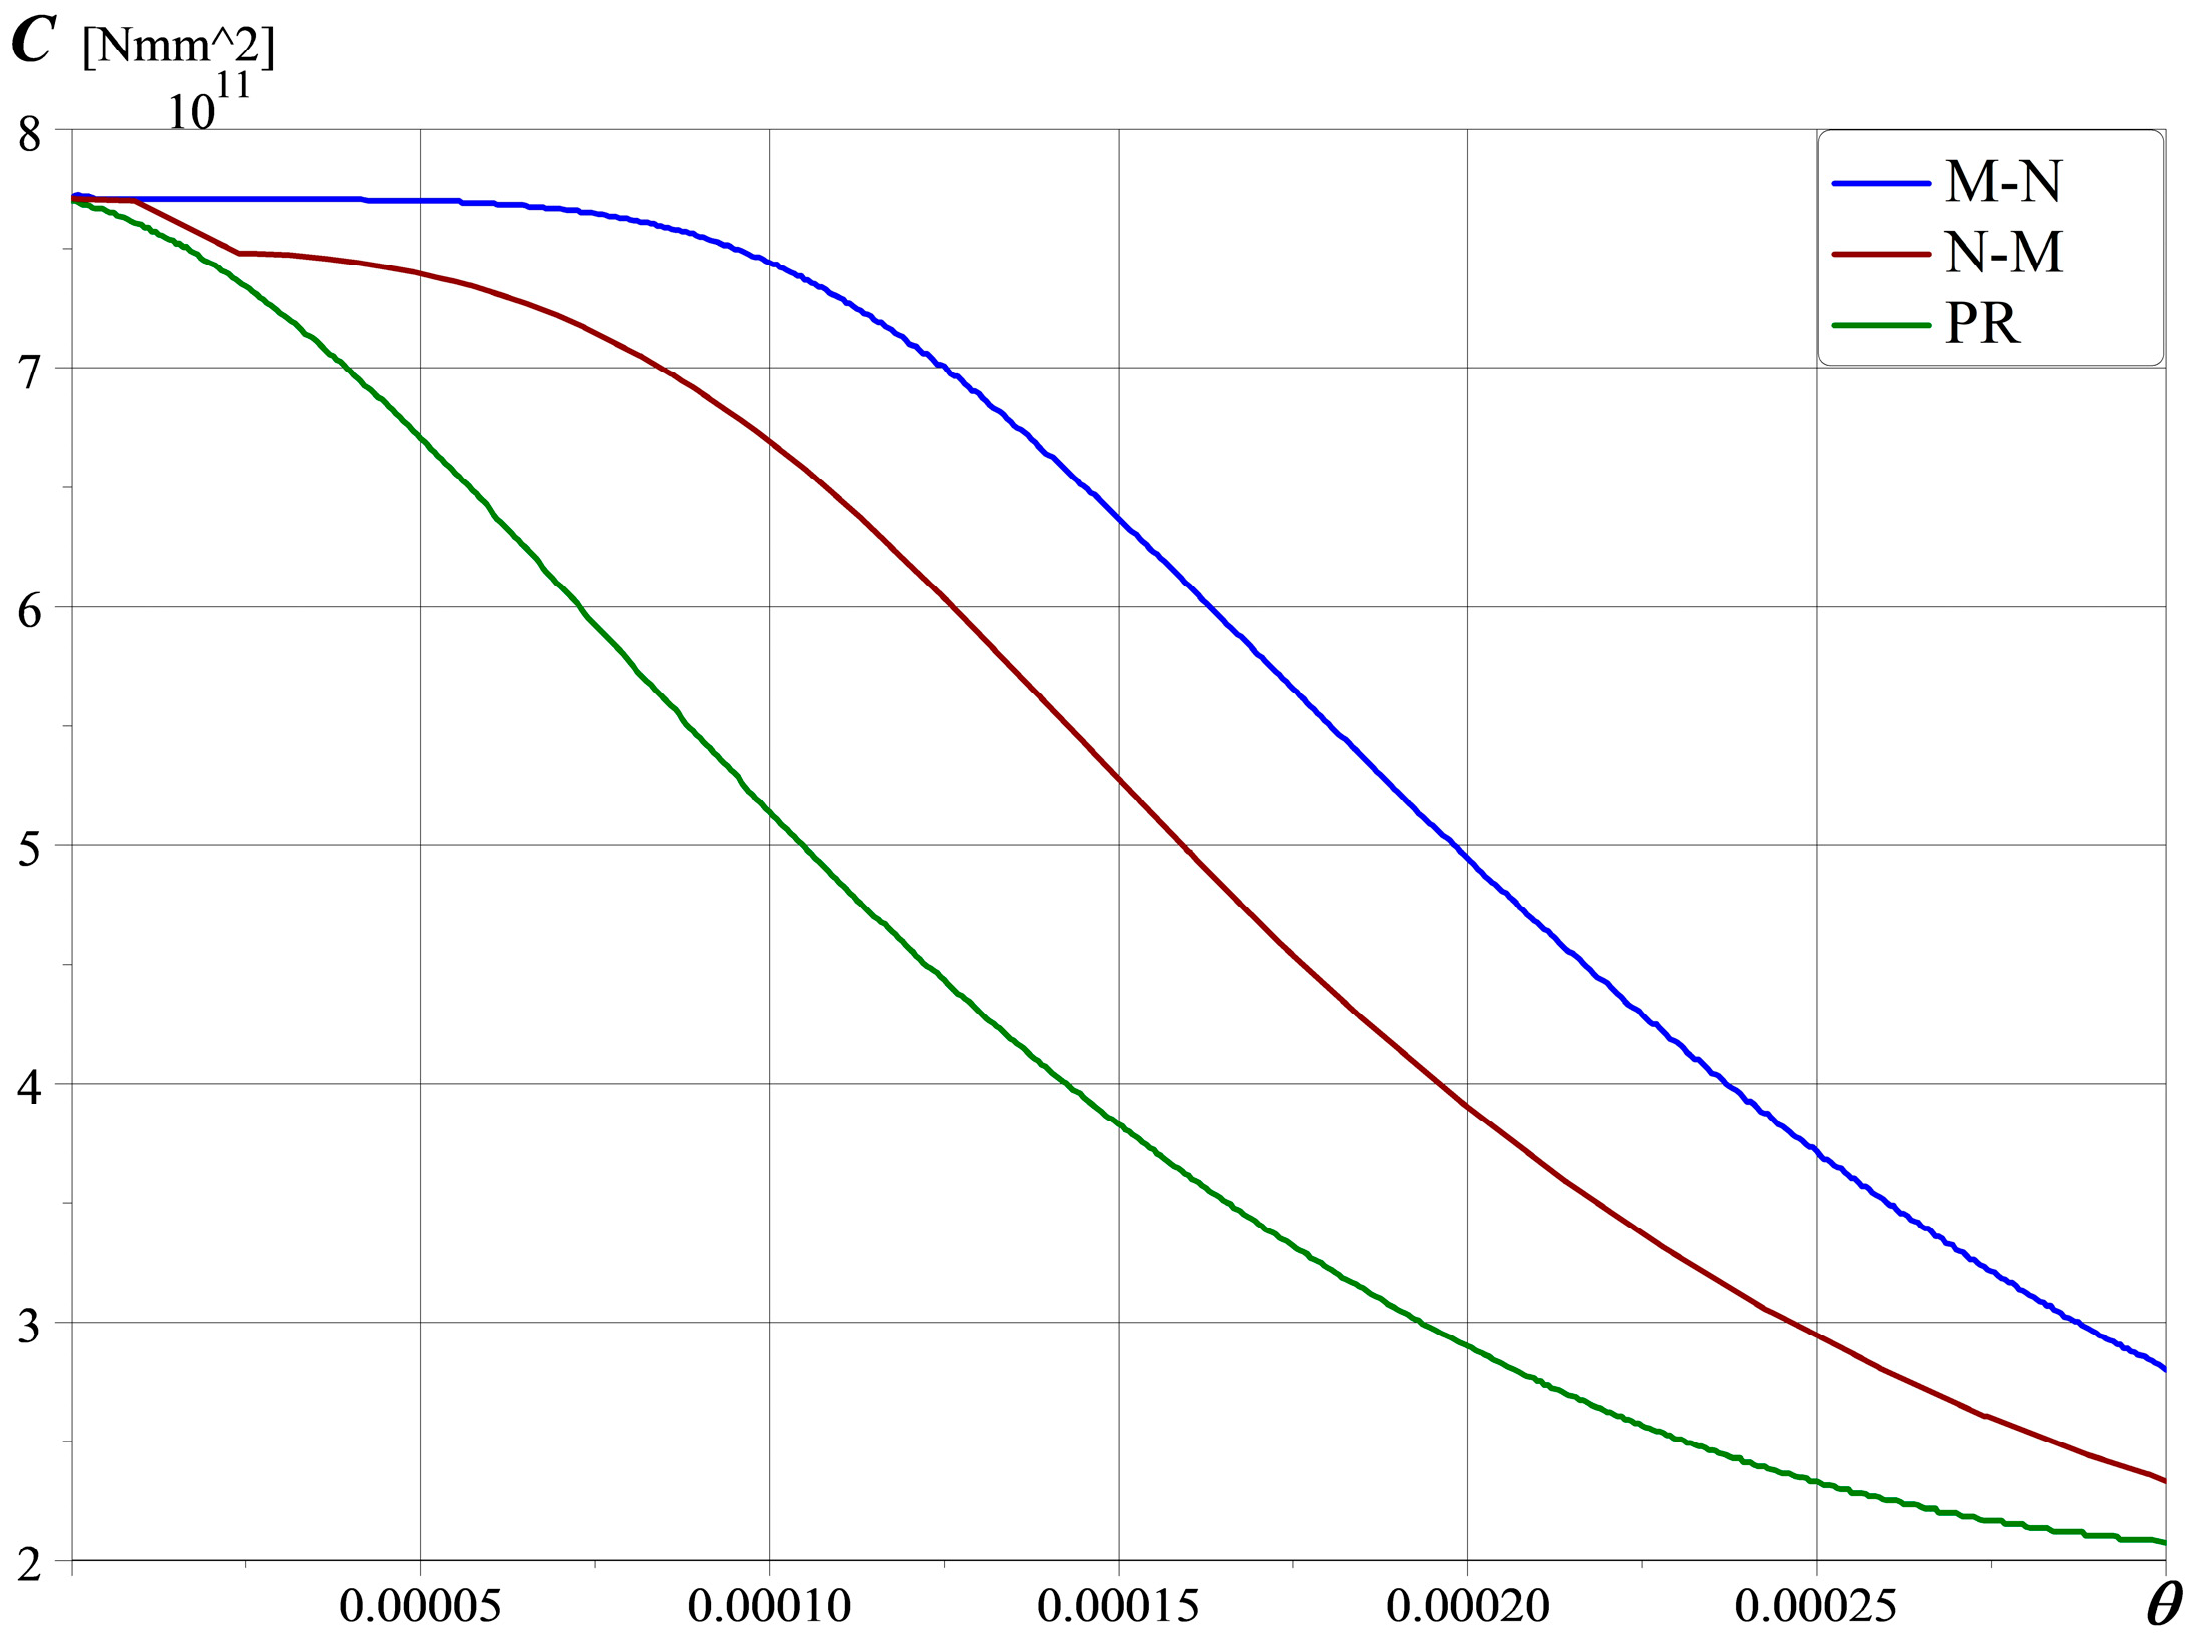
Evolution of torsional stiffness of the five-hole cross-section under the M–N, N–M and PR paths.
Figure 10 additionally demonstrates the nonuniformity of the local response: at point P2, the strains develop more intensively than at P1 and P4. This is associated with the position of P2 relative to the spaces between the holes, where the stress flow undergoes the strongest local change.
To verify the role of geometry, three cross-sections of equal area were compared: a solid circle, a concentric annulus, and a circle with five holes. As can be seen from Figure 11, the difference in stiffness is determined not only by the amount of material but also by its distribution relative to the polar center. The five-hole cross-section occupies an intermediate position: the internal holes reduce torsional resistance, while the material in the outer zone partially preserves the stiffness.
The purpose of this equal-area comparison is therefore to demonstrate the influence of topology and material distribution rather than to establish a universal ranking of perforated sections. Variations in hole number and relative hole size would constitute additional geometric design parameters and require a broader parametric study.
The final result is central to the entire paper. In Figure 12, the curves C(θ) for M–N, N–M and PR do not coincide, although states of the same cross-section are compared. This means that the loss of torsional stiffness is determined not only by the final loading level but also by the sequence in which plastic strains appear near the internal contours. Under proportional loading, degradation begins earlier; under M–N, a higher level of effective stiffness is retained in the initial segment; and N–M occupies an intermediate position. It is precisely this difference that represents the mechanical manifestation of path dependence in a multiply connected cross-section.
5. Conclusions
- The problem of elastoplastic torsion–tension of a multiply connected circular rod with one central and four lateral holes has been formulated and numerically implemented. The computational scheme combines the Prandtl stress function, a local J2 update, and a masked finite-difference grid.
- It has been shown that the holes not only reduce the cross-sectional area but also rearrange the flow of shear stresses. The most pronounced concentration of equivalent stresses occurs near the internal contours and in the spaces between the holes.
- Comparison of the trajectories M–N, N–M and PR confirms that the same final values of N and M do not lead to the same local deformation path. Therefore, for elastoplastic torsion–tension, the history of load application is of fundamental importance.
- The Prandtl–Reuss model defines the basic incremental mechanism of plastic flow, whereas the deformation-path-curvature model makes it possible to reveal the additional influence of path rotation and deformation memory under non-proportional loading.
- The loading-path dependence identified locally in the post-yield strain response also produces a significant integral effect. The maximum normalized differences in effective torsional stiffness are approximately 13% for M–N versus N–M, 33% for M–N versus PR, and 21% for N–M versus PR, demonstrating that loading history must be considered together with the terminal load state in the elastoplastic analysis of multiply connected rods.
- A comparison of cross-sections of equal area shows that torsional stiffness is determined not only by the ma terial area but also by its distribution relative to the polar center and by the configuration of the internal contours.
- The developed FDM framework provides a geometry-flexible numerical model for determining the complete stress–strain state and effective torsional response of multiply connected prismatic rods under complex elastoplastic loading. The number, size, and location of internal holes are introduced through the geometric description and can be changed without reformulating the governing equations or the solution algorithm. The five-hole configurations considered in this study serve as representative applications of the framework; their quantitative stress and stiffness characteristics are configuration-specific, whereas the computational formulation is applicable to the broader class of multiply connected prismatic cross-sections.
Author Contributions
Methodology, J.T.; software, J.T.; numerical implementation, J.T.; validation, J.T.; formal analysis, J.T.; investigation, J.T.; data curation, J.T.; visualization, J.T.; writing—original draft preparation, J.T.; conceptualization, R.A.; theoretical framework, R.A.; application of the Avarge Curvature theory, R.A.; scientific interpretation of the results, R.A.; writing—review and editing, R.A.; supervision, R.A. All authors have read and agreed to the published version of the manuscript.
Funding
This research received no external funding. The Article Processing Charge (APC) was funded by the Institute of Mechanics and Seismic Stability of Structures named after M.T. Urazbaev, Uzbekistan Academy of Sciences.
Institutional Review Board Statement
Not applicable.
Informed Consent Statement
Not applicable.
Data Availability Statement
The data presented in this study are available on request from the corresponding author due to privacy.
Acknowledgments
The authors gratefully acknowledge the Institute of Mechanics and Seismic Stability of Structures named after M.T. Urazbaev, Uzbekistan Academy of Sciences, for creating favorable research conditions and providing access to the technical infrastructure necessary for carrying out this study.
Conflicts of Interest
The authors declare no conflicts of interest. The funder had no role in the design of the study; in the collection, analyses, or interpretation of data; in the writing of the manuscript; or in the decision to publish the results.
Abbreviations
The following abbreviations are used in this manuscript:
| FDM | Finite-difference method |
| SOR | Successive over-relaxation |
References
- Ieşan, D. Classical and Generalized Models of Elastic Rods; Chapman & Hall/CRC: New York, NY, USA, 2009. [Google Scholar] [CrossRef] [Scilit]
- Mironov, B.; Mironov, Y. Torsion of anisotropic and non-uniform cylindrical rods with elliptical section. MATEC Web Conf. 2018, 251, 04037. [Google Scholar] [CrossRef] [Scilit]
- Chen, H.; Gomez, J.; Pindera, M.J. Saint Venant’s torsion of homogeneous and composite bars by the finite volume method. Compos. Struct. 2020, 242, 112128. [Google Scholar] [CrossRef] [Scilit]
- Mironov, B.G.; Mironov, Y.B. Torsion of non-uniform cylindrical and prismatic rods made of ideally plastic material under linearized yield criterion. Mech. Solids 2020, 55, 841–848. [Google Scholar] [CrossRef] [Scilit]
- Babamuratov, K.S.; Abirov, R.A. On physical reliability in the theory of plasticity. Strength Mater. 2001, 33, 1–7. [Google Scholar] [CrossRef] [Scilit]
- Abirov, R.A. On complex loading of cylindrical shell. AIP Conf. Proc. 2024, 3119, 050001. [Google Scholar] [CrossRef] [Scilit]
- Abirov, R.A. On the physical reliability and taking complex loading into account in plasticity. Mater. Sci. 2008, 44, 512–516. [Google Scholar] [CrossRef] [Scilit]
- Franců, J.; Rozehnalová-Nováčková, P. Torsion of a bar with holes. Eng. Mech. 2015, 22, 3–23. [Google Scholar]
- Toro, S.A.; Aranda, P.M.; García-Herrera, C.M.; Celentano, D.J. Analysis of the elastoplastic response in the torsion test applied to a cylindrical sample. Materials 2019, 12, 3200. [Google Scholar] [CrossRef] [Scilit] [PubMed]
- Bayat, Y.; Ekhteraei Toussi, H. Elastoplastic torsion of hollow FGM circular shaft. J. Comput. Appl. Res. Mech. Eng. 2015, 4, 165–180. [Google Scholar] [CrossRef] [Scilit]
- Chouly, F.; Hild, P. On a finite element approximation for the elastoplastic torsion problem. Appl. Math. Lett. 2022, 132, 108191. [Google Scholar] [CrossRef] [Scilit]
- Chouly, F.; Gustafsson, T.; Hild, P. A Nitsche method for the elastoplastic torsion problem. ESAIM Math. Model. Numer. Anal. 2023, 57, 1731–1746. [Google Scholar] [CrossRef] [Scilit]
- Xu, B.; Zhang, R.; Yang, K.; Yu, G.; Yu, C. Application of generalized finite difference method for elastoplastic torsion analysis of prismatic bars. Eng. Anal. Bound. Elem. 2023, 146, 939–950. [Google Scholar] [CrossRef] [Scilit]
- Wang, H.; Zhang, X.; Wu, W.; Liaw, P.K.; An, K.; Yu, Q.; Wu, P. On the torsional and coupled torsion-tension/compression behavior of magnesium alloy solid rod: A crystal plasticity evaluation. Int. J. Plast. 2022, 151, 103213. [Google Scholar] [CrossRef] [Scilit]
- Chung, J.H.; Heo, J.S.; Lee, J.J. Modeling and numerical simulation of the pseudoelastic behavior of shape memory alloy circular rods under tension-torsion combined loading. Smart Mater. Struct. 2006, 15, 1651–1662. [Google Scholar] [CrossRef] [Scilit]
- Padmanabhan, R.; MacDonald, B.J.; Hashmi, M.S.J. Elastic-plastic behaviour of an AlSiC MMC rod under combined tension and torsion loading. J. Mater. Process. Technol. 2004, 155–156, 1756–1759. [Google Scholar] [CrossRef] [Scilit]
- Chen, J.F.; Guan, Z.P.; Yang, C.H.; Niu, X.L.; Jiang, Z.T.; Song, Y.Q. Comparison of strain ranges and mechanical properties of metal rods under tension and torsion tests. J. Jilin Univ. Eng. Technol. Ed. 2018, 48, 1153–1160. [Google Scholar] [CrossRef]
- Zhang, Y.; Yaghoobi, M.; Zhang, Y.; Rubio-Ejchel, D.; Kenesei, P.; Park, J.-S.; Rollett, A.D.; Gordon, J.V. In situ measurement of three-dimensional intergranular stress localizations and grain yielding under elastoplastic axial-torsional loading. J. Mater. Res. Technol. 2024, 30, 8792–8804. [Google Scholar] [CrossRef] [Scilit]
- Papasidero, J.; Doquet, V.; Mohr, D. Ductile fracture of aluminum 2024-T351 under proportional and non-proportional multi-axial loading: Bao–Wierzbicki results revisited. Int. J. Solids Struct. 2015, 69–70, 459–474. [Google Scholar] [CrossRef] [Scilit]
- Xu, Y.; Zhou, J.; Farbaniec, L.; Pellegrino, A. Optimal design, development and experimental analysis of a tension–torsion Hopkinson bar for the understanding of complex impact loading scenarios. Exp. Mech. 2023, 63, 773–789. [Google Scholar] [CrossRef] [Scilit]
- Jog, C.S.; Mokashi, I.S. A finite element method for the Saint-Venant torsion and bending problems for prismatic beams. Comput. Struct. 2014, 135, 62–72. [Google Scholar] [CrossRef] [Scilit]
- Wang, C.H. Multi-phased solutions of Prandtl’s stress function for an orthotropic rectangular bar under Saint-Venant’s torsion and the general rule of swapping. Heliyon 2024, 10, e38329. [Google Scholar] [CrossRef] [Scilit] [PubMed]
- Ike, C.C. Galerkin solutions for the Saint-Venant torsion of prismatic bars with rectangular cross-sections. Adv. Model. Anal. A 2019, 56, 13–20. [Google Scholar] [CrossRef] [Scilit]
- Simo, J.C.; Hughes, T.J.R. Computational Inelasticity; Springer: New York, NY, USA, 1998. [Google Scholar] [CrossRef] [Scilit]
- de Souza Neto, E.A.; Perić, D.; Owen, D.R.J. Computational Methods for Plasticity: Theory and Applications; John Wiley & Sons: Chichester, UK, 2008. [Google Scholar] [CrossRef] [Scilit]
- Steinberg, D.J.; Cochran, S.G.; Guinan, M.W. A constitutive model for metals applicable at high-strain rate. J. Appl. Phys. 1980, 51, 1498–1504. [Google Scholar] [CrossRef] [Scilit]
- da Silveira, T.; Baumgardt, G.; Rocha, L.A.O.; dos Santos, E.D.; Isoldi, L.A. Geometric investigation of thin perforated steel plates under biaxial elasto-plastic buckling by using constructal design. Rep. Mech. Eng. 2024, 5, 43–67. [Google Scholar] [CrossRef] [Scilit]
- Galuppi, L.; Royer-Carfagni, G. Membrane analogy for multi-material bars under torsion. Proc. Math. Phys. Eng. Sci. 2019, 475, 20190124. [Google Scholar] [CrossRef] [Scilit] [PubMed]

Disclaimer/Publisher’s Note: The statements, opinions and data contained in all publications are solely those of the individual author(s) and contributor(s) and not of MDPI and/or the editor(s). MDPI and/or the editor(s) disclaim responsibility for any injury to people or property resulting from any ideas, methods, instructions or products referred to in the content. |
© 2026 by the authors. Licensee MDPI, Basel, Switzerland. This article is an open access article distributed under the terms and conditions of the Creative Commons Attribution (CC BY) license.