


Abstract
In this study, novel exact solutions of the Duffing equation with their phase portraits are proposed and reasoned. It is shown that phase trajectories are initially elliptical and become distorted in the unstable area with the growth of the variable parameter in the damped case. The instability criteria of the identified solutions have been determined together with the Fourier series transformation up to the first and high harmonics in the sense of the physical interpretation. An explicit form for the non-linear differential operator corresponding to the considered functions has been derived, and its main functional spectrum has been evaluated. Non-isothermal creep tests of different materials were completely described using the Duffing equation via noted solutions up to the fracture as processes with a personal deformation response. We successfully examined the relationship between the thermal and magnetic properties of the ferromagnetic amorphous alloy under its non-linear deformation, using the critical exponents equal to α1 = 2 and α2 = 1. With high linear correlation coefficients (0.9 and above) between our model and experiments (within ±0.01 mm of residual error), the behavior of organic and metallic systems is well predicted under the same thermomechanical testing conditions on the mesoscale.
1. Introduction
A quantitative description of various non-linear processes using basic mathematical functions (or their superposition) remains incomplete in the fields of applied mathematics, physics, and technics [1,2,3,4,5,6,7,8]. In this case, the presence of numerous key accompanying factors [9,10] and their complicated relations [11,12] becomes the main barrier to obtaining necessary information. Furthermore, for some differential equations describing such processes, there are no main methods for obtaining an explicit solution, and one can apply complicated special functions [13] that affect practical versatility and quantitative model prediction [14]. In some cases, an exact solution is expressed only with local special functions [15] whose application cannot be practically effective, especially under irreversible or non-equilibrium conditions, and approximation becomes useful somehow there [16]. The Duffing equation [17,18], which is a homogeneous (or inhomogeneous) ordinary second-order non-linear differential equation describing damped (undamped) oscillations, can be mentioned, for example. A physical or engineering illustration for this equation is an ideal dynamical system consisting of a parallel-connected inelastic spring and a non-linear viscous cylinder pump (broadened Maxwell or Kelvin–Voigt models) [19]. An effective interpolation or analytical derivation of a solution for the differential equation is the direct and most precise method for describing non-linear oscillator behavior. A clear understanding of the transition conditions between linear and nonlinear stages becomes possible with explicit and mathematically simple solutions [20]. From theoretical and applied perspectives, analysis of the phase portraits and stability at any given solutions [21] with variation in its free parameters is supposed to be also important.
Phase transitions (or critical phenomena) can cause the noted nonlinearity, for example, in polymers and different alloys [22,23]. In experiments, such effects appear in differential scanning calorimetry [24,25] and in different diffraction patterns [26,27]. Some effects are described in phase diagrams (component mass vs. temperature, and so on) [28]. In numerous systems, heating rate and other driving parameters, for instance, described with amplitude–frequency response (AFR) in mechanical testing, have an additional impact on nonlinear processes [29]. Despite the proposed, well-known theory of second-order phase transitions [30,31], its use can be ineffective in certain cases (also for first-order transformations) due to a personal system complexity (like renormalization groups, etc.). Therefore, a proposal of new model approaches, according to critical exponents under nonlinear conditions, seems to be necessary. Here, a combination of several theoretical concepts (mechanical with thermodynamic, for instance) is complementary, and it could become a foundation for the comprehensive model description [32,33]. It is also known that the different testing machines used for dynamo-mechanical (DMA) and thermo-mechanical (TMA) analysis impose the upper limit of the heating rate [34] that must be considered in real nonlinear experiments, involving a ten times faster temperature reach and multiple phase transitions.
As we mentioned above, deformation of the materials involves both a viscoelastic [35] and a nonlinear [36] scenario. For instance, non-isothermal creep [37,38] and DMA [39] are nonlinear deformation experiments due to the absence of the exponential elastic response in their plots, and the monotone heating combined with oscillating mechanical load causes resonance effects with attractors in phase portraits [40]. Besides the proposed relationships for thermo-mechanical conditions [41,42], a suggested master differential equation with stability analysis of solutions is necessary for non-isothermal deformation. Comprehensive modeling of some critical effects that arise in different systems under the same thermo-mechanical conditions is also of interest for possible switching between the special cases throughout the process [43,44].
Thus, we set the goal here to generally determine the master nonlinear differential equation describing thermo-mechanical processes with constant or oscillating loads and different heating modes. Analysis of the equation with solutions considering the mathematical stability under linear or nonlinear deformation tests is the important task for this study. Fractography of materials undergoing the creep tests at a constant heating rate with phase transition will be separately considered.
2. Experimental Procedure
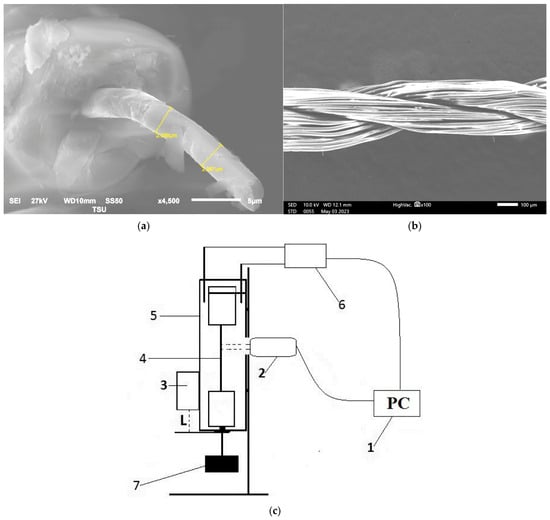
Apart from the model analysis conducted in frames of the master nonlinear differential equation and its solutions probative empirical data were collected with laboratory equipment to study non-isothermal creep [37]. We used amorphous magnetic alloys (also metallic glasses or MG, at. wt.%, AMAG-183: Co-82.69%, Fe-2.21%, Si-7.77%, Mn-4.19%, B-2%, Cr-1.14% and AMAG-200: Fe-80.22%, Si-8.25%, Cu-1.44%, Nb-10.09%), manufactured like Vacuumschmelze or Metglass products, and polycrystalline alloys (pt. wt.%: Al-98%, Fe-2%) together with non-crystalline magnetic micro-rods (pt. wt.%: Co-75%, Ni-0.9%, Fe-6%, Si-8%, B-7%, Cr-3.1%) as the testing specimens. The deformation behavior of an organic structure (a silk fiber) was estimated under the same temperature conditions for comparison with alloys. The size of AMAG-183 and AMAG-200 ribbons was about 55 × 3.5 × 0.015 mm by length, wide, and thickness, respectively, while the polycrystalline specimens were made in a 50 × 6 × 0.01 mm configuration. Magnetic micro-rods (or just named «rods» here) of 3 μm in diameter by themselves were initially fabricated inside a cylinder glass cover about an 8 μm radius (see Figure 1a) with the possible change up to 50 mm in length.
Figure 1.
Geometry and structure of the (a) micro-rod; (b) silk fiber; Loading scheme under creep testing (c): 1 computer, 2 laser pyrometer, 3 laser sensor (measuring elongation), 4 specimen, 5 furnace, 6 temperature switcher, 7 static load.
The silk fiber has a wicker rope-like structure with the maximal diameter of about 267 μm across the 30 filaments and a thickness of about 16 μm per filament (see Figure 1b).
During non-isothermal uniaxial (vertical) creep tests of AMAG alloys and silk fibers, the VT = Const fixed heating rate was reached as 1, 2 or 3 K/s with applied 1, 17 or 42 N constant loads for MGs but 0.1 N for the organic system. Crystalline alloys were tested at the same VT values, but under applied loads of 1, 1.5 or 3 N. The amorphous magnetic rod manifested the similar creep scenario at VT = 1 K/s and under 0.1 N of load. The mentioned difference between loads and heating rates is caused by the isothermal tensile stress of materials as a room-temperature limit for the possible experimental conditions also considering the literature data (for example, see [45]). For all the mentioned investigations, initial factors (i.e. the heating rate and load) were selected either separately or together to determine the system stability against the external impact (see Table 1). In summary, all the mentioned tests together were carried out about 1000 times for quantitatively identification of the statistical appearance in behavior (mentioned below in the text, C, B experimental parameters are mean values for the collected numerical set, and x0 is the constant term, which can be chosen either as initial distance from a specimen loaded edge to the elongation sensor (our case—see L in Figure 1c) or as initial specimen length).
Table 1.
Experimental conditions and used specimens (with their amount mentioned in brackets).
For structural testing of specimens before and after experiments, we used D2 Phaser (Bruker, Billerica, MA, USA) and XRD-7000S X-Ray (Shimadzu, Kyoto, Japan) diffractometers. The melting and glass-transition temperatures of a silk fiber (with 1.426 mg mass) were determined using an EXSTAR TG/DTA 7200 (Hitachi, Chiba, Japan) complex both in the air atmosphere and a carbon dioxide stream (at the 50 mL/min flow rate) on a platinum substrate. The amorphous ribbons were annealed with a SNOL 8.2/1100 (SnolTherm, Utena, Lithuania) furnace for 10, 25, and 38 min. Fractography, plastic flow, and melting were examined using optical or scanning electron microscopy (Vega3, Tescan, Brno, Czech Republic and JCM-7000, Jeol, Tokyo, Japan). Magnetic properties of metallic glasses were studied before and after mechanical testing with a LakeShore-7407 (Lake Shore Cryotronics, Westerville, OH, USA) magnetometer under ±125–1000 Oe external field both in parallel and perpendicular projections relative to specimens.
3. Results and Discussion
3.1. Model Basement and Analysis
To enable a universal analysis of various non-linear thermo-mechanical processes (like non-isothermal creep here or DMA in [29,40,41]), we propose some exact solutions for the master differential equation. Therefore, it is necessary to formulate and prove two basic theorems on explicit solutions.
Let us define the
function with positive x0 constant, C and B parameters, and t variable, determined in a [0; B) half-open interval. Thus, there is a following theorem.
Theorem 1.
Function (1) is an exact solution of the
non-linear homogeneous differential equation, where is a cubic polynomial by x variable with −6/B2, −6/CB, −2/C2 constant coefficients at x, x2, and x3 positive terms, respectively, with −2C/B3 coefficient as the free term.
The proof for this theorem is provided in the Appendix A.1 section. Similarly to Theorem 1, formulation of the second theorem about an explicit solution is possible.
Let the
function be defined in the [0; B) half-open interval, where the first two terms form (1) with b and ω as positive constants.
Theorem 2.
Function (3) is an exact solution of the
non-linear inhomogeneous differential equation, where is a cubic polynomial by x and t variables with −6/B2, −6/CB, −2/C2 constant coefficients at x, x2, and x3 positive terms, respectively, with −2C/B3 coefficient as the free term, and .
The reasoning for the Theorem 2 is similar to the proof for the Theorem 1 considering the transfer of the harmonic term (from the right side in (4) to the left side), and we get the final identity 0 = 0 (see the Appendix A.2).
The physical and engineering meaning of (2) is an undamped Duffing non-linear differential equation (i.e., , where are constants) describing free oscillations of an inelastic spring parallel combined with a piston under its periodical viscous rubbing in a cylinder (in case (4), we can notice a damped pendulum ) [19]. Accurate to the m mass, the meaning of (1) can be clearly shown, i.e. within the growth of heating temperature, an elastic reaction of the specimen weakens and deformation accelerates to the third-order value by x in t time. The stability point shifts rapidly toward fracture, and viscosity of the material can generate beating, resonance, and other phase effects (bifurcations) [41]. As a result, the rational function (1) is accurately applied in experiments [29,40,41] across the entire mesoscale. A similar conclusion is valid for the Equation (4) with sine or cosine in the right side. Herewith, there are several ways to represent this equation. In original Duffing’s work [17], the term involving the first time derivative of coordinate is not mentioned, but it can be generally included in the representations [18,19]. By using (1), the x or x2 term is replaced with a non-linear expression of . To achieve this, we may use the substitution in relative form [37],
wherein , and is an initial longitudinal coordinate or just a constant (details are also provided in the Appendix A.3). Already known solutions such as Jacobi and Weierstrass elliptic functions [14,15,16] describe the viscoelastic region, and (1) or (3) provide modeling for elastic and plastic deformation flow with the further fracture of the specimens (xo, B, C, ω, b are initial length, fracture time, flow coefficient, cyclic frequency, and loading amplitude, respectively). A replacement of the x3 term using (5) yields an expression for non-linear (non-Newtonian, dilatant) viscosity as appears with the 3/2 power there, while x2 describes linear internal friction (or just the x term as (5) provides pseudoplastic flow with the 1/2 power). This allows us to define clearly which non-linear flow regimes emerge during claimed deformation. Also (1) and (3) can be transformed to the viscoelastic deformation function (Maxwell-Voigt model [35]) in the limit transition. To achieve this, we need the reaction force function (see Equation (7) and the force vector diagram from [41], also see Appendix A.4 here): , derived using (1) and (3) in frames of the second Newton’s law, whose special case is the Duffing equation, i.e., the term describes the specimen response. Then, with , and, in order of smallness, the term –kΔx = –6mΔx/B2 being material elastic force will slower tend to zero in comparison with others, i.e. (also, some analysis on this can be found in [41]). Therefore, with respect to the mentioned reasoning, the master Duffing equation becomes to the form, whose solution is known as Maxwell-Voigt viscoelastic function. Thus, the reaction force function transforms to the elastic model regime while non-linear (1) or (3) solutions tend to isothermal functional case with and q parameters. Note that with temperature decrease comparable to VT, curves (1) and (3) demonstrate relaxation like an isothermal model graph, and that testifies about relation between viscoelasticity and proposed solutions. Finally, the Duffing Equation (2) becomes to Maxwell or Kelvin-Voigt models with equality to zero of terms containing higher x coordinate powers (>1), and if , where E, η are Young’s modulus and dynamic viscosity (constants in the elastic region), respectively, and is a limited temperature difference at constant heating rate. For instance, in discussed experiments, t(VT) can be explicitly determined as a linear [37] function that allows for the limit transition.
Besides (1) and (3) solutions, their separate superposition with a linear function is also acceptable as the second-order derivative by time completely eliminates the linear term, and a proof for applicability becomes similar to the described reasoning in the Appendix A.1. Thus, in this study, three novel major types of explicit solutions for the Duffing equation are proposed with the further discussion of their application in different non-linear cases (plastic deformation with fracture) using exact relationships instead truncated complex-valued series [21] or special integral functions in the quasi-linear region [14,15,16]. Using Equation (5), one can obtain the analytical form of a differential operator A, i.e., , which differs from form in linear algebra (where λ is an eigenvalue of A, M = C/Bxo, N = xo/C). This non-linearity of A permits estimation of its basis functions, which generate solutions to (2) or (4), and whose expression has arithmetic, trigonometric, and hyperbolic superpositions by t [46] partially related to (1) or (3) as well as with some Jacobi and Weierstrass elliptic functions. But the available representation of the basic set is only supplementary (or qualitative) as its functions themselves do not satisfy Equations (2) or (4) unlike their superpositions. Moreover, (1) and (3) are related to a differential form defined in the x-t plane [42] with some peculiarities [29] observed after its derivation. And the functions distinguishing from (1) by added terms (i.e., continuous differentiable superpositions of f(t) in the [0; B) half-open interval) form a subset of the solutions like (4) with the similar proof (like in Appendix A.2). For example, equation:
where the fourth term corresponds to the Weibull distribution [47] with the β-parameter ( represents the shrinkage velocity), and the whole function (5a) is a solution to whose partial cases describe isothermal or non-isothermal creep, DMA, TMA as well as fatigue experiments (proof details are reached in the Appendix A.5). As we mentioned above, the main condition for a non-isothermal experiment change the third term in (5a) to xo, and the function tends to zero with the fixed β in a finite temperature interval ΔT. For isothermal experiments, (5a) is surely considered without the t = f(VT) relationship, when constant C, B, q, β, ω parameters will determine a sigmoid deformation curve (more details can be obtained in the Appendix A.6).
During analysis of the differential equations their stability (by Lyapunov or Poincare), phase portraits (for cyclic solutions), and resonance conditions (perturbations, beating, etc.) [19,21] can be considered, and that assists in a universal description of different processes. For (3), analytical set of phase portraits in x, coordinates are supposed to be appropriate. Particularly, cos(ωt) and sin(ωt), in (3) with derivative, respectively, after a separate powering and the further mutual addition (to get the identity), permit derivation for the canonical ellipse equation in the mentioned phase plane:
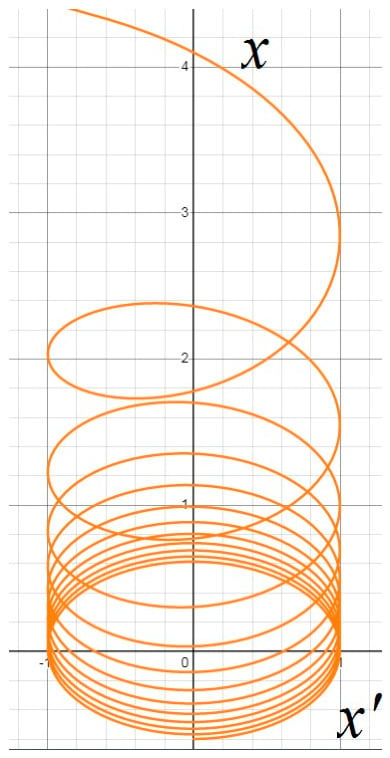
where the center depends on t, and semi-axes are determined by the amplitude-frequency response (AFR), i.e., ω and b. With equation (3) we can conclude about a shifting of the ellipse (6) and its center towards the x and axes to infinity, in the first quadrant at increasing t, and that approves instability of the phase trajectory (see Figure 2).
Figure 2.
A phase portrait plotted by Equation (6) where and x equals itself.
Also, unlimited and non-uniform changes of AFR together with other factors acting in time (such as critical heating rate or load, phase transitions, etc.) can be related to the system stability. Then, together with (4), additional expressions (like a phase equilibrium equation, and so on) can be used in a mathematical system set. Some examples of the initial conditions and pre-determining factors are described in the references [29,40,41]. Particularly, such elliptical phase trajectories was observed in [40] with a suggestion about the presence of an unknown master non-linear differential equation. Changing of the AFR and the possible resonance can be investigated either approximately [19,21] or precisely. Since some solutions of (3) are known in the explicit form, direct harmonic Fourier analysis with a(n; ω) amplitude derivation is reasonable. To make this, Equation (3) should be expressed as a trigonometric Fourier series (over the real interval) with an a(n; ω) amplitude searching to derive the AFR. The case when a(0; ω) corresponds to stable oscillations (the initial ellipse), and the amplitude is determined as:
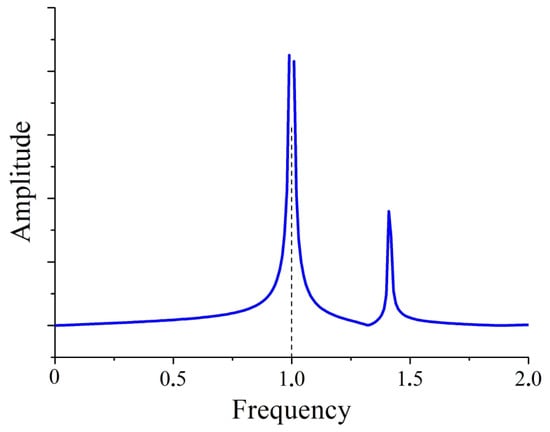
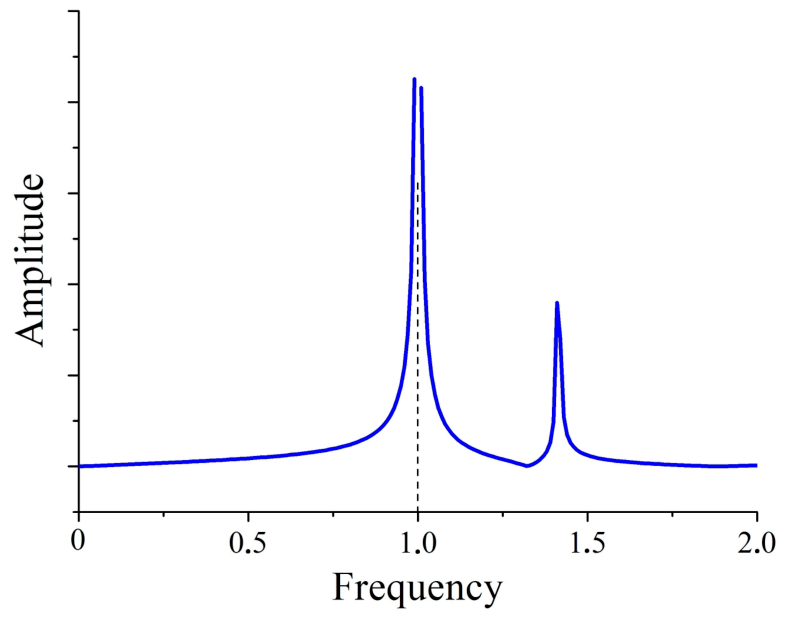
From the numerical analysis of (7), it follows that zero stable harmonics do not contain resonance elements, but the growth by n leads to instability (i.e., with constant M1 and M2 coincides qualitatively with the AFR from [19,48] and correlates as an unsmoothed signal with its averaged curve). Comparing results from [41] with the discussed model (3) and literature data [19,48], we can conclude resonance behavior in practice with beats in a «soft» or an «unsymmetrical» system (the resonance frequency ω = 2πn/B, where n is a natural number), and a qualitative AFR is depicted in Figure 3.
Figure 3.
An AFR plotted at resonance frequencies with a singular point (noted with the dashed line).
If we also take account of the above-mentioned transition from (3) to at a small t or isothermal conditions (together with ), the «viscoelastic» Kelvin-Voigt function can be expanded into the Fourier series. Then, determining a(t; ω) AFR over a variable time interval as a two-parameter function enables a qualitative description of the reversible resonance maximum achieving at an acting frequency. It is equivalent to the description of frequency-driving β-relaxation in amorphous materials under DMA [24,25], and all the terms in a Fourier series become meaningful from the applied standpoint as a response from linked oscillation pendulums (or the molecular oscillators, deforming areas) with typical interference (collective addition or subtraction of the coherent waves) and resonance [29]. As a step forward, only non-isothermal creep of different materials using the mentioned expressions from this paragraph will be analyzed below.
3.2. Non-Isothermal Creep at Different Heating Rates and Static Loads
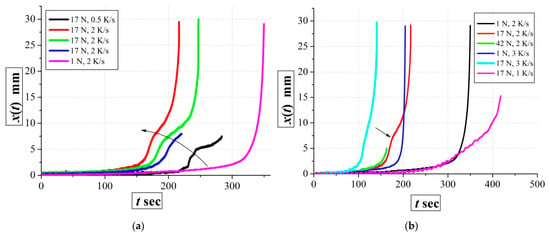
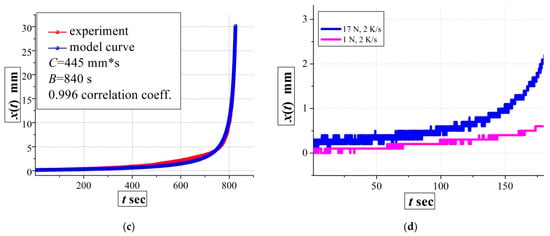
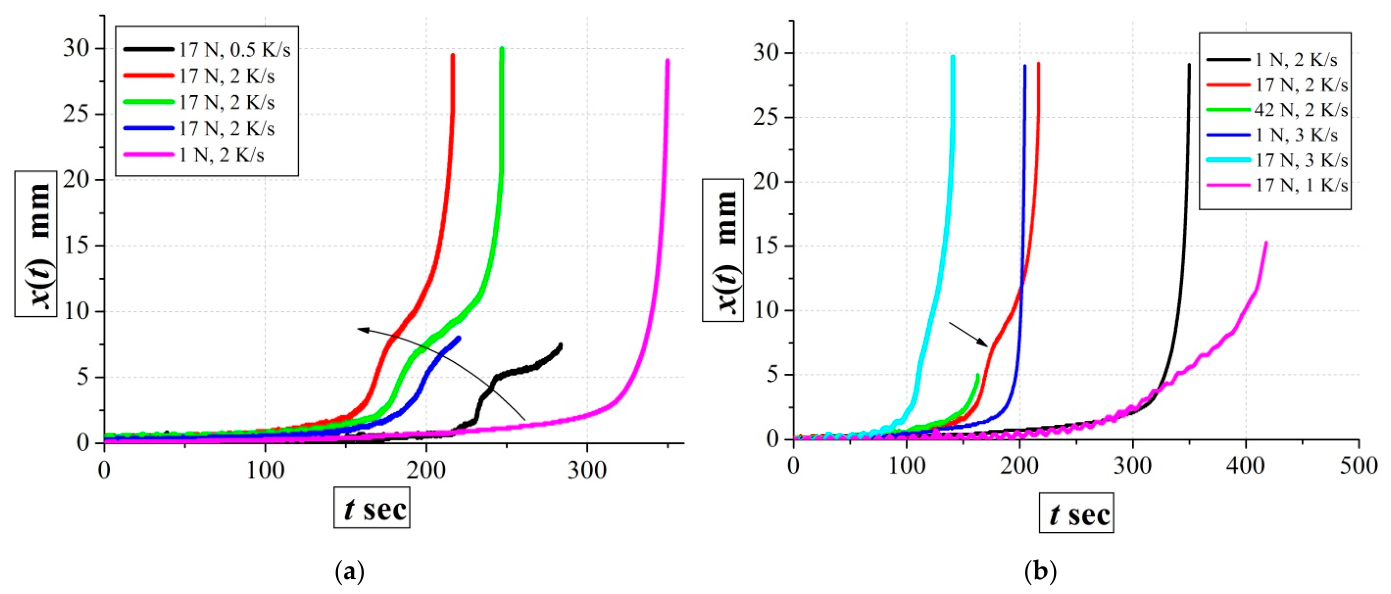
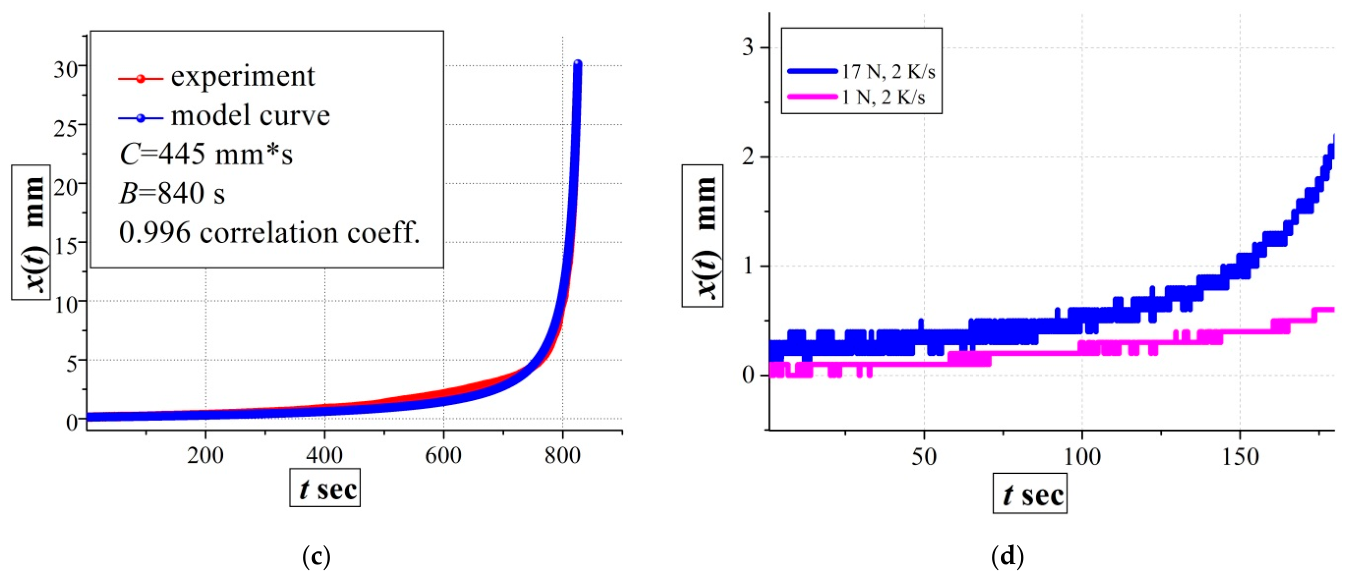
In non-isothermal creep tests on AMAG-183 metallic glasses, the deformation scenario (1) appears with the linear correlation coefficient exceeding 0.9 (and, on average, C = 400 mm·s, B = 141 s, VT = 3 K/s, gravity force (i.e., load) mg = 17 N, xo = 0.1 mm, also with ±0.01 mm of the residual error value providing a complete coincidence in the continuum mechanics scale). Due to the loading specific, harmonic oscillations, whose amplitude may be neglected, can appear on some experimental curves, or their analysis is possible with (3). Similarly, different personal values of C and B have been determined at various heating rates and loads with the same correlation order (Figure 4c). Herewith, an upward-convex bend (irreversible accelerated deformation) is repeatedly observed in the x(t) experimental plots, mainly under 17 N loading with 0.5 or 2 K/s strictly constant heating rates (Figure 4a), and that can be caused by phase-structural instability demanding analysis in frames of the proposed model (see Section 3.1). Other loads and heating rates do not provide such effect, but B lifespan increases or becomes shorter (see Figure 4b) with variations of the maximum possible elongation and C parameter. Herewith secondary-like (quasi-linear) creep behavior appears during the tests at the same heating rates and under the different loads (Figure 4d).
Figure 4.
Deformation curves x(t) of AMAG-183 MG, recorded under different heating rates and loads: (a) bending (the trend of instability is mentioned with the arrow). Blue and black curves correspond to specially unfinished tests to show independency between bending and boundary conditions; red, green, blue curves are shifted between one another to avoid the graphical overlapping during analysis; (b) a set of curves plotted by different experiments (the arrow notes a bending segment); (c) a typical non-isothermal x(t) creep curve of AMAG-183 MG, obtained under 1 N of load and 1 K/s of a heating rate for comparison; (d) a quasi-linear (secondary creep) region under non-isothermal conditions.
Similar experimental behavior was described in [38] for the nickel alloy with a proposed hypothesis about sum of deformation terms, but there were no suggestions on a master relationship (like Duffing equation) and its accompanying analysis.
To determine analytical relationships between heating rates, ΔF loads, and the plot bending, we use Equation (11) rewritten for the CDMA thermal capacity from [29] under the statically acting force condition (), i.e.,:
where G is the Gibbs energy depending on ΔF and T variables by a process (1). Using an expression for the reaction force (see Equation (4) in [29]) as
we provide the second derivative of G in (8) as
Since we analyze an arbitrary variation of the reaction force during non-isothermal creep, the G function and its derivatives are considered on the entire process sub-plane rather than along a single F(T) path, and Equation (10) should be integrated twice to obtain the G primitive (i.e., inverse derivative) function. In result, the Gibbs energy for the bending process x(t) will be expressed as:
and the equality between its and mixed derivatives confirms the validity of performed operations together with the whole approach (i.e. G is the differential form on the F-T plane). With differentiation (11) by F, it is possible to describe the bending of (1) in the expected phase transition area for the amorphous alloy as Equation (8) follows from the Clausius-Clapeyron relation [29]:
Joint numerical analysis of (12) and the bending segment in x(t(T)) demonstrates their identity (accelerated growth) at higher temperatures, and different VT affects compatibility together with the Δl curvature. The maximal achieved correlation coefficient between both functions is 0.9, but there are possible curves with lower values. Among the VT numbers, one can detect those magnitudes providing two-point crossing (double roots) between (12) and (1) with the mutual, experimentally approved, curve switching. It is known [49] that a functional jump of the first derivative by G (i.e., (12) scenario) relates to the first order phase transition in a system. Herewith, heat emission can appear such that it is described with (8) for calorimetry (similar to [29]), and the entire process corresponds to crystallization of an amorphous structure under certain loads and heating rates. Additionally, comparison of the first and second derivatives for (1) and (12), together with corresponding reaction forces (derived from Newton’s laws [41]), demonstrates irreversible accelerated deformation and material softening by (12) scenario. It is known [49,50,51] that, for the first-order phase transition, calculation of pseudo-critical exponents may be carried out by its relationship with thermodynamic potentials. As thermal capacity under F constant loading force is a characteristic parameter, its behavior during the bending can be estimated. To make this, Equation (10) multiplied by «–T» should be analyzed in a form:
considering that two powers of , i.e., α1 = 2 and α2 = 1 are critical exponents, respectively. One can see from (13) that the calculated temperature interval overlaps the Curie and crystallization points of the investigated alloy [52], and the critical exponents differ from the pure isothermal paramagnetic transition (when CF~1) [50] due to the thermal impact both on mechanical and magnetic properties. Behavior of (13) by the absolute value is equivalent to Curie-Weiss law (especially if we neglect α1 = 2 power in smallness order with ), and relation between magnetocaloric and thermal systems is known referring to critical exponents theory (where CH ferromagnetic thermal capacity under the H field is proportional to CF, i.e., CH ~ CF) [50]. Since Equation (12) also involves the difference between BVT and ΔT, the bending intensity depends on the optimal (limited) value of VT within the (0; +∞) range, along with material-specific properties described by C and B. It is experimentally approved with data in Figure 4b under 17 N of load and 1, 2, or 3 K/s heating rate. As both magnetic and thermomechanic properties conjugate in the AMAG-183 MG under mentioned conditions, then we have to additionally approve the mutual impact of spin and interatomic reorganizations on the bending effect. Note that outside the phase transition region, Equations (8), (10)–(13) are not applicable hence we will consider the bending together with its modeling in this manner.
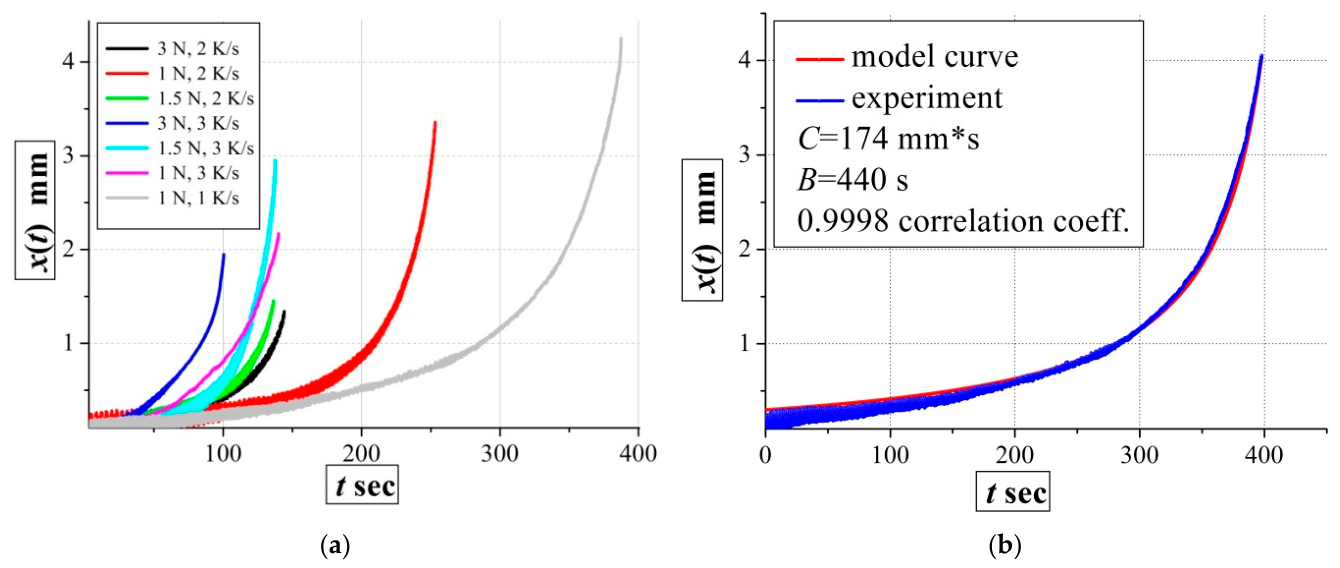
Experimental verification can be started with a comparative study of the deformation curves for AMAG-183 amorphous and Al-Fe crystalline ribbons under the same conditions (for example, on average, C = 144 mm·s, B = 306 s, VT = 2 K/s, mg = 1.5 N the gravity force depending on the tensile stress, xo = 0.1 mm, 0.9 as the correlation coefficient with ±0.01 mm of the residual error value). In Figure 5, non-isothermal creep curves of the aluminum polycrystalline alloy are depicted.
Figure 5.
Deformation x(t) relationships of Al-Fe polycrystalline alloy at different heating rates and statically acting loads (a); A typical non-isothermal x(t) creep curve of Al-Fe, obtained under 1 N of load and 1 K/s of a heating rate for comparison between the model and experiments (b).
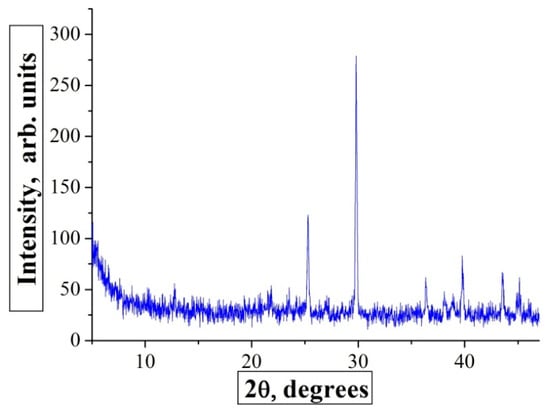
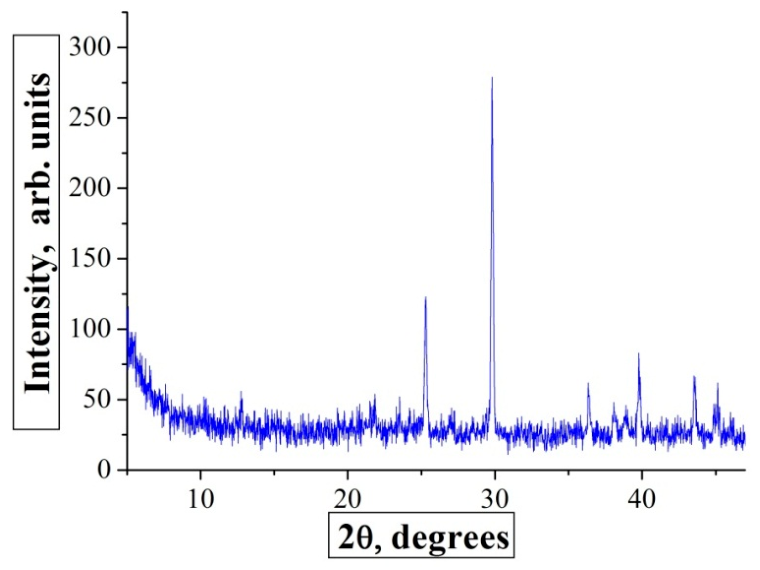
As shown in Figure 5, crystalline specimens demonstrate a relatively less plasticity compared to metallic glasses, although upper strain limit shorts similarly by the iterative growth of heating rate and loading. Herewith, the bending effect typical to MG does not appear in the curves that can be related to the absence of phase transitions (like magnetic or atomic ones) in this material due to its primary crystallization (Figure 6).
Figure 6.
XRD response from the Al-Fe polycrystalline ribbon alloy.
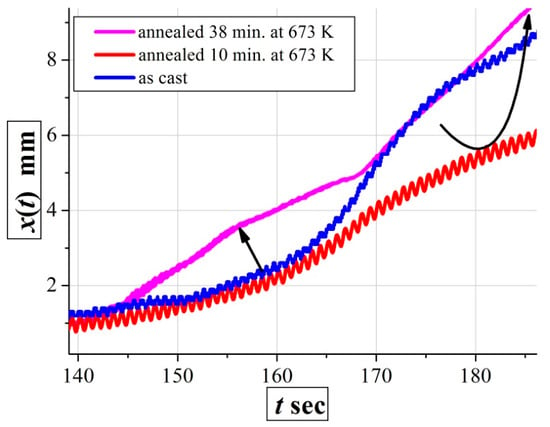
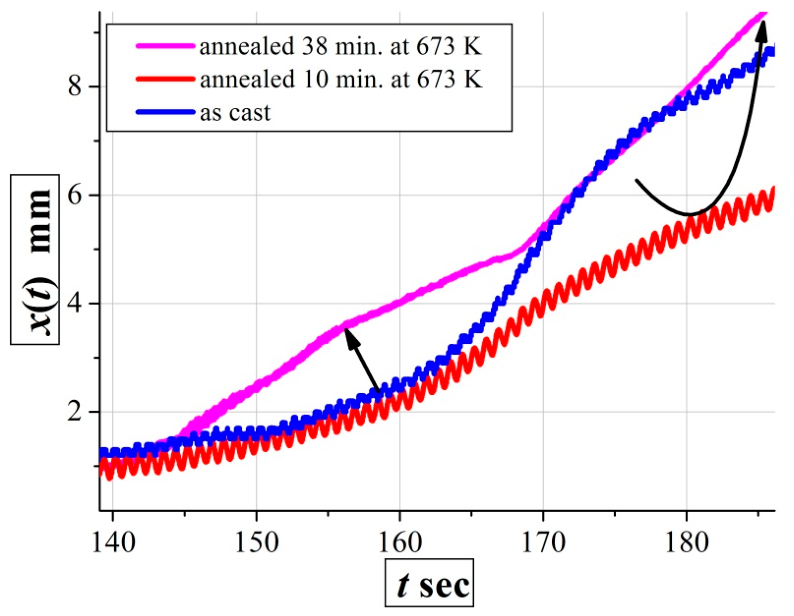
Further investigation into the relationship between initial experimental conditions and the bending of the creep curves was performed on AMAG-183 specimens, previously annealed at 673 K for 10, 25, and 38 min, with 788 K being identified empirically as the crystalline temperature [52]. In Figure 7, deformation creep curves obtained after the different annealing stages are plotted.
Figure 7.
Creep curves of as-cast and annealed AMAG-183 specimens. Arrows indicate directions to plot smoothing, and the whole experimental interval is shown with an insert.
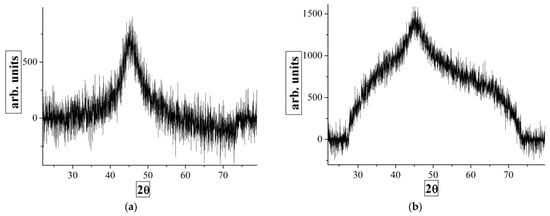
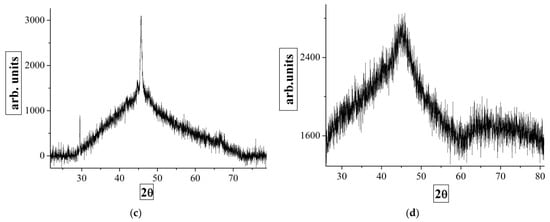
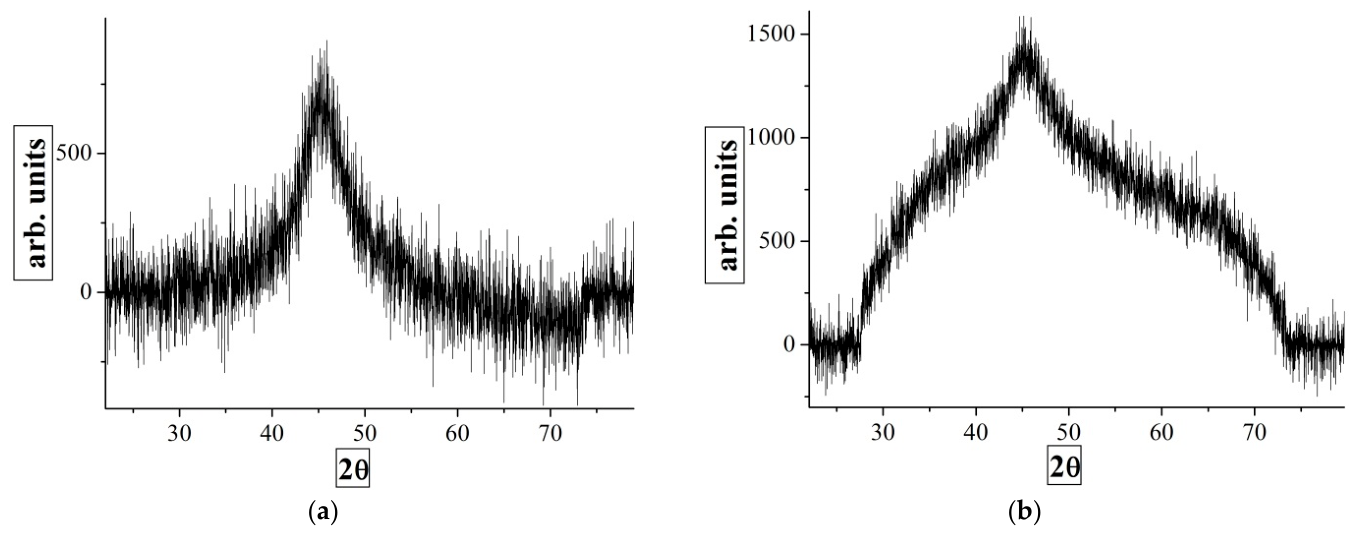
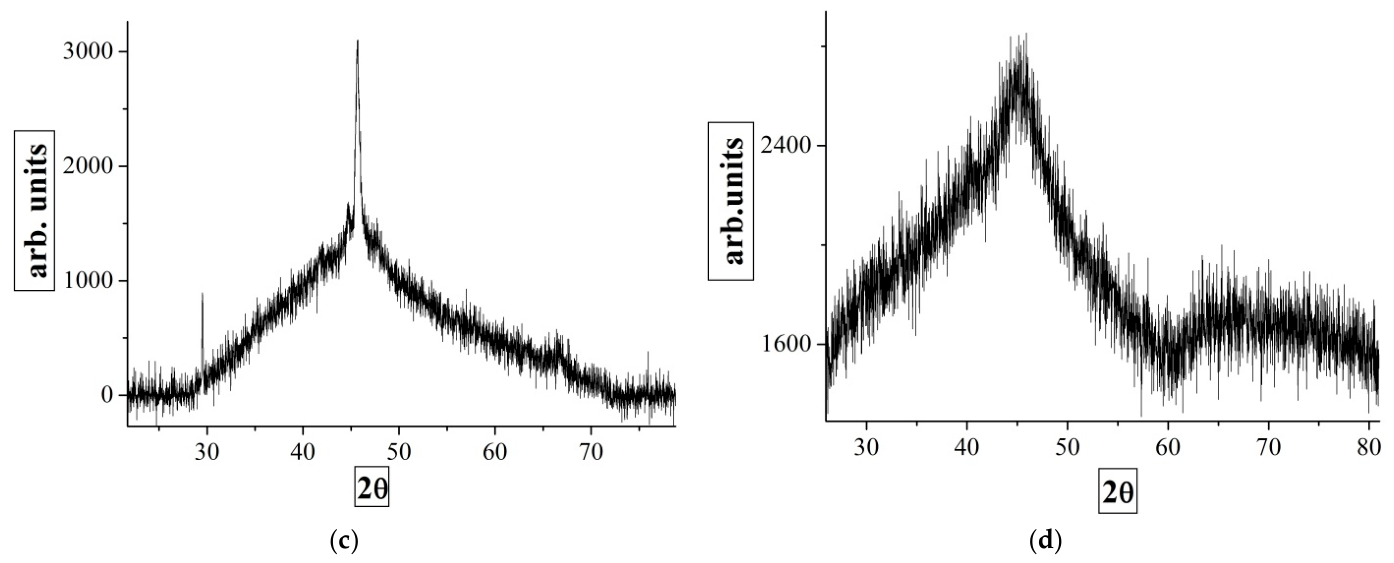
Figure 7 testifies about 1.5 times curve smoothing after 10 min. annealing at 673 K with the further 1.5–2 times extra aligning since 38 min. of the same temperature treatment regime. Expanding the specimen set for use in 10–38 min. annealing times (at 673 K) provides the plot distribution between the mentioned curves (not all of them are depicted to avoid the pointless overlapping). This behavior of experimental graphs testifies to a system shift between two positions that can be described with (1) and (3) parameterization in energy and work coordinates [42]. Annealing and creep tests induce certain structural reorganizations within the material. A treatment of as-cast AMAG-183 ribbons (Figure 8a) at 673 K for 10 min does not lead to structural crystallization (Figure 8b) even after the whole creep test, and only with the pre-annealing in 38 min (at the same temperature) using a further non-isothermal creep experiment diffraction peaks appear (Figure 8c,d).
Figure 8.
XRD data for AMAG-183 alloy: (a) as-cast specimen; (b) after a non-isothermal creep test (up to the fracture) of a pre-annealed (in 10 min. at 673 K) ribbon; (c) the same as in (b), but the treatment was carried out in 38 min. at 673 K; (d) annealed sample in 38 min. at 673 K before the creep test.
Also, there is a relation between non-isothermal creep or annealing and the wideness of ferromagnetic hysteresis loops, changing due to anisotropy and structural reorganizations [52]. Thus, data comparison permits to make a conclusion about the curve bending as a result of the interatomic and magnetic reorganizations (partial relaxation, phase transitions), arising due to quite intensive thermo-mechanical impact over time. Temporal annealing under pre-crystallization temperatures contributes to more uniform structural relaxation that is observed as the smoothing of the curve bends. If we note the Fourier series expansion for (1) by normal frequencies (see Section 3.1), bending element (12) can be interpreted as a resonance of magnetic (spin-orbital) and atomic subsystems in the alloy under external mechanical impact and heating (i.e., infrared photonic flux absorption with the further phonon excitation spectra). Bending magnitude before and after annealing depends on C and B structural parameters (at determined VT with ΔT), and violation of mathematical or physical stability is provided by their changing under the F acting load. As noted above, this reasoning (from the Section 3.2) is valid only in frames of the Clausius-Clapeyron relation [29], i.e., at phase transition, observing with applied methods (diffractometry, calorimetry, magnetometry, etc.). Beyond the phase transition and shift of equilibrium, equations and solutions from the Section 3.1 are still useful for other materials with their creep analysis. Non-isothermal creep testing can also be applied as a method to determine phase transition temperatures in MG and other amorphous materials at higher heating rates and under loads, which are not accessible with techniques like DMA or TMA.
3.3. Non-Isothermal Creep with a Further Polymorphic Transition in the Fractured Material Structure
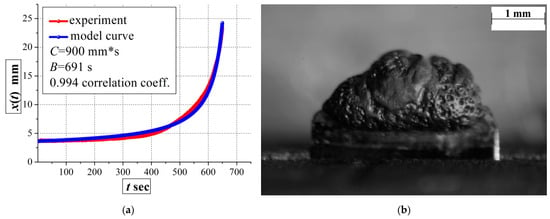
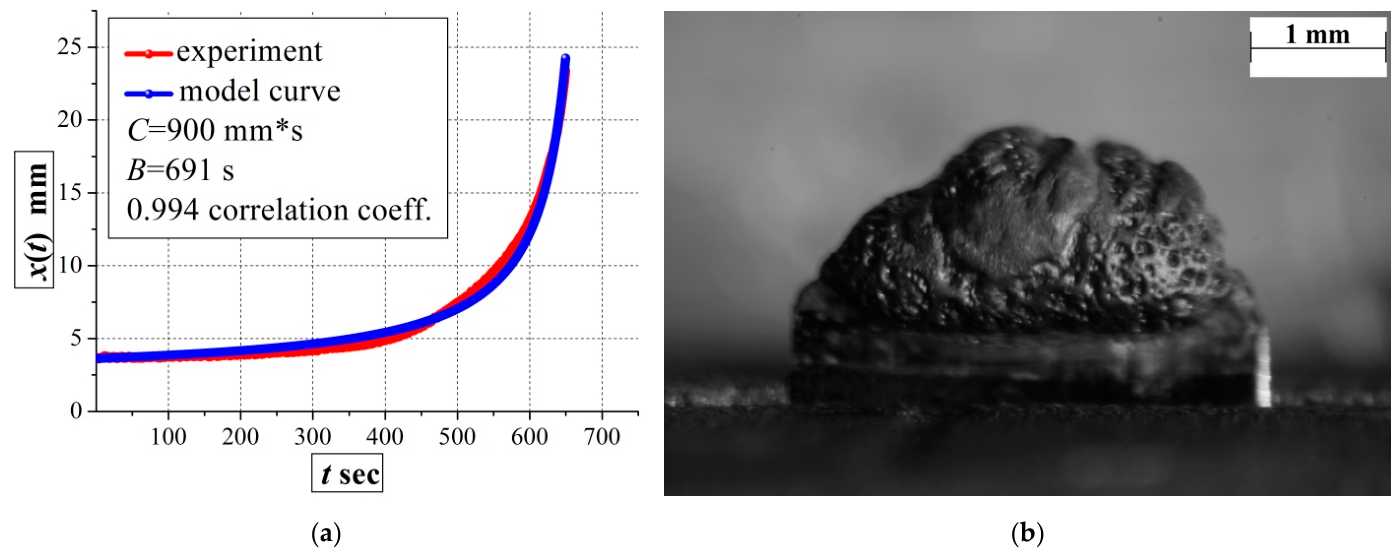
Under non-isothermal creep testing of the AMAG-200 ribbon alloy, deformation curves are precisely described with proposed Equation (1) (for example, 0.994 correlation coefficient, C = 900 mm·s, B = 691 s, VT = 1 K/s, mg = 1 N load, and xo = 3.6 mm with ±0.01 mm of the residual error value) like for the AMAG-183 specimens (see Figure 9a). Herewith, after the fracture of a ribbon specimen, its upper free part melted with the further rolling up under the surface tension (opposite to the gravitational field) and forming the drop with orange light radiation (~103 K by Wien’s black-body color temperature scale [53]), and that ended by mass solidification without visible glow (see Figure 9b).
Figure 9.
A typical creep curve (a) and the solidified metal drop at the upper free part of the fractured AMAG-200 ribbon specimen (b).
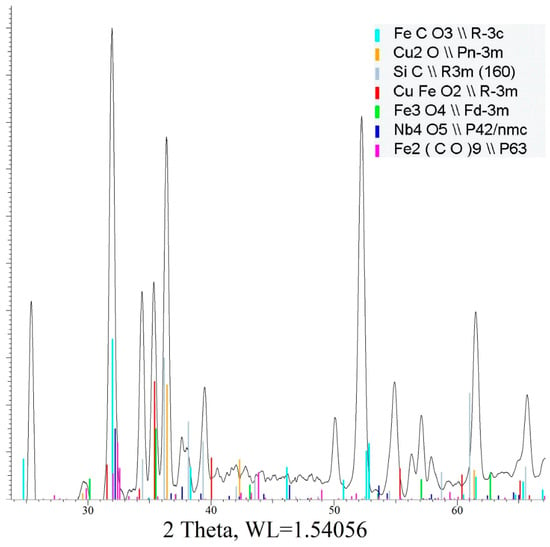
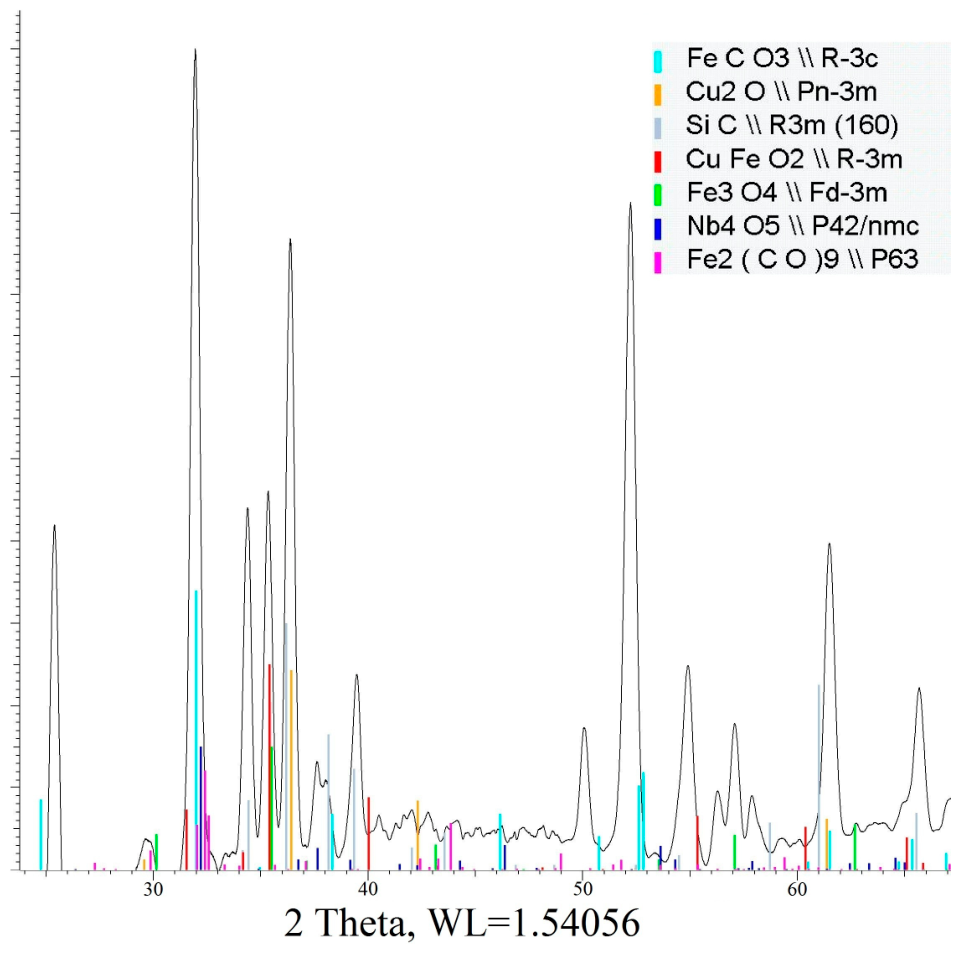
This process systematically occurs in the first minute after the end of a creep test both inside the furnace chamber (with passive temperature growth) and its outside (opened pot already without heating), i.e. stored heat received after the fracture of a specimen from a heater (due to thermal transition inertia) spends to the further phase transition in its upper free part. XRD testifies (Figure 10) that on the drop surface and its depth there are no molecular bonds which undergo the liquid state transition at 103 K (mainly, crystalline oxides of the base atomic components with 1.5·103 K or higher melting point appear in the specter).
Figure 10.
An XRD pattern recorded from the solidified drop of AMAG-200 specimen matrix.
Possible explanation for the observed effect is the presence of more complicated (triple or multiple) crystalline phases with the lower liquidus point and non-linear stoichiometry based on the main alloy components [54]. The same process is not observed in the AMAG-183 system, and that indicates specific properties of the AMAG-200 alloy outside the range, wherein the Duffing equation can be directly applied.
3.4. Non-Isothermal Creep of Amorphous Micro-Rods with a Glass Cover
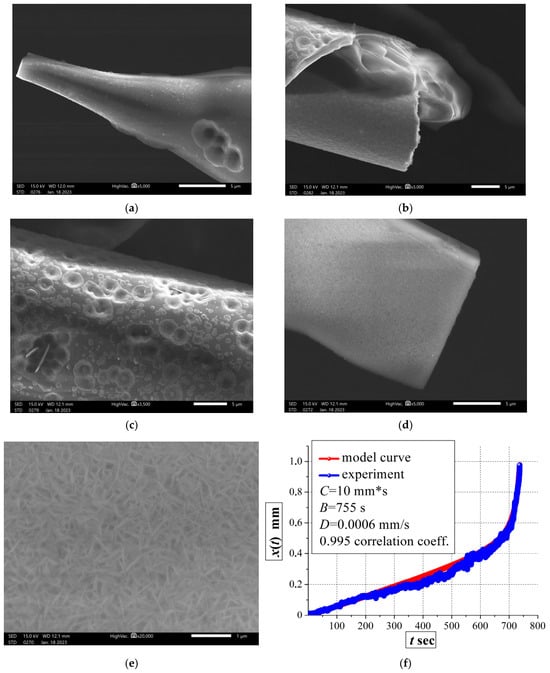
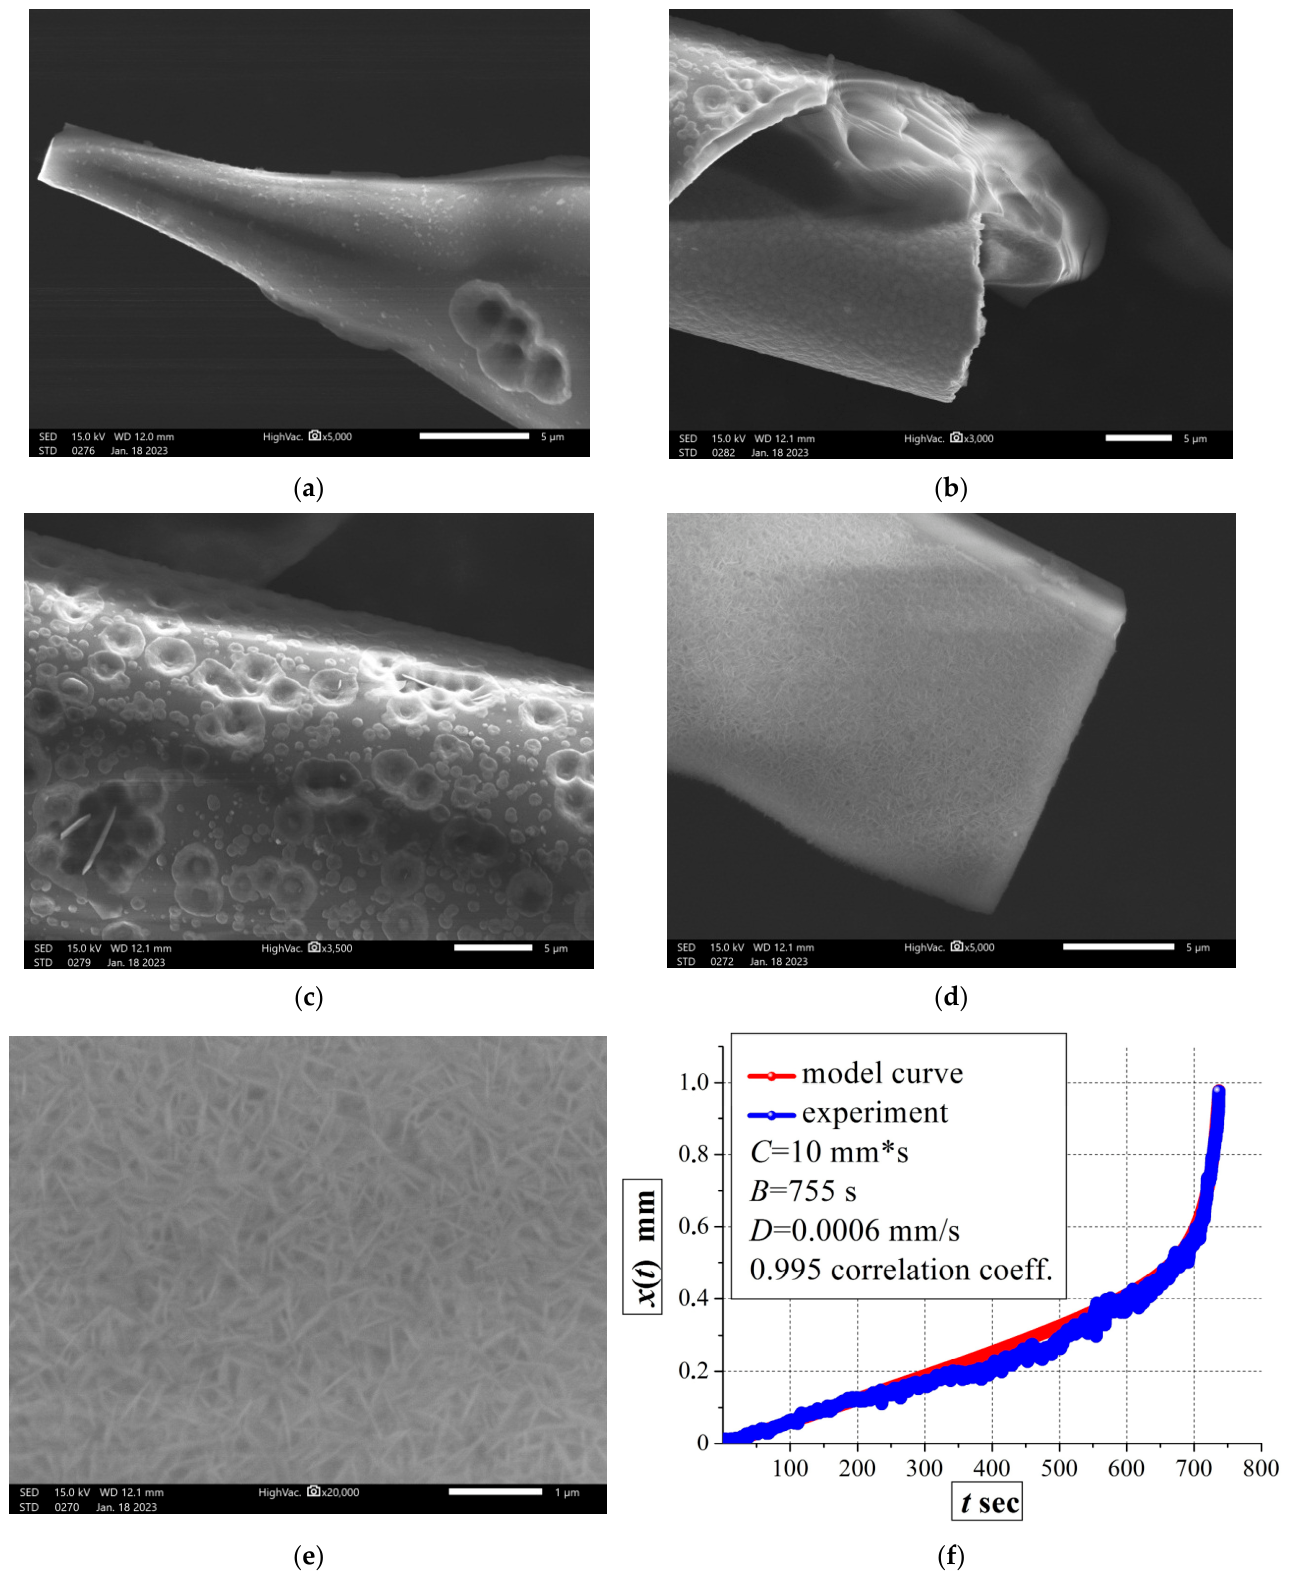
Non-isothermal creep of the amorphous rods covered by glass is described with (1), for example, up to 0.995 correlation coefficient, C = 10 mm·s, B = 755 s, the linear term –Dt = –0.0006t m, VT = 1 K/s, mg = 0.1 N, xo = 0.1 mm, and ±0.01 mm of the residual error value (Figure 11f). Herewith, deformation is completely smooth (i.e., no bends in x(t) curves appear) despite the combined visco-brittle fracture of a rod with its glass coating, melting, and cracking (see Figure 11a–e) forming lateral tension zones near the contact boundary between glass and alloy [55].
Figure 11.
SEM data, collected in a fracture zone of amorphous rods: (a) viscous tightening in the lateral projection; (b) brittle cracking of the glass coating around the rod and break; (c) melting area of the glass coating; (d) combined rupture of glass with specimen; (e) formation of microstructure in the glass coating; (f) A typical creep curve with its fitting.
Similar to AMAG-200, whose deformation is described in the Section 3.3, the shift of a melting temperature point occurs in the glass coating. Particularly, in Figure 11a,c, glass melting zones are visible despite the heating temperature not exceeding 103 K during the whole experiment (and the same phase parameter is obviously higher for any SiO2 systems regardless of defects [56]). This testifies to the impact of interatomic bonding in the interphase boundary between glass and alloy on local thermodynamic processes.
3.5. Non-Isothermal Creep of Silk Fibers
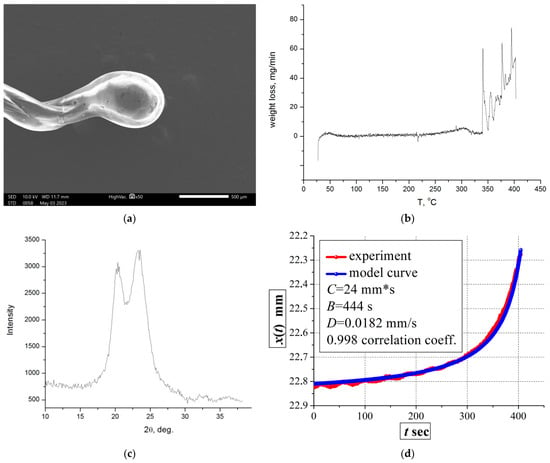
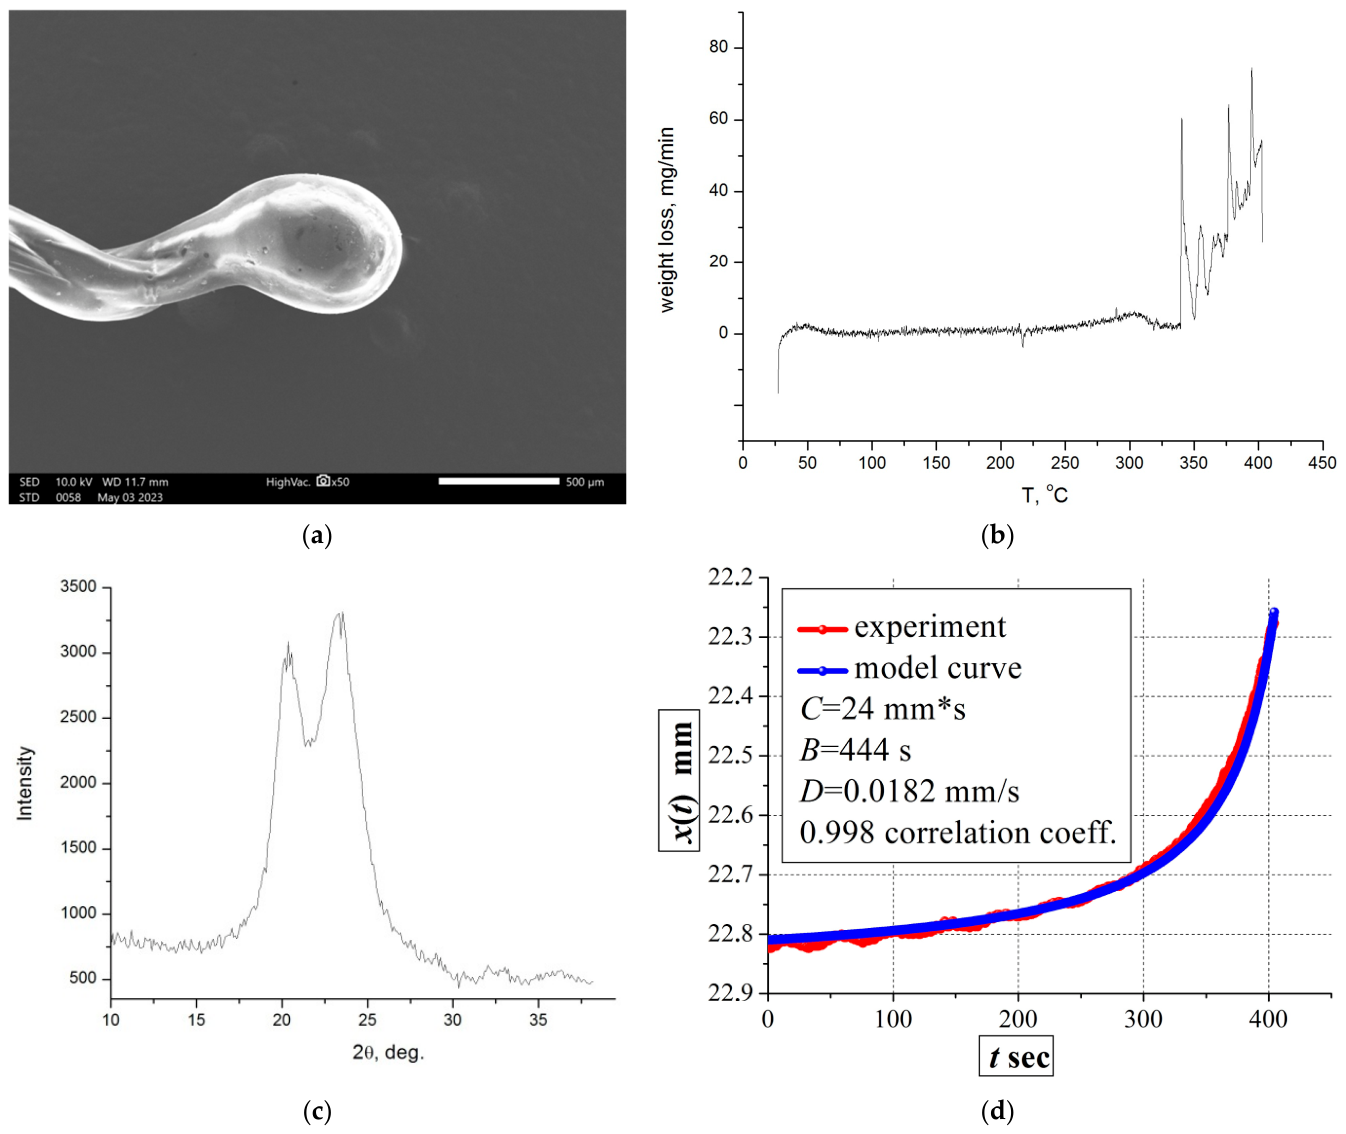
Non-isothermal creep tests of silk fibers are also modeled using (1) at 0.998 correlation coefficient (for example, C = 24 mm·s, B = 444 s, mg = 0.1 N, xo = 22.8 mm, VT = 1 K/s, also with ±0.01 mm of the residual error value, see Figure 12d), but at 2 and 3 K/s heating rates a −Dt = −0.0182t linear term should be included in the model related to the Duffing equation due to the experimental linear decrease. Considering negative linear term in Equation (5a) together with (1) and substitution (for a fixed heating rate), we can conclude direct dependence modeling some non-zero shrinkage with controlled , i.e., linear term is more pronounced with higher . Also as AMAG-200 alloy, silk fiber structures undergo the fragment melting after the fracture of specimens (Figure 12a), and partial weight loss is possible (Figure 12b), but the interatomic structure stays disordered (Figure 12c).
Figure 12.
Behavior and condition of an investigated silk fiber: (a) fragment melting and drop formation; (b) a thermogram without mechanical load; (c) XRD data; (d) A typical creep curve with its fitting.
Mentioned deformation behavior can be explained in this manner: with temperature growth from the room values, fibers tighten up and adapt to the external load, elastically resisting like engineering pulleys, and that is described with the negative linear term in (5a). However, the further combined action of higher temperatures and constant load leads to plastic structural deformation, which is modeled with a rational function in (1) or (3). Due to reorganization and breakdown of molecular bonds, plastic deformation dominates over elastic process, and the model predicts an asymptotic growth in deformation as time approaches a critical value.
4. Conclusions
Deformation scenarios of non-isothermal creep (including DMA and TMA) can be described with solutions proposed here for the master Duffing equation. In certain cases, specific deviations (such as bending or melting) caused by phase transitions in studied materials are observed. As the presence of (1) or (3) is determined by a force distribution in the systems, application may be broader for these analytical relationships together with the master equation, and extended models can be supplied with state equations (like Clausius-Clapeyron and others). Obtained results can be interesting in different fields where non-linear system behavior strongly appears (for example, in non-linear spintronics [57], economics [58], etc.).
Author Contributions
Writing—Original Draft Preparation, A.D.B.; Writing—Review & Editing, V.A.F., and N.S.P.; Data Curation, A.D.B. and N.S.P. and G.V.G.; Methodology, A.D.B. and V.A.F.; Validation, A.D.B. and V.A.F.; Formal Analysis, A.D.B.; Supervision, V.A.F. All authors have read and agreed to the published version of the manuscript.
Funding
This research received no external funding.
Institutional Review Board Statement
Not applicable.
Informed Consent Statement
Not applicable.
Data Availability Statement
Dataset available on request from the authors due to privacy.
Acknowledgments
Arseniy Berezner thanks Dear Monsieur Schabot Lucien Georges from Grand-Duché de Luxembourg for comprehensive and perennial help, making it possible to realize this work. The results were partially obtained at the Center for Collective Use of Scientific Equipment at Derzhavin Tambov State University. Magnetometry was performed at Magnetic Materials Research Laboratory (Lomonosov Moscow State University). Authors thank P.V. Andreev (Lobachevsky State University) for assistance with some XRD measurements.
Conflicts of Interest
The authors declare no conflict of interest.
Appendix A
Appendix A.1
To prove Theorem 1, the second temporal derivative of (1) with the further exchange from t to x using the inverse [29] function relative to (1) should be calculated. Then, the derived expression for is substituted into Equation (2), and the fractions are algebraically simplified by reducing to a common denominator and performing mutual subtraction of opposite terms. In result, (2) becomes to a 0 = 0 identity.
Appendix A.2
To prove that is a solution in Theorem 2, an exchange from t to x can be made with expression, where , and is a function of , i.e. an extended cubic polynomial by should be considered in the left part of the Duffing equation.
Appendix A.3
The relationship is derived from equation in the following way. At first, the relative equation should be used for with its further differentiation, i.e. . Then the binomial can be arithmetically expressed from in the single-valued form using the above discussed relative equation. The determined expression is substituted into the equation instead of the denominator. After that, the parameter can be arithmetically obtained from as . Alternatively, we can also describe the deformation parameter as .
If the value is substituted in the Duffing equation (i.e. in ) instead of x, x2, x3 terms, non-Newtonian flow components (,,) appear in the resulting force distribution.
Appendix A.4
To determine equilibrium force condition, one can make following analysis. From the claimed force equation, the resulting force relationship can be obtained with the initial condition together with zero or positive ω loading frequencies (considering DMA or pure non-isothermal creep experiments). Since we get the resulting force equation (), it can be analyzed mathematically with respect to the value acceptable region, i.e., (the presence of a creep test itself, in principle) if considering that and initial deformation time is determined as . Then we get the initial force condition, which tends to zero at infinite B (ideal absolutely non-deformable body) and remains non-zero at finite B-parameter (i.e. there is some residual force providing further isothermal creep of a real deformable system in the constant gravity field if ). Using the second Newton’s law for this case, one can obtain that with its and integrals only at with for a real deformable system. If then , and the pure equilibrium regime is reached by the system due to its structural freedom without any axial loading in the gravity force field. Thus, the claimed functional set agrees with initial and boundary conditions.
Appendix A.5
If
and , then a substitution of the second derivative of (5a) into the modified Duffing equation provides the identity 0 = 0, i.e., (5a) is the necessary solution.
Appendix A.6
Using the equation claimed before in Appendix A.4 together with creep rate (the second derivative of (1)), we can derive the expression, which is a case of the creep Norton law with one-powers of and t (S is the cross-section area if it is constant during deformation under stress, x0 is an initial coordinate). With modification of to the exponential Arrhenius form [59] at , Q activation energy can be determined as 61–66 kJ/mol at s−1 [29], s, using present experimental conditions from Section 2 up to the R molar gas constant at the temperatures T = Const = 300 K or 400 K. Obtained activation energy value agrees with experimental data for Sn-Ag-Cu alloy under isothermal creep in the same temperature region [60].
References
- Kovacic, I.; Teofanov, L.; Zhu, R.; Wang, X.; Zhao, J. Vibration control via finite and semi-infinite vibration attenuation regions in the chain of mass-in-mass units: From theory to experiments. Nonlinear Dyn. 2025, 113, 30497–30513. [Google Scholar] [CrossRef] [Scilit]
- Xing, J.; Li, X.; Shen, Y. Study on the vibration reduction mechanism of nonlinear energy sink with Zener system. Nonlinear Dyn. 2025, 113, 5145–5170. [Google Scholar] [CrossRef] [Scilit]
- Müller, P.C.; Weber, W.E. Modal analysis and insights into damping phenomena of a special vibration chain. Arch. Appl. Mech. 2021, 91, 2179–2187. [Google Scholar] [CrossRef] [Scilit]
- Chen, P.; Yang, X. Dynamics analysis of a bistable 2-DOF coupled oscillator with nonlinear damping. Int. J. Nonlinear Mech. 2025, 171, 105021. [Google Scholar] [CrossRef] [Scilit]
- Malkiel, N.; Rabinovitch, O. Nonlinear stochastic evolution of spatial uncertainty along the process axis. Int. J. Nonlinear Mech. 2025, 175, 105125. [Google Scholar] [CrossRef] [Scilit]
- Ahirwar, M.; Pratiher, B. Size-dependent nonlinear modal dynamics in MEMS micro rotors. Int. J. Nonlinear Mech. 2025, 176, 105115. [Google Scholar] [CrossRef] [Scilit]
- Baghdali, I.; Attia, A.; Bourada, F.; Bousahla, A.A.; Tounsi, A.; Heireche, H.; Tounsi, A.; Bourada, M.; Yaylaci, M. Analysis of the Impact of the Viscoelastic Foundation on Bending and Vibration of FG Porous Nanoplates within Integral Higher-Order Shear Deformation Theory. Phys. Mesomech. 2025, 28, 245–262. [Google Scholar] [CrossRef] [Scilit]
- Khon, Y.A. Lüders and Portevin–Le Chatelier Bands at the Stage of Elastoplastic Transition: Nucleation and Propagation. Phys. Mesomech. 2025, 28, 91–100. [Google Scholar] [CrossRef] [Scilit]
- Iacono, R.; Boyd, J.P. The Kidder Equation. Stud. Appl. Math. 2015, 135, 63–85. [Google Scholar] [CrossRef] [Scilit]
- Ginzburg, V.V.; Gendelman, O.V.; Zaccone, A. Unifying Physical Framework for Stretched-Exponential, Compressed-Exponential, and Logarithmic Relaxation Phenomena in Glassy Polymers. Macromolecules 2024, 57, 2520–2529. [Google Scholar] [CrossRef] [Scilit]
- Chowdhury, S.; Adhikari, S.; Banerjee, A. Robust control design of nonlinear negative stiffness base isolators for MDOF systems. Int. J. Nonlinear Mech. 2025, 174, 105083. [Google Scholar] [CrossRef] [Scilit]
- Safari, S.; Montalvão, D.; Londoño Monsalve, J.M. Data-driven structural identification of nonlinear assemblies: Uncertainty Quantification. Int. J. Nonlinear Mech. 2025, 170, 105002. [Google Scholar] [CrossRef] [Scilit]
- Kovacic, I.; Cveticanin, L.; Zukovic, M.; Rakaric, Z. Jacobi elliptic functions: A review of nonlinear oscillatory application problems. J. Sound. Vib. 2016, 380, 1–36. [Google Scholar] [CrossRef] [Scilit]
- Elías-Zúñiga, A. Exact solution of the cubic-quintic Duffing oscillator. Appl. Math. Model. 2013, 37, 2574–2579. [Google Scholar] [CrossRef] [Scilit]
- Elías-Zúñiga, A. Analytical solution of the damped Helmholtz–Duffing equation. Appl. Math. Lett. 2012, 25, 2349–2353. [Google Scholar] [CrossRef] [Scilit]
- Elías-Zúñiga, A.; Martínez-Romero, O.; Córdoba-Díaz, R.K. Approximate Solution for the Duffing-Harmonic Oscillator by the Enhanced Cubication Method. Math. Probl. Eng. 2012, 1, 1–12. [Google Scholar] [CrossRef] [Scilit]
- Duffing, G. Erzwungene Schwingungen bei Veränderlicher Eigenfrequenz und Ihre Technische Bedeutung [Forced Oscillations with Variable Natural Frequency and Their Technical Relevance]; Vieweg: Braunschweig, Germany, 1918; pp. 72–73. (In German) [Google Scholar]
- Kovacic, I.; Brennan, M. (Eds.) The Duffing Equation: Nonlinear Oscillators and Their Behaviour; Wiley: Hoboken, NJ, USA, 2011. [Google Scholar]
- Jordan, D.W.; Smith, P. Nonlinear Ordinary Differential Equations, 4th ed.; CRC Press: Oxford, UK, 2007. [Google Scholar]
- Bender, C.M.; Orszag, S.A. Advanced Mathematical Methods for Scientists and Engineers I: Asymptotic Methods and Perturbation Theory; Springer: Berlin/Heidelberg, Germany, 1999. [Google Scholar]
- Nayfeh, A.H.; Balachandran, B. Applied Nonlinear Dynamics; Wiley: Hoboken, NJ, USA, 1995. [Google Scholar]
- Trachenko, K.; Zaccone, A. Slow stretched-exponential and fast compressed-exponential relaxation from local event dynamics. J. Phys. Condens. Matter. 2021, 33, 315101. [Google Scholar] [CrossRef] [Scilit] [PubMed]
- Koeppel, A.; Laity, P.R.; Holland, C. The influence of metal ions on native silk rheology. Acta Biomater. 2020, 117, 204–212. [Google Scholar] [CrossRef] [Scilit] [PubMed]
- Wang, W.H. Dynamic relaxations and relaxation-property relationships in metallic glasses. Prog. Mater. Sci. 2019, 106, 100561. [Google Scholar] [CrossRef] [Scilit]
- Chen, Y.M.; Xiao, Y.H.; Lyu, G.J.; Wang, B.; Wang, Y.J.; Yang, Y.; Pineda, E.; Fusco, C.; Chazeau, L.; Qiao, J.C. Dynamic relaxation in metallic glasses: A unified view from quasi-point defects and fractional viscoelasticity. Int. J. Eng. Sci. 2025, 217, 104394. [Google Scholar] [CrossRef] [Scilit]
- Römer, F.; Ramasamy, P.; Steffny, I.; Stoica, M.; Lienert, U.; Quick, C.; Hegedüs, Z.; Eckert, J.; Spieckermann, F. Crystallization of Fe74Mo4P10C7.5B2.5Si2 metallic glass: Insights from in-situ synchrotron diffraction and Flash DSC. Mater. Today Adv. 2025, 25, 100550. [Google Scholar] [CrossRef] [Scilit]
- Yesudhas, S.; Levitas, V.I.; Lin, F.; Pandey, K.K.; Smith, J.S. Unusual plastic strain-induced phase transformation phenomena in silicon. Nat. Commun. 2024, 15, 7054. [Google Scholar] [CrossRef] [Scilit] [PubMed]
- Davydov, S.V. Phase Diagram of Fe–100% C Alloys. Part One. Basic Inconsistencies of Fe–Fe3C Alloy Phase Diagram. Steel Transl. 2023, 53, 144–153. [Google Scholar] [CrossRef] [Scilit]
- Berezner, A.D.; Fedorov, V.A.; Zadorozhnyy, M.Y. Relaxation behavior of an Al-Y-Ni-Co metallic glass in as-prepared and cold-rolled state. J. Alloys Compd. 2022, 923, 166313. [Google Scholar] [CrossRef] [Scilit]
- Landau, L.D. On the Theory of Phase Transitions. Zh. Eksp. Teor. Fiz. 1937, 7, 19–32. [Google Scholar]
- Hohenberg, P.C.; Krekhov, A.P. An introduction to the Ginzburg-Landau theory of phase transitions and nonequilibrium patterns. Phys. Rep. 2015, 572, 1–42. [Google Scholar] [CrossRef] [Scilit]
- Budkov, Y.A.; Kalikin, N.N.; Brandyshev, P.E. Thermomechanical approach to calculating mechanical stresses in inhomogeneous fluids and its applications to ionic fluids. J. Stat. Mech. 2024, 123201. [Google Scholar] [CrossRef] [Scilit]
- Blaschke, D.N.; Hunter, A.; Preston, D.L. Phase transformation kinetics model for metals. Int. J. Plast. 2026, 196, 104579. [Google Scholar] [CrossRef] [Scilit]
- Menard, K.P. Dynamic Mechanical Analysis: A Practical Introduction; CRC Press: Boca Raton, FL, USA, 1999. [Google Scholar]
- Wilkinson, W. Non-Newtonian Fluids; Pergamon: London, UK, 1960. [Google Scholar]
- Louzguine-Luzgin, D.V.; Zadorozhnyy, M.Y.; Ketov, S.V.; Jiang, J.; Golovin, I.S.; Aronin, A.S. Influence of cyclic loading on the structure and double-stage structure relaxation behavior of a Zr-Cu-Fe-Al metallic glass. Mater. Sci. Eng. A 2019, 742, 526–531. [Google Scholar] [CrossRef] [Scilit]
- Fedorov, V.A.; Berezner, A.D.; Beskrovnyi, A.I.; Neov, D. Determining the Form of a Hydrodynamic Flow upon Creep of an Amorphous Cobalt-Based Metal Alloy in a Variable Temperature Field. Tech. Phys. Lett. 2018, 44, 678–680. [Google Scholar] [CrossRef] [Scilit]
- Gyurov, S.; Czeppe, T.; Drenchev, L.; Stefanov, G.; Russew, K. Thermo-mechanical study of rapidly solidified NiNbZrTiAl amorphous metallic alloys. Mater. Sci. Eng. A 2017, 684, 222–228. [Google Scholar] [CrossRef] [Scilit]
- Berezner, A.; Fedorov, V.; Grigoriev, G. A Few Fracture Features of Al-Based and Cu-Based Ribbon Metallic Glasses Under Non-isothermal and Oscillating Loading; Lecture Notes in Mechanical Engineering; Springer: Berlin/Heidelberg, Germany, 2022. [Google Scholar]
- Berezner, A.D.; Fedorov, V.A.; Zadorozhnyy, M.Y.; Golovin, I.S.; Louzguine-Luzgin, D.V. Deformation of Cu-Pd-P metallic glass under cyclic mechanical load on continous heating. Theor. Appl. Fract. Mech. 2022, 118, 103262. [Google Scholar] [CrossRef] [Scilit]
- Berezner, A.D.; Fedorov, V.A.; Zadorozhnyy, M.Y.; Golovin, I.S.; Louzguine-Luzgin, D.V. Deformation of Al85Y8Ni5Co2 Metallic Glasses under Cyclic Mechanical Load and Uniform Heating. Metals 2021, 11, 908. [Google Scholar] [CrossRef] [Scilit]
- Berezner, A.; Fedorov, V. Non-Isothermal Dynamic Mechanical Analysis of Ribbon Metallic Glasses and Its Thermodynamic Description. Materials 2022, 15, 8659. [Google Scholar] [CrossRef] [Scilit] [PubMed]
- Wu, X.; Zhan, L.; Yang, Y.; Xu, Y.; Zhang, Q.; Yang, X. Effects of Specimen Thickness and Non-Isothermal Process on Creep Behavior of AA2024 Aluminum Alloy. Metals 2023, 13, 409. [Google Scholar] [CrossRef] [Scilit]
- Yang, J.; Chen, L.; Ma, P.; Zhan, L.; Liu, C. Non-isothermal creep ageing in a largely pre-deformed Al–Cu alloy. J. Mater. Res. Technol. 2026, 41, 7066–7076. [Google Scholar] [CrossRef] [Scilit]
- Patel, M.; Dubey, D.K.; Singh, S.P. Phenomenological models of Bombyx mori silk fibroin and their mechanical behavior using molecular dynamics simulations. Mater. Sci. Eng. C 2020, 108, 110414. [Google Scholar] [CrossRef] [Scilit] [PubMed]
- Svirshchevskii, S.R. Nonlinear differential operators of first and second order possessing invariant linear spaces of maximal dimension. Theor. Math. Phys. 1995, 105, 1346–1353. [Google Scholar] [CrossRef] [Scilit]
- Fernandez-Canteli, A.; Castillo, E.; Blason, S. A methodology for phenomenological analysis of cumulative damage processes. Application to fatigue and fracture phenomena. Int. J. Fatigue 2021, 150, 106311. [Google Scholar] [CrossRef] [Scilit]
- Brennan, M.J.; Kovacic, I.; Carrella, A.; Waters, T.P. On the jump-up and jump-down frequencies of the Duffing oscillator. J. Sound. Vib. 2008, 318, 1250–1261. [Google Scholar] [CrossRef] [Scilit]
- Whitman, A.M. Thermodynamics: Basic Principles and Engineering Applications; Springer: Berlin/Heidelberg, Germany, 2019. [Google Scholar]
- Pathria, R.K.; Beale, P.D. Statistical Mechanics, 4th ed.; Academic Press: Cambridge, MA, USA, 2021. [Google Scholar]
- Debenedetti, P.G. Metastable Liquids: Concepts and Principles; Princeton University Press: Princeton, NJ, USA, 1996. [Google Scholar]
- Berezner, A.D.; Fedorov, V.A.; Perov, N.S.; Pluzhnikova, T.N.; Fedotov, D.Y.; Shlikova, A.A. Magnetic properties of Co-based and Fe-based tape amorphous alloys. J. Phys. Condens. Matter 2020, 32, 114001. [Google Scholar] [CrossRef] [Scilit] [PubMed]
- Stewart, S.M. Spectral peaks and Wien’s displacement law. J. Thermophys. Heat Transf. 2012, 26, 689–692. [Google Scholar] [CrossRef]
- Shishin, D.; Hidayat, T.; Jak, E.; Decterov, S.A. Critical assessment and thermodynamic modeling of the Cu–Fe–O system. Calphad 2013, 41, 160–179. [Google Scholar] [CrossRef] [Scilit]
- Chernakov, A.P.; Kolesnikova, A.L.; Gutkin, M.Y.; Romanov, A.E. Periodic array of misfit dislocation loops and stress relaxation in core-shell nanowires. Int. J. Eng. Sci. 2020, 156, 103367. [Google Scholar] [CrossRef] [Scilit]
- Ojovan, M.I. Glass formation in amorphous SiO2 as a percolation phase transition in a system of network defects. JETP Lett. 2004, 79, 632–634. [Google Scholar] [CrossRef] [Scilit]
- Temnaya, O.; Nikitov, S. Non-isochronous exceptional point shift in coupled spin-torque nano-oscillators. J. Magn. Magn. Mater. 2024, 598, 171999. [Google Scholar] [CrossRef] [Scilit]
- Yilmaz, A.; Unal, G. Stochastic Duffing equation in modelling of financial time series. Int. J. Dynam. Control 2019, 7, 1173–1194. [Google Scholar] [CrossRef] [Scilit]
- Kohout, J. Description of steady-state creep rate with continuously varying stress sensitivity parameter and upper limits of applied stress. Heliyon 2025, 11, e41169. [Google Scholar] [CrossRef] [Scilit] [PubMed]
- Moriuchi, M.; Kariya, Y.; Kondo, M.; Kanda, Y. Class I Creep Deformation of Sn–Ag–Cu Containing Solid Solution Elements and Its Effect on Thermal Fatigue Life of Solder Joints. Mater. Trans. JIM 2022, 63, 805–812. [Google Scholar] [CrossRef] [Scilit]

Disclaimer/Publisher’s Note: The statements, opinions and data contained in all publications are solely those of the individual author(s) and contributor(s) and not of MDPI and/or the editor(s). MDPI and/or the editor(s) disclaim responsibility for any injury to people or property resulting from any ideas, methods, instructions or products referred to in the content. |
© 2026 by the authors. Licensee MDPI, Basel, Switzerland. This article is an open access article distributed under the terms and conditions of the Creative Commons Attribution (CC BY) license.