


Abstract
Roll-bonded stainless steel/aluminum laminates are increasingly used in lightweight structural applications; however, their deep-drawing behavior and thickness evolution remain insufficiently understood due to the mechanical mismatch between constituent layers. This study investigates the deep drawing of a SUS304/AA1050/SUS430 laminated sheet through a combined experimental and finite-element approach. The laminate was manufactured by roll bonding and exhibited sound interfacial integrity without observable delamination. To account for load transfer and deformation compatibility among the bonded layers, the material was modeled as an equivalent homogeneous laminate whose constitutive response was identified directly from tensile tests performed on the three-layer sheet. Full-field strain measurements were obtained using digital image correlation (DIC), and anisotropic plasticity was described using the Hill48 yield criterion combined with Swift and Voce hardening laws. Numerical predictions were validated against experimentally measured thickness distributions in cylindrical cup deep drawing. Among the investigated constitutive models, the Voce-RD0 calibration provided the closest agreement with experimental results. The validated model was subsequently employed to evaluate the effects of blank holder force, punch–die clearance, and die radius on thickness evolution. Based on the systematic parametric investigation, the combination of a blank holder force of 14 tons, a punch–die clearance of 3.2 mm, and a die radius of 10 mm yielded the most uniform thickness distribution among the conditions investigated. Under these conditions, localized thinning was reduced and the thickness distribution became more uniform. The finite element predictions agreed well with the experimental measurements, with deviations below 3%. The proposed experimental–numerical approach offers a practical framework for constitutive characterization and process parameter selection in the deep drawing of roll-bonded multilayer sheet materials.
1. Introduction
Three-layer sheet materials have attracted considerable interest in recent years because they combine the advantageous properties of different constituent metals within a single structure. By integrating materials with complementary mechanical and physical characteristics, multilayer laminates can simultaneously provide high strength, improved formability, enhanced corrosion resistance, and reduced weight. These attributes have promoted their increasing application in automotive, aerospace, energy, and consumer-product industries, where lightweight design and multifunctional performance are essential. Among various multilayer systems, stainless steel/aluminum laminates have received particular attention due to their favorable combination of the strength and corrosion resistance of stainless steel with the low density and good formability of aluminum alloys. However, the presence of dissimilar layers introduces additional complexity during plastic deformation because differences in mechanical properties may influence material flow, thickness evolution, and strain distribution during forming operations.
Deep drawing remains one of the most widely used sheet-metal forming processes for producing axisymmetric components. The forming behavior of multilayer sheets during deep drawing has therefore become an important research topic. Tsukamoto [1] demonstrated that multilayer aluminum/duralumin structures exhibit enhanced energy absorption owing to layer-wise deformation mechanisms. Zafar et al. [2] investigated hydro-mechanical deep drawing of trilayer aluminum sheets and reported that chamber pressure strongly influences thickness distribution and defect formation. Atrian et al. [3] and Qi et al. [4] showed that differences in layer properties significantly affect stress distribution, localized thinning, and forming quality in laminated metallic sheets. Similar observations were reported by Marcin et al. [5] for explosively welded multilayer composites, where finite element simulations successfully captured the deformation behavior observed experimentally.
In addition to laminate architecture, process parameters play a crucial role in determining forming quality. According to Tiwari et al. [6], blank holder force, die geometry, clearance, friction conditions, and material properties directly influence thickness distribution and the occurrence of defects such as wrinkling and tearing. Material anisotropy is another important factor affecting forming behavior. Xu et al. [7] demonstrated that anisotropic constitutive models provide significantly more accurate predictions than isotropic assumptions for rolled metallic sheets.
Recent developments have also focused on constitutive modeling and damage prediction in sheet-metal forming. Laboubi et al. [8] applied the Lemaitre ductile damage model to predict fracture initiation during deep drawing, while Beltzung et al. [9] and Guo et al. [10] highlighted the growing potential of data-driven and machine-learning approaches for predicting forming responses. In parallel, Wang et al. [11] emphasized the importance of friction control and tooling conditions in micro deep drawing applications.
For laminated metallic composites, Li et al. [12] investigated the forming limits of SUS430/Al1050/SUS430 laminates and demonstrated that the mechanical properties of individual layers significantly affect the global deformation response. Atrian and Fereshteh-Saniee [3] further showed that interlayer mechanical interactions strongly influence drawing force, material flow, and thickness variation during deep drawing. More recently, Gabsi et al. [13] reported that stainless steel/aluminum clad materials produced through solid-state bonding exhibit favorable combinations of mechanical performance and corrosion resistance, highlighting their growing industrial relevance.
Despite these advances, several key issues remain insufficiently addressed in the existing literature. First, studies focusing on thickness evolution and localized thinning in roll-bonded SUS304/AA1050/SUS430 laminates during deep drawing are still relatively limited. Second, the influence of different constitutive hardening laws on the predictive capability of finite element simulations for multilayer laminates has not been systematically assessed. Third, experimentally validated studies that systematically investigate the effects of key process parameters on thickness distribution in laminated sheet forming remain scarce. Finally, although equivalent homogeneous material models are widely employed for computational efficiency, the assumptions concerning interface compatibility and interlayer load transfer are seldom discussed in sufficient detail.
In this study, the primary objective is not to investigate detailed interfacial mechanisms or local stress transfer between individual layers, but rather to characterize the overall mechanical response and anisotropic behavior of the roll-bonded laminate through a combined experimental and numerical framework. Accordingly, an equivalent homogeneous material representation is adopted, in which the three-layer sheet is described using a single constitutive model. The material parameters are identified directly from tensile tests performed on the laminated sheet, thereby inherently accounting for the combined response of all constituent layers and their collective load-sharing behavior.
To address the aforementioned gaps, the present work investigates the deep drawing behavior of roll-bonded SUS304/AA1050/SUS430 trilayer sheets through an integrated experimental–numerical approach. Uniaxial tensile tests were carried out along the rolling direction (RD), diagonal direction (DD), and transverse direction (TD), while full-field deformation was measured using a two-dimensional digital image correlation (2D-DIC) system. The obtained stress–strain responses were used to calibrate the Swift and Voce hardening laws, which were subsequently implemented in finite element simulations together with the Hill48 anisotropic yield criterion. After validation against experimentally measured thickness distributions, the numerical model was employed to study the effects of blank holder force, punch–die clearance, and die radius on thickness evolution. The aim is to identify an appropriate constitutive description for the trilayer laminate and to establish process conditions that effectively suppress localized thinning during deep drawing.
2. Materials and Methods
2.1. Material
2.1.1. Chemical Composition and Mechanical Characterization
The experimental investigation was performed using a roll-bonded SUS304/AA1050/SUS430 trilayer sheet with a total thickness of 2.5 mm. The laminate consisted of a 0.5 mm SUS304 austenitic stainless-steel layer, a 1.2 mm AA1050 aluminum core layer, and a 0.8 mm SUS430 ferritic stainless-steel layer. This material system was selected because it combines the corrosion resistance and mechanical strength of stainless steels with the low density and high formability of aluminum, making it attractive for lightweight structural components produced by sheet-forming operations.
The trilayer sheet was manufactured by a roll-bonding process. Prior to bonding, the surfaces of the individual sheets were mechanically treated and cleaned to remove oxide films and surface contaminants. The layers were then assembled in the sequence SUS304 (0.5 mm)/AA1050 (1.2 mm)/SUS430 (0.8 mm) and subjected to rolling under high compressive pressure. During rolling, severe plastic deformation disrupted the surface oxide layers and promoted intimate metallic contact between adjacent layers, resulting in a solid-state metallurgical bond. After roll bonding, a fully consolidated laminate with a final thickness of 2.5 mm was obtained.
The integrity of the bonded interfaces was assessed through cross-sectional optical and scanning electron microscopy (SEM) observations. No visible interfacial defects, delamination, or voids were detected within the examined regions. In addition, neither interfacial separation nor relative sliding between layers was observed during the tensile and deep-drawing experiments conducted in the present study. These observations support the assumption of effective load transfer and deformation compatibility across the bonded interfaces within the investigated deformation range.
The chemical compositions of the constituent layers are summarized in Table 1. SUS304 is an austenitic stainless steel containing chromium and nickel as the principal alloying elements, providing excellent corrosion resistance and good ductility. AA1050 is a commercially pure aluminum alloy with an aluminum content exceeding 99.5 wt.%, offering high formability and low density. SUS430 is a ferritic stainless steel primarily alloyed with chromium, which contributes to its strength, oxidation resistance, and dimensional stability. The combination of these three materials provides a favorable balance between strength, corrosion resistance, and formability for deep-drawing applications. To clarify the mechanical contributions of the constituent layers, the basic mechanical properties of SUS304, AA1050, and SUS430, as provided by the manufacturer, have been included. SUS304 exhibits the highest ultimate tensile strength (722 MPa), followed by SUS430 (495 MPa), whereas AA1050 has the lowest tensile strength (approximately 75 MPa). In contrast, SUS430 possesses the highest yield strength (305 MPa), followed by SUS304 (277 MPa), while AA1050 exhibits the lowest load-carrying capacity. Combined with the different layer thicknesses (0.5 mm for SUS304, 1.2 mm for AA1050, and 0.8 mm for SUS430), these differences govern the overall mechanical behavior of the laminated sheet. Consequently, the equivalent material parameters employed in the finite-element simulations were identified directly from tensile tests on the roll-bonded laminate, allowing the constitutive model to represent the integrated effects of constituent properties, layer geometry, and interfacial load transfer during deformation.
Table 1.
Chemical composition of the three-layer sheet material.
For the purposes of the present study, the mechanical behavior of the laminated sheet was characterized at the structural level through uniaxial tensile testing prior to the forming experiments. The objective was not to investigate local stress-transfer mechanisms or layer-by-layer deformation interactions, but rather to evaluate the overall mechanical response and anisotropic behavior of the roll-bonded laminate as an integrated material system. Accordingly, the material characterization was conducted using a combined experimental–numerical approach involving tensile testing, digital image correlation (DIC), and finite-element analysis.
To maintain consistency with this objective, the finite-element model adopted an equivalent homogeneous material (EHM) assumption, whereby the three-layer laminate was represented as a single equivalent material with effective mechanical properties. The constitutive parameters were not derived from the individual constituent layers; instead, they were identified directly from tensile tests performed on the bonded SUS304/AA1050/SUS430 laminate. Consequently, the calibrated material parameters inherently incorporate the combined influence of the three constituent layers as well as the load-sharing effects arising from the bonded multilayer structure. This approach is commonly employed when the primary interest lies in predicting the global forming response rather than resolving local interfacial phenomena.
Uniaxial tensile tests were conducted in accordance with ISO 6892-1. To assess the planar anisotropy introduced by the rolling process, specimens were extracted along three characteristic orientations relative to the rolling direction of the sheet: the rolling direction (RD, 0°), the diagonal direction (DD, 45°), and the transverse direction (TD, 90°).
The geometry and orientation of the tensile specimens are presented in Figure 1. To minimize thermal effects, residual stresses, and edge damage during specimen preparation, all samples were fabricated using abrasive water-jet cutting. This preparation method ensured high dimensional accuracy while preserving the integrity of the material in the gauge section, thereby improving the reliability of the subsequent mechanical characterization.
Figure 1.
(a) Schematic illustration of the orientations of the tensile specimens extracted from the original sheet along the rolling direction (RD), diagonal direction (DD), and transverse direction (TD); (b) geometry and dimensions of the uniaxial tensile specimen prepared in accordance with the ISO 6892-1 standard (unit: mm).
During the tensile experiments, the deformation of the specimens was measured using a two-dimensional digital image correlation (2D-DIC) system integrated with an Instron 3382A universal testing machine (Instron, Norwood, MA, USA), enabling full-field strain measurements with high accuracy. The specimens were securely clamped between the grips of the testing machine, while a high-resolution camera continuously recorded images of the speckle-patterned surface. A dedicated illumination system was employed to ensure consistent image quality and to enhance measurement precision. The acquired image sequences were processed using DIC software (in-house software) to determine the full-field strain distribution, while the applied load and crosshead displacement were simultaneously recorded by the testing machine. The synchronization between the optical measurement system and the mechanical loading system enabled accurate tracking of strain evolution and the construction of the corresponding stress–strain curves of the material (Figure 2).
Figure 2.
Schematic illustration of the experimental configuration of the 2D Digital Image Correlation (2D-DIC) system integrated with the universal testing machine for uniaxial tensile testing.
After the uniaxial tensile tests, the fractured specimens of the roll-bonded multilayer sheet are shown in Figure 3a, and the corresponding true stress–strain curves for the rolling (RD, 0°), diagonal (DD, 45°), and transverse (TD, 90°) directions are presented in Figure 3b. These experimental data were used to calibrate the constitutive model for the subsequent finite element simulations, while the corresponding mechanical properties are summarized in Table 2.
Figure 3.
(a) Tensile specimens after fracture following the uniaxial tensile tests; (b) true stress–strain curves obtained along three material orientations: RD (0°), DD (45°), and TD (90°).
Table 2.
Mechanical properties of the three-layer sheet (SUS304/AA1050/SUS430).
The stress–strain curves exhibit directional dependence, reflecting the in-plane anisotropy of the laminated sheet. As shown in Figure 3b, the responses in the RD and DD directions are very similar over most of the deformation range, whereas a more noticeable difference is observed in the TD direction, particularly in terms of yield strength. These results indicate a moderate degree of in-plane anisotropy under the investigated loading conditions.
A limitation of this study is that repeated tensile tests were not available for all material orientations. Consequently, the statistical scatter of the experimental data could not be quantified using measures such as standard deviation or confidence intervals. Therefore, the small differences observed between the RD and DD directions should be interpreted with caution, as they may fall within the experimental variability. Despite this limitation, the calibrated constitutive model reproduced both the overall tensile response and the thickness evolution during deep drawing with good agreement between the finite element predictions and the experimental measurements. Additional repeated tensile tests will be conducted in future work to quantify experimental variability and further improve the robustness of the constitutive model calibration.
2.1.2. Hardening Law for Material Behavior
To accurately describe the evolution of flow stress with increasing plastic strain, two widely adopted isotropic hardening laws were considered in this study, namely the Swift [14] and the Voce hardening models [15]. These constitutive relations are commonly used in sheet metal forming simulations because they are capable of capturing the strain hardening behavior over a broad plastic deformation range. The mathematical expressions of these hardening laws are given as follows:
The Swift hardening model is expressed as:
The Voce hardening model is expressed as:
where and denote the equivalent stress and equivalent plastic strain, respectively. The parameter represents the initial yield stress of the material, while C, n, P and Q are material constants associated with the hardening behavior in Equations (1) and (2). The Swift hardening model is typically suitable for describing the early stages of plastic deformation with continuous strain hardening, whereas the Voce model provides a more realistic representation of materials that exhibit a tendency toward saturation of the flow stress at larger plastic strains.
The material parameters associated with these hardening laws were identified for three characteristic material directions corresponding to the rolling direction (RD), the diagonal direction (DD, 45°), and the transverse direction (TD, 90°). The calibrated coefficients are summarized in Table 3.
Table 3.
Calibrated parameters of Swift and Voce hardening models.
These material constants (C, n, P and Q) were determined through a least-squares fitting procedure, in which the predicted hardening curves were adjusted to minimize the deviation from the experimentally obtained true stress–strain data obtained from uniaxial tensile tests. This fitting approach ensures that the constitutive models accurately reproduce the strain hardening characteristics of the material across the plastic deformation range relevant to the deep drawing process.
The quality of the fitting between the experimental data and the predicted curves was quantitatively evaluated using the coefficient of determination (), which measures the proportion of variance in the experimental data explained by the fitted model. The value is calculated according to Equation (3):
where and represent the experimental values and the model-predicted values, respectively, while denotes the mean value of the experimental dataset. An value approaching unity indicates a strong agreement between the experimental measurements and the fitted constitutive model.
The calibrated parameters obtained from this procedure are summarized in Table 3, while the corresponding hardening curves for both models under the three tensile directions are presented in Figure 4. These curves demonstrate the capability of the Swift and Voce hardening models to reproduce the experimentally observed strain hardening response of the three-layer sheet material. The comparison also highlights the directional dependence of the hardening behavior, which reflects the anisotropic nature of the material induced by the rolling process.
Figure 4.
Calibrated hardening curves for the three-layer sheet material along different material orientations.
The Swift and Voce hardening laws were adopted to describe the strain-hardening behavior of the roll-bonded multilayer sheet rather than the elastic–plastic transition immediately after yielding. As shown in Figure 4, the differences between the experimental and fitted curves are limited to a narrow strain range near the yield point, whereas both hardening laws accurately reproduce the material response over the moderate and large plastic strain ranges relevant to the deep-drawing process. Within the Hill48 constitutive framework, the initial yield surface is defined by the experimentally determined yield stresses and Lankford coefficients (r-values), while the Swift and Voce laws govern the subsequent evolution of the flow stress. Therefore, the local mismatch near yielding is not expected to significantly influence the finite element predictions under the investigated forming conditions.
2.1.3. Yield Function
Since the investigated sheet material exhibits pronounced plastic anisotropy, an appropriate anisotropic yield criterion is required to accurately describe its yielding behavior under multi-axial stress states. In the present study, the quadratic anisotropic yield function proposed by Hill (Hill48) [16] was adopted, as it has been widely used in sheet metal forming simulations due to its simplicity and effectiveness in representing planar anisotropy.
According to the Hill48 yield criterion, the equivalent stress is defined as:
where F, G, H, L, M, and N are material anisotropy coefficients that characterize the directional dependence of the yield behavior, and represent the components of the stress tensor. These coefficients must be determined through experimental characterization of the material.
It is worth noting that when the parameters satisfy the conditions F = G = H = 0.5 and L = M = N = 1.5, the Hill48 yield function reduces to the classical von Mises yield criterion, which describes the behavior of isotropic materials. Therefore, the Hill48 model can be regarded as a generalized form capable of representing both isotropic and anisotropic plastic behavior.
Several approaches can be used to calibrate the anisotropic coefficients in the Hill48 criterion. In this work, the coefficients were determined using the Lankford coefficients (r-values) obtained from uniaxial tensile tests along different rolling directions [17,18]. This approach leads to the so-called Hill-R formulation, which relates the anisotropy coefficients to the experimentally measured r-values. The corresponding relationships are given by Equations (5)–(8):
where R0, R45 and R90 represent the Lankford coefficients measured in the RD, DD, and TD directions, respectively. The remaining coefficients were assigned the conventional values L = M = 1.5, corresponding to the isotropic shear response assumption.
Based on the experimentally determined r-values, the calibrated anisotropy parameters used in the present simulations are G = 0.5571, F = 0.4899, H = 0.4429, and N = 1.2638.
Figure 5a illustrates the variation in the normalized yield stress with respect to different loading directions relative to the rolling direction, highlighting the influence of material anisotropy on the onset of plastic yielding. Meanwhile, Figure 5b presents the Hill48-R model response, demonstrating its capability to reproduce the continuous evolution of the Lankford coefficient (r-value) as a function of the loading angle, based on the experimental data obtained at 0°, 45°, and 90°. The results indicate that the calibrated anisotropic yield criterion is able to capture the directional dependence of the material behavior across the entire investigated angular range, thereby confirming the consistency and reliability of the parameter identification procedure.
Figure 5.
Predicted normalized yield stress (a) and corresponding Lankford coefficients (b) for the three-layer sheet based on different yield functions.
In addition, the pronounced variation in the normalized yield stress with loading orientation further confirms that the investigated three-layer sheet material exhibits strong direction-dependent mechanical behavior, characteristic of rolled metallic laminates with pronounced anisotropy.
2.2. Finite Element Simulation and Deep Drawing Experiments
2.2.1. Finite Element Modeling
The investigated component is a cylindrical cup formed from a trilayer sheet consisting of SUS304/AA1050/SUS430, with a total thickness of 2.5 mm. This material configuration combines the corrosion resistance of austenitic stainless steel, the excellent formability of aluminum, and the structural strength of ferritic stainless steel, thereby providing a representative multilayer system for advanced sheet metal forming applications. The deep drawing configuration and the principal geometric parameters of the tooling system are illustrated in Figure 6a. The final cup has a diameter of 200 mm and a punch nose radius of 20 mm. The initial blank diameter is 355 mm, and the target cup height is 110 mm.
Figure 6.
Overview of the cup drawing system: (a) schematic representation and associated geometric parameters; (b) finite element model; (c) experimental die setup.
To evaluate the formability and thickness evolution of the three-layer sheet material during deep drawing, several key technological parameters were systematically investigated. These include the punch–die clearance (Wc), the die shoulder radius (Rd), and the blank holder force (BHF). Variations in these parameters strongly influence the material flow, strain distribution, and localized thinning behavior along the cup wall region. Therefore, their effects on the thickness distribution were analyzed through an integrated experimental–numerical approach, enabling a comprehensive assessment of process stability and forming quality.
The deep drawing process was numerically simulated using the commercial finite element software ABAQUS 6.13 [19], within a three-dimensional finite element framework, as illustrated in Figure 6b. In the numerical model, the punch was fixed in position, whereas the die and blank holder were allowed to move vertically in order to deform the blank and progressively form a cylindrical cup to the target depth. The punch, die, and blank holder were all modeled as rigid bodies, which is a commonly adopted assumption in sheet metal forming simulations due to their substantially higher stiffness compared to the deformable blank. As a result, the material behavior of these tooling components was not explicitly defined.
The contact interactions between the forming tools and the blank were modeled using a Coulomb friction formulation. Three contact pairs, namely punch–blank, blank holder–blank, and die–blank, were considered in the finite element model. The corresponding friction coefficients were defined as μp = 0.25, μh = 0.15, and μd = 0.15, respectively. These values were taken from previously reported studies on the deep drawing of three-layer sheet materials [20,21,22,23], ensuring consistency with established modelling practices in the literature. The trilayer blank was discretized using four-node, reduced-integration shell elements (S4R), which offer an efficient balance between computational cost and accuracy, particularly in capturing both elastic and plastic deformation behavior during the forming process [24,25,26,27,28].
The plastic flow behavior was described using the Hill’48-R anisotropic yield criterion to account for the directional mechanical response of the roll-bonded multilayer sheet. Combined with the calibrated hardening law, this constitutive model was used to simulate anisotropic deformation and predict thickness evolution during the deep-drawing process.
The constitutive parameters were identified from the available experimental data. Because repeated tensile tests were not available for all rolling directions, the statistical variability of the material response could not be quantified or incorporated into the constitutive calibration. Consequently, the finite element simulations were performed using the available experimental data for each material orientation, and the simulation results should be interpreted within this limitation.
2.2.2. Experimental Deep Drawing Setup
To validate the numerical predictions and to investigate the forming behavior of the three-layer sheet material under real processing conditions, deep drawing experiments were carried out using a 200-ton hydraulic press. The tooling system, including the punch, die, and blank holder, as shown in Figure 6c, was manufactured from SKD11 tool steel, which is widely used in sheet metal forming applications due to its excellent wear resistance and high mechanical strength. After machining, all tooling components were subjected to a controlled heat treatment process to achieve a hardness of 52–58 HRC, ensuring sufficient structural durability under forming loads.
In addition to the hardness requirement, careful attention was given to the surface quality of the tooling components in order to minimize frictional variability and ensure consistent contact conditions during forming. The functional surfaces of the punch, die, and blank holder were finished to a surface roughness of Ra = 1.25 μm, which is suitable for deep drawing operations involving multilayer metallic sheets. Furthermore, all tooling parts were precision-machined to satisfy the geometric specifications and dimensional tolerances defined in the forming configuration shown in Figure 6a. These requirements include the punch profile, die shoulder radius, and punch–die clearance, which play critical roles in controlling material flow and preventing excessive thinning or wrinkling during the deep drawing process.
The careful fabrication and preparation of the tooling system ensured that the experimental conditions closely matched those assumed in the finite element simulations, thereby enabling a reliable comparison between numerical predictions and experimental observations. This integrated experimental–numerical framework provides a robust basis for evaluating the forming response and thickness evolution of the SUS304/AA1050/SUS430 trilayer sheet during cylindrical cup deep drawing.
2.2.3. Thickness Measurement of the Formed Cup
To quantitatively evaluate the thickness distribution along the wall of the deep-drawn cylindrical cup, a unified measurement methodology was established for both experimental measurements and numerical simulations. As illustrated in Figure 7a, a total of 20 characteristic points were defined along the meridional profile of the cup cross-section. These points were evenly spaced at 10 mm intervals along the wall height direction. The first measurement point was located 10 mm below the upper flange edge of the formed cup. This flange region was excluded from the analysis because it is removed during the trimming stage to obtain the final cup geometry with a functional height of 100 mm.
Figure 7.
Determination of thickness distribution along the wall of the deep-drawn cylindrical cup: (a) measurement scheme along the cup profile, (b) thickness extraction from the finite element simulation, and (c) experimental thickness measurement points on the formed specimen.
For the numerical simulations (Figure 7b), the local thickness values at the predefined locations were extracted directly from the finite element model using the post-processing measurement tools available in the simulation software. The thickness values were determined based on the nodal coordinates of the shell elements representing the multilayer blank. This approach enables accurate retrieval of local thickness variations along the cup wall region while ensuring full consistency with the predefined measurement locations used in the experimental analysis.
For the experimental measurements (Figure 7c), the corresponding measurement points were carefully marked on the surface of the formed cup after the deep drawing process. The wall thickness at each location was measured using a digital micrometer with a resolution of 0.01 mm, ensuring high measurement precision. To improve the reliability of the data and minimize random measurement errors, the thickness at each location was measured three times independently, and the average value was taken as the representative thickness at that point.
By applying an identical measurement layout for both the numerical and experimental analyses, the study ensures direct comparability between simulation predictions and experimental observations. This consistent evaluation framework allows for a reliable assessment of the predictive capability of the proposed finite element model in capturing the thickness evolution and localized thinning behavior of the SUS304/AA1050/SUS430 three-layer sheet material during the deep drawing process. The methodology therefore provides a robust basis for validating the constitutive modeling and forming simulations developed in this study.
3. Results and Discussions
In this study, the experimentally determined mechanical properties of the SUS304/AA1050/SUS430 trilayer sheet were combined with the technological parameters of the deep drawing process and two commonly used hardening laws, namely Swift and Voce, calibrated along the three principal material orientations (0°, 45°, and 90°). These constitutive models were implemented into the finite element framework to perform numerical simulations, which were subsequently validated through controlled deep drawing experiments.
Initially, a baseline set of technological parameters was selected to evaluate the predictive capability of the material models. The reference process parameters were defined as follows: blank holder force (BHF) = 10 tons, die radius (Rd) = 8 mm, and punch–die clearance (Wc) = 3 mm. Under these conditions, the simulated thickness distributions were compared with experimental measurements in order to determine the most suitable hardening model and rolling direction combination for describing the plastic behavior of the three-layer sheet material.
Once the most appropriate constitutive model had been identified, a systematic parametric investigation was carried out to examine the effects of the principal process parameters on the thickness distribution and thinning behavior of the cylindrical cup. The blank holder force was varied from 6 to 20 tons, the punch–die clearance from 2.6 to 4.0 mm in increments of 0.2 mm, and the die radius from 2 to 14 mm. Based on the simulation results, the combination of process parameters that produced the most uniform thickness distribution and the least localized thinning was selected through systematic manual variation of these variables. The selected parameter combination was subsequently evaluated by finite element simulation and validated experimentally to assess the predictive capability of the proposed modeling framework.
3.1. Influence of Hardening Models and Rolling Direction on Thickness Prediction
The measurement locations were defined consistently for both the experimental tests and the finite element simulations (FEM), and the corresponding configuration is illustrated in Figure 7b,c, based on the cross-sectional profile of the formed component. Specifically, measurement point 1 is positioned near the cup mouth curvature, approximately 10 mm from the edge. Points 1–9 are distributed along the straight generatrix of the cup wall, representing the primary deformation zone during drawing. Points 10 and 11 are located within the transition region associated with the punch fillet radius, where strain gradients are typically more pronounced. Points 12–20 are assigned to the cup bottom region, capturing the deformation state in the most constrained area of the formed component.
This measurement strategy was established to systematically capture the evolution of thickness across the critical deformation zones involved in the deep drawing process, thereby enabling a detailed comparison between experimental observations and numerical predictions.
The deviation between the numerical simulation results and the experimentally measured values was evaluated using Equation (9), while the corresponding comparison of thickness distribution between simulation and experiment is presented in Figure 8 for the reference process condition (BHF = 10 tons, Rd = 8 mm, Wc = 3.0 mm).
where (%) represents the relative deviation between the simulated and experimental thickness values, (mm) denotes the experimentally measured thickness, and (mm) represents the simulated thickness at the corresponding location.
Figure 8.
Comparison of thickness distribution along the cylindrical cup profile obtained from finite element simulation and experimental measurement, together with the corresponding prediction error. Process parameters used in this analysis were: blank holder force BHF = 10 tons, die radius Rd = 8 mm, and punch–die clearance Wc = 3.0 mm.
The thickness distribution of the three-layer cylindrical cup after deep drawing was evaluated using 20 measurement locations along the component profile, as illustrated in Figure 8. These locations can be divided into three characteristic deformation regions, corresponding to the dominant deformation mechanisms involved in the deep drawing process. Specifically, positions 1–9 (corresponding to a distance of 0–80 mm) are located along the cup wall region, positions 10–11 (90–100 mm) correspond to the punch fillet radius region, and positions 12–20 (110–190 mm) are distributed across the cup bottom region.
To evaluate the predictive capability of the material models, the experimental measurements were compared with numerical simulation results obtained using the Swift and Voce hardening models, each considered along three rolling directions of the material (0°, 45°, and 90°). This comparison provides a comprehensive assessment of how the selected hardening law and material anisotropy influence the accuracy of thickness prediction in the deep drawing of three-layer sheet material.
In the cup wall region (positions 1–9), the thickness of the component gradually decreases from the cup mouth toward the punch fillet radius region. This trend is primarily attributed to the tensile deformation experienced by the material along the cup wall region during the deep drawing process. The experimental results indicate that the thickness decreases from approximately 2.53 mm at position 1 to about 1.86 mm at position 9. Most of the numerical models are capable of reproducing this decreasing trend with reasonable accuracy, particularly in the cases of Swift_0, Swift_45, and Voce_0. In this region, the deviation between simulation and experimental measurements generally remains below 3%, indicating that the deformation behavior along the wall can be predicted relatively well by these models. However, the models Swift_90, Voce_45, and Voce_90 begin to show a tendency to predict more pronounced thinning as the material approaches the punch fillet radius region.
The punch fillet radius region (positions 10–11) represents the most critical zone in terms of deformation complexity, where the material experiences a combined state of bending, unbending, and tensile stretching. Consequently, this region is typically associated with the minimum thickness during deep drawing. According to the experimental measurements, the minimum thickness of the component occurs at position 9 (80 mm) with a value of approximately 1.86 mm, after which the thickness slightly increases as the material transitions into the punch fillet radius region. The numerical simulations also predict the location of minimum thickness near this region; however, the predicted thinning magnitude varies significantly depending on the selected hardening model and rolling direction.
For the Swift hardening model, the predicted thickness at position 9 is 1.77 mm (Swift_0), 1.71 mm (Swift_45), and 1.29 mm (Swift_90). In contrast, the Voce hardening model predicts corresponding values of 1.93 mm (Voce_0), 1.24 mm (Voce_45), and 1.00 mm (Voce_90). These results clearly indicate that the cases Swift_90, Voce_45, and particularly Voce_90 significantly overestimate the degree of thinning compared with the experimental measurements. Conversely, the Voce_0 model produces thickness values that are much closer to the experimental observations.
The largest discrepancies between simulation and experiment are also observed in this critical transition region. At position 8 (70 mm), the deviation reaches 36.7% for Swift_90, 39.4% for Voce_45, and 54.0% for Voce_90. Similarly, at position 9 (80 mm), the deviations remain relatively high, reaching 30.9%, 33.3%, and 46.3% for Swift_90, Voce_45, and Voce_90, respectively. In contrast, the Voce_0 model shows a deviation of only approximately 3.6% at this position, and the deviation remains below 5% for most of the measurement locations, indicating a significantly more stable and accurate predictive capability.
In the cup bottom region (positions 12–20), the thickness gradually increases and stabilizes within the range of approximately 2.0 mm to 2.15 mm. This trend is consistent with the material flow mechanism during deep drawing, in which material from the flange region is gradually drawn inward and redistributed toward the bottom of the cup. The numerical simulation results in this region closely follow the experimental trend, with an average deviation generally smaller than 6%, confirming that the numerical models are capable of reproducing the material flow behavior in the bottom region with reasonable accuracy.
Based on the overall comparison of thickness distribution trends, locations of minimum thickness, and quantitative deviations between simulation and experimental measurements across the entire component profile, it can be clearly observed that the Voce hardening model along the 0° rolling direction (Voce_0) provides the best agreement with the experimental results. This model not only accurately predicts the location of minimum thickness but also produces thickness values that are closest to the experimental measurements, while maintaining relatively small deviations across most measurement positions.
Therefore, the Voce_0 hardening model can be considered the most suitable material model for accurately simulating and predicting the thickness distribution in the deep drawing process of three-layer sheet materials investigated in this study. The selected constitutive model provides a reliable basis for further numerical investigations of deep drawing in roll-bonded multilayer sheets. It can also be used to assess the influence of process parameters on thickness evolution and forming quality under different forming conditions.
3.2. Influence of Blank Holder Force on Thickness Distribution
Prior to investigating the effects of process parameters, the material model employed in the finite element simulations was established through a systematic comparison between numerical predictions and experimental results. Among the six material parameter sets constructed from two hardening laws (Swift and Voce) combined with three material orientations (0°, 45°, and 90°), the Voce-RD0 model exhibited the best agreement with the experimental observations in terms of both the final cup geometry and the forming height. Accordingly, this model was selected as the constitutive description for all subsequent analyses.
The selected hardening model was coupled with the Hill48 anisotropic yield criterion, in which the anisotropy coefficients were determined based on the yield stress and Lankford coefficients in different material directions. In addition, the mechanical properties of the SUS304/AA1050/SUS430 trilayer sheet were taken from Table 2. The contact interaction between the blank and the tooling components was described using a Coulomb friction model, with friction coefficients of μp = 0.25 for the punch–blank interface, μh = 0.15 for the blank holder–blank interface, and μd = 0.15 for the die–blank interface. Based on these modeling assumptions, a parametric study was conducted to evaluate the effects of blank holder force, die clearance, and punch radius on the formability and thickness evolution of the formed cup.
The influence of the blank holder force (BHF) on the thickness distribution and thinning behavior of the cylindrical cup obtained from the deep drawing simulation can be clearly observed from the curves presented in Figure 9a, while the variation of the minimum thickness with respect to BHF is illustrated in Figure 9b. In this study, the blank holder force was systematically varied within the range of 6 to 20 tons in order to evaluate its role in controlling material flow and deformation stability during the forming process. The simulation results reveal that the magnitude of BHF significantly affects the thickness distribution along the height of the cylindrical cup.
Figure 9.
Influence of the blank holder force on the thickness distribution of the cylindrical cup during the deep drawing simulation: (a) thickness distribution along the cup profile; (b) variation of the minimum thickness as a function of blank holder force. Process parameters: Rd = 8 mm and Wc = 3.0 mm.
A general trend observed in all thickness distribution curves indicates that the sheet thickness gradually decreases from the flange region (approximately 0–60 mm) toward the punch fillet radius region (about 70–90 mm). This zone corresponds to the location where the most severe deformation occurs during the deep drawing process. In this region, the material simultaneously experiences biaxial tensile stress and bending as it flows over the punch fillet radius region, resulting in significant plastic deformation and thickness reduction. Beyond the punch fillet radius region, the material thickness tends to increase slightly and then stabilizes along the cup wall and bottom region (beyond approximately 100 mm). This behavior is consistent with the typical deformation mechanism in deep drawing, where the transition region around the punch fillet radius region commonly represents the location of minimum thickness.
For relatively low blank holder forces, particularly 6 tons and 8 tons, the minimum thickness near the punch fillet radius region decreases significantly. According to the summarized data, the minimum thickness reaches only 1.02 mm at BHF = 6 tons and 1.63 mm at BHF = 8 tons. The primary reason for this phenomenon is that the applied blank holder force is insufficient to effectively restrain the material flow from the flange into the deformation zone. When the restraining force is too small, the material in the flange region flows excessively and becomes unstable, which often leads to the formation of wrinkling along the flange. The presence of wrinkles disrupts the uniform deformation process and causes localized strain concentration as the material subsequently passes over the punch fillet radius region. As a consequence, severe thinning occurs in this region. Therefore, when the blank holder force is too low, the forming quality deteriorates due to the simultaneous occurrence of flange wrinkling and excessive thinning.
When the blank holder force increases to the intermediate range of 10–16 tons, the thickness distribution becomes significantly more stable and uniform. In particular, the condition BHF = 14 tons provides the most favorable result, where the minimum thickness reaches approximately 2.06 mm, which is close to the initial sheet thickness. In addition, the thickness distribution curve under this condition exhibits only minor variation along the entire cup height. This behavior indicates that a moderate blank holder force can effectively regulate the material flow from the flange into the forming region while maintaining deformation stability. As a result, both undesirable phenomena—wrinkling in the flange and excessive local thinning—are significantly suppressed. Consequently, the material is more evenly redistributed during the forming process, allowing the cup wall region to maintain a relatively uniform thickness.
Conversely, when the blank holder force further increases to 18 tons and 20 tons, the minimum thickness near the punch fillet radius region decreases sharply to approximately 1.24 mm and 0.69 mm, respectively. An excessively large blank holder force severely restricts the inward movement of material from the flange toward the deformation zone. Under these conditions, the material located near the punch fillet radius region must accommodate a greater portion of the deformation through tensile stretching rather than material flow. This leads to intensified tensile stress and localized strain concentration in this region, resulting in pronounced thinning. In extreme cases, the accumulated stress and strain may exceed the forming limit of the material, ultimately causing tearing or fracture along the cup wall region.
Based on the above analysis, it can be concluded that the blank holder force plays a decisive role in controlling the thickness distribution and deformation stability of the cylindrical cup during the deep drawing process. An excessively low blank holder force (6–8 tons) promotes flange wrinkling and severe thinning, whereas an excessively high blank holder force (18–20 tons) leads to excessive thinning and an increased risk of tearing. Within the investigated parameter range, an optimal blank holder force of approximately 14 tons is identified. At this level, the cylindrical cup exhibits a relatively uniform thickness distribution with minimal thinning, while maintaining values close to the initial sheet thickness. This condition therefore ensures the most favorable forming quality and structural integrity of the deep-drawn component.
From a broader perspective, these findings highlight the importance of carefully balancing the restraining force applied to the blank during the forming process. For three-layer sheet material, where interlayer deformation compatibility may further complicate material flow behavior, the appropriate selection of blank holder force becomes even more critical for achieving uniform deformation and preventing premature failure. Consequently, the present analysis improves the understanding of the relationships between the principal process parameters and the resulting formability and dimensional stability of roll-bonded multilayer sheet components during deep drawing.
3.3. Influence of Punch–Die Clearance on Thickness Distribution
The effect of the punch–die clearance (Wc) on the thickness distribution and thinning behavior of the cylindrical cup produced from the three-layer sheet material is illustrated in Figure 10a, while the corresponding variation in the minimum thickness as a function of clearance is presented in Figure 10b. These results provide important insight into how geometric clearance influences the material flow characteristics and deformation stability during the deep drawing process. In the present investigation, the clearance between the punch and die was systematically varied from 2.6 mm to 4.0 mm with an increment of 0.2 mm in order to evaluate its role in controlling strain distribution within the three-layer sheet material during forming.
Figure 10.
Effect of punch–die clearance on the thickness distribution of the cylindrical cup in the deep drawing simulation: (a) thickness distribution along the cup profile; (b) variation of the minimum thickness with respect to punch–die clearance. Process parameters: BHF = 10 tons and Rd = 8.0 mm.
The simulation results clearly demonstrate that punch–die clearance plays a critical role in regulating the flow of material from the flange region into the deformation zone, thereby strongly influencing the thickness evolution along the cup wall region. As the clearance varies within the investigated range, noticeable differences in thickness distribution are observed at several measurement locations along the cup profile. The most pronounced variations occur in the transition region between the cup bottom and the cup wall region, corresponding approximately to measurement positions 7–9 (60–80 mm). This region is known to experience the highest level of plastic deformation during deep drawing, where the material undergoes simultaneous stretching and bending while passing over the punch fillet radius region. Consequently, this area is typically associated with the occurrence of minimum thickness.
When the clearance is relatively small, specifically Wc = 2.6 mm, the gap between the punch and die becomes insufficient compared with the total thickness of the three-layer sheet. Under this condition, the material flow through the punch–die interface is strongly constrained. As the sheet is forced to pass through the narrow deformation zone, significant resistance to material flow develops, resulting in elevated tensile stresses and severe strain localization in the transition region. The simulation results reveal that the minimum thickness decreases dramatically to approximately 0.52 mm, representing a substantial reduction compared with the initial sheet thickness. On the thickness distribution curve, the corresponding profile for Wc = 2.6 mm exhibits a pronounced trough around 80 mm, indicating a sudden and severe reduction in thickness. Such behavior reflects the occurrence of excessive thinning and suggests a high risk of material fracture during the forming process. Therefore, an excessively small punch–die clearance is clearly unfavorable for deep drawing operations involving three-layer sheet material.
When the clearance is slightly increased to Wc = 2.8 mm, the severity of thinning is partially alleviated; however, the minimum thickness remains relatively low at approximately 1.47 mm. Although the increase in clearance allows the material to flow more freely compared with the previous case, the deformation distribution is still not fully stable. In particular, the transition region between the cup bottom and the cup wall region continues to exhibit a noticeable reduction in thickness, indicating that strain concentration remains present in this area. Consequently, this clearance value does not yet provide optimal deformation conditions for achieving a uniform thickness distribution.
As the clearance increases further to Wc = 3.0 mm, 3.2 mm, and 3.4 mm, the thickness distribution becomes significantly more uniform along the entire cup profile. In this intermediate clearance range, the material can flow from the flange into the deformation zone in a more controlled and stable manner. The reduced resistance to material flow decreases the magnitude of tensile stress concentration, thereby limiting the occurrence of localized thinning. Among these conditions, Wc = 3.2 mm yields the most favorable result. Under this clearance value, the minimum thickness reaches approximately 1.96 mm, which is close to the original sheet thickness. Moreover, the thickness distribution curve along the cup wall region appears relatively smooth and stable, with only minor fluctuations across the measurement positions. This behavior indicates that the deformation is distributed more uniformly throughout the formed component, which contributes to improved geometric accuracy and enhanced structural integrity of the cylindrical cup.
However, when the clearance is further increased to Wc = 3.8 mm and 4.0 mm, the punch–die gap becomes excessively large relative to the technological requirements of the deep drawing process. In such cases, the forming tools are no longer able to effectively guide and restrain the material flow within the deformation zone. As a consequence, the material in the flange region tends to deform more freely, which may lead to flange wrinkling and unstable material flow conditions. The simulation results reflect this phenomenon through the deterioration of thickness uniformity along the cup wall region. In addition, the minimum thickness decreases again to approximately 1.35 mm and 1.22 mm, respectively. This trend indicates that an overly large clearance reduces the ability of the tooling system to control deformation, thereby increasing the likelihood of localized thinning and potential material failure during the deep drawing process.
A comprehensive evaluation of the thickness distribution curves and the corresponding minimum thickness values indicates that Wc = 3.2 mm represents the most appropriate punch–die clearance within the investigated parameter range. At this clearance level, the cylindrical cup exhibits the most uniform thickness distribution, minimal thinning, and a stable deformation state. Furthermore, this condition effectively balances two competing forming issues: excessive thinning caused by insufficient clearance and flange wrinkling associated with excessive clearance. Therefore, the clearance value Wc = 3.2 mm is identified as the optimal technological parameter for the deep drawing of the three-layer sheet material investigated in this study.
From a broader perspective, the present analysis highlights the importance of carefully selecting the punch–die clearance when forming three-layer sheet material. Unlike conventional monolithic sheets, multilayer systems may exhibit more complex deformation interactions between layers, which makes the control of strain distribution particularly sensitive to tooling geometry. By identifying an appropriate clearance range, the present work contributes to improving deformation stability and thickness uniformity in the deep drawing of three-layer sheet material structures, thereby enhancing the reliability and applicability of such materials in advanced forming applications.
3.4. Influence of Die Corner Radius
The influence of the die radius (Rd) on the thickness distribution and thinning behavior of the cylindrical cup fabricated from the three-layer sheet material can be analyzed based on the results presented in Figure 11a, while the corresponding variation of the minimum thickness with respect to the die radius is illustrated in Figure 11b. These results provide valuable insight into the role of die geometry in controlling deformation behavior and material flow during the deep drawing process of three-layer sheet material structures.
Figure 11.
Influence of die radius on the thickness distribution of the cylindrical cup obtained from the deep drawing simulation: (a) thickness distribution along the cup profile; (b) variation of the minimum thickness as a function of die radius. Process parameters: BHF = 10 tons and Wc = 3.0 mm.
The simulation results demonstrate that the die radius has a pronounced effect on the deformation state and the resulting thickness evolution along the cup wall region. As the die radius varies from Rd = 2 mm to Rd = 14 mm, the thickness measured at different locations along the cup profile exhibits distinct trends. The most significant variations occur in the transition region between the cup bottom and the cup wall region, corresponding approximately to measurement positions 5–8 (40–70 mm). This region is characterized by severe plastic deformation during deep drawing because the material must simultaneously undergo bending and tensile stretching while passing through the die–punch transition zone. Consequently, this area is generally associated with the highest degree of thinning.
For the case of Rd = 2 mm, the die radius is relatively small, forcing the material to experience intense bending and stretching when flowing through the transition region between the cup bottom and the cup wall region. This severe deformation condition promotes strong localization of strain, leading to a substantial reduction in sheet thickness. The simulation results indicate that the minimum thickness decreases dramatically to approximately 0.85 mm, representing a significant reduction compared with the original sheet thickness. In the thickness distribution curve, the profile corresponding to Rd = 2 mm shows a pronounced trough near 50 mm, reflecting a sharp drop in thickness. Such behavior suggests a high likelihood of deformation instability or even material tearing during the forming process. Therefore, an excessively small die radius is clearly unsuitable for deep drawing cup-shaped components produced from three-layer sheet material.
When the die radius increases to Rd = 4 mm and Rd = 6 mm, the severity of thinning is noticeably reduced. The minimum thickness increases to approximately 1.62 mm and 1.84 mm, respectively. This improvement indicates that enlarging the die radius alleviates the degree of localized bending experienced by the material as it enters the deformation zone, thereby enhancing the plastic flow capability of the sheet. Nevertheless, the thickness distribution along the cup wall region under these conditions is still not fully uniform. In particular, the region around the punch–die transition continues to exhibit noticeable thickness reduction, indicating that localized strain concentration has not yet been completely eliminated.
Further increases in the die radius to Rd = 8 mm, 10 mm, and 12 mm lead to a much more stable and uniform thickness distribution across the entire cup profile. As the die radius becomes larger, the material can flow more smoothly from the blank flange into the deformation region, reducing the intensity of localized stress and strain. Consequently, the deformation is distributed more evenly along the cup wall region. Among these conditions, Rd = 10 mm provides the most favorable result. Under this configuration, the minimum thickness reaches approximately 2.02 mm, which is very close to the initial sheet thickness and higher than those observed in the other investigated cases. In addition, the thickness distribution curve along the measurement distance appears relatively smooth and stable, with only minor fluctuations. This indicates that the deformation process becomes more uniform along the entire cup wall region, suggesting that a moderate die radius can effectively balance the material flow behavior and the stretching of the cup wall region.
However, when the die radius is further increased to Rd = 12 mm and Rd = 14 mm, the improvement in thickness uniformity becomes less significant, and a slight reduction in minimum thickness begins to appear again. Although the degree of thinning remains within an acceptable range, the increasing die radius reduces the ability of the tooling geometry to effectively guide and control the material flow into the forming zone. As a result, more material tends to migrate toward the cup wall region, leading to a slight increase in tensile stretching and consequently a moderate decrease in thickness.
A comprehensive assessment of the simulation data and thickness distribution curves therefore indicates that Rd = 10 mm represents the most suitable die radius within the investigated parameter range. At this value, the cylindrical cup exhibits the highest minimum thickness, the most uniform thickness distribution, and the lowest degree of thinning, while also minimizing the risk of deformation instability. Accordingly, the die radius Rd = 10 mm is identified as the optimal geometric parameter for the deep drawing of the three-layer sheet material considered in this study.
From a broader manufacturing perspective, these findings highlight the critical importance of die geometry in controlling deformation behavior when forming three-layer sheet material structures. Compared with conventional monolithic sheets, multilayer materials often exhibit more complex interactions between layers during plastic deformation. Consequently, the selection of tooling parameters such as the die radius becomes essential for ensuring stable material flow, minimizing thinning, and improving the structural integrity of deep-drawn components. The present results therefore provide useful guidelines for the design of forming tools and process parameters in advanced three-layer sheet material forming applications.
3.5. Validation of the Selected Process Parameters
In this study, both the die geometry and the process parameters were treated as input variables for the deep drawing simulations. The investigated parameters include blank holder force (BHF), die shoulder radius (Rd), and punch–die clearance (Wc), while the corresponding output response is the thickness distribution (tp), as summarized in Table 4.
Table 4.
Input and output parameters.
Based on the systematic parametric investigation, the combination of a blank holder force of 14 tons, a punch–die clearance of 3.2 mm, and a die radius of 10 mm produced the most uniform thickness distribution among the conditions investigated. Under these conditions, material flow during deep drawing was more uniform, resulting in reduced localized thinning and a more homogeneous thickness distribution along the cup wall. The simulation results indicate that the minimum thickness in the most severely deformed region was only slightly reduced, reaching approximately 2.21–2.23 mm, which is significantly higher than that obtained from the initial simulation case. In addition, the thickness distribution along the cup wall became smoother, with reduced fluctuations over the entire measurement range, indicating a more homogeneous strain distribution along the cup height. These improvements confirm that appropriate adjustment of key process parameters effectively mitigates stress concentration and suppresses localized thinning during forming.
Figure 12 compares the thickness distributions predicted by the finite element model with the corresponding experimental measurements for the selected process parameters. Good agreement is observed over the entire cup profile, indicating that the proposed finite element model reliably captures the thickness evolution during deep drawing. Compared with the reference process condition, the selected parameter combination (blank holder force = 14 tons, punch–die clearance = 3.2 mm, and die radius = 10 mm) produces a more uniform thickness distribution and reduces localized thinning in the critical deformation region. These results demonstrate the influence of the principal process parameters on material flow and thickness evolution and confirm the effectiveness of the parameter selection based on the systematic parametric investigation.
Figure 12.
Comparison of the thickness distribution along the cup wall between the finite element prediction and the experimental measurement for the selected process parameters (blank holder force = 14 tons, die radius = 10 mm, and punch–die clearance = 3.2 mm).
The initial numerical results indicate that the thickness distribution along the cup wall is not uniform. In the region near the cup bottom (approximately measurement points 1–4, corresponding to a distance of 0–30 mm), the thickness gradually decreases from about 2.55 mm to 2.29 mm. This reduction becomes more pronounced in the transition zone between the cup bottom and the wall, where the most severe plastic deformation occurs during deep drawing. Specifically, at measurement positions around 80–90 mm, the thickness drops to approximately 1.89–1.93 mm, clearly indicating significant thinning. Beyond this region, the thickness increases again toward the flange area. This distribution pattern suggests that the initial parameter set does not ensure optimal material flow conditions, leading to localized strain concentration in the transition zone and consequently excessive thinning.
A quantitative comparison between the improved simulation results and the experimental measurements further confirms the reliability of the numerical approach. The relative deviation between simulation and experiment at the measurement positions is generally within the range of 0.4% to 2.6%, with the largest discrepancy occurring near a distance of approximately 120 mm. In the context of sheet metal forming simulations, such a deviation is considered relatively small and falls well within the acceptable range reported in similar forming studies. This level of agreement demonstrates the robustness of the adopted numerical model in predicting thickness evolution during the forming of three-layer sheet material structures.
The results show that, among the conditions investigated, the combination of blank holder force, punch–die clearance, and die radius exerted a pronounced influence on the thickness distribution of the cylindrical cup. Compared with the reference process condition, the selected parameter combination reduced localized thinning and produced a more uniform thickness distribution along the cup wall. Furthermore, the finite element predictions agreed well with the experimental measurements, supporting the predictive capability of the proposed numerical model for evaluating thickness evolution during the deep drawing of roll-bonded multilayer sheet materials.
More broadly, these findings highlight the importance of integrating numerical simulation with experimental validation to systematically evaluate the effects of process parameters in the deep drawing of roll-bonded multilayer sheet materials. The methodology adopted in this study provides a reliable framework for improving forming quality and reducing the risk of defects in complex sheet metal components. Consequently, the proposed approach contributes to advancing the design and manufacturing of three-layer sheet material structures used in modern engineering applications where both structural integrity and dimensional accuracy are critical.
4. Conclusions
This study investigated the influence of constitutive modeling and process parameters on the thickness distribution of a SUS304/AA1050/SUS430 laminated sheet during deep drawing through a combination of finite-element simulations and experimental validation.
The main findings can be summarized as follows:
- -
- Among the investigated constitutive models, the Voce-RD0 parameter set provided the closest agreement with the experimental thickness distribution and the location of maximum thinning, and was therefore selected for subsequent analyses.
- -
- Blank holder force, punch–die clearance, and die radius were identified as the primary process parameters affecting thickness evolution and formability. Both excessively low and excessively high values of these parameters increased thickness non-uniformity and reduced process stability.
- -
- Among the conditions investigated, a blank holder force of 14 tons, a punch–die clearance of 3.2 mm, and a die radius of 10 mm produced the most uniform thickness distribution and the least localized thinning.
- -
- The finite element predictions agreed well with the experimental measurements, with deviations ranging from 0.4% to 2.6%, demonstrating the capability of the proposed constitutive framework to predict thickness evolution under the investigated forming conditions.
The combined experimental–numerical approach presented in this study provides a practical framework for constitutive model evaluation and systematic investigation of process parameter effects in the deep drawing of roll-bonded multilayer sheet materials.
A limitation of the present study is that repeated tensile tests were not available for all material orientations; therefore, the statistical variability of the experimental data could not be quantified or incorporated into the constitutive calibration. Future work will include replicated tensile tests to evaluate the influence of experimental variability on constitutive parameter identification and the predictive performance of the finite element model.
Author Contributions
Conceptualization, K.-T.T., T.-T.L. and D.-T.N.; Methodology, K.-T.T., T.-T.L. and D.-T.N.; Software, T.-T.L.; Validation, K.-T.T., T.-T.L. and D.-T.N.; Formal analysis, K.-T.T. and T.-T.L.; Investigation, K.-T.T., T.-T.L. and D.-T.N.; Resources, K.-T.T. and T.-T.L.; Data curation, K.-T.T.; Writing—original draft, K.-T.T., T.-T.L. and D.-T.N.; Writing—review & editing, D.-T.N.; Visualization, T.-T.L. and D.-T.N.; Supervision, T.-T.L. and D.-T.N.; Project administration, D.-T.N.; Funding acquisition, D.-T.N. All authors have read and agreed to the published version of the manuscript.
Funding
This research is funded by Hanoi University of Science and Technology (HUST) under Grant No. T2024-PC-028.
Data Availability Statement
The original contributions presented in this study are included in the article. Further inquiries can be directed to the corresponding author.
Conflicts of Interest
The authors declare no conflict of interest.
References
- Tsukamoto, H. Impact compressive behavior of deep-drawn cups consisting of aluminum/duralumin multi-layered graded structures. Mater. Sci. Eng. B 2015, 198, 25–34. [Google Scholar] [CrossRef] [Scilit]
- Zafar, R.; Lihui, L.; Rongjing, Z. Analysis of hydro-mechanical deep drawing and the effects of cavity pressure on quality of simultaneously formed three-layer Al alloy parts. Int. J. Adv. Manuf. Technol. 2015, 80, 2117–2128. [Google Scholar] [CrossRef] [Scilit]
- Atrian, A.; Fereshteh-Saniee, F. Deep drawing process of steel/brass laminated sheets. Compos. Part B Eng. 2013, 47, 75–81. [Google Scholar] [CrossRef] [Scilit]
- Qi, Y.Y.; Ma, X.G.; Jiang, Z.Y.; Ma, L.N.; Wang, Z.H.; Zhou, C.L.; Hasan, M.; Dobrzański, L.A.; Zhao, J.W. Numerical and experimental investigation on the formability of stainless steel-copper composites during micro deep drawing. J. Cent. South Univ. 2025, 32, 1237–1251. [Google Scholar] [CrossRef] [Scilit]
- Marcin, K.; Łukasz, L.; Paulina, L.-G.; Krzysztof, M.; Janusz, M. Analysis of the deep drawing process of three-layered explosive welded composite. Procedia Manuf. 2020, 50, 153–158. [Google Scholar] [CrossRef] [Scilit]
- Tiwari, P.R.; Rathore, A.; Bodkhe, M.G. Factors affecting the deep drawing process—A review. Mater. Today Proc. 2022, 56, 2902–2908. [Google Scholar] [CrossRef] [Scilit]
- Xu, C.; Huang, S.; Li, Z.; Cai, Y.; Li, H.; Pang, Y. Anisotropy of 316 L stainless steel foil and its effect on the forming process. Mater. Today Commun. 2025, 45, 112210. [Google Scholar] [CrossRef] [Scilit]
- Laboubi, S.; Boussaid, O.; Zaaf, M.; Ghennai, W. Numerical investigation and experimental validation of Lemaitre ductile damage model for DC04 steel and application to deep drawing process. Int. J. Adv. Manuf. Technol. 2023, 126, 2283–2294. [Google Scholar] [CrossRef] [Scilit]
- Beltzung, B.; Pelé, M.; Renoult, J.P.; Sueur, C. Deep learning for studying drawing behavior: A review. Front. Psychol. 2023, 14, 992541. [Google Scholar] [CrossRef] [Scilit] [PubMed]
- Guo, Y.; Wang, C.; Han, S.; Kosec, G.; Zhou, Y.; Wang, L.; Wahab, M.A. A deep neural network model for parameter identification in deep drawing metal forming process. J. Manuf. Process. 2025, 133, 380–394. [Google Scholar] [CrossRef] [Scilit]
- Wang, C.J.; Cheng, L.D.; Liu, Y.; Zhang, H.; Wang, Y.; Shan, D.B.; Guo, B. Research on micro-deep drawing process of concial part with ultra-thin copper foil using multi-layered DLC film-coated die. Int. J. Adv. Manuf. Technol. 2019, 100, 569–575. [Google Scholar]
- Li, X.; Liu, C.; Zhang, M. Forming Limits Prediction of Laminated SUS430/Al1050/SUS430 Composites and the Effect of Component Properties on Mechanical Performance. Adv. Eng. Mater. 2024, 26, 2400619. [Google Scholar] [CrossRef] [Scilit]
- Gabsi, Y.; Zouari, S.; Abdennadher, M.; Dieng, L.; Elleuch, R. Development and Characterization of Cladding AISI 304L Stainless Steel on Aluminum. J. Manuf. Mater. Process. 2025, 9, 30. [Google Scholar] [CrossRef] [Scilit]
- Swift, H.W. Plastic instability under plane stress. J. Mech. Phys. Solids 1952, 1, 1–18. [Google Scholar] [CrossRef] [Scilit]
- Voce, E. The relationship between stress and strain for homogeneous deformation. J. Inst. Met. 1948, 74, 537–562. [Google Scholar]
- Hill, R. A Theory of the Yielding and Plastic Flow of Anisotropic Metals. Proc. R. Soc. A 1948, 193, 281–297. [Google Scholar] [CrossRef] [Scilit]
- Ozturk, F.; Toros, S.; Kilic, S. Effects of Anisotropic Yield Functions on Prediction of Forming Limit Diagrams of DP600 Advanced High Strength Steel. Procedia Eng. 2014, 81, 760–765. [Google Scholar] [CrossRef] [Scilit]
- Basak, S.; Panda, S.K.; Lee, M.G. Formability and fracture in deep drawing sheet metals: Extended studies for pre-strained anisotropic thin sheets. Int. J. Mech. Sci. 2019, 170, 105346. [Google Scholar] [CrossRef] [Scilit]
- Hibbitt, B.K.; Sorensen, P.S.D. Abaqus/CAE User’s Manual, Ver. 6.10.1; Abaqus Inc.: Palo Alto, CA, USA, 2001; pp. 1–847. [Google Scholar]
- Luyen, T.T.; Mac, T.B.; Banh, T.L.; Nguyen, D.T. Investigating the impact of yield criteria and process parameters on fracture height of cylindrical cups in the deep drawing process of SPCC sheet steel. Int. J. Adv. Manuf. Technol. 2023, 128, 2059–2073. [Google Scholar] [CrossRef] [Scilit]
- Zein, H.; El Sherbiny, M.; Abd-Rabou, M.; El Shazly, M. Thinning and spring back prediction of sheet metal in the deep drawing process. Mater. Des. 2014, 53, 797–808. [Google Scholar] [CrossRef] [Scilit]
- The-Thanh, L.; Tien-Long, B.; The-Van, T.; Nguyen, D.-T. A study on a deep-drawing process with two shaping states for a fuel-filter cup using combined simulation and experiment. Adv. Mech. Eng. 2019, 11, 1687814019872674. [Google Scholar] [CrossRef] [Scilit]
- Sheng, Z.Q.; Jirathearanat, S.; Altan, T. Adaptive FEM simulation for prediction of variable blank holder force in conical cup drawing. Int. J. Mach. Tools Manuf. 2004, 44, 487–494. [Google Scholar] [CrossRef] [Scilit]
- Mac, T.B.; Hoang, T.K.; Nguyen, D.-T. An integrated experimental–numerical investigation of temperature-dependent formability in heat-assisted single point incremental forming of AA6061 aluminium alloy. Int. J. Adv. Manuf. Technol. 2026, 144, 5091–5111. [Google Scholar] [CrossRef] [Scilit]
- Luyen, T.T.; Hoang, T.K.; Than, V.T.; Nguyen, D.-T. Thermo–mechanical modeling and experimental validation of heat-assisted single-point incremental forming of AA1050 complex thin-shell components: Process optimization and experimental verification. Ain Shams Eng. J. 2026, 17, 104174. [Google Scholar] [CrossRef] [Scilit]
- Luyen, T.T.; Mac, T.B.; Than, V.T.; Hoang, T.K.; Nguyen, D.-T. Thermal and tool path effects on forming force and surface integrity in heat-assisted single point incremental forming of AA1050 aluminum alloy. Case Stud. Therm. Eng. 2026, 79, 107839. [Google Scholar] [CrossRef] [Scilit]
- Hoang, T.K.; Luyen, T.T.; Nguyen, D.-T. An in-depth analysis of process parameter effects on forming forces in single point incremental forming of Al1050 aluminium sheets. Adv. Mater. Process. Technol. 2026, 12, 167–180. [Google Scholar]
- Luyen, T.T.; Mac, T.B.; Hoang, T.K.; Nguyen, D.-T. A study on improving thickness uniformity and geometric precision of truncated cone components in hydraulic pressure-assisted single point incremental forming. J. Manuf. Process. 2026, 152, 488–505. [Google Scholar]
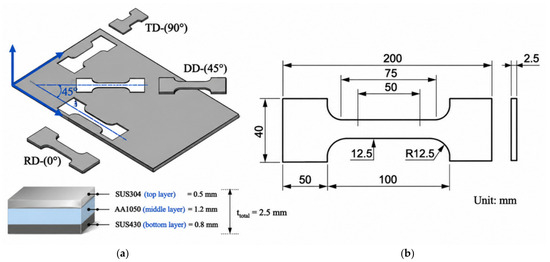
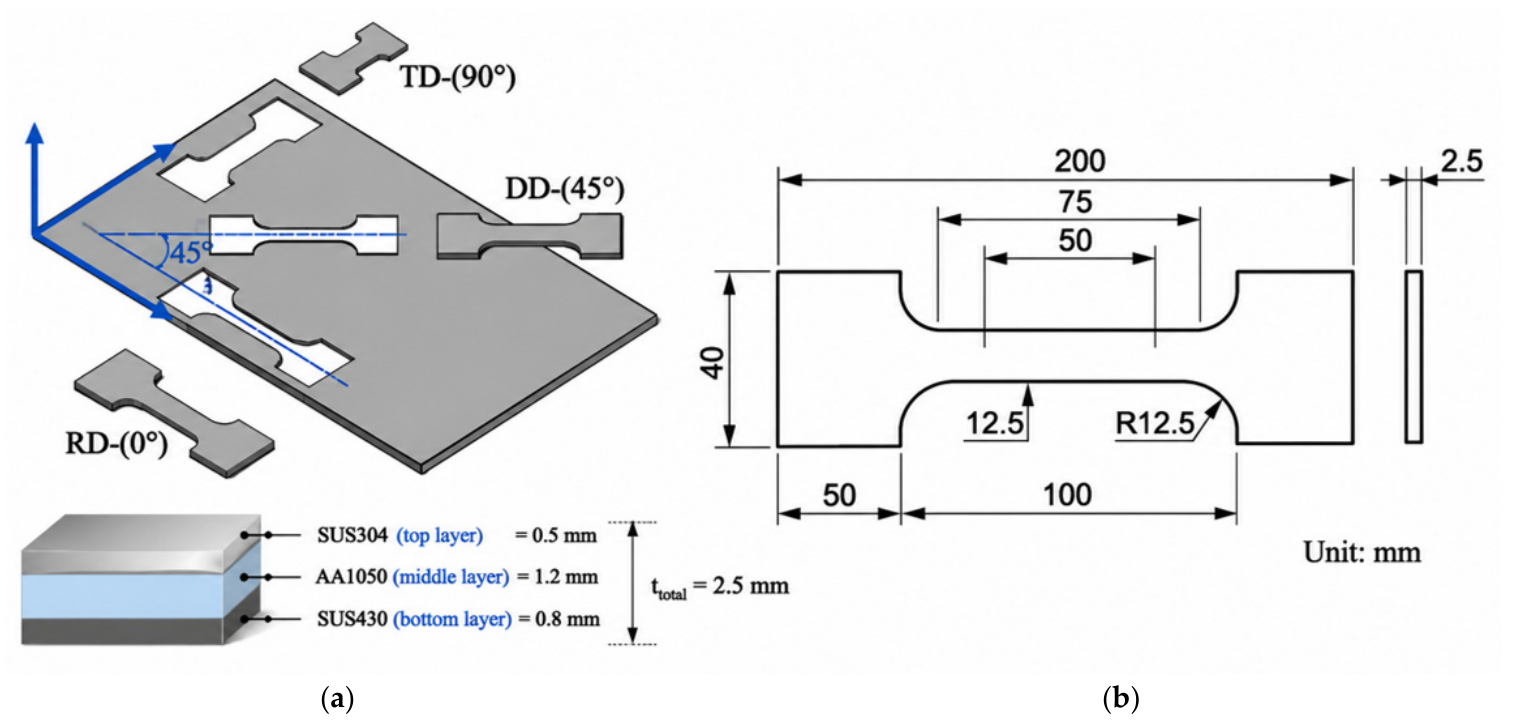
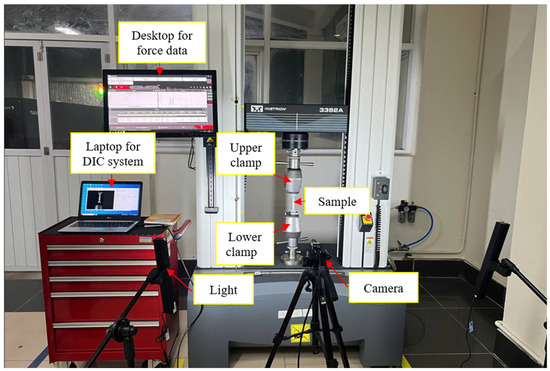
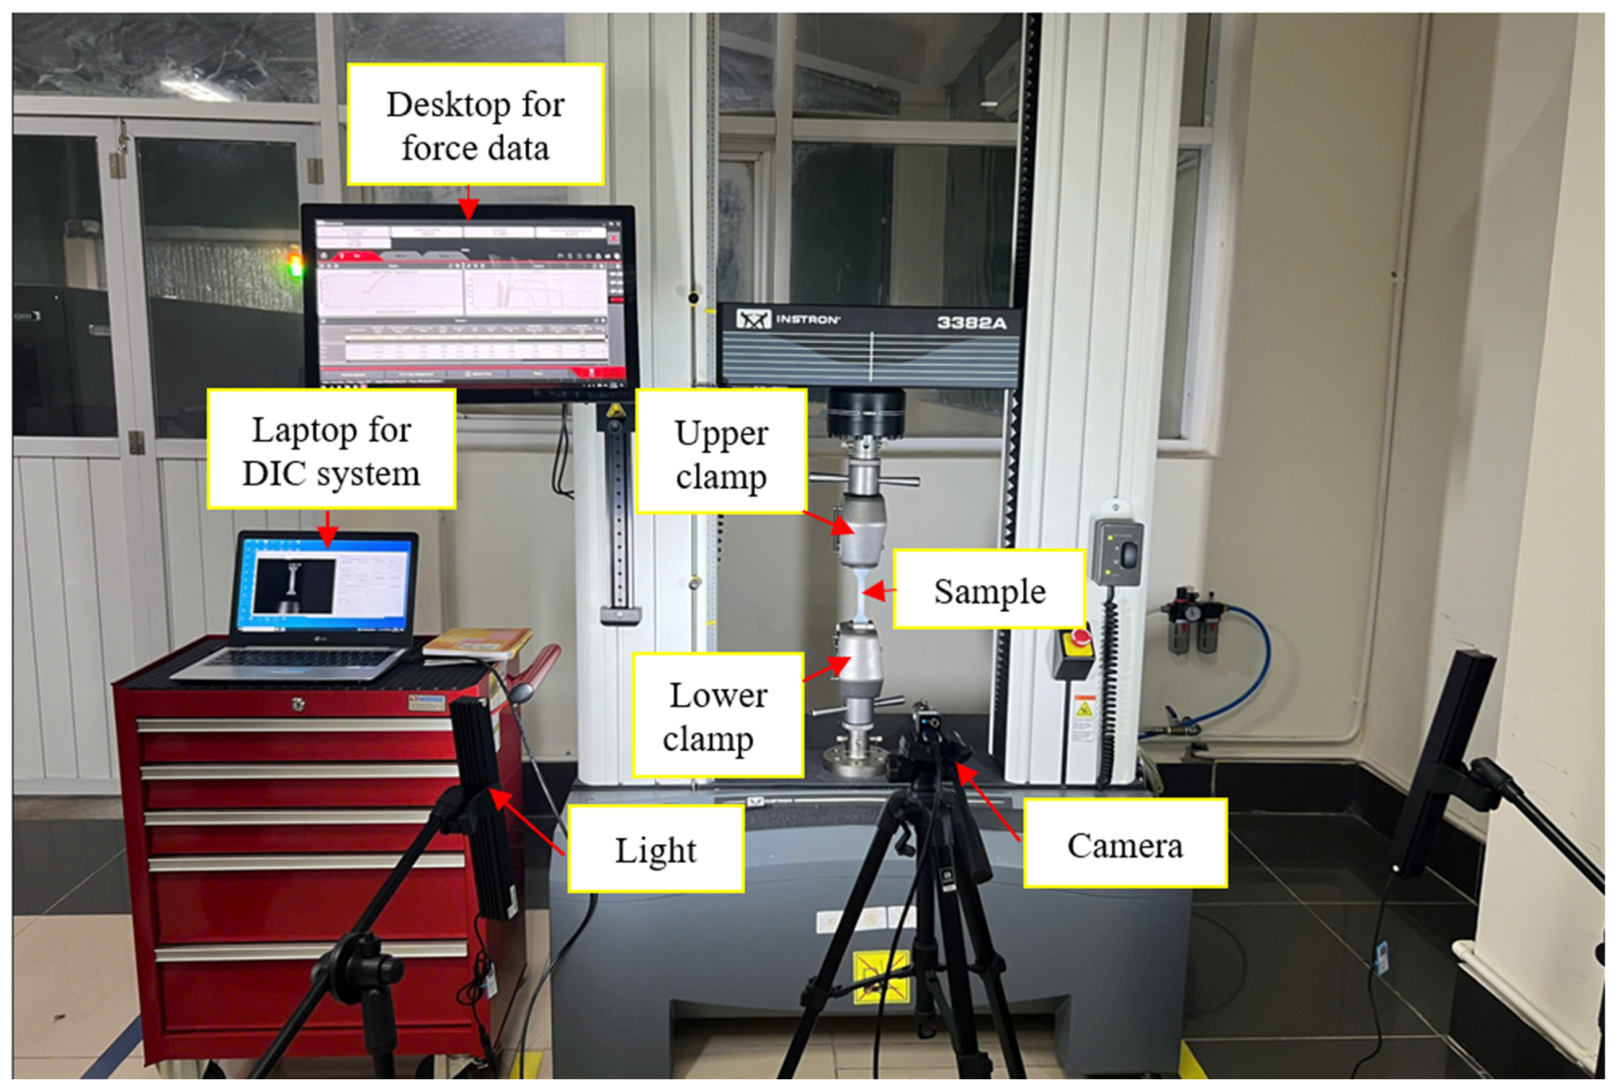
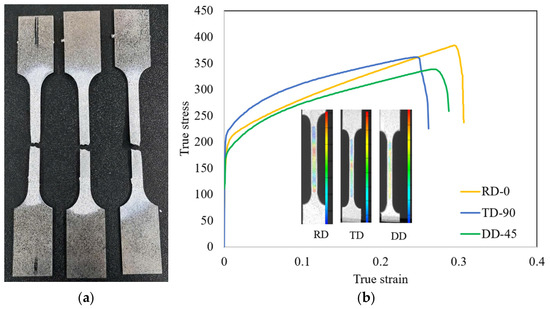
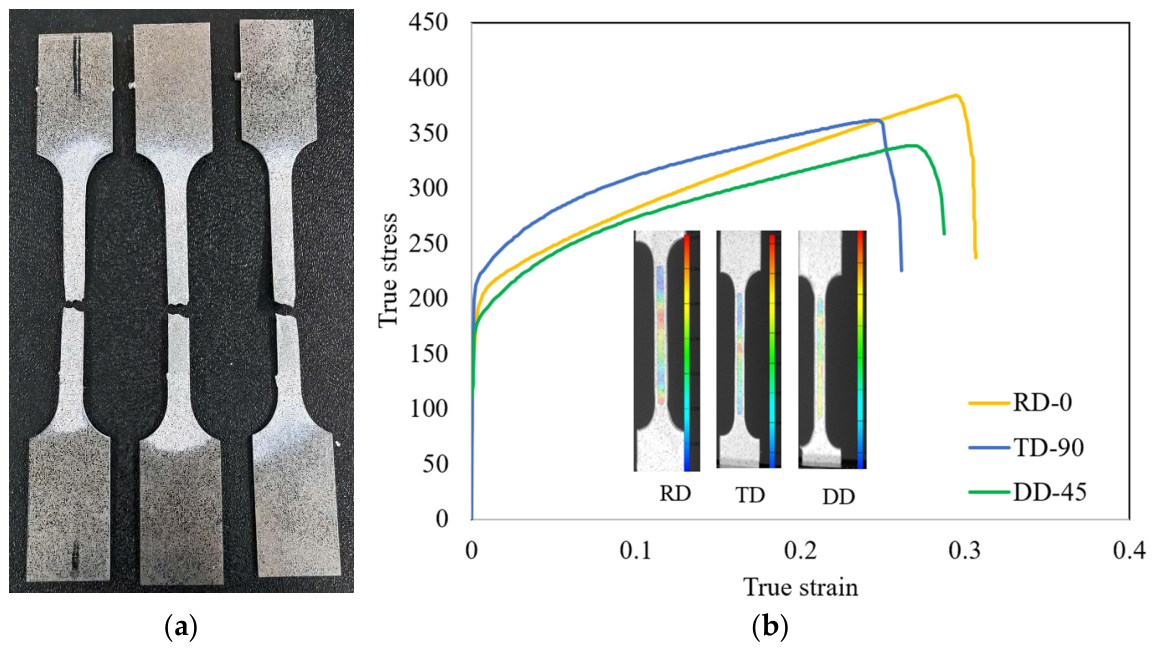
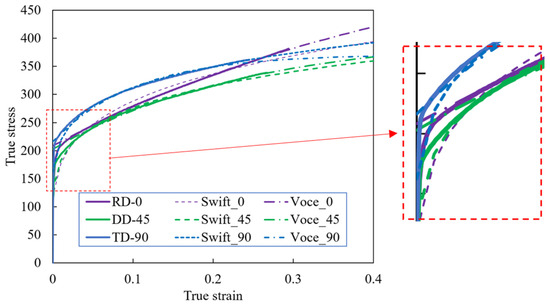
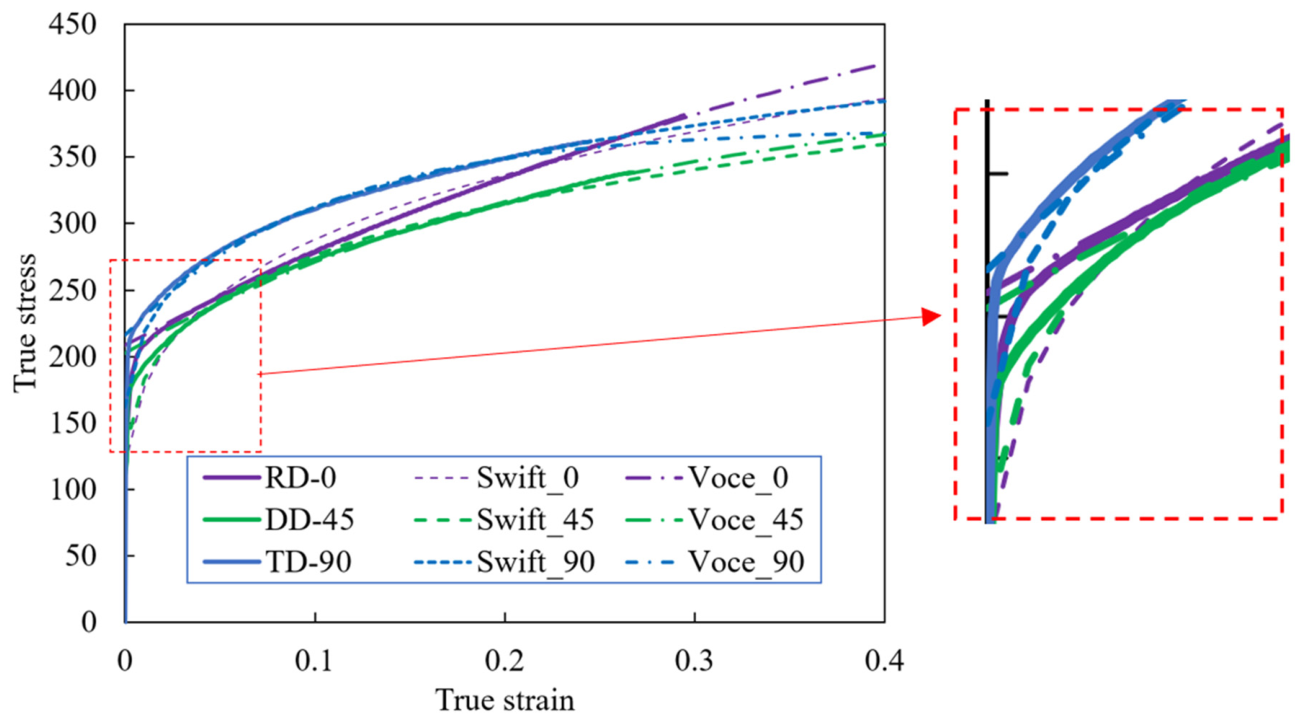
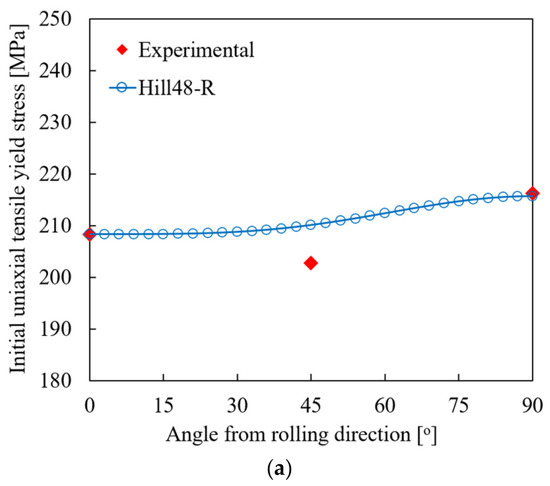
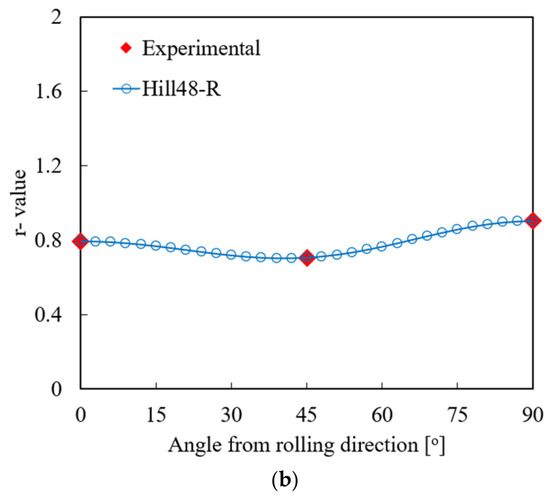
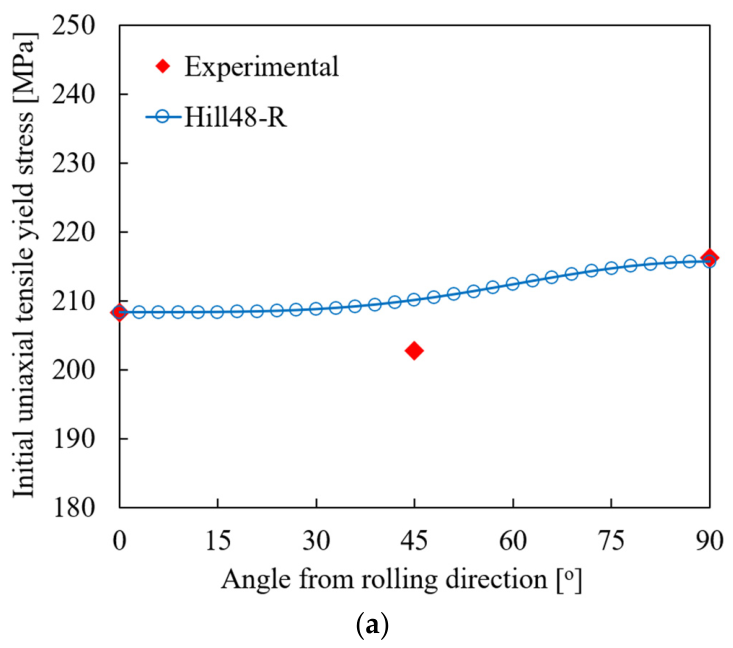
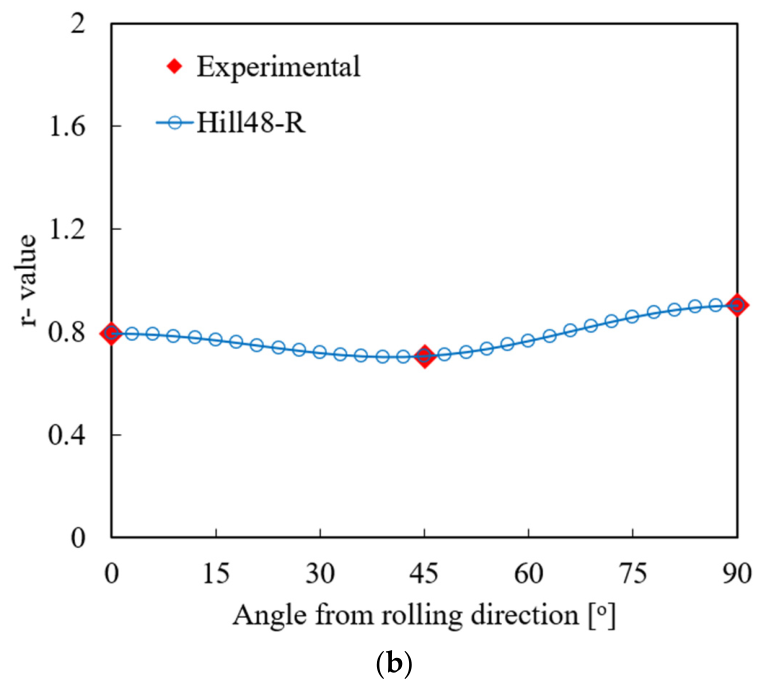
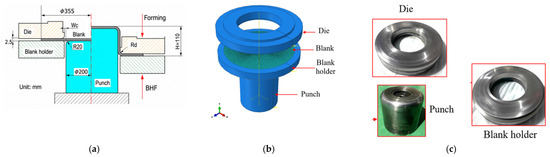
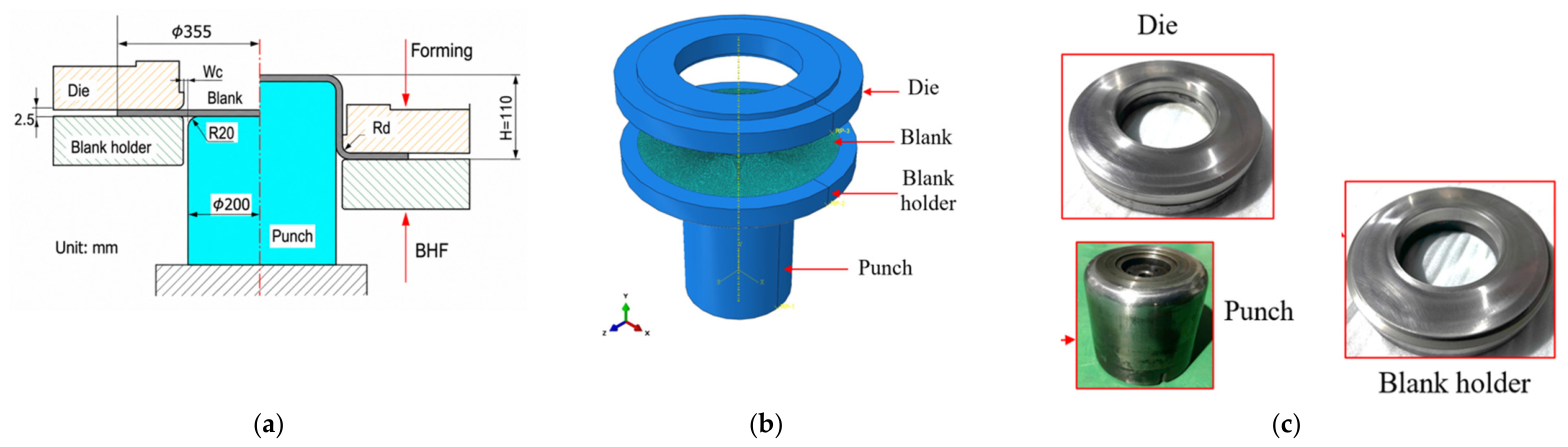
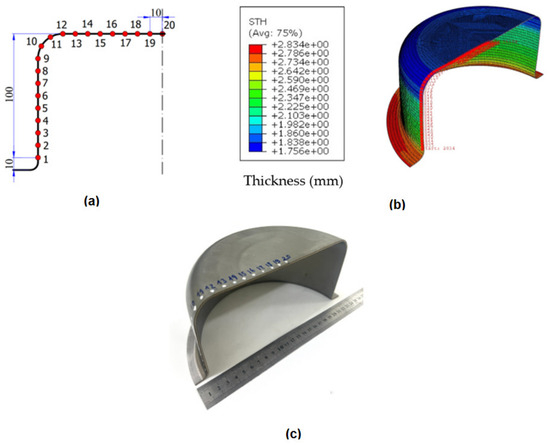
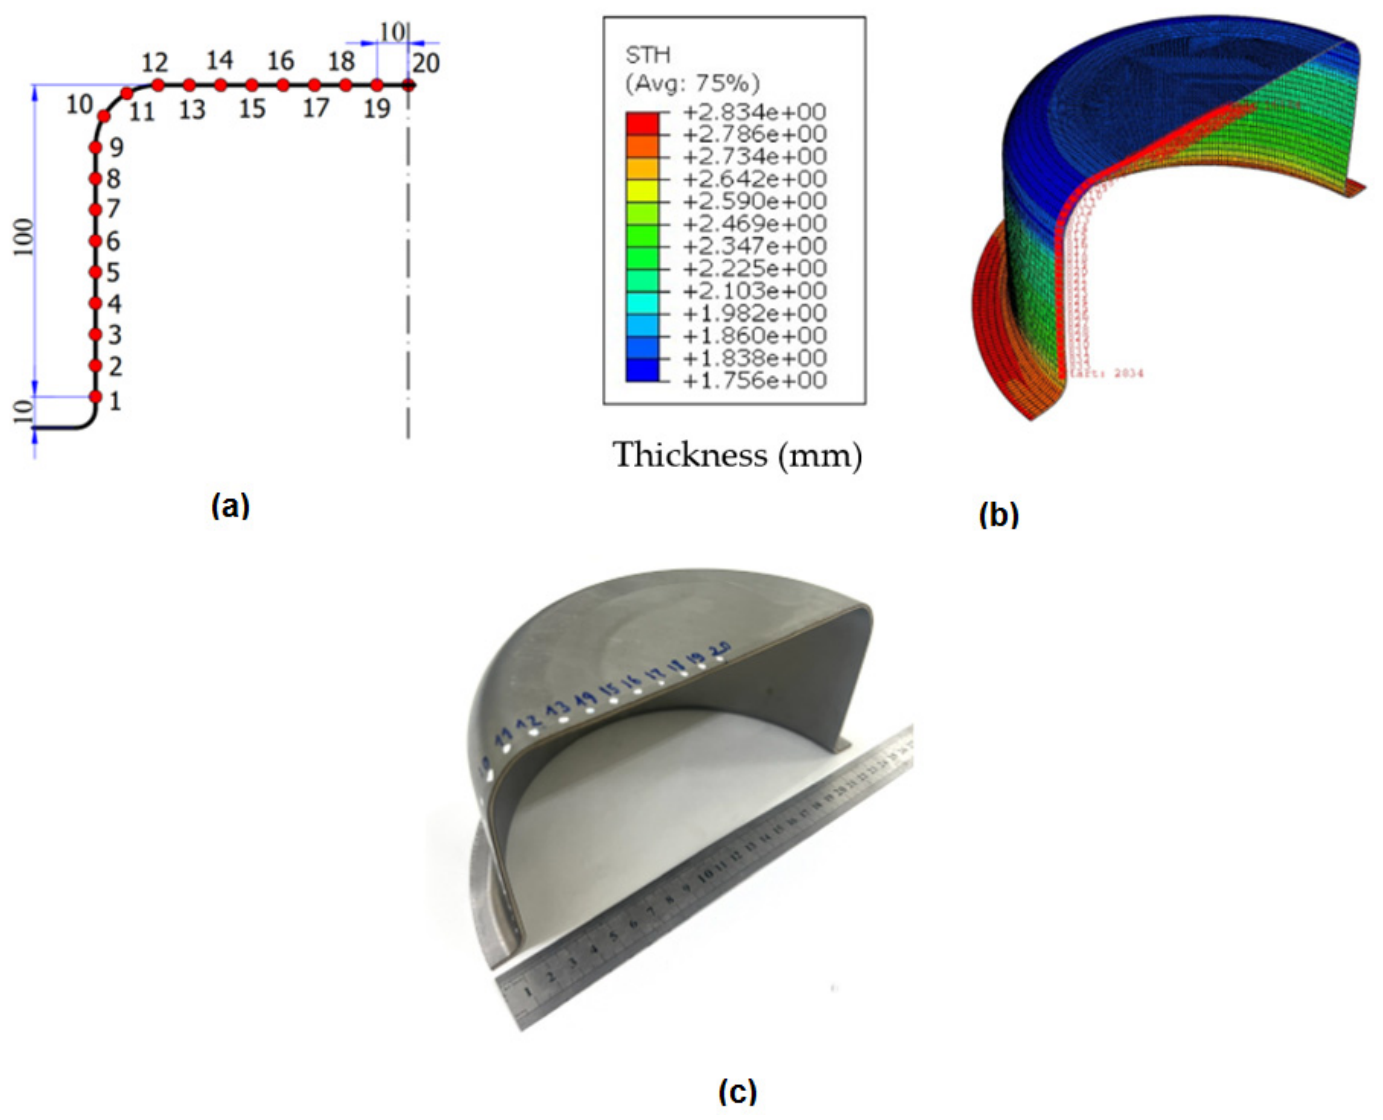
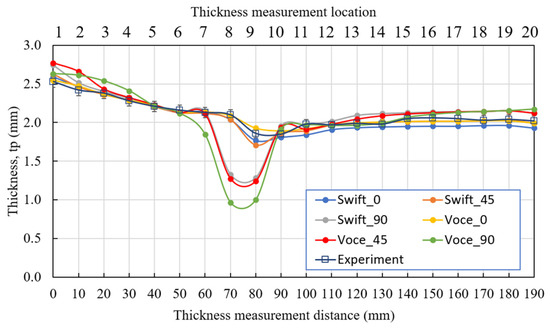
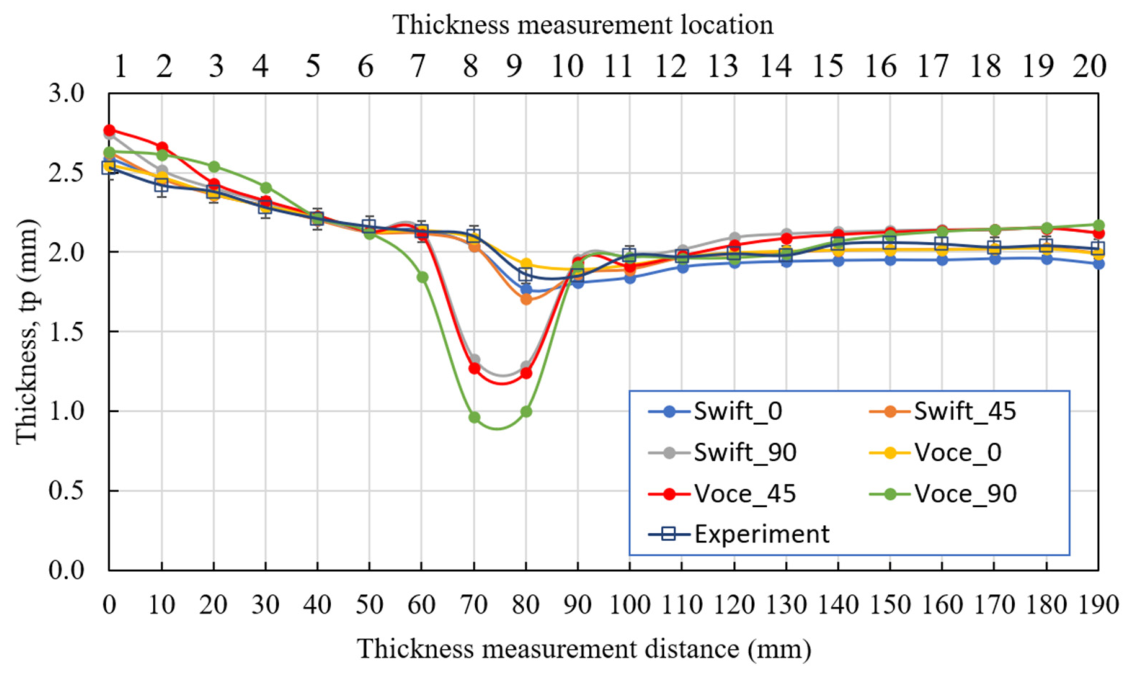
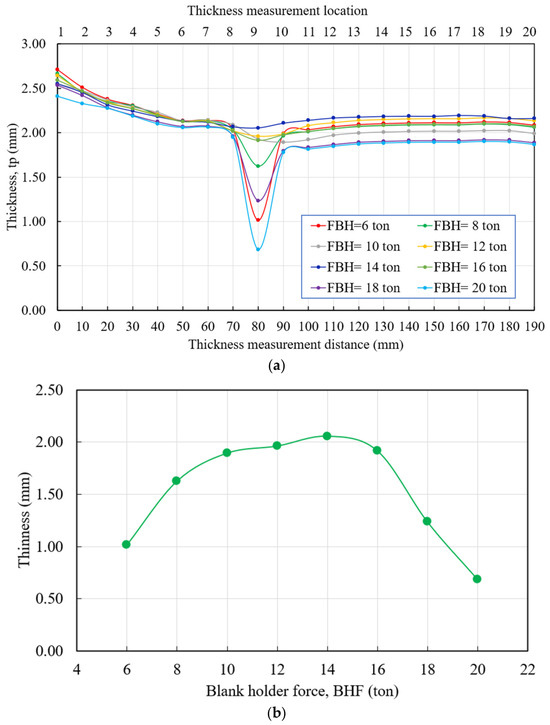
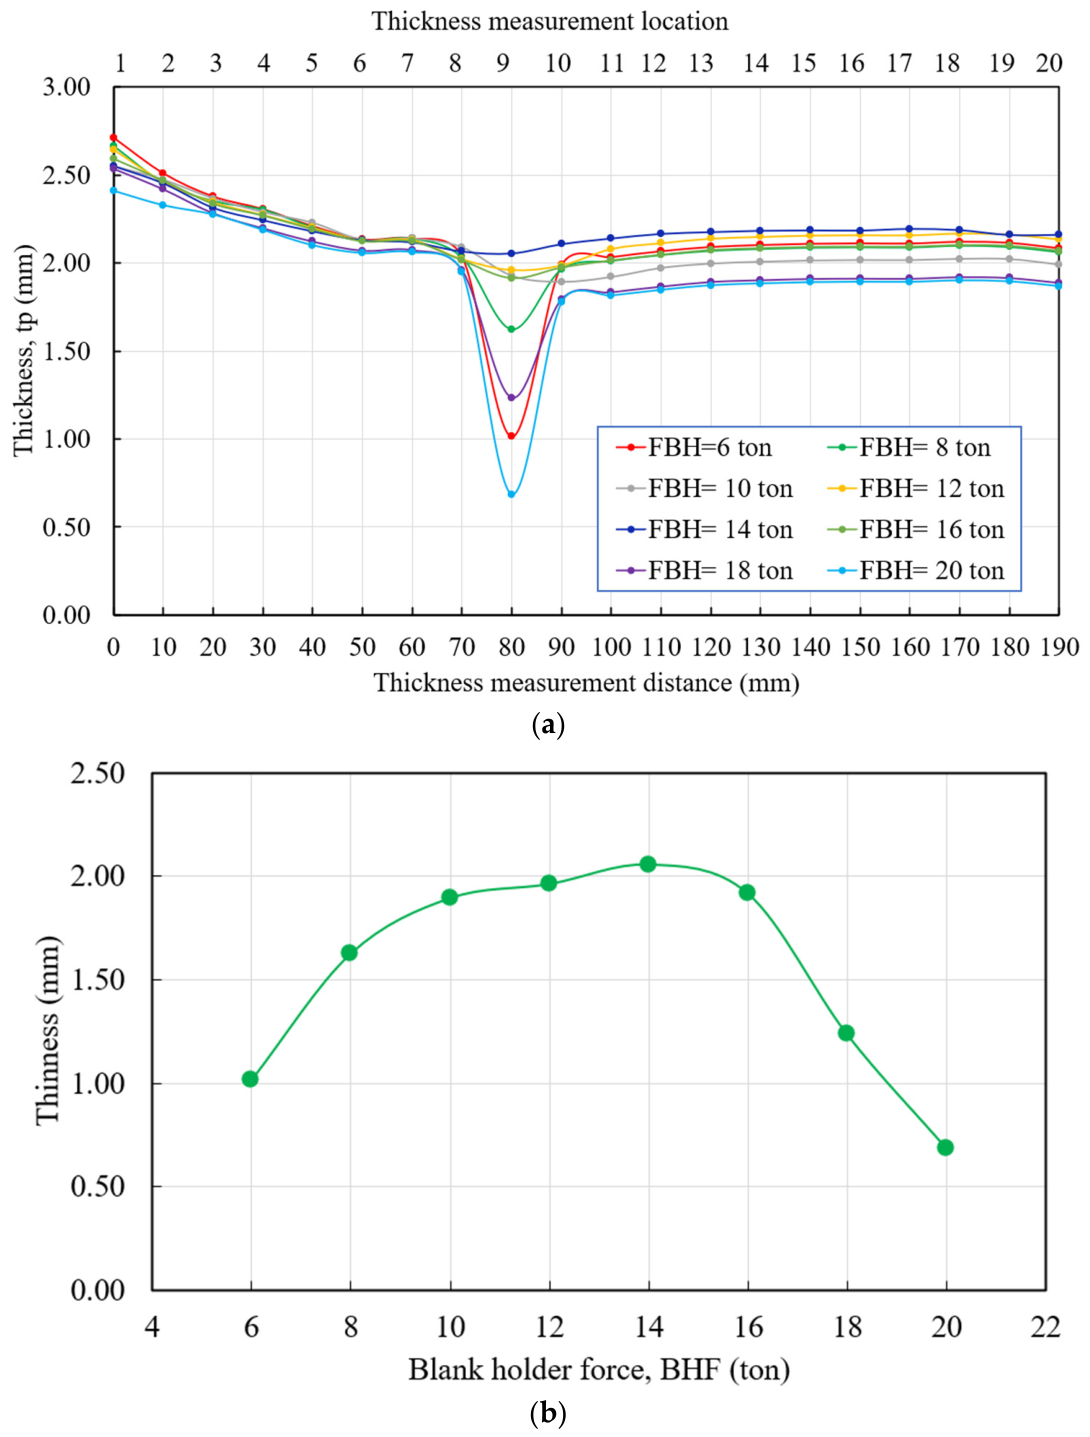
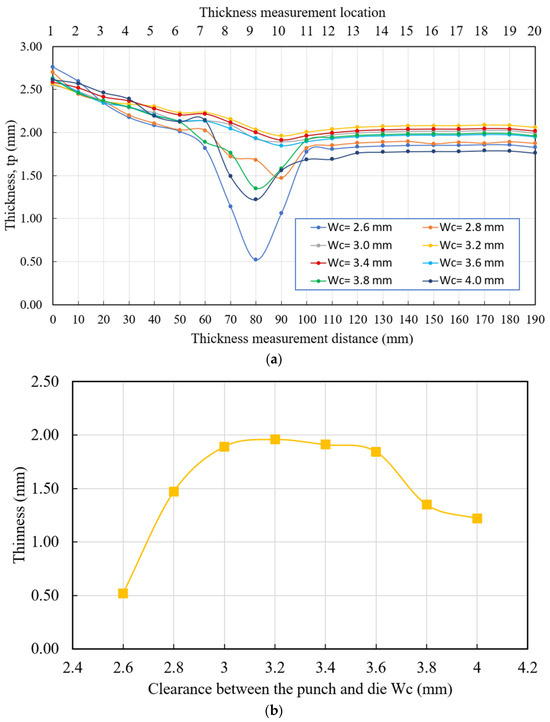
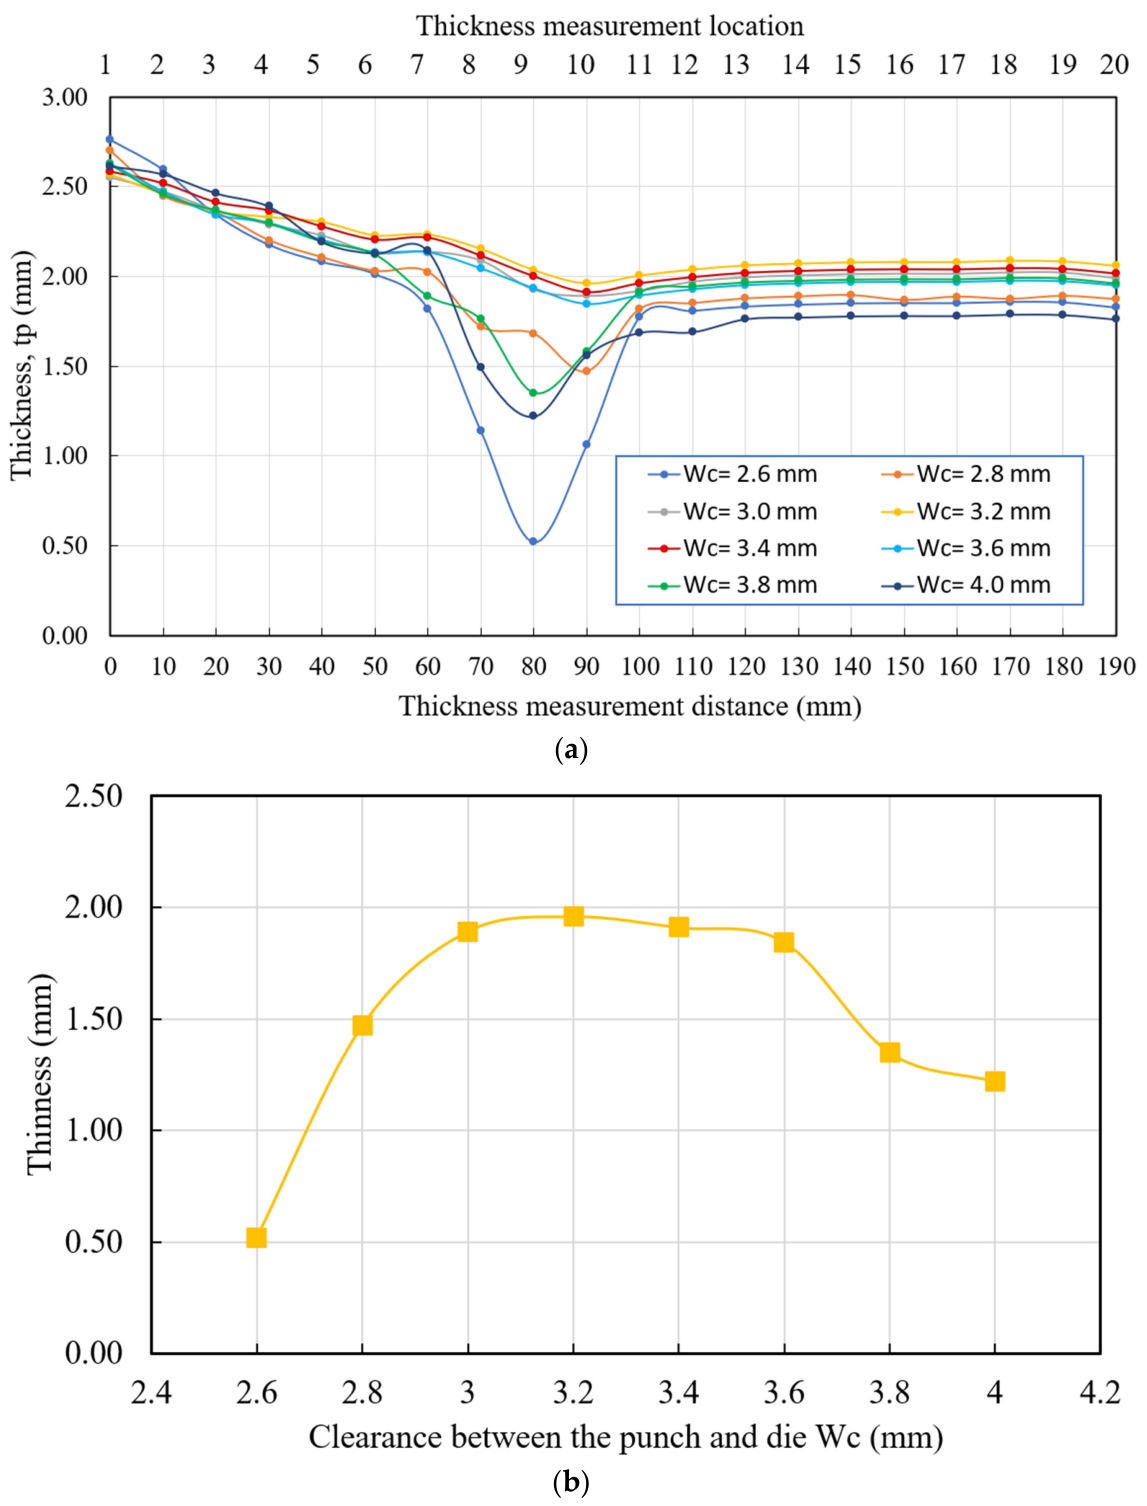
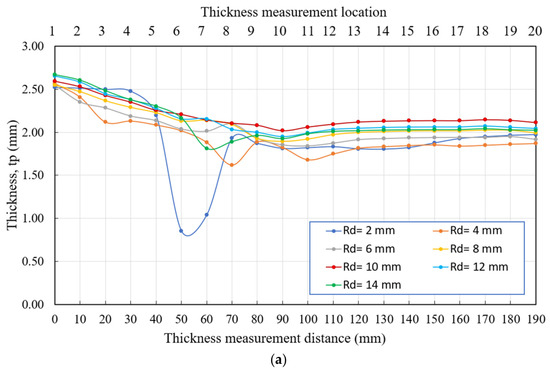
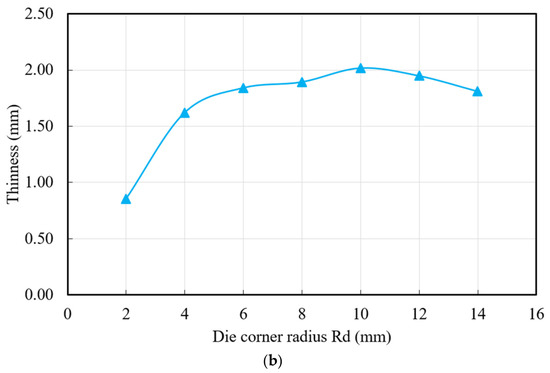
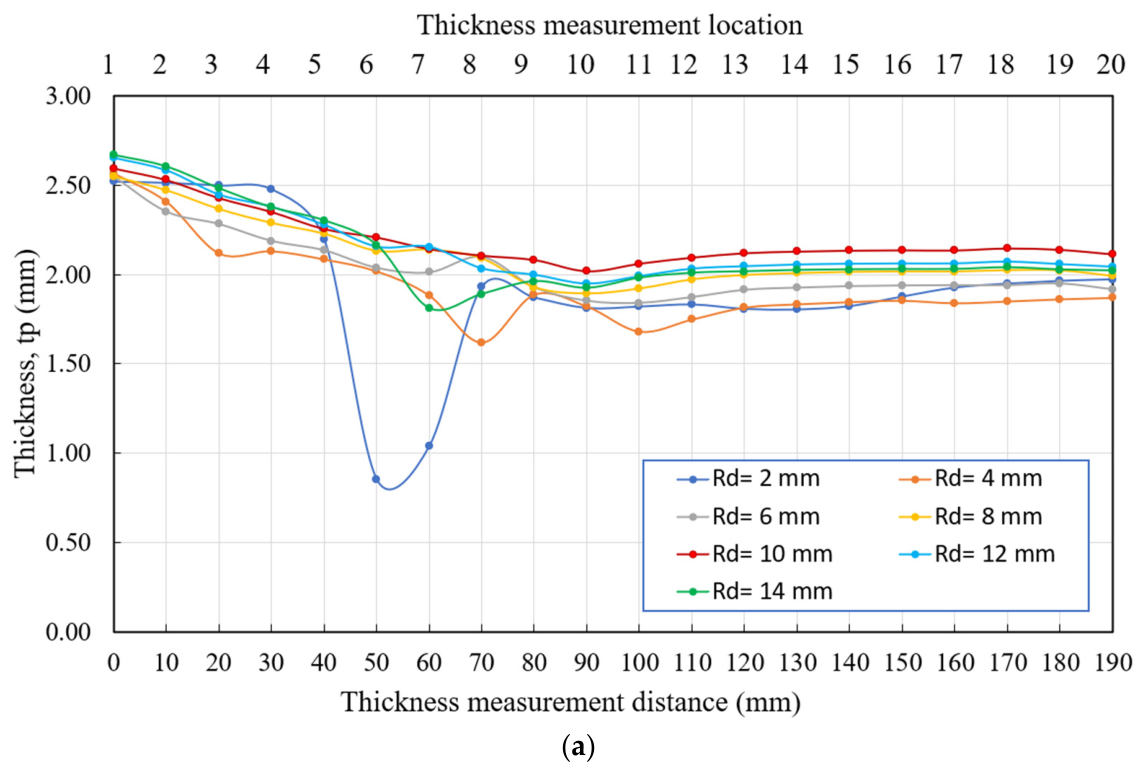
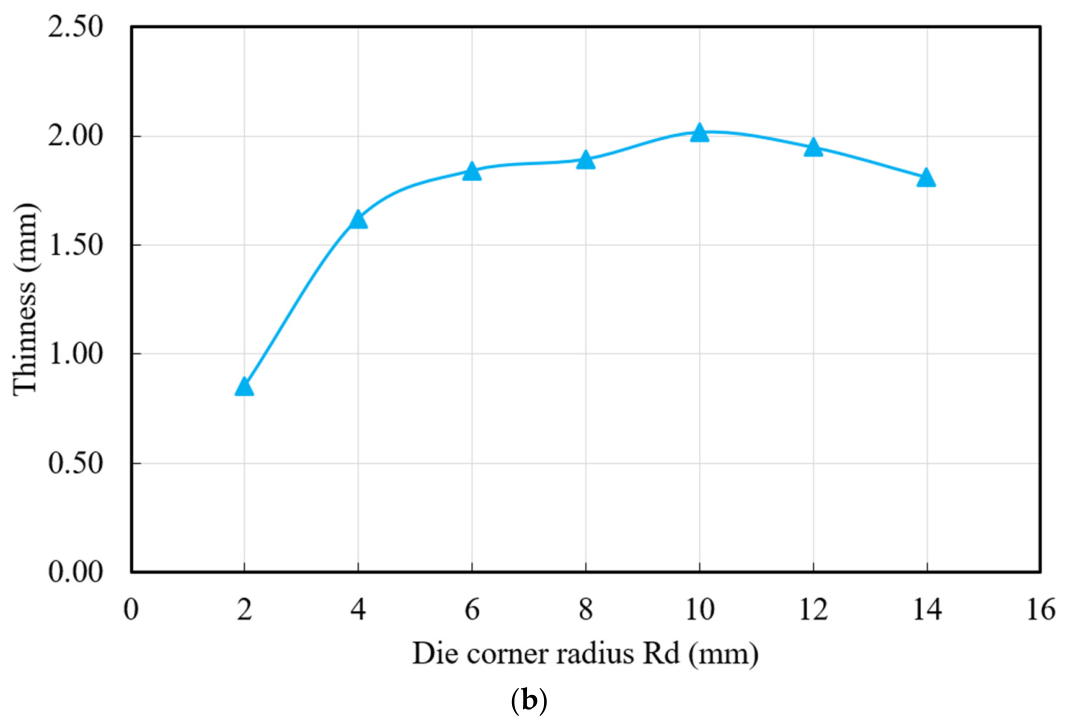
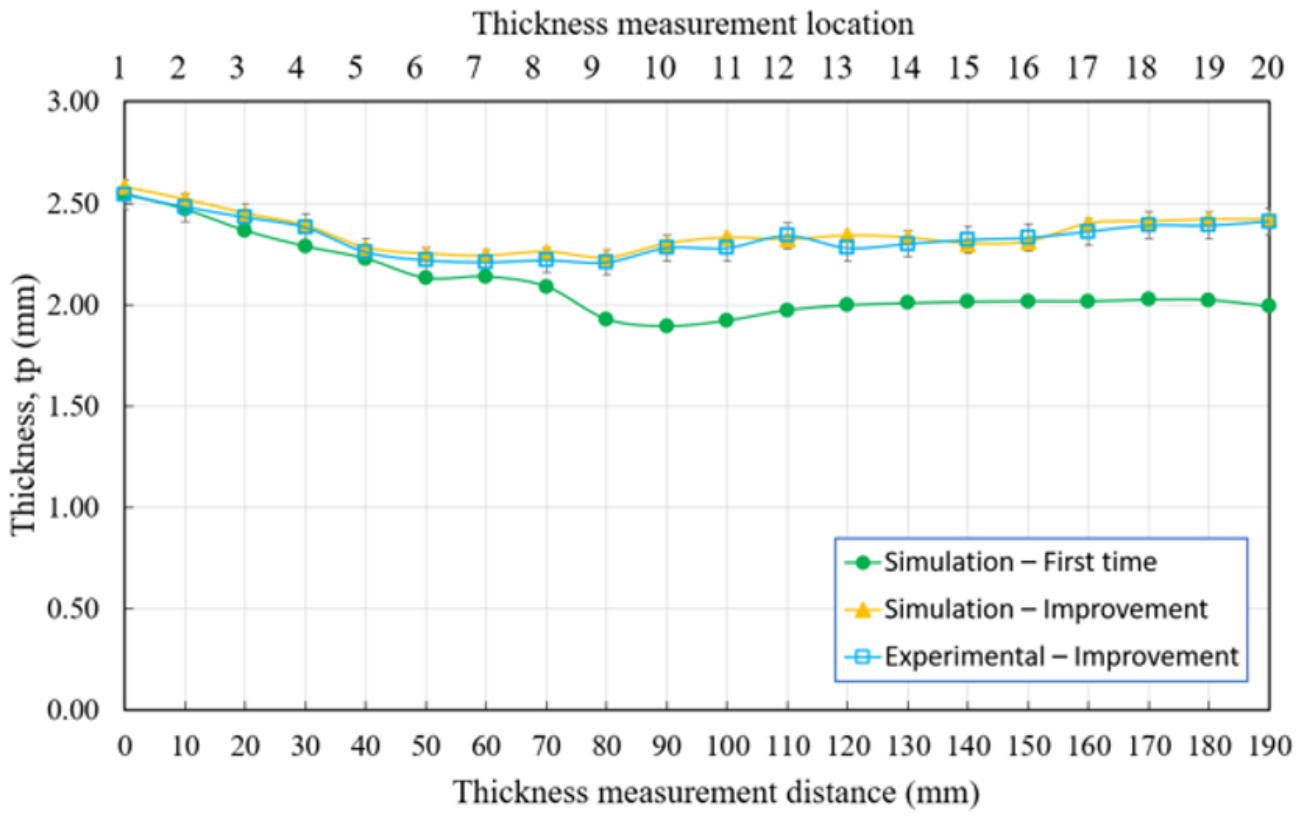

Disclaimer/Publisher’s Note: The statements, opinions and data contained in all publications are solely those of the individual author(s) and contributor(s) and not of MDPI and/or the editor(s). MDPI and/or the editor(s) disclaim responsibility for any injury to people or property resulting from any ideas, methods, instructions or products referred to in the content. |
© 2026 by the authors. Licensee MDPI, Basel, Switzerland. This article is an open access article distributed under the terms and conditions of the Creative Commons Attribution (CC BY) license.