


Abstract
Objectives. This study evaluated the performance of three intraoral scanners with different acquisition technologies in detecting early signs of tooth wear, using micro-computed tomography (micro-CT) as the reference standard. Methods and Materials. Three IOS were examined, including an active triangulation scanner, a structured-light triangulation scanner, and a parallel confocal technology scanner. Ten extracted unrestored and caries-free premolars were placed in the maxillary left second premolar position of a dental mannequin and scanned at baseline, generating quadrant digital models. Micro-CT scans were also obtained at baseline. Wear was simulated by immersion in a 1% citric acid solution followed by brushing of the buccal surfaces. All specimens were rescanned with IOS and micro-CT. Micro-CT datasets were reconstructed into stereolithography models and compared with IOS models using mesh analysis software. Statistical analysis was performed in R using linear mixed-effects models to account for repeated measurements across teeth. RMS values and absolute errors relative to the micro-CT reference were analysed with device as a fixed effect and tooth as a random effect, with Tukey-adjusted pairwise comparisons. Repeatability was additionally assessed from the repeated scans using within-tooth variability. Results. Significant differences were observed among the evaluated systems in the detection of changes related to tooth wear (p < 0.001). The micro-CT reference showed the lowest RMS value, followed by Trios 3, Primescan, and Omnicam. Model-based analyses confirmed significant differences among the evaluated systems, while the magnitude and statistical support of pairwise contrasts depended on the specific outcome considered. Repeatability analysis showed that Trios 3 had the lowest within-tooth standard deviation and repeatability coefficient (0.0215 mm and 0.0595 mm, respectively), followed by Primescan (0.0290 mm and 0.0802 mm), whereas Omnicam showed the highest within-tooth variability and repeatability coefficient (0.0624 mm and 0.173 mm). Conclusions. The parallel confocal and structured-light triangulation intraoral scanners produced RMS values numerically closer to the micro-CT reference than the active triangulation scanner. However, none of the evaluated intraoral scanners demonstrated quantitative agreement sufficient to be considered interchangeable with the reference standard.
1. Introduction
Non-carious tooth wear tends to increase proportionally with patient age and is a high-priority concern in the general population. Non-carious tooth wear is a particular problem that predominantly correlates with patient habits [1]. Diagnostic processes for tooth wear include the detection of hard dental tissue loss. Moreover, tooth wear can be defined as attrition, abrasion, and erosion [2]. Tooth wear primarily affects enamel, but progression can lead to extensive loss of hard dental tissues, compromising function and aesthetics. Recent epidemiologic studies of the permanent dentition have shown that erosive tooth wear affects approximately 88% of permanent teeth [3].
Given these findings, the diagnosis of tooth wear is critical to prevent further complications that contribute to additional tooth structure loss. In most cases, clinicians can identify and treat etiologic factors once wear becomes clinically detectable. However, early assessment at a stage when tooth wear remains visually imperceptible would benefit patients, as preventive measures could halt the underlying processes before damage occurs [2]. For many years, the diagnosis of tooth wear relied on visual dental examinations, supported by indices used to estimate severity [4]. These indices assess tooth tissue loss qualitatively or quantitatively, based on factors such as the affected tissue, the underlying wear mechanism, and the extent of damage [5]. More than 100 index systems have been reported, with the Basic Erosive Wear Examination (BEWE) among the most widely used [6]. A major limitation of erosion indices is their subjective nature, which results in low sensitivity, particularly during initial use [6]. Diagnosing early signs of a complex condition such as tooth wear can be challenging because clinical observation has limited sensitivity for recognizing progressive changes that may not be evident on visual inspection. Moreover, comparison and detection of changes require stable reference areas, which are not always present when the amount of change is clinically relevant. As a result, tooth wear is often not identified until it is advanced and dentin is exposed [3].
The integration of intraoral scanners (IOS) into clinical practice has introduced an additional noninvasive method for early identification of tooth wear. Previous studies have demonstrated the ability of IOS to evaluate tooth wear progression, although limitations related to precision and the identification of adequate reference surfaces have been reported [7]. Notably, these investigations typically used a single IOS system with a specific image acquisition technology, and none incorporated an independent validation method such as micro-CT [8]. Advances in computational power and imaging technology have enabled quantitative assessment of tooth wear on three-dimensional dental models, which has improved the accuracy and efficacy of tooth wear evaluation [9].
The fully digital workflow offers potential benefits for patients and practitioners. The use of intraoral scanners and software enables the creation of digital dental models and subsequent analysis to evaluate surfaces subjected to tooth wear. The resulting three-dimensional models support a more accurate and efficient workflow by reducing errors commonly associated with conventional techniques [10]. Within the restorative process, the accuracy of a completely digital workflow is supported by the literature [11,12]. Complete-arch, half-arch, and localized scans have been investigated using various scanners with different acquisition technologies [13]. Research has shown that IOS accuracy differs by approximately 0.100 mm (100 μm) or less compared with analog methods [14]. However, IOS accuracy depends on the technology used and the physical properties of the scanned substrate. The accuracy of active triangulation systems is lower than that of parallel confocal scanners. Consequently, newer scanners show superior performance compared with older devices that use active triangulation technology [14].
In clinical cases of tooth wear, 3D models obtained from intraoral scans at different patient visits are compared to detect small changes within restricted areas of interest. This approach requires three-dimensional analysis with specialized software. For complete-arch scans, standard practice typically involves linear measurements between anatomic landmarks or teeth. However, for half-arch scans or limited areas of interest, an initial alignment of the models is performed, followed by a full 3D comparison [15]. The assessment of tooth wear using IOS is often evaluated relative to measurements obtained from other laboratory instruments. Some studies have compared differences detected in 3D IOS-derived models with measurements made directly on specimens using optical coherence tomography or profilometry, resulting in findings that are difficult to interpret [7]. This mixed three-dimensional and analog methodology complicates comparison across studies. A fully digital, three-dimensional comparison of scan models obtained at different time points, directly evaluated against accurate three-dimensional representations of teeth for wear assessment, has not been systematically investigated.
Therefore, this in vitro study aimed to evaluate the performance of different intraoral scanners in assessing tooth wear, using three-dimensional models generated from micro-CT scans as the reference standard. The null hypotheses were as follows: (Ho1) no difference in wear detection among the intraoral scanners, and (Ho2) no difference between the intraoral scanners and the micro-CT reference in wear detection.
2. Materials and Methods
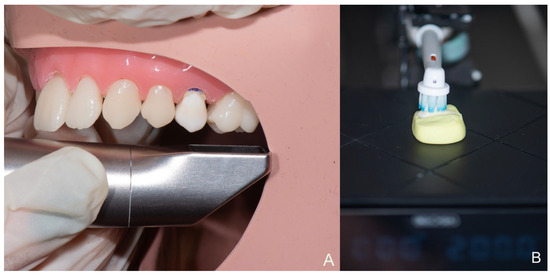
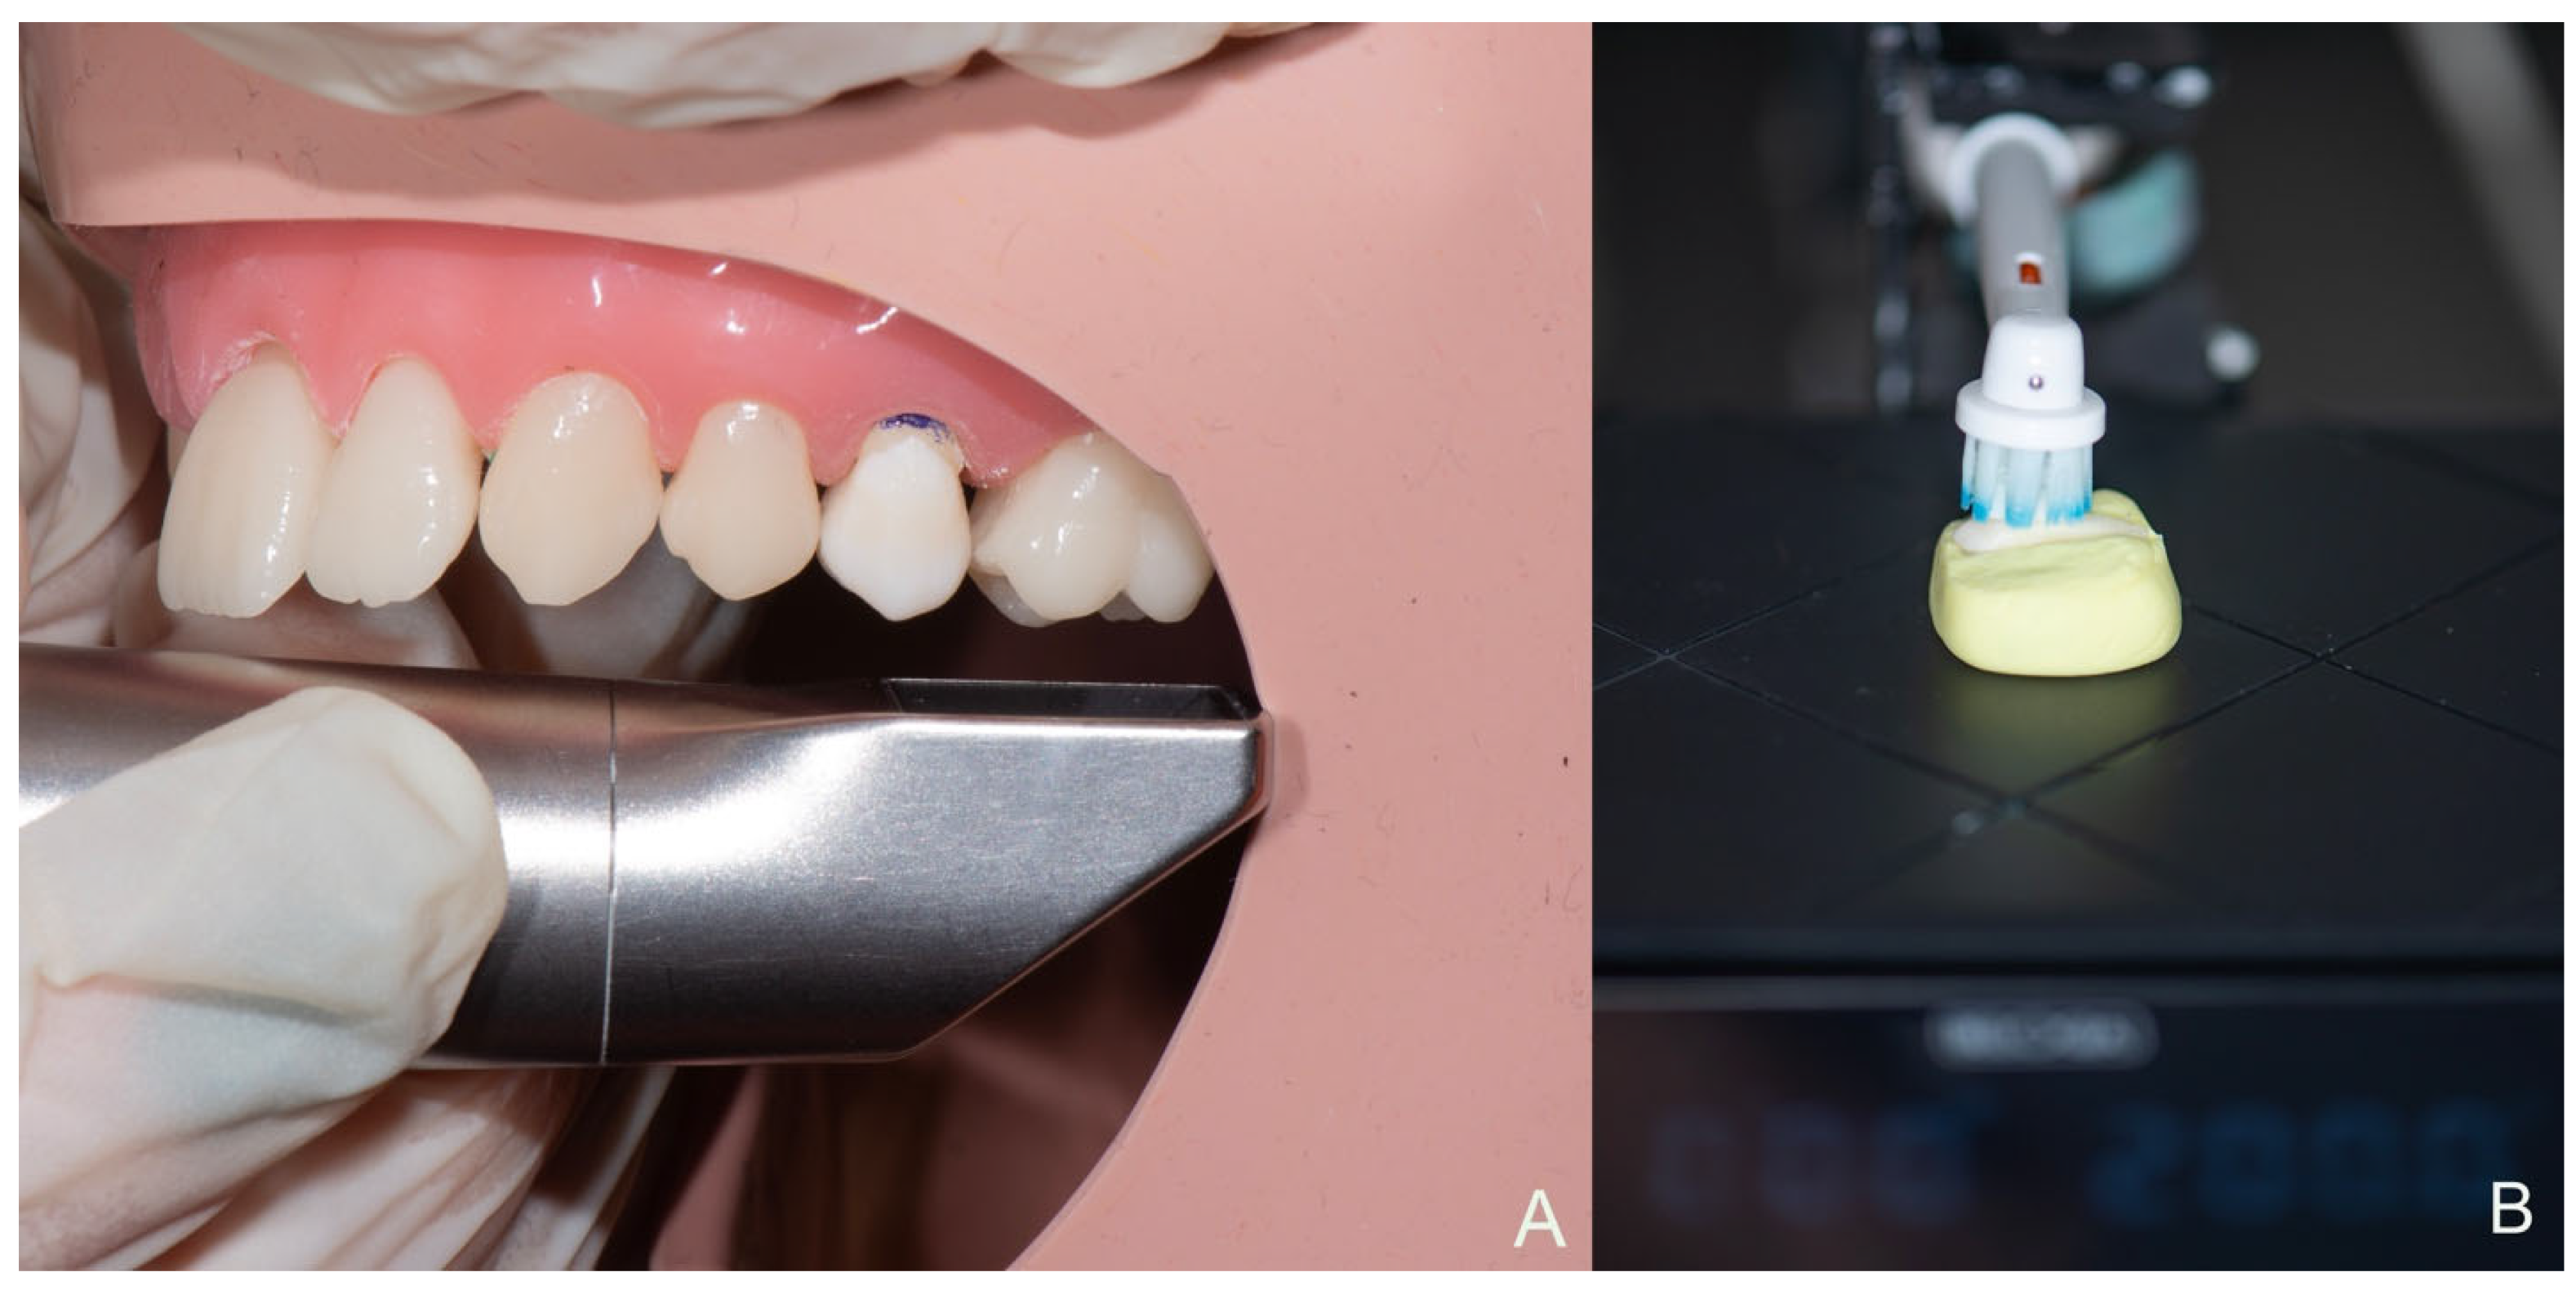
The study was approved by the Ethics and Deontology Committee of the Department of Dentistry, School of Health Sciences, Aristotle University of Thessaloniki (Protocol No. 258/14-10-2024). All procedures were conducted in accordance with the relevant guidelines and regulations. Ten human premolars (n = 10), extracted for orthodontic reasons, were used. The teeth were ultrasonically cleaned and visually examined for caries, restorations, cracks, or structural defects before use. An articulated plastic mannequin (P-OCLUSAL Produtos Odontológicos Ltd.a, São Paulo, Brazil) was modified to include an empty socket at the position of the maxillary left second premolar, which served as the scan model. Each selected tooth was fitted into this socket, and the cervical margins were marked. These marks served as standardized landmarks to enable reproducible positioning of the teeth during the experimental procedures (Figure 1). The acquisition technologies and scanning principles of the intraoral scanners and the micro-CT reference system are summarized in Table 1. The scanning procedure began at the maxillary left second molar and progressed anteriorly. Occlusal surfaces were scanned first, followed by the buccal and lingual surfaces, extending to the maxillary left central incisor and including the gingival area of the model. The same scanning protocol was applied for all scanners. This method followed the manufacturers’ guidelines, as adherence to a standardized scan path has been shown to affect scan accuracy [15,16]. Initial calibration was performed before image acquisition and repeated every six scans, in accordance with the manufacturers’ instructions. All scans were saved as baseline datasets. Each premolar was then removed from the mannequin and mounted on a custom silicone base extending to the cervical reference mark. For the micro-CT procedure, individual silicone bases were fabricated for each tooth and extended similarly to the cervical mark. The silicone bases with mounted premolars were placed in the micro-CT holder and secured to the tomography tube with adhesive tape. Each premolar was scanned with a micro-CT system (Bruker SkyScan Micro CT, Bruker Corp., Kontich, Belgium). Scans were performed at a source voltage of 100 kV, with a rotation step of 0.4 degrees, a 1 mm aluminum filter, and a voxel size of 36.9 μm, using a step-and-shoot acquisition mode. Flat-field correction was applied before each scan. Image reconstruction was performed with proprietary software (NRecon 1.7.4.6, Bruker microCT, N.V., Kontich, Belgium) under standard reconstruction parameters. To simulate the cumulative effects of erosive and abrasive tooth wear, all teeth were immersed in a 1% citric acid solution (pH 2.7), according to the protocol described by Michou et al. [7]. After 24 h, the teeth were removed, rinsed with deionized water, and air-dried with oil-free compressed air. Following erosion, abrasion was simulated by brushing with an electric toothbrush (Triumph Professional Care, Oral-B, Braun GmbH, Kronberg, Germany) modified for continuous operation under a standardized load of 200 g [17]. Only the buccal surface of each premolar was exposed to brushing, while the remaining surfaces were covered with silicone putty. The toothbrush body was aligned parallel to the buccal surface and secured in a custom holder. A precision scale was integrated into the holder to ensure a constant brushing load of 200 g on the toothbrush head. The brushing time required to simulate one year of toothbrushing was calculated on the basis of 2 min of brushing twice daily, corresponding to approximately 31,680 brushing cycles per year [17]. When applied to a single surface, the required brushing duration was approximately 18 min. A low-abrasivity toothpaste (Colgate Total, RDA 70) was used as the abrasive medium [18]. After brushing, the teeth were rinsed with water and dried with oil-free compressed air. The teeth were then repositioned in the articulated mannequin, and a second quadrant scan was obtained with each intraoral scanner. A second micro-CT scan was subsequently performed using the same acquisition methodology. The reconstructed micro-CT datasets from both time points were processed with Slicer 5.8.1 software to generate three-dimensional models of the scanned teeth in stereolithography (.STL) format. Segmentation was performed manually by a single operator to isolate each tooth from the surrounding silicone base, and the segmented regions were exported as standardized .STL files for comparison. All three-dimensional models generated in the study were analyzed using mesh inspection software (Geomagic Control X, Hexagon AB; version 2025.0.0, Hexagon AB, Stockholm, Sweden). For the quantitative wear analysis, baseline and post-wear models were compared within each acquisition workflow. IOS-derived RMS values were obtained by comparing the baseline and post-wear quadrant models generated by each intraoral scanner, whereas micro-CT-derived RMS values were obtained by comparing the corresponding baseline and post-wear micro-CT tooth models. Because of the anatomical curvature of the tooth surface and the irregularity of wear, changes were not measured linearly but were analyzed using three-dimensional superimposition. The baseline and post-wear models were registered in the mesh inspection software using a reference best-fit alignment approach. For IOS-derived quadrant scans, adjacent teeth and unchanged surfaces were used as reference structures for registration. In an attempt to minimize bias in the altered area, the buccal surface subjected to wear simulation was excluded before alignment, and deviation analysis was then performed after registration. For the micro-CT workflow, tooth repositioning was standardized according to the cervical marks and individualized silicone bases. The changes in tooth surface were expressed as the root mean square (RMS) of point-to-point deviations within the analysis area. The surface deviation was quantified by the RMS value of the point-to-point distances between the superimposed baseline and post-wear meshes within the predefined buccal region of interest. The RMS value does not describe the maximum surface loss at a single location but rather provides a global summary of the magnitude of surface deviation across all points within the selected region. Because the wear simulation was performed only on the buccal surface, the deviation analysis was restricted to the buccal region of interest. This anatomical region was used for all baseline and follow-up comparisons after spatial registration, using anatomical boundaries and cervical landmarks to standardize the region of interest. The color maps provided a qualitative representation of the distribution of deviations, whereas the numerical RMS values were retrieved from the reporting module of the software and recorded as numeric values for statistical analysis [19,20]. A separate cross-modality alignment was performed only to generate the qualitative color deviation maps comparing post-wear IOS models with the corresponding post-wear micro-CT-derived models shown in Figure 5. For this visualization, each IOS post-wear quadrant model was aligned with the corresponding micro-CT-derived post-wear model using best-fit alignment on the entire available model geometry. This approach was selected because only the experimental premolar was subjected to wear simulation, whereas the remaining adjacent teeth and mannequin model structures were unchanged and provided stable reference geometry for qualitative spatial correspondence. These cross-modality color maps were intended solely for visual illustration and were not used to calculate the numerical RMS values, scanner-to-reference discrepancy metrics, or statistical model outcomes reported in the study. For agreement analysis with the reference method, the RMS value obtained from each intraoral scanner for a given specimen and repeated scan was compared with the corresponding RMS value obtained from the micro-CT model of the same specimen. Absolute error was defined as |RMS(IOS) − RMS(micro-CT)|. The root mean square error (RMSE) was calculated as the square root of the mean squared difference between the RMS values obtained from each intraoral scanner and the corresponding RMS values obtained from the micro-CT reference. Lin’s concordance correlation coefficient (CCC) was used as a supplementary descriptive measure of agreement between the intraoral scanners and the micro-CT reference, taking into account both precision and deviation from perfect concordance. Statistical processing was performed in R Studio (version 2024.12). Descriptive statistics were expressed as mean ± standard deviation (SD), and the level of statistical significance was set at α = 0.05. Signed scanner-to-reference discrepancy was summarized using the median paired difference between each IOS-derived RMS value and the corresponding micro-CT RMS value, with 95% empirical intervals calculated from the 2.5th and 97.5th percentiles of the observed paired differences. These intervals were used as descriptive empirical intervals rather than formal confidence intervals. This signed difference metric was interpreted separately from the mean absolute error (MAE) and root mean square error (RMSE), which quantify the magnitude of scanner-to-reference disagreement irrespective of direction. Model-based comparisons were reported with estimated marginal means, standard errors, confidence intervals, test statistics, and p-values. Because each tooth was evaluated repeatedly across all scanning systems, RMS data were analyzed using a linear mixed-effects model fitted with the lme function of the nlme package in R. Device was included as a fixed effect, and tooth was included as a random intercept to account for repeated observations within each specimen. The three repeated scans per tooth and per scanner were retained as separate observations and were not aggregated before model fitting. Restricted maximum likelihood estimation was used. Heteroscedasticity across devices was accommodated using a variance identity structure, varIdent (form = ~1|device), because descriptive variability differed substantially among the evaluated systems. F-tests for fixed effects and denominator degrees of freedom were obtained using the default anova.lme procedure in nlme, with containment used as the degrees-of-freedom method. Pairwise comparisons were obtained from estimated marginal means with Tukey adjustment for multiple testing. Because the lmerTest framework does not reproduce the same device-specific residual variance structure, the heteroscedastic nlme model was retained as the primary RMS analysis. To assess the robustness of the overall device effect to the reviewer-recommended degrees-of-freedom approach, a supplementary linear mixed-effects model was fitted using the lmer function of the lmerTest package, with device as a fixed effect, tooth as a random intercept, and Satterthwaite approximation for denominator degrees of freedom. Absolute error relative to the micro-CT reference was defined as . Because this outcome is strictly non-negative and diagnostic inspection of an initially fitted Gaussian mixed-effects model indicated departure from approximate normality, absolute error was analyzed using a generalized linear mixed-effects model with a Gamma distribution and log link, fitted with the glmmTMB package, version 1.1.14 (Comprehensive R archive Network). Device was included as a fixed effect, and tooth was included as a random intercept. Because absolute error was calculated relative to the micro-CT reference, this model included only the three intraoral scanners. The three repeated scans per tooth and per scanner were retained as separate observations. Device-specific dispersion was modelled using dispformula = ~device. The overall effect of device was evaluated by likelihood-ratio comparison of the full model against a reduced model without the device term. Model-estimated mean absolute errors were obtained on the response scale, and Tukey-adjusted pairwise comparisons were performed using estimated marginal means. Model adequacy was assessed using simulation-based residual diagnostics implemented in the DHARMa package, version 0.4.7, (Comprehensive R archive Network). Bland–Altman plots were generated as a supplementary agreement analysis to visualize the relationship between each intraoral scanner and the micro-CT reference. For each scanner, the difference between the IOS-derived RMS value and the corresponding micro-CT RMS value was plotted against their mean. Because visual inspection suggested that the magnitude of the difference increased with the mean RMS value, proportional bias was assessed formally by fitting a linear regression model for each scanner, with the IOS–micro-CT difference as the dependent variable and the paired mean RMS value as the predictor. The slope, p-value, and coefficient of determination were used to characterize the magnitude-dependent disagreement pattern. Because each tooth was scanned three times with each system, precision was evaluated descriptively by quantifying within-tooth, within-scanner variability across repeated scans. For each scanner, the within-tooth standard deviation of RMS values was calculated, and repeatability coefficients were derived as 2.77 times the within-tooth standard deviation. These repeatability estimates were interpreted as descriptive measures of within-tooth scan variability under the present experimental conditions. Plots were generated using ggplot2, version 4.0.3 (Comprehensive R archive Network).
Figure 1.
(A) Scanning the premolar in situ with the intraoral scanner. (B) Abrasion simulation apparatus demonstrating the mounted tooth specimen under a controlled brushing load of 200 gr.
Table 1.
Acquisition technologies and scanning principles of the intraoral scanners and the micro-computed tomography reference system used in this study.
3. Results
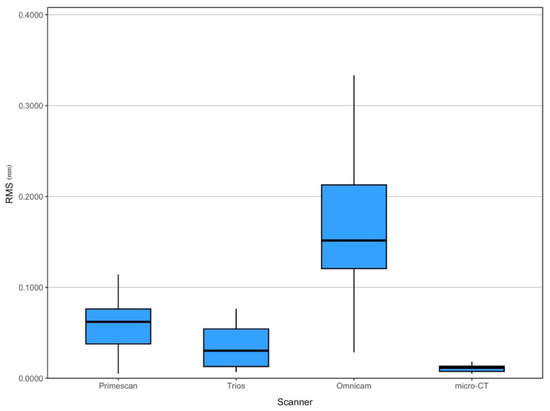
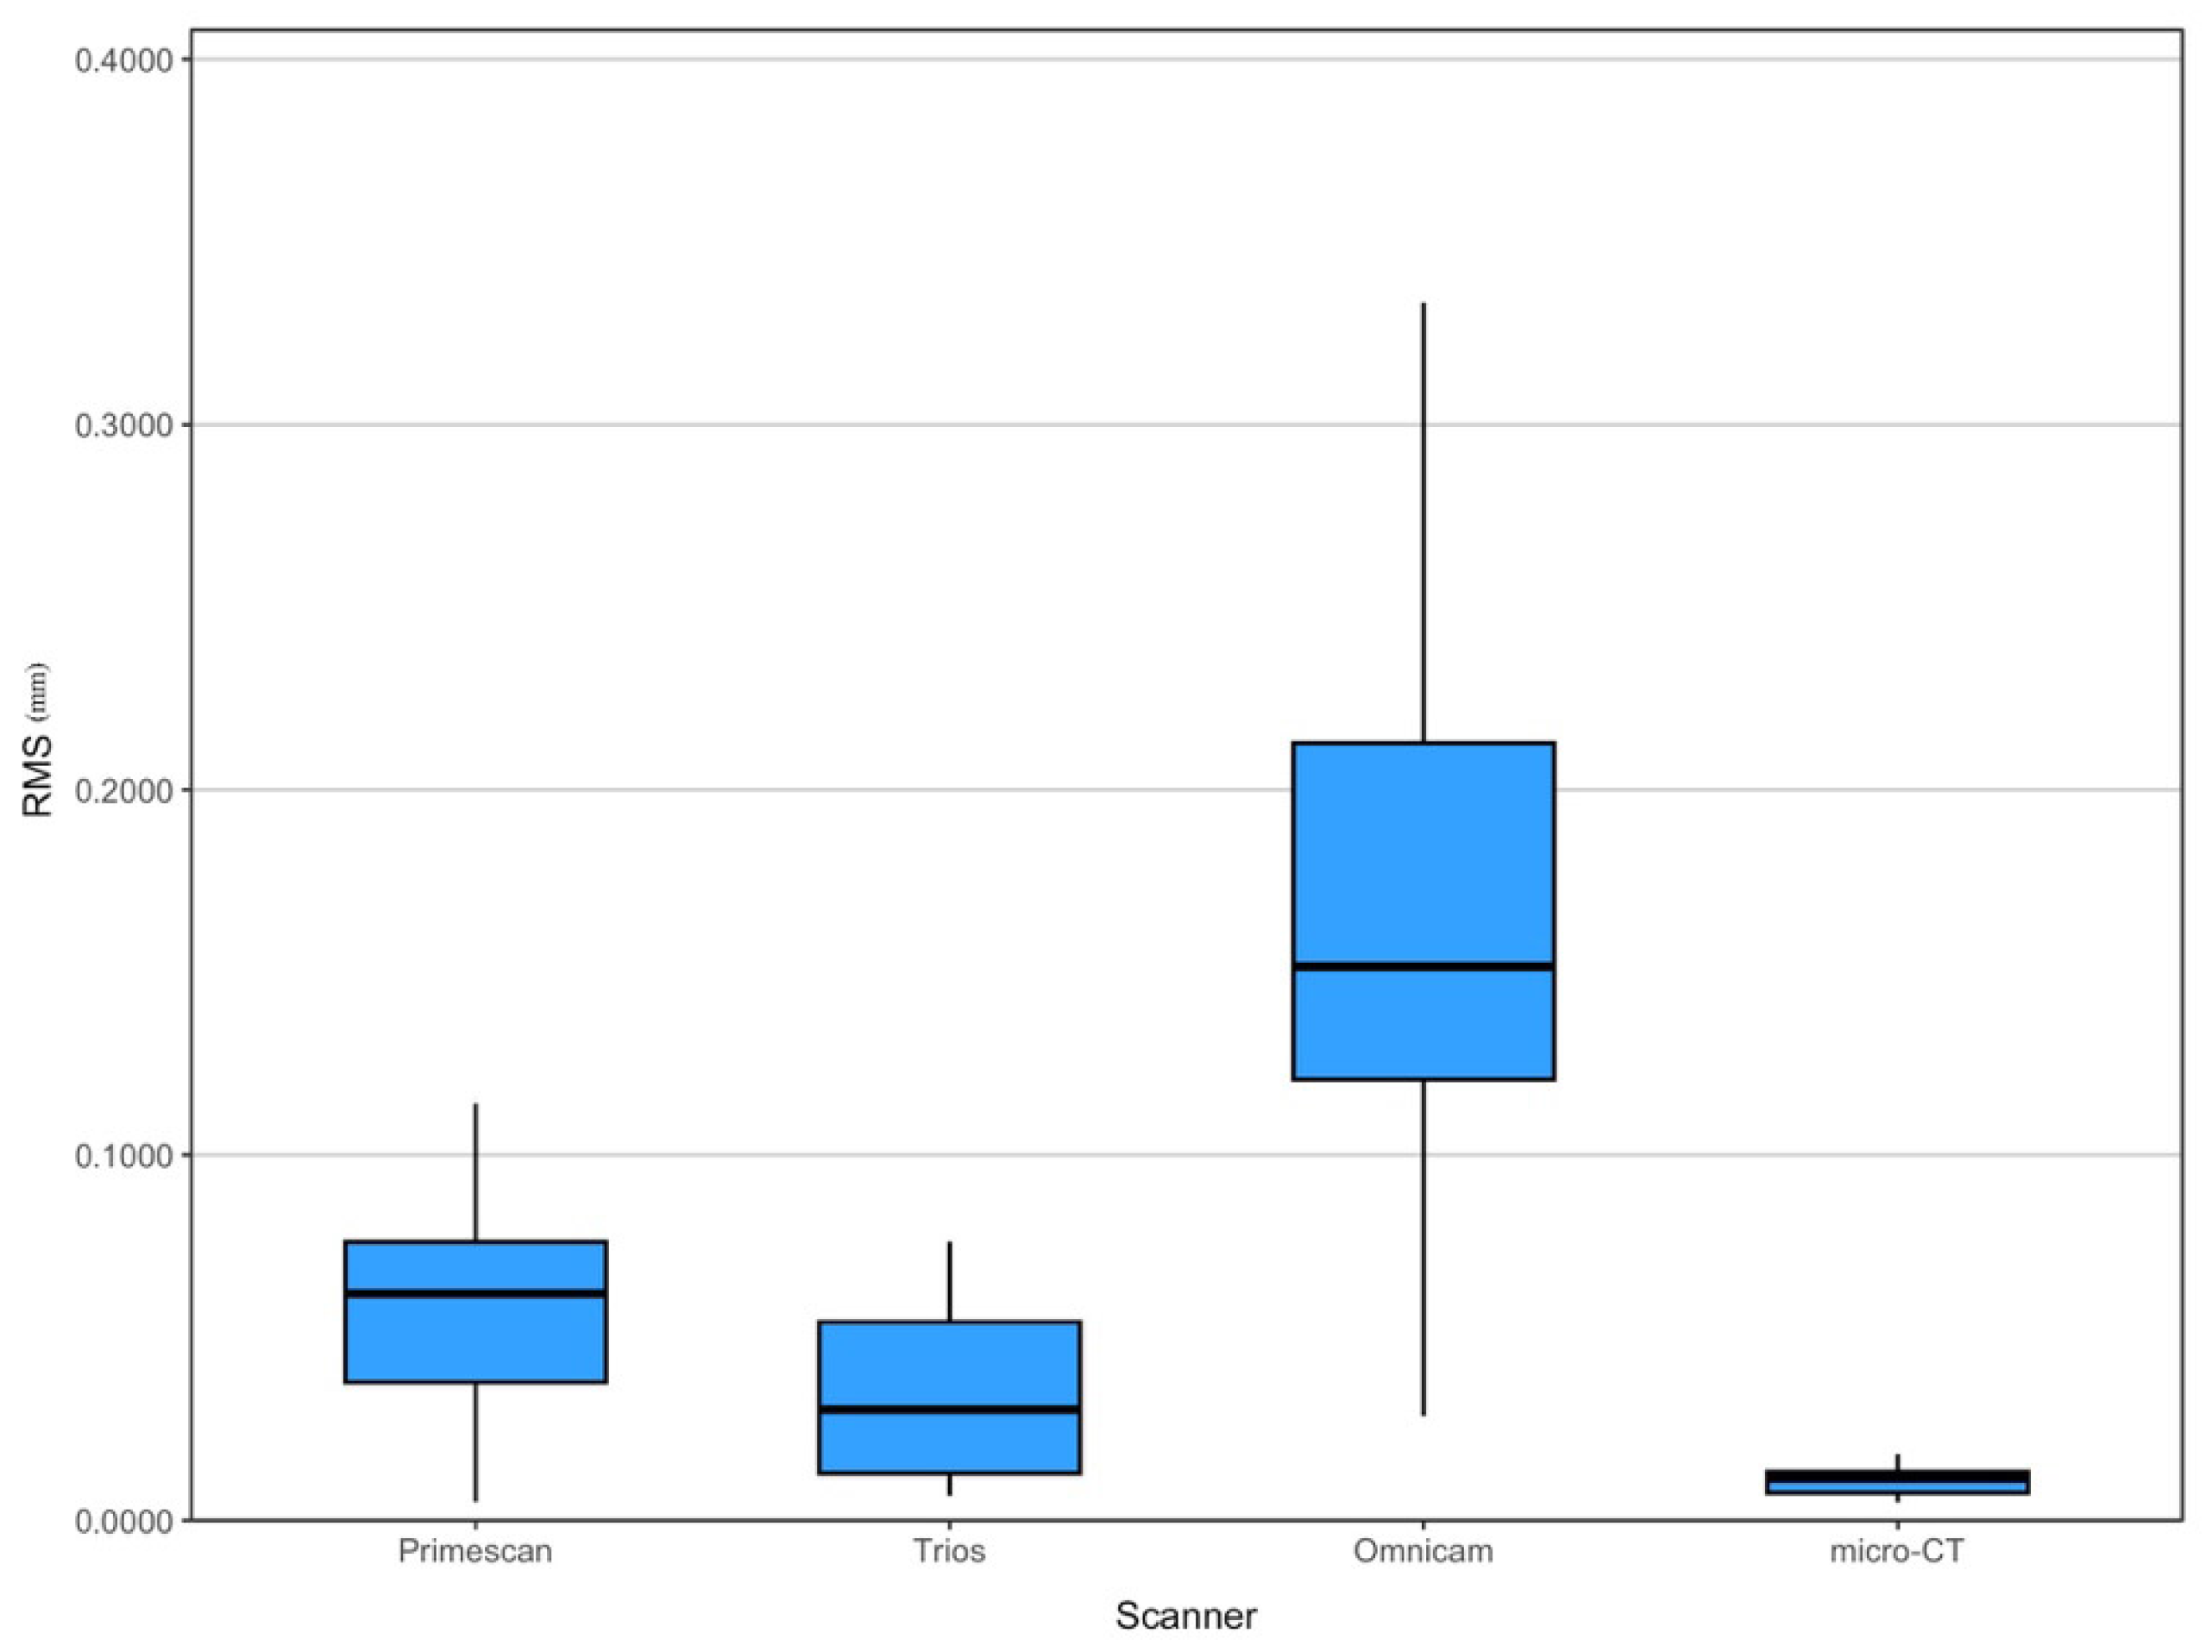
All intraoral scanners produced higher RMS values than the micro-CT reference. The mean RMS ± SD values were lowest for the micro-CT reference (0.0109 ± 0.0035 mm), followed by Trios 3 (0.0350 ± 0.0232 mm), Primescan (0.0590 ± 0.0302 mm), and Omnicam (0.1709 ± 0.0794 mm). Results are presented in Table 2 and Figure 2.
Table 2.
Descriptive statistics of RMS values for the evaluated systems and agreement metrics of the intraoral scanners relative to the micro-CT reference.
Figure 2.
Box plots illustrating the distribution of the RMS values for each intraoral scanner and the micro-CT reference scans. Trios and Primescan demonstrated lower RMS variation compared to Omnicam, while the micro-CT group exhibited the lowest RMS values, reflecting the reference standard.
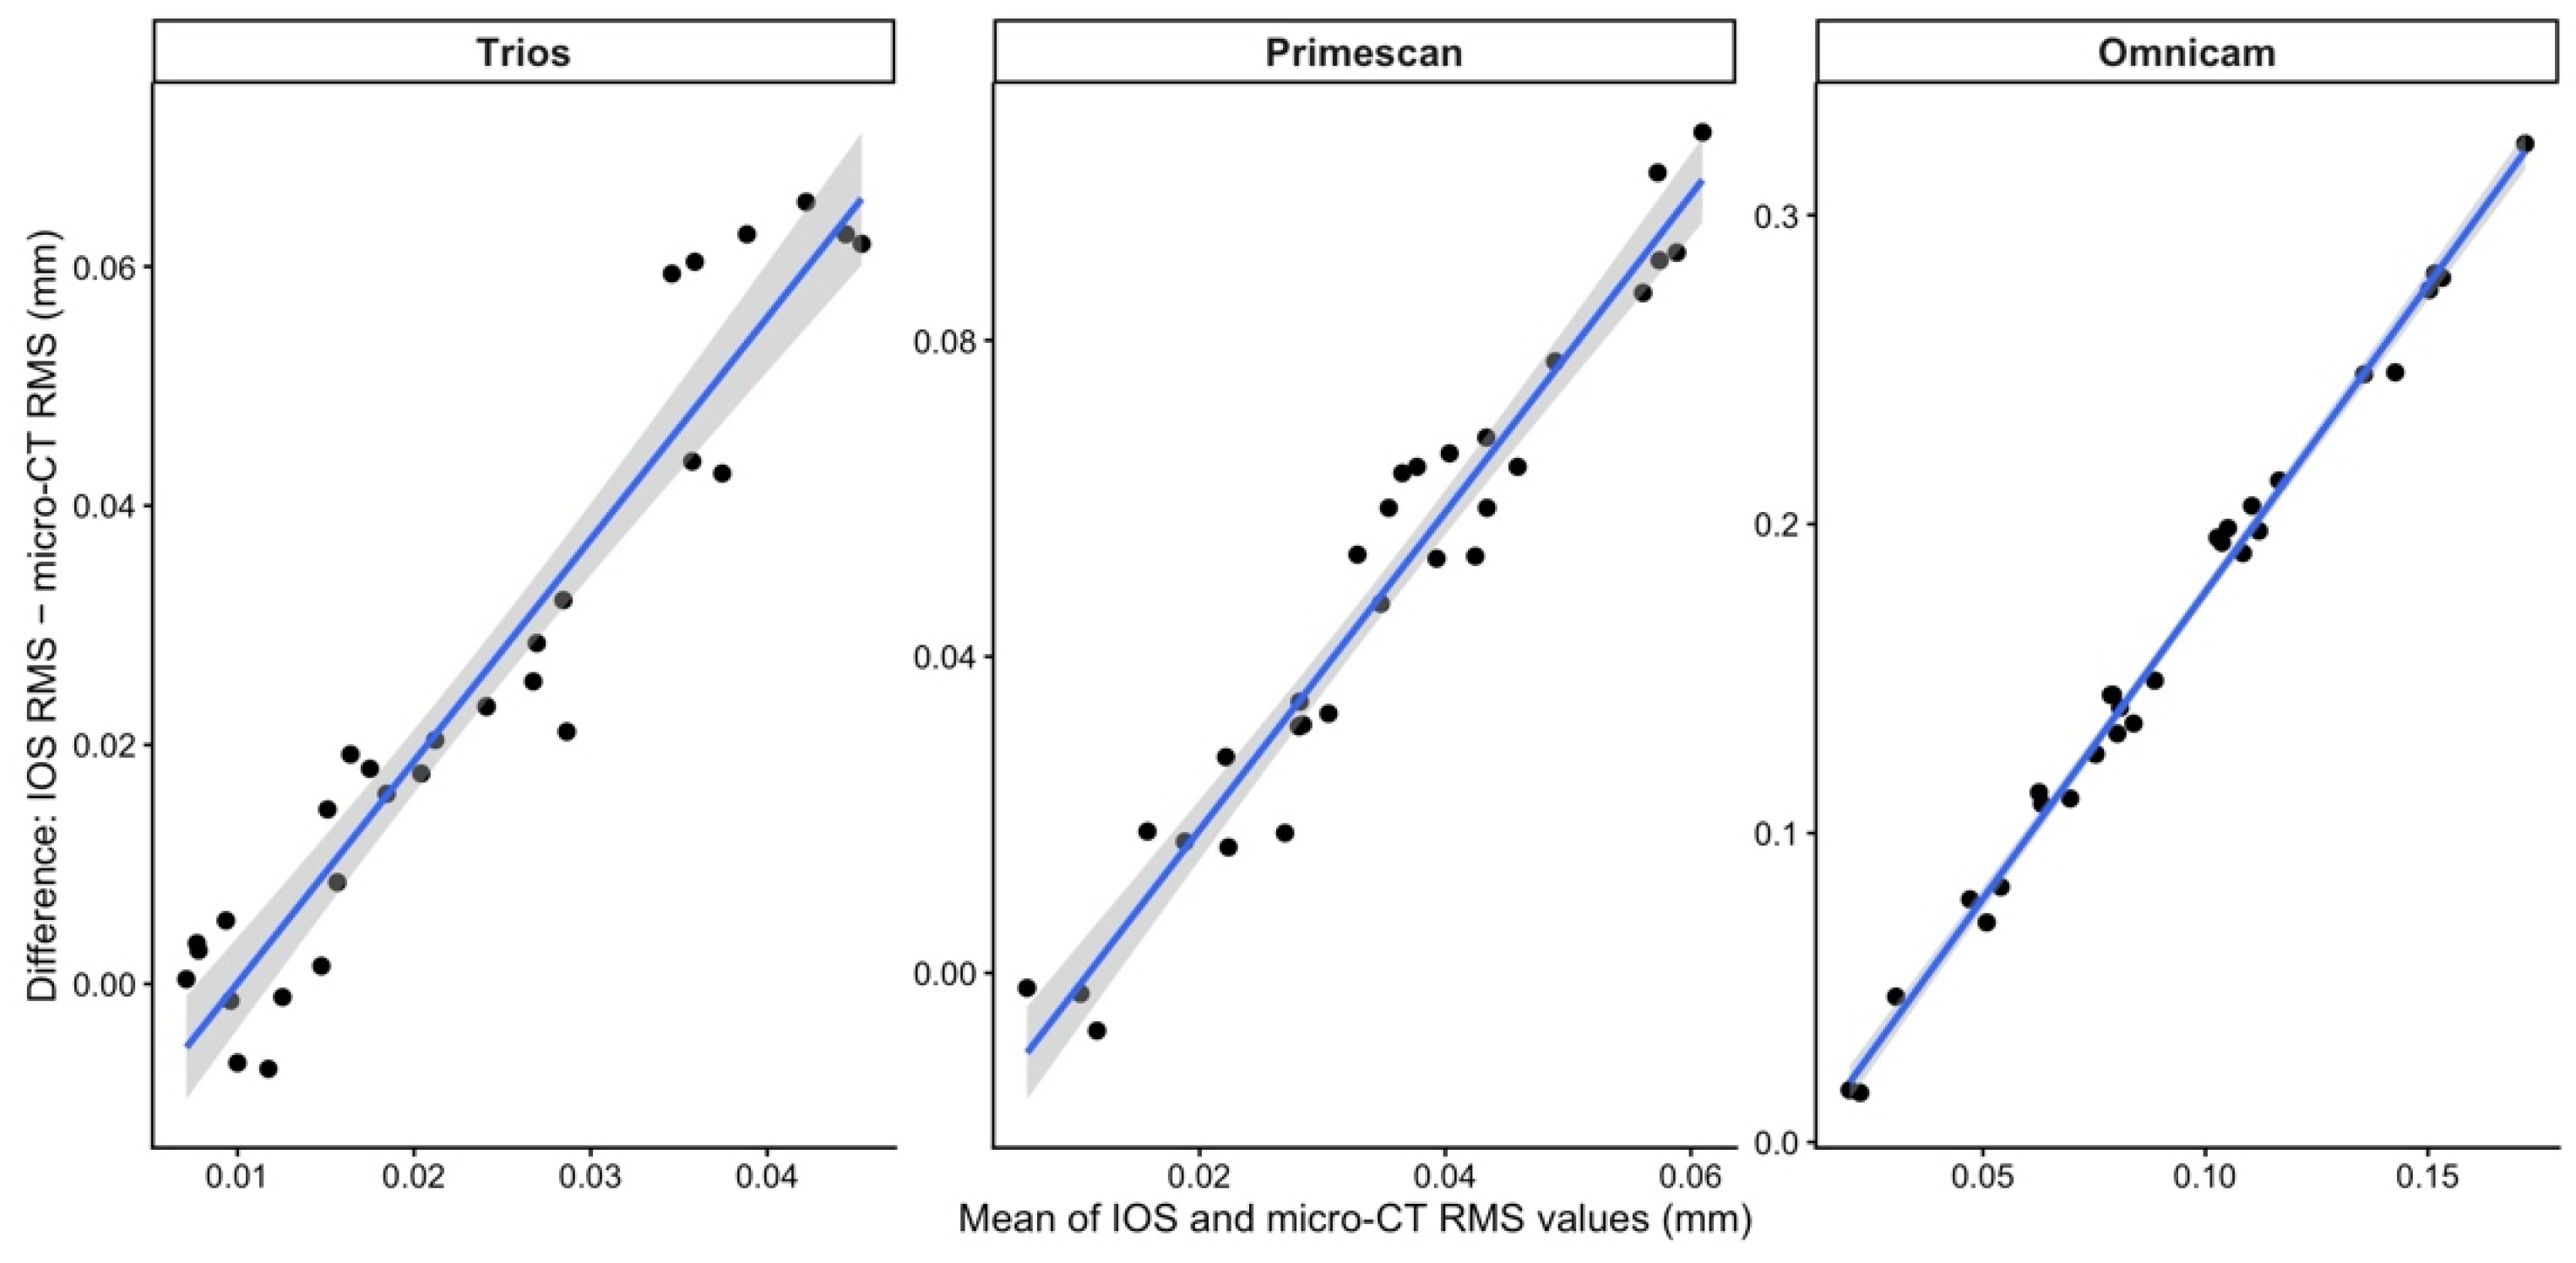
Trios 3 exhibited the smallest median signed scanner-to-reference difference relative to the micro-CT reference (+0.0198 mm, 95% empirical interval [−0.0067, 0.0634]), followed by Primescan (+0.0525 mm, 95% empirical interval [−0.0039, 0.1026]) and Omnicam (+0.1448 mm, 95% empirical interval [0.0167, 0.2926]). These findings were supported by additional metrics. Mean absolute error (MAE) values were 0.0252 mm for Trios 3, 0.0489 mm for Primescan, and 0.1600 mm for Omnicam. These metrics were interpreted as complementary descriptors of scanner-to-reference discrepancy: the median paired difference summarized signed deviation, whereas MAE and RMSE summarized the unsigned magnitude of disagreement. Concordance correlation coefficients (CCC) were 0.0146 for Trios 3, −0.00848 for Primescan, and 0.000702 for Omnicam, indicating negligible concordance with the micro-CT reference. Bland–Altman analysis revealed a clear magnitude-dependent disagreement pattern for all three scanners, with the IOS–micro-CT difference increasing as the paired mean RMS value increased. Formal regression analysis confirmed significant positive proportional bias for Trios 3 (slope = 1.856, p < 0.0001, R2 = 0.9145), Primescan (slope = 2.007, p < 0.0001, R2 = 0.9487), and Omnicam (slope = 1.985, p < 0.0001, R2 = 0.9923). These results indicate that disagreement between IOS-derived RMS values and the micro-CT reference was not constant across the measurement range but increased systematically at higher RMS magnitudes. The primary heteroscedastic nlme linear mixed-effects model fitted to the repeated-scan observations showed a significant effect of device on RMS values (F(3,107) = 75.12, p < 0.0001). Estimated marginal means were lowest for the micro-CT reference (0.0109 mm), followed by Trios 3 (0.0350 mm), Primescan (0.0590 mm), and Omnicam (0.1709 mm). Pairwise comparisons from this primary model demonstrated significant differences among all systems, including between Trios 3 and Primescan (estimate = 0.0240 mm, p = 0.0044). The supplementary lmerTest sensitivity analysis using Satterthwaite denominator degrees of freedom confirmed a significant overall effect of device on RMS values (F(3,107) = 87.63, p < 0.0001), supporting the robustness of the primary omnibus inference. Because the absolute-error outcome was non-negative and residual diagnostics from an initially fitted Gaussian mixed-effects model indicated departure from approximate normality, inferential analysis was conducted using a Gamma generalized linear mixed-effects model with log link and device-specific dispersion. This model showed a significant effect of device on absolute error, as confirmed by likelihood-ratio testing against the reduced model (χ2(2) = 62.30, p < 0.0001). Model-estimated mean absolute errors on the response scale were lowest for Trios 3 (0.0249 mm; 95% CI: 0.0166–0.0373), followed by Primescan (0.0473 mm; 95% CI: 0.0346–0.0647) and Omnicam (0.1534 mm; 95% CI: 0.1182–0.1989). Tukey-adjusted pairwise comparisons showed that Trios 3 had significantly lower absolute error than Primescan (ratio = 0.526, p = 0.0133) and Omnicam (ratio = 0.162, p < 0.0001), while Primescan also showed significantly lower absolute error than Omnicam (ratio = 0.309, p < 0.0001). Simulation-based residual diagnostics did not indicate lack of uniformity (p = 0.207), residual dispersion (p = 0.388), or excess outliers (p = 1.000). Based on absolute-error modelling, the ranking of agreement with the micro-CT reference was Trios 3 < Primescan << Omnicam. Precision analysis based on the repeated scans showed differences in within-tooth repeatability among the evaluated systems. Trios 3 showed the lowest mean within-tooth standard deviation (0.0215 mm) and the lowest repeatability coefficient (0.0595 mm), followed by Primescan (0.0290 mm and 0.0802 mm, respectively), whereas Omnicam showed the highest within-tooth variability (0.0624 mm) and the highest repeatability coefficient (0.1730 mm). Overall, Trios 3 most closely approximated the micro-CT reference, showing the lowest RMS bias, the lowest absolute error, and the most favorable repeatability among the evaluated intraoral scanners. Although Trios 3 and Primescan produced values closer to the micro-CT reference than Omnicam, the close-to-zero or slightly negative CCC values indicate that none of the evaluated systems should be considered interchangeable with micro-CT for quantitative wear assessment.
4. Discussion
The present study evaluated the performance of three intraoral scanners (IOS) using different acquisition technologies in comparison with micro-CT scans for the assessment of tooth wear. The primary heteroscedastic mixed-effects analysis of RMS values demonstrated a significant overall effect of device, resulting in rejection of the first null hypothesis (Ho1). The supplementary lmerTest sensitivity model using Satterthwaite denominator degrees of freedom confirmed this overall device effect. Comparisons with the micro-CT reference and the absolute-error analysis further demonstrated that scanner-to-reference discrepancy differed among systems, resulting in rejection of Ho2. Trios 3 and Primescan produced RMS values numerically closer to the micro-CT reference than Omnicam, and the revised Gamma mixed-effects analysis of absolute error indicated a graded performance pattern of Trios 3, followed by Primescan, and then Omnicam. Nevertheless, these relative differences should be interpreted alongside the agreement analyses rather than as evidence of quantitative interchangeability with the reference method. However, the very low concordance correlation coefficients should be interpreted cautiously. Although Lin’s concordance correlation coefficient was calculated as a supplementary measure of agreement, the compared values were derived RMS metrics generated through different acquisition, reconstruction, and registration workflows rather than direct measurements of the same physical quantity obtained under identical conditions. In addition, the mean RMS value obtained from the micro-CT reference was 0.0109 mm, or 10.9 μm, which was below the nominal voxel dimension of 36.9 μm used for micro-CT acquisition. Voxel size should not be considered an absolute detection threshold for reconstructed three-dimensional surface analysis; nevertheless, the small magnitude of the reference RMS values indicates that the simulated wear signal was being evaluated near the lower practical measurement range of the present micro-CT-based workflow. Consequently, the near-zero or slightly negative CCC values may reflect not only scanner-to-reference disagreement, but also the difficulty of demonstrating concordance when the true wear-related signal is small relative to the combined noise introduced by acquisition, segmentation, mesh reconstruction, and registration. The Bland–Altman analysis provided an important complementary interpretation of the agreement results. Rather than showing a constant level of disagreement across the measurement range, all three scanners demonstrated strong proportional bias, with IOS–micro-CT differences increasing as the mean RMS value increased. This pattern indicates that scanner-to-reference disagreement became progressively larger at higher measured surface-deviation magnitudes. Therefore, agreement cannot be summarized adequately by constant limits of agreement across the full range of RMS values. This finding reinforces the conclusion that, although Trios 3 and Primescan performed more favorably than Omnicam in several descriptive and model-based comparisons, none of the evaluated scanners demonstrated quantitatively stable agreement with the micro-CT reference across the observed measurement range (Figure 3).
Figure 3.
Bland–Altman plots showing agreement between each intraoral scanner and the micro-CT reference for RMS surface deviation values. The solid horizontal line represents the mean bias, and the dashed horizontal lines represent the 95% limits of agreement. Differences were calculated as IOS-derived RMS minus micro-CT RMS.
Several studies have investigated the ability of IOS to assess early tooth wear, with promising findings. Kumar et al. tested the sensitivity of intraoral scanners in distinguishing early tooth wear and found that the scanners were able to identify early lesions. However, the study also reported low precision and highlighted limitations in repeatability and measurement consistency during scanning procedures [21]. These results align with earlier findings by Meireles et al., who similarly reported notable measurement errors [22].
As intraoral scanner technology has evolved, subsequent studies have demonstrated improvements in accuracy and reductions in measurement error. These improvements were closely associated with scan length, as studies reporting lower errors typically involved single-tooth scans rather than larger regions [23].
In the present study, quadrant scans were used rather than single-tooth scans and this procedure may also have influenced the results. Larger scan spans accumulate stitching and reconstruction errors, and this may partly explain the deviations observed. However, the quadrant scans reflect the clinical situation in which sequential scans are compared using adjacent structures as references. Adjacent teeth served as reference structures for model alignment prior to comparison. The alignment method applied was reference best-fit alignment. Before superimposition, the buccal surfaces of the teeth subjected to wear were excluded in the software to optimize the performance of the best-fit alignment [19,24]. This approach is consistent with previous studies that reported advantages of this superimposition strategy [19]. Because the best-fit alignment method incorporates the entire model through an iterative closest point algorithm, it can tend to underestimate wear [24]. Excluding worn surfaces facilitates optimal alignment of the remaining model, leaving only the excluded areas for comparison. Although the alignment method used in this study is consistent with previous investigations, the comparison strategy differed. Most prior studies employed profilometry or optical coherence tomography as the reference standard for validation [21]. In the present study, micro-CT scans were used as the reference standard. Micro-CT was selected as the reference method based on the rationale of its high-resolution three-dimensional volumetric imaging capability, detailed three-dimensional object reconstruction using STL models, and the possibility of performing non-destructive testing of the same object prior to and after the simulation of wear. Unlike two-dimensional approaches, the three-dimensional imaging of complex dental shapes using micro-CT establishes it as the most appropriate reference method for the proposed in vitro study. However, it should be understood that the reference method was a reference standard rather than the actual ground truth. Micro-CT is best viewed as a high-resolution reference standard, rather than ground truth, due to the possibility of error introduced by processes such as conversion, segmentation and registration that could also introduce variability. This consideration is particularly relevant in the present study because the mean micro-CT RMS value was 10.9 μm, whereas the nominal voxel size was 36.9 μm. Although the reconstructed surface model may capture subvoxel-scale variation through the combined effects of grey-value information, segmentation, interpolation, and surface extraction, the present findings should not be interpreted as establishing that micro-CT provided an error-free ground-truth estimate of such small wear changes. Rather, the reference method operated at a measurement scale at which reconstruction and post-processing uncertainty may become proportionally influential. This may partly explain why concordance with the IOS-derived RMS values was extremely low despite a consistent descriptive ranking among scanners. The micro-CT datasets were converted to stereolithography (.STL) files and compared directly with IOS-derived models. This approach enabled precise RMS measurements across all models, independently of differences between devices or measurement tools. The relatively large standard deviations observed in all groups, including the micro-CT reference, indicate substantial specimen-to-specimen variability in the measured surface changes. This variability can be attributed to the natural differences in premolar morphology, the degree and pattern of wear resulting from the erosive-abrasive protocol, and the associated model registration and surface deviation analysis. Therefore, it should not be assumed that the variability of the RMS values is due to the imprecision of the scanner but rather a consequence of the combined effects of the variables. However, it was still possible to determine the ranking of the systems, with the least variation from the micro-CT reference being that of the Trios 3, followed by the Primescan and then the Omnicam. Although RMS values for each intraoral scanner differed significantly from the micro-CT reference, the Trios 3 and Primescan groups produced RMS values closer to those of the micro-CT reference than the Omnicam group. The repeatability analysis further supported the relative ranking of the evaluated systems, with Trios 3 showing the most favorable precision, followed by Primescan, whereas Omnicam showed substantially greater within-tooth variability. The observed scanner-to-reference discrepancies should be interpreted cautiously in light of the registration-dependent nature of the analytical workflow. In the present study, surface deviations within the worn buccal region were quantified after reference best-fit alignment on unworn surfaces. Consequently, the measured RMS differences were contingent not only on the ability of each scanner to capture wear-related surface change, but also on the stability of the superimposition procedure used to bring sequential models into correspondence. Although Trios 3 and Primescan produced RMS values closer to the micro-CT reference than Omnicam, the present data do not permit the contribution of registration-related uncertainty to be quantified independently. Therefore, the observed scanner-to-reference differences should be interpreted as reflecting the combined influence of image acquisition, mesh reconstruction, regional superimposition, and wear-related surface change. The very low concordance correlation coefficients further indicate that none of the evaluated intraoral scanners demonstrated quantitative agreement sufficient to be considered interchangeable with the micro-CT reference method (Figure 4). The direct IOS-versus-micro-CT color maps presented in Figure 5 were generated through a separate cross-modality best-fit alignment of the post-wear models using the entire available model geometry. These maps were included only to provide a qualitative visual representation of spatial deviation patterns and were not used to derive the numerical scanner-to-reference discrepancy metrics or the statistical comparisons. Accordingly, uncertainty related to this cross-modality superimposition may influence the visual appearance of Figure 5, but it does not directly contribute to the reported median signed differences, observed MAE values, RMSE values, or model-based absolute-error analyses, which were calculated from RMS values derived independently within each modality-specific baseline-to-post-wear comparison.
Figure 4.
Comparative color maps between baseline and final scans after simulated tooth wear for the intraoral scanners: (A) Primescan, (B) Trios 3, and (C) Omnicam. The maps illustrate the spatial distribution of deviations on the analyzed buccal surface region after superimposition. The same color scale was applied across all three panels. Green and yellow areas signify minimal displacement within ±0.1 mm; blue areas highlight substantial inward displacement of −1.0 mm.
Figure 5.
Qualitative color deviation maps comparing each post-wear intraoral scanner model with the corresponding post-wear micro-CT-derived model after cross-modality best-fit alignment on the entire available model geometry: (A) Primescan, (B) Trios 3, and (C) Omnicam. These maps were generated solely for visual illustration of spatial deviation patterns and were not used to calculate the numerical RMS values, scanner-to-reference discrepancy metrics, or statistical model outcomes reported in the study. Green areas indicate the lowest surface deviation relative to the micro-CT-derived model, whereas blue areas indicate negative deviations.
These findings suggest that Trios 3 and Primescan performed more favorably than Omnicam under the present experimental conditions, although none of the evaluated systems demonstrated quantitative agreement sufficient for interchangeability with the micro-CT reference. In contrast, the Omnicam group failed to approach the micro-CT RMS value, likely owing to inaccuracies during scan reconstruction (Figure 5).
These inaccuracies could result from either the acquisition technology or the software architecture integrated into the scanner. During the 3D comparison phase, the metrology software used an algorithm to calculate the mean absolute distance between corresponding points of the models, which defined their discrepancy [25,26]. This procedure requires the selection of specific areas for model comparison (Figure 3 and Figure 4). Previous studies have emphasized the critical importance of selecting specific regions, as this choice can strongly influence the validity of accuracy [27,28]. Accuracy is defined by trueness and precision, with precision referring to an IOS’s ability to deliver consistent results under repeated scans. Several factors influence accuracy, including properties of the scanned substrate and the scanner’s acquisition technology [24]. Translucent materials, in particular, can negatively affect the accuracy of certain IOS systems [23]. In the present study, the materials used were not highly translucent, highlighting the importance of the operational scanning technology integrated into each IOS device. The evaluated scanners used the following acquisition technologies: active triangulation technology for Omnicam, structured-light triangulation for Primescan, and parallel confocal imaging for Trios 3. As reported by Dutton et al., IOS systems based on active triangulation exhibit lower accuracy compared with scanners that use parallel confocal technology [14]. In the same study, Primescan and Trios 3 demonstrated better trueness and precision than Omnicam. The lower performance of the Omnicam scanner in detecting tooth wear may be attributed to its active triangulation technology, which is inherently less capable of capturing fine surface changes compared with the structured-light and parallel-confocal technologies used in the Primescan and Trios 3. Consequently, the Omnicam scanner showed reduced accuracy in detecting changes on tooth surfaces subjected to artificial wear, producing 3D models that deviated more from the micro-CT reference. The limitations of this study include the relatively small sample size, the location of the artificially induced tooth wear, and the nature of the wear simulation. As this was a controlled in vitro exploratory investigation, neither an a priori nor a post hoc power calculation was performed. However, the number of specimens was comparable to that used in previous in vitro studies evaluating tooth wear and intraoral scanner performance. Nevertheless, the limited number of specimens should be taken into account when interpreting the magnitude and generalizability of the findings. Wear was induced exclusively on the buccal surfaces, which are more accessible during scanning compared with other regions. However, tooth wear can also affect occlusal and lingual surfaces, depending on its etiology. An additional limitation is that the erosive–abrasive protocol could have produced specimen-specific differences in the depth, extent, and pattern of wear between specimens. Although all teeth were subjected to the same standardized procedure, natural anatomical variation among premolars may have influenced the resulting wear pattern. A model based on standardized defects of known depth could provide a more controlled reference for future validation studies. Nevertheless, tooth wear is a multifactorial process involving stress, friction, and biocorrosion mechanisms. Furthermore, abrasive wear was assessed using toothpaste without artificial saliva. This approach was intentional, as saliva is known to modulate tooth wear [28,29]. The objective of the study was to recreate early indications of tooth wear rather than to minimize it, and the use of artificial saliva could have reduced the abrasive effect, potentially limiting detection of subtle changes. Therefore, the present model does not fully reproduce the multifactorial clinical conditions under which tooth wear develops. Although the reference best-fit alignment with exclusion of the worn buccal surface was consistent with previous investigations, this methodological choice introduces structural dependence between the stability of registration on the unworn reference surfaces and the measured deviation within the worn buccal region. Therefore, the reported RMS deviations remain partly contingent on the quality of the alignment procedure. A data-derived estimate of registration uncertainty, such as residual deviation on the reference alignment surfaces or perturbation of the selected registration region, was not available from the retained analytical outputs and was therefore not quantified retrospectively. Accordingly, the present findings should not be interpreted as isolating true wear-related surface change from registration-related artefact, but rather as reflecting the overall performance of the complete scan-to-analysis workflow. Although precision was not the primary outcome of the study, an additional repeatability analysis based on the repeated scans was performed. This assessment was limited to within-tooth variability under the present experimental conditions and should not be interpreted as a comprehensive evaluation of scanner precision across broader clinical scenarios. Moreover, the within-tooth standard deviations and derived repeatability coefficients were based on only three repeated scans per tooth; therefore, these estimates may have wide uncertainty and should be interpreted as descriptive rather than highly precise repeatability parameters. Future studies specifically designed to evaluate precision should include a larger number of repeated scans and should further investigate the influence of scan span and stitching-related error under similar experimental conditions.
5. Conclusions
The detection of early signs of tooth wear differed significantly among the evaluated IOS systems. In addition, none of the IOS systems matched the wear-detection capability of the micro-CT reference. Trios 3 and Primescan showed closer agreement with the micro-CT reference than Omnicam; however, under the low-magnitude simulated-wear conditions evaluated in this study, none of the intraoral scanners demonstrated quantitative agreement sufficient to be considered interchangeable with the micro-CT reference workflow. The repeatability analysis showed that Trios 3 had the most favorable within-tooth repeatability, followed by Primescan, whereas Omnicam showed the highest within-tooth variability. Because registration-related uncertainty was not quantified independently, the observed scanner-to-reference differences should be interpreted as outcomes of the complete acquisition, reconstruction, registration, and surface-analysis workflow rather than as isolated estimates of true wear-detection error. The very low concordance values should be interpreted in light of the small reference RMS magnitude relative to the micro-CT voxel dimension and may reflect the limited ability of the complete measurement workflow to establish agreement for changes approaching its lower practical measurement range. Therefore, IOS-based RMS surface deviation analysis may support relative monitoring of simulated tooth wear, but the tested scanners should not be considered quantitatively interchangeable with micro-CT for very early wear assessment.
Author Contributions
M.T.: Conceptualization, Methodology, Writing—Original Draft. P.M.: Conceptualization, Methodology, Investigation, Validation, Writing—Reviewing and Editing. P.K.: Supervision. D.D.: Writing—Review and Editing, Supervision. K.T.: Resources, Supervision. All authors have read and agreed to the published version of the manuscript.
Funding
This research did not receive any specific grant from funding agencies in the public, commercial, or not-for-profit sectors.
Institutional Review Board Statement
The study was approved by the Ethics and Deontology Committee of the Department of Dentistry, School of Health Sciences, Aristotle University of Thessaloniki (approval code Protocol No. 258/14-10-2024; approval date 14 October 2024).
Informed Consent Statement
Patient consent was waived because the teeth were obtained from an extracted-tooth repository maintained by the Oral Surgery Laboratory; therefore, no patients were directly recruited and informed consent was not required for participation.
Data Availability Statement
The data are available upon reasonable request.
Conflicts of Interest
The authors declare no conflicts of interest. The manufacturers of the evaluated systems had no role in the design of the study; in the collection, analyses, or interpretation of data; in the writing of the manuscript; or in the decision to publish the results.
References
- Zimmer, R.; Barbosa, G.F.; Portella, F.F.; Soares, P.V.; Reston, E.G. Association between non-carious cervical lesions, dentin hypersensitivity and anxiety in young adults: A cross-sectional study. J. Dent. 2025, 153, 105563. [Google Scholar] [CrossRef] [Scilit]
- Grippo, J.O.; Simring, M.; Coleman, T.A. Abfraction, abrasion, biocorrosion, and the enigma of noncarious cervical lesions: A 20-year perspective. J. Esthet. Restor. Dent. 2012, 24, 10–23. [Google Scholar] [CrossRef] [Scilit] [PubMed]
- Al-Seelawi, Z.; Hermann, N.V.; Peutzfeldt, A.; Baram, S.; Bakke, M.; Sonnesen, L.; Tsakanikou, A.; Rahiotis, C.; Benetti, A.R. Clinical and digital assessment of tooth wear. Sci. Rep. 2024, 14, 592. [Google Scholar] [CrossRef] [Scilit] [PubMed]
- López-Frías, F.J.; Castellanos-Cosano, L.; Martín-González, J.; Llamas-Carreras, J.M.; Segura-Egea, J.J. Clinical measurement of tooth wear: Tooth wear indices. J. Clin. Exp. Dent. 2012, 4, e48–e53. [Google Scholar] [CrossRef] [Scilit] [PubMed]
- Lussi, A.; Ganss, C. (Eds.) Erosive Tooth Wear: From Diagnosis to Therapy; Karger: Basel, Switzerland, 2014. [Google Scholar]
- Bartlett, D.; Ganss, C.; Lussi, A. Basic erosive wear examination (BEWE): A new scoring system for scientific and clinical needs. Clin. Oral Investig. 2008, 12, 65–68. [Google Scholar] [CrossRef] [Scilit]
- Michou, S.; Vannahme, C.; Ekstrand, K.R.; Benetti, A.R. Detecting early erosive tooth wear using an intraoral scanner system. J. Dent. 2020, 100, 103445. [Google Scholar] [CrossRef] [Scilit]
- Al Shammari, M.; Helmi, A.; Jadeja, S.; Bartlett, D.; O’Toole, S. The early wear susceptibility of cementum, enamel and dentine in vitro. J. Dent. 2022, 127, 104339. [Google Scholar] [CrossRef] [Scilit]
- Wulfman, C.; Koenig, V.; Mainjot, A.K. Wear measurement of dental tissues and materials in clinical studies: A systematic review. Dent. Mater. 2018, 34, 825–850. [Google Scholar] [CrossRef] [Scilit]
- Revilla-León, M.; Alonso Pérez-Barquero, J.; Barmak, A.B.; Agustín-Panadero, R.; Fernández-Estevan, L.; Gómez-Polo, M. Accuracy of intraoral scanner systems for fabricating inlay, onlay, and veneer restorations: A systematic review and meta-analysis. J. Esthet. Restor. Dent. 2025, 37, 727–755. [Google Scholar] [CrossRef] [Scilit]
- Rekow, E.D. Digital dentistry: The new state of the art—Is it disruptive or destructive? Dent. Mater. 2020, 36, 9–24. [Google Scholar] [CrossRef] [Scilit]
- Borbola, D.; Vág, J. Unifying intraoral scanner, computer-aided manufacturing, and final crown accuracy: A virtual-fit method for marginal gap evaluation. J. Dent. 2025, 163, 106113. [Google Scholar] [CrossRef] [Scilit] [PubMed]
- Chen, Y.; Zhai, Z.; Watanabe, S.; Nakano, T.; Ishigaki, S. Understanding the effect of scan spans on the accuracy of intraoral and desktop scanners. J. Dent. 2022, 124, 104220. [Google Scholar] [CrossRef] [Scilit]
- Dutton, E.; Ludlow, M.; Mennito, A.; Kelly, A.; Evans, Z.; Culp, A.; Kessler, R.; Renne, W. The effect different substrates have on the trueness and precision of eight different intraoral scanners. J. Esthet. Restor. Dent. 2020, 32, 204–218. [Google Scholar] [CrossRef] [Scilit] [PubMed]
- Pattamavilai, S.; Ongthiemsak, C. Accuracy of intraoral scanners in different complete arch scan patterns. J. Prosthet. Dent. 2024, 131, 155–162. [Google Scholar] [CrossRef] [Scilit] [PubMed]
- Mai, H.Y.; Mai, H.N.; Lee, C.H.; Lee, K.B.; Kim, S.Y.; Lee, J.M.; Lee, K.W.; Lee, D.H. Impact of scanning strategy on the accuracy of complete-arch intraoral scans: A preliminary study on segmental scans and merge methods. J. Adv. Prosthodont. 2022, 14, 88–95. [Google Scholar] [CrossRef] [Scilit]
- Reidelbach, C.; Swoboda, M.; Spraul, M.; Vach, K.; Patzelt, S.B.M.; Hellwig, E.; Polydorou, O. Effects of erosion and abrasion on resin-matrix ceramic CAD/CAM materials: An in vitro investigation. Eur. J. Oral Sci. 2024, 132, e12967. [Google Scholar] [CrossRef] [Scilit]
- Hamza, B.; Attin, T.; Cucuzza, C.; Gubler, A.; Wegehaupt, F.J. RDA and REA values of commercially available toothpastes utilising diamond powder and traditional abrasives. Oral Health Prev. Dent. 2020, 18, 807–814. [Google Scholar]
- O’Toole, S.; Osnes, C.; Bartlett, D.; Keeling, A. Investigation into the accuracy and measurement methods of sequential 3D dental scan alignment. Dent. Mater. 2019, 35, 495–500. [Google Scholar] [CrossRef] [Scilit]
- Abad-Coronel, C.; Pazán, D.P.; Hidalgo, L.; Larriva Loyola, J. Comparative analysis between 3D-printed models designed with generic and dental-specific software. Dent. J. 2023, 11, 216. [Google Scholar] [CrossRef] [Scilit]
- Kumar, S.; Keeling, A.; Osnes, C.; Bartlett, D.; O’Toole, S. The sensitivity of digital intraoral scanners at measuring early erosive wear. J. Dent. 2019, 81, 39–42. [Google Scholar] [CrossRef] [Scilit]
- Meireles, A.B.; Vieira, A.W.; Corpas, L.; Vandenberghe, B.; Bastos, F.S.; Lambrechts, P.; Campos, M.M.; Casas, E.B.d.L. Dental wear estimation using a digital intra-oral optical scanner and an automated 3D computer vision method. Comput. Methods Biomech. Biomed. Engin. 2016, 19, 507–514. [Google Scholar] [CrossRef] [Scilit]
- Mennito, A.S.; Evans, Z.P.; Nash, J.; Bocklet, C.; Kelly, A.L.; Bacro, T.; Cayouette, M.; Ludlow, M.; Renne, W.G. Evaluation of the trueness and precision of complete arch digital impressions on a human maxilla using seven different intraoral digital impression systems and a laboratory scanner. J. Esthet. Restor. Dent. 2019, 31, 369–377. [Google Scholar] [CrossRef] [Scilit]
- Kühne, C.; Lohbauer, U.; Raith, S.; Reich, S. Measurement of tooth wear by means of digital impressions: An in-vitro evaluation of three intraoral scanning systems. Appl. Sci. 2021, 11, 5161. [Google Scholar] [CrossRef] [Scilit]
- Witecy, C.; Ganss, C.; Wöstmann, B.; Schlenz, M.B.; Schlenz, M.A. Monitoring of Erosive Tooth Wear with Intraoral Scanners In vitro. Caries Res. 2021, 55, 215–224. [Google Scholar] [CrossRef] [Scilit]
- Li, P.; Wang, R.; Wang, Y.; Tao, W. Evaluation of the ICP algorithm in 3D point cloud registration. IEEE Access 2020, 8, 68030–68048. [Google Scholar] [CrossRef] [Scilit]
- Wu, W.L.; Wang, C.W.; Nam, H.Y.; Lin, W.C. Trueness and precision analysis of crown margins on digital casts produced by various dental scanning systems. J. Dent. Sci. 2025, 20, 1447–1453. [Google Scholar] [CrossRef] [Scilit] [PubMed]
- Nedelcu, R.; Olsson, P.; Nyström, I.; Rydén, J.; Thor, A. Accuracy and precision of 3 intraoral scanners and accuracy of conventional impressions: A novel in vivo analysis method. J. Dent. 2018, 69, 110–118. [Google Scholar] [CrossRef] [Scilit]
- Lam, W.Y.H.; Tse, A.K.L.; Tew, I.M.; Man, W.H.C.; Botelho, M.G.; Pow, E.H.N. Impact of hypo-salivation on severe tooth wear: A ten-year cohort of patients received radiotherapy for nasopharyngeal carcinoma. J. Dent. 2020, 97, 103343. [Google Scholar] [CrossRef] [Scilit]





Disclaimer/Publisher’s Note: The statements, opinions and data contained in all publications are solely those of the individual author(s) and contributor(s) and not of MDPI and/or the editor(s). MDPI and/or the editor(s) disclaim responsibility for any injury to people or property resulting from any ideas, methods, instructions or products referred to in the content. |
© 2026 by the authors. Licensee MDPI, Basel, Switzerland. This article is an open access article distributed under the terms and conditions of the Creative Commons Attribution (CC BY) license.