


Abstract
Surrogate safety assessment in motorcycle-dominated mixed traffic requires screening methods that distinguish threshold-sensitive event prevalence from stable site, time, and interaction patterns. This study develops a TTC–THW-based site–time–interaction framework for engineering screening using 13.342 h of video from six Hanoi arterials, comprising 371,864 vehicles, 2,977,401 validated leader–follower observations, and 180,722 TTC-defined events. Primary window-level inference uses 799 complete non-overlapping 60 s windows; 3181 overlapping windows are retained only for sensitivity analysis. Increasing the TTC reference from 1.5 to 2.4 s raised the flagged-observation proportion from 12.04% to 17.99%, without changing the site ordering. A one-standard-deviation increase in median THW was associated with a 13.81% lower expected TTC-defined event rate per following exposure in the primary model (IRR=0.8619, 95% CI 0.8433–0.8809), with similar estimates under overlapping-window and AR(1) GEE specifications. Follower-clustered event models showed stable vehicle-pair contrasts across TTC-defined criticality cut-points of 0.6, 0.8, and 1.0 s; the MC–Car odds ratios were 1.440, 1.352, and 1.273, respectively, relative to Car–Car. Alternative THW boundaries and empirical tertiles retained the main temporal-compression contrasts. Downsampling from 7.5 to approximately 3.75 Hz reduced absolute event counts by about 30.6–30.7% but left comparative site rankings unchanged. The framework therefore provides trajectory-based interaction screening rather than crash-risk prediction or independently validated near-crash classification.
1. Introduction
Crash records remain essential for safety planning, but they are retrospective and often sparse. Several years may be required to identify stable patterns, by which time traffic or road conditions may have changed. Traffic-conflict analysis therefore complements crash-based assessment by examining observable interactions before crashes accumulate [1,2,3,4].
Surrogate measures are not crash probabilities. The progression from routine interaction to evasive response, conflict, and crash involves behavioural and causal processes that one trajectory indicator cannot identify [5]. Nevertheless, video-derived trajectories can support timely, disaggregated screening when crash data lack the required spatial or temporal resolution.
Computer vision has expanded this approach from manually coded events to millions of trajectory observations. Automated methods now support interaction reconstruction, exposure estimation, real-time monitoring, and before–after evaluation [6,7,8,9,10]. The remaining challenge is to convert these observations into practical decisions about where and when to investigate.
Time-to-collision (TTC) and time headway (THW) describe different aspects of longitudinal interaction. TTC combines spacing and relative speed and is finite only while a follower closes on its leader. THW describes temporal spacing across a wider range of following conditions [11,12,13]. Their interpretation therefore depends on the analytical objective, event definition, and traffic context [14,15].
1.1. Research Need
Three issues limit direct engineering use. First, transferred TTC references can substantially change the number of flagged observations; therefore, absolute prevalence and comparative site-ranking stability should be assessed separately [16,17,18]. Second, site-level prevalence alone cannot distinguish persistent short spacing from isolated interactions. Window-level THW can provide this temporal context, but overlapping monitoring windows can reuse the same microscopic observations and create dependence if used directly for inference. Third, vehicle-pair contrasts require careful statistical treatment because repeated events may arise from the same vehicles and because TTC, THW, gap, and closing speed are algebraically coupled. A TTC-derived outcome should therefore not be interpreted using minimum THW or closing speed as if they were independent safety predictors.
These three limitations map directly onto the study questions. TTC reference sensitivity maps to the Site question of where investigation should begin; persistent temporal compression maps to the time question of when detailed review is warranted; and repeated, heterogeneous vehicle-pair interactions map to the interaction question of which pair-specific conditions warrant attention.
1.2. Study Objective and Contributions
This study analysed 13.342 h of video from six motorcycle-dominated arterials in Hanoi, Vietnam. The dataset contained 371,864 vehicles and 2,977,401 validated leader–follower observations. We used a previously validated, class-aware reconstruction procedure as the measurement layer and focused on translating the resulting interactions into engineering screening outputs.
The framework addresses three directly mapped questions:
- Where should investigation begin? TTC threshold scanning separates changes in flagged-observation prevalence from changes in comparative site and vehicle-pair rankings.
- When is detailed review warranted? Complete non-overlapping 60 s windows provide the primary THW-based temporal inference, while overlapping windows and AR(1) GEE are used to test dependence robustness.
- Which interaction conditions warrant attention? Vehicle-pair models use follower-clustered inference and alternative TTC-defined criticality partitions without entering minimum THW or closing speed as predictors of a TTC-derived outcome.
The outputs form a multidimensional site–time–interaction screening profile. They are not combined into a weighted index, because they describe distinct operational dimensions and no externally validated weighting scheme is available. The framework is intended to prioritise further review, not to estimate crash probability, identify injury severity, label verified near-crashes, define universal TTC or THW thresholds, or prescribe countermeasures.
2. Materials and Methods
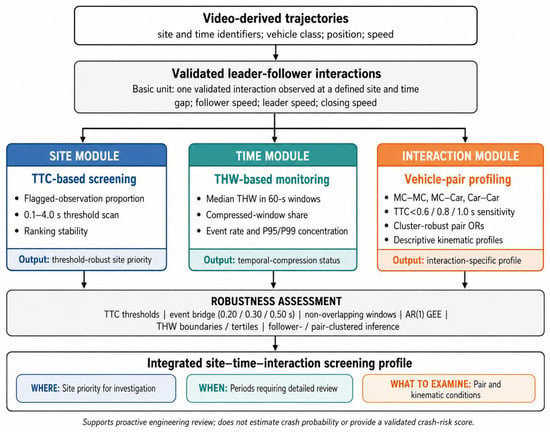
The analytical workflow was designed to convert large-scale trajectory observations into a site–time–interaction screening profile. In this study, the TTC–THW framework is defined as an operational procedure that converts validated vehicle-trajectory interactions into engineering screening outputs at the site, time-window, and vehicle-interaction levels. The basic analytical unit is a validated leader–follower interaction observed at a defined site and time. The framework does not estimate crash probability, injury severity, or independently verified near-crash occurrence and does not replace crash-based safety evaluation.
Two TTC-based quantities are distinguished. Observation-level flagged proportions are used for threshold scanning and comparative site ranking, whereas temporally merged TTC-defined event counts are used for window-level rate modelling. These quantities are not treated as interchangeable.
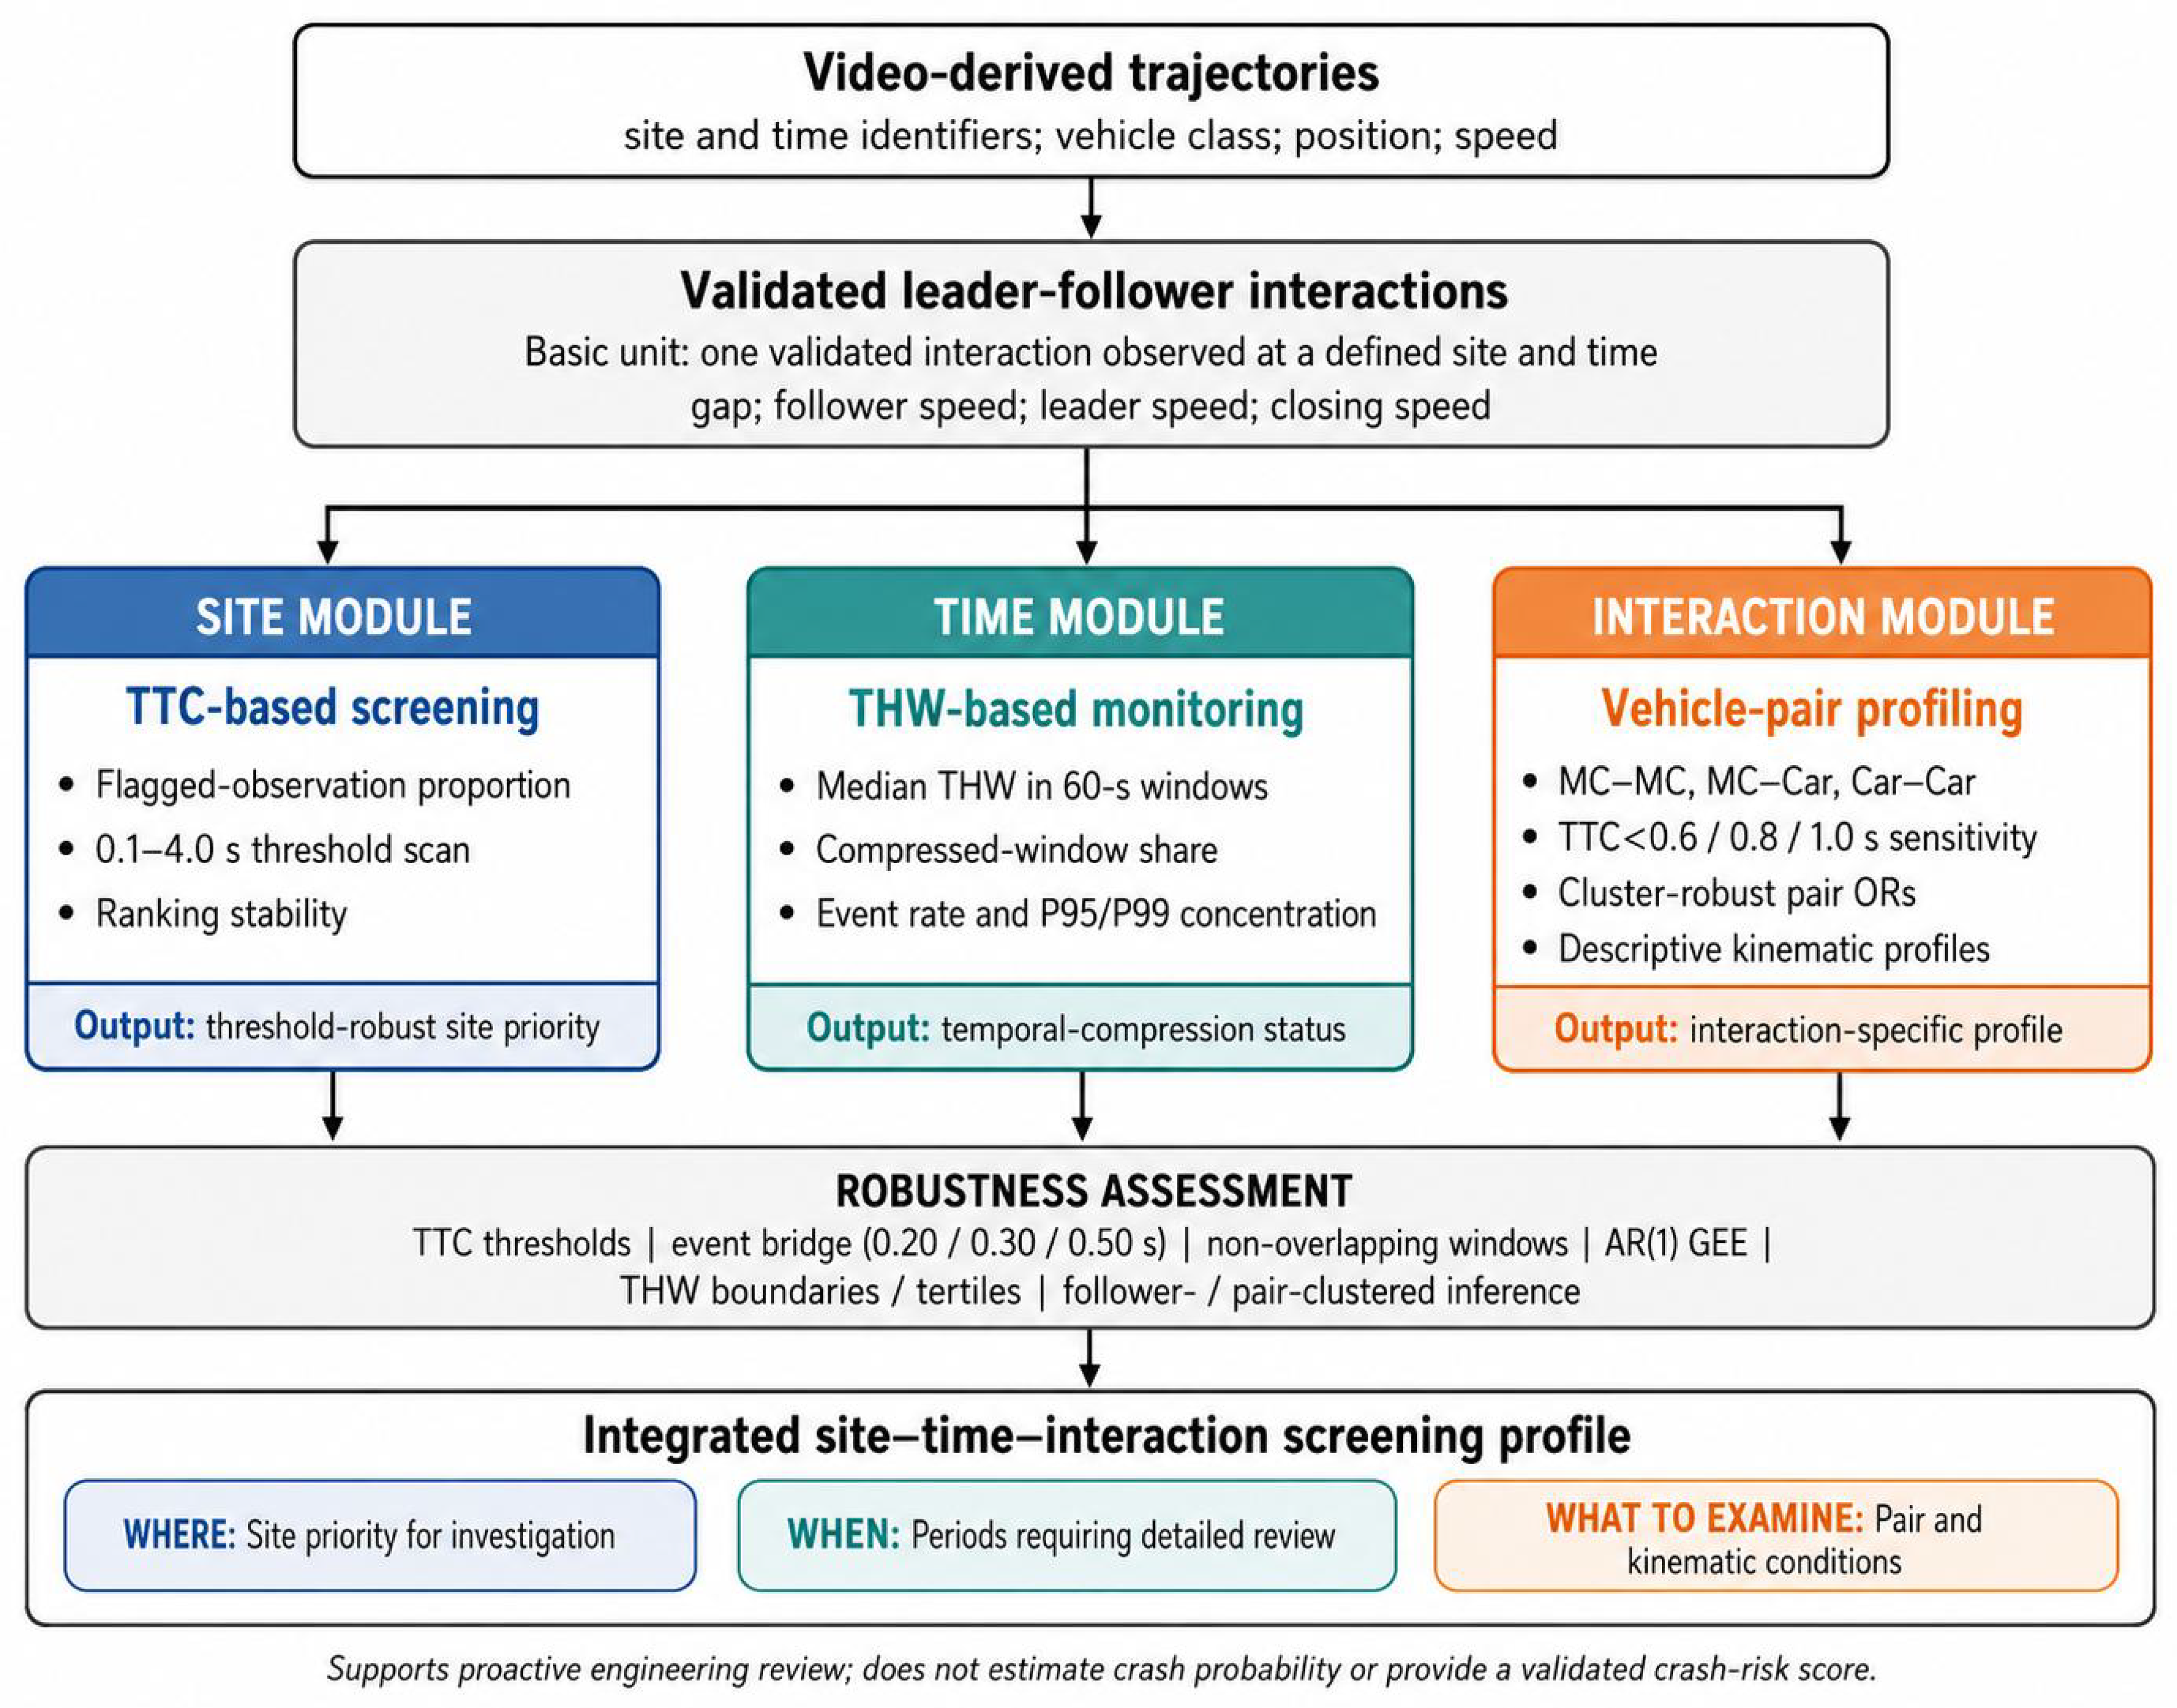
The final framework shown in Figure 1 contains trajectory input; validated interaction measurement; site, time, and interaction modules; a robustness layer; and an integrated engineering-screening output. Robustness assessment includes TTC threshold sensitivity, event-bridge sensitivity, complete non-overlapping windows, AR(1) GEE, alternative THW boundaries including empirical tertiles, follower- and pair-clustered event inference, equal-exposure resampling, and sampling-resolution diagnostics.
Figure 1.
TTC–THW-based site–time–interaction engineering-screening framework. Validated trajectory interactions are converted into complementary site-, time-, and interaction-level outputs. The robustness layer assesses TTC references, event bridges, temporal-window dependence, THW reporting boundaries, clustered event inference, equal exposure, and sampling resolution. The framework supports proactive engineering review and does not estimate crash probability or produce a validated crash-risk score.
2.1. Study Sites and Trajectory Data
The empirical data were collected from six motorcycle-dominated urban arterial sites in Hanoi, Vietnam. The sites differed in effective road width, traffic volume, motorcycle composition, and observed operating conditions. Recording zones were selected on uninterrupted arterial segments to reduce the immediate influence of signal start-up movements and standing intersection queues.
All six sites are therefore uninterrupted arterial segments. Intersections, roundabouts, ramps, and other explicit crossing or merging conflict geometries are outside the empirical scope of the present dataset; transfer to those environments requires external testing.
Recording duration was determined by the intended traffic-state coverage rather than by imposing an identical clock duration at every site. Approximately three-hour recordings were used where the field campaign was intended to cover a complete peak-period evolution, including the full morning-peak process at the long-duration sites, whereas the shorter approximately 1–1.6 h recordings represented comparatively stable-flow periods. The unequal durations therefore reflect different observation objectives rather than post hoc truncation according to TTC/THW outcomes. Nevertheless, duration still affects the amount of independent temporal information; rate models use explicit exposure adjustment, and an equal-exposure robustness analysis resampled the same number of complete non-overlapping windows from every site.
Motorcycle movements in the study environment were not strictly lane-based. Motorcycles frequently travelled abreast, followed vehicles with lateral offset, filtered through available gaps, and changed their behaviourally relevant leader without executing a conventional lane change [19,20]. These characteristics made the sites suitable for examining TTC and THW under motorcycle-dominated, weak-lane-disciplined traffic conditions.
The source videos were recorded at a resolution of pixels and a source frame rate of 30 frames per second. Vehicle detection and tracking were performed every four original video frames. The original source-frame indices were retained in the trajectory records; therefore, the timestamp corresponding to source frame f was calculated as
where t is expressed in seconds.
The effective trajectory sampling frequency was therefore
corresponding to an effective observation interval of
Vehicle detection was implemented using the Ultralytics YOLO framework [21], while vehicle identities were maintained using BoT-SORT [22]. Four vehicle classes were retained: motorcycles, cars, buses, and trucks. Image coordinates were transformed to site-specific ground-plane coordinates using homography calibration. Where trajectory smoothing was required, a Savitzky–Golay filter was applied [23].
Detection, tracking, coordinate transformation, trajectory smoothing, and speed estimation can propagate measurement uncertainty into trajectory-derived surrogate measures [24]. Leader–follower observations were therefore reconstructed using a previously validated class-aware procedure that considered longitudinal order, lateral compatibility, vehicle dimensions, and intervening vehicles.
Explicit leader identification is particularly important in weak-lane-disciplined traffic because the nearest longitudinal vehicle is not necessarily the behaviourally relevant leader [25,26]. The present study treats the validated leader–follower observations as the analytical input and does not present the reconstruction procedure as a new contribution.
The final analytical dataset contained 13.342 h of video, 371,864 detected vehicles, and 2,977,401 validated leader–follower observations. The final site-level analytical profile is reported in Table 1.
Table 1.
Summary of the final analytical dataset by site.
2.2. TTC and THW Computation
For each valid leader–follower observation, the longitudinal bumper-to-bumper gap was denoted by g, the follower speed by , and the leader speed by . Closing speed was calculated as
TTC was calculated for longitudinally closing interactions as
This definition follows the conventional interpretation of TTC as the remaining time to a potential collision if the current longitudinal relative motion continues [11,27].
THW was calculated as
This definition is consistent with its conventional use as a temporal following-spacing measure [12].
TTC and THW were treated as complementary rather than interchangeable indicators [13]. TTC depends on spacing and closing speed and was used for threshold-sensitive comparative screening and event construction. THW describes temporal spacing across a broader range of following conditions and was used for window-level traffic-compression monitoring.
No new TTC, THW, or combined surrogate safety measure was introduced. The three principal vehicle-pair categories were MC–MC, MC–Car, and Car–Car. Mixed motorcycle–car interactions were assigned to the MC–Car category irrespective of whether the motorcycle was the leader or follower. Pair-type classification was used for diagnostic comparison and was not treated as an independent measure of crash risk.
2.3. Event and Monitoring-Window Construction
2.3.1. TTC-Defined Event Construction
The conventional TTC benchmark of 1.5 s was used to identify sub-threshold observations. The value was retained as a reproducible comparison benchmark rather than as a locally validated crash-risk threshold [16,17].
Sub-threshold observations belonging to the same leader–follower pair were merged into one event when the elapsed time between successive observations did not exceed 0.30 s:
Because the effective trajectory interval was approximately 0.133 s, the 0.30 s rule allowed one missing effective trajectory observation to be bridged. A gap of approximately 0.400 s, corresponding to two missing effective observations, generally initiated a new event.
The use of a real-time bridge interval avoided ambiguity associated with expressing event continuity in raw source-frame counts while processing only every fourth frame. The complete event-construction procedure was also repeated using bridge intervals of 0.20 and 0.50 s as sensitivity specifications.
For each event, the following quantities were retained:
- Site and vehicle-pair category;
- Event start and end times;
- Minimum TTC;
- Minimum THW;
- Mean closing speed;
- Traffic-flow state;
- Event duration.
Event duration was calculated inclusively as
where and are the original source-frame indices. This definition assigned a duration of approximately 0.133 s to a single-observation event rather than treating it as a zero-duration event.
The sensitivity of the event inventory to the 0.20 s, 0.30 s, and 0.50 s bridge intervals is reported in Supplementary Table S1.
2.3.2. Monitoring-Window Construction
For statistical inference, the primary monitoring dataset used complete, non-overlapping 60 s windows. This specification avoids direct reuse of the same microscopic observations across adjacent primary windows. A total of 799 complete windows were retained. The previously used 60 s windows with a 15 s step produced 3181 complete windows and were retained only as a higher-resolution sensitivity analysis.
For each window, the TTC-defined event count was based on event start times, and the number of validated following observations was used as the exposure quantity. The event rate per 1000 following observations was
where is the TTC-defined event count and is the number of validated leader–follower observations in window w.
Window-level median THW was used as the continuous temporal-spacing indicator. For operational reporting, windows were also classified as Compressed (<0.55 s), Moderate (0.55–0.75 s), or Less-compressed (>0.75 s). These categories are pragmatic local reporting bins rather than empirically validated crash-safety thresholds. Robustness was evaluated using 0.50/0.75 s and 0.60/0.80 s alternatives and pooled empirical-tertile boundaries.
2.4. Statistical Analysis
The statistical strategy was revised to align the inferential unit with the dependence structure of each module. Millions of microscopic observations are therefore not interpreted as millions of independent replicates.
2.4.1. Stage 1: Threshold-Robust TTC Site Screening
Observation-level TTC flagged proportion at site i and reference was calculated as
TTC was scanned from 0.1 to 4.0 s in 0.1 s increments. The conventional 1.5 s value was used as the benchmark. The 2.4 s value was retained only as a motorcycle-related kinematic comparison reference, informed by the distinct emergency-braking characteristics reported for motorcycle riders [28,29], and was not treated as a deployable or universal threshold. Kendall’s measured site- and pair-ranking stability relative to the 1.5 s benchmark.
Because observation duration differed among sites, an equal-exposure robustness analysis sampled 90 complete non-overlapping 60 s windows from each site over 1000 bootstrap repetitions and recalculated the 1.5 s site ordering.
2.4.2. Stage 2: THW-Based Temporal Screening
The primary count model was a negative-binomial regression estimated on the 799 complete non-overlapping 60 s windows. The dependent variable was the TTC-defined event count, and was included as an offset so that results represented event occurrence per following exposure. Median THW, flow rate, mean speed, and motorcycle ratio were standardised, and site-fixed effects were included. The exponentiated median-THW coefficient is reported as an incidence rate ratio (IRR).
Two dependence checks were conducted. First, the same negative-binomial specification was fitted to the 3181 complete 60 s windows constructed with a 15 s step. Second, a negative-binomial generalized estimating equation (GEE) with an AR(1) working correlation within-site was fitted to the complete non-overlapping windows.
2.4.3. Extreme-Event Concentration by THW State
Operational THW bins were used as a reporting layer rather than a validated ordinal safety scale. For each classification scheme, mean TTC-defined event rates were compared across Compressed, Moderate, and Less-compressed windows. Extreme interaction concentration was summarised by the proportions of TTC-defined events exceeding the global P95 and P99 values of , following the broader use of extreme-value concepts for conflict-based safety screening [30,31]. The main 0.55/0.75 s scheme was compared with 0.50/0.75 s, 0.60/0.80 s, and pooled empirical-tertile boundaries.
2.4.4. Stage 3: Vehicle-Pair Interaction Profiling
The event-level analysis was restricted to the three principal pair categories (MC–MC, MC–Car, and Car–Car). Of the 180,722 TTC-defined events, 180,372 (99.81%) belonged to these categories and entered the pair-specific models; the remaining 350 events involved other vehicle-class combinations and were retained only in the overall event inventory.
Within the TTC-defined event set, s was used as the primary internal partition for higher TTC-defined criticality. It is not crash severity, injury severity, or independently validated near-crash severity. Robustness was assessed with 0.6 s and 1.0 s cut-points.
Logistic models included pair type, flow state, and site-fixed effects, using Car–Car as the reference pair. Standard errors were cluster-robust at the site-specific follower-vehicle level because repeated events could originate from the same follower trajectory; 111,799 follower-level clusters were represented. A sensitivity specification clustered by unique site-specific leader–follower pair.
Minimum THW and mean closing speed were removed as predictors of the TTC-derived binary outcome because TTC, THW, gap, follower speed, and closing speed share algebraic components. These quantities were retained only as descriptive kinematic characteristics of the vehicle-pair categories and are not interpreted as independent causal safety effects.
2.4.5. Sampling-Resolution and Numerical-Sensitivity Analysis
The effective trajectory frequency was 7.5 Hz ( s). Event-level diagnostics therefore recorded the number of effective samples contributing to each TTC-defined event. Sampling sensitivity was evaluated by alternating-phase downsampling to approximately 3.75 Hz, reconstructing the event set, and recomputing comparative site rankings.
First-order local error-amplification coefficients were also derived from the TTC and THW formulas with respect to gap and speed components. Because independent ground-truth standard deviations for gap and speed error were unavailable, no absolute propagated TTC/THW accuracy is claimed. This analysis quantifies numerical sensitivity only.
2.5. Engineering Screening Logic
The three modules provide complementary, non-composite outputs. The site module identifies where comparative interaction prominence is highest and tests whether that priority is stable across TTC references. The time module identifies when short temporal spacing persists and whether the event-rate association survives dependence-aware specifications. The interaction module identifies which vehicle-pair categories are over-represented in alternative TTC-defined criticality partitions using clustered inference. These outputs are combined descriptively as a site–time–interaction screening profile, not as a weighted crash-risk score.
3. Results
3.1. Analytical Sample and Event Inventory
The final analytical dataset contained 2,977,401 validated leader–follower observations and 180,722 TTC-defined events under the 0.30 s bridge rule. The event-level pair models used 180,372 events in the MC–MC, MC–Car, and Car–Car categories. The primary temporal analysis contained 799 complete non-overlapping 60 s windows; 3181 overlapping 60 s/15 s step windows were used only for sensitivity analysis.
3.2. Where to Investigate: Threshold-Robust TTC Screening
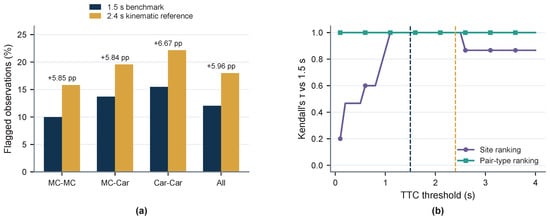
At the 1.5 ms benchmark, 12.04% of all validated following observations were flagged. At the 2.4 s motorcycle-related kinematic reference, the flagged share increased to 17.99%, an increase of 5.96 percentage points. The pair ordering remained Car–Car > MC–Car > MC–MC.
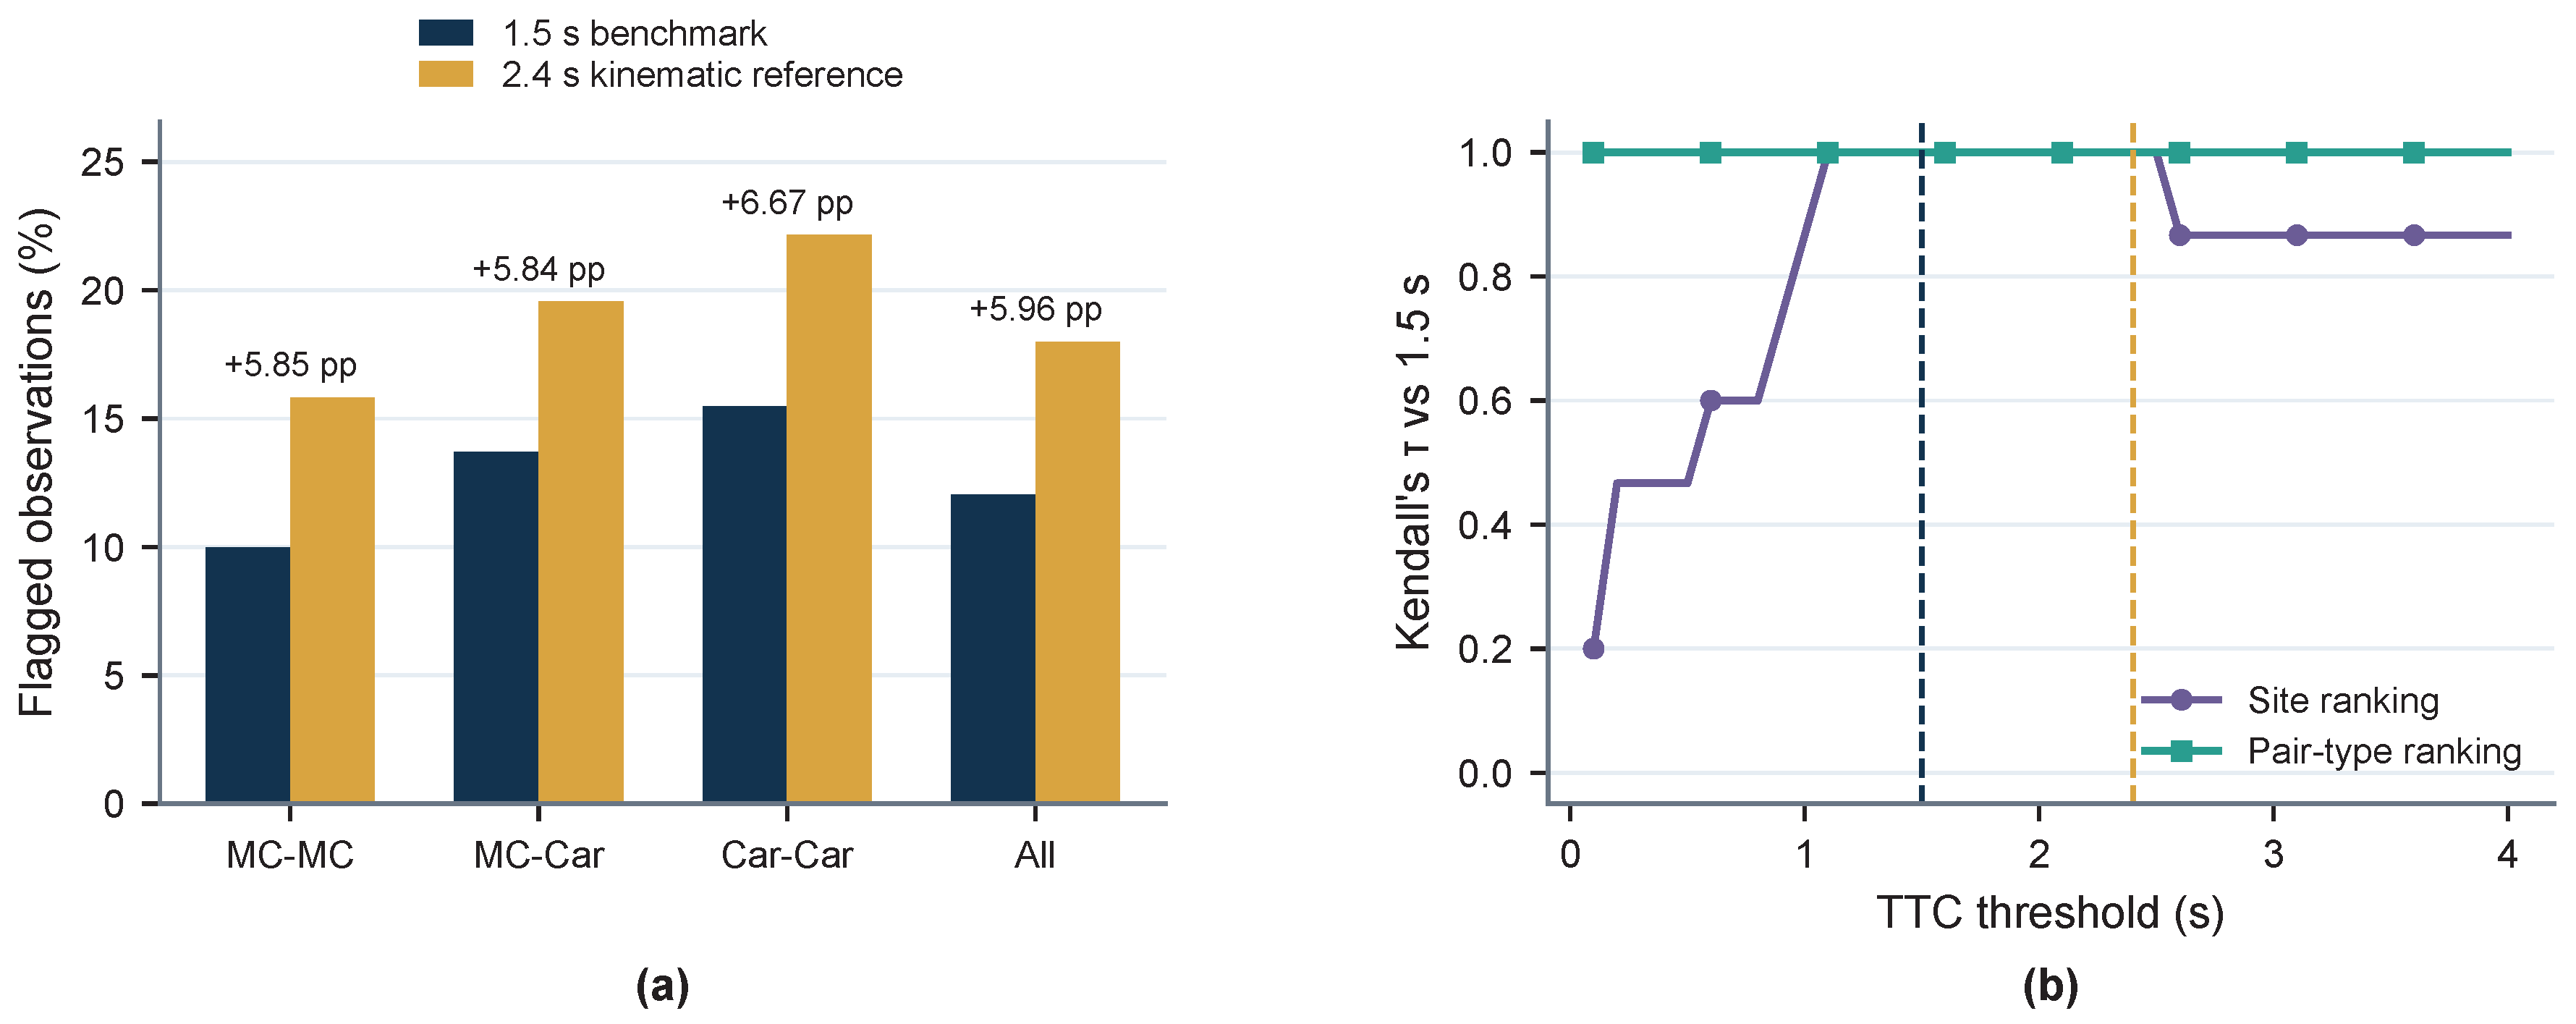
The site ordering was identical at 1.5 and 2.4 s: S2 > S3 > S1 > S4 > S6 > S5. Kendall’s between the two site rankings was 1.000, as was the pair-type ranking correlation. Figure 2 summarizes the flagged-observation proportions at the 1.5 s benchmark and the 2.4 s motorcycle-related kinematic reference together with threshold-wide ranking stability. The complete 0.1–4.0 s flagged-proportion scan is provided in Supplementary Figure S1.
Figure 2.
TTC threshold sensitivity and comparative ranking stability. (a) Flagged-observation proportions at the 1.5 s benchmark and the 2.4 s motorcycle-related kinematic reference. (b) Kendall’s of site and vehicle-pair rankings relative to the 1.5 s benchmark across the 0.1–4.0 s TTC scan. The complete threshold-wide flagged-proportion curves are provided in Supplementary Figure S1.
3.3. When to Investigate: THW-Based Temporal Monitoring
Continuous Median-THW Association
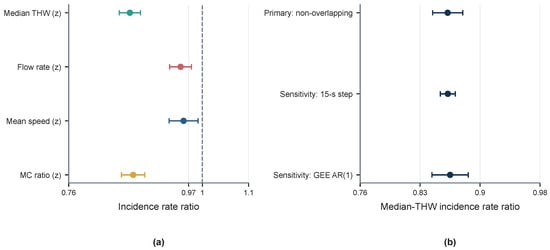
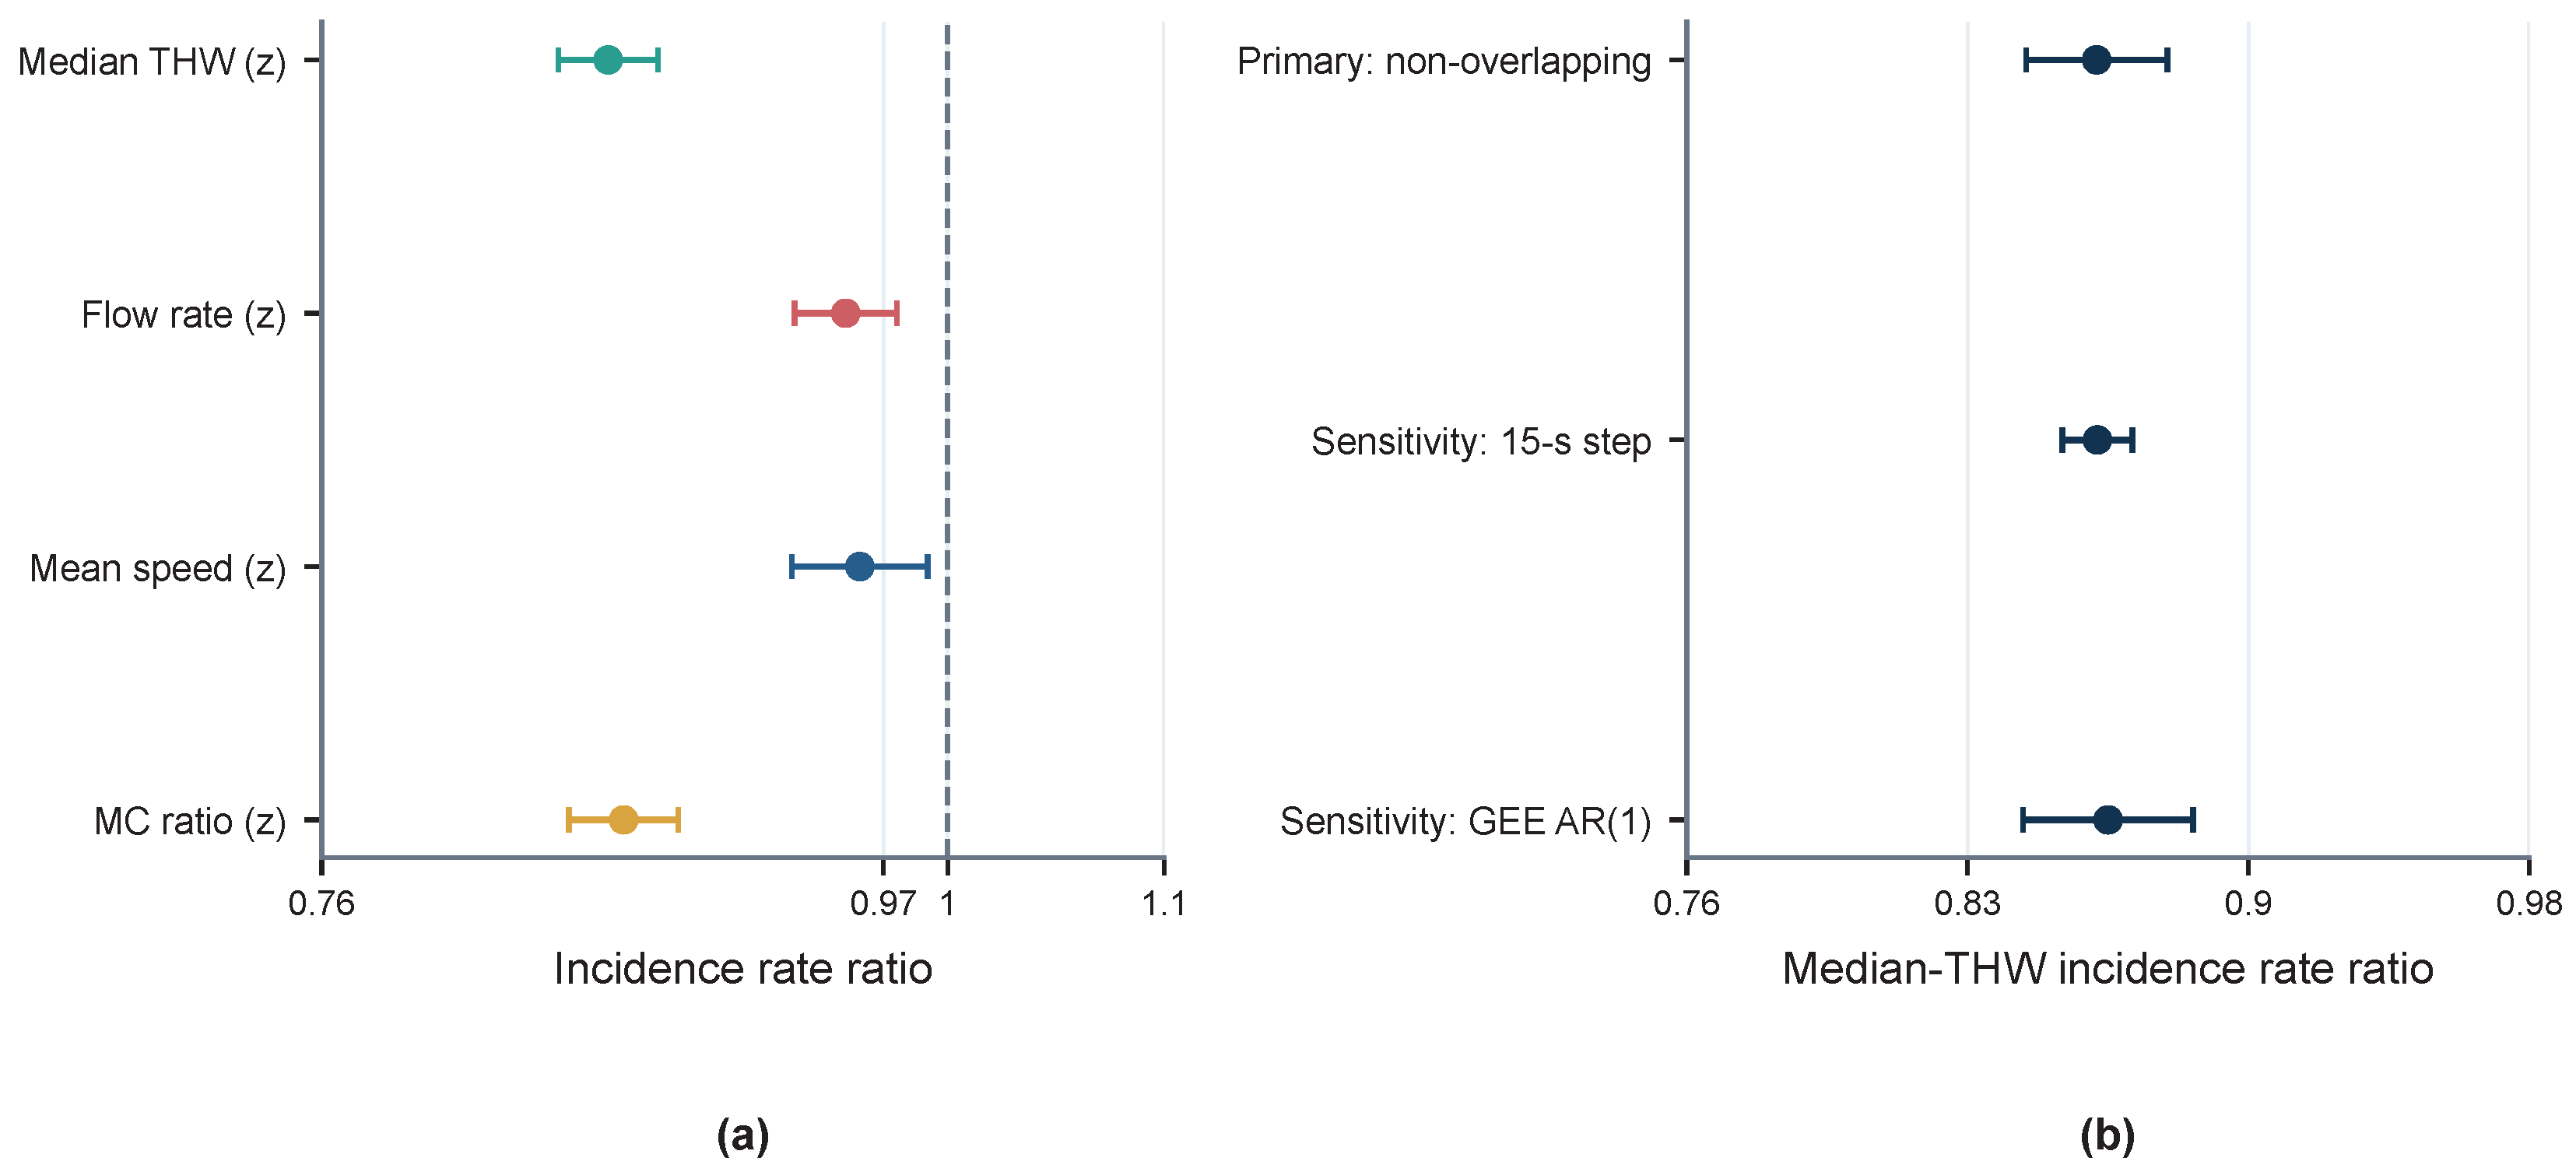
In the primary negative-binomial model based on 799 complete non-overlapping windows, a one-standard-deviation increase in median THW was associated with a 13.81% lower expected TTC-defined event rate per following exposure (IRR = 0.8619, 95% CI 0.8433–0.8809, ). The estimate was nearly unchanged in the overlapping-window sensitivity model (IRR = 0.8621, 95% CI 0.8529–0.8714) and the AR(1) GEE (IRR = 0.8649, 95% CI 0.8426–0.8879). Table 2 summarizes these three dependence-aware specifications, and Figure 3 shows (a) the primary-model covariate IRRs and (b) the median-THW IRR across the primary and sensitivity specifications.
Table 2.
Robustness of the median-THW association across temporal-dependence specifications.
Figure 3.
Window-level count-model results under the final dependence-aware analysis. (a) Incidence rate ratios and 95% confidence intervals for the standardized covariates in the primary negative-binomial model using complete non-overlapping 60 s windows. (b) Median-THW incidence rate ratio under the primary non-overlapping model, the 15 s-step overlapping-window sensitivity model, and the AR(1) GEE sensitivity model.
3.4. Which Interaction Conditions Warrant Attention: Vehicle-Pair Profiling
The three principal vehicle-pair categories accounted for 180,372 events. The primary outcome was membership in the s internal partition, termed higher TTC-defined criticality. This is a TTC-derived classification within the event set and is not crash severity or verified near-crash severity.
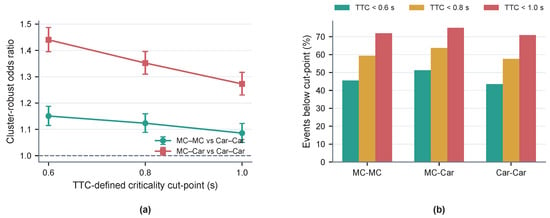
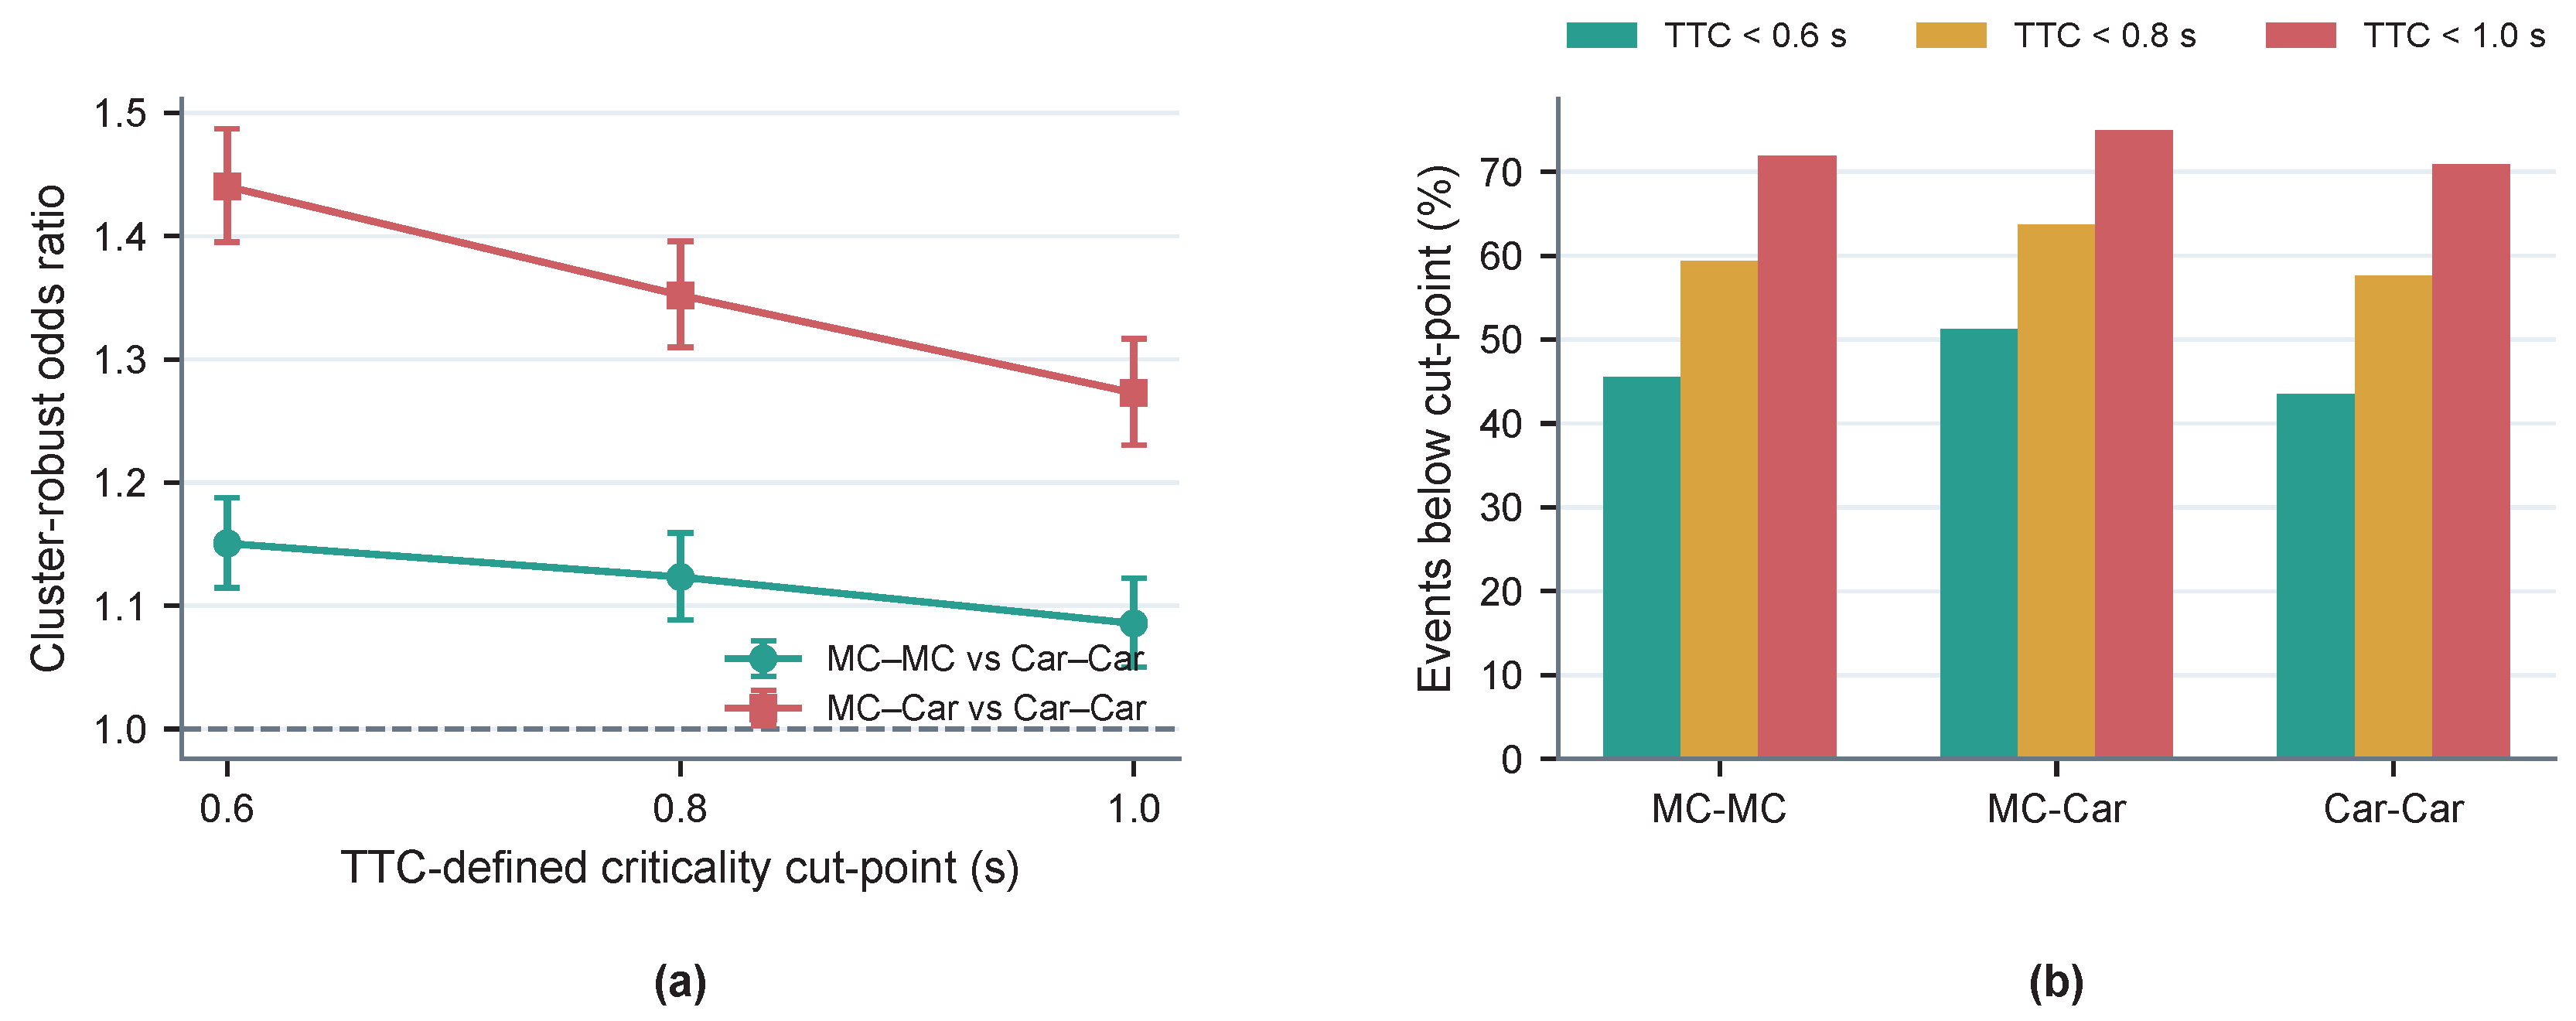
Using follower-vehicle cluster-robust inference and Car–Car as the reference, the MC–MC OR was 1.123 (95% CI 1.089–1.159) and the MC–Car OR was 1.352 (95% CI 1.310–1.396) at the 0.8 s partition. The same direction was retained at 0.6 and 1.0 s. MC–Car ORs were 1.440 (1.395–1.487), 1.352 (1.310–1.396), and 1.273 (1.230–1.317) at 0.6, 0.8, and 1.0 s, respectively; corresponding MC–MC ORs were 1.151 (1.115–1.188), 1.123 (1.089–1.159), and 1.086 (1.050–1.122).
Minimum THW and mean closing speed were not entered as predictors of the TTC-derived outcome because doing so would create algebraic circularity. They are retained only as descriptive kinematic characteristics of the pair categories. Figure 4 shows both the clustered OR estimates and the observed cut-point proportions by pair category.
Figure 4.
Vehicle-pair contrasts across alternative TTC-defined criticality cut-points. (a) Follower-clustered odds ratios and 95% confidence intervals for MC–MC and MC–Car relative to Car–Car. (b) Observed proportions of events below the 0.6, 0.8, and 1.0 s TTC cut-points by vehicle-pair category. The outcome is TTC-derived and should not be interpreted as crash, injury, or independently verified near-crash severity.
3.5. Operational THW States and Extreme-Event Concentration
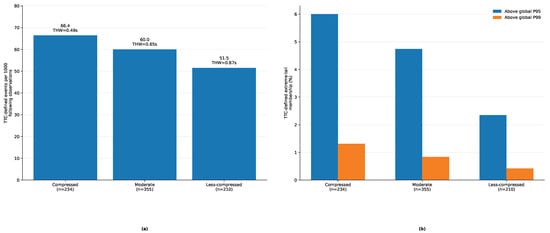
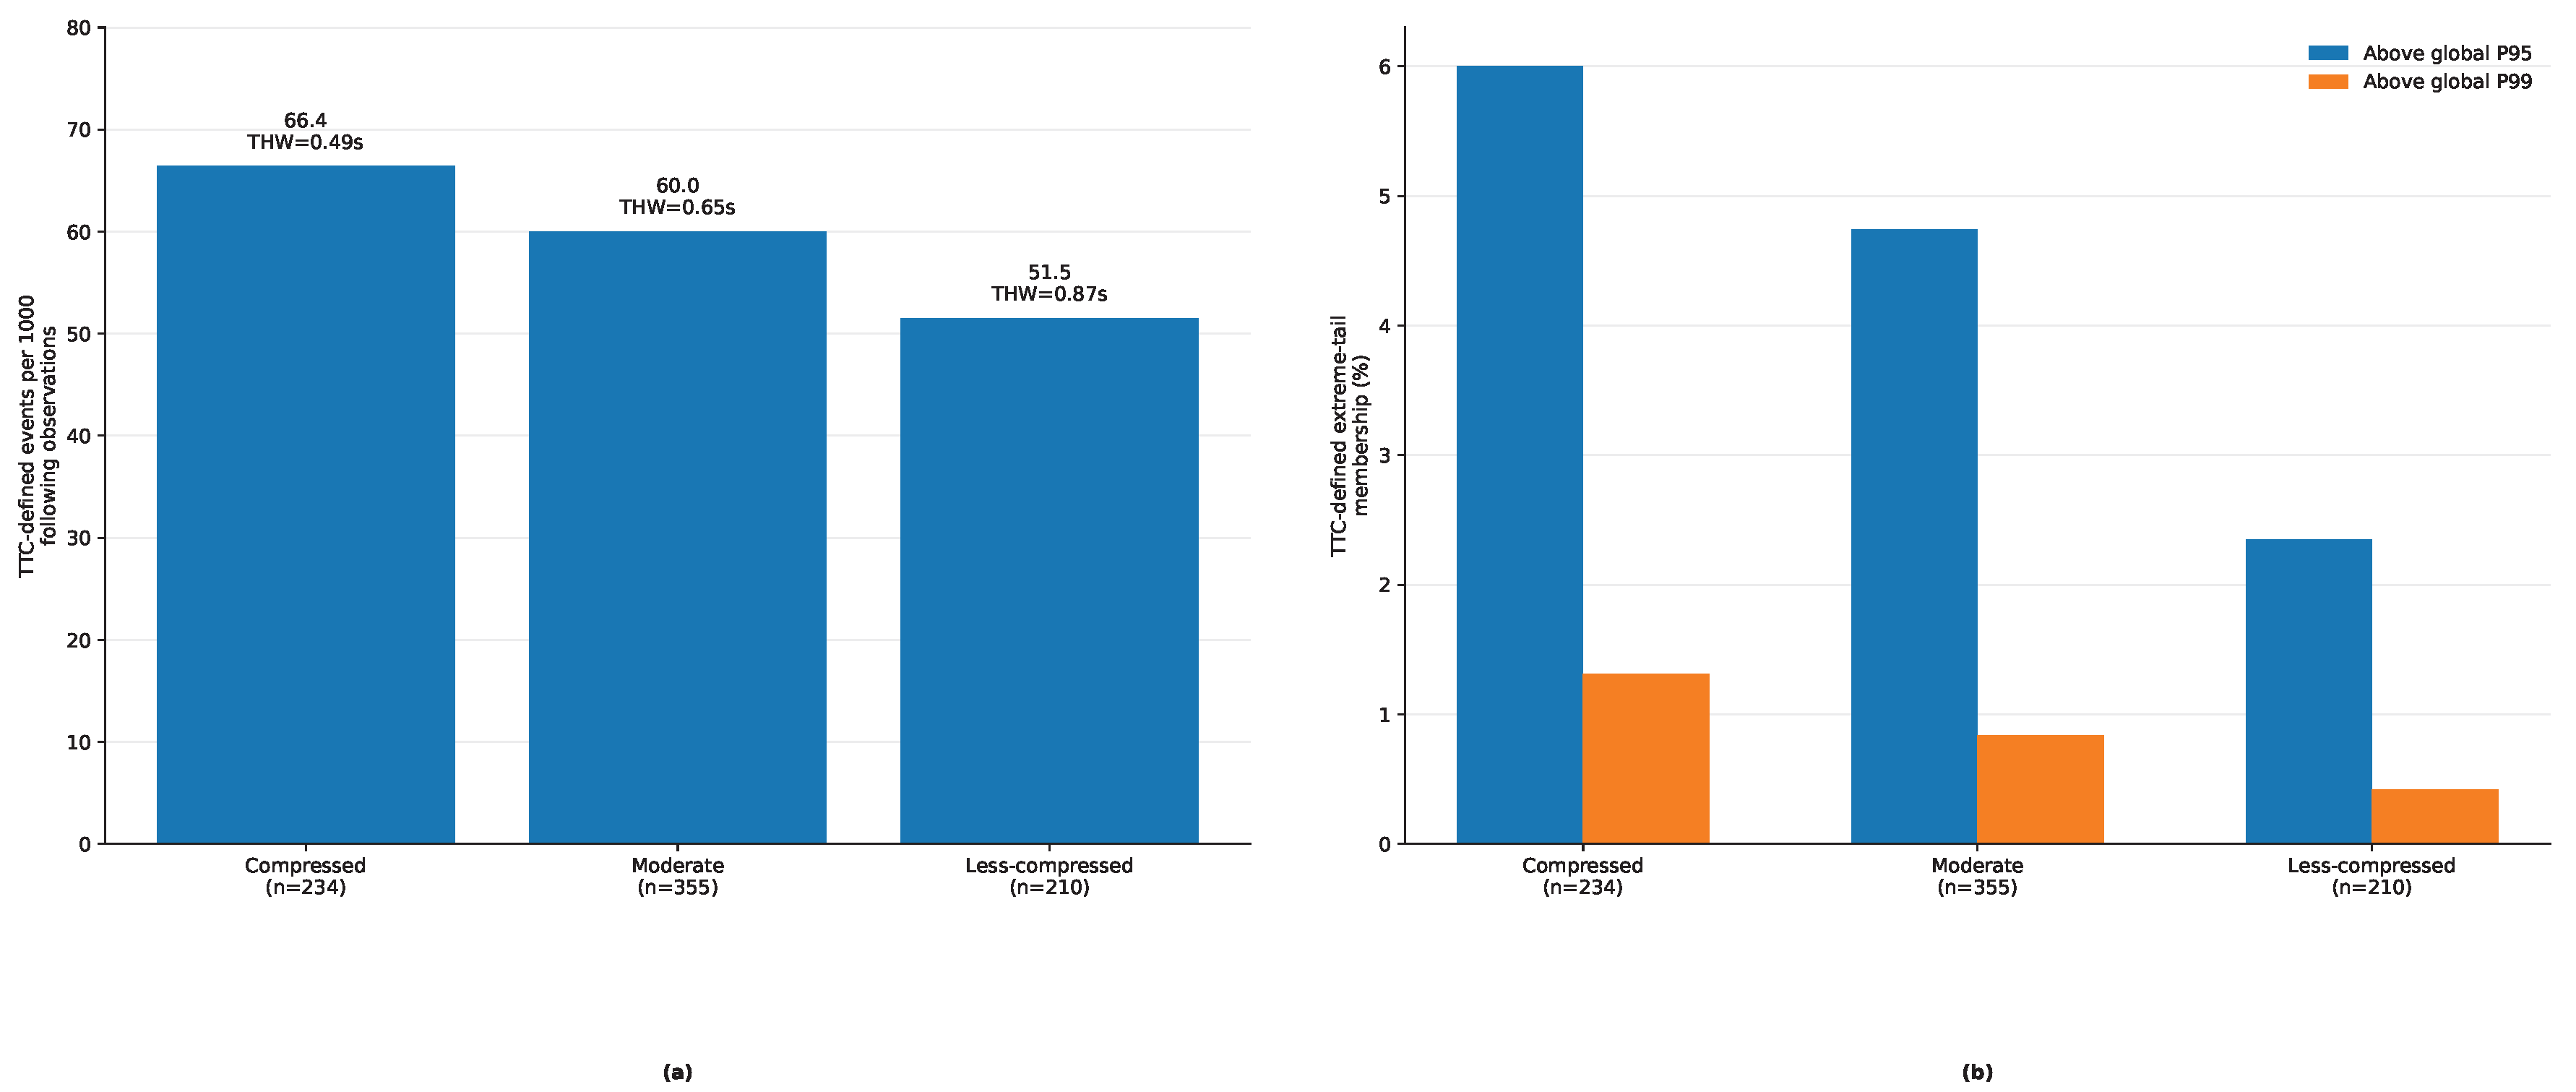
Under the primary operational boundaries, the 799 complete non-overlapping windows comprised 234 Compressed, 355 Moderate, and 210 Less-compressed windows. Mean TTC-defined event rate declined from 66.41 per 1000 following observations in Compressed windows to 51.53 in Less-compressed windows. Global P95 and P99 tail shares also decreased across the raw state summaries. In the adjusted THW-state negative-binomial model, both Compressed (IRR = 1.0957, 95% CI 1.0442–1.1497) and Moderate windows (IRR = 1.1117, 95% CI 1.0761–1.1485) were elevated relative to Less-compressed windows. Because the adjusted Moderate estimate was slightly greater than the Compressed estimate, the adjusted state IRRs are not interpreted as a strictly monotonic dose–response relationship. Table 3 reports the operational-state summaries, and Figure 5 summarizes the raw event-rate and P95/P99 tail contrasts.
Table 3.
THW operational states in complete non-overlapping 60 s windows.
Figure 5.
THW-based temporal-compression states using complete non-overlapping 60 s windows. (a) Mean TTC-defined event rate per 1000 following observations. (b) Shares of TTC-defined events in the global P95 and P99 criticality tails. The categories are operational reporting bins rather than validated safety thresholds.
3.6. Robustness Assessment
Event-bridge sensitivity showed 206,459 events under the 0.20 s bridge, 180,722 under the primary 0.30 s bridge, and 169,085 under the 0.50 s bridge. Observation-level TTC threshold scanning was unaffected because it precedes event aggregation.
THW-state robustness was examined using fixed alternatives and empirical tertiles (Supplementary Figure S2). The pooled empirical-tertile boundaries were 0.5655 and 0.7103 s, close to the main 0.55/0.75 s operational bins. Across all four schemes, Compressed windows retained higher mean event rates and substantially higher P95/P99 tail concentration than Less-compressed windows.
Equal-exposure resampling used 90 complete non-overlapping 60 s windows per site and 1000 bootstrap repetitions (Supplementary Figure S4). The median 1.5 s ordering remained S2 > S3 > S1 > S4 > S6 > S5. S2 ranked first in all resamples, and S1 and S3 remained in the top three in all resamples. The median Kendall rank correlation with the full-sample ordering was 1.000.
Sampling-resolution diagnostics (Supplementary Figure S3) showed that s events had a median of two effective samples; 47.46% were single-sample events and 79.55% contained three or fewer samples. Alternating-phase downsampling from 7.5 to approximately 3.75 Hz reduced absolute event counts by about 30.6–30.7%, but comparative site ranking remained unchanged at both the 1.5 and 2.4 s references (Kendall’s ). Thus, absolute event inventories are sampling-resolution-sensitive, whereas the site-screening ordering was stable in this diagnostic.
3.7. Integrated Engineering Screening Output
The modules provide complementary answers rather than a single risk index. S2 is the highest-priority site under the threshold-robust TTC comparison. S1 combines substantial temporal compression with strong upper-tail concentration, while S3 retains high TTC prevalence without persistent compression. These are trajectory-based interaction-screening profiles, not crash-risk rankings. Their purpose is to direct subsequent video review, field investigation, before–after assessment, and future externally validated safety analysis.
4. Discussion
4.1. Threshold Sensitivity and Site Screening
Changing the TTC reference from 1.5 to 2.4 s materially increased absolute flagged prevalence but did not change the site ordering. This distinction is central to the revised framework: a kinematic comparison reference can be used to test screening stability without being promoted as a universal safety threshold. The unequal recording durations were linked to the field design: longer recordings captured complete peak-period evolution, whereas shorter recordings represented comparatively stable-flow periods. Equal-exposure bootstrapping further showed that the full-sample ordering was not simply a consequence of unequal observation duration.
4.2. Temporal Compression and Dependence-Aware Inference
The median-THW association was nearly identical under the primary non-overlapping Negative Binomial model, the overlapping-window sensitivity model, and the AR(1) GEE. This directly addresses the dependence introduced by 60 s windows advanced in 15 s steps. THW categories remain useful for operational reporting, but the adjusted Moderate and Compressed IRRs do not form a strictly monotonic sequence; the categories should therefore not be interpreted as a calibrated ordinal safety scale.
4.3. Vehicle-Pair Contrasts Without Algebraic Circularity
To avoid algebraic circularity, minimum THW and closing speed are not used to explain the TTC-derived binary outcome. The event models therefore focus on vehicle-pair contrasts with clustered inference and show that the MC–Car contrast remains elevated across 0.6, 0.8, and 1.0 s TTC-defined criticality partitions. These ORs describe associations within a TTC-defined event set; they are not causal effects or crash-risk ratios.
4.4. Sampling Resolution and Numerical Uncertainty
The effective 7.5 Hz sampling frequency limits temporal resolution for very short events. The finding that 47.46% of s events were represented by a single sub-threshold sample precludes claims of highly resolved sub-second event histories. Downsampling reduced absolute event counts by approximately 31%, confirming that event inventories are sampling-sensitive. The unchanged site ranking under this diagnostic is reassuring for comparative screening but does not establish ground-truth TTC/THW accuracy. First-order error amplification was therefore reported only as numerical sensitivity because independent reference errors for gap and speed were unavailable.
4.5. Relationship to Crash Risk and External Validity
No crash records, injury outcomes, independently labelled near-crash events, or expert-coded evasive manoeuvres were used. The framework therefore does not validate TTC or THW as crash predictors and does not convert site ordering into expected crash frequency. Its outputs are trajectory-based interaction-screening priorities.
All six sites are uninterrupted arterial segments in Hanoi. The present evidence does not establish applicability to intersections, roundabouts, ramps, signalised conflict zones, other cities, or strongly lane-disciplined traffic. Transferability of the analytical procedure is distinct from transferability of the numerical TTC/THW distributions, operational THW boundaries, and empirical site ordering.
4.6. Limitations and Future Research
Four limitations define the scope of the revised conclusions. First, there is no external crash or independently coded near-crash validation. Second, only six Hanoi uninterrupted arterial segments are represented. Third, the 7.5 Hz trajectories provide limited resolution for very short events, and independent ground-truth trajectory errors were unavailable for absolute TTC/THW uncertainty propagation. Fourth, the event-level outcome remains TTC-derived even when alternative cut-points are used. Future work should combine higher-frequency or ground-truthed trajectories with crash, verified near-crash, or expert-coded evasive-event outcomes across intersections, roundabouts, ramps, and independent traffic networks.
5. Conclusions
This study analysed 371,864 vehicles and 2,977,401 validated leader–follower observations from 13.342 h of video at six motorcycle-dominated Hanoi arterials. The final event inventory contained 180,722 TTC-defined events, and the primary temporal inference used 799 complete non-overlapping 60 s windows.
The Site module showed that absolute TTC prevalence is reference-sensitive while comparative site priority can remain stable: the 1.5 and 2.4 s orderings were both S2 > S3 > S1 > S4 > S6 > S5. The time module showed a robust negative association between median THW and exposure-adjusted event rate, with a primary IRR of 0.8619 and similar overlapping-window and AR(1) GEE estimates. The interaction module showed stable vehicle-pair contrasts across 0.6, 0.8, and 1.0 s TTC-defined criticality partitions using follower-clustered inference, without treating minimum THW or closing speed as independent predictors of the TTC-derived outcome.
The framework should therefore be interpreted as a structured engineering-screening procedure rather than a crash-prediction model. TTC-based site comparison identifies where interaction patterns are comparatively prominent, THW-based monitoring identifies when persistent temporal compression is present, and vehicle-pair profiling identifies which interaction categories warrant closer review. The resulting site–time–interaction profile prioritises further investigation without claiming universal TTC/THW safety thresholds, causal effects, independently validated near-crash severity, or calibrated crash-risk scores.
Supplementary Materials
The following supporting information can be downloaded at https://www.mdpi.com/article/10.3390/vehicles8090203/s1, Figure S1: Complete TTC flagged-observation proportion scan from 0.1 to 4.0 s; Table S1: Sensitivity of the TTC-defined event inventory to the temporal bridge interval; Table S2: Robustness of the median-THW association across dependence-aware window specifications; Table S3: Follower-clustered vehicle-pair contrasts across TTC-defined criticality cut-points; Figure S2: THW-boundary sensitivity; Figure S3: Sampling-resolution sensitivity; Figure S4: Equal-exposure site-rank stability.
Author Contributions
Conceptualization, J.W. and X.L.; methodology, J.W., R.Y. and J.P.; software, J.W.; validation, J.W. and R.Y.; formal analysis, J.W. and J.P.; investigation, J.W. and X.L.; resources, X.L. and R.Y.; data curation, J.W. and R.Y.; literature review and translation, H.D. and W.Y.; writing—original draft preparation, J.W.; writing—review and editing, J.W., X.L., H.D., R.Y. and W.Y.; visualization, J.W.; supervision, X.L.; project administration, X.L.; funding acquisition, X.L. and J.P. All authors have read and agreed to the published version of the manuscript.
Funding
This research was funded by the Guangxi Higher Education Undergraduate Teaching Reform Project (2023JGA362), the Scientific Research Fund of Guangxi Science & Technology Normal University (GXKS2022ZD001, GXKS2024QNTD21, GXKS2025QNTD16), and the Guangxi Zhuang Autonomous Region Experimental Teaching Center Construction Project (Intelligent Vehicles and Advanced Manufacturing Experimental Teaching Center).
Institutional Review Board Statement
Not applicable.
Informed Consent Statement
Not applicable.
Data Availability Statement
The data presented in this study are available from the corresponding author upon reasonable request.
Conflicts of Interest
The authors declare no conflicts of interest. The funders had no role in the design of the study; in the collection, analyses, or interpretation of data; in the writing of the manuscript; or in the decision to publish the results.
References
- Hydén, C. The Development of a Method for Traffic Safety Evaluation: The Swedish Traffic Conflicts Technique; Bulletin 70; Department of Traffic Planning and Engineering, Lund Institute of Technology: Lund, Sweden, 1987. [Google Scholar]
- Zheng, L.; Ismail, K.; Meng, X. Traffic conflict techniques for road safety analysis: Open questions and some insights. Can. J. Civ. Eng. 2014, 41, 633–641. [Google Scholar] [CrossRef] [Scilit]
- Tarko, A.P. Surrogate measures of safety. In Safe Mobility: Challenges, Methodology and Solutions; Lord, D., Washington, S., Eds.; Transport and Sustainability; Emerald Publishing: Bingley, UK, 2018; Volume 11, pp. 383–405. [Google Scholar] [CrossRef] [Scilit]
- Arun, A.; Haque, M.M.; Bhaskar, A.; Washington, S.; Sayed, T. A systematic mapping review of surrogate safety assessment using traffic conflict techniques. Accid. Anal. Prev. 2021, 153, 106016. [Google Scholar] [CrossRef] [Scilit]
- Davis, G.A.; Hourdos, J.; Xiong, H.; Chatterjee, I. Outline for a causal model of traffic conflicts and crashes. Accid. Anal. Prev. 2011, 43, 1907–1919. [Google Scholar] [CrossRef] [Scilit]
- Saunier, N.; Sayed, T. Automated road safety analysis using video data. Transp. Res. Rec. 2007, 2019, 57–64. [Google Scholar] [CrossRef] [Scilit]
- Ismail, K.; Sayed, T.; Saunier, N. Automated analysis of pedestrian–vehicle conflicts: A context for before-and-after studies. Transp. Res. Rec. 2010, 2198, 52–64. [Google Scholar] [CrossRef] [Scilit]
- Sayed, T.; Zaki, M.H.; Autey, J. Automated safety diagnosis of vehicle–bicycle interactions using computer vision analysis. Saf. Sci. 2013, 59, 163–172. [Google Scholar] [CrossRef] [Scilit]
- Essa, M.; Sayed, T. Full Bayesian conflict-based models for real-time safety evaluation of signalized intersections. Accid. Anal. Prev. 2019, 129, 367–381. [Google Scholar] [CrossRef] [Scilit]
- Hu, Y.; Li, Y.; Huang, H.; Lee, J.; Yuan, C.; Zou, G. A high-resolution trajectory-data-driven method for real-time evaluation of traffic safety. Accid. Anal. Prev. 2022, 165, 106503. [Google Scholar] [CrossRef] [Scilit]
- Hayward, J.C. Near-miss determination through use of a scale of danger. Highw. Res. Rec. 1972, 384, 24–34. [Google Scholar]
- Allen, B.L.; Shin, B.T.; Cooper, P.J. Analysis of traffic conflicts and collisions. Transp. Res. Rec. 1978, 667, 67–74. [Google Scholar]
- Vogel, K. A comparison of headway and time to collision as safety indicators. Accid. Anal. Prev. 2003, 35, 427–433. [Google Scholar] [CrossRef] [Scilit]
- Johnsson, C.; Laureshyn, A.; De Ceunynck, T. In search of surrogate safety indicators for vulnerable road users: A review of surrogate safety indicators. Transp. Rev. 2018, 38, 765–785. [Google Scholar] [CrossRef] [Scilit]
- Lu, C.; He, X.; van Lint, H.; Tu, H.; Happee, R.; Wang, M. Performance evaluation of surrogate measures of safety with naturalistic driving data. Accid. Anal. Prev. 2021, 162, 106403. [Google Scholar] [CrossRef] [Scilit]
- Nadimi, N.; Ragland, D.R.; Mohammadian Amiri, A. An evaluation of time-to-collision as a surrogate safety measure and a proposal of a new method for its application in safety analysis. Transp. Lett. 2020, 12, 491–500. [Google Scholar] [CrossRef] [Scilit]
- Nadimi, N.; NaserAlavi, S.S.; Asadamraji, M. Calculating dynamic thresholds for critical time to collision as a safety measure. Proc. Inst. Civ. Eng. Transp. 2022, 175, 403–412. [Google Scholar] [CrossRef] [Scilit]
- Sukhanya, K.; Shilpa, R.N.; Bhavathrathan, B.K. Investigating surrogate safety measures’ threshold consistency on different types of curves. J. Transp. Saf. Secur. 2025, 17, 633–645. [Google Scholar] [CrossRef] [Scilit]
- Nguyen, L.X.; Hanaoka, S.; Kawasaki, T. Describing non-lane-based motorcycle movements in motorcycle-only traffic flow. Transp. Res. Rec. 2012, 2281, 76–82. [Google Scholar] [CrossRef] [Scilit]
- Nguyen, L.X.; Hanaoka, S.; Kawasaki, T. Traffic conflict assessment for non-lane-based movements of motorcycles under congested conditions. IATSS Res. 2014, 37, 137–147. [Google Scholar] [CrossRef] [Scilit]
- Jocher, G.; Chaurasia, A.; Qiu, J. Ultralytics YOLO. 2023. Available online: https://github.com/ultralytics/ultralytics (accessed on 13 July 2026).
- Aharon, N.; Orfaig, R.; Bobrovsky, B.-Z. BoT-SORT: Robust associations multi-pedestrian tracking. arXiv 2022, arXiv:2206.14651. [Google Scholar] [CrossRef] [Scilit]
- Savitzky, A.; Golay, M.J.E. Smoothing and differentiation of data by simplified least squares procedures. Anal. Chem. 1964, 36, 1627–1639. [Google Scholar] [CrossRef] [Scilit]
- Steinmaßl, M.; Beeking, M.; Troth, N.; Rehrl, K. A framework for reliable traffic surrogate safety assessment based on multi-object tracking data. Traffic Saf. Res. 2025, 9, e000123. [Google Scholar] [CrossRef] [Scilit]
- Nagahama, A.; Wada, T.; Yanagisawa, D.; Nishinari, K. Detection of leader–follower combinations frequently observed in mixed traffic with weak lane discipline. Phys. A 2021, 570, 125789. [Google Scholar] [CrossRef] [Scilit]
- Kulkarni, M.M.; Chaudhari, A.A.; Srinivasan, K.K.; Chilukuri, B.R.; Treiber, M.; Okhrin, O. Leader–follower identification with vehicle-following calibration for non-lane-based traffic. Transp. Res. Part C Emerg. Technol. 2025, 171, 104940. [Google Scholar] [CrossRef] [Scilit]
- Li, Y.; Wu, D.; Lee, J.; Yang, M.; Shi, Y. Analysis of the transition condition of rear-end collisions using TTC index and vehicle trajectory data. Accid. Anal. Prev. 2020, 144, 105676. [Google Scholar] [CrossRef] [Scilit]
- Ecker, H.; Wassermann, J.; Hauer, G.; Ruspekhofer, R.; Grill, M. Braking deceleration of motorcycle riders. In Proceedings of the International Motorcycle Safety Conference, Orlando, FL, USA, 1–4 March 2001. [Google Scholar]
- Huertas-Leyva, P.; Nugent, M.; Savino, G.; Pierini, M.; Baldanzini, N.; Rosalie, S. Emergency braking performance of motorcycle riders: Skill identification in a real-life perception–action task designed for training purposes. Transp. Res. Part F Traffic Psychol. Behav. 2019, 63, 93–107. [Google Scholar] [CrossRef] [Scilit]
- Songchitruksa, P.; Tarko, A.P. The extreme value theory approach to safety estimation. Accid. Anal. Prev. 2006, 38, 811–822. [Google Scholar] [CrossRef] [Scilit]
- Zheng, L.; Ismail, K.; Meng, X. Freeway safety estimation using extreme value theory approaches: A comparative study. Accid. Anal. Prev. 2014, 62, 32–41. [Google Scholar] [CrossRef] [Scilit]

Disclaimer/Publisher’s Note: The statements, opinions and data contained in all publications are solely those of the individual author(s) and contributor(s) and not of MDPI and/or the editor(s). MDPI and/or the editor(s) disclaim responsibility for any injury to people or property resulting from any ideas, methods, instructions or products referred to in the content. |
© 2026 by the authors. Licensee MDPI, Basel, Switzerland. This article is an open access article distributed under the terms and conditions of the Creative Commons Attribution (CC BY) license.