


Abstract
In response to the limitations of the conventional fixed-rate pricing model for freeways in addressing spatiotemporal imbalances in traffic flow distribution and low road network resource utilization, as well as the neglect of Vehicle Collision probability in existing differentiated pricing frameworks, this study analyzes the underlying relationship between road traffic saturation and collision probability. On this basis, a bi-level programming model for differentiated freeway pricing that explicitly accounts for Vehicle Collision probability is developed. The upper-level model maximizes the economic benefit of freeway operations while incorporating vehicle-collision-probability-related costs, whereas the lower-level model minimizes vehicle travel impedance, including both travel cost and time delays induced by collisions. A hybrid algorithm combining particle swarm optimization (PSO) and pattern search (PS) is employed to solve the optimal pricing scheme across different vehicle types (passenger cars and trucks), road segments, and time periods. A nested Logit model is introduced to characterize travelers’ route choice behavior between alternative routes, thereby capturing the traffic redistribution effect induced by pricing rate adjustments. Empirical data from a section of the Shenyang–Haikou Freeway corridor in China for the year 2024 are used for model calibration and validation. The results indicate that following the optimized pricing scheme, the freeway’s monthly net revenue increased by 9.44%, truck and passenger car traffic volumes rose by 8.59% and 6.12%, respectively, and total segment traffic volume increased by 7.18%. The saturation of the freeway increased from approximately 0.18 to about 0.32, while that of the parallel arterial decreased from approximately 0.9 to about 0.67, indicating a more balanced traffic flow distribution across the network and a substantial reduction in Vehicle Collision probability. These findings demonstrate that the proposed method can effectively balance the trade-offs among operational revenue, traffic efficiency, and driving safety, providing both theoretical support and a quantitative tool for the scientific formulation of differentiated freeway pricing schemes.
1. Introduction
With the continuous expansion of freeway networks and the rapid growth of the vehicle fleet, the spatiotemporal imbalance in traffic flow distribution across regional road networks has become increasingly prominent. Various external factors further exacerbate these spatiotemporal fluctuations, such as public holidays, weekday–weekend differences, seasonal variations, and special events, all of which collectively contribute to the phenomenon whereby certain freeway segments experience congestion during peak hours while remaining underutilized during off-peak periods, whereas parallel national and provincial highways are chronically overloaded [1]. This imbalance leads to low resource utilization efficiency and elevated maintenance costs for freeways, and exacerbates congestion and the frequency of vehicle collisions on parallel arterials [2]. The conventional fixed-rate pricing model is ill-equipped to accommodate complex variations in travel demand and cannot effectively leverage price mechanisms to guide vehicle diversion and off-peak travel. To address this challenge, China’s Ministry of Transport, together with the National Development and Reform Commission and the Ministry of Finance, jointly issued the Implementation Plan for the Comprehensive Promotion of Differentiated Toll Pricing Policies on Freeways in 2021, encouraging local authorities to adopt differentiated pricing models—by segment, vehicle type, time period, and entry/exit point—tailored to regional network structures and operational characteristics, with the aim of improving freeway network efficiency and service quality [3].
Extensive research on differentiated freeway pricing has been conducted worldwide, which can be broadly categorized into two groups. The first category focuses on pricing methodologies, with an emphasis on policy-level implementation and effectiveness evaluation. Regarding pricing models, Wu et al. [2] systematically reviewed the implementation pathways and key technologies of six primary differentiated pricing modes: segment-based, time-of-day-based, vehicle-type-based, direction-based, entry/exit-based, and payment-method-based. Farias et al. [4] provided a comprehensive review of dynamic toll pricing algorithms, operational strategies, equity mechanisms, and funding models for toll roads. Yan et al. [5] systematically reviewed existing research on differentiated freeway pricing and identified four core steps for policy implementation. In terms of effectiveness evaluation, Shen et al. [6] developed an evaluation index system based on the entropy method and value function method to conduct graded assessments of differentiated pricing implementation outcomes. Zhu et al. [7] constructed an optimization model for differentiated pricing using operator net revenue and traveler impedance as evaluation metrics. Liu et al. [8] employed random forest models to analyze the influence of public satisfaction on the effectiveness of differentiated pricing implementation.
The second category pertains to pricing model research, which focuses on developing mathematical formulations for toll rate optimization; among these, bi-level programming has emerged as the predominant framework due to its capacity to capture the Stackelberg game between road operators and users. Zhang et al. [9] introduced elastic demand into the bi-level framework, enhancing the model’s adaptability to dynamic traffic demand fluctuations. Li et al. [10] proposed a bi-level programming model for optimal toll design based on heterogeneous household residential location equilibrium. Lu et al. [11] proposed an optimization model for freeway concession contracts incorporating pavement deterioration and maintenance costs, finding that maintenance expenditures significantly influence optimal toll strategies. Yan et al. [12], drawing on price elasticity of demand, formulated a two-part tariff model to elucidate the economic relationship between toll rates and traffic volumes. Wang et al. [13] developed a multi-class traffic assignment model with elastic demand to examine the effects of link tolls on equilibrium flows. Swami et al. [14] constructed a travel choice behavior model under differentiated freeway pricing based on price elasticity. Cheng et al. [15] integrated multi-user stochastic user equilibrium assignment into the lower-level model, validating the practical value of multi-modal differentiated toll schemes. Kong et al. [16] employed latent class Multinomial Logit (MNL) and Nested Logit (NL) models to classify truck drivers into “price-sensitive,” “captive,” and “loyal” groups, confirming the differential weighting of toll rates across decision-maker categories. Chen et al. [17] developed a data-driven segment- and vehicle-type-based bi-level pricing methodology using Electronic Toll Collection (ETC) gantry data, achieving significant improvements in network operational efficiency. Wang et al. [18] developed a bi-level model incorporating carbon emission reduction benefits into the freeway benefit framework, using the shadow price method to quantify carbon trading prices, thereby achieving coordinated optimization of economic and environmental outcomes. Yu et al. [19] embedded group equity and spatiotemporal metrics into both the objective function and constraints of the bi-level model, exploring the trade-off between efficiency and fairness in differentiated pricing design. Dong et al. [20] combined structural equation modeling with latent class Logit models to reveal the mechanisms through which different pricing strategies influence the route choice behavior of heterogeneous users. Yan et al. [21], based on consumer surplus theory, established a network operator surplus maximization model incorporating time and monetary costs, deriving optimal discount rate ranges for various vehicle types.
Notably, changes in toll rates substantially influence traffic flow distribution, and traffic volume is related to vehicle collision rates through complex nonlinear relationships. Previous studies have confirmed the nonlinear relationship between saturation and crash rate, noting that at low saturation levels, high-speed travel tends to induce single-vehicle crashes, whereas at high saturation levels, increased traffic density and frequent lane changes lead to a rise in multi-vehicle collisions [22,23]. Subsequent research further verified the U-shaped relationship between the two variables and identified saturation as a critical traffic-flow parameter affecting safety [24,25]. On this basis, Tian et al. [26] proposed the concept of dynamic risk saturation, finding that it initially increases and then decreases with saturation, better reflecting the dynamic nature of safety risk. Yu et al. [27] employed spatial autoregressive quantile regression and found that the influence of regional factors on crash rates exhibits a U-shaped pattern across the distribution tails. Samerei et al. [28] also confirmed, using ensemble learning methods, that saturation is a significant variable influencing the severity of stacked crashes. Despite the well-established U-shaped relationship between Volume-to-Capacity ratio (V/C) ratio and vehicle collision rates, existing differentiated pricing research has predominantly focused on optimizing operational efficiency and economic benefits. The vast majority of pricing models continue to target operator revenue maximization and user travel cost minimization, rarely incorporating Vehicle Collision probability as a core consideration in rate optimization. Mannering et al. [29] cautioned that neglecting crash risk may lead to pricing strategies that improve efficiency at the expense of safety, resulting in a net loss of social welfare. Consequently, it is imperative to integrate Vehicle Collision probability as a critical constraint or model component in the formulation of differentiated pricing strategies to achieve co-optimization of economic performance and traffic safety.
However, before incorporating traffic safety into the freeway toll optimization model, it is necessary to first clarify the connotation of the core concept of “risk.” Aven [30] provided a systematic historical review and analysis of development trends in the definition of the risk concept, noting that over the past 15 to 20 years, the definition of risk has gradually shifted from a relatively narrow perspective based on probability and expected values toward a broader way of thinking that emphasizes events, consequences, and uncertainty. Aven also emphasized that there is a fundamental distinction between the concept of risk itself and the methods used to describe and measure. The above conceptual framework, the “vehicle collision probability” examined in this study corresponds, within the broad concept of risk, to the dimension of the likelihood of collision occurrence—that is, the “probability of event occurrence” element in the definition of risk. The severity of the consequences of collisions (such as casualties and property damage), on the other hand, belongs to the “consequence” dimension of the risk definition. Constrained by data availability and model complexity, the present study focuses its analytical scope on the collision probability dimension, adopting the crash rate per million vehicle-kilometers per hour as the core metric.
In light of these gaps, this paper develops an optimization model for differentiated freeway pricing that explicitly accounts for Vehicle Collision probability. The remainder of this paper is organized as follows. Section 2 presents the modeling approach for differentiated pricing considering Vehicle Collision probability, including definitions of foundational indicators for saturation and crash rate, polynomial fitting, and correlation assessment. Section 3 describes the hybrid particle swarm optimization (PSO)-pattern search (PS) algorithm for solving the model. Section 4 presents a case study on a segment of the Shenyang–Haikou Freeway and its parallel national highway, including parameter calibration, result analysis, and comparison with the current scheme. Section 5 concludes the paper, discusses limitations, and outlines directions for future research.
2. Modeling Approach for Differentiated Pricing
2.1. Foundational Definitions of Saturation and Crash Rate
Capacity is defined as the maximum hourly traffic flow rate (in vehicles or persons) that can reasonably be expected to traverse a lane, a uniform cross-section, or an intersection under prevailing roadway, traffic, control, and environmental conditions over a specified time period. Based on functional characteristics, capacity is classified into three types: actual capacity, basic capacity, and design capacity [31,32].
The capacity adopted in this study is the actual capacity of the freeway. Under existing roadway conditions, the actual capacity for one direction with m lanes is given by [33]
where denotes the basic capacity (pcu/h/lane), m is the number of lanes in one direction (lane), is the roadside interference correction factor, is the driver population characteristic coefficient (larger values indicate greater familiarity with the roadway), and is the traffic composition correction factor, expressed as [31]
where is the proportion of total traffic volume accounted for by vehicle type i (e.g., medium or heavy vehicles), and is the passenger car equivalent factor for vehicle type i.
Road saturation is defined as the ratio of actual traffic volume to capacity, serving as a key indicator of traffic load level and congestion severity. It is a core metric for evaluating freeway level of service and operational status [34]. Saturation is computed as
where Q denotes the actual traffic volume (pcu).
The road crash rate is a fundamental statistical metric for assessing Vehicle Collision probability. It generally refers to the probability or frequency of traffic crashes or resulting casualties occurring within a defined spatial and temporal scope, used to characterize the safety risk level of a specific region, roadway, or location. This study adopts the crash rate per million vehicle-kilometers per hour, calculated as
where is the total number of crashes on the study segment during time period t (case), T is the total number of hours in the analysis period, is the total traffic volume during period t (pcu), L is the segment length (km), and is the time interval (standardized to 1 h).
2.2. Polynomial Fitting and Correlation Assessment
To quantitatively characterize the nonlinear dependence between saturation S and the crash rate per million vehicle-kilometers per hour , and to establish a general procedure for determining whether any given set of discrete observed data conforms to this relationship, this section employs polynomial regression analysis. The mathematical formulation of the fitted model and the specific steps for correlation assessment are presented below.
2.2.1. Polynomial Fitting Model
Assuming a U-shaped relationship between crash rate and saturation S, a quadratic polynomial is adopted as the basic functional form
where a, b, and c are parameters to be estimated.
Based on sample data , the parameters are estimated using the least squares method, with the objective function
where denotes the saturation of the k-th sample, and is the corresponding observed crash rate (calculated on a per million vehicle-kilometer per hour basis).
Taking the first derivative of Equation (5) and setting it to zero yields the saturation value corresponding to the theoretical minimum crash rate:
If , the curve exhibits a U-shape, and represents the saturation level associated with the lowest safety risk.
2.2.2. Correlation Assessment Procedure for Discrete Data Points
For any set of independently observed discrete points , the degree of conformity to the relationship described by Equation (5) can be determined through the following steps:
Substitute into the estimated Equation (5) to obtain the predicted crash rate . Since is objectively known, the relative residual is selected as the primary diagnostic indicator:
Based on the residual distribution characteristics of the fitted sample, data points are categorized into three grades according to the following criteria:
- (1)
- If , the data point is considered to exhibit significant correlation with the fitted relationship (consistent with the U-shaped safety risk trend).
- (2)
- If , it is regarded as weakly correlated, potentially influenced by localized anomalous factors (e.g., adverse weather, work zones).
- (3)
- If , it is deemed uncorrelated, warranting separate investigation of the underlying traffic or crash anomalies.
The coefficient of determination between all observed points and the corresponding predicted values is computed as
where is the mean of the observed crash rates.
- (1)
- If , the fit is highly correlated and the model is applicable;
- (2)
- If , the fit is moderately correlated and the model is generally applicable, possibly with refinement using additional variables;
- (3)
- If , the fit is weakly correlated, and the model should be reconsidered or the data re-examined.
2.3. Construction of the Bi-Level Programming Model
In freeway operations, road authorities aim to establish a novel pricing system to achieve efficient network-wide resource allocation and improve service levels and operational efficiency. Road operators seek reasonable financial returns to sustain operations, while travelers expect reduced travel expenditure and expedient journeys. Given the divergent and independent objectives of these three stakeholders, this study adopts a bi-level programming framework to optimize freeway toll rates. The upper-level model maximizes freeway economic benefits, while the lower-level model minimizes travel impedance, with traffic volumes at different toll levels serving as the linking variables between the two levels.
2.3.1. Economic Benefit Maximization Model
The upper-level model is formulated to maximize the net economic benefit of the freeway, defined as the difference between total operating revenue and total costs. Revenue is primarily derived from toll collections, while costs include construction, management and operation, maintenance, and safety expenditures.
The primary revenue source for freeway operators is toll collection. Total toll revenue is calculated based on traffic volumes, toll rates, and travel distances across segments, vehicle types, and time periods. The average daily toll revenue is expressed as
where i denotes the i-th segment (i = 1, 2, 3… I), j denotes the j-th vehicle type (j = 1, 2, 3… J), t denotes the t-th time period (t = 1, 2, 3… T), is the traffic volume of vehicle type j on segment i during period t (pcu), is the toll rate (RMB/vehicle-km) for vehicle type j on segment i during period t, and is the length of segment i (km).
Construction cost is defined as the cumulative total construction investment, comprising both self-financed funds and bank loans at the time of construction. In this study, the interest payments on bank loans are amortized over the toll collection period and allocated on a monthly basis as current-period costs. The average daily construction cost, considering the interest rate, is calculated as
where is the self-financed fund (RMB), is the bank loan (RMB), is the loan interest rate, is the toll collection period (years), is the final year of toll collection, and is the year of freeway opening.
Management and operation costs refer to the expenditures associated with daily operations, including personnel salaries for toll collection, road maintenance, equipment repair, and administration, as well as associated training, travel, and office expenses. These costs are influenced by regional economic development levels, average wages, and actual operational conditions, and remain relatively stable over time.
After a freeway is opened to traffic, pavement and facilities gradually deteriorate with age. To ensure safe and efficient vehicle passage, routine maintenance and periodic rehabilitation are necessary. Maintenance activities include road sweeping, landscaping, and ancillary facility upkeep. Maintenance costs are generally influenced by traffic volume and years in service.
The routine maintenance cost model is specified as
where is the routine maintenance cost coefficient, is the lane correction factor, is the fixed asset investment price index, is the years in service (years), is the traffic volume (pcu), is the bridge–tunnel ratio, is a dummy variable for pavement type, and are coefficients of the multiple linear regression model.
The major rehabilitation cost model is
where is the empirically calibrated conversion coefficient.
Thus, the total maintenance and rehabilitation cost is:
Freeway safety costs refer to the total resources expended over the entire operational lifecycle to improve driving safety conditions, prevent crashes, and bear the consequences of crashes that do occur. These costs are divided into two categories: proactive safety investment costs and crash-induced loss costs. Proactive costs include expenditures on safety facility installation, traffic safety management, and hazard mitigation. Crash loss costs encompass direct economic damages, casualty compensation, emergency repairs, and indirect losses from reduced capacity and travel delays, and are influenced by segment crash rates, traffic volumes, and segment length.
The proactive safety investment cost model is
where is the average daily safety investment cost per unit length (RMB).
The crash loss cost model is
where denotes the proportions of minor, general, and major crashes; are the average economic losses associated with minor, general, and major crashes (RMB); is the traffic volume on segment i during period t (pcu); and is the corresponding crash rate per million vehicle-kilometers per hour for segment i during period t.
Thus, the total safety cost is:
The average daily total freeway operating cost is therefore
where denotes the average daily management and operation cost (RMB).
2.3.2. Travel Impedance Minimization Model
The lower-level model is formulated to minimize travelers’ travel impedance, which comprises both time costs and monetary costs. Travelers tend to select the route with the least impedance. For differentiated toll schemes by segment, vehicle type, and time period, the impedance for each vehicle type on each segment during each period must be separately calculated.
The travel time impedance for vehicle type j on segment i during period t is given by
where is the value-of-time coefficient (RMB/min); , with being the regional gross domestic product (RMB), the regional population, and the average working hours (min); is the free-flow travel time (min); is the average vehicle speed on segment i (m/min); are calibration parameters; are the average time delays associated with minor, general, and major crashes (min); and is the capacity of segment i (pcu/h).
The travel monetary impedance for vehicle type j on segment i during period t is:
2.3.3. Traffic Flow Assignment Model
Travel costs significantly influence travelers’ route choice behavior. In the freeway context, travel costs are primarily composed of time costs and monetary costs. In selecting the study corridor, it is assumed that there exists a parallel national highway serving as an alternative route to the freeway. By adjusting freeway toll rates, total travel costs can be altered, thereby redistributing traffic between the freeway and its parallel alternative. This paper combines the travel time and monetary impedance components from the lower-level model to construct impedance functions. A nested Logit model with a nested structure is introduced to account for correlation in route choice. Assuming the utility function , where the deterministic component includes travel time impedance and monetary impedance , and the random component follows a generalized extreme value distribution, the probability of route being chosen for Origin-Destination (OD) pair (r,s) is expressed as
where denotes the probability that vehicle type j chooses route (freeway or parallel national highway) during period t; is the fixed utility; is the perception parameter; is the nest-specific dispersion parameter; and is the set of alternatives within nest m.
3. Hybrid Algorithm for Model Solution
Based on Equations (10)–(18), the economic benefit maximization model function is:
Based on Equations (19) and (20), the travel impedance minimization model function is:
Subject to the constraint
where and denote the lower and upper bounds of toll rate adjustments, respectively.
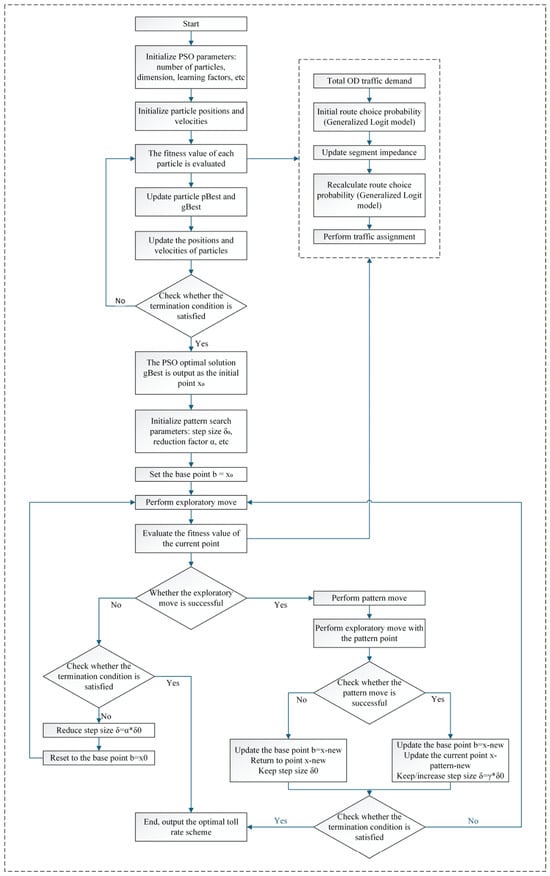
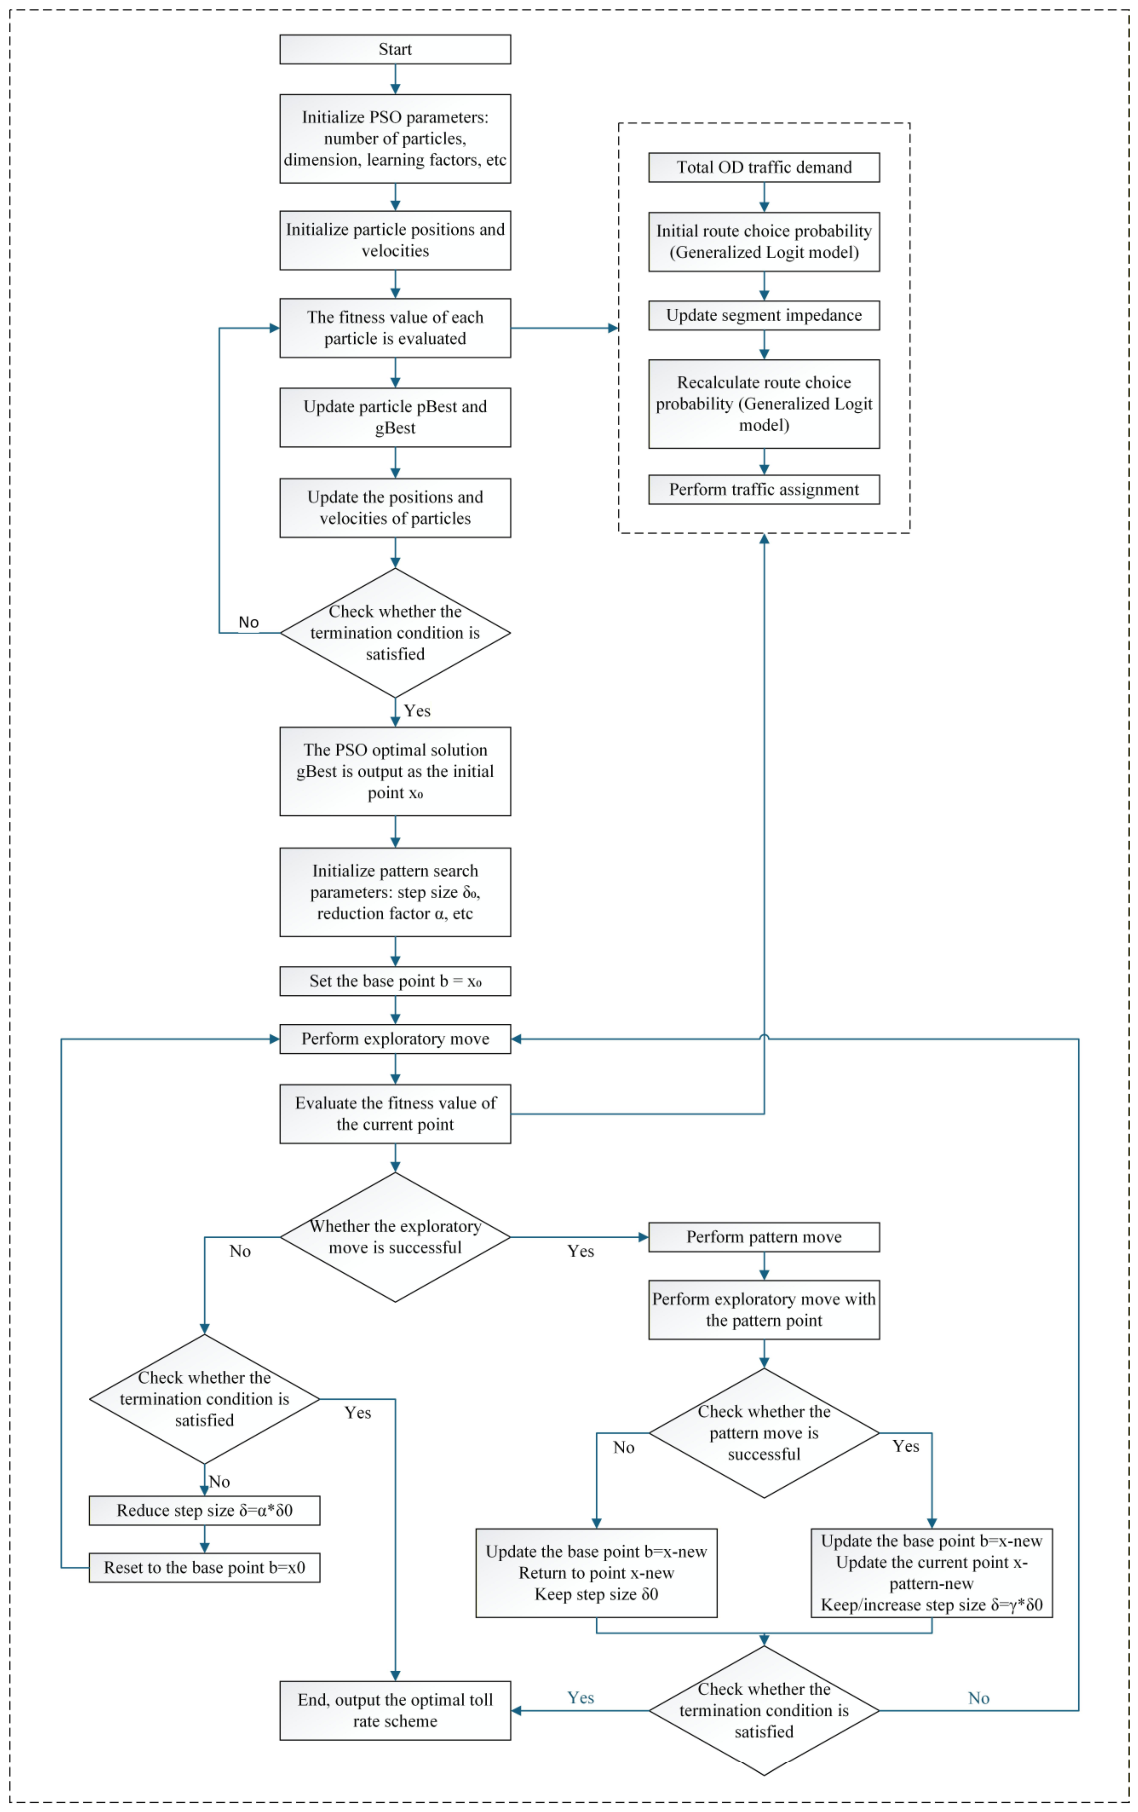
Bi-level programming models generally possess inherent properties such as nestedness and non-convexity, making it difficult for any single algorithm to balance solution efficiency, accuracy, and feasibility. Therefore, this paper designs a hybrid algorithm tailored to the characteristics of the developed bi-level model. The PSO algorithm is first employed for global coarse search to identify high-quality solution regions, followed by the pattern search method for local fine-tuning to improve solution quality and convergence speed. The PSO-PS solution procedure is illustrated in Figure 1.
Figure 1.
Flowchart of the Particle Swarm Optimization–Pattern Search (PSO-PS) Method.
The key steps of the PSO-PS algorithm for solving the bi-level model are as follows:
Step 1: Initialize parameters and particle swarm.
Set PSO parameters: population size N = 50, learning factors , inertia weight w = 0.9, maximum iterations = 150. Initialize particle positions (i.e., the toll rate matrix across segments, vehicle types, and time periods) randomly within a specified range around the current toll rates.
Step 2: Evaluate the upper-level objective function.
Substitute the toll scheme represented by each particle into the upper-level model and compute the freeway net revenue R as the fitness value for that particle.
Step 3: Update particle states.
Adjust particle velocities and positions according to the PSO update equations, and update the individual best pbest and global best gbest.
Step 4: Check PSO convergence.
If the global best solution shows no significant improvement for 20 consecutive generations, or if the maximum iteration count is reached, terminate the PSO phase and proceed to the pattern search phase.
Step 5: Pattern search local optimization.
Using the PSO-output global best gbest as the initial point, construct pattern vectors and evaluate the objective function at new candidate solutions; accept and update if an improved solution is found.
Step 6: Iterate and check convergence.
Repeat Step 5, progressively reducing the step size, until the change in the objective function value falls below a preset threshold , or until the maximum number of local search iterations is reached.
Step 7: Output the optimal toll rate scheme.
Output the final optimized differentiated toll rate matrix and validate through traffic assignment using the lower-level model.
4. Case Study
4.1. Study Area Road Network Data Processing and Scheme Design
This study selects the Xiliu–Shilihe segment of the Shenyang–Haikou Freeway and its adjacent National Highway 202 as the study corridor. The freeway segment is 97.2 km in length, while the parallel national highway is 104.9 km long. Both road sections satisfy the criteria for the study area. Based on traffic survey data from 1 September 2024–30 September 2024 (collected in accordance with the Ministry of Transport’s Statistical Survey System for Highway Traffic Conditions [35], the traffic flow characteristics of the regional network are analyzed to facilitate the targeted design of differentiated pricing schemes.
4.1.1. Regional Network Traffic Survey Data Processing
Along the Xiliu–Shilihe segment of the Shenyang–Haikou Freeway, there are 12 toll stations. Using these toll stations as nodes, the segment is divided into 11 basic freeway sections (with corresponding divisions maintained for the parallel national highway). Traffic volumes are aggregated by segment, vehicle type, and time period for both the freeway and the national highway based on the survey data. Preliminary analysis indicates that the proportion of special-purpose vehicles and motorcycle in the total traffic stream is negligible; therefore, these are excluded. Ultimately, four passenger car types and six truck types are selected for analysis. The traffic volume statistics by segment, vehicle type, and time period are presented in Table 1, Table 2 and Table 3, respectively.
Table 1.
Traffic Volumes by Segment.
Table 2.
Traffic Volumes by Vehicle Type.
Table 3.
Traffic Volumes by Time Period.
4.1.2. Differentiated Pricing Scheme Design
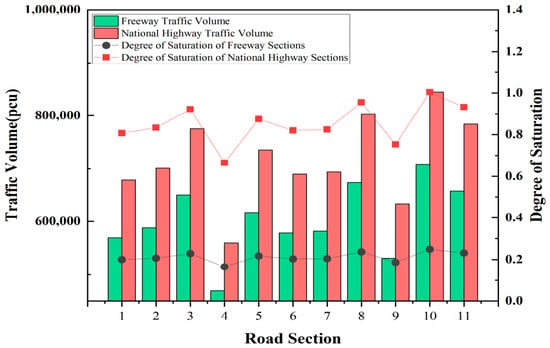
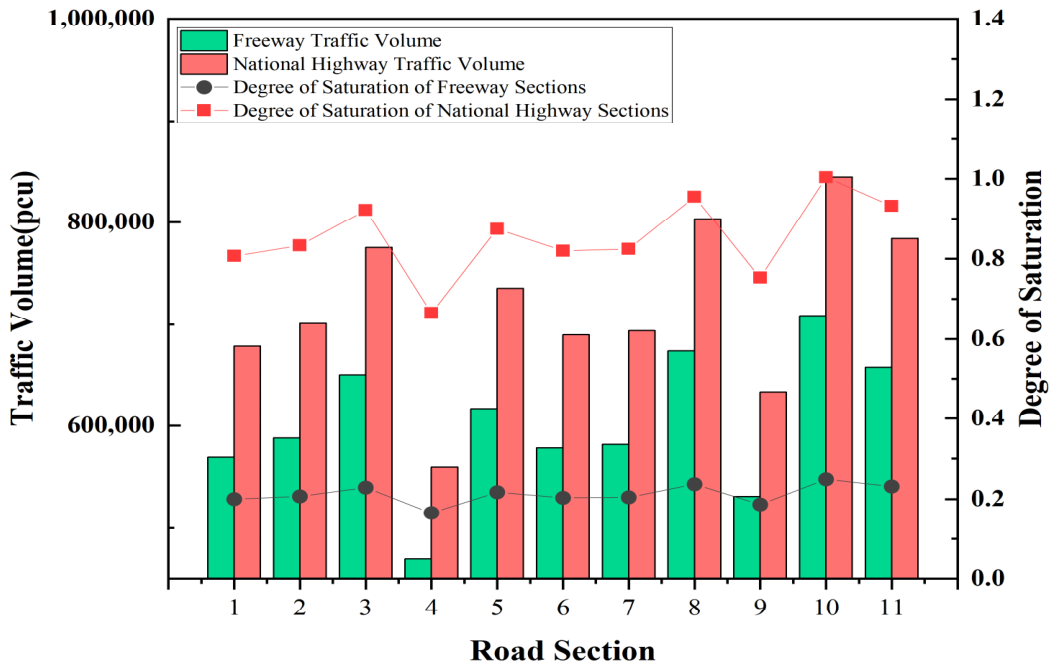
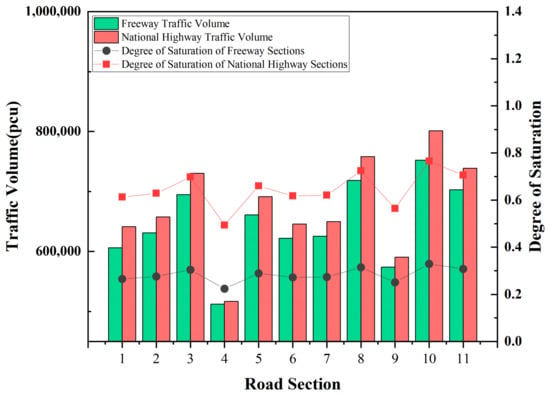
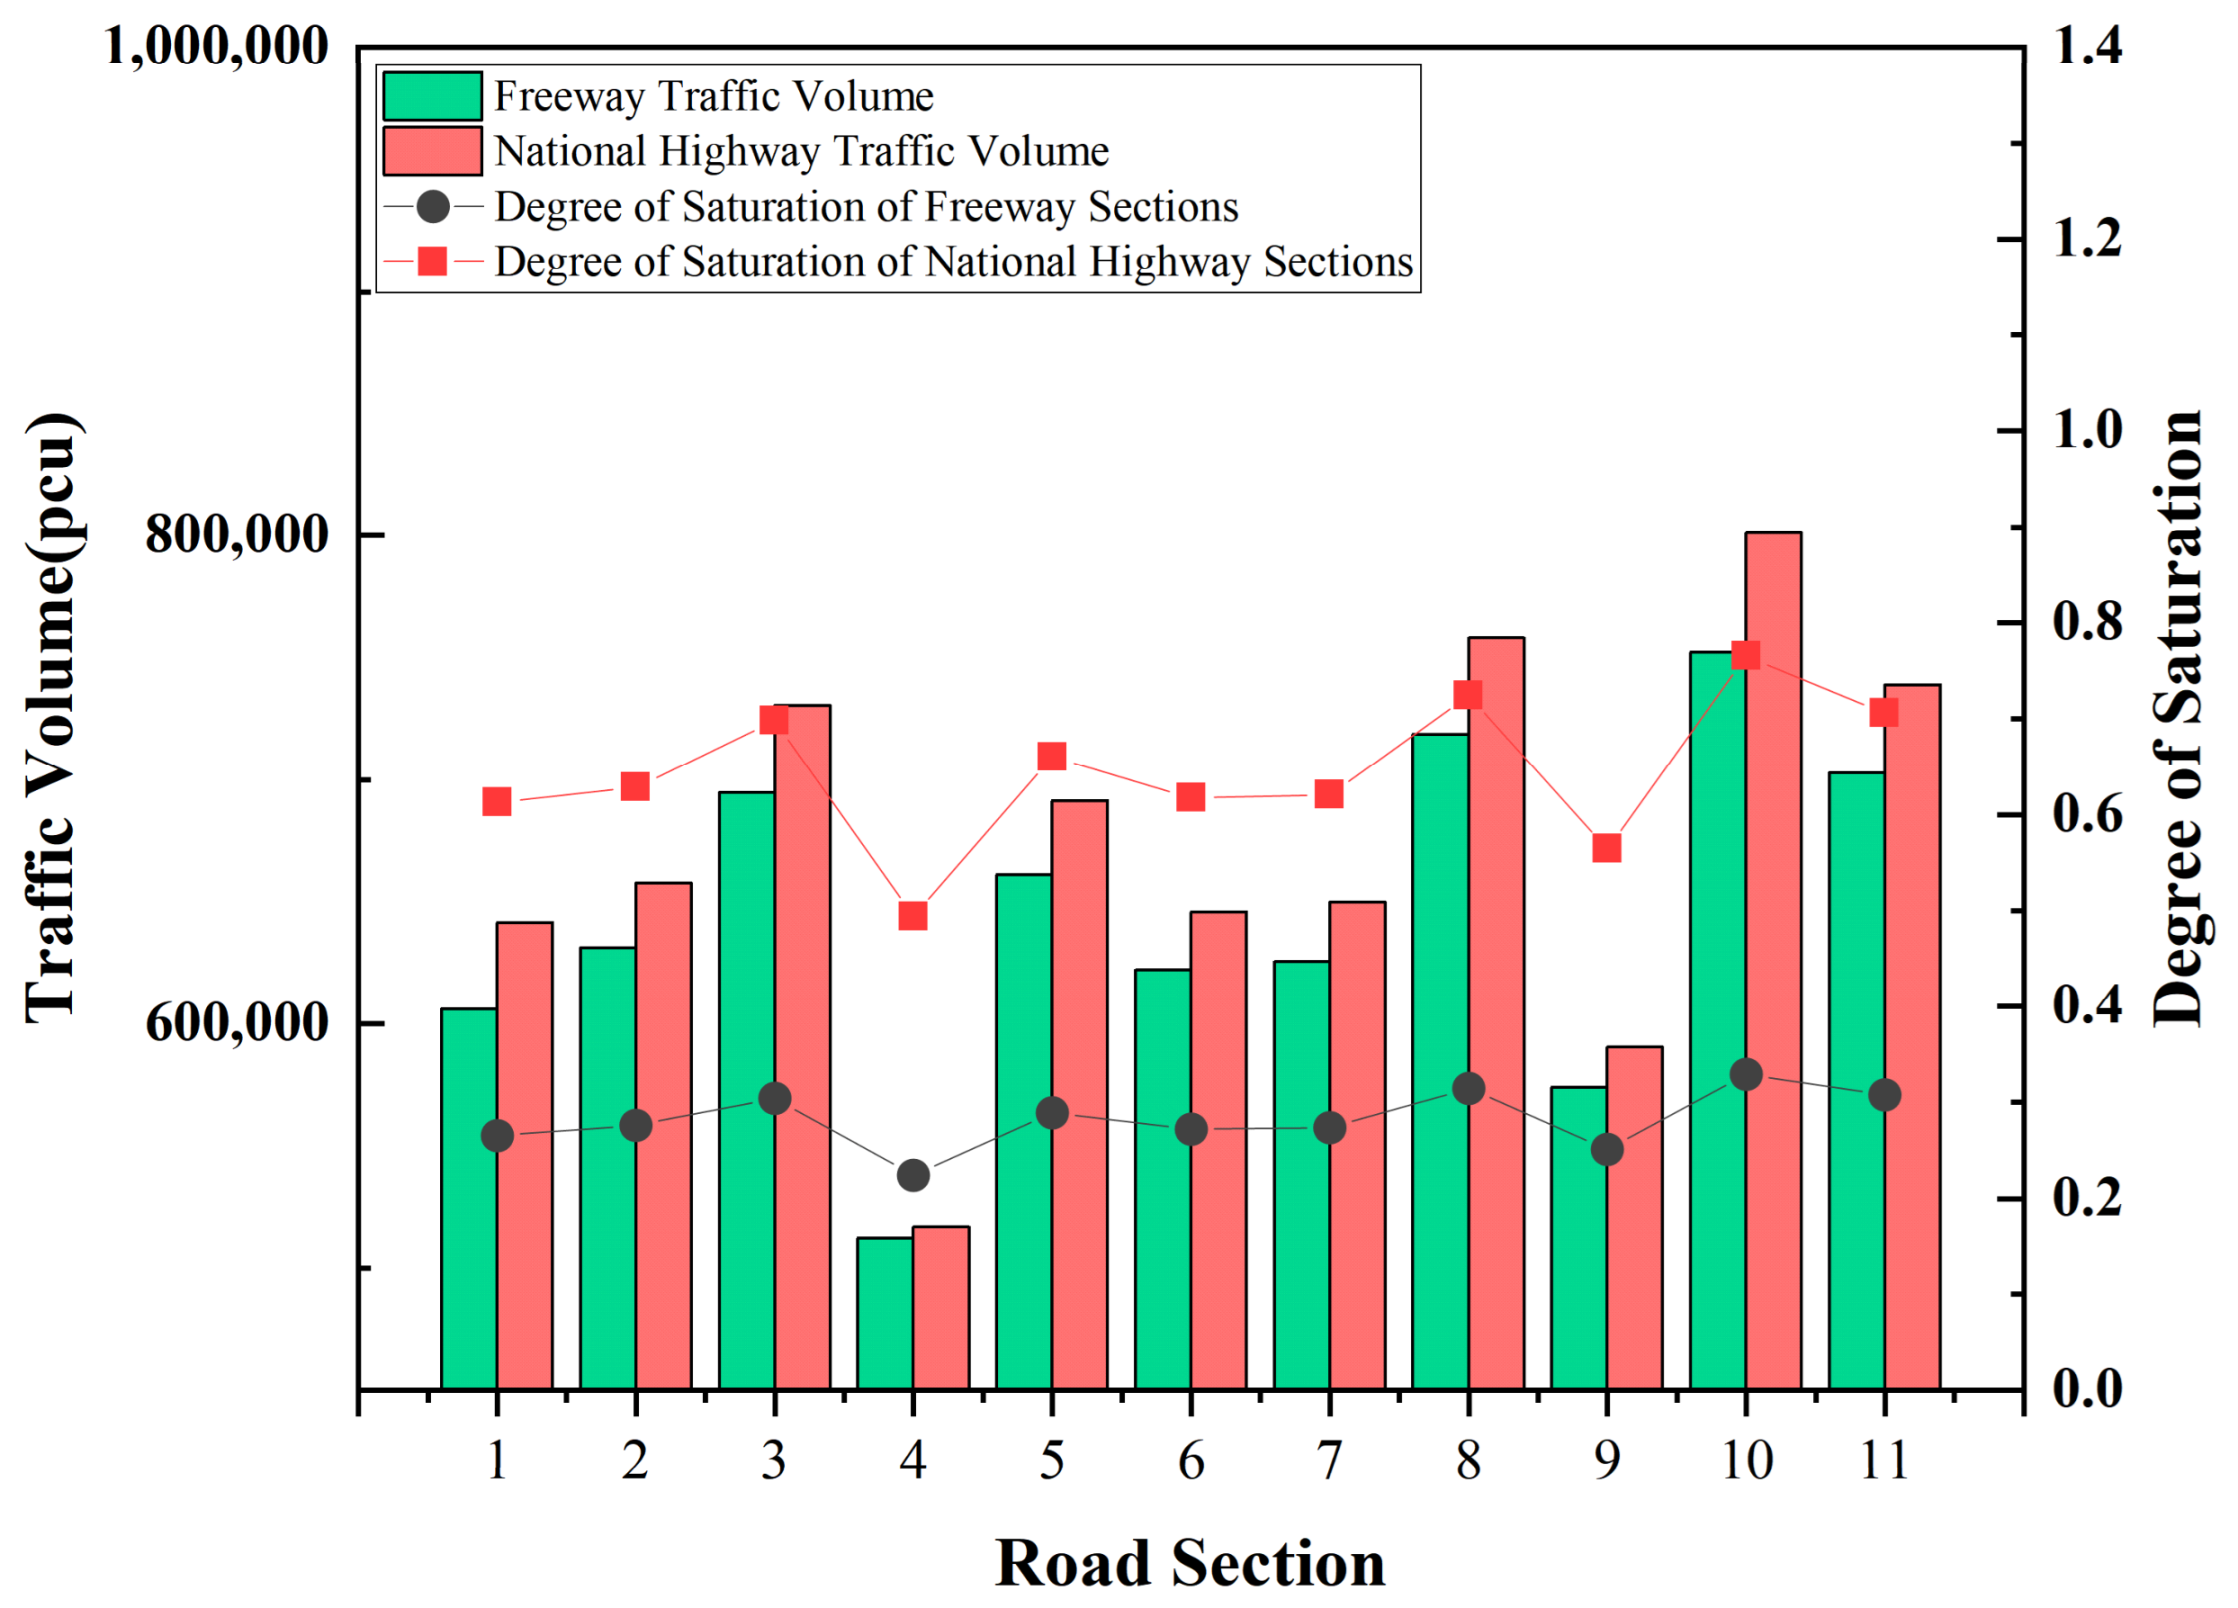
Based on the traffic survey data for the freeway and its parallel national highway, a comparative analysis of segment-level traffic volumes and saturation is conducted, with results shown in Figure 2.
Figure 2.
Comparison of Traffic Volumes and Saturation between the Freeway and Parallel National Highway.
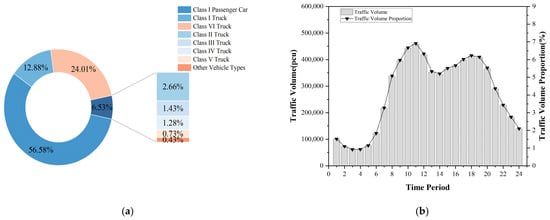
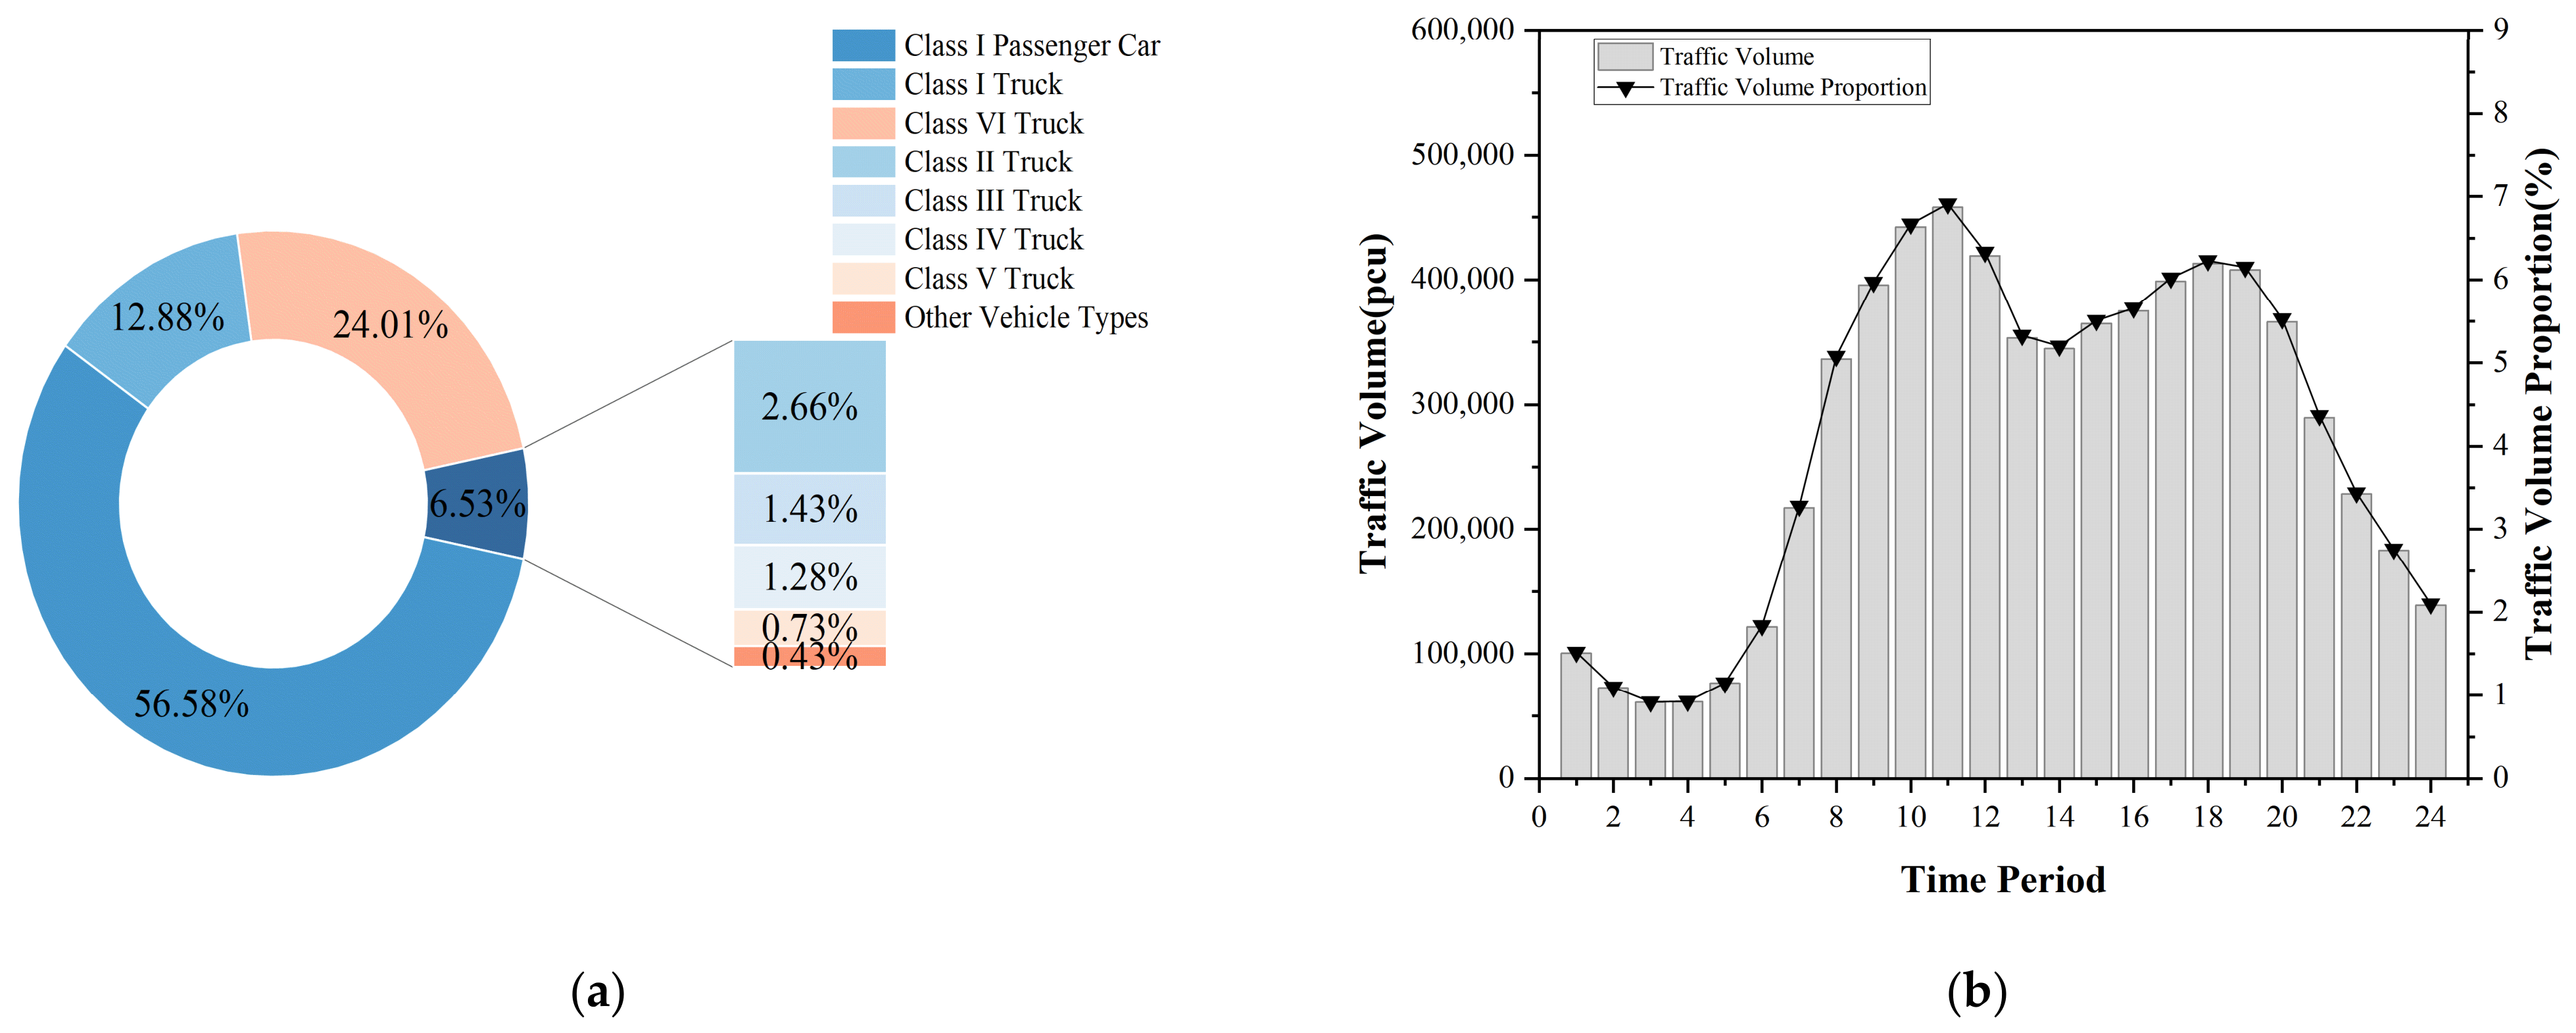
The vehicle-type composition ratios for the freeway (with Class 2, 3, and 4 passenger cars combined as “Others” since each accounts for less than 0.2%) and the time-period distribution ratios are presented in Figure 3.
Figure 3.
Freeway Traffic Distribution Characteristics: (a) Vehicle-Type Composition; (b) Time-Period Distribution.
As evident from Figure 2 and Figure 3, the freeway traffic flow exhibits notable heterogeneity across segments, vehicle types, and time periods. The saturation of freeway segments is approximately 0.2, while the parallel national highway operates near saturation at approximately 0.9, indicating relatively low freeway utilization efficiency and substantial congestion pressure on the parallel national highway, with elevated Vehicle Collision probability. These observations underscore the necessity of implementing segment-, vehicle-type-, and time-period-based toll rate optimization for the freeway.
4.2. Model Parameter Calibration
4.2.1. Polynomial Fitting Model Parameters
A 29.2 km segment of the Shenyang–Haikou Freeway is selected as the analysis unit for the saturation-crash rate relationship. Crash data are sourced from the Liaoning Provincial Road Traffic Crash Statistical Yearbook, compiled by the Traffic Management Bureau of the Liaoning Provincial Public Security Department, recording 617 crashes on this segment over the period 1 June 2022–31 May 2024. Traffic data are derived from ETC gantry and toll station detection systems, which primarily collect speed, volume, and vehicle-type data. These are converted to hourly averages for the saturation–crash rate analysis.
Given that traffic volumes and compositions vary along the freeway due to entry and exit points, the segment is divided into five sub-segments based on toll station and interchange locations. Crash and traffic data are aggregated on a 24-h basis, yielding 120 data points for analyzing the saturation–crash rate relationship.
Using Equations (1)–(4), the 24-h saturation and crash rate for the selected segment are computed, as summarized in Table 4. The results show that traffic volume, heavy vehicle percentage, actual capacity, and saturation all vary considerably over the 24-h period.
Table 4.
24-Hour Saturation and Crash Rate Calculations.
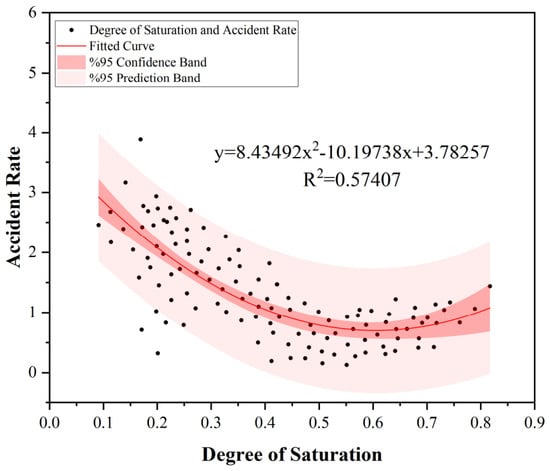
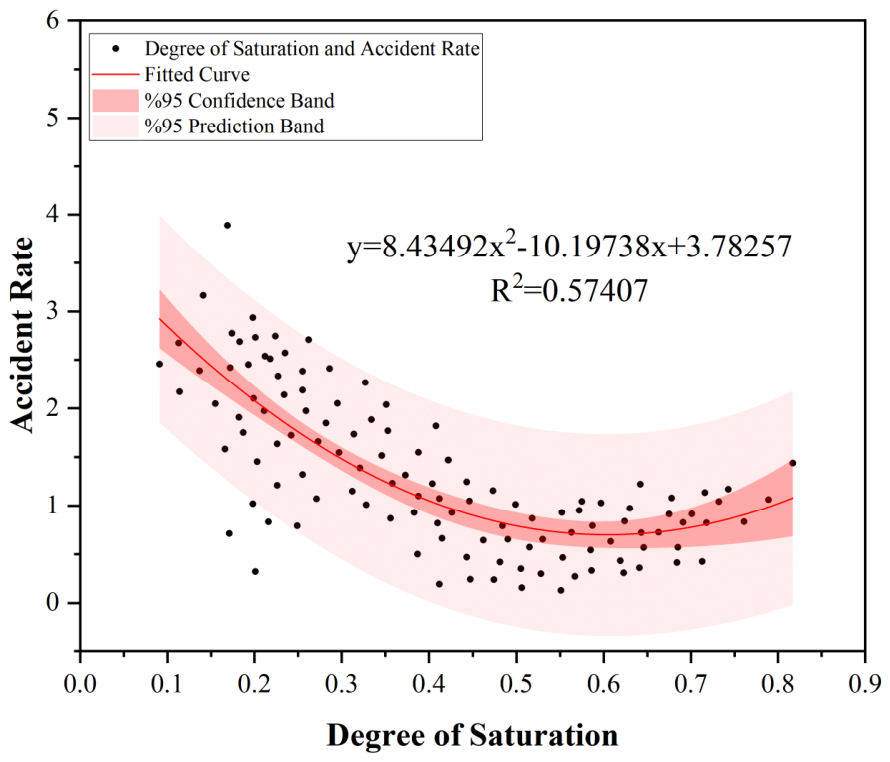
Regression analysis was performed on the obtained data, yielding the relationship curve between the two variables, as shown in Figure 4.
Figure 4.
Relationship between saturation and crash rate on the freeway.
It can be observed that the relationship between saturation and crash rate on the freeway exhibits a U-shaped pattern, which can be fitted by a quadratic curve. In the figure, y denotes the crash rate, with x denoting the saturation. The coefficient of determination . The overall correlation is moderate, and the fitted model is relatively applicable.
From the fitted curve, the corresponding relationship between saturation and crash rate can be derived as follows:
Using the formula for the abscissa of the vertex of a quadratic function, the independent variable at the extremum point is obtained as , which corresponds to the saturation value associated with the theoretical minimum crash rate.
4.2.2. Bi-Level Model Parameters
The current toll rates by vehicle type for the study corridor are presented in Table 5 [36].
Table 5.
Current Toll Rates by Vehicle Type.
The selected freeway underwent reconstruction in 2004 and was designated as a toll-operating highway with a 25-year concession period. According to the project’s final financial accounts, the total construction cost was RMB 2.0412 billion, of which RMB 1.4288 billion was financed through bank loans at an interest rate of 2.7%.
Based on the 2024 final departmental accounts of the Liaoning Provincial Department of Transport, the management and operation cost is taken as RMB 30,000/km/month.
Following Reference [37] and adjusted for the specific conditions of the study segment, parameters , , are set to 3.4, 1.0, and 103, respectively; , , are set to 0.029, 0, and 1; and are assigned values of 3.873, 0.386, 1.965 × 10⁻⁴, 6.157, 2.639, 2.567, and 17.
Based on routine maintenance records, the coefficient is taken as 548. According to crash statistics, the proportions , , for minor, general, and major crashes are 0.87, 0.11, and 0.02, with corresponding average economic losses of RMB 5000, 15,000, and 2,100,000, respectively.
Drawing on recommended values for travel time value from Reference [38] and adjusting for local economic conditions, the value-of-time coefficient is set at RMB 0.12/min, and α and β are set to 0.15 and 0.4, respectively. Based on crash statistics, the average time delays ,, for minor, general, and major crashes are 23 min, 87 min, and 298 min.
Based on observed travel choice behavior in the study area, the nest dispersion parameter is 0.5 (standard error: 0.042, t-statistic: 11.90, p < 0.001), the perception parameter is 0.3 (standard error: 0.038, t-statistic: 7.89, p < 0.001), the converged log-likelihood LL(β) is −1847.6, the null log-likelihood LL(0) is −2677.7, and the McFadden R2 is 0.31.
4.3. Model Results
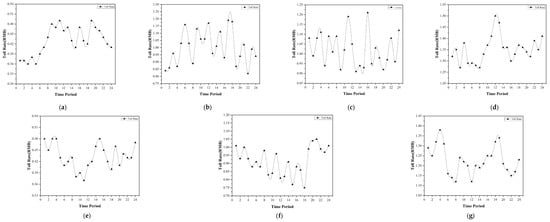
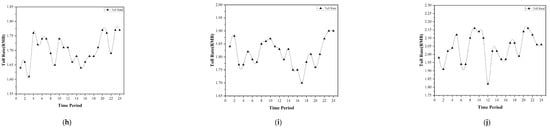
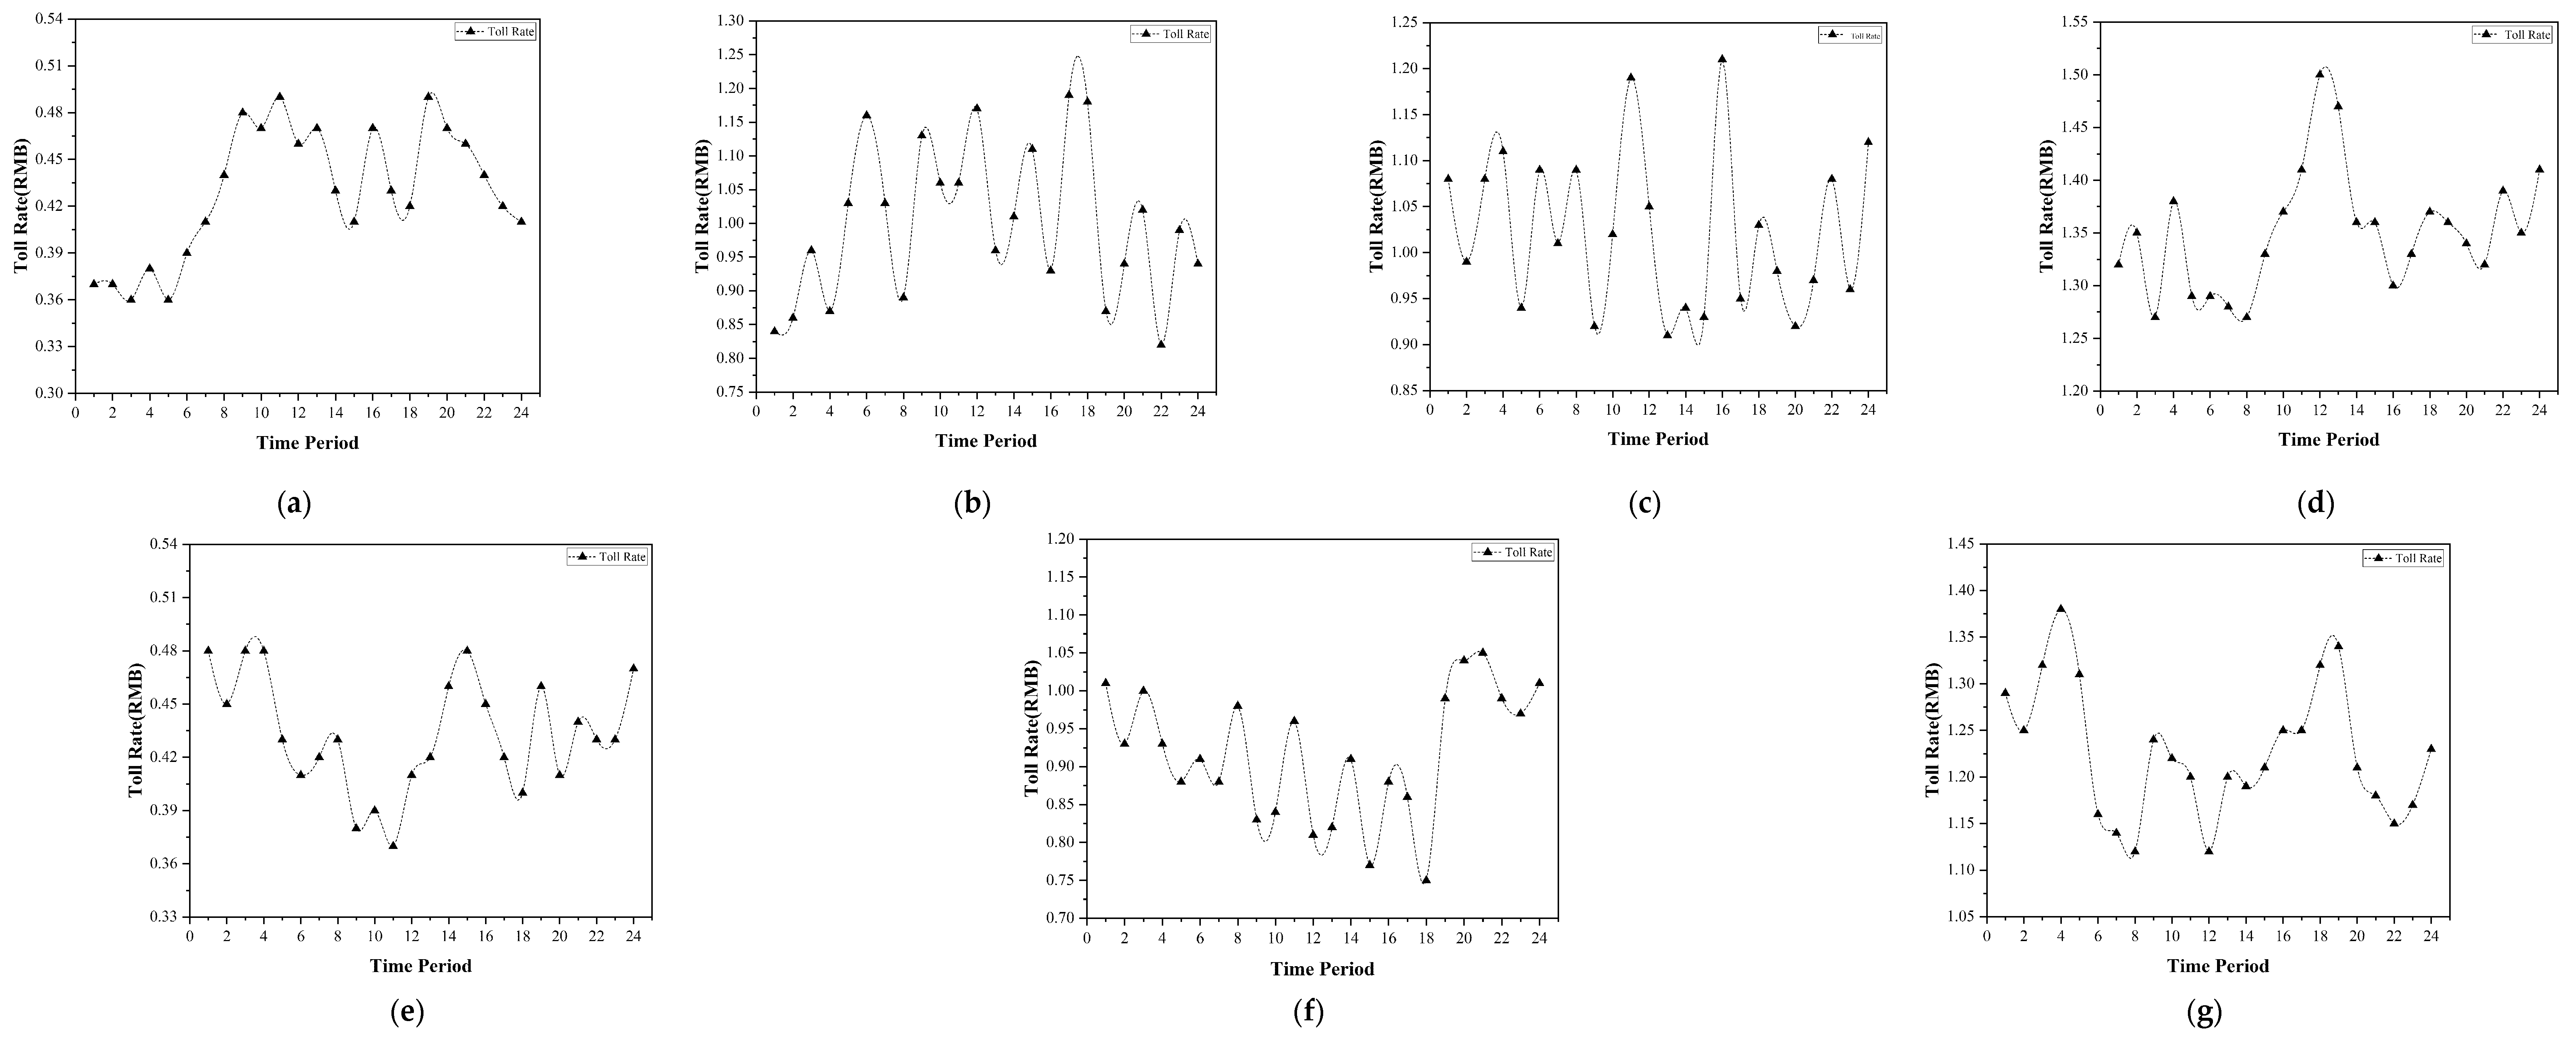
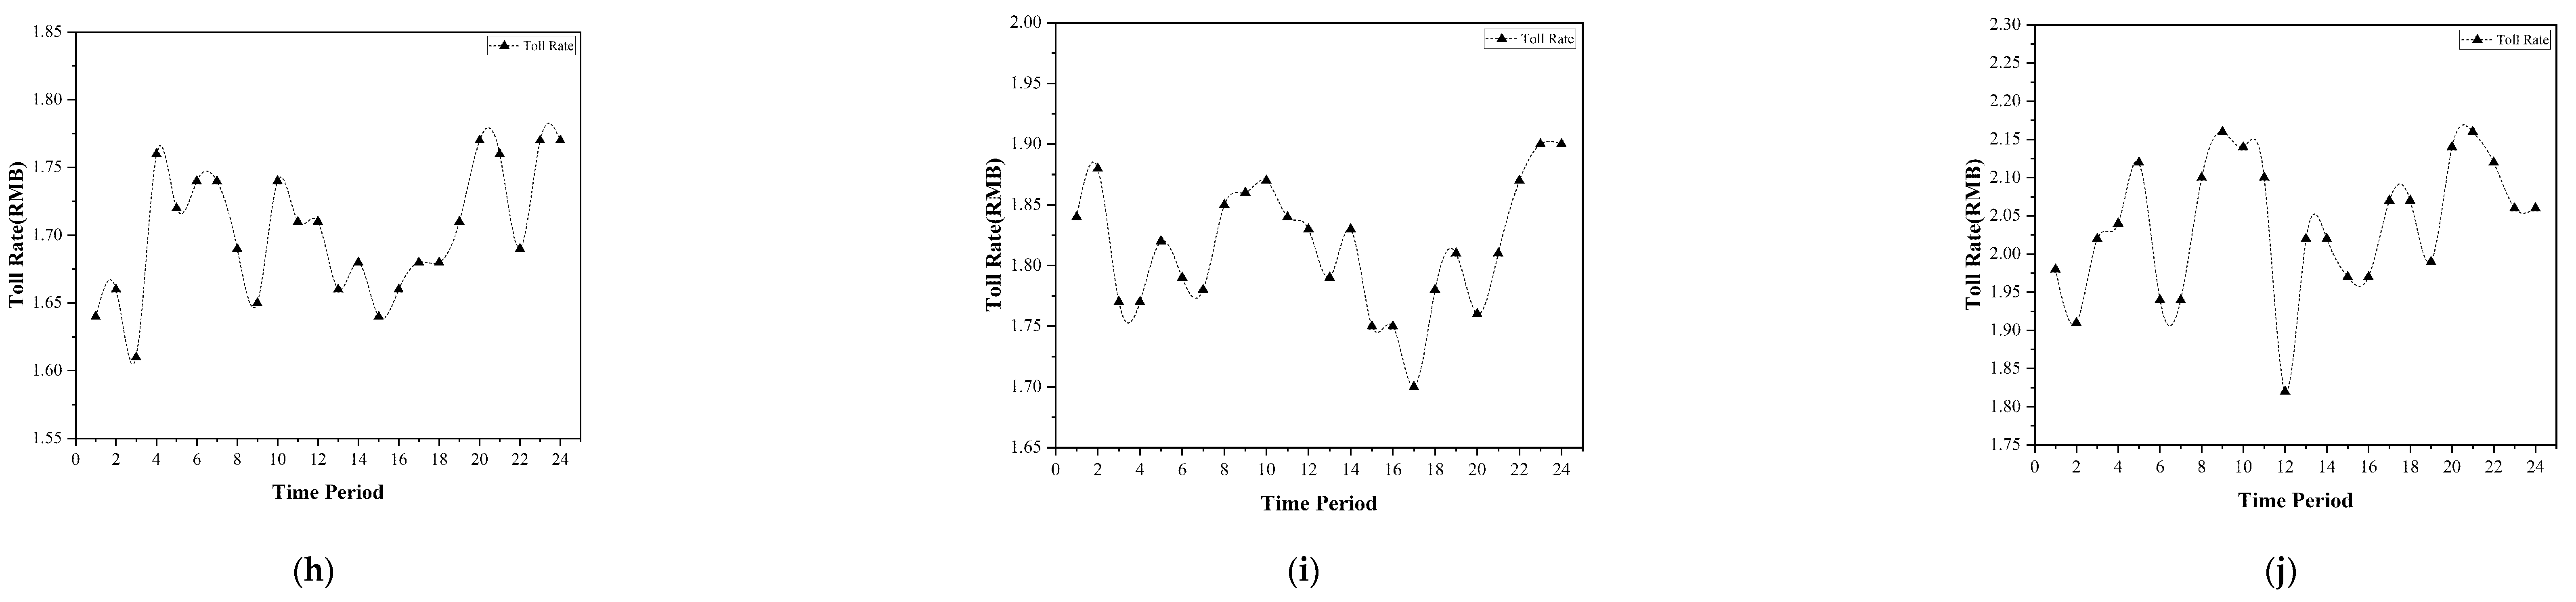
Given the multidimensional nature of the differentiated pricing scheme (segments × vehicle types × time periods), full result matrices are large. For illustrative purposes, the results for Segment 1 are presented to show the optimal toll rates for each vehicle type across time periods and the corresponding traffic volume distributions. The optimal toll rates for each vehicle type on Segment 1 across time periods are shown in Figure 5.
Figure 5.
Optimal Toll Rates for Different Vehicle Types across Time Periods on Segment 1: (a–j) for Passenger Car Classes 1–4 and Truck Classes 1–6.
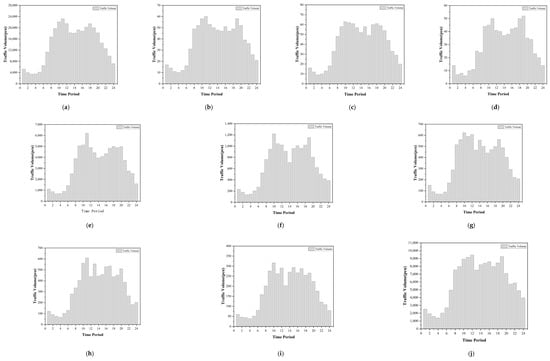
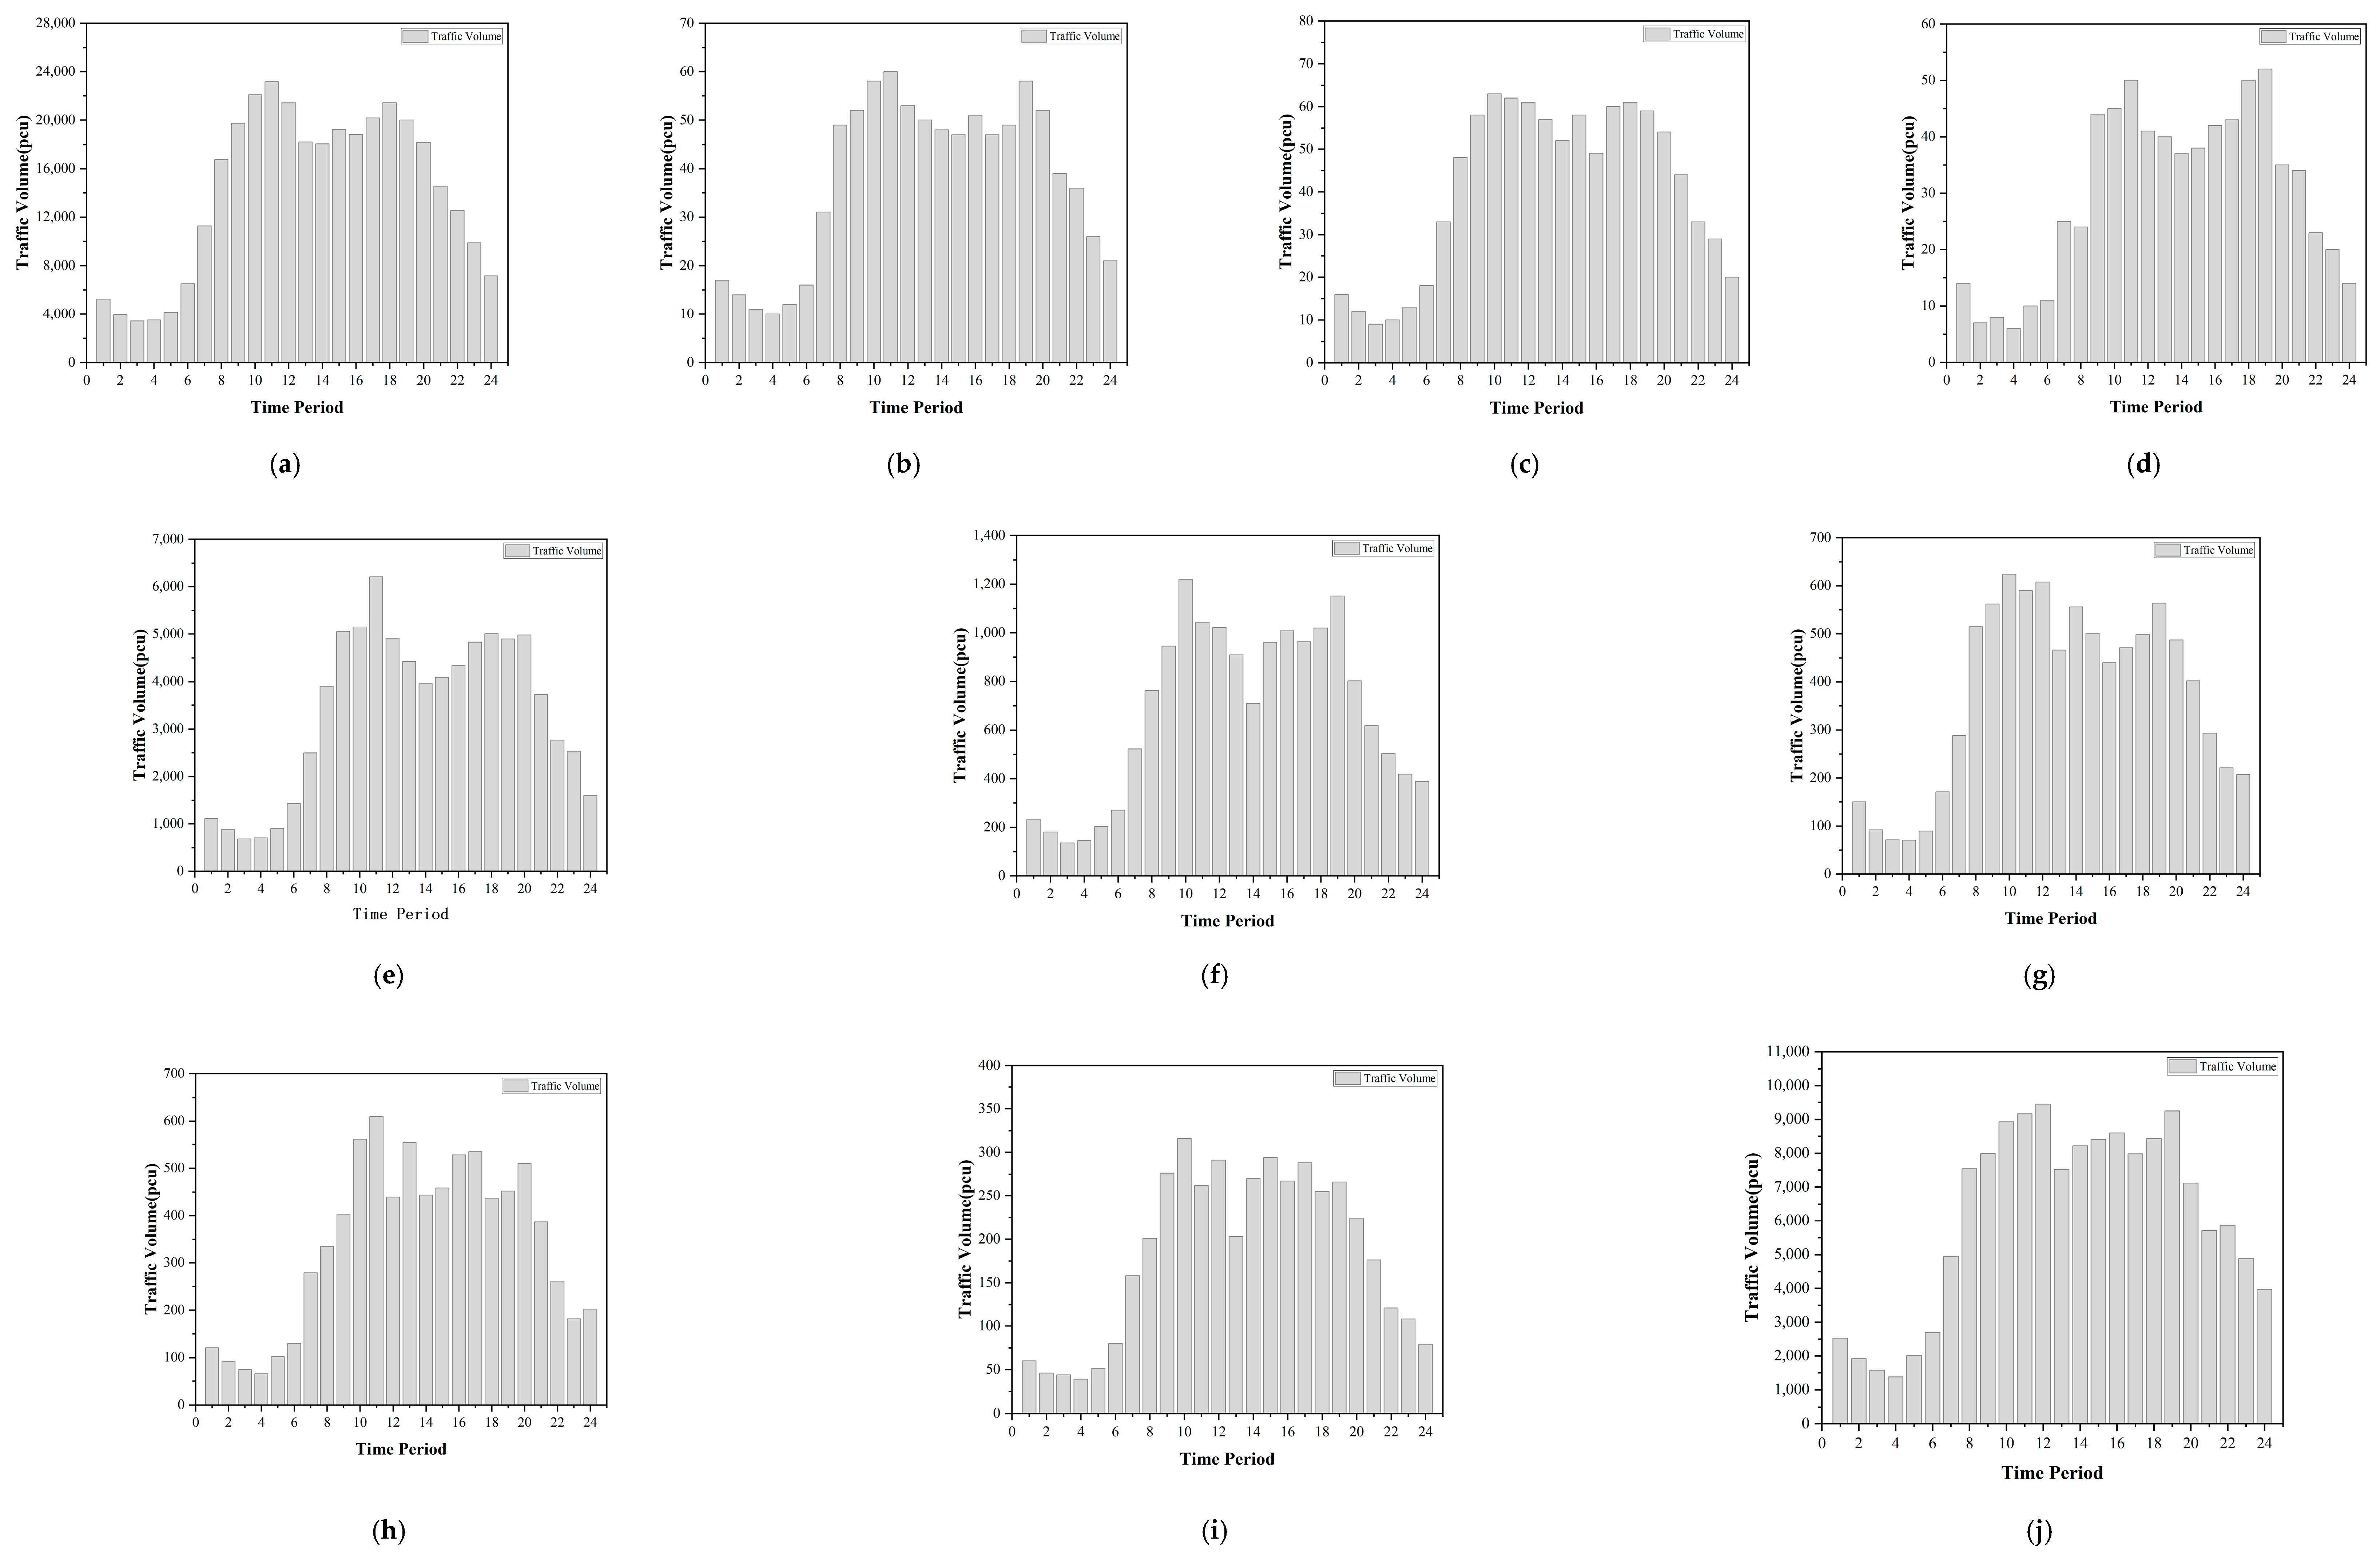
The corresponding traffic volumes under the optimal rate scheme for each vehicle type across time periods are shown in Figure 6.
Figure 6.
Traffic Volumes for Different Vehicle Types across Time Periods under the Optimal Toll Scheme on Segment 1: (a–j) for Passenger Car Classes 1–4 and Truck Classes 1–6.
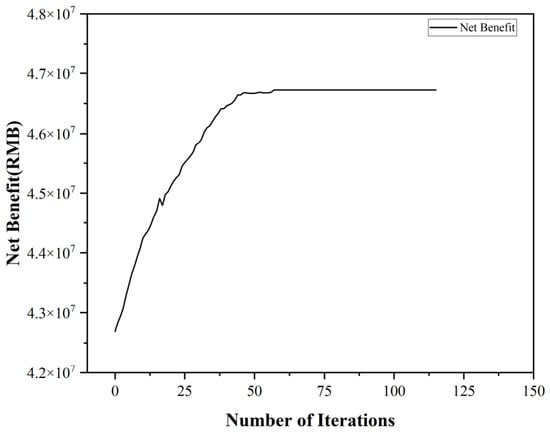
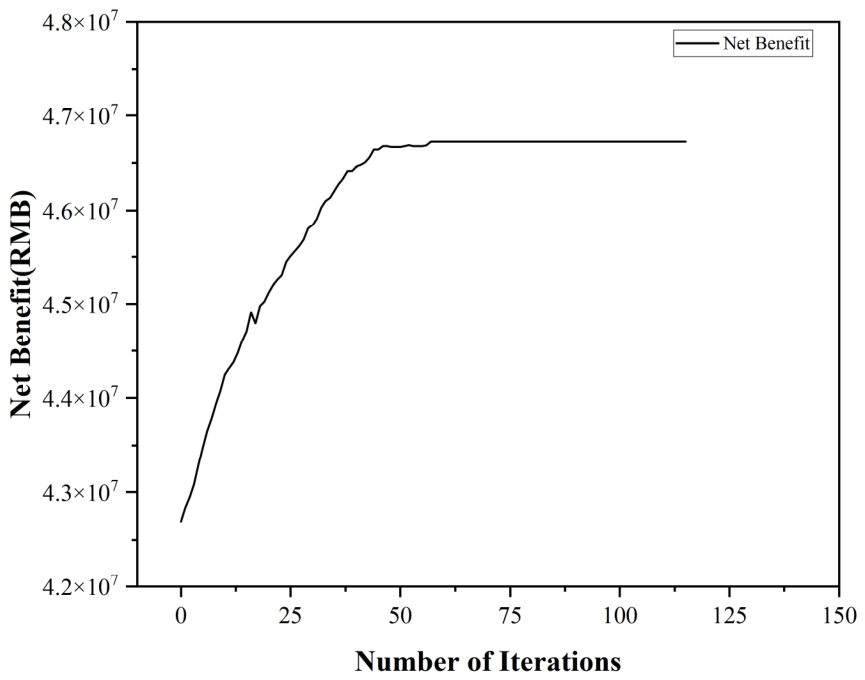
Figure 7 presents the evolution of freeway net revenue over iterations during the PSO-PS solution process.
Figure 7.
Iteration History of the PSO-PS Algorithm.
As shown in Figure 6, net revenue increases steeply in the early iterations, with the algorithm efficiently exploring the solution space and achieving substantial revenue gains. Between iterations 25 and 50, the growth rate gradually moderates as the algorithm approaches the neighborhood of the optimal solution. After iteration 57, the net revenue curve stabilizes, indicating full convergence; further iterations yield no additional improvement. This convergence behavior demonstrates the robustness of the hybrid algorithm, with no divergence or local-optima entrapment. The optimal differentiated toll scheme is obtained in just 57 iterations, well within the preset maximum of 150, confirming both computational efficiency and solution reliability. Under the optimized scheme, the freeway’s monthly net revenue increases by RMB 4,031,078.44, representing a growth rate of 9.44%.
4.4. Comparison with the Existing Scheme
4.4.1. Traffic Volume Comparison
Following implementation of the differentiated pricing scheme, traffic volumes on the freeway increase across all segments, vehicle types, and time periods, demonstrating effective traffic induction. The monthly traffic volume changes by segment, vehicle type, and time period are summarized in Table 6, Table 7 and Table 8, respectively. Aggregate statistics show that truck traffic increased by 244,661 vehicles (8.59%), passenger car traffic by 231,089 vehicles (6.12%), and total segment traffic by 475,750 vehicles (7.18%).
Table 6.
Monthly Traffic Volume Comparison by Segment Before and After Optimization.
Table 7.
Monthly Traffic Volume Comparison by Vehicle Type Before and After Optimization.
Table 8.
Monthly Traffic Volume Comparison by Time Period Before and After Optimization.
4.4.2. Saturation Comparison
Following toll optimization, freeway segment traffic volumes increase to varying degrees, improving road resource utilization while alleviating congestion on the parallel national highway. Figure 8 displays the post-optimization traffic volumes and saturation levels for both the freeway and the parallel national highway. The data indicate that the saturation of the parallel national highway has decreased to approximately 0.67, effectively mitigating congestion and enhancing vehicle operation safety. Concurrently, freeway segment traffic exhibits a balanced growth pattern, indicating that road resources are being utilized more fully and network-wide operational efficiency has improved.
Figure 8.
Traffic Volumes and Saturation for the Freeway and Parallel National Highway after Differentiated pricing Optimization.
4.4.3. Collision Probability Analysis
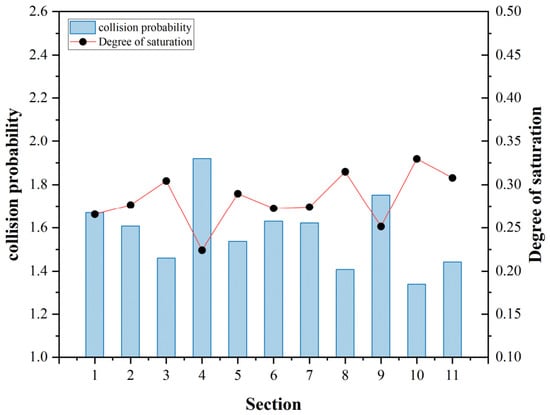
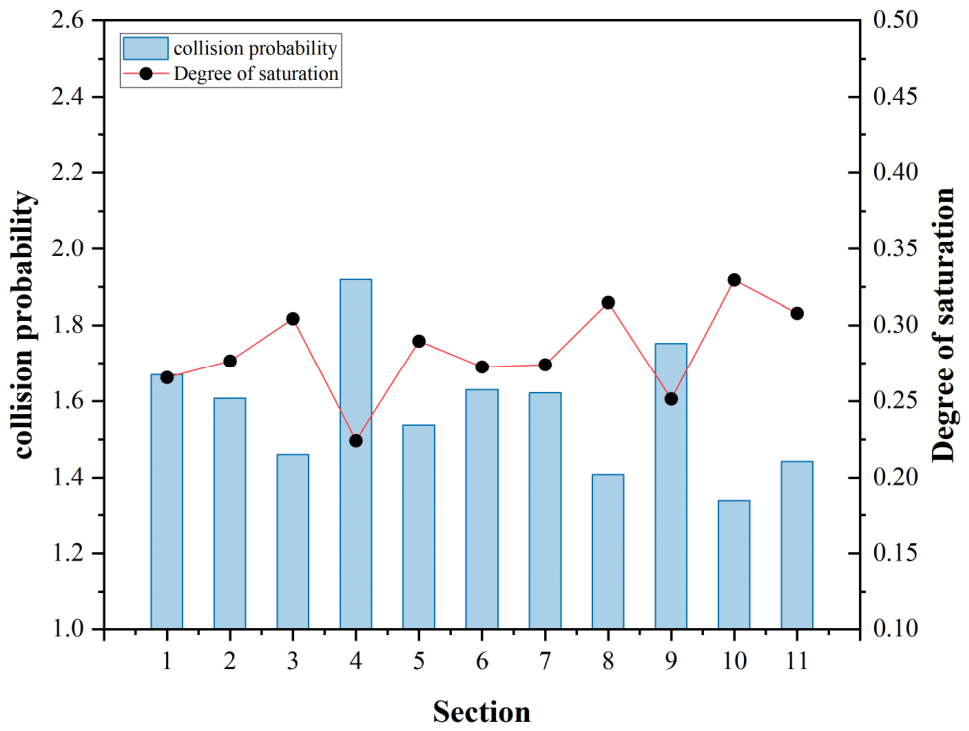
To evaluate the safety impact of the optimized pricing scheme, the post-optimization saturation values for each segment were substituted into the fitted polynomial model (Equation (25)) to obtain the predicted collision probabilities. The post-optimization collision probability and road saturation for each freeway segment are shown in Figure 9. The results indicate that as freeway saturation increased from approximately 0.18 to about 0.32, the predicted collision probability decreased significantly, which is consistent with the U-shaped relationship documented in the literature [22,23,24,25]. Specifically, under extremely low saturation conditions, free-flow conditions encourage higher travel speeds, increasing the likelihood of single-vehicle crashes. When saturation rises to a moderate level, traffic flow becomes more stable, vehicle speeds decrease, and collision probability declines accordingly. As saturation further increases beyond a certain critical threshold, traffic density rises sharply, effective spacing between vehicles diminishes considerably, and the demand for lane changes and overtaking intensifies, leading to an increase in collision probability dominated by multi-vehicle collisions such as sideswipes and rear-end crashes. The optimized pricing scheme successfully shifted the freeway from a low-saturation, high-risk regime to a lower-risk range, while simultaneously alleviating congestion on the parallel national highway. These results confirm that the proposed pricing optimization achieves synergistic benefits in both operational efficiency and traffic safety.
Figure 9.
Post-optimization collision probability and saturation of the freeway segments.
5. Conclusions
This paper proposes an optimization method for differentiated freeway pricing that explicitly accounts for Vehicle Collision probability. By leveraging the relationship between saturation and crash rates, a multidimensional toll rate decision-making framework is developed to achieve optimization under the multiple constraints of operational revenue, travel impedance, and driving safety. First, the nonlinear relationship between network saturation and crash rates is analyzed, elucidating the mechanisms through which spatiotemporal traffic flow characteristics influence operating costs, crash losses, and travel costs. Second, incorporating freeway operating revenue–cost structure and crash loss components, an upper-level economic benefit model with embedded safety cost terms is established, complemented by a lower-level travel impedance model based on travel time and monetary costs. Furthermore, a nested Logit model is introduced to capture travelers’ route choice behavior and describe the traffic redistribution induced by differentiated toll rates. Finally, a hybrid PSO-PS algorithm is employed to solve the nonlinear segment-, vehicle-type-, and time-period-based bi-level programming model. A case study on the Xiliu–Shilihe segment of the Shenyang–Haikou Freeway and its parallel National Highway 202 is conducted for empirical validation. The results demonstrate the following.
The proposed differentiated toll model that accounts for Vehicle Collision probability effectively coordinates traffic flow distribution across different segments, vehicle types, and time periods, enhancing operator net revenue while reducing travelers’ travel impedance. Following optimization, the monthly net revenue of the freeway increased by RMB 4.031 million, representing a growth rate of 9.44%. Truck traffic volume rose by 244,661 vehicles (an increase of 8.59%), among which Class 6 trucks (six-axle) contributed the largest absolute increase of 175,364 pcu. Passenger car traffic increased by 231,089 vehicles (an increase of 6.12%), with Class 1 passenger cars accounting for the predominant share of this increment (227,096 pcu). The saturation of the parallel national highway decreased from approximately 0.9 to about 0.67, while the saturation of the freeway increased from 0.18 to approximately 0.32. Substituting the optimized saturation values into the fitted crash rate model (Equation (25)) yielded a substantial predicted reduction in crash rate, confirming that the increase in freeway saturation shifted the facility from a high-risk low-saturation regime to a lower-risk range. The hybrid algorithm converged fully within 57 iterations, considerably fewer than the preset upper limit of 150 iterations, thereby validating the computational efficiency and solution reliability of the proposed model. These findings further underscore the necessity of incorporating Vehicle Collision probability into the toll rate optimization framework.
Nevertheless, several issues warrant further consideration. This study employs the crash rate per million vehicle-kilometers per hour as the measure of collision probability and does not incorporate collision consequence severity into the optimization framework. Under low-density, high-speed conditions, collision probability is low but consequences are severe; under high-density, low-speed conditions, collision probability is high but consequences are less severe. Therefore, a “reduction in collision probability” does not equate to “comprehensive improvement in traffic safety.” In the case study of this paper, the optimization direction moves from low saturation toward moderate saturation, where the changes in probability and severity are aligned, making the safety improvement estimates conservative. In addition, the model was calibrated and validated under the average traffic conditions of September 2024 and has not been tested under different demand scenarios or external disruptions; under atypical conditions, the optimal toll scheme may become ineffective. Future work should consider the development of a joint probability–severity model, and incorporate robust optimization or scenario analysis approaches to strengthen both the comprehensiveness of risk assessment and the adaptability of model deployment.
Overall, the proposed differentiated pricing model considering Vehicle Collision probability and its hybrid solution algorithm are shown to be effective in deriving feasible toll schemes under complex multidimensional pricing scenarios, providing a theoretical foundation and quantitative tool for refined freeway toll design.
Author Contributions
Conceptualization, S.D. and X.Z.; Methodology, X.Z. and S.L.; Software, S.L.; Validation, X.Z.; Formal analysis, Y.Z.; Investigation, X.Z.; Resources, X.Z.; Data curation, X.Z. and Y.Z.; Writing—original draft, X.Z.; Writing—review & editing, S.L.; Visualization, Y.Z.; Supervision, S.D.; Project administration, S.D.; Funding acquisition, S.D. All authors have read and agreed to the published version of the manuscript.
Funding
This research received no external funding.
Data Availability Statement
The original contributions presented in this study are included in the article. Further inquiries can be directed to the corresponding author.
Conflicts of Interest
The authors declare no conflict of interest.
References
- Macioszek, E.; Kurek, A. Road Traffic Distribution On Public Holidays And Workdays On Selected Road Transport Network Elements. Transp. Probl. 2021, 16, 127–138. [Google Scholar] [CrossRef] [Scilit]
- Wu, J.Q.; Huo, Y.Q.; Wang, J.Z.; Guo, H.Y. A review of differentiated tolling research for freeways. J. Shandong Univ. (Eng. Sci.) 2023, 53, 18–29. [Google Scholar] [CrossRef]
- Ministry of Transport, National Development and Reform Commission; Ministry of Finance. Notice on the Issuance of the “Implementation Plan for the Comprehensive Promotion of Differentiated Toll Pricing Policies on Freeways”. 2 June 2021. Available online: https://xxgk.mot.gov.cn/jigou/glj/202106/t20210615_3609815.html (accessed on 4 July 2026).
- Farias, A.V.; Zhu, S.; Mardan, A. An overview of dynamic pricing toll roads in the united states: Pricing algorithms, operation strategies, equity concerns, and funding mechanism. Case Stud. Transp. Policy 2024, 17, 101226. [Google Scholar] [CrossRef] [Scilit]
- Yan, S.Y.; You, W.B.; Liu, H.; Su, L.; Chen, N.; Yan, Y.C.; Yang, Y.X. Research review of differentiated charging on expressway. J. Chang. Univ. (Nat. Sci. Ed.) 2026, 46, 128–150. [Google Scholar] [CrossRef]
- Shen, K.; Liu, R.; Duan, L.Z.; Li, Z.N. Research on evaluation method of implementation effect of differentiated tolling for freeways. Constr. Econ. 2023, 44, 566–570. [Google Scholar] [CrossRef]
- Zhu, Z.; Zhang, X.; Wei, Z.; Liu, M.; Yu, C.; Wu, Z. Research on optimization model of differentiated toll rate of expressway towards sustainable transportation development. Adv. Transp. Stud. 2024, 62, 191. [Google Scholar]
- Liu, Y.; Duan, R.; Shen, K.; Luan, Q.; Gao, H.; Deng, H. An investigation into the determinants of satisfaction concerning varied toll policies on highways using the random forest model. AIMS Math. 2024, 9, 4161–4177. [Google Scholar] [CrossRef] [Scilit]
- Zhang, H.; Shi, F.; Lu, Y.; Lei, D.Y.; Zhu, D.T. Optimization model for overloading penalty rate on freeways under elastic demand. China J. Highw. Transp. 2012, 25, 126–132. [Google Scholar] [CrossRef]
- Li, T.; Sun, H.; Wu, J.; Ge, Y.E. Optimal toll of new highway in the equilibrium framework of heterogeneous households’ residential location choice. Transp. Res. Part A Policy Pract. 2017, 105, 123–137. [Google Scholar] [CrossRef] [Scilit]
- Lu, Z.; Meng, Q. Impacts of pavement deterioration and maintenance cost on Pareto-efficient contracts for highway franchising. Transp. Res. Part E Logist. Transp. Rev. 2018, 113, 1–21. [Google Scholar] [CrossRef] [Scilit]
- Yan, D.D.; Liu, Y.H.; Qin, Y.Q.; Miao, Y.F.; Yao, Y.H. A two-part tariff pricing method for freeways. J. Kunming Univ. Sci. Technol. (Nat. Sci. Ed.) 2020, 45, 168–174. [Google Scholar] [CrossRef]
- Wang, J.; Lu, L.; Peeta, S.; He, Z. Optimal toll design problems under mixed traffic flow of human-driven vehicles and connected and autonomous vehicles. Transp. Res. Part C Emerg. Technol. 2021, 125, 102952. [Google Scholar] [CrossRef] [Scilit]
- Himanshu, S.; Chintaman, B.; Ashish, D. Developing Policy Framework of Dynamic Toll Pricing in India. Transp. Res. Procedia 2021, 52, 605–612. [Google Scholar] [CrossRef] [Scilit]
- Cheng, S.J.; Shao, X.M.; Li, Z.; Wang, J.F. Differentiated toll pricing for freeways based on a bi-level programming model. Shandong Sci. 2023, 36, 93–101+120. [Google Scholar] [CrossRef]
- Kong, D.X.; Ao, G.C.; Zhang, H.L.; Xu, W.W. Analysis and modeling of truck travel choice preferences under differentiated tolling. J. Shenzhen Univ. (Sci. Eng.) 2023, 40, 210–217. [Google Scholar] [CrossRef] [Scilit]
- Chen, M.; Wang, J.S.; Li, Y.Q.; Lyu, X.; Zhao, J.D. ETC gantry data-driven bi-level programming method for differentiated freeway tolling. Sci. Technol. Eng. 2024, 24, 1251–1258. [Google Scholar] [CrossRef]
- Wang, J.F.; Li, X.D.; Song, Z.F.; Guo, E.Y. Differentiated freeway toll pricing model considering carbon emission reduction benefits. J. South China Univ. Technol. (Nat. Sci. Ed.) 2024, 52, 14–22. [Google Scholar] [CrossRef]
- Yu, X.; Wang, X.; Liao, F.; Zhou, Y.; Wang, Y.; Wang, H. Pricing Differentiated Expressway Tolls for Freight Trucks Balancing Equity and Efficiency. In Proceedings of the 2025 5th International Conference on Business Administration and Data Science (BADS 2025); Atlantis Press: Dordrecht, The Netherlands, 2025; pp. 301–311. [Google Scholar] [CrossRef] [Scilit] [PubMed]
- Dong, X.; Zeng, Y.; Luo, R.; Lyu, N.; Xu, D.; Zhou, X. Influence of differentiated tolling strategies on route choice behavior of heterogeneous highway users. Future Transp. 2025, 5, 41. [Google Scholar] [CrossRef] [Scilit]
- Yan, S.Y.; Zhao, J.Q.; You, W.B.; Liu, Y.; Hao, S.J.; Wu, F.W. Bi-level programming model for differentiated toll discounts for freight trucks on freeways. J. Tsinghua Univ. (Sci. Technol.) 2025, 65, 1347–1358. [Google Scholar] [CrossRef]
- Ji, X.J.; Fang, S.E.; Huang, J. Relationship between V/C ratio and crash rate on basic freeway segments. J. Highw. Transp. Res. Dev. 2003, 20, 122–124. [Google Scholar] [CrossRef]
- Lord, D.; Manar, A.; Vizioli, A. Modeling crash-flow-density and crash-flow-V/C ratio relationships for rural and urban freeway segments. Accid. Anal. Prev. 2005, 37, 185–199. [Google Scholar] [CrossRef] [Scilit] [PubMed]
- Zhong, L.D.; Sun, X.D.; Chen, Y.S.; He, Y.L.; Zhang, J. Study on the relationship between V/C ratio and crash rate on freeways. J. Beijing Univ. Technol. 2007, 33, 37–40. [Google Scholar] [CrossRef]
- Zhong, L.D.; Sun, X.D. Relationship between freeway safety and traffic flow characteristic parameters. J. Beijing Univ. Technol. 2013, 39, 251–256. [Google Scholar]
- Tian, W.L.; Wu, Z.G.; Li, J.; Hu, S.H.; Sun, X.J. Freeway traffic safety analysis based on dynamic risk saturation. J. Transp. Inf. Saf. 2021, 39, 12–18+42. [Google Scholar] [CrossRef]
- Yu, T.; Gao, F.; Liu, X.; Tang, J. A spatial autoregressive quantile regression to examine quantile effects of regional factors on crash rates. Sensors 2021, 22, 5. [Google Scholar] [CrossRef] [Scilit] [PubMed]
- Samerei, S.A.; Aghabayk, K.; Montella, A. Analyzing pile-up crash severity: Insights from real-time traffic and environmental factors using ensemble machine learning and Shapley additive explanations method. Safety 2024, 10, 22. [Google Scholar] [CrossRef] [Scilit]
- Mannering, F.L.; Bhat, C.R. Analytic methods in accident research: Methodological frontier and future directions. Anal. Methods Accid. Res. 2014, 1, 1–22. [Google Scholar] [CrossRef] [Scilit]
- Aven, T. The risk concept—Historical and recent development trends. Reliab. Eng. Syst. Saf. 2012, 99, 33–44. [Google Scholar] [CrossRef] [Scilit]
- JTG B01-2014; Highway Engineering Technical Standard. China Communications Press: Beijing, China, 2014.
- Elefteriadou, L.A. The highway capacity manual 6th edition: A guide for multimodal mobility analysis. Ite J. 2016, 86, 14–18. [Google Scholar] [CrossRef] [Scilit] [PubMed]
- JTG D20-2017; Highway Route Design Specification. China Communications Press: Beijing, China, 2017.
- Roess, R.P.; Prassas, E.S. The Highway Capacity Manual: A Conceptual and Research History; Springer: Cham, Switzerland, 2014. [Google Scholar] [CrossRef] [Scilit]
- General Office of the Ministry of Transport. Notice on the Issuance of the Statistical Survey System for the Highway and Waterway Transport Industry (2023 Annual Report and 2024 Regular Report). 8 January 2024. Available online: https://xxgk.mot.gov.cn/jigou/zhghs/202401/t20240119_3983546.html (accessed on 4 July 2026).
- Liaoning Provincial People’s Government. Notice on the Adjustment of Vehicle Toll Rate Standards for Provincial Freeways. 30 March 2009. Available online: https://www.ln.gov.cn/web/zwgkx/lnsrmzfgb/2009n/qk/2009n_dqq/szfwj/F865C27FA25642C285918EF6975A4559/ (accessed on 4 July 2026).
- Yang, Y.-h.; Jiang, Y.-h.; Wang, X.-c. Pavement performance prediction methods and maintenance cost based on the structure load. Procedia Eng. 2016, 137, 41–48. [Google Scholar] [CrossRef] [Scilit]
- Standard Quota Institute of the Ministry of Housing and Urban-Rural Development; Transport Planning and Research Institute, Ministry of Transport. Economic Evaluation Methods and Parameters for Highway Construction Projects; China Planning Press: Beijing, China, 2010. [Google Scholar]

Disclaimer/Publisher’s Note: The statements, opinions and data contained in all publications are solely those of the individual author(s) and contributor(s) and not of MDPI and/or the editor(s). MDPI and/or the editor(s) disclaim responsibility for any injury to people or property resulting from any ideas, methods, instructions or products referred to in the content. |
© 2026 by the authors. Licensee MDPI, Basel, Switzerland. This article is an open access article distributed under the terms and conditions of the Creative Commons Attribution (CC BY) license.