


Abstract
Full-vehicle crash simulations that account for occupant injury are essential for automobile safety assessment; however, they are computationally intensive and time-consuming. In particular, dash panel deformation plays a key role in transmitting impact loads to an occupant’s lower extremities. To address this issue, this study proposes a two-stage machine learning framework for occupant lower-limb injury assessment. In the first stage, the deformation behavior of the dash panel is predicted using a machine learning model, enabling efficient generation of a wide range of deformation patterns. In the second stage, occupant lower-limb injury metrics are evaluated based on the predicted deformation using a sled model. While the ultimate objective is to establish the complete two-stage framework, the present paper is limited to the first stage. It investigates the feasibility of machine learning-based deformation prediction. Deformation distributions of simplified structural components are predicted using an XGBoost-based machine learning model, in which principal component scores derived from geometric and deformation data serve as input features. The objective is to efficiently generate representative deformation modes from limited training data rather than optimizing prediction accuracy for individual deformation responses. Numerical experiments are conducted to investigate the effectiveness of the proposed prediction framework. The results of the proposed approach show good agreement with crash simulations in overall deformation behavior, while local deformation is not reproduced perfectly. These findings demonstrate the feasibility of machine learning-based dash panel deformation prediction as the first step toward the proposed two-stage framework for lower-limb injury assessment.
1. Introduction
In recent years, the increase in stringent automobile safety regulations and assessment protocols has raised the required level of crash safety performance. Accordingly, automotive manufacturers must evaluate whole vehicle structural strength and detailed occupant injury metrics across a wide range of crash conditions. As a result, computer-aided engineering (CAE), particularly numerical simulation-based approaches, has become an essential tool in vehicle development. In parallel, advances in data-driven techniques have stimulated growing interest in applying machine learning methods to predict vehicle structural responses and occupant injury outcomes in crash events [1,2].
Occupant injury assessment involves multiple anatomical regions, including the head, chest, neck, abdomen, and lower limbs, each governed by distinct biomechanical injury mechanisms and evaluation indices [3,4,5,6,7,8]. Among these regions, lower-limb injuries are of particular concern in frontal collision scenarios, as they frequently occur even in crashes that do not result in severe or fatal injuries. Moreover, such injuries can lead to long-term functional impairment and reduced post-crash mobility, underscoring the importance of their accurate evaluation in vehicle safety design. Unlike head and chest injuries, which are strongly influenced by restraint systems such as airbags and seatbelts, lower-limb injuries are predominantly affected by the deformation behavior of vehicle interior structures.
In frontal impacts, the dash panel plays a central role in transmitting impact loads to the occupant’s lower extremities through interactions with the knees, femur, and tibia. Previous studies have noted considerable relationships between dash panel deformation characteristics and lower-limb injury indices, including femoral loads and tibial accelerations. Consequently, accurate prediction of dash panel deformation is a key requirement for reliable assessment of lower-limb injury risk. However, due to complex geometries, material nonlinearities, and large deformation behavior, accurately predicting dash panel deformation is still difficult.
The finite element method (FEM) is widely recognized as the standard analytical approach for CAE-based crash safety evaluation. It is extensively employed in the automotive industry through commercial software packages [9,10]. FEM-based crash simulations enable high-fidelity analysis of structural deformation and occupant responses. Nevertheless, such simulations are computationally intensive, requiring substantial resources and long computation times, particularly in large-scale parametric studies or design optimization. This computational burden significantly limits the number of feasible simulation cases in practical vehicle development.
To address these limitations, machine learning techniques have been explored as alternative or complementary approaches to conventional FEM-based crash analyses [11,12,13,14]. Recent studies have demonstrated the applicability of machine learning methods to crashworthiness analysis, including the prediction of deformation behavior, stress responses, impact performance, and injury-related metrics under nonlinear loading conditions [15,16,17]. For structural crash prediction, a variety of data-oriented approaches have recently been proposed. Deep learning-based surrogate models, including convolutional neural networks (CNNs) and graph neural network (GNN) architectures, have shown the capability to learn complex spatially deformation responses directly from simulation data. In particular, mesh-based GNN surrogate models have been developed to predict crash responses of vehicle structures while preserving mesh connectivity information [18]. Reduced-order modeling techniques have also been investigated to accelerate crashworthiness optimization by representing high-dimensional structural responses in a low-dimensional latent space [19]. Furthermore, physics-informed surrogate frameworks have been proposed to improve prediction efficiency by means of incorporating engineering knowledge into the learning process [20]. Although these approaches have presented promising predictive performance, they generally require relatively large and varied training datasets to achieve consistent generalization. In industrial crashworthiness applications, the generation of such datasets commonly relies on extensive finite element analyses, resulting in considerable computational cost. In contrast, gradient boosting methods have been widely recognized as effective learning algorithms for structured tabular datasets and are particularly suitable when the available training data are limited. Comparative studies have reported that XGBoost achieves predictive performance comparable to or exceeding that of recent deep learning approaches, such as TabNet and transformer-based models, for tabular engineering datasets. Moreover, recent impact engineering and crashworthiness studies have successfully applied XGBoost to predict impact responses, structural failure behavior, and crash-related performance variables from relatively small simulation datasets [21,22,23]. Motivated by the results, the present study uses XGBoost as the regression model to predict deformation modes from a limited number of crash simulations. Once trained, the model enables rapid prediction of structural deformation with negligible computational cost. The objective is not to replace high-fidelity crash simulations entirely, but to investigate whether physically meaningful deformation fields can be efficiently predicted from a restricted dataset representative of the practical vehicle design space [15,16,17].
Based on this background, the present study proposes a two-stage prediction framework for measuring occupant lower-limb injuries, as described in Section 2. The objective of this framework is to reduce the overall computational cost of crash-safety evaluation without sacrificing acceptable predictive accuracy. In the first stage, the deformation behavior of a key vehicle interior component is predicted using a machine learning model. In the second stage, occupant lower-limb injury metrics are evaluated based on the predicted structural deformation.
As an initial investigation of the proposed framework, this study focuses on the first stage, namely, predicting the final deformation shape of the dash panel in frontal crash events. The purpose of this study is not to identify the most accurate machine learning model for deformation prediction. Instead, we propose a practical framework that efficiently predicts representative deformation modes with reasonable accuracy and computational cost. Such a framework is expected to facilitate the generation of additional deformation data and support subsequent analyses related to occupant injury prediction. Considering the limited size of the available dataset and the objective of developing an efficient prediction framework, this study focuses on evaluating the feasibility of deformation prediction rather than maximizing prediction accuracy by using increasingly complex machine learning models. A machine learning model is developed to predict the final deformed configuration of the dash panel, and its predictive performance is quantitatively evaluated using appropriate error metrics. In addition, the influence of key factors on prediction accuracy is analyzed to clarify the relationship between deformation characteristics and model performance. The results of this study provide fundamental insights into the efficient application of machine learning techniques for vehicle crash-safety evaluation and lay the foundation for subsequent research on the prediction of lower-limb injuries. To achieve this objective, the principal component variables are treated as design variables representing feasible deformation modes within the PCA space derived from the training data. Accordingly, the present study focuses on predicting representative deformation behaviors within this learned design domain rather than directly addressing arbitrary unseen vehicle geometries.
2. Concept of the Proposed Approach
In this section, the overall framework of the proposed machine learning-based approach for predicting occupant lower-limb injuries is presented. The framework consists of two stages: prediction of dash panel deformation using a machine learning model and prediction of occupant lower-limb injury metrics based on the predicted deformation. Although the present study focuses on the first stage, the second stage is introduced to clarify the intended application and the overall workflow of the proposed methodology.
First, the procedure for generating dash panel deformation using a machine learning model is described. Next, the modeling process for predicting occupant lower-limb injury metrics is outlined.
2.1. Generation of Data for Occupant Sled Analysis (First Stage)
In conventional machine learning-based approaches to lower-limb injury prediction, the relationship between lower-limb injury metrics and time-series data, such as dash panel deformation histories and vehicle acceleration pulses, is learned from crash analyses that explicitly include occupant models. These time-series data represent the mechanical relationships between the occupant’s lower limbs and the dash panel during a crash and therefore contain essential information to comprehend lower-limb injury mechanisms.
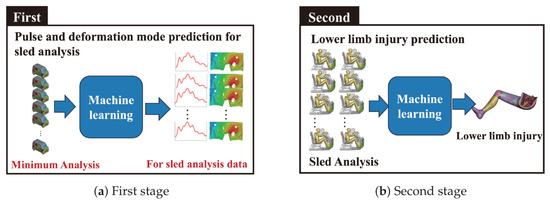
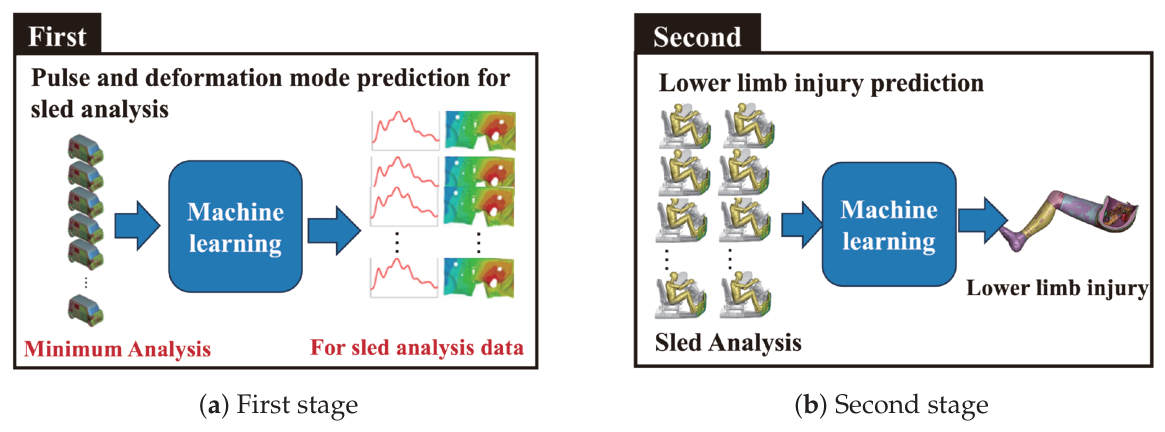
In contrast, the present study adopts a different strategy, as illustrated in Figure 1. In the first stage of the proposed framework, a machine learning model is trained to generate time-series data of dash panel deformation and vehicle acceleration pulses using crash analyses conducted without occupant models. Rather than directly predicting lower-limb injury metrics, this stage focuses on generating the fundamental input data required for subsequent lower-limb injury prediction, which constitutes a key feature of the proposed approach.
Figure 1.
Overall framework of the proposed two-stage prediction approach. The present study focuses on the first stage (a). The second stage (b), which predicts occupant lower-limb injury metrics from the generated deformation data, will be investigated in future work.
In conventional frameworks, a large number of crash analyses must be repeatedly performed to construct training data sets that comprehensively cover various deformation patterns and acceleration pulses. Consequently, the computational cost of crash analyses becomes substantial, and preparing training data requires considerable time and computing resources.
To mitigate this issue, the present study introduces a machine learning-based data generation process as the first stage of the framework (Figure 1a), consequently reducing the number of crash analyses required to acquire training data for lower-limb injury prediction. This strategy is likely to considerably reduce computational costs and improve the overall efficiency of the data generation process.
Nevertheless, even in the first stage, a certain number of crash analyses are still required to train the machine learning model. Therefore, this study also investigates methods to minimize the computational time of crash analyses to achieve a practical balance between computational efficiency and prediction accuracy in generating dash panel deformation histories and vehicle acceleration pulses.
2.2. Modeling for Lower-Limb Injury Prediction (Second Stage)
In the second stage, lower-limb injury is evaluated using a machine learning model, as illustrated in Figure 1b. First, occupant behavior during a crash is simulated through occupant sled analyses. The occupant sled model is employed because the primary focus of this study is lower-limb injury. Sled analyses require fewer computational resources than full-vehicle crash analyses and significantly reduce the time needed to collect training data for lower-limb injury prediction.
In this stage, a certain number of sled analyses are required to obtain reference results. To define the boundary conditions for the sled analyses, the sled model uses the dash panel deformation histories and vehicle acceleration pulses generated in the first stage as input data. The proposed machine learning framework enables the generation of an arbitrary number of such input datasets, therefore facilitating efficient preparation of training data for lower-limb injury evaluation.
In summary, the proposed framework consists of two stages: deformation prediction and injury prediction. The present study focuses on developing the deformation prediction model (Stage 1), which serves as the foundation for the subsequent injury prediction framework.
3. Numerical Data of Vehicle Body Deformation
This section describes the numerical analysis setup and presents the numerical results of the dash panel deformation relevant to lower-limb injury estimation. In addition, the definitions of the input and output variables used for the machine learning models are provided. The data were obtained from numerical analyses using the commercial software LS-DYNA performed for multiple design variants of the vehicle structure. Owing to proprietary restrictions, the specific parameter values and design details are not disclosed in this paper. The analyzed variants were selected from configurations investigated during the vehicle development process and were based on the same vehicle architecture as that used in the target model.
3.1. Numerical Analysis Setup and Results
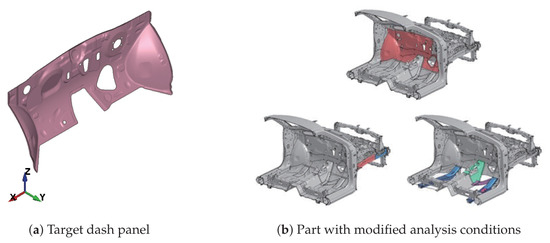
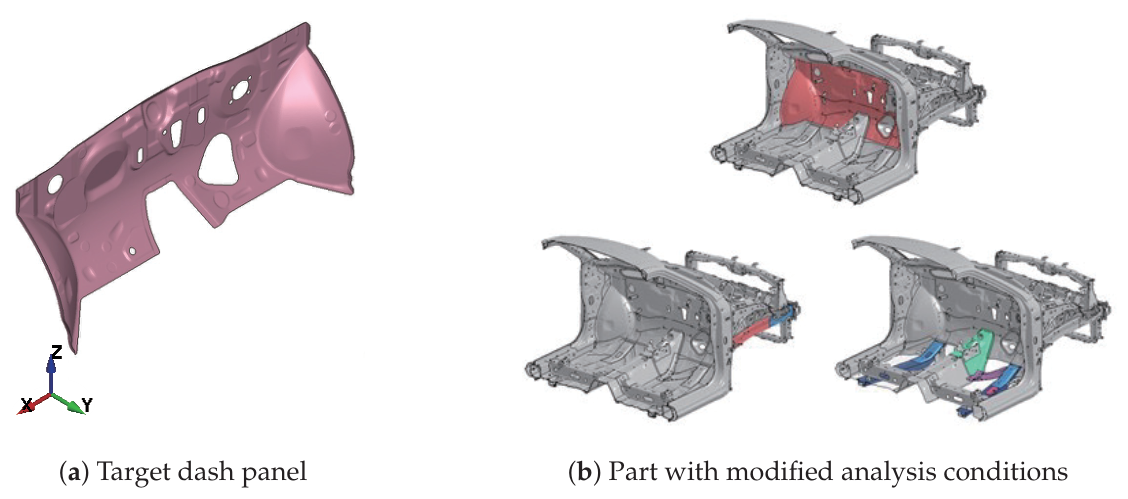
Figure 2 illustrates the dash panel model and the parts model used to define the analysis conditions in the crash simulations conducted in this study. Figure 2a shows the dash panel model, which consists of 33,895 elements and 33,750 nodes. Full-vehicle crash simulations were performed with this model for 14 cases, yielding a variety of dash panel deformation patterns. Figure 2b shows the model with modified analysis conditions. In these simulations, the deformation patterns were generated by varying the shell element thickness and material strength, while all other modeling parameters, including geometry, impact velocity, and impact angle, were kept identical across all cases. The positive Y-axis is defined as pointing from the front to the rear of the vehicle.
Figure 2.
Analysis model of dash panel.
Based on previous findings, deformation in the Y direction is the most influential factor governing dash panel deformation. Therefore, among the 14 analysis cases, particular attention is paid to the Y-direction displacement. The maximum Y-direction displacement for each case is listed in Table 1.
Table 1.
Maximum Y-displacement for each case.
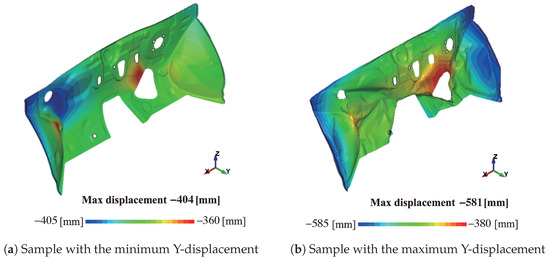
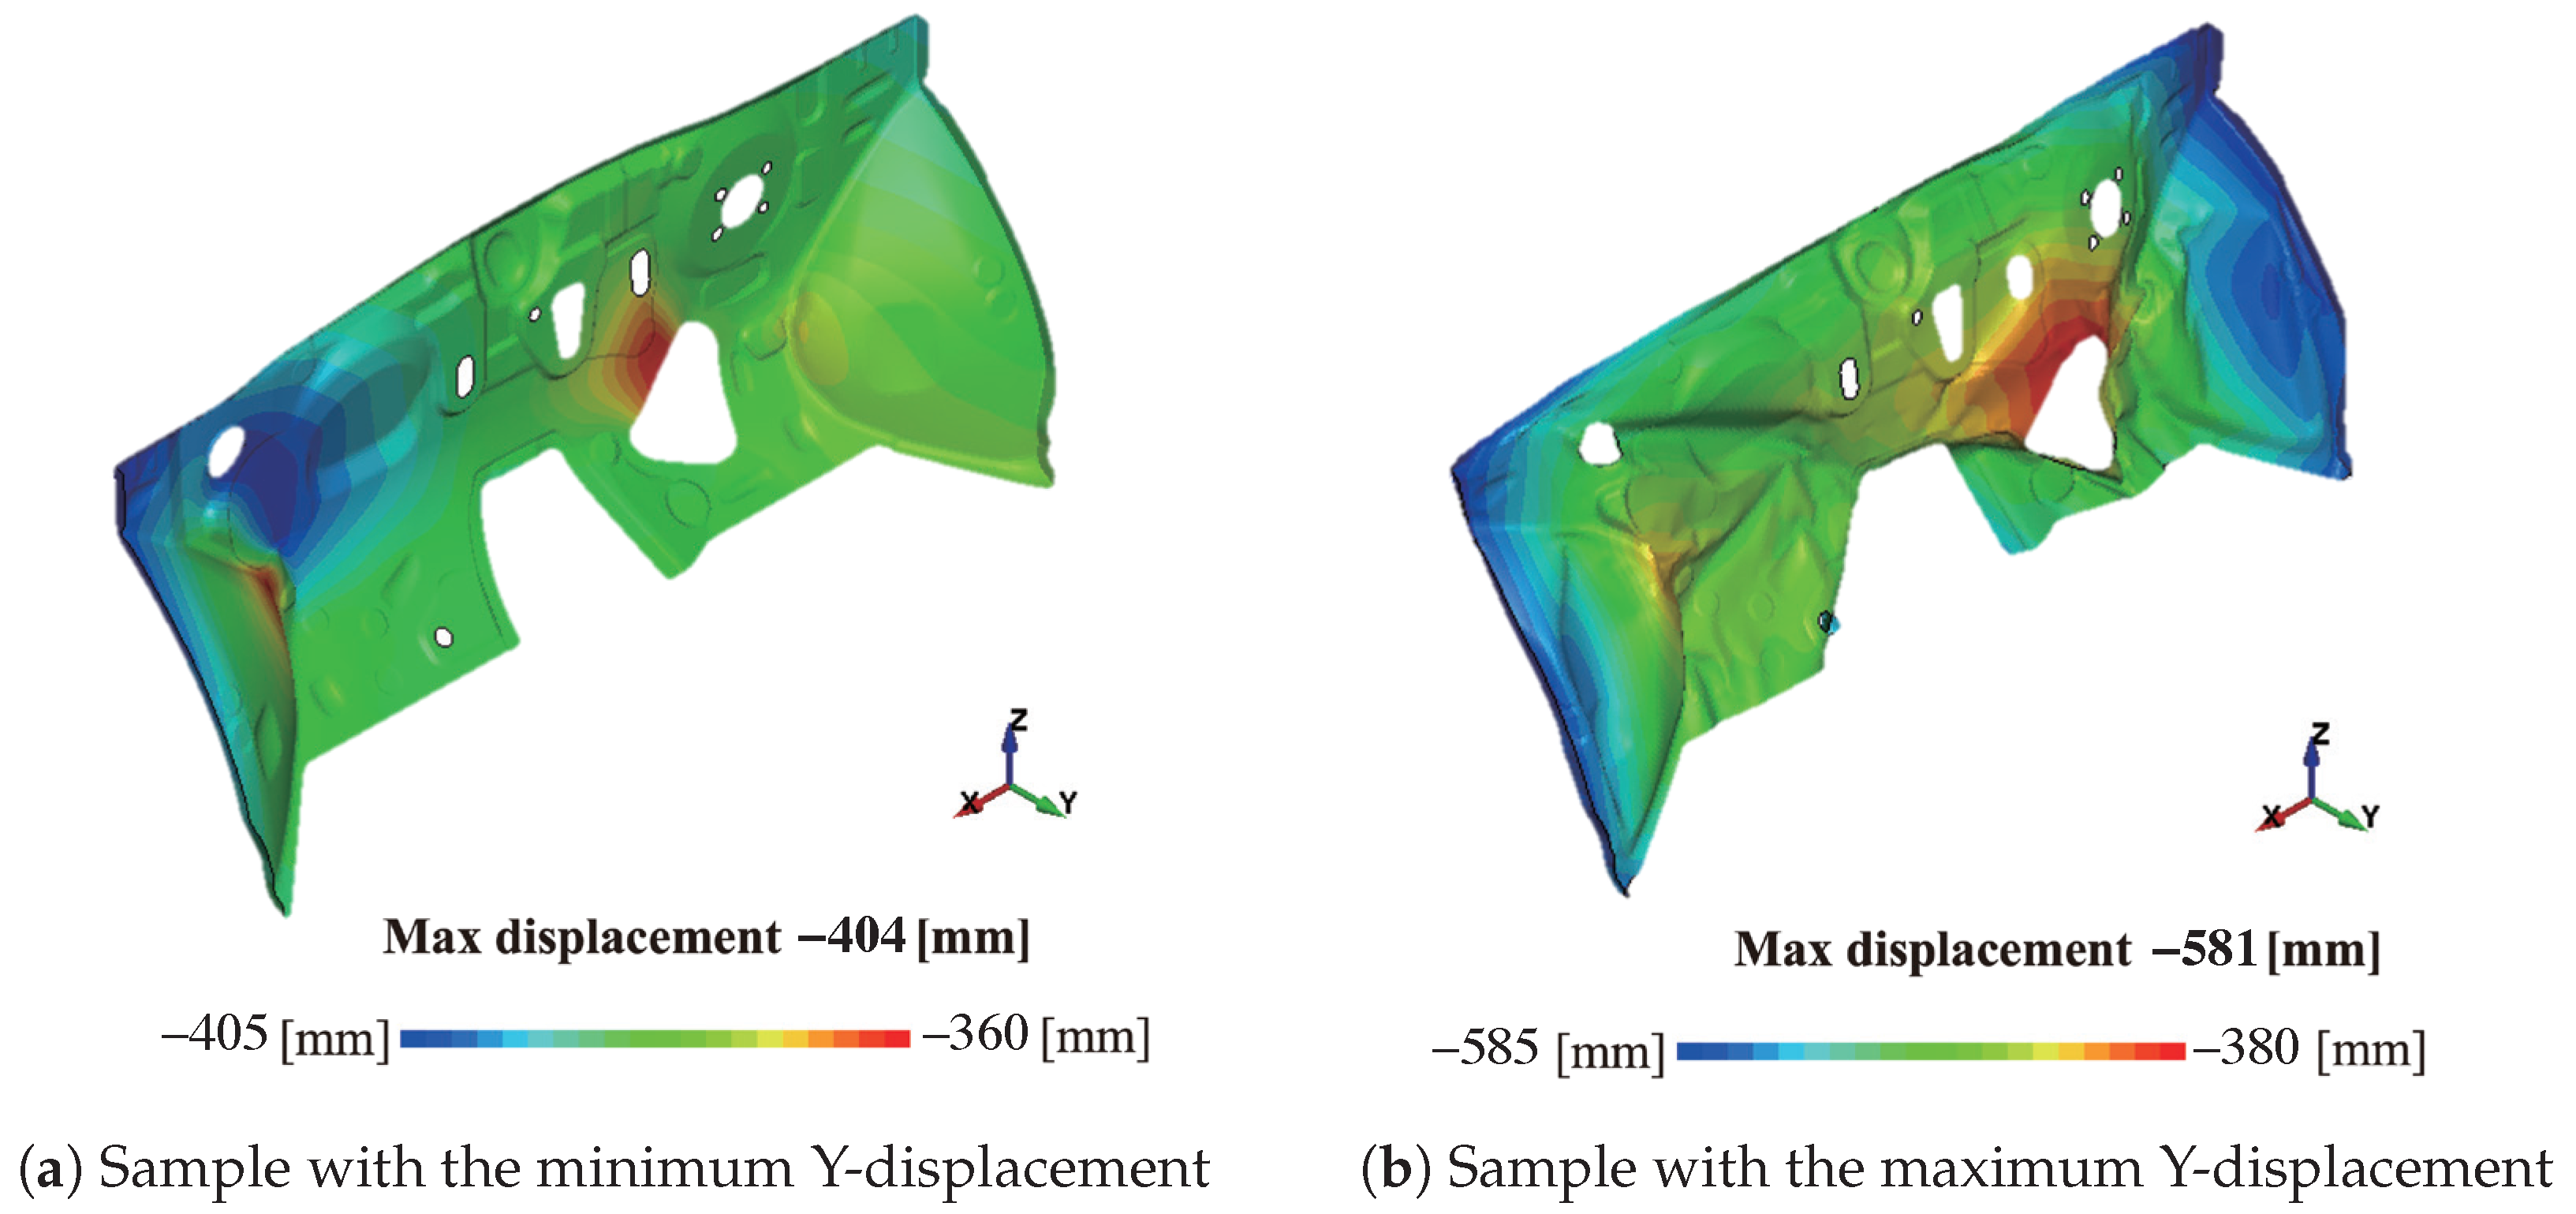
Figure 3 presents representative examples of the analysis results, including the cases with the minimum (Figure 3a) and maximum (Figure 3b) Y-direction displacements. These examples show that the resulting deformation patterns differ markedly between cases.
Figure 3.
Representative samples of the Y displacement.
It should be noted that the present dataset is limited in size and does not cover the full range of possible crash deformation patterns. Nevertheless, the analyzed cases were generated using physically consistent finite element crash simulations based on realistic vehicle models, material properties, and boundary conditions used during vehicle development. Therefore, the deformation patterns included in the dataset represent physically meaningful variations within the target design space rather than arbitrary deformation configurations. Further studies will investigate a broader range of design parameters and crash conditions to more comprehensively assess the robustness and generalization capability of the proposed framework.
3.2. Definition of Input and Output Variables
In this study, the deformation of the dash panel is described in terms of the X-, Y-, and Z-direction displacements at each node of the numerical model. Although deformation history data are available in the numerical results, the present method focuses on the nodal displacements in the final deformed configuration as the target of prediction.
Accordingly, the output variables of the machine learning model are defined as the X-, Y-, and Z-direction displacements at all nodes in the final deformed configuration.
Since the objective of this method is to generate deformation patterns for arbitrary input data, it is necessary to impose constraints on the input variables to ensure that only physically realizable shapes are produced. In this study, principal component analysis (PCA) is employed to characterize the intrinsic properties [24] and variability of the deformation data obtained from numerical simulations. Based on this analysis, the input variables for the machine learning model are constructed in a reduced and constrained space defined by the principal components. Details of the machine learning model are presented in the following section; here, the procedure for deriving the input variables from the numerical analysis results is described.
In the present study, the PCA basis is used to establish a common low-dimensional representation of deformation modes observed in the available simulation database. The principal components are introduced to describe the variability of deformation patterns and to constrain the generated shapes to physically realizable deformation modes. Thus, PCA serves as a deformation representation framework rather than a supervised feature extraction procedure for improving prediction accuracy. For this purpose, PCA was performed using all available deformation cases to construct a common deformation representation space. Although the test case was included in the PCA calculation, PCA was employed solely to define the deformation basis and did not use any information related to the machine learning targets. The prediction model itself was trained exclusively using the training dataset. Therefore, the influence of this procedure on the reported prediction performance is considered limited.
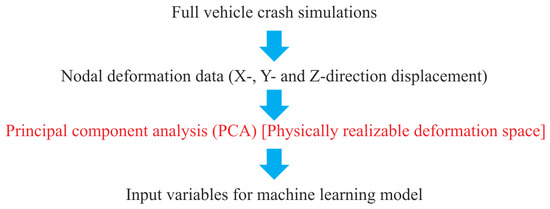
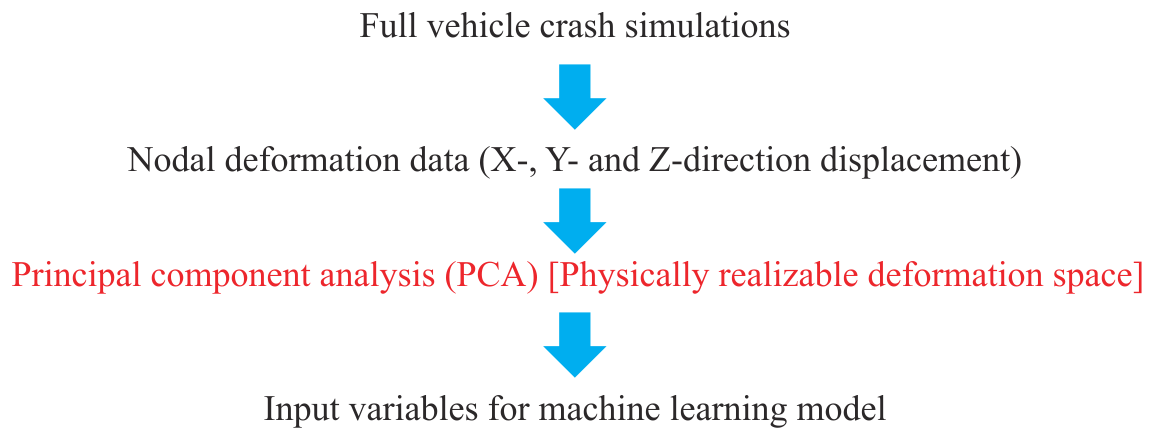
PCA is employed to extract the dominant sources of variation from the overall data distribution, rather than relying directly on explicit physical features. This procedure enables prediction and generation in an abstracted feature space, without being limited by direct physical interpretations. In principle, various choices of input variables can be considered for the PCA. In the present study, as a fundamental investigation, the maximum Y-direction displacement used to label each analysis case, together with the X-, Y-, and Z-direction displacements at each node, is adopted as the input dataset. The number of principal components employed as input variables is set to four. Figure 4 illustrates the workflow for the first step of the proposed framework, focusing on generating the dash panel deformation using numerical analysis and machine learning.
Figure 4.
Flowchart of PCA-based input variable construction.
4. Machine Learning Method
The present section outlines the machine learning method employed in this study. First, gradient boosting, which forms the fundamental concept underlying the adopted learning framework, is introduced. Next, eXtreme Gradient Boosting (XGBoost), the specific machine learning model used in this study, is described in detail. Finally, the workflow of the learning process is presented, including the procedures for performance evaluation and hyperparameter optimization. XGBoost is selected because it provides robust predictive performance on structured tabular data and is well-suited to situations where the available training data are limited. Considering that the objective of this study is to establish an efficient deformation-prediction framework rather than to identify the optimal learning algorithm, XGBoost was considered an appropriate choice for the present investigation.
4.1. Overview of Gradient Boosting
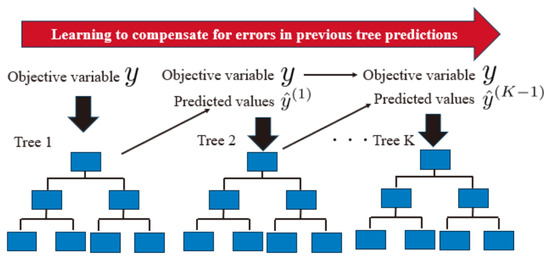
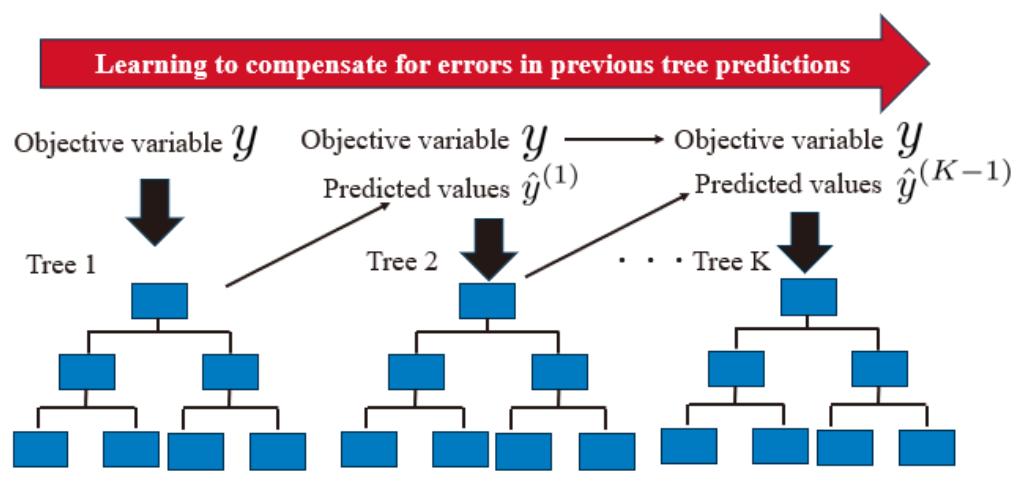
Gradient boosting is an ensemble learning method that boosts predictive performance by sequentially combining multiple weak learners, typically decision trees [25,26], as illustrated in Figure 5. The fundamental principle of gradient boosting is that each new model is trained to minimize the loss function by learning the residuals (prediction errors) of the ensemble constructed so far. Through this iterative process, successive models progressively correct errors from previous models, leading to improved overall prediction accuracy.
Figure 5.
Learning gradient boosting.
Gradient boosting is widely applied in machine learning for both regression and classification tasks. Several advanced algorithms based on this method have been developed to improve computational efficiency and scalability for large datasets, among which eXtreme Gradient Boosting (XGBoost), described in the following subsection, is one of the most representative examples.
4.2. XGBoost Model Formulation
XGBoost is a learning algorithm that introduces regularization and approximate split search into gradient boosted decision trees (GBDT) and delivers high performance, including on large-scale data. The formulation of XGBoost is shown according to Chen and Guestrin [27]. The prediction model in XGBoost is defined as an additive model consisting of K regression trees .
Each is a decision tree with a certain structure and parameters, and the entire model is learned by sequentially adding trees. Learning is formulated as the minimization of the following regularized objective function
Here, l is the loss function (e.g., squared error), T is the number of leaves, is the penalty for the number of nodes, and is the regularization coefficient for the weights. The objective function is minimized sequentially, and at the t-th step, the model is updated by adding a new tree . At this point, the objective function is approximated using a Taylor expansion as follows.
Here,
are the first and second order gradients, respectively.
When the set of instances belonging to leaf node j is denoted as , the optimal score of the leaf is given by the following.
The minimum value of the objective function at this point is expressed by the following equation.
The split evaluation function , which is the reduction in the objective function due to the split, is used to evaluate split candidates and is formulated as follows.
Here, is the parent node, and and are instance sets corresponding to the left and right child nodes, respectively. The function measures the quality of the split, such as information gain or Gini coefficient, and the split with the highest score is adopted. Furthermore, XGBoost improves performance and generalization using the following methods: shrinkage via the learning rate , column subsampling, sparse partitioning for missing values, and a weighted quantile sketch for approximate partitioning. These procedures empower XGBoost to serve as a powerful gradient boosting method that achieves high regularization, generalization, and computational efficiency.
4.3. Workflow and Performance Metrics
This subsection describes the procedure for constructing the machine learning model and evaluating its estimation performance. First, principal component analysis (PCA) is applied to the simulation data to extract feature variables used as explanatory variables.
To evaluate the generalization performance of the proposed model, the available simulation data are split into three subsets: training, validation, and test. A portion of the dataset is reserved as an independent test set and is not used during model training or hyperparameter tuning. The remaining data are used for model development and are further split into training and validation datasets at an 8:2 ratio. The training dataset is used to fit the model parameters, while the validation dataset is used for hyperparameter optimization.
Hyperparameters are optimized using Optuna [28] by minimizing the mean absolute error (MAE). The search ranges of the hyperparameters explored in this study are summarized below.
Model accuracy is assessed by predicting the target variables on the test dataset and evaluating the resulting predictions. The MAE and the coefficient of determination () are used as evaluation measures and are defined as follows.
Here, denotes the actual value of the i-th sample, denotes the predicted value, N is the number of samples, and represents the mean of the actual values.
The MAE evaluates the average magnitude of the prediction error and approaches zero as prediction accuracy improves. Because MAE assigns identical weight to all errors, it is less sensitive to large deviations, which may lead to relatively large maximum errors when models are selected solely on the basis of MAE. The coefficient of determination measures the goodness-of-fit of the regression model, and values closer to 1 indicate higher predictive accuracy.
5. Evaluation of Vehicle Body Deformation Prediction
This section evaluates the first-stage deformation prediction model of the proposed machine learning framework. Principal component analysis (PCA) is employed to represent dash panel deformation patterns in a reduced feature space, and XGBoost is used to predict the corresponding deformation modes.
The model is trained and evaluated using a limited number of crash simulation datasets, and investigates the feasibility of deformation prediction. Prediction accuracy is examined through validation and test datasets, and the reconstructed deformation shapes are compared with the reference numerical results. The results suggest that the proposed model can reproduce the major deformation characteristics of the dash panel, although differences persist in certain localized deformation regions.
5.1. Representation of Deformation Using Principal Components
As described in Section 3, PCA is applied to extract feature variables used as explanatory inputs for the machine learning model. Following the procedure outlined above, the 14 simulation cases listed in Table 1 are divided into training, validation, and test datasets. The case with the maximum Y-direction displacement of 536 mm is selected as the test dataset to evaluate the proposed model’s capability. The remaining 13 cases are used for model development and are randomly split into training and validation datasets at an 8:2 ratio.
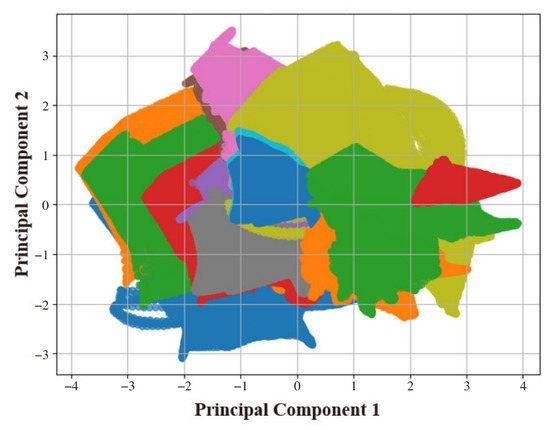
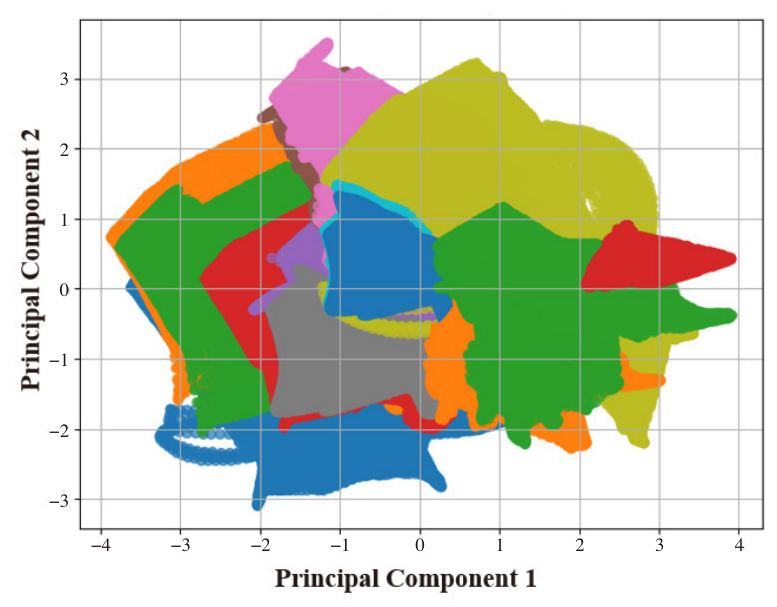
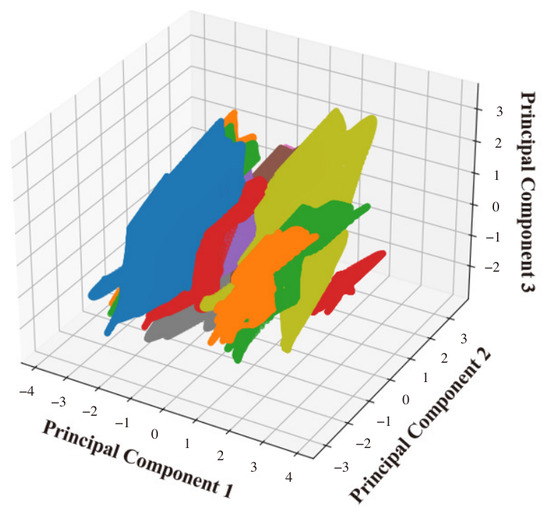
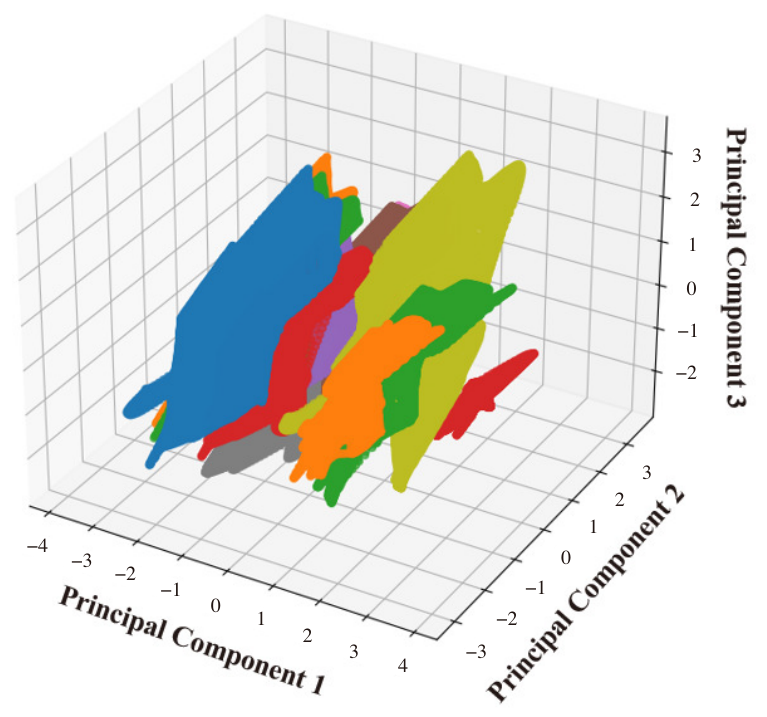
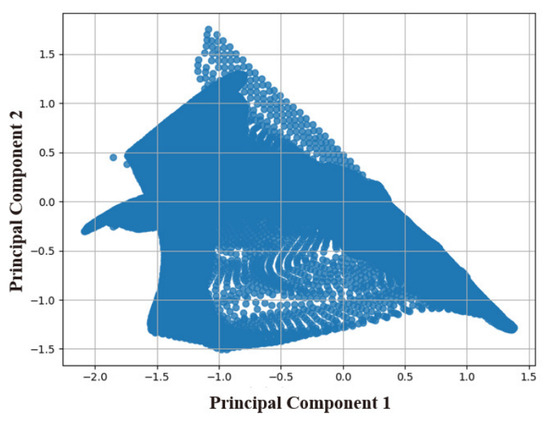
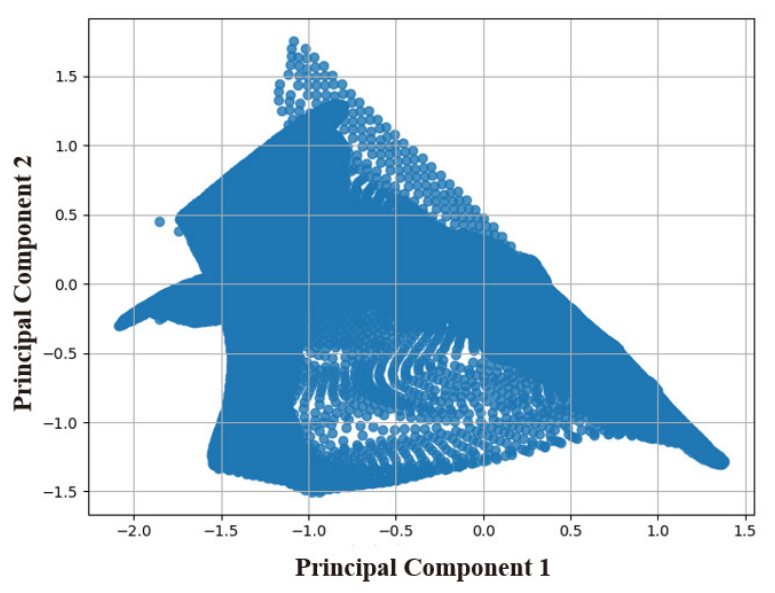
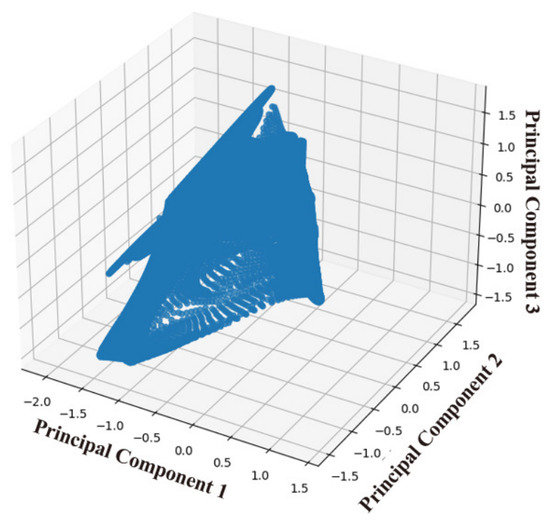
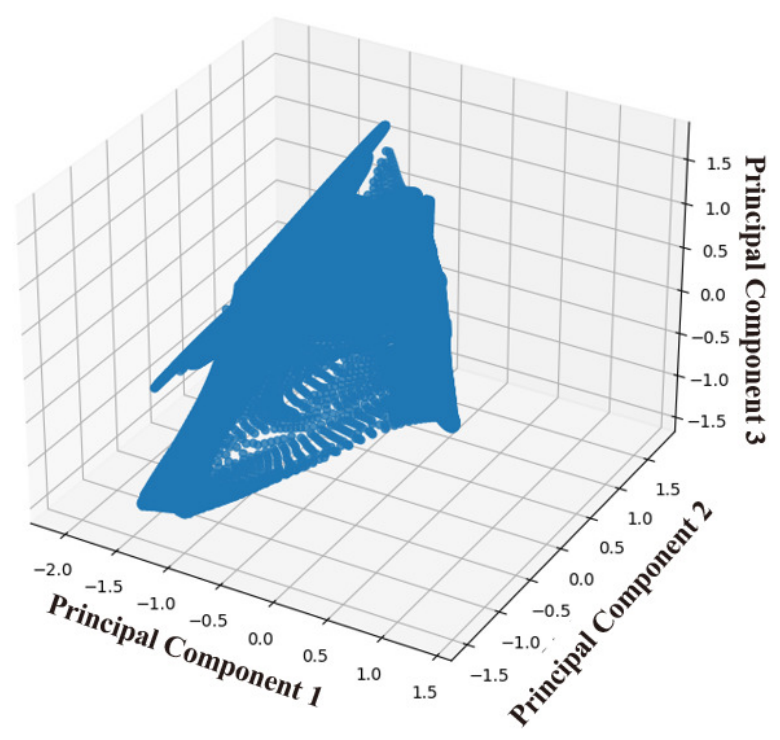
PCA was performed on all available deformation data from 14 cases, using the maximum Y-direction displacement and the nodal displacements in the X-, Y-, and Z-directions to establish a common deformation representation space. Although the test case was included in the PCA calculation, PCA is an unsupervised dimensionality-reduction technique and does not utilize the target variables used for machine learning. Therefore, the influence on prediction performance is expected to be limited. The purpose of PCA in this study was to construct a compact deformation representation rather than to optimize the prediction model. Figure 6 and Figure 7 show the PCA results obtained from the training and validation datasets. In addition, the PCA results for the test case with the maximum Y-direction displacement of 536 mm are presented in Figure 8 and Figure 9.
Figure 6.
Projection onto the first two principal components. Different colors
represent different input cases listed in Table 1.
Figure 7.
Projection onto the first three principal components. Different colors
represent different input cases listed in Table 1.
Figure 8.
Projection onto the first two principal components for test data.
Figure 9.
Projection onto the first three principal components for test data.
5.2. Prediction Accuracy and Performance Evaluation
In this study, separate machine learning models are constructed for the X-, Y-, and Z-direction displacements. The optimization objective is the minimization of the sum of the MAEs for X-, Y-, and Z-direction predictions, and the hyperparameters are optimized accordingly. The search ranges of the XGBoost hyperparameters are specified in Table 2, and the optimized results are summarized in Table 3.
Table 2.
Hyperparameter search ranges.
Table 3.
Hyperparameters for XGBoost.
The corresponding prediction performance on the validation dataset is evaluated using the MAE and the coefficient of determination , as summarized in Table 4. As shown in Table 4, the MAE values for the X-, Y-, and Z-direction displacements remain small, and the corresponding values are close to , indicating that the model can reproduce the displacement responses with reasonable accuracy. The computational efficiency of the proposed framework was also evaluated. One full-vehicle crash simulation typically required approximately 10–20 h, whereas prediction using the trained machine learning model took only tens of seconds per sample.
Table 4.
MAE and for X, Y, and Z displacements on the validation data.
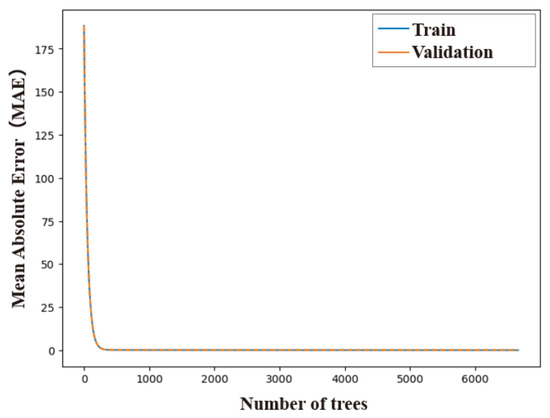
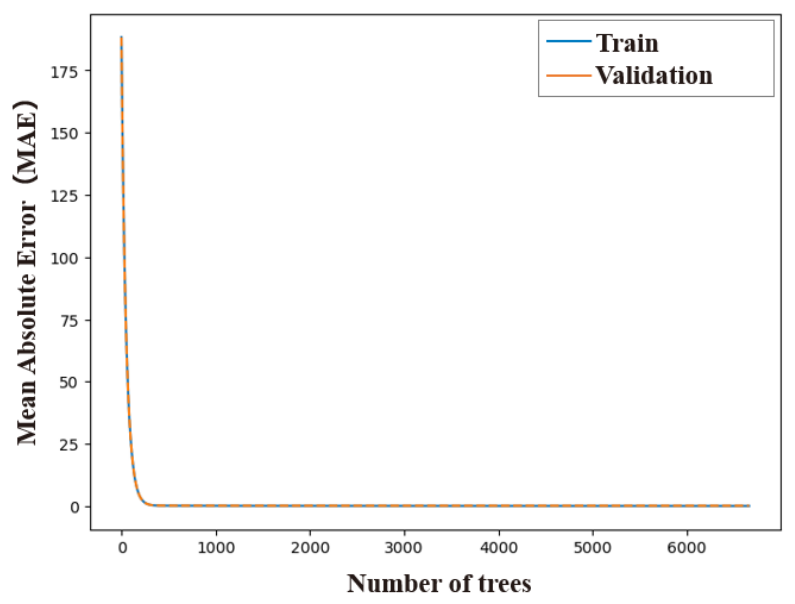
Figure 10 presents the learning curve for the Y-direction displacement as a representative example. The blue and orange lines correspond to the MAE values for the training and validation datasets, respectively. Both errors decrease as the number of trees increases and eventually approach nearly constant values. In addition, the validation error remains stable throughout training and does not increase as model complexity grows. The similar behavior observed for the training and validation datasets suggests that the model converges in a stable manner without exhibiting the typical signs of severe overfitting.
Figure 10.
Learning curve of the XGBoost model (training and validation error).
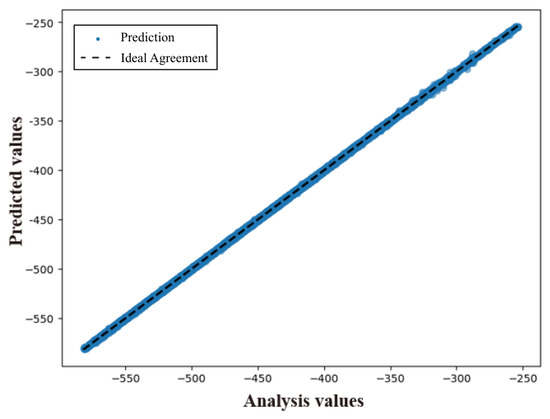
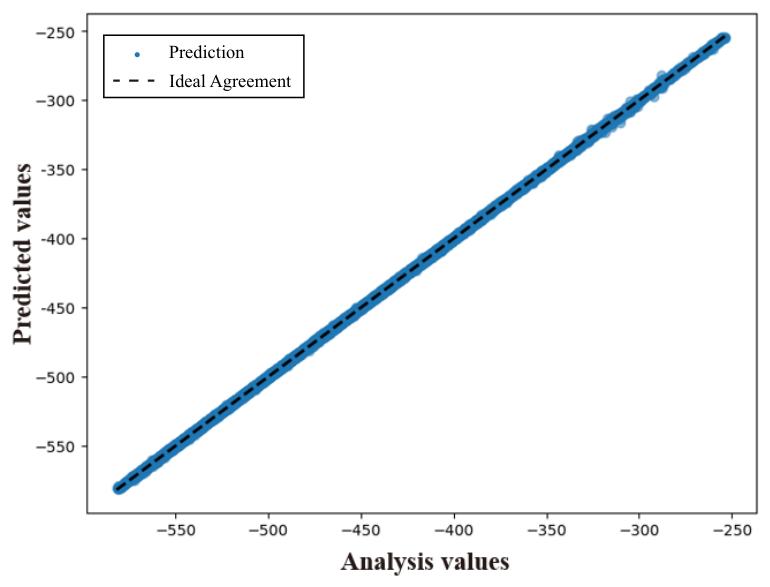
Figure 11 presents a scatter plot of predicted versus analytical Y-direction displacement values for the validation dataset, with the predicted values on the vertical axis and the analytical values on the horizontal axis. The black dashed line represents the ideal agreement between the predicted and analytical values, and the predicted values are closely distributed around this line.
Figure 11.
Comparison of analysis and predicted Y-direction displacement fields for validation data.
These results suggest that the proposed model can reasonably capture the relationship between the input features and the Y-direction displacement.
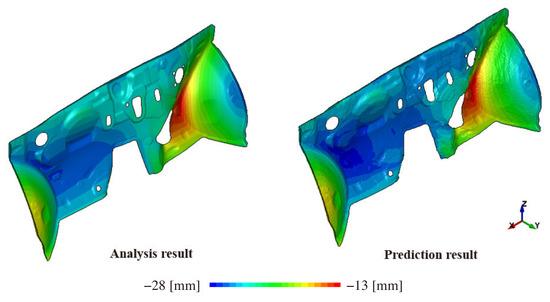
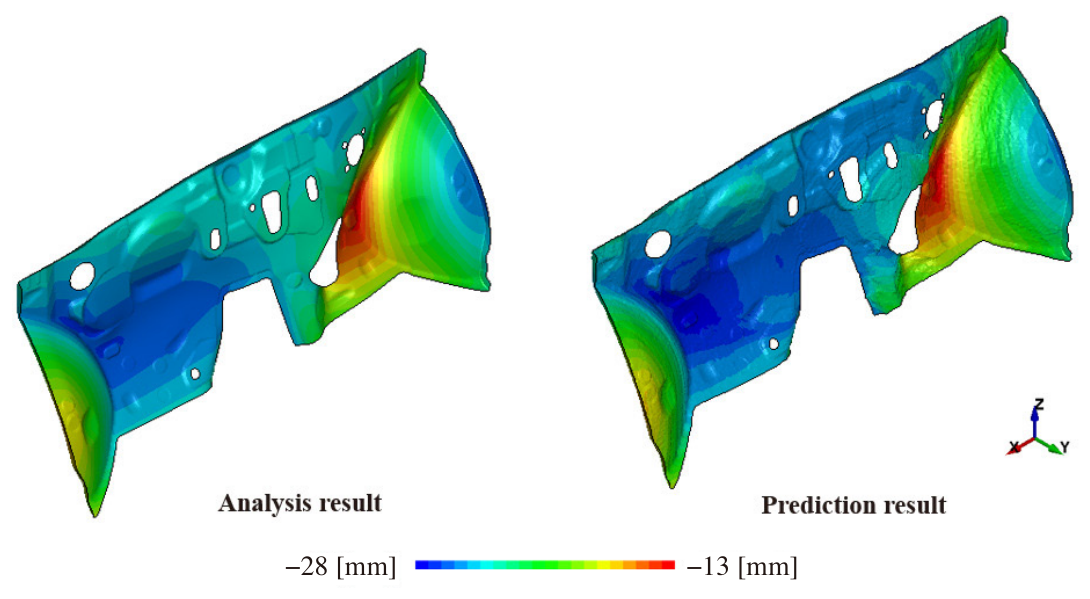
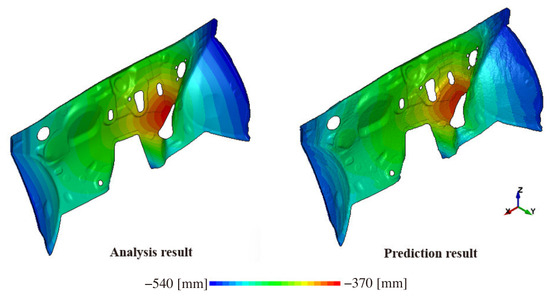
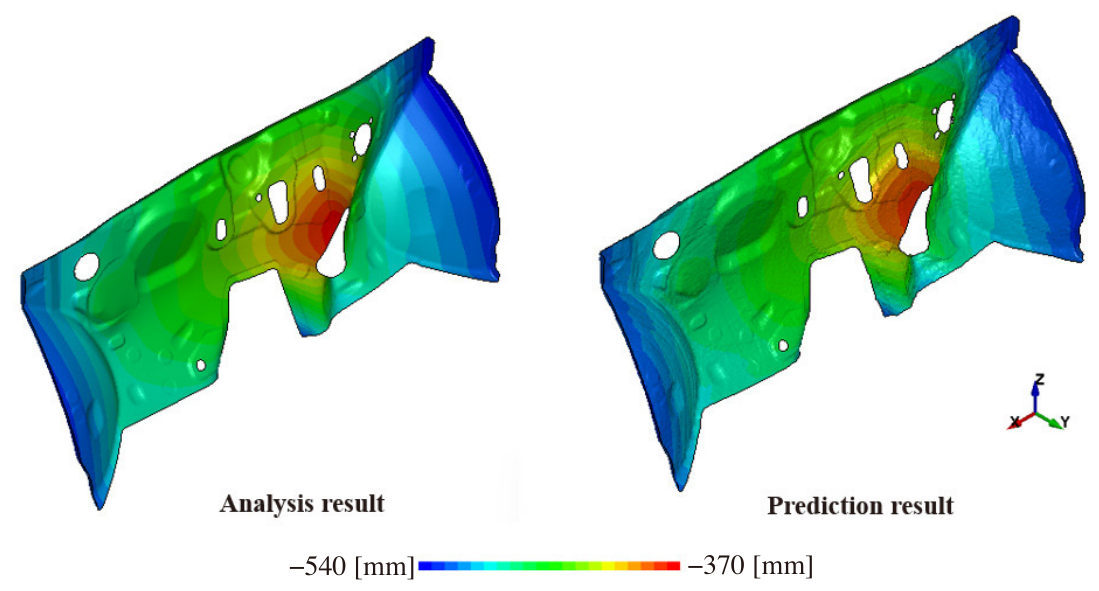
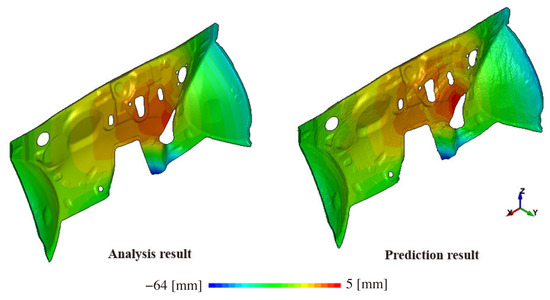
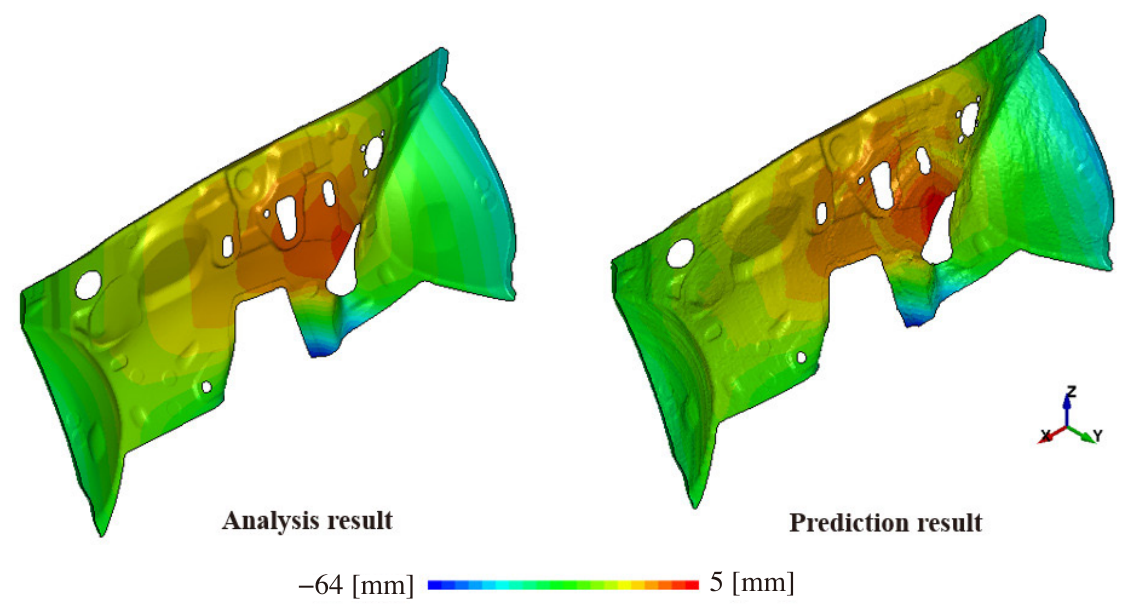
Furthermore, the trained model is evaluated using the test dataset. The MAE and values obtained for the test dataset are summarized in Table 5. Although the MAE values for the test dataset are larger than those for the validation dataset, the corresponding values remain relatively high, suggesting that the dominant deformation trends are preserved for unseen data. Figure 12, Figure 13 and Figure 14 present contour plots comparing the predicted and analytical displacement fields in the X-, Y-, and Z-directions, respectively. These contour plots illustrate the displacement distributions and suggest that the proposed model reasonably captures the overall deformation characteristics of the dash panel. A closer examination of the results reveals that the predicted displacement fields exhibit a coarser distribution than those obtained from the numerical analysis.
Table 5.
MAE and for X, Y, and Z displacements on the test data.
Figure 12.
Comparison of analysis and predicted X-direction displacement fields. The proposed model shows good agreement with the reference analysis, capturing the overall deformation pattern and local variations in displacement.
Figure 13.
Comparison of analysis and predicted Y-direction displacement fields. The proposed model shows good agreement with the reference analysis, capturing the overall deformation pattern and local variations in displacement.
Figure 14.
Comparison of analysis and predicted Z-direction displacement fields. The proposed model shows good agreement with the reference analysis, capturing the overall deformation pattern and local variations in displacement.
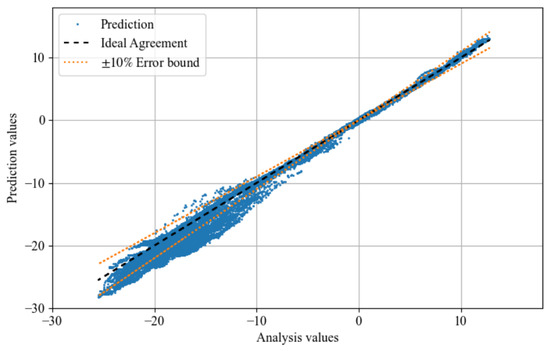
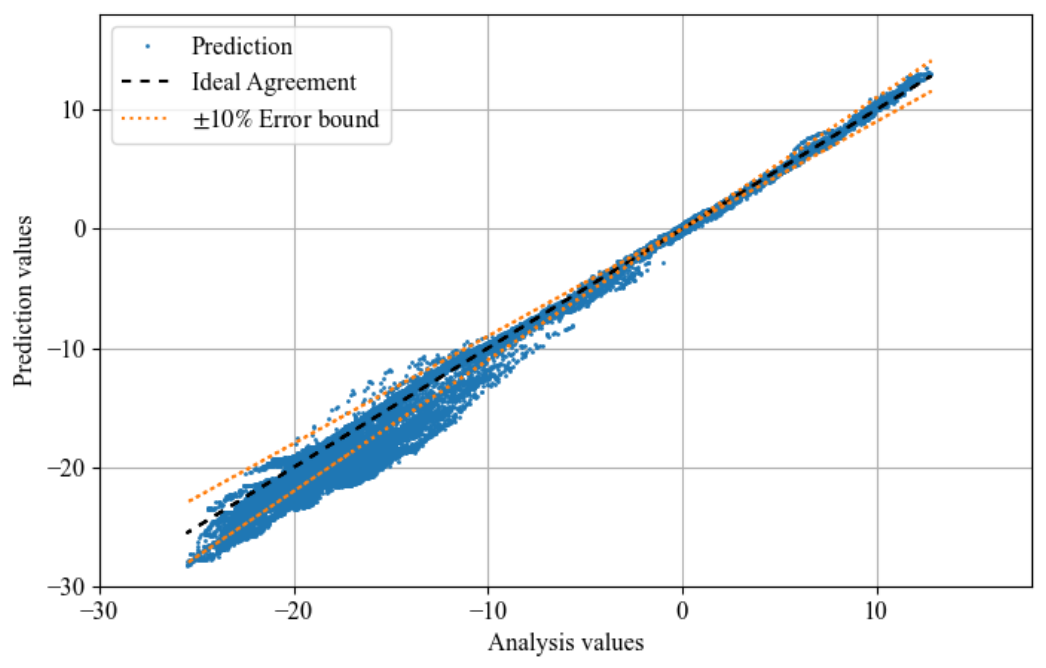
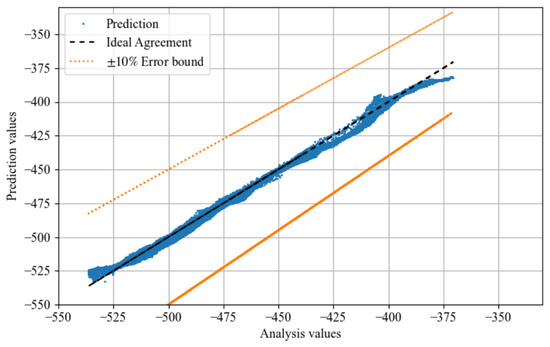
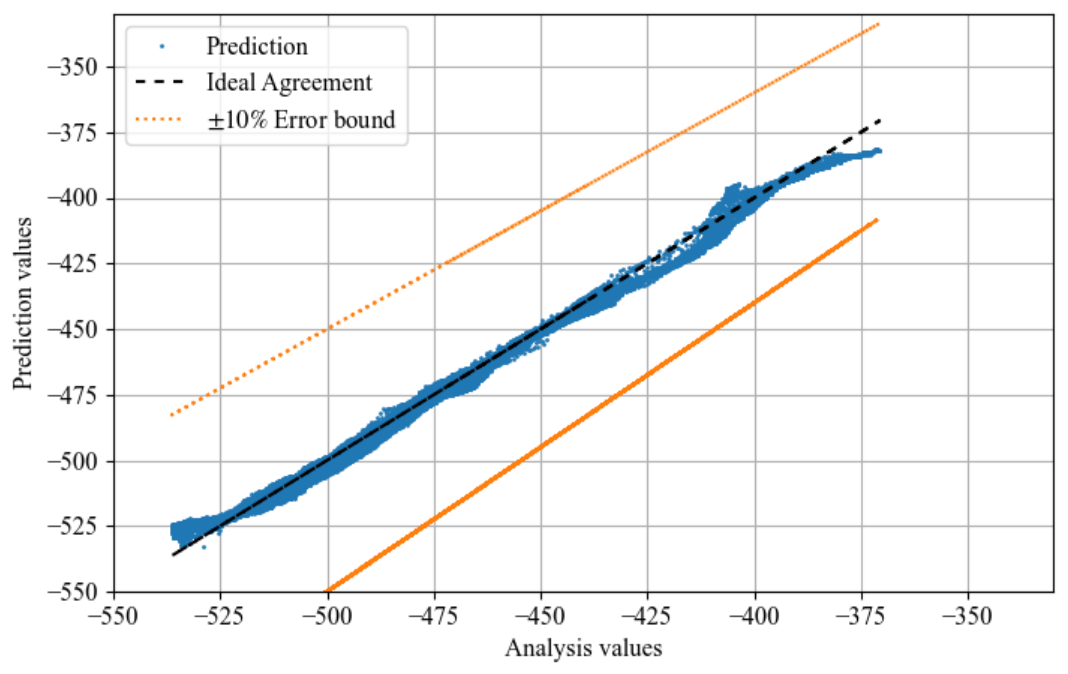
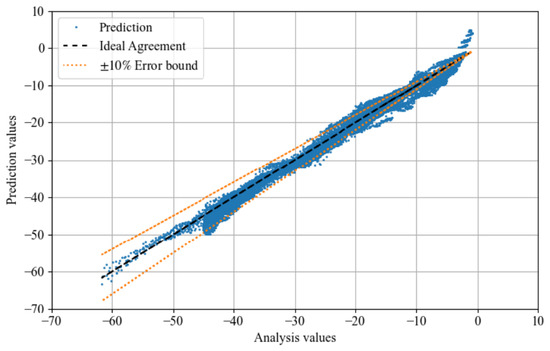
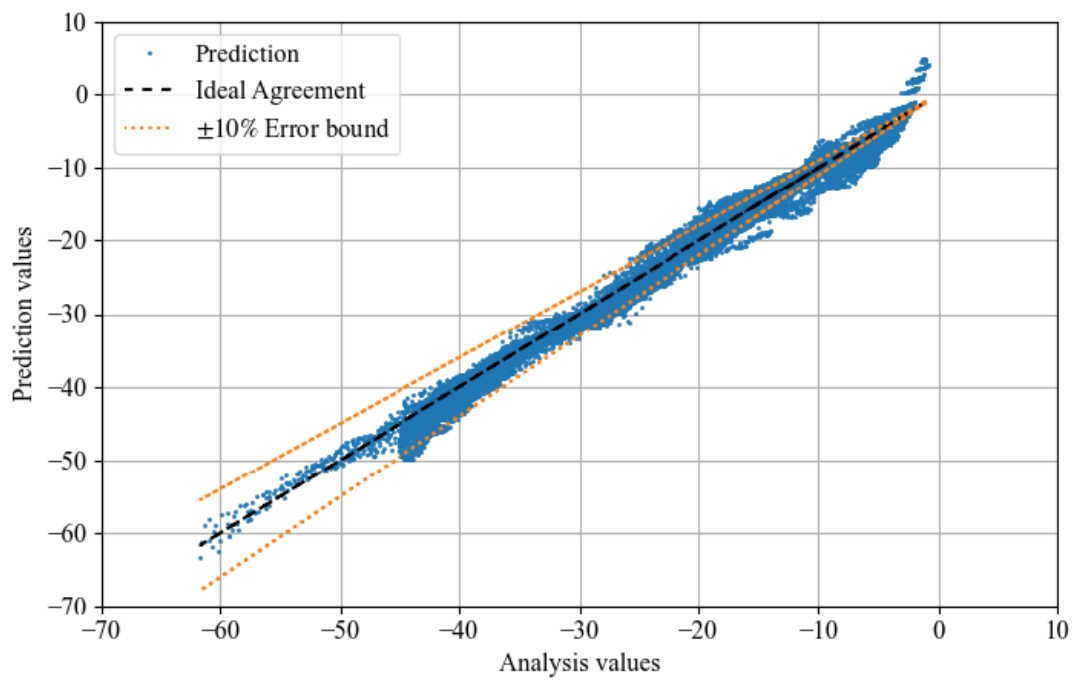
In addition, Figure 15, Figure 16 and Figure 17 present scatter plots comparing the predicted and analytical displacement values for the test dataset in the X-, Y-, and Z-directions, respectively. The black dashed line indicates the ideal agreement for each case, and the orange dashed line indicates the error envelope. As shown in Figure 15, Figure 16 and Figure 17, most prediction results are distributed close to the ideal agreement line and fall within the error bounds, indicating that the proposed model reproduces the simulation results with reasonable accuracy. The largest errors are observed in regions with large deformation responses. The data points located outside the error bounds are primarily concentrated in the displacement range of approximately −10 to −20. These values correspond to the blue regions in the contour plot shown in Figure 12, where localized deformation gradients are relatively large. Consequently, even small prediction discrepancies may lead to noticeable differences in the contour distribution and increased relative errors. Nevertheless, the majority of the nodal predictions remain within the error bounds, and the overall deformation pattern is consistently reproduced. These results suggest that the proposed model reasonably predicts the dominant deformation characteristics.
Figure 15.
Comparison of analysis and predicted X-direction displacement fields for test data.
Figure 16.
Comparison of analysis and predicted Y-direction displacement fields for test data.
Figure 17.
Comparison of analysis and predicted Z-direction displacement fields for test data.
The Y-direction displacement shows the largest deformation among the three displacement components. The range of the displacement in the X and Z directions is considerably smaller, approximately one order of magnitude lower than that in the Y direction. Correspondingly, the prediction errors in the X and Z directions are also smaller when evaluated in terms of absolute displacement. The largest errors are observed in areas where relatively large deformation occurs. However, the overall deformation tendency of the dash panel, particularly in the Y direction, is generally consistent with the corresponding analysis results. These results show that the proposed model reproduces the overall deformation behavior of the dash panel, although noticeable differences remain in some localized deformation regions.
Overall, the proposed learning model reproduces the global deformation behavior of the dash panel reasonably well, whereas its capability to capture localized deformation features remains limited. These limitations may arise from multiple factors. The PCA-based representation primarily retains dominant global deformation modes, while the node-wise prediction strategy does not explicitly account for spatial continuity or mesh connectivity. Future improvements may therefore involve incorporating spatial or topology-related information and exploring alternative deformation representations for preserving localized deformation features. The validation case used in this study is located within the distribution of the training data in the PCA feature space. Therefore, the prediction task corresponds to interpolation within the learned design domain. Although only one validation case was examined, similar prediction performance is expected for other cases that remain within the same training data distribution. Furthermore, this study validates the proposed framework only for predicting the final deformation field. Prediction of deformation histories, acceleration pulses, and occupant injury metrics was beyond the scope of this study. Extending the framework to incorporate these capabilities represents an important direction for future research. In addition, the present validation was conducted using a limited test configuration and does not provide a comprehensive assessment of model generalization. More rigorous validation procedures, including leave-one-out cross-validation and evaluations using multiple unseen cases, are necessary to further investigate the robustness and predictive capability of the proposed method. In practical applications involving an actual unseen vehicle, geometric features would first be extracted from the corresponding CAD or finite element model and projected onto the PCA basis constructed during training to obtain the principal component variables. However, this workflow is outside the scope of the present study. Within the scope of this study, the principal component variables are treated as design variables and are sampled within the interpolation region of the feasible PCA space to predict representative final deformation configurations. This strategy enables efficient exploration of deformation modes while maintaining consistency with the deformation characteristics represented in the training dataset.
6. Conclusions
This study proposed a two-stage machine learning-based framework for occupant lower-limb injury assessment, in which the deformation behavior of the dash panel is first predicted and subsequently used for injury evaluation. As an initial investigation, the present study focused on the first stage of the framework and examined the feasibility of predicting the final deformation field of the dash panel from limited crash simulation data. The predicted deformation shapes reproduced the major displacement patterns observed in the analysis results, although larger differences were found in several locally deformed regions. Considering the limited number of training cases used in this study, the model was able to approximate the overall deformation behavior of the dash panel. These results support the feasibility of using machine learning to estimate dash-panel deformation as the first stage of the proposed framework. Accordingly, the present study validated only the capability to predict the final deformation field. Incorporating acceleration pulses and predicting occupant injury were beyond the scope of the present work. In addition, several limitations remain in the current study. In particular, the prediction accuracy for localized deformation features was limited, which may be related not only to the PCA-based representation adopted in this work but also to the restricted size and diversity of the available training data. Therefore, further investigation is required to clarify the influence of these factors and to improve the robustness of the proposed approach. Future work will include systematic comparisons with baseline machine learning models to further clarify the advantages and limitations of the proposed XGBoost-based framework. In addition, a more rigorous validation procedure, in which PCA is recomputed within each training fold during cross-validation, will be investigated to eliminate potential information leakage and provide a more unbiased assessment of predictive performance. Moreover, the second stage of the framework, namely injury prediction based on the generated deformation behavior, will be evaluated to assess the practical applicability of the overall methodology for occupant lower-limb injury assessment. Finally, from a practical standpoint, the proposed framework provides an efficient basis for predicting representative dash-panel deformation behaviors within a PCA-based design space. In the present study, the principal component variables were treated as design variables representing feasible deformation modes within the interpolation region defined by the training data in the PCA space. Therefore, the scope of this study is the efficient prediction of representative deformation behaviors within the learned design domain rather than the direct prediction of arbitrary unseen vehicle geometries. Practical application to unseen vehicle designs will require geometric feature extraction from CAD or finite element models followed by projection onto the established PCA basis, which will be investigated in future work.
Author Contributions
Conceptualization, H.S. and K.N. (Kei Nagasaka); Methodology, H.S.; Validation, K.N. (Kyohei Noguchi), K.N. (Kei Nagasaka), I.M. and Y.Y.; Formal analysis, K.N. (Kyohei Noguchi); Investigation, I.M.; Data curation, K.N. (Kyohei Noguchi) and Y.Y.; Writing—original draft, H.S.; Supervision, S.O.; Project administration, S.O. All authors have read and agreed to the published version of the manuscript.
Funding
This research received no external funding.
Institutional Review Board Statement
Not applicable.
Informed Consent Statement
Not applicable.
Data Availability Statement
The data presented in this study are available on request from the corresponding author.
Conflicts of Interest
Authors Kei Nagasaka and Idemitsu Masuda were employed by the company Suzuki (Japan), Hamamatsu. Author Yuta Yokoyama was employed by the company Diver Technology Corporation. The remaining authors declare that the research was conducted in the absence of any commercial or financial relationships that could be construed as a potential conflict of interest.
References
- Li, N.; Fang, H.; Zhang, C.; Gutowski, M.; Palta, E.; Wang, Q. A numerical study of occupant responses and injuries in vehicular crashes into roadside barriers based on finite element simulations. Adv. Eng. Softw. 2015, 90, 22–44. [Google Scholar] [CrossRef] [Scilit]
- Gao, W.; Zhao, G.; He, X.; Chen, S.; Wang, C. A high-fidelity numerical approach for dummy head-windshield contact interactions. Int. J. Impact Eng. 2023, 176, 104560. [Google Scholar] [CrossRef] [Scilit]
- Deng, X.; Potula, S.; Grewal, H.; Solanki, K.N.; Tschopp, A.A.; Horstemeyer, M.F. Finite element analysis of occupant head injuries: Parametric effects of the side curtain airbag deployment interaction with a dummy head in a side impact crash. Accid. Anal. Prev. 2013, 55, 232–241. [Google Scholar] [CrossRef] [Scilit] [PubMed]
- Xiao, S.; Yang, J.; Huang, J.; Crendall, J.R. Development of a belted occupant FE model for prediction of chest injury risk based on stress and strain analysis. J. Mech. Med. Biol. 2017, 17, 5. [Google Scholar] [CrossRef] [Scilit]
- Ekambaram, K.; Frampton, R.; Lenard, J. Factors associated with chest injuries to front seat occupants in frontal impacts. Traffic Inj. Prev. 2019, 20, S37–S42. [Google Scholar] [CrossRef] [Scilit] [PubMed]
- Berthelson, P.R.; Ghassmei, P.; Wood, J.W.; Liu, Y.; Al-Graitti, A.J.; Jones, M.D.; Chowdhury, S.; Prabhu, R.K. Evaluation of occupant neck injury response to varied impact conditions using a finite element-mathematical surrogate modeling approach. Int. J. Crashworthiness 2022, 27, 1726–1742. [Google Scholar]
- Xiao, S.; Shi, X.; Sun, X.; Zhang, H.; Ma, W.; Liu, Z. Impact overlaps on occupant lower limb injuries under car frontal crash. Int. J. Automot. Technol. 2022, 23, 659–665. [Google Scholar] [CrossRef] [Scilit]
- Ye, X.; Gaewsky, J.P.; Miller, L.E.; Jones, D.A.; Kelly, M.E.; Suhey, J.D.; Koya, B.; Weaver, A.A.; Stitzel, J.D. Numerical investigation of driver lower extremity injuries in finite element frontal crash reconstruction. Traffic Inj. Prev. 2018, 19, S21–S28. [Google Scholar] [CrossRef] [Scilit] [PubMed]
- Benson, D.J. Computational methods in Lagrangian and Eulerian hydrocodes. Comput. Methods Appl. Mech. Eng. 1992, 99, 235–394. [Google Scholar] [CrossRef] [Scilit]
- Belytschko, T.; Liu, W.K.; Moran, B.; Elkhodary, K. Nonlinear Finite Elements for Continua and Structures, 2nd ed.; Wiley: Hoboken, NJ, USA, 2014. [Google Scholar]
- Vurtur Badarinath, P.; Chierichetti, M.; Davoudi Kakhki, F. A Machine Learning Approach as a Surrogate for a Finite Element Analysis: Status of Research and Application to One Dimensional Systems. Sensors 2021, 21, 1654. [Google Scholar] [CrossRef] [Scilit] [PubMed]
- Jokar, M.; Semperlotti, F. Finite element network analysis: A machine learning based computational framework for the simulation of physical systems. Comput. Struct. 2021, 247, 106484. [Google Scholar] [CrossRef] [Scilit]
- Capuano, G.; Rimoli, J.J. Smart finite elements: A novel machine learning application. Comput. Methods Appl. Mech. Eng. 2019, 345, 363–381. [Google Scholar] [CrossRef] [Scilit]
- Kohar, P.C.; Grave, L.; Eller, K.T.; Connolly, S.D.; Inal, K. A machine learning framework for accelerating the design process using CAE simulations: An application to finite element analysis in structural crashworthiness. Comput. Methods Appl. Mech. Eng. 2021, 385, 114008. [Google Scholar] [CrossRef] [Scilit]
- Shao, Y.; Shi, X.; Zhang, Y.; Shiwakoti, N.; Xu, Y.; Ye, Z. Injury severity prediction and exploration of behavior-cause relationships in automotive crashes using natural language processing and extreme gradient boosting. Eng. Appl. Artif. Intell. 2024, 133, 108542. [Google Scholar] [CrossRef] [Scilit]
- Ahn, H.; Yu, Y.; Lee, S.; Cho, J.Y. Machine learning model incorporating domain knowledge for predicting maximum deflection of reinforced concrete beams under low-velocity impact. Int. J. Impact Eng. 2026, 207, 105483. [Google Scholar]
- Zheng, H.; Li, C.; Sun, Y.; Han, Q.; Yao, X. Impact protection mechanism and failure prediction of modular hierarchical honeycomb system with self-locking effect. Int. J. Impact Eng. 2025, 201, 105274. [Google Scholar] [CrossRef] [Scilit]
- Li, H.; Zhao, Y.; Zhou, H.; Pfaff, T.; Li, N. A graph neural network surrogate model for mesh-based crashworthiness prediction of vehicle panel components. Results Eng. 2026, 30, 110925. [Google Scholar] [CrossRef] [Scilit]
- Czech, C.; Lesjak, M.; Bach, C.; Duddeck, F. Data-driven models for crashworthiness optimisation: Intrusive and non-intrusive model order reduction techniques. Struct. Multidiscip. Optim. 2022, 65, 190. [Google Scholar] [CrossRef] [Scilit]
- You, J.; Zhao, Y.; Jia, L.; Wang, N.; Sun, Z.; Zou, W.; Hu, Y.; Liu, L.; Zhang, C. A fast crashworthiness assessment framework: Sectional force-based multi-stage physics informed surrogate model. Adv. Eng. Softw. 2026, 213, 104090. [Google Scholar]
- Gider, V.; Ekinci, S.; Izci, D.; Gokalp, I.; Rashdan, M.; Salman, M. Comparative evaluation of XGBoost, TabNet, and FT transformer models for fatal crash prediction under extreme class imbalance. Sci. Rep. 2026, in press. [Google Scholar] [CrossRef] [Scilit] [PubMed]
- Shwartz-Ziv, R.; Armon, A. Tabular data: Deep learning is not all you need. Inf. Fusion 2022, 81, 84–90. [Google Scholar] [CrossRef] [Scilit]
- Grinsztajn, L.; Oyallon, E.; Varoquaux, G. Why do tree-based models still outperform deep learning on tabular data? arXiv 2022, arXiv:2207.08815. [Google Scholar]
- Abdi, H.; Williams, L. Principal component analysis. Wires Comput. Stat. 2010, 2, 433–459. [Google Scholar] [CrossRef] [Scilit]
- Friedman, J.H. Greedy function approximation: A gradient boosting machine. Ann. Stat. 2001, 29, 1189–1232. [Google Scholar] [CrossRef] [Scilit]
- He, Z.; Lin, D.; Lau, T.; Wu, M. Gradient Boosting Machine: A Survey. arXiv 2019, arXiv:1908.06951. [Google Scholar]
- Chen, T.; Guestrin, C. XGBoost: A scalable Tree Boosting System. In Proceedings of the 22nd ACM SIGKDD International Conference on Knowledge Discovery and Data Mining, San Francisco, CA, USA, 13–17 August 2016; pp. 785–794. [Google Scholar]
- Akiba, T.; Sano, S.; Ohata, T.; Koyama, M. Optuna: A Next-generation Hyperparameter Optimization Framework. In Proceedings of the 25th ACM SIGKDD International Conference on Knowledge Discovery and Data Mining, Anchorage, AK, USA, 4–8 August 2019; pp. 2623–2631. [Google Scholar]

Disclaimer/Publisher’s Note: The statements, opinions and data contained in all publications are solely those of the individual author(s) and contributor(s) and not of MDPI and/or the editor(s). MDPI and/or the editor(s) disclaim responsibility for any injury to people or property resulting from any ideas, methods, instructions or products referred to in the content. |
© 2026 by the authors. Licensee MDPI, Basel, Switzerland. This article is an open access article distributed under the terms and conditions of the Creative Commons Attribution (CC BY) license.