Article

A Methodology for the Dynamic Determination of Passenger Car Unit Values at Intersections


Department of Road and Urban Transport, University of Žilina, Univerzitná 1, 01026 Žilina, Slovakia
*
Author to whom correspondence should be addressed.
Vehicles 2026, 8(7), 160; https://doi.org/10.3390/vehicles8070160

Submission received: 31 May 2026 / Revised: 3 July 2026 / Accepted: 6 July 2026 / Published: 8 July 2026

Abstract

Passenger car unit (PCU) values are an essential input for traffic capacity assessment (TCA) of intersections, as they allow different vehicle categories to be converted into a common unit. In the Slovak Republic, current technical guidelines use fixed equivalency factors for specific intersection types. However, international research shows that PCU values depend on local traffic conditions, vehicle composition, road geometry, and vehicle interactions. Incorrectly selected factors may therefore lead to inaccurate capacity calculations and misleading conclusions regarding intersection performance. This study analyses PCU values for different vehicle categories, with a focus on heavy vehicles (HV) at roundabouts and turbo roundabouts (TR). Traffic surveys were conducted at selected intersections near industrial areas, where a higher proportion of freight traffic was expected. Manual and semi-automatic turning-movement counts were combined with high-resolution video recordings and automatic traffic counters (ATC) to obtain data on traffic volumes, vehicle composition, travel times, speeds, vehicle lengths, and time headways. The results indicate that the behavior of trucks and HV combinations may differ from the assumptions reflected in static equivalency factors. In several cases, the measured travel times and time headways did not reach the values implied by the prescribed PCU coefficients. Based on these findings, a methodology for dynamically determining PCU values was proposed. The methodology is based on the time headway principle and uses commonly available measurement devices. The proposed approach enables PCU values to be determined for either a simplified two-category vehicle classification or a more detailed classification. It may serve as an alternative to static tabulated values, particularly under non-standard traffic composition, a high proportion of HV, or specific geometric conditions of intersections.

1. Introduction

Road transport is an integral part of the daily life of the population. In the EU, approximately three-quarters of passenger transport is by road, which puts pressure on the use and development of road infrastructure [1,2]. In combination with high volumes of freight vehicles, the road network often operates close to capacity, with the most critical elements of the transport network—intersections—usually the first to fail. Most intersections in the road network are at-grade, unsignalized, with right-of-way regulated by horizontal and vertical traffic signs. This type of intersection also poses a challenge as autonomous vehicles are gradually deployed into real-world traffic [3,4,5], which will affect not only road traffic safety and flow efficiency in the future [6] but also urban logistics [7,8].
All basic types of unsignalized intersections have a clearly defined capacity calculation procedure [9,10] used to assess the level of service (LOS) achieved by a given intersection. TCA of an intersection represents a fundamental analytical tool in traffic engineering. Its purpose is to verify the ability of an intersection to safely and efficiently accommodate the required traffic demand while maintaining the selected LOS, which is classified using grades A to F [11].
TCA is primarily used in the design of new intersections, where it is necessary to verify the suitability of the proposed geometric and traffic-organizational layout with respect to expected traffic volumes. It is also applied when assessing alternative design solutions, enabling an objective comparison of their operational parameters. TCA is also essential for the reconstruction and modernization of existing intersections, as well as for situations where significant changes in traffic relations or increases in traffic volumes occur, which may reduce traffic flow, cause congestion, or increase the risk of road accidents.
TCA is also used for the continuous evaluation of traffic operation within traffic management, particularly when measurements or operational experience indicate insufficient intersection performance. The assessment results provide a basis for proposing changes to traffic organization, traffic control, or construction measures. They also enable the determination of capacity, degree of saturation, LOS, and other operational indicators characterizing the quality of intersection performance.
In the intersection TCA, traffic volumes are converted to PCUs using fixed, tabulated PCU values. However, such an approach may not adequately reflect actual local operating conditions in all cases. The use of inappropriate PCU coefficients may subsequently affect the calculated average waiting time, degree of saturation, and resulting LOS.
Therefore, the aim of this study is not only to extend existing theoretical knowledge of PCU estimation but also to propose a methodology that can be practically applied within standard TCA procedures. The proposed approach is intended to be based on data obtained using commonly available traffic survey methods, particularly a standard intersection traffic survey supplemented by automatic recording of vehicle passages and their time headways.

2. Literature Review

2.1. Passenger Car Unit

To assess traffic quality, the expected traffic volumes, expressed in vehicles, must be converted to PCU. PCU is a comparative numerical unit that expresses the effect of different vehicle types in traffic flow. It is represented by an average passenger car (PC), to which other vehicles are converted using appropriate equivalency factors based on their driving characteristics and dimensions [11,12]. It should be noted that heavier vehicles, such as buses (B) and trucks (T), differ not only in their larger dimensions but also in their acceleration and braking characteristics [13,14].
The research inputs used by scholars to estimate PCU values also differ considerably. While some authors, for example [15,16], measure traffic-flow characteristics on straight sections of motorways or roads, others obtain data on vehicle movements directly at intersections [17,18].
From a historical perspective, the conversion of HV was already mentioned in the 1950 edition of the American methodological manual, Highway Capacity Manual [19]. In this manual, a multiplication factor of 2 was used when counting the volume of HV on multilane roads in level terrain. However, this factor was not explicitly named, and its meaning was not explained in the manual. It was only 15 years later, in an updated version of the manual, that the Highway Research Board, now the Transportation Research Board, introduced the concept of the passenger car equivalent (PCE). The manual justified the need for such conversion under mixed traffic-flow conditions.
Approaches to determining PCU values differ across countries. Slovak technical guidelines define PCU values using fixed coefficients that remain constant for a given intersection type. However, the authors in [20] found that PCU values are not universal but strongly depend on local conditions, such as traffic composition, geometry, and driver behavior, resulting in considerable inconsistency across studies. At the same time, they demonstrated that PCU is not a static parameter; rather, it varies with traffic volume, the proportions of different vehicle types, and other factors. Therefore, dynamic and context-specific methods should be used for its estimation [21].
The authors of [22] found that PCU values at signalized intersections under mixed traffic conditions are dynamic and strongly depend on factors such as lane width, traffic composition, traffic flow speed, and traffic volume. To determine these values, they proposed a methodology based on a modified area-occupancy principle and applied a microsimulation model. Similarly, source [15] states that PCU values depend on several factors, including:
  • vehicle characteristics [23,24],
  • traffic-flow characteristics,
  • road characteristics,
  • environmental conditions,
  • climatic conditions,
  • traffic control conditions.
However, other factors also affect PCU values, including the proportion of HV, pavement condition, number of lanes, speed limits, and traffic congestion [25].
The ongoing development of connected and automated vehicle technologies introduces new requirements for traffic-flow analysis. During the transition period, road traffic will consist of varying proportions of human-driven vehicles, vehicles equipped with advanced driver-assistance systems, and connected and automated vehicles operating simultaneously [26,27,28]. Such mixed human–machine traffic may significantly affect vehicle interactions, including lane-changing decisions, time headways, acceleration and deceleration patterns, and traffic-flow stability [29,30]. Recent studies indicate that the operational effects of connected and automated vehicles depend not only on their market penetration rate but also on control strategies, vehicle-to-vehicle communication capabilities, interactions with conventional vehicles, and local road geometry [31]. Research findings further suggest that safety, traffic flow efficiency, road capacity, and operating conditions at intersections, merging and diverging areas, and lane-changing locations may be substantially affected in mixed traffic environments [32].
These findings indicate that PCU values should not be considered immutable constants, since the equivalent impact of vehicles on traffic flow may also be influenced in the future by the development of new technologies and changes in vehicle interactions. Conversely, after the full deployment of autonomous vehicles, PCU values may approach constant levels because traffic flow is expected to become more predictable.
Although the present study focuses on conventional mixed traffic consisting primarily of PC and HV, the proposed methodology based on time headways may provide a suitable basis for future research on the dynamic determination of PCU values in environments with different proportions of connected and automated vehicles.
PCU estimation is important not only for assessing traffic quality, but also because it affects the economics and costs associated with transport infrastructure [33].

2.2. Methods for Determining PCU

Several methods for estimating PCU values are described in the literature, leading to some variability when selecting an appropriate approach. The aim of this analytical chapter is to systematically analyze the available methods for estimating PCUs and to discuss their suitability for application under different conditions. In the scientific literature, for example, in [34,35,36], several methods used for estimating PCU are described. The most frequently used methods include the following:

2.2.1. Time Headway Method

To explain the principle of this method, it is necessary to define time headway, which, according to [37], is the time interval between two consecutive vehicles passing a specific point on a road section. An increase in average time headway in the traffic flow reduces road capacity. This method is relatively simple and is suitable for use under less heterogeneous traffic conditions and at higher LOS [38,39]. Its disadvantage is the considerable difficulty of accurately measuring time headways in the field, which requires advanced tools or technologies. Collecting enough samples is particularly problematic when some vehicle categories are underrepresented in traffic flow, which limits the method’s practical applicability. Since the method is based on measuring time headways, it can be applied primarily to road sections where vehicles do not change lanes [40].
Similarly to the present study, the authors of [41] investigated 13 single-lane roundabouts in Hungary and calibrated a capacity model using locally observed critical gaps and follow-up headways. They found that the locally calibrated model provided higher and more accurate estimates of entry capacity than standard international models, confirming the importance of driver behavior and local operating conditions in TCA.

2.2.2. Homogeneous Coefficient Method

The World Road Association PIARC proposed a model for determining the so-called homogeneity coefficient, which is equivalent to the PCU value. This method considers vehicle length and average speed. Its main advantage is that the individual input data required for the calculation are relatively easy to measure. On the other hand, the calculation includes the average vehicle speed, which does not capture its variability under different traffic conditions. Moreover, considering vehicle length alone is insufficient for assessing interactions between vehicles in a mixed traffic flow [34,42].

2.2.3. Walker’s Method

This method is based on the number of overtaking maneuvers per unit length of a road section and on traffic volumes for individual vehicle categories, assuming that each vehicle travels at its natural speed. Since direct field measurement of the number of overtaking maneuvers would be highly demanding and technically complicated, the method also includes a procedure for estimating this number based on vehicle speeds.
Walker’s method, therefore, considers the number of overtaking maneuvers as a surrogate indicator of the level of interaction between vehicles, which is subsequently used to determine PCU values. The method enables the number of overtaking maneuvers to be estimated without the need for time-consuming direct measurements. Its disadvantage is that it assumes each vehicle travels at a constant, i.e., normal, speed. Moreover, the method is not suitable for traffic flows comprising more than two vehicle categories [43].

2.2.4. Speed-Based Method

According to this method, the PCU equivalency factor is directly proportional to the speed ratio and inversely proportional to the ratio of the vehicles’ projected areas. The method is simple and captures the dynamic nature of PCU. It is suitable for mixed traffic flows with any number of vehicle categories [44,45,46].

2.2.5. Multiple Linear Regression Method

Multiple linear regression represents a direct method for estimating PCU values. The basic assumption is that the average speed of PC is a function of the traffic volumes for individual vehicle categories.
According to [47], the advantage of this method lies in its suitability for application to highly heterogeneous, i.e., mixed, traffic flows. However, foreign authors in study [48] point out that negative values of regression coefficients may lead to inaccurate estimates of PCU equivalency factors.

2.2.6. Simultaneous Equations Method

This is an extended method based on vehicle time headways. Compared with previous methods, it is more general, as it accounts for all vehicle categories in the traffic flow [49].
This method provides more accurate estimates of PCU values compared with the regression method; however, it involves an iterative computational procedure, which makes the calculations longer and more complex [50].

2.2.7. Huber Method

Huber’s method is a procedure for estimating PCU equivalency factors by comparing traffic flow intensity with and without the assessed vehicle category, which differs from standard PC. The method was proposed by Matthew J. Huber in 1982 [51], considering a traffic flow composed only of trucks and PC.
The main advantage of this method is its simplicity, as PCU equivalency factors are estimated based on traffic volume, which can be easily measured through traffic surveys. Its disadvantage is that the method is applicable only when the traffic flow contains only one other vehicle category, in addition to PC [51,52].

2.2.8. Simulations

Simulation techniques represent a computer-assisted approach that has gained considerable popularity in recent decades [53,54,55,56]. This method is used to develop a computer model, i.e., a microsimulation, which reproduces vehicle behavior observed under real traffic conditions. Such a model enables the prediction of traffic characteristics for various traffic situations and scenarios. The results obtained through simulation models are subsequently used to determine PCU values for individual vehicle categories [57].
Microsimulation is suitable for diverse traffic situations, as traffic-flow characteristics and road geometric conditions can be modified within the model [58,59]. However, they require deeper knowledge of traffic modeling, and model verification also represents a disadvantage, as it requires extensive real-world data covering a wide range of traffic conditions [60,61].

2.3. PCU Values in the Slovak Republic

Since 1 January 2025, the technical guidelines TP 102, Calculation of Road Capacity, have been in force in the Slovak Republic. These guidelines replaced not only TP 102 from 2015, but also Chapter 5 of TP 007 [62], which regulated the capacity calculation of roundabouts, and Chapter 5 of TP 100 [63], which defined the capacity calculation of TRs. The new technical guidelines, therefore, constitute a unified document that contains all TCA procedures for common types of intersections.
The currently used and valid equivalency factors, which convert different vehicle types into PCUs, are considered static.
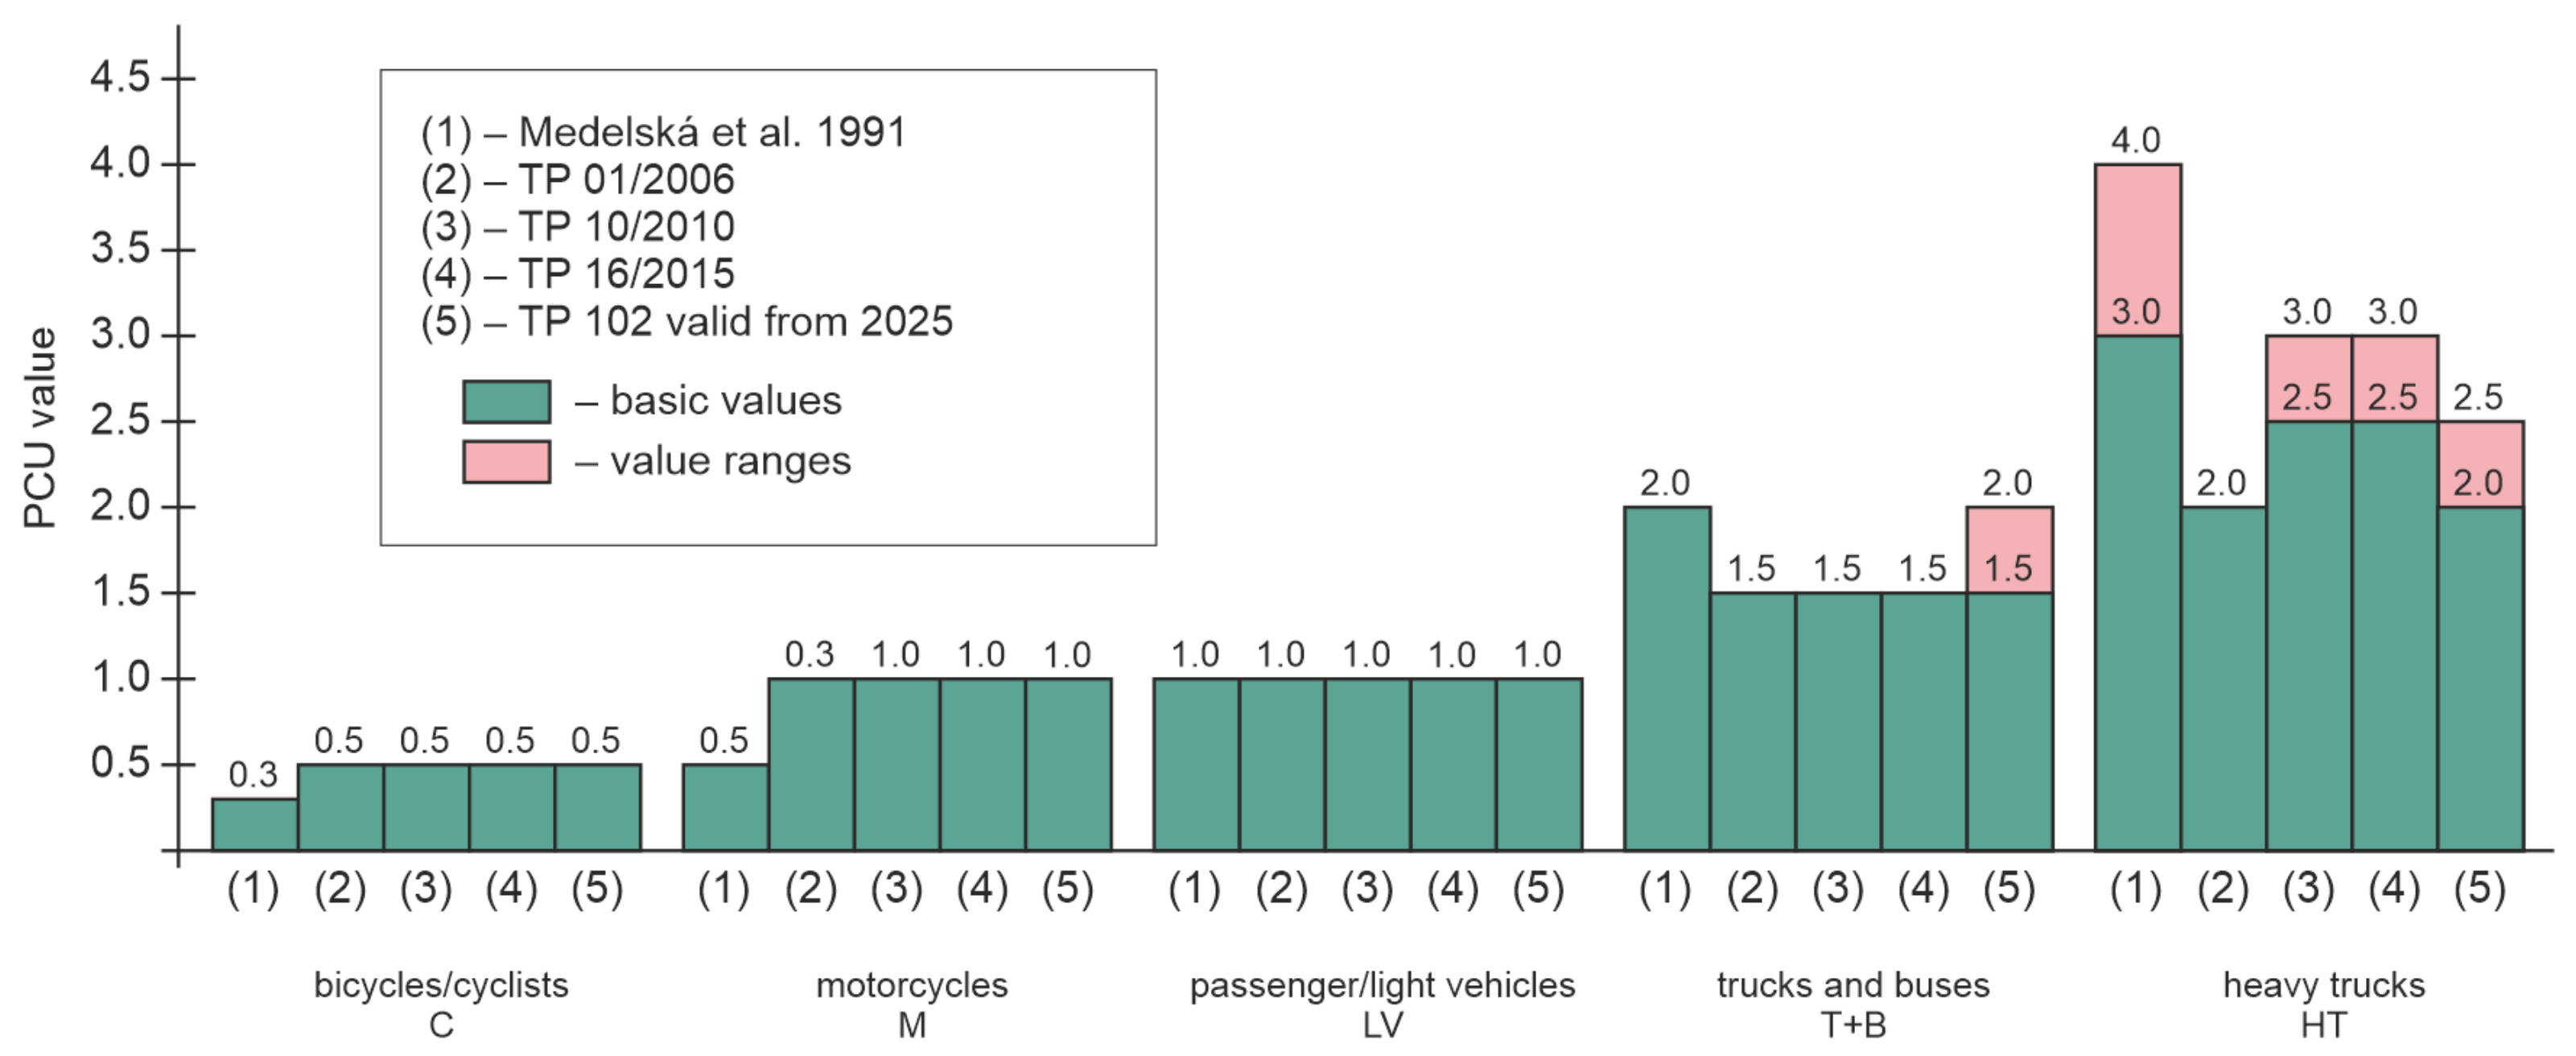
Figure 1 graphically compares the PCU equivalency factors and their chronologically ordered development, as documented in [11,12,64,65,66]. As shown in the figure, heavy goods vehicles are particularly contentious, as their coefficient is logically the highest. Most documents provided two possible coefficient values for this vehicle category, whereas the latest technical guidelines include three possible values.
Figure 1 clearly shows that the coefficient for trucks has not been stable over time. Therefore, it is appropriate to scientifically examine the real impact of this vehicle category on the traffic flow and to simulate the possible consequences of potential changes in the coefficients.

2.4. PCU Values According to Foreign Authors

Research studies worldwide seek to accurately quantify the impact of various heavier and non-standard vehicles. For example, in study [54], PCU values were determined by analyzing road geometric parameters and traffic-flow characteristics during peak periods from video recordings. The average PCU values for buses were 3.8 in mountainous areas and 1.8 in flat terrain, while the corresponding values for trucks were 4.8 and 3.2. These findings clearly indicate that the coefficients currently in use in Slovakia are too low. However, studies also suggest the opposite.
According to the authors in [67], the average PCU values were 1.26 for PC and 1.59 for trucks on motorways in the United Kingdom. Similarly, the authors in [68] selected 43 locations for conducting traffic surveys and investigated the influence of HV within motorway traffic flows. They found that the presence of HV in the traffic flow increased the speed of these vehicles, with the PCU reaching 1.76 when the share of HV exceeded 9%, whereas the Highway Capacity Manual 2000 [69] recommends a value of 1.5. Studies recommending lower PCU values for HV also include [39], which estimated PCU values based on truck proportions and speeds. The study’s results showed PCU values of 2.0 for buses and 1.67 for trucks.
The above overview clearly indicates that PCU values for HV differ considerably among authors, depending on the methodologies used, traffic conditions, and analyzed locations. This inconsistency highlights the need for a unified, methodologically consistent PCU estimation methodology that would enable comparable, reliable results.
At the same time, it should be emphasized that the choice of a specific PCU value has a substantial impact on the results of capacity calculations and, consequently, on LOS at the assessed intersection. Incorrectly determined PCU values may therefore lead to either underestimation or overestimation of capacity and to inaccurate conclusions in TCA.
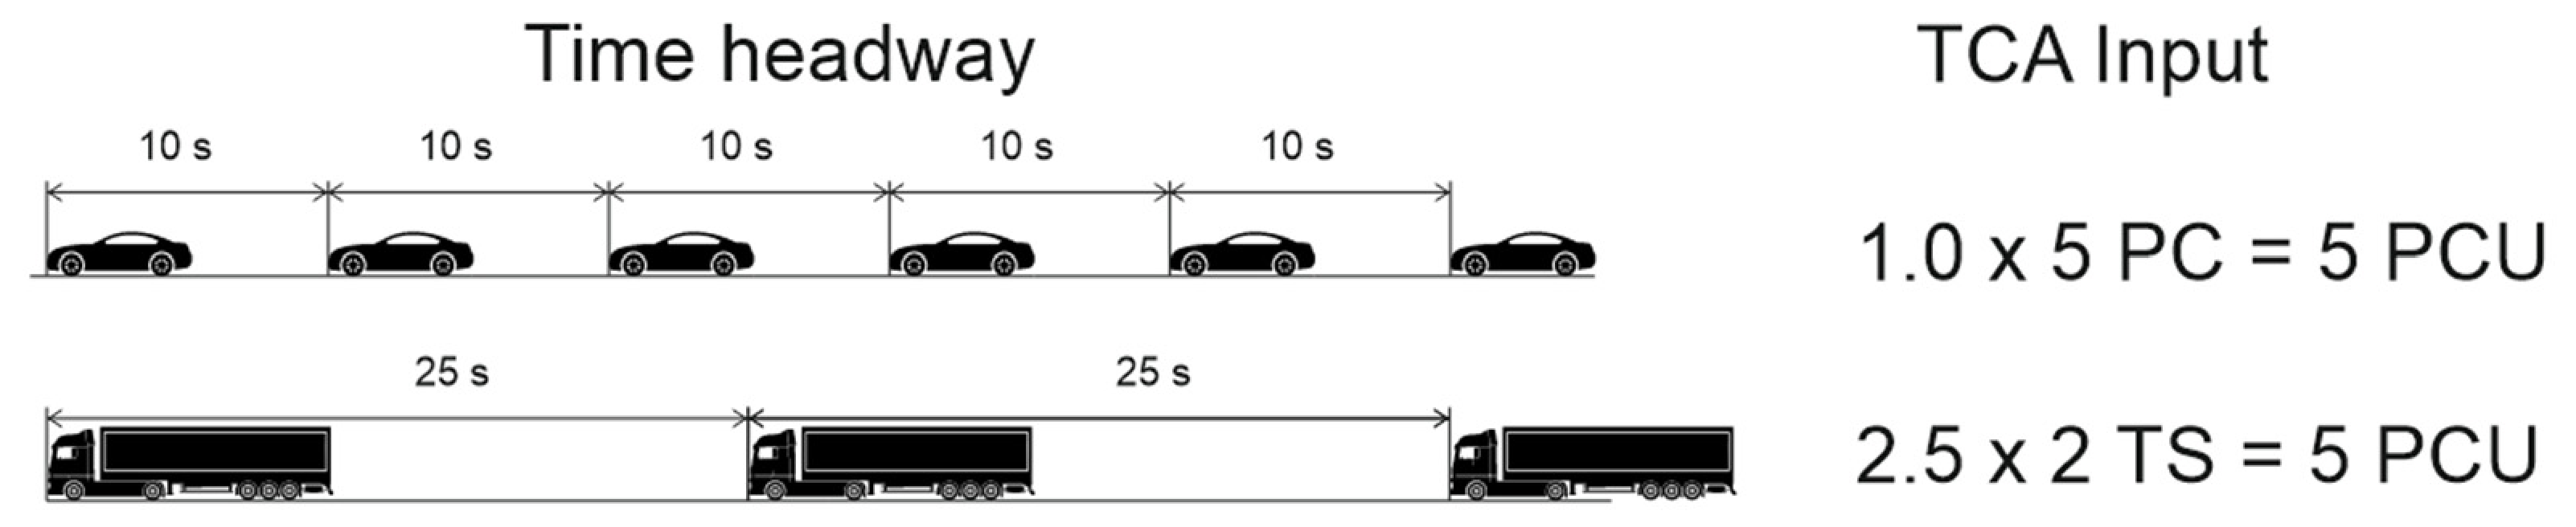
In the Slovak Republic, only fixed PCU values are used to determine LOS of an intersection. For example, if an analyzed intersection is loaded by five PC or by two TSs, the input to the capacity calculation is identical, i.e., 5 PCU (Figure 2). However, in real traffic conditions, the average time, i.e., the lost time attributable to a single vehicle, will certainly differ across these vehicle categories. Nevertheless, TCA identifies the same average waiting time and the same LOS in both cases. In other words, to achieve the same LOS at a given intersection, a tractor–semitrailer combination would need to have operational characteristics identical to those of 2.5 PC.
In this study, the time headway is assigned to the following vehicle, i.e., to the vehicle recorded second in the vehicle pair. It is defined as the time interval between the passage of the preceding vehicle and the passage of the following vehicle at the measurement point.
Most studies in this field focus on estimating PCU values for specific road sections and intersections [31]. Determining PCU values at intersections is more challenging than on uninterrupted road sections, where traffic flow is not disturbed by conflicting movements, priority rules, or control measures. To date, PCU values have not been universally established in a way that simultaneously accounts for all relevant factors, such as longitudinal gradient, shoulder condition, pavement roughness, the proportion of individual vehicle categories, or the share of slow-moving vehicles [34]. Many authors have focused on PCU estimation at signalized intersections [70,71,72,73,74,75]; however, considerably fewer studies have addressed unsignalized intersections.
In study [35], the authors compared three methods for estimating PCU values at unsignalized intersections. The first approach was based on occupancy time, i.e., the total time during which a vehicle performing a priority movement occupies the conflict area. The second method was based on the ratio of critical gaps, while the third method used the ratio of follow-up headways. According to the authors, the critical gap is preferable to the critical headway because of the substantial variation in vehicle lengths under heterogeneous traffic conditions. They argued that PCU estimation should account not only for the dynamic characteristics and dimensions of vehicles but also for driver behavior during intersection traversal.
Study [76] also addressed the estimation of PCU values at a four-leg roundabout. The authors proposed a method based on time occupancy, defined as the average time each vehicle category spends in the roundabout area while passing through the intersection. On this basis, they determined PCU values for individual vehicle categories and developed a traffic-stream equivalency coefficient that enables converting a heterogeneous traffic stream into a homogeneous one without the need for separate PCU factors [77].
Although examining critical gaps or occupancy times may be more appropriate for the individual determination of PCU values, such measurements would be considerably more demanding than measuring follow-up headways, which can be obtained using commonly available ATC.

2.5. Implications of Incorrect PCU Values

If equivalency factors are selected incorrectly, the capacity calculation may lead to erroneous outputs, which may result in the following:
  • Underestimation of traffic demand—the actual traffic situation on the given road section or at the intersection will be worse than predicted by the calculation. This alternative assumes that the investment project, if the capacity calculation was carried out for new development, was approved, while traffic quality at the assessed intersection will be worse, with longer waiting times. In some cases, the intersection’s capacity may even be exceeded. Under borderline traffic-load conditions, it may occur that a construction project was approved solely from a traffic-engineering perspective due to incorrect or inaccurate input data.
  • Overestimation of traffic demand—this represents the opposite case, in which the capacity calculation may assign a longer waiting time and a worse LOS to the intersection. This may result in the unnecessary rejection of an investment project.
Similar problems may also arise when designing an entirely new intersection. Correct calculation of input values is particularly important for intersections associated with high investment costs [60,61,62]. In some cases, researchers have concluded that the selection of PCU values did not affect the resulting LOS at an unsignalized intersection. For example, the authors of study [75] investigated how different PCU values influenced the TCA of the unsignalized Airport Chowk intersection in Surkhet, Nepal. They compared three sets of PCU coefficients and found that, although the different values affected the calculated traffic volumes and critical gaps, they did not change the resulting LOS in most cases.

3. Materials and Methods

Foreign authors describe both static and dynamic PCU values in their studies. The aim of this paper is to propose a methodology for the dynamic determination of PCU equivalency factors that reflect actual traffic conditions. In this context, “dynamic” does not refer to online calculations or real-time estimation; rather, it refers to the processing of values obtained from traffic surveys and their subsequent use in the capacity calculation.
To formulate the conclusions, several traffic surveys were conducted to determine traffic-flow characteristics in relation to the study’s objectives. The main objectives of the research described in this article can be summarized as follows:
  • Identification of differences in travel times of different vehicle types at a small roundabout. This comparison provides information on the dynamic characteristics of heavier vehicles as they pass through a single-lane roundabout.
  • Collection of traffic-flow data using ATC and assessing their potential use in determining PCU values. In this phase, in addition to ATCs, a standard turning-movement traffic survey will be conducted at a TR.
  • Proposal and practical application of the proposed methodology for determining PCU values, which will be easily applicable in practice. The proposed methodology will be based on the most suitable method presented by foreign authors and will thus serve as a basis for future modifications to technical guidelines in the Slovak Republic.
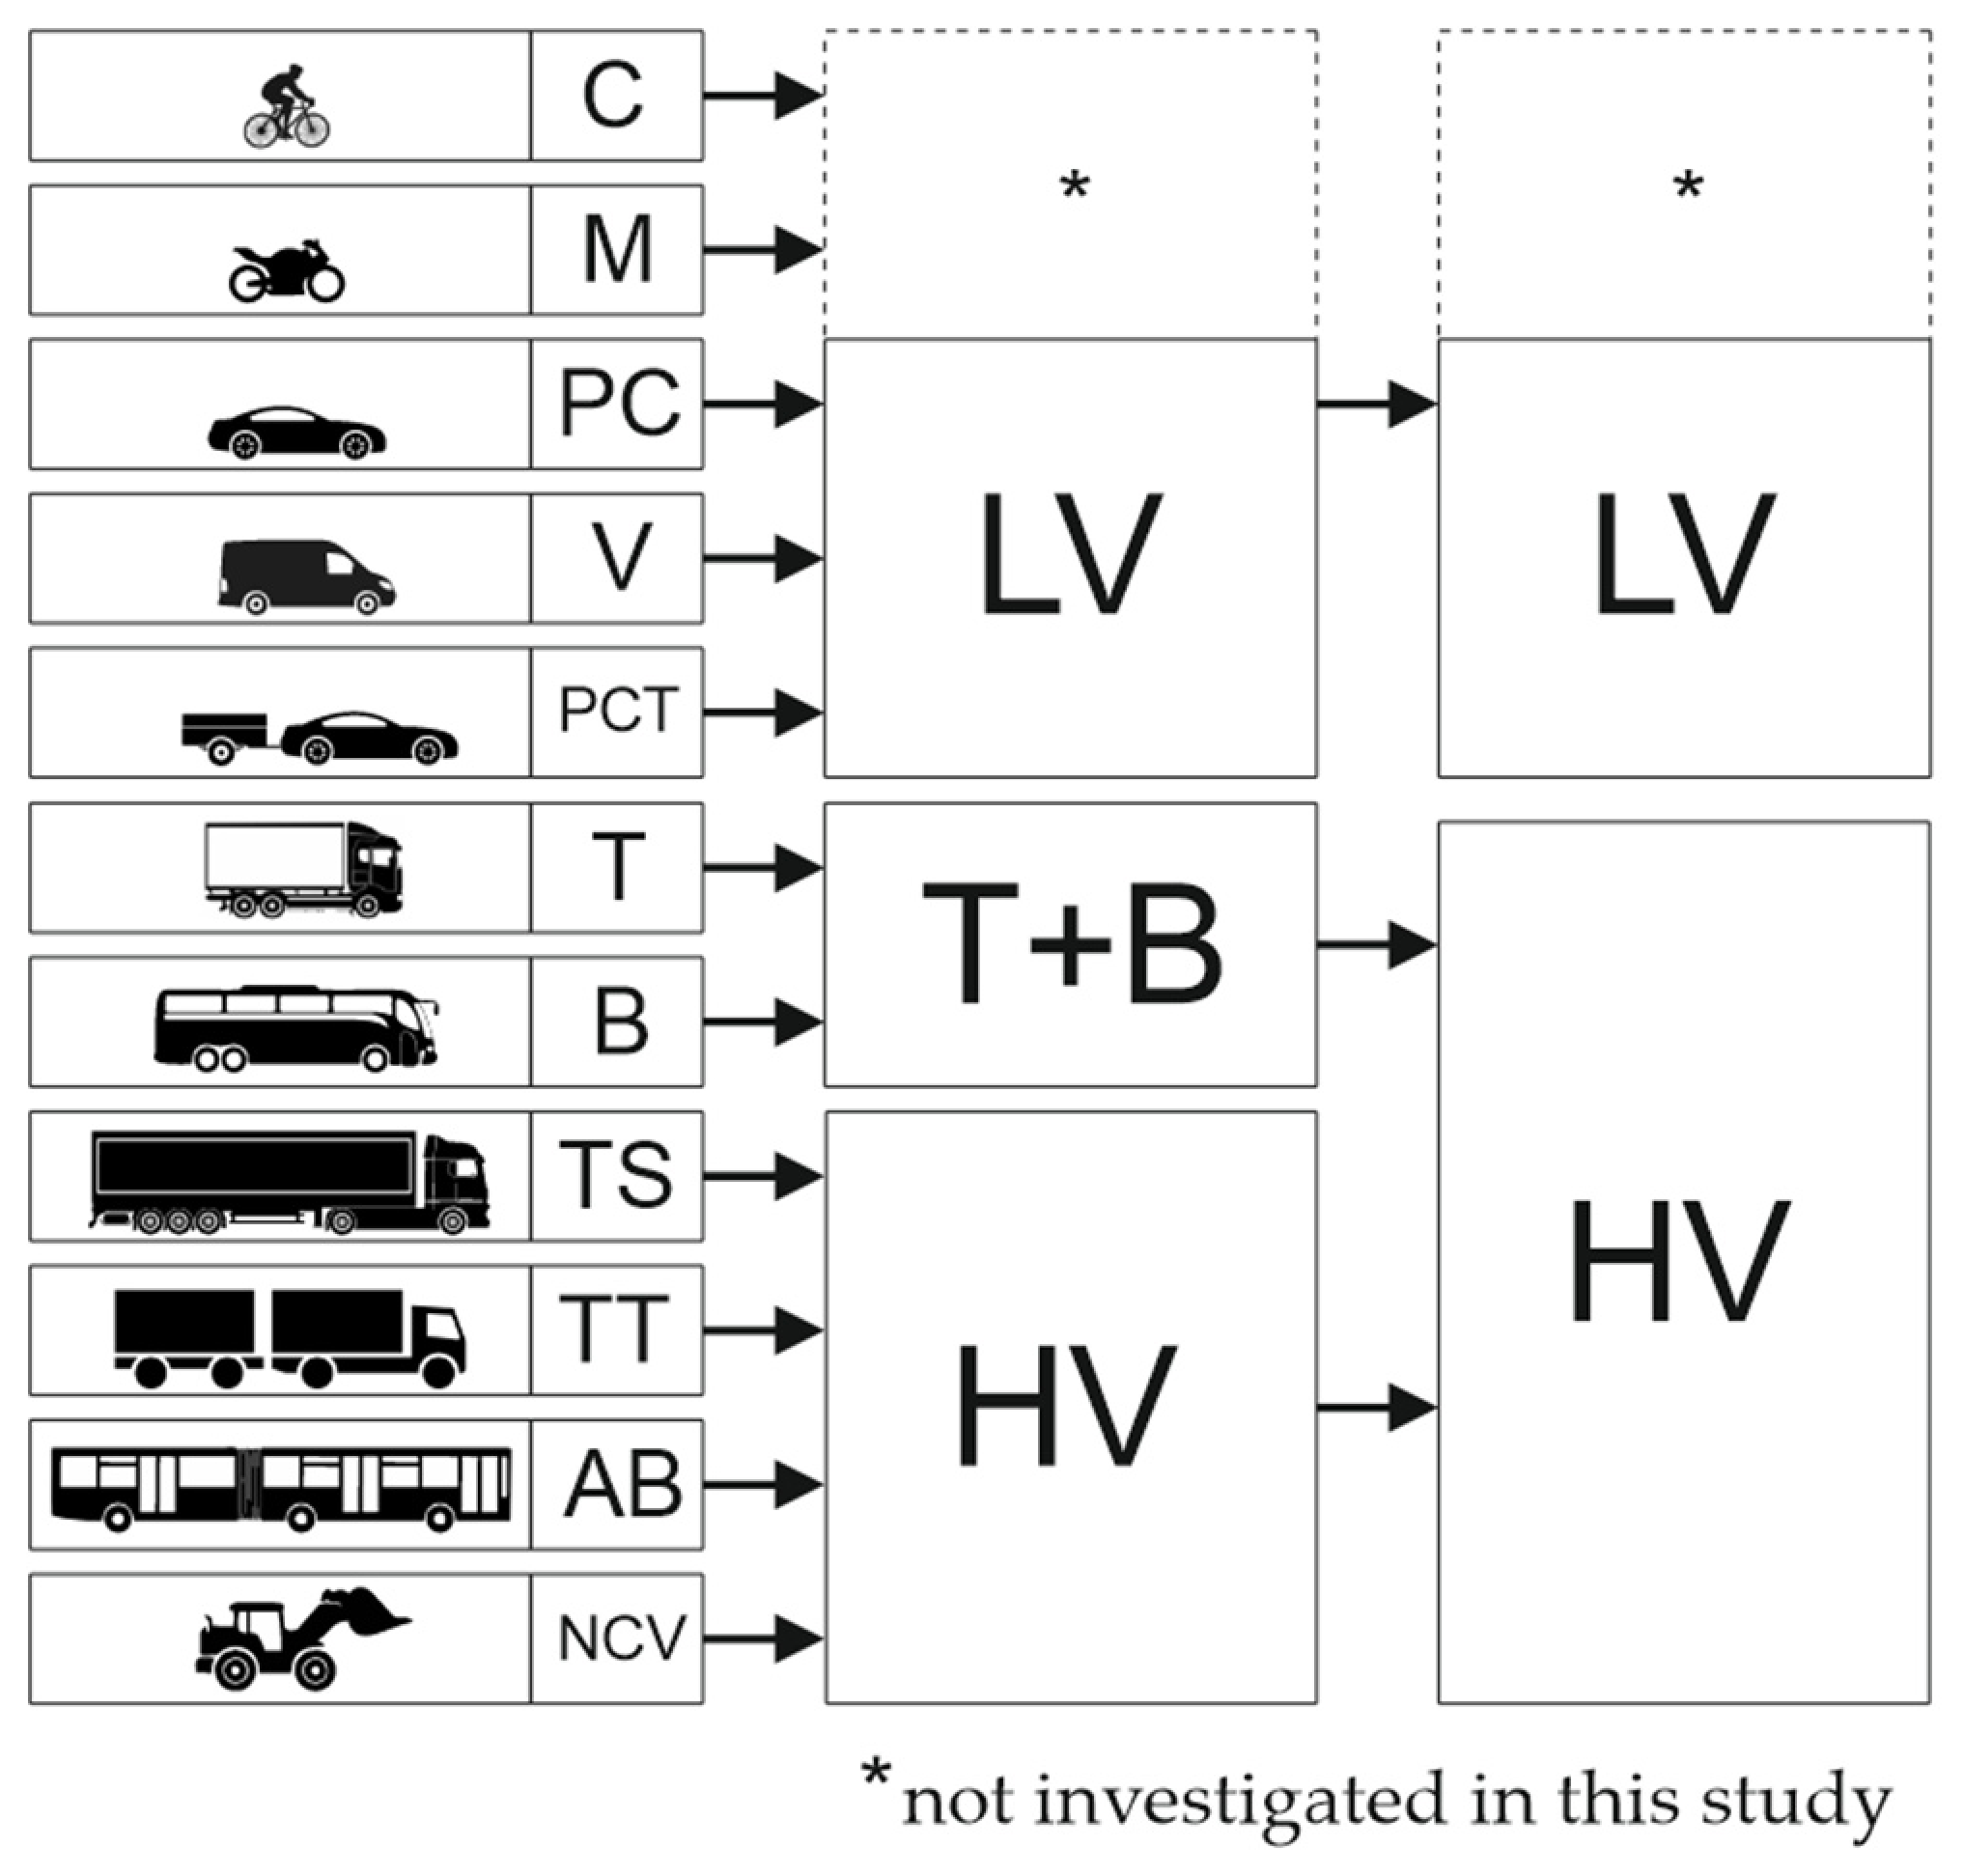
During the traffic surveys, it was necessary to define all investigated vehicle categories and their aggregation into groups, as this is important for the application of the proposed methodology. As shown in Figure 3, the classification was performed in two stages. First, the detailed vehicle categories were grouped according to their operational and physical characteristics. Cyclists (C), motorcycles (M), passenger cars (PC), vans (V), and passenger cars or vans with trailers (PCT) were assigned to the light vehicle group (LV). Trucks (T) and buses (B) were initially combined into the intermediate group T+B, while truck–trailer combinations (TT), tractor–semitrailer combinations (TS), articulated buses (AB), and non-classified vehicles (NCV) were grouped as heavy vehicles (HV).
To simplify the application of the proposed methodology, the detailed categories were subsequently aggregated into two final groups: light vehicles (LV) and heavy vehicles (HV). The final LV group included cyclists, motorcycles, passenger cars, vans, and passenger cars or vans with trailers. The final HV group included trucks, buses, truck–trailer combinations, tractor–semitrailer combinations, articulated buses, and non-classified vehicles. This two-level categorization enables the methodology to be applied either with a more detailed classification, in which trucks and buses are treated separately from longer heavy vehicle combinations, or with a simplified division into light and heavy vehicles only.

3.1. Traffic Survey No. 1

To evaluate vehicle travel times, an intersection traffic survey was conducted at a single-lane roundabout at the intersection of road III/2095 and the D3 motorway feeder road, which currently connects road I/11 with the Schaeffler Slovakia plant. In the future, the feeder road will serve as the main connection between Kysucké Nové Mesto and the D3 motorway. This location was selected for the following reasons:
  • The roads intersect at a relatively clear single-lane roundabout.
  • There are no other intersections, merging lanes, or turning lanes within a sufficient distance before and after the intersection.
  • Overtaking is prohibited by horizontal road markings within a sufficient distance before and after the intersection.
  • A higher number of trucks is expected to pass through the intersection on working days due to the proximity of the industrial park.
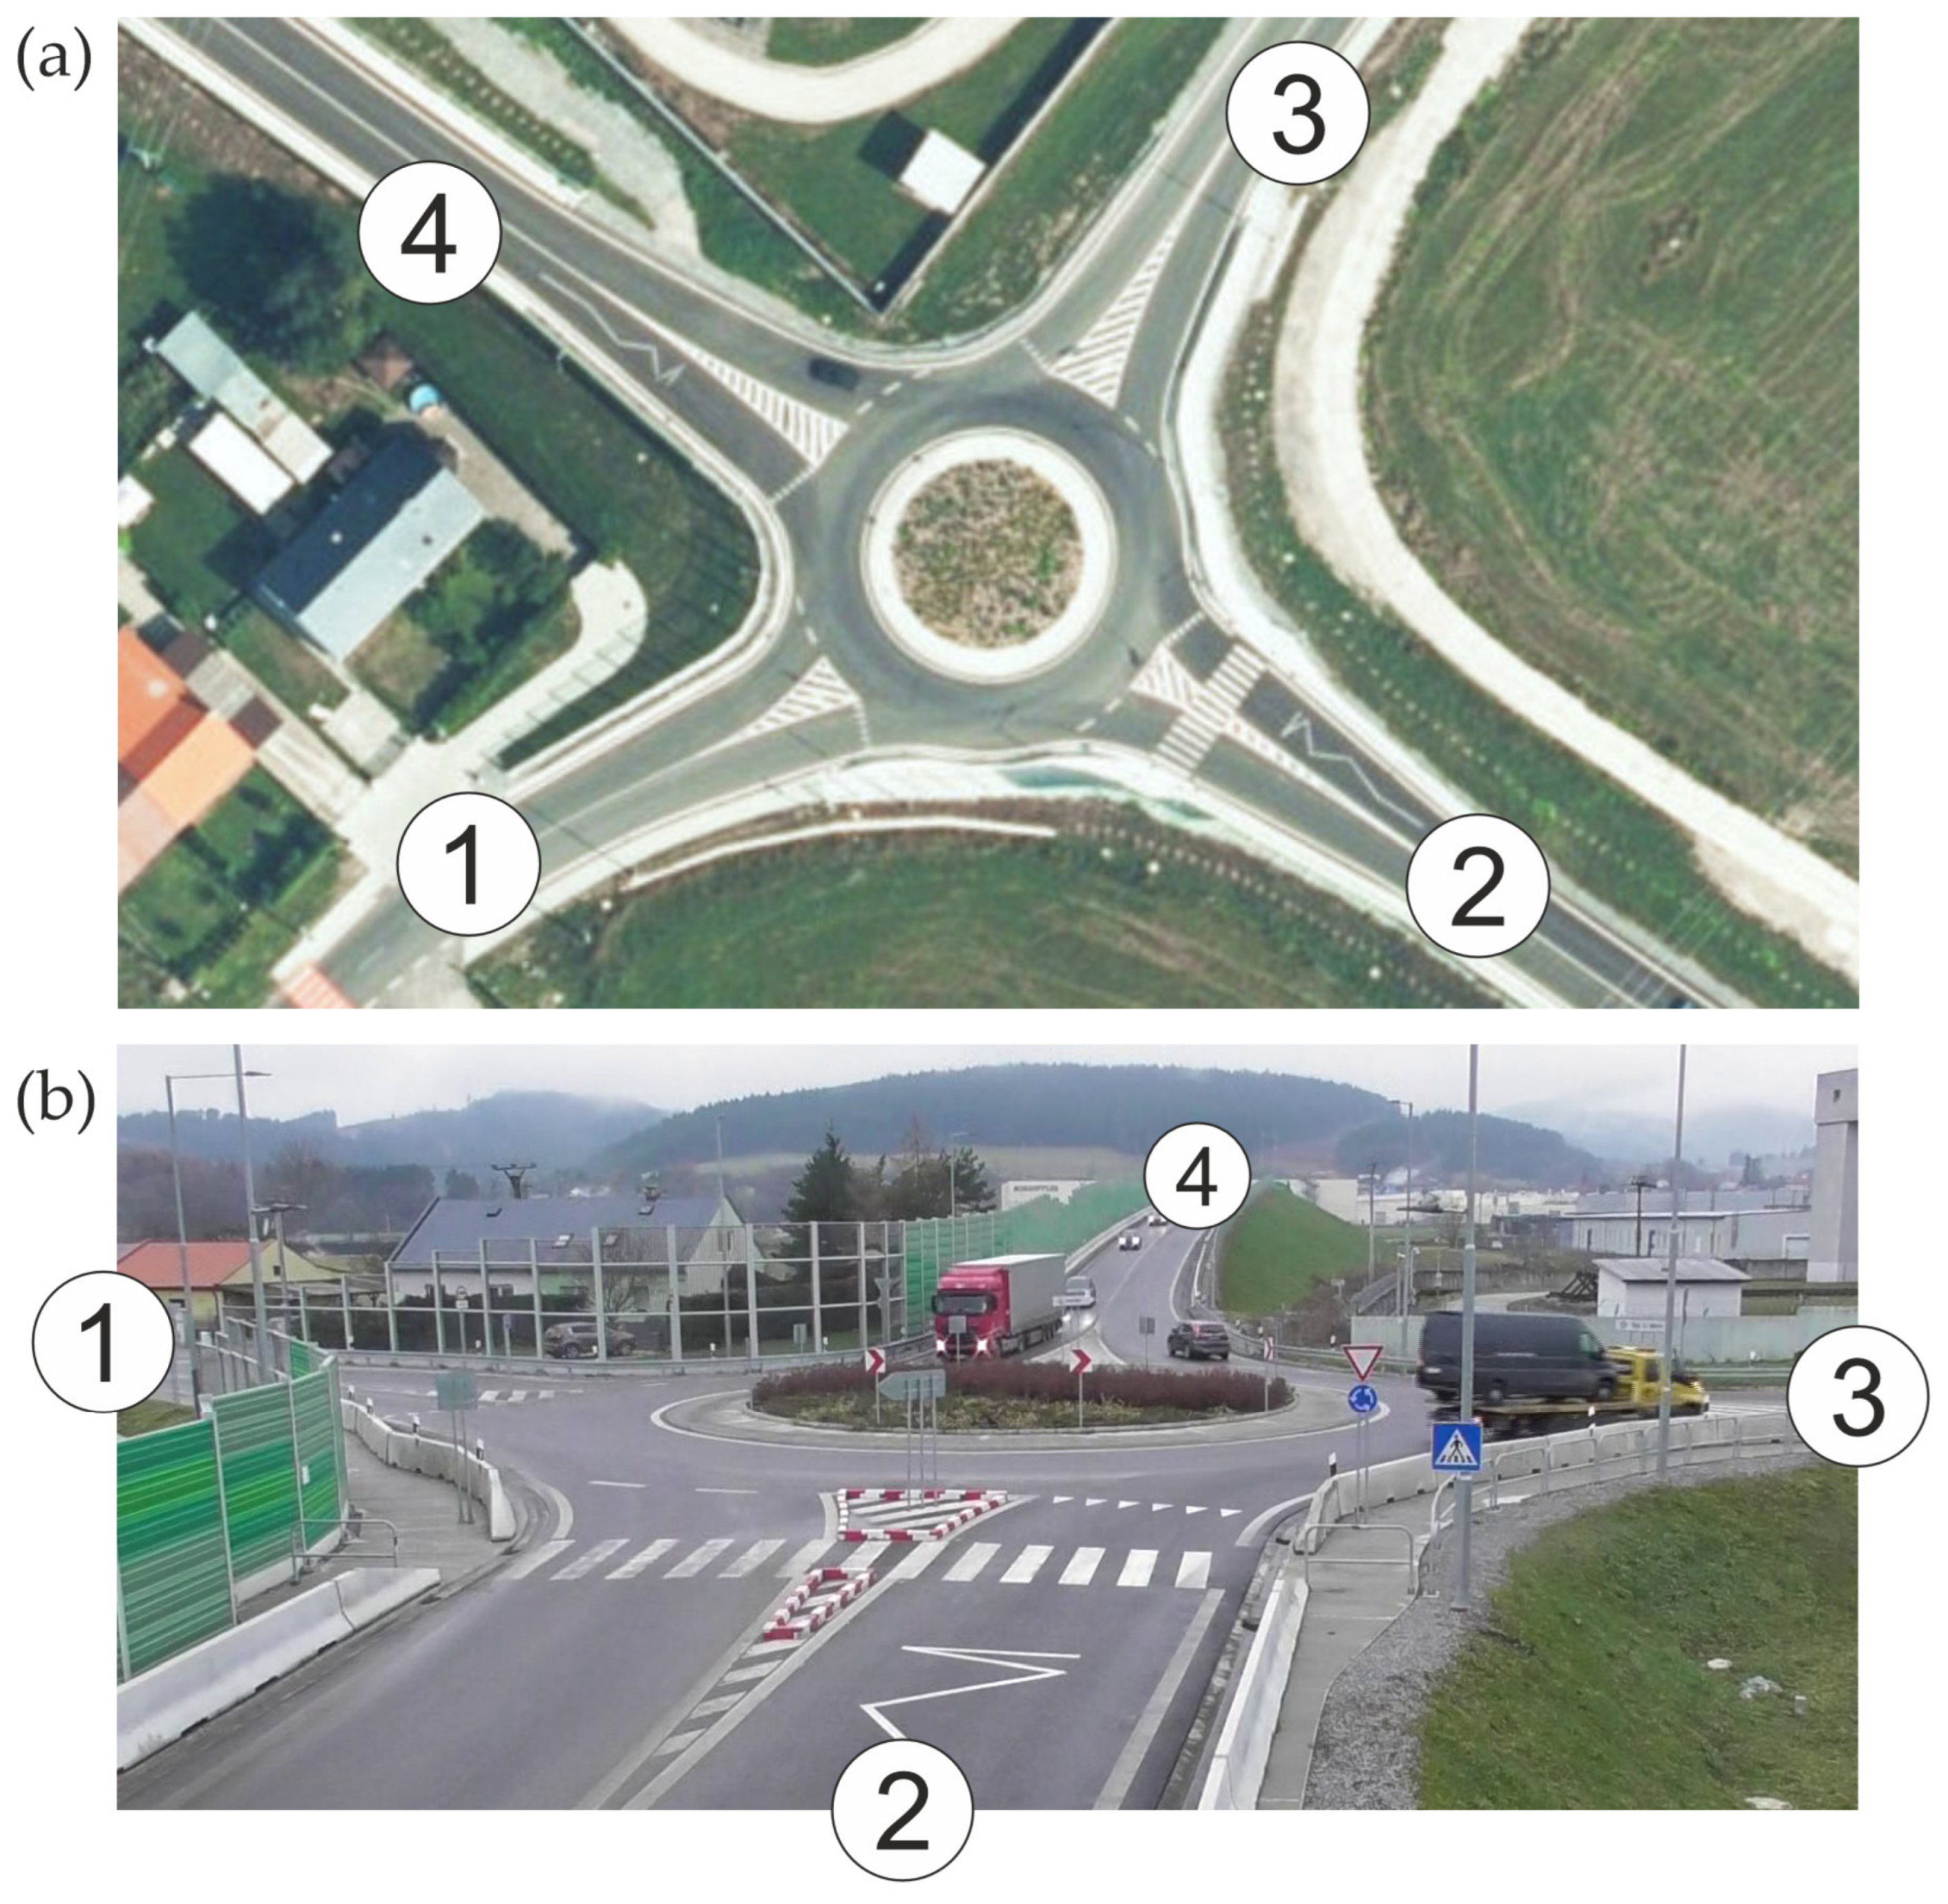
Video recording was used to collect the data, as it represents a reliable method for obtaining traffic-flow data [78,79]. Traffic survey no. 1, which served as the initial data source for the intersection’s TCA, was conducted on 25 November 2025 from 6:00 a.m. to 6:00 p.m., i.e., for 12 h. The designation of the individual approaches to the analyzed intersection based on a satellite image is shown in Figure 4a, while the view from the video camera is shown in Figure 4b. The satellite image was obtained from [80].
During the survey, individual approaches to the intersection and vehicle movements within the intersection area were monitored at 15-min intervals, from which the peak 15-min and peak hourly traffic volumes were determined. In this way, the morning peak hour (MPH), afternoon peak hour (APH), and peak 15-min period were identified for the intersection.

3.2. Traffic Survey No. 2

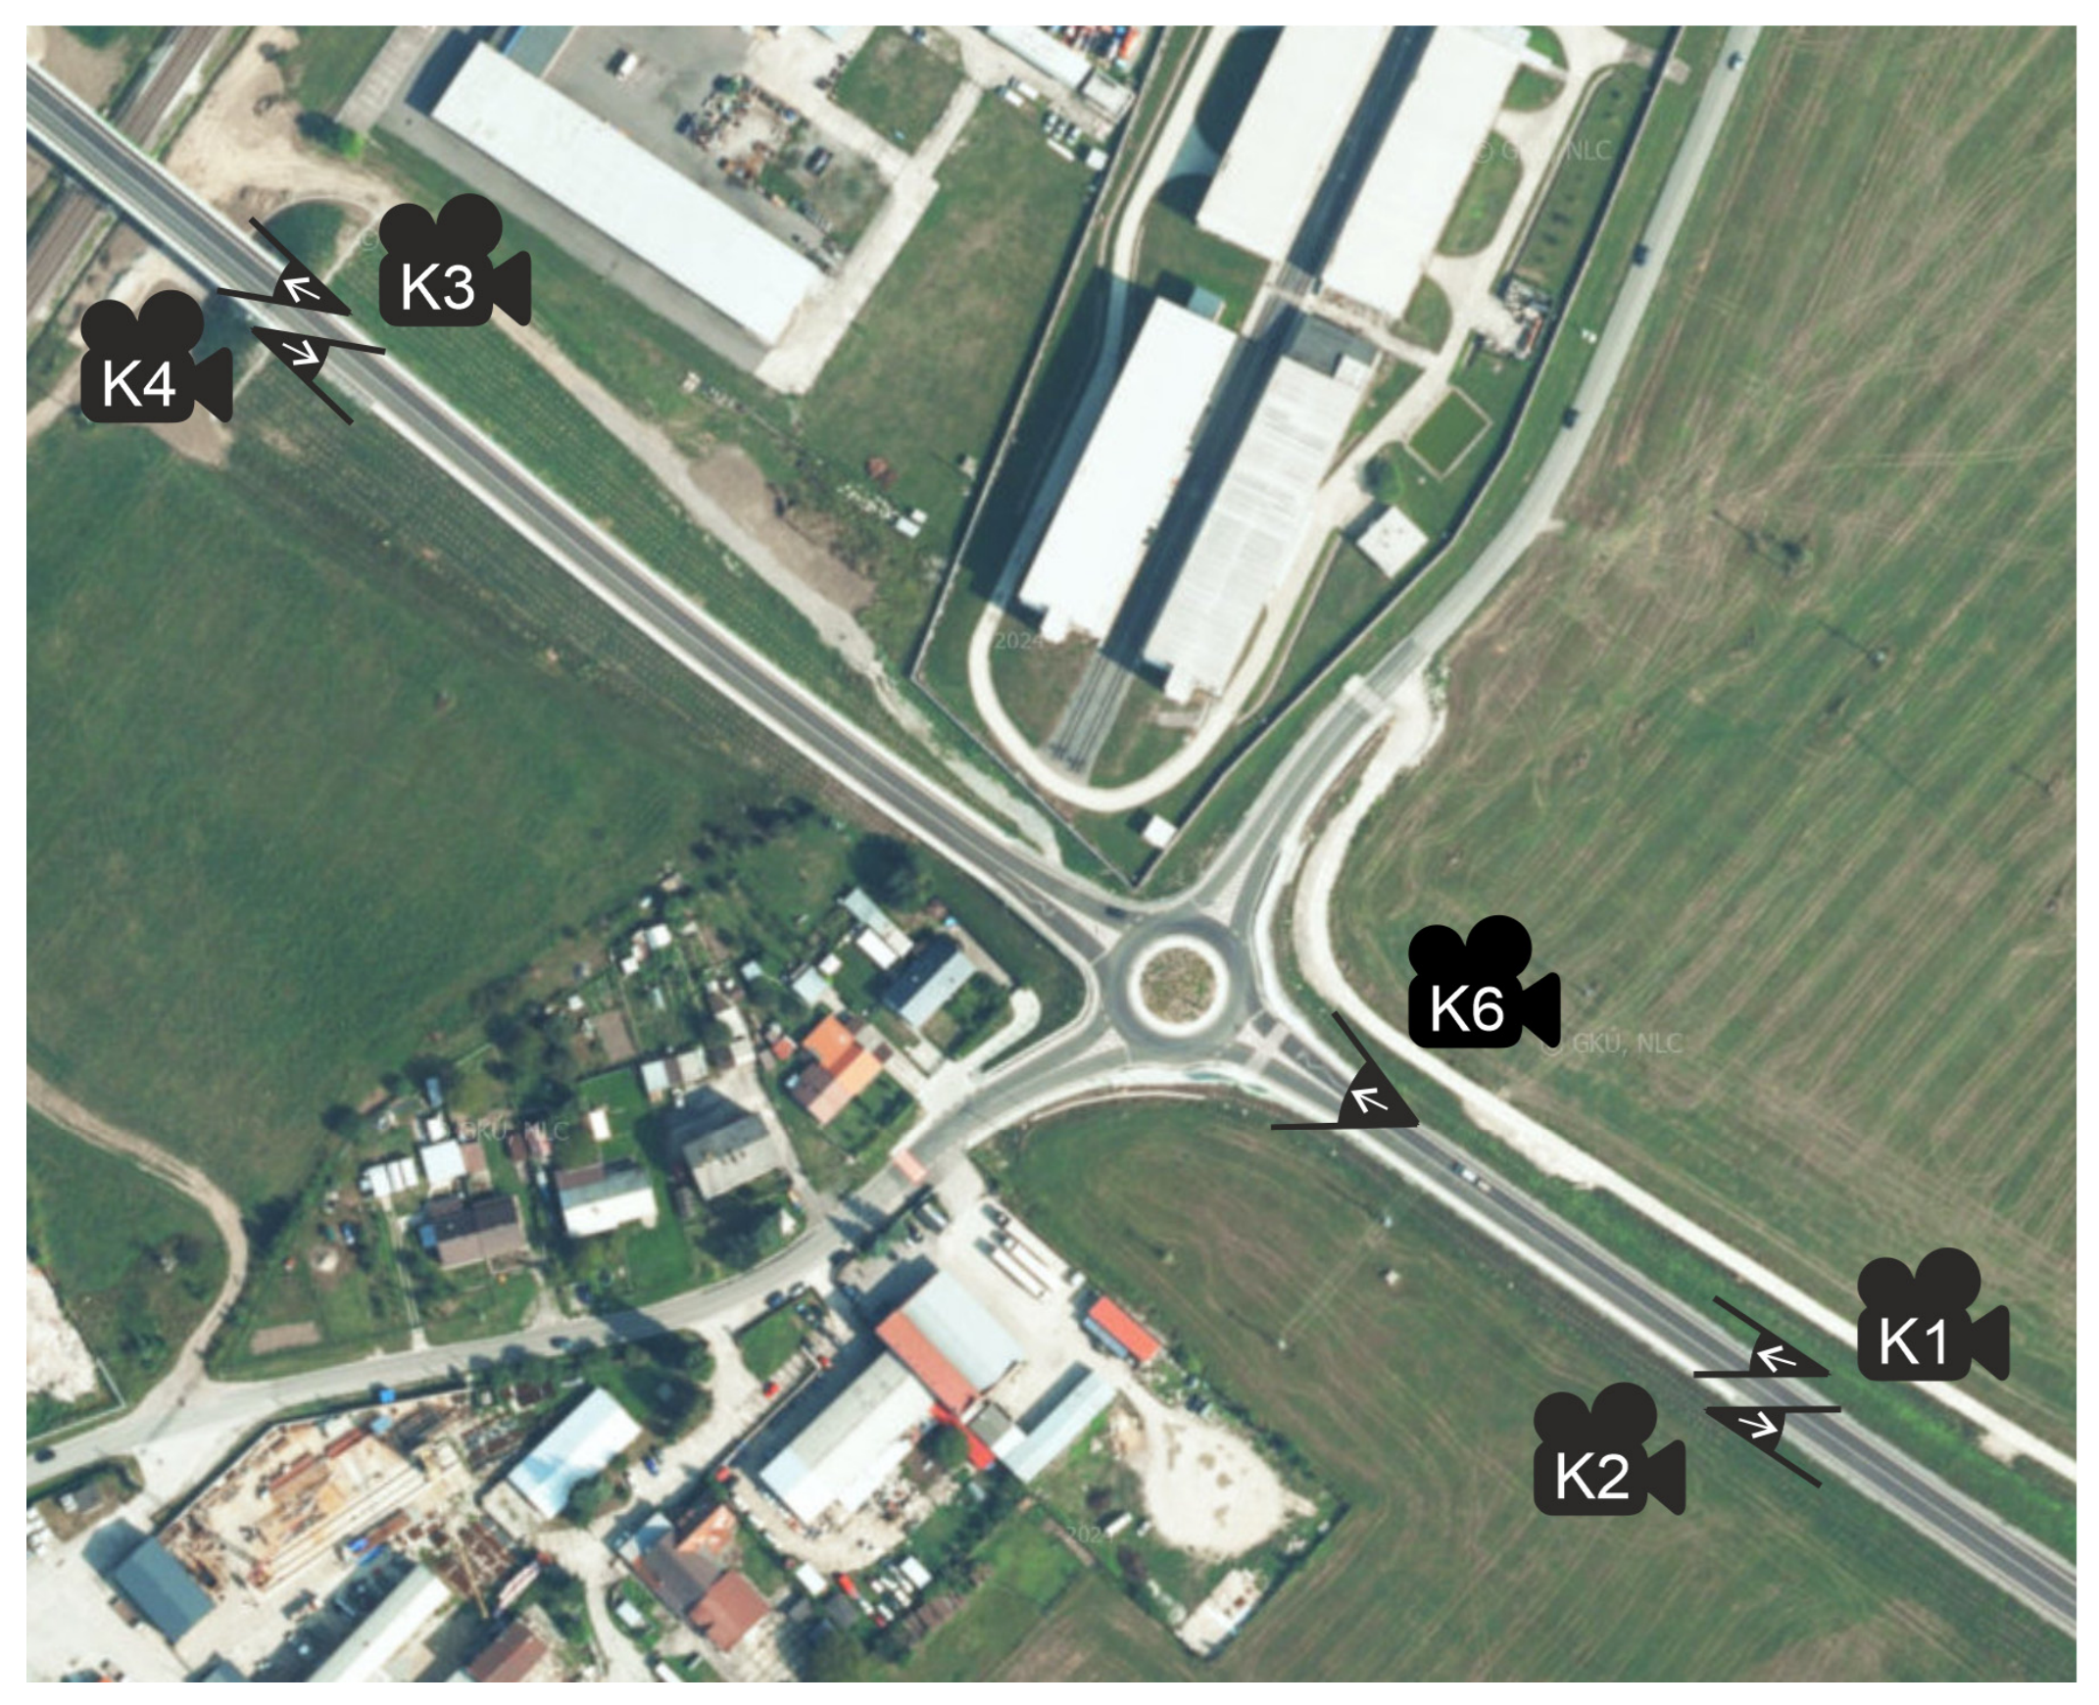
In addition to the turning-movement traffic survey described above, a supplementary traffic survey was conducted. Its aim was to obtain, for informational purposes, the largest possible number of travel times for individual vehicles. This traffic survey was conducted on two road profiles using four high-resolution video cameras, allowing vehicle license plate numbers to be read in most cases. The positions of the individual cameras during the traffic survey are shown in Figure 5.
Although the cameras at both profiles were positioned at the same locations, the imaginary vehicle passage lines were shifted relative to each other due to the sensor position and zoom level. Measurements were used to determine the mutual distances between the points at which vehicle registration plates were read, and the exact vehicle passage times were recorded.
The purpose of this supplementary traffic survey was to obtain additional traffic-flow characteristics and to compare them across different vehicle categories. This traffic survey was conducted simultaneously with traffic survey no. 1, and its aim was to determine:
  • The average travel time of individual vehicle categories over a longer road section, with the observation points located at a sufficient distance before the intersection. This procedure ensured that the compared travel times included all components related to passing through the intersection, i.e., breaking before the intersection, maneuvers within the intersection, and subsequent acceleration of all vehicle types.
  • The ratio between the measured travel times of different vehicle categories and those of PC over a longer road section.

3.3. Traffic Survey No. 3

Another test survey was carried out at a TR on Dolné Hony Street in Nitra, near the Nitra–North Industrial Park and the JLR (Jaguar Land Rover) automotive plant. The aim of this test survey was not only to obtain data on traffic volumes but also to record the speeds of approaching vehicles for model calibration. In this part of the study, the feasibility of using ATC will be examined, as this device provides information not only on the number of vehicles but also on their lengths and speeds.
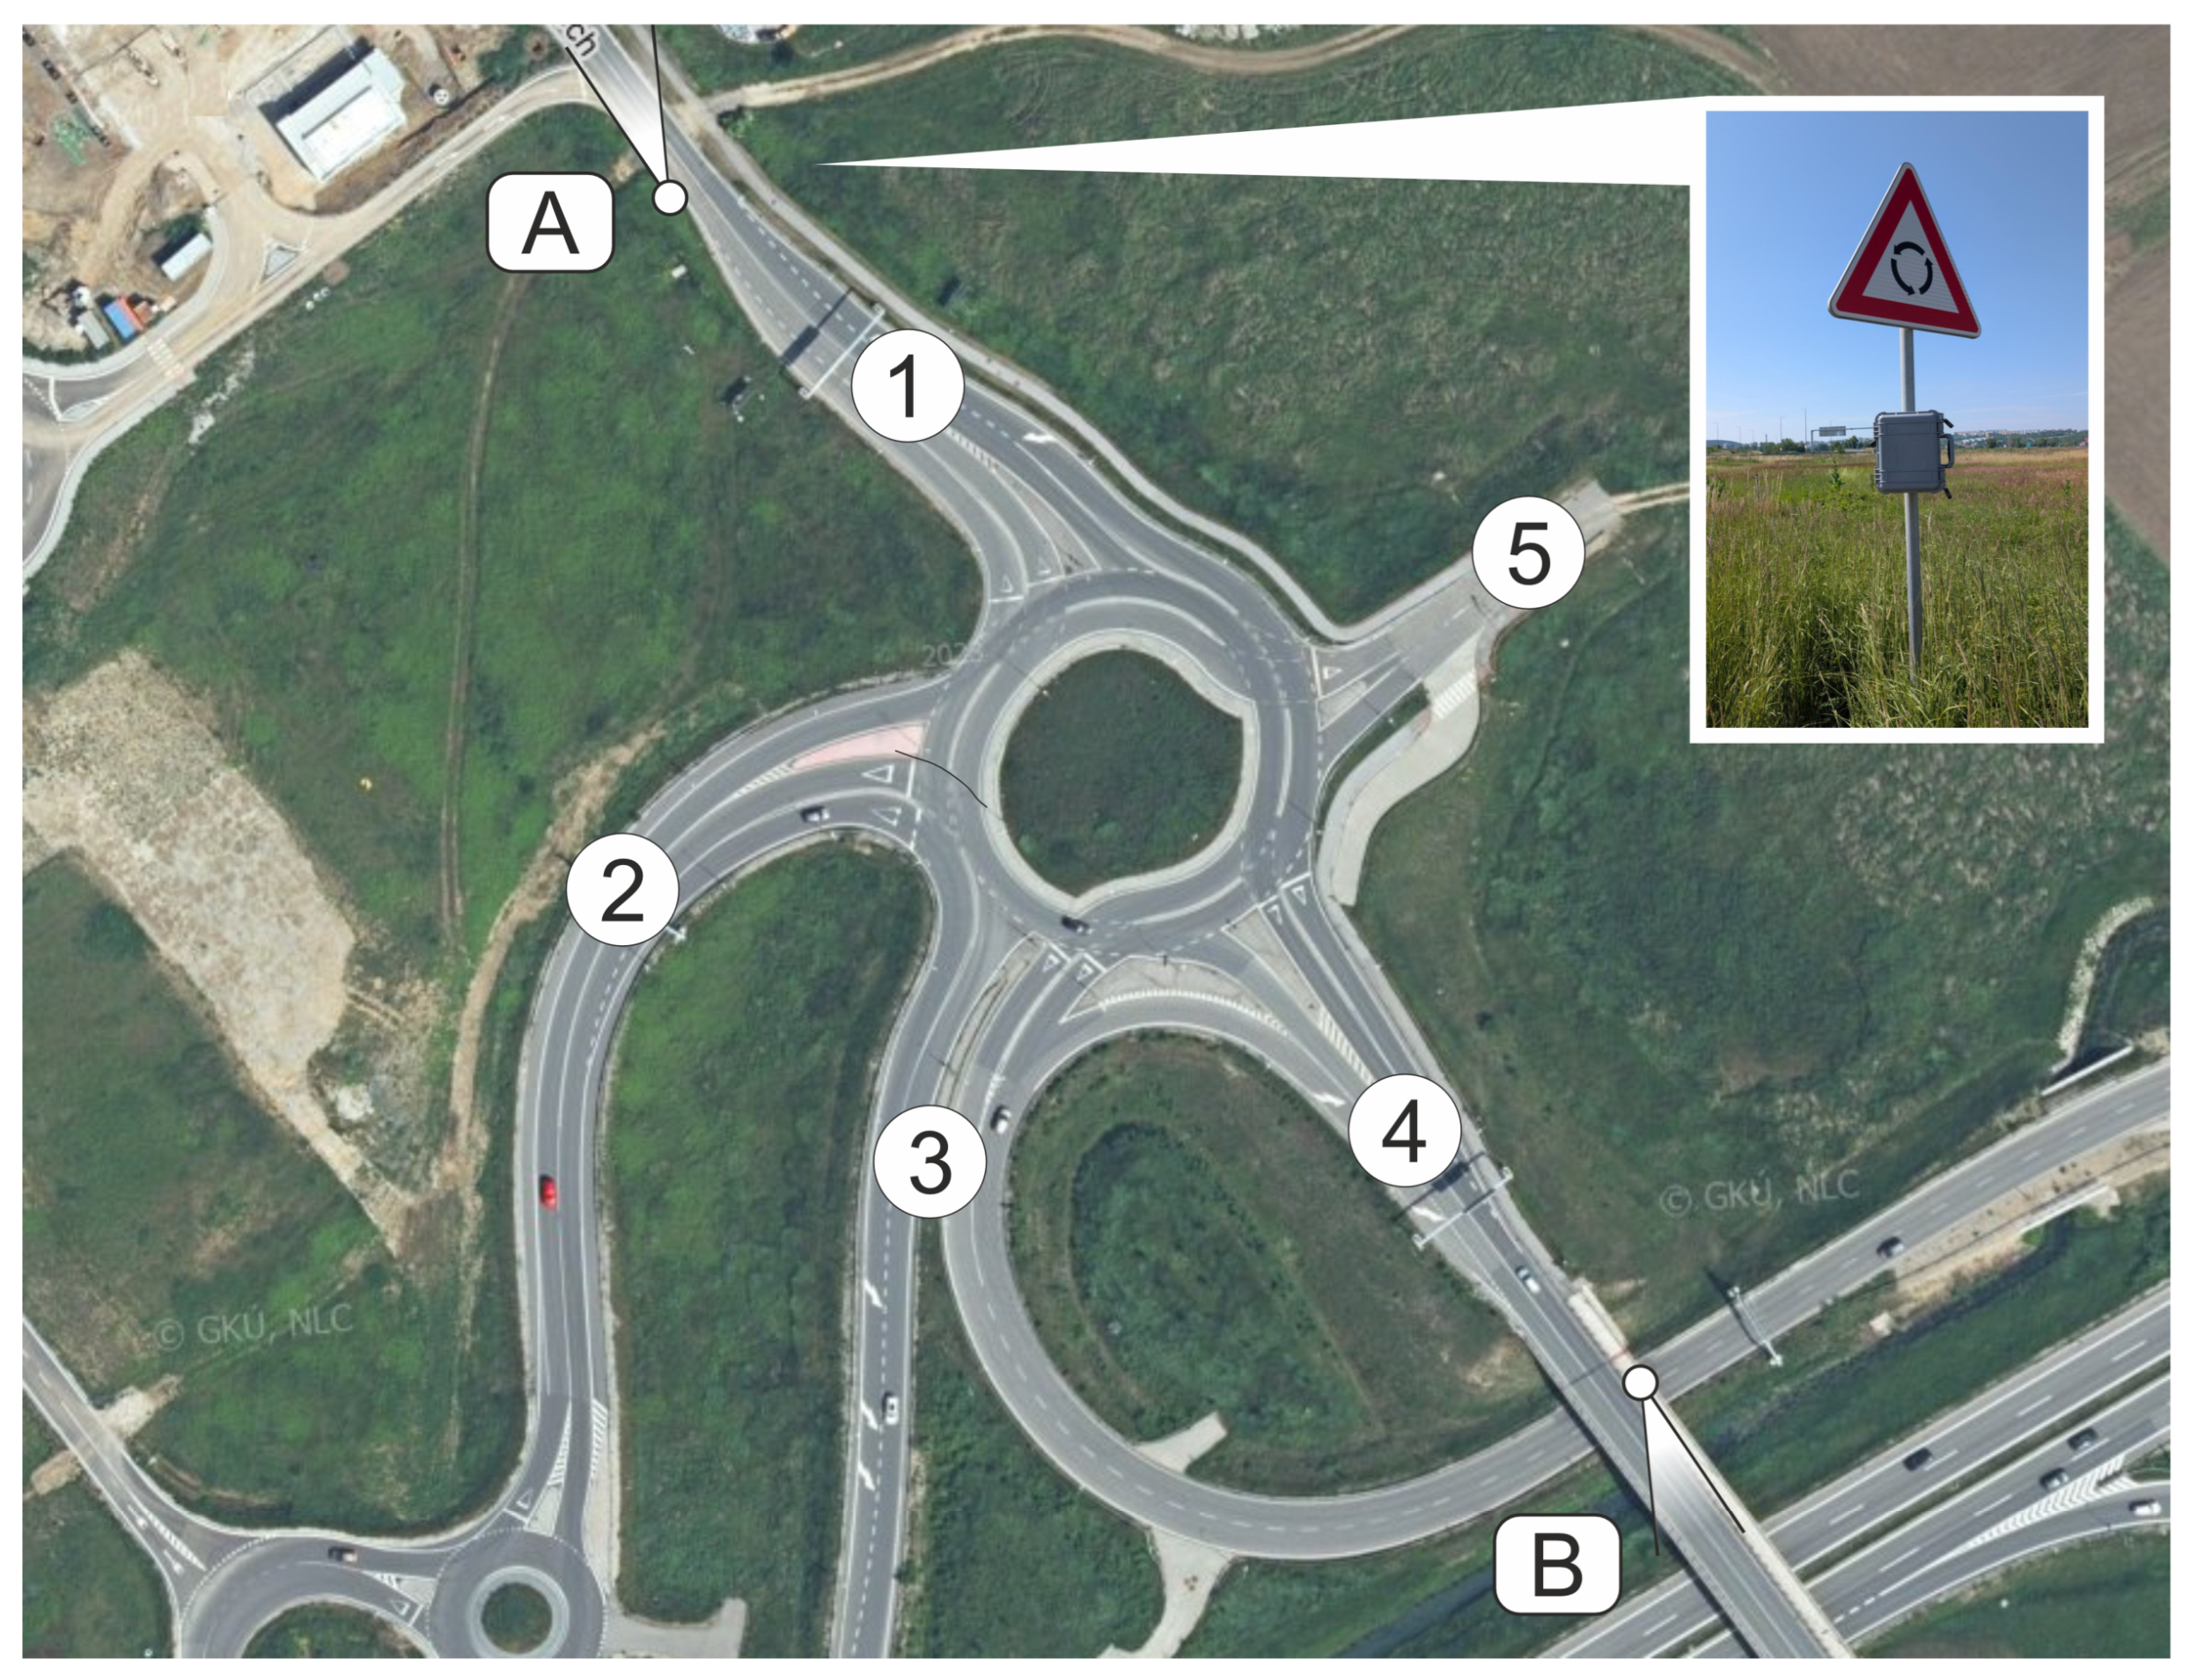
The traffic survey was conducted on 18 June 2025 from 6:00 a.m. to 6:00 p.m. under favorable weather conditions. A semi-automatic traffic survey method was used, employing two video cameras: one mounted on a public lighting pole and the other, the main camera, on an overhead traffic-sign gantry.
To improve the clarity of the TCA of this intersection, the following simplifications were considered:
  • Arm 5, which is unused according to Figure 6, was not included in the calculation.
  • Arm 4 was considered in the calculation as a TR 2/2 layout, and the connecting branch between Arms 3 and 4 was not considered.
In addition to the video cameras, two ATCs (ATC-A: SR7, Sierzega Elektronik GmbH, Thening, Austria and ATC-B: SDR Traffic+, DataCollect Traffic Systems GmbH, Kerpen, Germany) were installed on Arms 1 and 4 (Figure 6). During installation, the Sierzega radar is positioned at the edge of the carriageway, typically at a distance of 0.5 to 2 m from the traffic lane and 1 m above ground level, most often on a traffic signpost. For proper operation, the device must be oriented at an angle of approximately 30° relative to the road axis. The road section upstream of the intersection consisted of a two-lane, bidirectional carriageway; therefore, mutual vehicle overlap was minimized. Moreover, the analysis primarily used the direction toward the intersection, i.e., the traffic lane closer to the device.
The data output from the ATC-A contains the following information:
  • date and time of vehicle passage,
  • vehicle length [dm],
  • spot speed of the vehicle [km/h],
  • vehicle category, determined only based on the measured vehicle length,
  • time headway from the preceding vehicle, with a maximum value of 25.5 s [s],
  • direction of travel of the recorded vehicle: the “+” sign for vehicles approaching the device and the “−” sign for vehicles travelling in the opposite direction.
The data output from the ATC-B device contains the following information:
  • date and time of vehicle passage,
  • direction of vehicle travel, where 1 denotes movement toward the device and 2 denotes movement away from the device,
  • vehicle length [m],
  • spot speed of the vehicle [km/h].

4. Results and Proposals

As in the previous chapter, the results are also divided into subsections by individual traffic surveys.

4.1. Results of Traffic Survey No. 1

The preliminary traffic count showed that although the intersection was not heavily loaded, a relatively large number of articulated vehicle combinations passed through it during the day. The total number of actual vehicles entering the analyzed roundabout was as follows:
  • 4112 vehicles between 6:00 a.m. and 12:00 p.m.
  • 6188 vehicles between 12:00 p.m. and 6:00 p.m.
  • 10,300 vehicles in total over the 12-h survey period.
In the initial calculation, the currently valid equivalency factors for conversion into PCUs were applied. The total number of PCUs entering the analyzed roundabout was as follows:
  • 4545.5 PCU between 6:00 a.m. and 12:00 p.m.
  • 6521.0 PCU between 12:00 p.m. and 6:00 p.m.
  • 11,066.5 PCU in total over the 12-h survey period.
The MPH occurred between 6:45 a.m. and 7:45 a.m., during which 909 vehicles entered the intersection. The peak 15-min interval occurred outside the peak-hour interval, specifically between 7:15 a.m. and 7:30 a.m., when 244 vehicles entered the intersection.
The APH occurred between 3:00 p.m. and 4:00 p.m., during which 1342 vehicles entered the intersection. The peak 15-min interval occurred between 3:15 p.m. and 3:30 p.m., when 394 actual vehicles entered the intersection. As in the MPH, the directions and volumes of traffic flows during the APH were also analyzed.
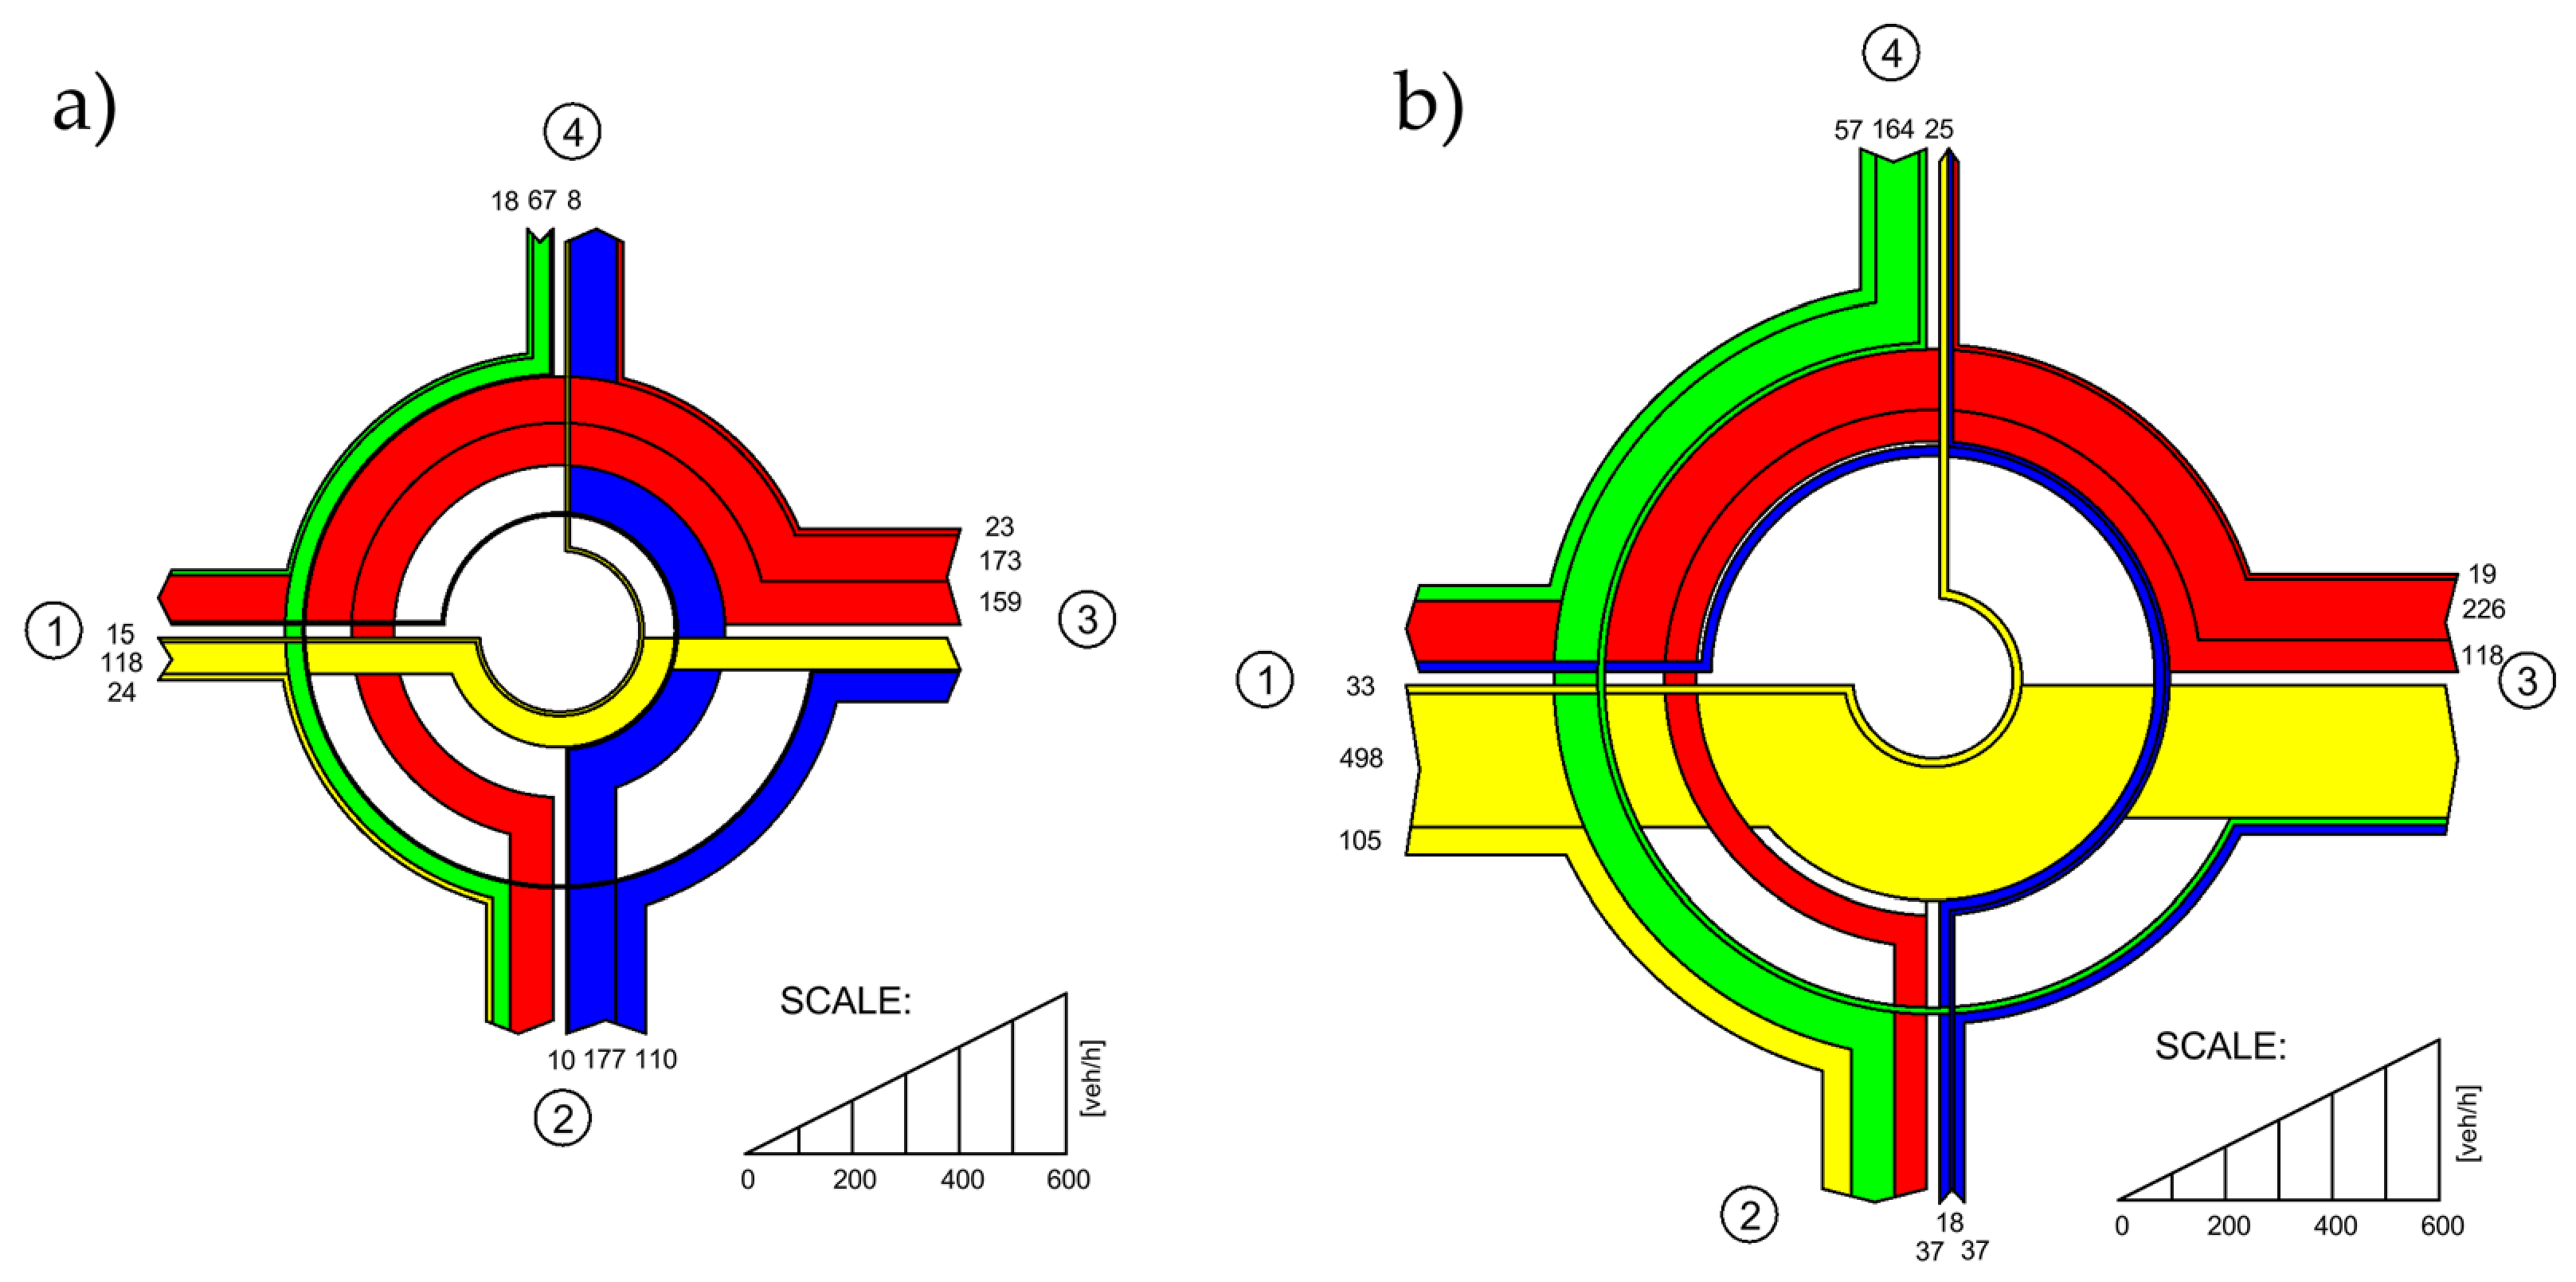
The distribution of vehicles during peak hours is illustrated by a special type of roundabout traffic-flow diagram in Figure 7.
TCA, along with the previously presented table of resulting waiting times, indicates that the intersection undoubtedly provides sufficient capacity for the current traffic volumes on all approaches. Nevertheless, this intersection is suitable for assessing the dynamic properties of individual vehicle categories because the traffic flow remains in motion and includes a relatively high proportion of HV, especially articulated vehicle combinations.

4.2. Results of Traffic Survey No. 2

During the supplementary traffic survey, the following data were recorded at each of the four observation points, K1 to K4:
  • vehicle registration plate,
  • vehicle category,
  • exact time of passage.
Subsequently, all vehicle registration plates were matched, and for each matched pair, the travel time between two consecutive observation points was calculated. The transcription of vehicle registration plates was performed manually to ensure the recognition of as many plates as possible. Nevertheless, several vehicles with unreadable or partially obstructed registration plates were recorded during the survey.
Based on the traffic-flow diagrams of actual vehicle volumes during the peak hours shown in Figure 7, it is evident that, due to the location of the intersection near an industrial area, there was a pronounced traffic load during the MPH from 7:15 a.m. to 8:15 a.m. on approach Arm 2, and conversely during the APH from 3:00 p.m. to 4:00 p.m. on the opposite direction. For this reason, the following comparison includes data representing:
  • The MPH for movements from entry Arm 2 to exit Arm 4, i.e., in the direction toward the industrial area.
  • The APH for movements from entry Arm 4 to exit Arm 2, i.e., in the direction from the industrial area.
As the capacity calculation shows, only 67 and 18 vehicles, respectively, traveled in the opposite direction during the MPH. For this reason, to include a larger number of relevant values, the following data were considered:
  • data for the entire morning period from 6:00 a.m. to 12:00 p.m. for movements from entry Arm 4 to exit Arm 2, i.e., in the direction from the industrial area,
  • data for the entire afternoon period from 12:00 p.m. to 6:00 p.m. for movements from entry Arm 2 to exit Arm 4, i.e., in the direction toward the industrial area.
The results of the travel time measurements, the success rate of vehicle detection compared with survey no. 1, and the calculated waiting times for individual vehicle categories during the MPH in the 2–4 direction are presented in Table 1.
The explanation of the individual items in Table 1, which also applies to the subsequent tables presented later in the article, is as follows:
  • Vehicle category: Not all vehicle categories are included in the table because cyclists (C) and motorcycles (M) do not have registration plates. Other categories, i.e., PCT, B, AB, and NCV (such as excavators or tractors), were generally absent.
  • Counted vehicles 1: This represents the total hourly traffic volume of a specific vehicle category recorded during traffic survey no. 1 using a semi-automatic recording method.
  • Counted vehicles 2: This represents the number of successfully matched pairs of vehicle registration plates at observation point K1 and subsequently at K2 during traffic survey no. 2. For some vehicles, the registration plates could not be read automatically; therefore, they were matched manually.
  • Success rate: This expresses the percentage of recorded vehicle passages during traffic survey no. 2 compared to no. 1.
  • Sum of travel times: This represents the sum of travel times between observation points K1 and K2, expressed in seconds and classified by vehicle category.
  • Average travel time: The average travel time per vehicle for the respective category.
  • Multiple of PC travel time: This expresses the travel time as a multiple of the average travel time of a standard PC.
According to the previous table, the vehicle categories T, TT, and TS did not exceed 1.5 times the travel time of a standard PC in any case. However, according to the technical guidelines, articulated and trailer combinations have an equivalency factor of up to 2.5 in this case, i.e., for a roundabout with a diameter of up to 60 m. It is clear, however, that the longer the road section before and after the intersection is included in the comparison, the smaller the percentage difference between a truck’s travel time and a PC’s will be. Therefore, the following chapter also describes another, more efficient procedure for obtaining travel times without the need for demanding supplementary traffic surveys.
Given the relatively high traffic volume and vehicle diversity during the APH, the peak hour for the 4–2 direction (i.e., from the industrial area) is also evaluated separately. The results of this part of the traffic survey are presented in Table 2.
The calculated coefficients in Table 2 indicate that, during the APH, the passage of trucks and articulated vehicle combinations slowed down compared with the MPH. This may have been caused by the higher traffic load during the APH, which increased by 48.0% compared with the MPH, i.e., from 907 to 1342 veh/h.
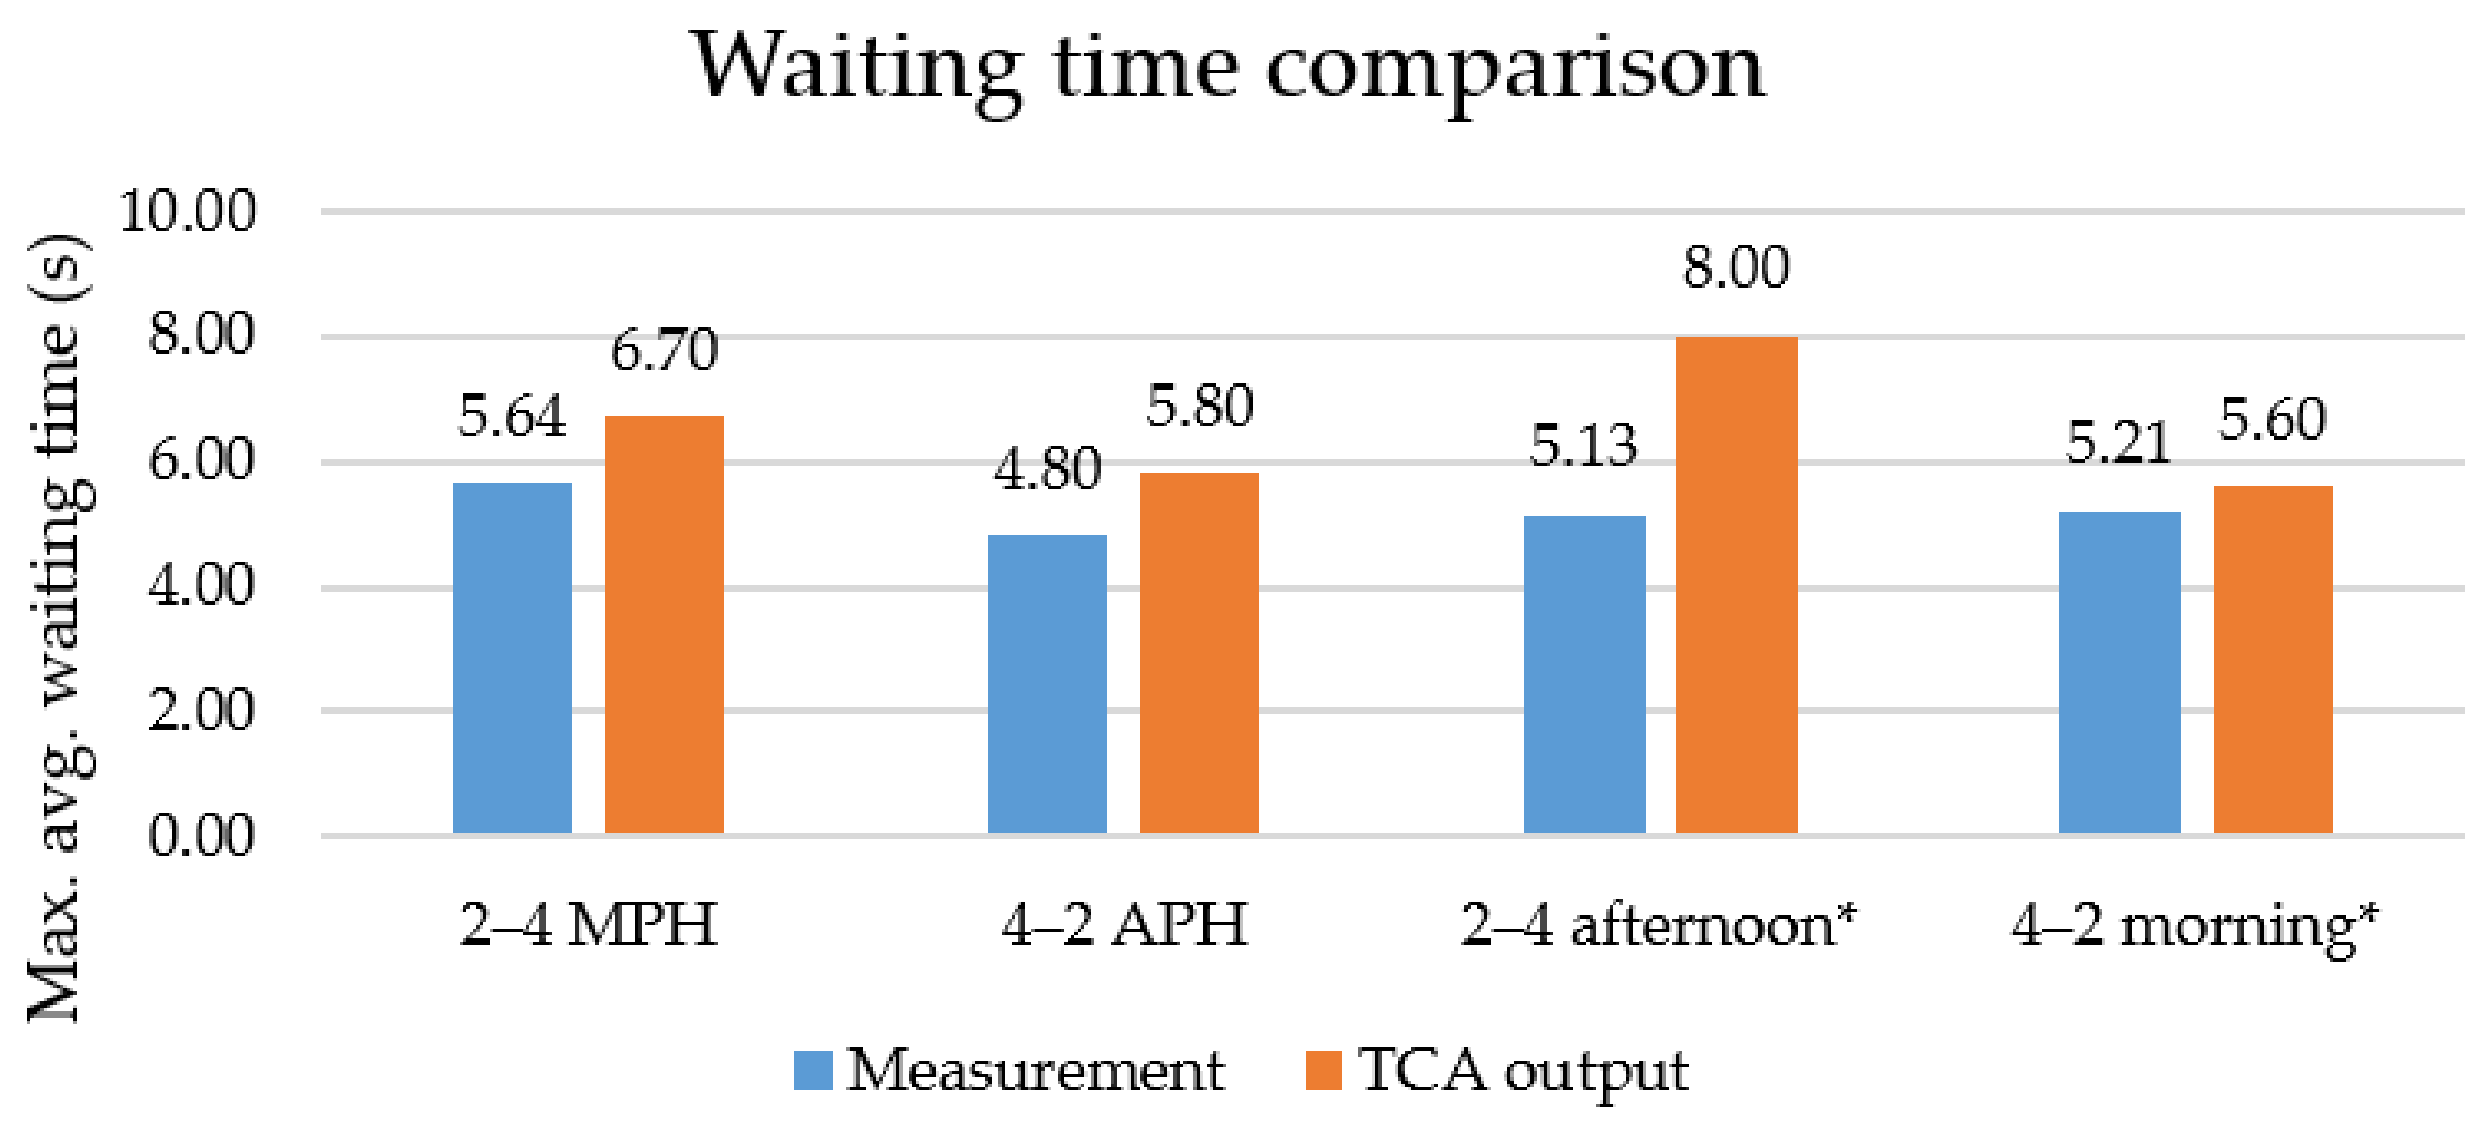
To verify the correctness of the data, a reverse calculation of the waiting time was performed, i.e., the average waiting time experienced by all vehicles in the traffic flow. This value was compared with the waiting obtained from the capacity calculation, which determines the data through a computational procedure rather than by direct measurement. The comparison of waiting times in the individual evaluated periods is shown in Figure 8.
As shown in the previous figure (Figure 8), the waiting time directly measured during the traffic survey is lower than the value obtained from TCA. The field-measured values were determined as the difference between each vehicle’s actual travel time and the theoretical travel time required for a vehicle to pass through the same road section at a constant speed of 50 km/h.
Figure 8 evaluates the waiting time for the MPH in the 2–4 direction and for the APH in the 4–2 direction. The right-hand part of the graph presents a comparison for the entire morning and afternoon periods, since the traffic volumes in the opposite directions were too low.

4.3. Results of Traffic Survey No. 3

The aim of this survey was to determine how the input variables could be measured and subsequently used to more accurately and dynamically determine PCU values for the capacity calculation of the intersection. For this purpose, the TR located near an industrial area was selected to ensure a high proportion of trucks and buses.
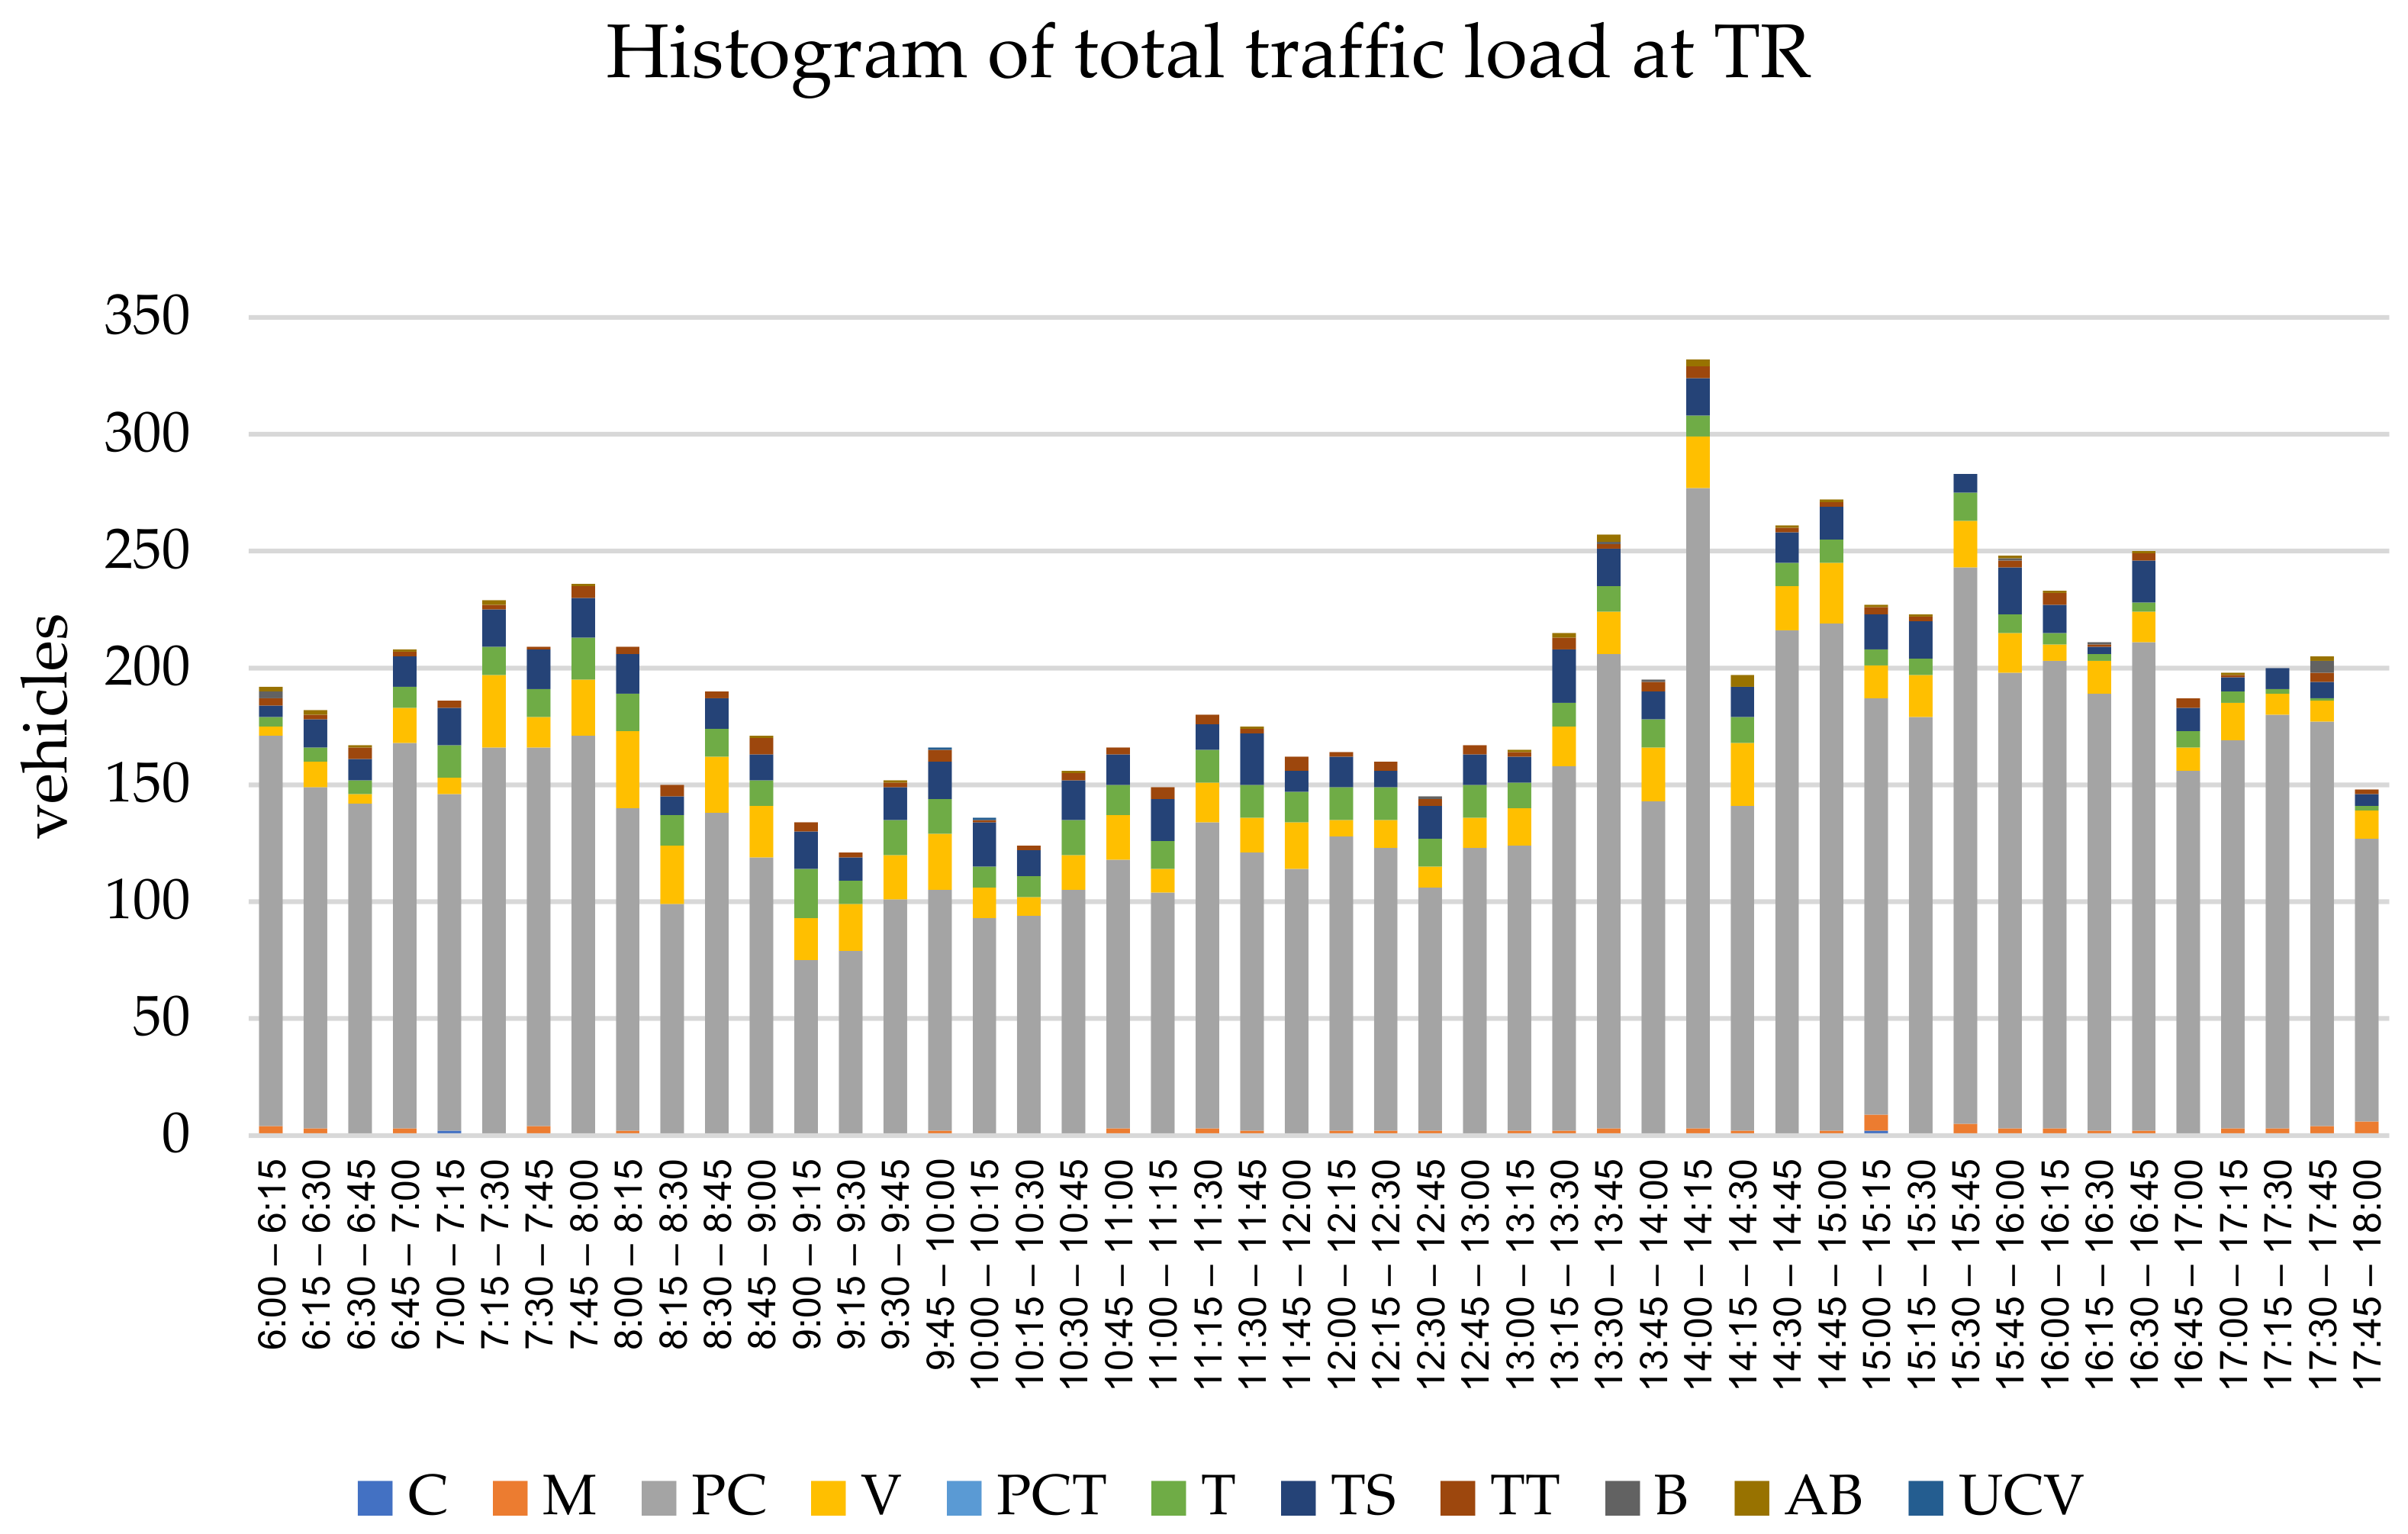
Similarly to the traffic survey no. 1, the evaluation of TR showed that the intersection was not heavily loaded. Figure 9 presents in detail the development of traffic volumes and the composition of the traffic flow. Nevertheless, this intersection is well-suited for demonstrating the importance of correctly setting the equivalency factors given the heterogeneous composition of the traffic flow. The LOS during both peak hours was A.
Data on vehicle passages on Arm 4 of TR were successfully extracted from ATC-A. In total, 5094 vehicles were recorded. In the direction toward the intersection, after removing very short vehicles (C, M), records of 3026 vehicle passages were obtained between 6:00 a.m. and 6:00 p.m. However, according to the manual evaluation, 3109 vehicles entered TR via the selected arm during the 12-h traffic survey. Thus, approximately 97.3% of all vehicles were successfully captured, excluding categories B and M.
The records were subsequently classified into three categories according to the vehicle length measured by the radar. This resulted in three vehicle groups:
  • Light vehicles (LVs), including vehicles of categories PC and V, with 2539 vehicles recorded out of 2571 counted by manual evaluation (98.8%).
  • T+B, including vehicles of categories T and B, with 177 vehicles recorded out of 197 counted by manual evaluation (89.8%).
  • HT, including vehicles of categories TS, TT, AB, and non-classified vehicles (NCV), with 310 vehicles recorded out of 341 counted by manual evaluation (90.9%).
During traffic survey no. 2, a total of 11,380 vehicle passage records were obtained from the second automatic traffic counter B between 6:00 a.m. and 6:00 p.m. After filtering for direction toward the intersection and removing very short vehicles (categories C and M), 3188 vehicles were recorded, while manual counting identified 3215.
Similarly to the evaluation of data from the first ATC, the vehicle records were classified into three categories based on radar-measured vehicle length. This resulted in the same three vehicle groups:
  • LV, with 2856 vehicles recorded out of 2862 counted by manual evaluation (99.8%).
  • T+B, with 167 vehicles recorded out of 185 counted by manual evaluation (90.27%).
  • HT, with 165 vehicles recorded out of 168 counted by manual evaluation (98.21%).
It was again confirmed that the time headway of HV does not reach twice the average headway of PC. The results are described in more detail in the following section, as they were used in the design and testing of the methodology for the dynamic determination of PCU equivalency factors.

4.4. Proposal of a Methodology for Determining Dynamic PCU Values

As demonstrated in this study, trucks and HV exhibit better dynamic characteristics than static equivalency factors suggest. In addition, several foreign authors have suggested introducing so-called dynamic equivalency factors. The following section provides a detailed description of the proposed methodology, which could be used either as an alternative to or as a complete replacement for static equivalency factors.
The aim of the proposed methodology is to develop a procedure that would ensure:
  • the simplest possible calculation based on measured traffic-flow characteristics;
  • an exact calculation procedure ensuring the reproducibility of results;
  • unambiguous input data;
  • easy acquisition of the input data required for the calculation.
The proposed methodology described below is based on the Time Headway Method and could, in the future, be incorporated into the technical guidelines TP 102. Since the calculation requires supplementary measurements of the traffic flow’s dynamic characteristics, such as vehicle time headways and speeds, it may serve as an alternative to static equivalency factor values, or even later as their full replacement.
If a significant deviation of traffic conditions from standard values is expected within the analyzed intersection, i.e., the intersection subjected to TCA, for example, due to a high proportion of trucks, the PCU equivalency factors could be determined individually based on traffic survey results using a method based on the analysis of time headways.
The method assumes that the headway between vehicles represents a measure of vehicle interaction within the traffic flow and is directly related to the capacity requirements of individual vehicle categories. An increase in average time headway due to the presence of a particular vehicle category reduces traffic flow capacity. The ratio of these headways can therefore be used to determine the equivalency factor, either for a single additional vehicle category or for several vehicle categories.
The methodology described in this section uses commonly available devices and does not significantly increase the complexity of conducting a traffic survey. The methodology is particularly suitable in cases involving:
  • non-standard traffic composition,
  • a significant proportion of HV,
  • specific local road conditions,
  • research or experimental analyses,
  • the need for increased accuracy of TCA.

4.4.1. Collection of Input Data

To determine dynamic equivalency factors, the following must be ensured within the same time interval:
  • a standard turning-movement traffic survey, preferably carried out using a manual or semi-automatic method, which ensures accurate vehicle categorization and identification of peak-hour intervals,
  • automatic recording of vehicle passages using ATC, or a microwave radar device, which enables the exact time of passage of individual vehicles, speed, vehicle length, and time headways between vehicles to be recorded,
  • synchronization of the time intervals of the automatic and manual measurements.

4.4.2. Placement of ATCs

ATCs should be positioned to capture the main traffic flow passing through the intersection, i.e., the flow expected to have the highest proportion of freight traffic. If it is not possible to identify in advance the two arms with the highest HV volume, or if the share of HV is relatively similar across the arms, ATC devices should be installed on all arms of the intersection at a sufficient distance upstream of the intersection. This is necessary because data in the immediate vicinity of the intersection may be distorted by stopping or slow-moving vehicles.

4.4.3. Processing of Data from ATCs

After obtaining complete data from the 12-h traffic survey, vehicle passage data must be extracted at least within the following scope:
  • date and exact time of vehicle passage,
  • vehicle direction, while only data for vehicles entering the intersection should be processed,
  • identification of vehicle length that enables vehicles to be classified into at least two categories.
Subsequently, at least two vehicle categories should be defined from these data. For categorization, the total number of vehicles on a specific intersection arm may be used, and all vehicle passage records, sorted according to the dynamic length measured by the ATC, may then be divided in proportion to the corresponding arm. During data processing, extreme or erroneous values must be removed, and the dataset’s representativeness must be ensured. The methodology is suitable for application when the share of heavier vehicles, i.e., HV or the combined group T+B+HV, exceeds 10%. At very low proportions of these vehicles, their influence on the calculation is limited, and determining the PCU equivalency factor is therefore inefficient.

4.4.4. Calculation of Coefficients

Within this methodology, the coefficient would be calculated in two ways. The first option is to divide vehicles into only two categories: LVs, including PC, M, V, and HV including T, B, AB, TS, TT, and NCV. Subsequently, only one PCU coefficient f P C U , H V , is determined for this vehicle category according to Equation (1):
f P C U , H V = t m t L V p L V p H V
In Equation (1), the input data are obtained as follows:
t m —the average time headway between two vehicles in a mixed traffic flow [s], obtained from the evaluation of ATC records. The entire traffic survey period is considered, including headway between two consecutive vehicles.
t L V —the average time headway of LVs [s], obtained from the same dataset; however, only the time headways between two consecutive LVs are considered. Again, all data (from the 12-h traffic survey) are used.
p L V —the proportion of LVs in the traffic flow [%], obtained from the manual evaluation of the turning-movement traffic survey at the intersection.
p H V —the proportion of HV in the traffic flow [%], obtained from the manual evaluation of the turning-movement traffic survey at the intersection.
Equation (1) is based on the assumption that, when the traffic flow is divided into two groups, the average time headway in a mixed traffic flow can be expressed at an aggregate level as a weighted average of the time headways of LVs and HV, where the weights correspond to the proportions of the respective groups in the traffic stream. This does not imply that all individual interactions between vehicles are linear. Rather, it represents a simplified model based on the linear decomposition of the time headway over the analyzed period, assuming a defined division of vehicles into two categories.
However, the methodology must also enable more precise coefficient settings for additional vehicle types, as the first alternative is limited to a mixed traffic flow consisting of LVs and one additional vehicle category. The time-headway-based method also includes a simplified relationship, given in Equation (2), that considers only the time-headway ratio without accounting for the proportions of vehicle categories in the traffic flow.
f J V , i = t i t L V
In Equation (2), t i represents the average time headway of the i-th vehicle category in the mixed traffic flow [s]. This variable is obtained as the average of all time headways of vehicles of the respective category relative to other vehicles.

4.5. Example of Coefficient Calculation

The example presented in the following text is based on real data obtained during traffic survey no. 3. If the methodology that defines only one equivalency factor is applied, the output would be based on the data in Table 3. To avoid the influence of free-flow headways that do not represent direct vehicle interaction, extreme time-headway values were excluded before the calculation of the representative mean headways [81]. The threshold was selected to retain vehicle pairs operating within the same traffic stream while excluding isolated vehicle passages.
The distribution of time headways was positively skewed due to the occurrence of longer free-flow intervals; therefore, standard deviations are not presented in Table 3 and the analysis focuses on representative mean headways after data screening.
According to the proposed methodology, the calculation could be performed jointly across both arms: the share of HV would be calculated based on the total number of vehicles entering the intersection on the selected arms, and the time headways would likewise be calculated from all ordered records.
In this case, the second device (ATC-B) is deliberately presented separately to demonstrate that, regardless of device type or intersection arm, approximately similar time headway values are achieved, and, in this case, even a similar share of heavy traffic is observed.
The same calculation was therefore also performed for Arm 2 of TR, with the results presented in Table 4.
According to this methodology, both devices should be considered, i.e., data on vehicle time headways from both directions of the road section where a higher proportion of HV is expected. After including all values in the average, the resulting coefficient value would be 1.715 PCU/veh.
The second alternative is a methodology for determining multiple coefficients using a simplified calculation based on time headway ratios. The resulting coefficient values are calculated as simple ratios between the average time headway of vehicles in the respective group and the time headway of LVs, which is always the shortest. This results in two or three coefficients: LV (3), T+B (4), and HV (5).
f P C U , L V = 1.00 -
f P C U , T + B = t T + B t L V = 14.55 9.26 = 1.57   -
f P C U , H V = t H V t L V = 16.07 9.26 = 1.74   -
As can be seen from the results, the coefficient for T+B is 1.57, whereas for the intersection analyzed in traffic survey no. 2, the coefficient according to TP 102 would be 1.50 and 2.0 for HV. In this case, the calculated coefficient for HV is 1.74. This indicates that the method, particularly for roundabouts or TRs with large outer diameters, may also determine slightly higher values.

4.6. Evaluation of the Proposed Methodology

The proposed methodology for the dynamic determination of PCU equivalency factors based on the time-headway principle is a practically applicable, technically justified procedure that enables consideration of real local traffic conditions in the TCA of intersections. The advantage of the methodology lies in combining automatic measurement of traffic characteristics using ATCs with accurate vehicle categorization based on a manual traffic survey. This minimizes the influence of subjectivity while ensuring sufficient accuracy of the input data. The method enables coefficients to be determined for both a simplified two-category vehicle classification and a more detailed classification of vehicles within the traffic flow, with the resulting values reflecting the actual interactions among vehicles.
Another advantage is the ability to apply the methodology as an alternative to tabulated equivalency factors, particularly in cases of non-standard traffic composition or specific geometric conditions at the intersection. The results of the application of the methodology show that the determined coefficients fall within a realistic range of values and may differ from standard values depending on the specific traffic-flow conditions, which confirms the validity of the dynamic approach.
Although the proposed methodology was developed and tested using data collected in Slovakia, its underlying principle is not limited to a specific country or national design standard. The method is based on directly observed traffic-flow characteristics, particularly vehicle time headways, and therefore reflects the actual behavior of drivers and vehicles under local operating conditions. The use of locally measured traffic-flow characteristics may be more appropriate than relying exclusively on fixed tabulated PCU values derived under different geographical, behavioral, or operational conditions.
Infrastructure design standards may also affect the resulting PCU values. Road geometry, lane width, approach alignment, curvature, gradients, visibility conditions, and intersection layout can influence vehicle speeds, acceleration and deceleration behavior, available gaps, and the interaction between vehicle categories. For example, wider lanes may encourage higher operating speeds, while constrained geometric conditions may increase the relative influence of HV on the traffic flow [82]. These effects are difficult to capture adequately through a single universal set of tabulated equivalency factors. By deriving PCU values from measured time headways, the proposed methodology can partially account for local infrastructure characteristics and prevailing driver behavior without requiring the prior definition of separate coefficients for every country, region, or geometric configuration.
A limitation of the methodology is its dependence on the quality and representativeness of the input measurements, particularly the accuracy of vehicle categorization and the proper placement of ATC outside the area influenced by the intersection itself. However, if these conditions are met, the methodology is a suitable tool for improving the accuracy of capacity calculations and expanding the options for determining equivalency factors in traffic engineering practice. For data collection, all time headways recorded during the 12-h traffic survey were included. Although it would be more efficient to examine only the time headways recorded during peak hours, this procedure is not recommended in the proposed methodology. Practical experience from traffic surveys indicates that the peak hour itself is a relatively short period, during which it may not be possible to obtain a sufficiently representative sample of vehicles for time-headway measurement.
The proposed procedure, in its current form, is most suitable for unsignalized intersections, particularly roundabouts, where the main entering traffic stream can be identified, measurements can be conducted at a sufficient distance upstream of the intersection, and vehicle time headways can be recorded without substantial influence from queues or lane-changing maneuvers [83]. In principle, the methodology is applicable to standard configurations of unsignalized and roundabout intersections as defined in [11]. For intersections with substantially different geometric characteristics, a higher number of lanes, a large proportion of turning vehicles, pedestrians or cyclists, or significant longitudinal gradients, the methodology should be validated separately before application.

4.7. Impact of Different PCU Values

To illustrate the practical implications of using different PCU values, a sensitivity analysis was performed for the examined TR. The analysis was based on APH, during which the proportions of the T+B vehicle group and HV were 6.52% and 8.88%, respectively. These values represent a considerably higher share of HV than that observed at the single-lane roundabout; therefore, the effect of changes in PCU coefficients can be expected to be more pronounced.
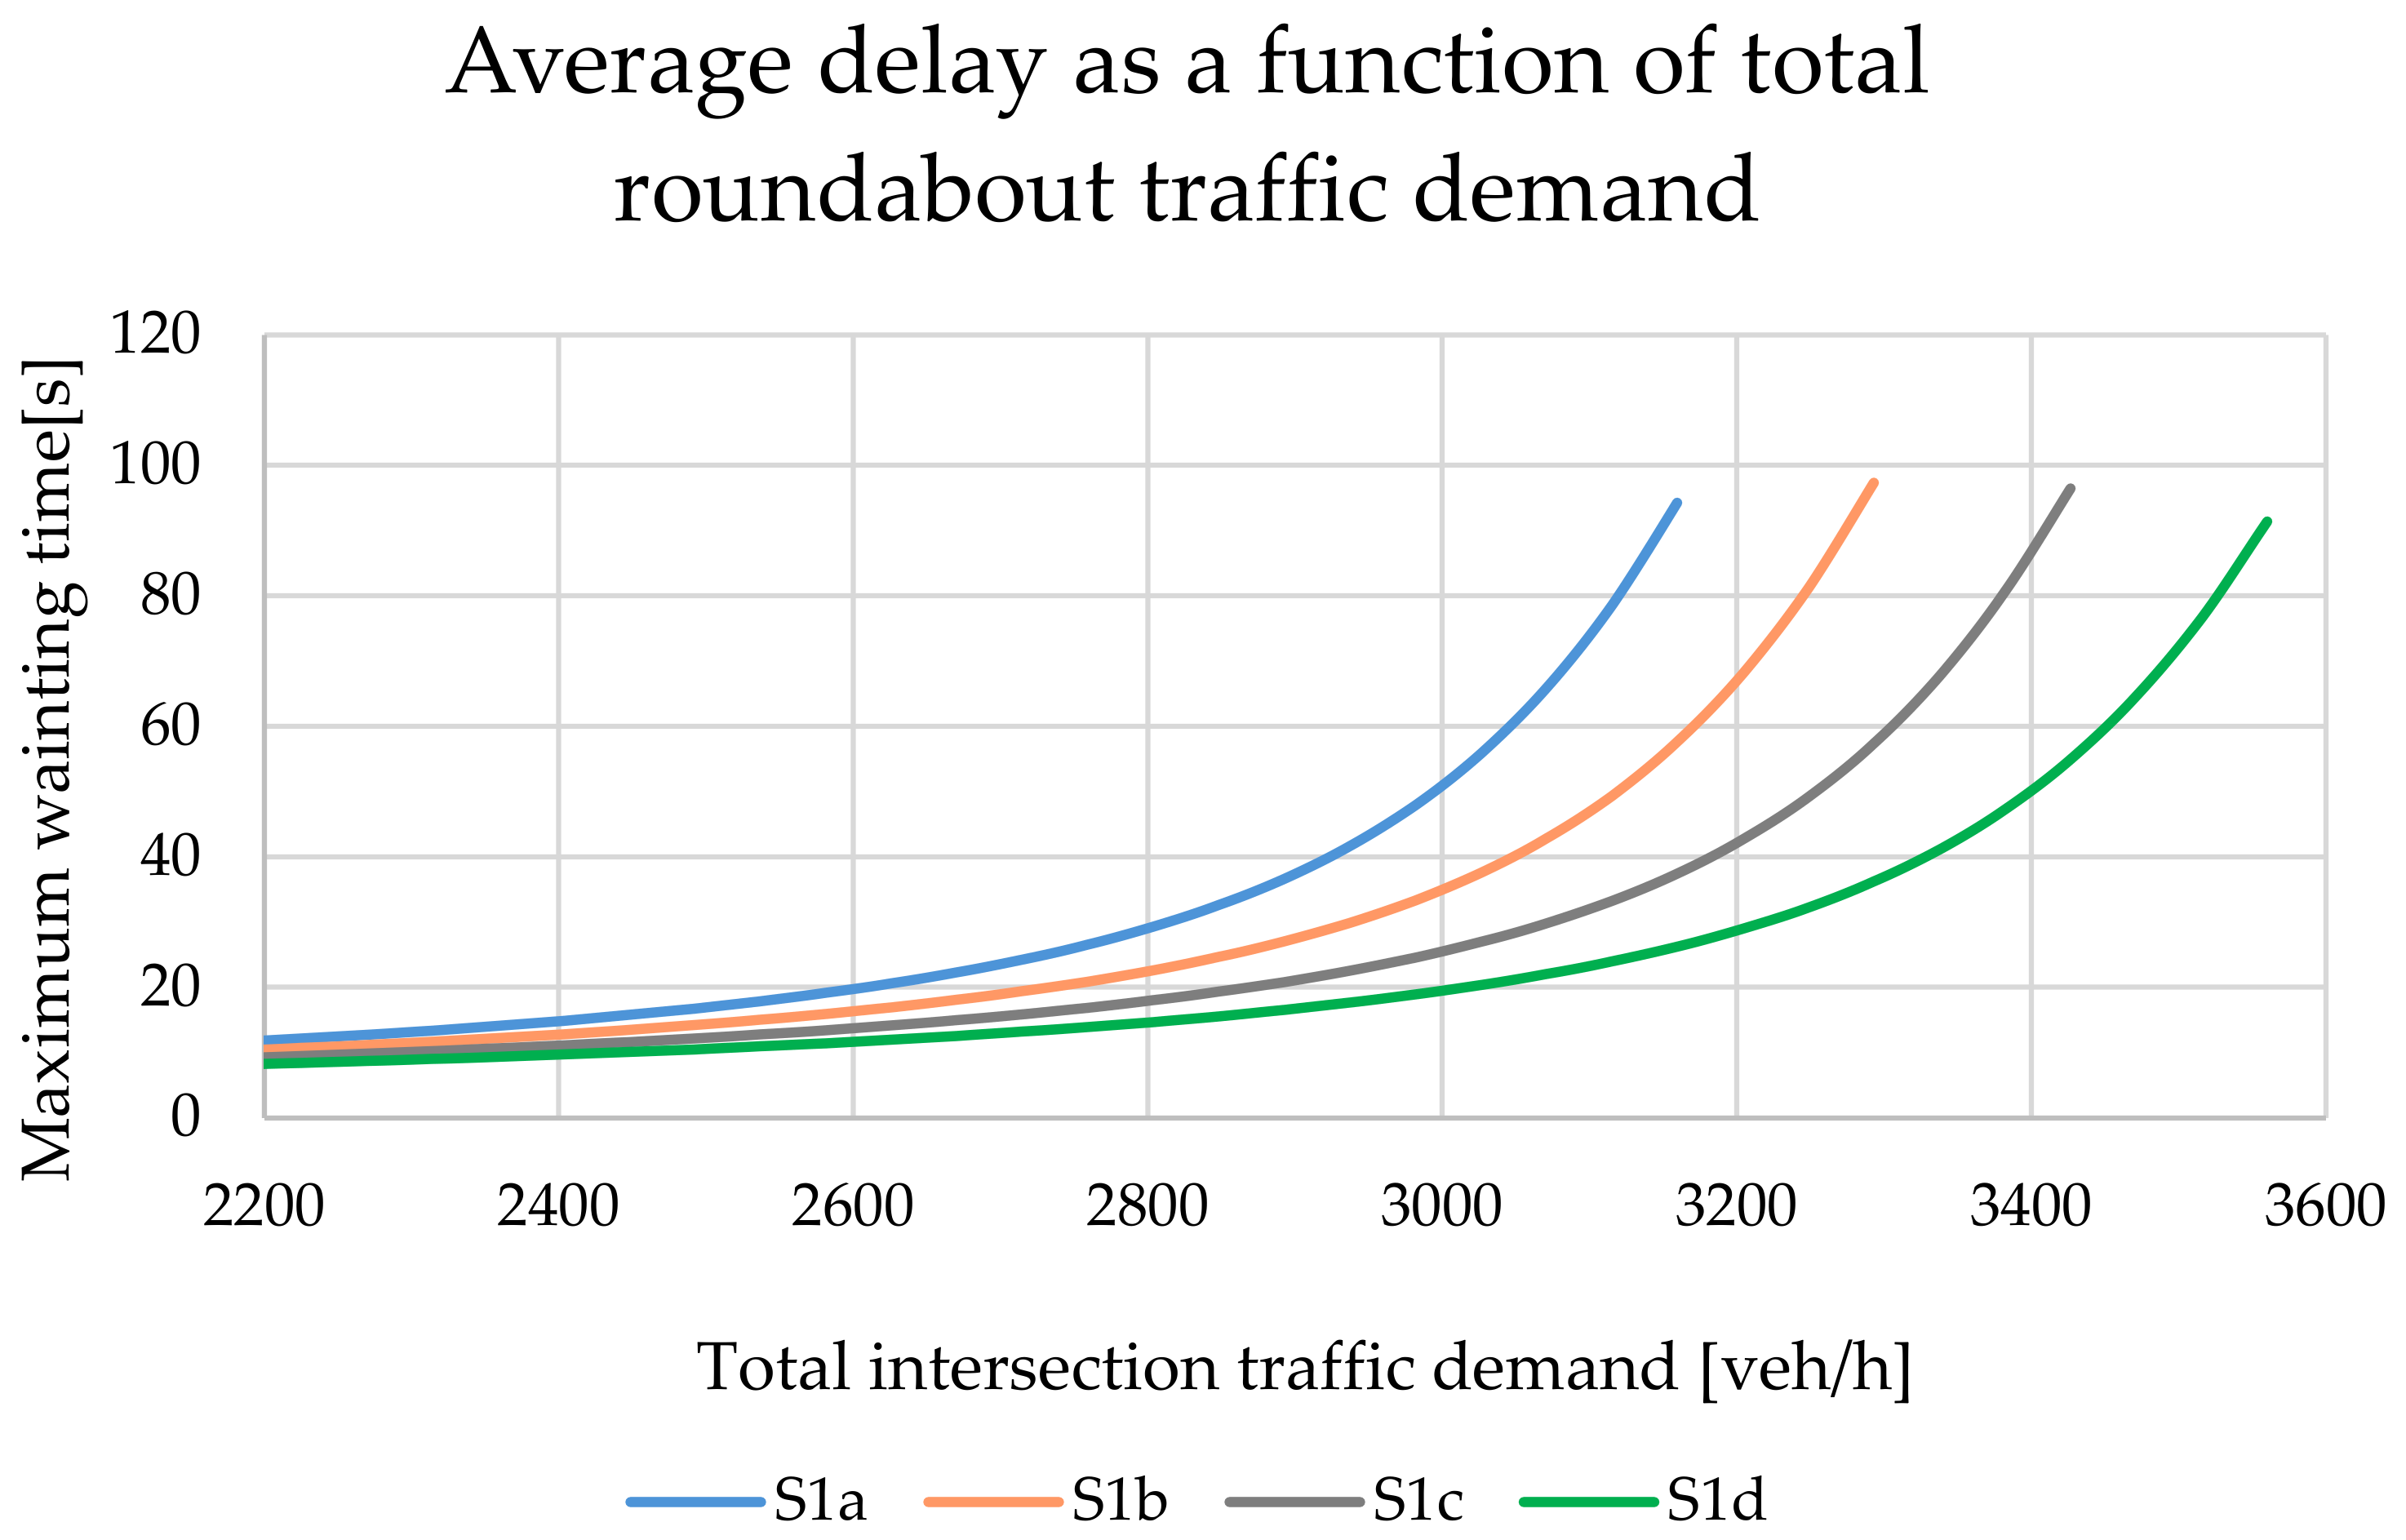
The simulation was carried out by gradually increasing the traffic demand on all traffic movements by one percentage point. For each demand level, the highest average waiting time among all roundabout approaches was considered. The calculation was repeated for several scenarios with different PCU coefficients assigned to each vehicle group. The waiting time curves were plotted only up to the point at which the available capacity was exceeded, i.e., until the last demand level with a positive capacity reserve.
Figure 10 shows the evolution of the maximum average waiting time across the individual scenarios where
  • S1a: T+B = 2.00 PCU; HV = 2.50 PCU (current values according to [11]).
  • S1b: T+B = 1.75 PCU; HV = 2.25 PCU.
  • S1c: T+B = 1.50 PCU; HV = 2.00 PCU.
  • S1d: T+B = 1.25 PCU; HV = 1.75 PCU.
All curves follow a similar non-linear pattern because the calculation procedure uses the same sequence: determining the basic capacity, the adjusted entry capacity, the degree of saturation, and, finally, the average waiting time. However, the individual curves differ substantially in their position, demonstrating that the selected PCU values directly affect the converted traffic demand and, consequently, the calculated operational performance of the intersection.
For the analyzed TR, the differences between the scenarios are more pronounced than in the single-lane roundabout. This is mainly attributable to TR’s higher overall capacity and, particularly, to the higher share of HV in the observed traffic flow. In the present case, Scenario S1c represents the currently applicable PCU coefficients for roundabouts with an outer diameter exceeding 60 m. Lower PCU values assigned to HV reduce the converted traffic demand and shift the waiting time curve towards higher actual traffic volumes. Conversely, higher PCU values result in an earlier increase in waiting and an earlier attainment of capacity limits.
The results indicate that the choice of PCU coefficients can have a substantial effect on TCA outcomes, especially when the intersection operates near its practical capacity. At the maximum acceptable LOS (E), using lower PCU coefficients could theoretically increase the estimated capacity of the analyzed TR by more than 200 actual vehicles per hour. This does not imply that lower coefficients should be applied universally. Rather, it demonstrates that static PCU values can significantly influence calculated waiting and capacity reserve, particularly at intersections with a high proportion of HV. Therefore, the use of locally measured and dynamically determined PCU values may provide a more realistic basis for TCA under specific traffic and geometric conditions.

5. Discussion and Conclusions

The research presented in this article focused on assessing the suitability of using static PCU values. As demonstrated, static values have been used, for example, in Slovakia for more than 20 years. The first equivalency factors were introduced in the United States’ Highway Capacity Manual in the mid-20th century. In the Slovak Republic, these tabulated PCU values have been incorporated from adopted German standards and regulations.
However, this article, like many other studies, demonstrates that a tabulated value may not always be correct and that PCU values can also be determined dynamically under specific conditions [22]. Such determination enables accounting for the specific conditions at a particular intersection and thus modifying the effects of different vehicle types, especially HV.
The proposed methodology presented in this article is relatively simple to calculate, as it uses time headway observations [84]. Other methods may also be considered, with eight introduced in the first part of the article; however, their practical implementation would either be complicated or yield irrelevant results.
For example, the speed-based method may appear relatively simple to implement, but, as indicated by the source [85] and the authors’ own testing, the results would be highly inaccurate and likely overestimate the effect of HV in most cases. Inaccuracies would occur mainly when measuring speed with ATC and when measuring vehicle lengths. Although these parameters can be measured dynamically, vehicle braking near intersections may distort length measurements. Since the speed-based method considers the ratio of vehicle areas, it is necessary to estimate the width of individual vehicle categories [86,87]. All these efforts should contribute to a more accurate prediction of LOS and the characteristics of traffic streams, particularly heterogeneous traffic streams [88,89].
Nevertheless, the methodology has several limitations. First, the accuracy of the resulting coefficients depends on the quality of the input data, particularly the correct categorization of vehicles and the proper placement of ATC. If devices are installed too close to the intersection, recorded speeds, vehicle lengths, and time headways may be distorted by braking, queuing, or acceleration maneuvers. Second, a sufficiently large and representative dataset is required. Although it may seem efficient to evaluate only peak-hour data, this study’s results indicate that a peak hour may not yield sufficient observations for less frequent vehicle categories. For this reason, a longer observation period, such as a 12-h traffic survey, is more suitable for determining stable, representative time-headway values. Third, the proposed methodology was tested on selected intersections located near industrial areas; therefore, further validation is required before general application to other types of intersections, traffic compositions, and road environments.
At high degrees of saturation, vehicle time headways may change non-linearly due to queue formation, forced stopping, downstream restrictions at the intersection exit, or interactions between individual traffic streams. Under such conditions, the average time headway no longer represents the relative effect of a specific vehicle category solely. Therefore, the methodology should not be applied under oversaturated conditions, i.e., when the degree of saturation is approximately x ≥ 1.0, or in cases where vehicle queues regularly extend to the measurement location [90]. When the degree of saturation is close to capacity, approximately x > 0.85, the results should be interpreted with increased caution and verified using additional operational indicators, particularly queue length and directly measured vehicle waiting time.
The methodology proposed in this study is based not only on the results of a conventional turning-movement traffic survey at the intersection, but also on the measurement of vehicle time headways using ATCs. A prerequisite for identifying the time headways of individual vehicle groups is their categorization. However, classifying vehicles into detailed categories based solely on length is practically difficult, as the lengths of certain types may overlap; for example, buses and trucks often have similar lengths.
Therefore, the proposed methodology requires creating only two or three broader length-based groups, as shown in Figure 3. The total number of vehicles in these groups can then be determined accurately from the classified traffic survey. By sorting all recorded vehicle passages according to their measured vehicle length and subsequently assigning them proportionally to the corresponding vehicle groups identified in the traffic survey, the effect of individual classification inaccuracies can be substantially reduced.
Another important aspect is the relationship between the proposed dynamic PCU methodology and existing national technical guidelines. The presented approach does not necessarily have to replace static tabulated values immediately. In the first stage, it could be used as an alternative method in specific cases where standard assumptions are questionable, for example, where the share of HV is high, the geometric layout is atypical, or the results of TCA are close to threshold values. In such cases, dynamically determined PCU values could provide a more reliable basis for decision-making. In the long term, the methodology could inform future revisions to technical guidelines by providing a transparent, data-based procedure for determining local equivalency factors.
Future research should expand the dataset to include a wider range of intersection types, including priority-controlled intersections, signalized intersections, single-lane roundabouts, multilane roundabouts, and TRs with varying geometric parameters. The aim of this study was not to demonstrate the universal applicability of the proposed methodology to all traffic situations, but rather to develop a practical procedure for dynamically determining PCU values based on time headways and to verify its applicability at unsignalized intersections with a higher proportion of HV. The selected sites were intentionally located near industrial areas to capture enough trucks and HV combinations to evaluate their influence on traffic flow.
The aim of the study was not to demonstrate the universal applicability of the methodology to all traffic situations, but rather to propose a practical procedure for the dynamic determination of PCU values based on time headways and to verify its applicability at unsignalized intersections with a higher proportion of HV. The selected sites were intentionally located near industrial areas to capture enough trucks and HV combinations to evaluate their influence on traffic flow. Signalized intersections may be particularly challenging because vehicles are required to come to a complete stop. This may result in more pronounced differences between the time headways of light and HV. For example, the authors of [91] estimated PCU values of approximately 0.40 for two-wheelers, 0.73 for autorickshaws, 1.30 for light commercial vehicles, and 2.06 for HV.
Further studies should also examine the influence of traffic volume, congestion level, entry geometry, lane width, longitudinal gradient, and the proportion of HV on dynamically determined PCU values. Another promising direction is to compare the proposed time-headway-based methodology with microsimulation outputs and other PCU estimation methods described in the literature. Such comparisons would enable evaluation of the robustness of the proposed method and determination of the conditions under which it provides the most reliable results. In addition, future research could focus on developing automated procedures for processing radar and video data, which would reduce the time required for traffic surveys and increase the practical applicability of the methodology.
Future research could extend the proposed methodology by using calibrated microscopic simulation models and machine-learning techniques. After calibration and validation using field data, microsimulation would enable the systematic evaluation of a broader range of traffic, geometric, and operational conditions that cannot be fully captured through field measurements alone. Such analyses could include varying proportions of heavy vehicles, traffic demand levels, lane configurations, intersection geometry, longitudinal gradients, control strategies, and queue formation. This would enable identification of the combinations of conditions under which PCU values change most substantially and could support extending the methodology to other intersection types, including signalized intersections. Previous research has demonstrated that microscopic simulation can be used to examine the effects of traffic volume, vehicle composition, and road width on PCU values at intersections, while also emphasizing the importance of proper calibration for individual vehicle classes and local driver behavior [91,92,93].
Machine-learning methods could further support the identification of nonlinear relationships between PCU values and explanatory variables, including vehicle composition, traffic volume, speed, time headways, vehicle length, intersection geometry, and the operational state of the traffic stream. With a sufficiently extensive and representative database from multiple locations, a predictive model could estimate a likely range of PCU values for new operating conditions or identify situations in which the use of standard tabulated coefficients may be inappropriate. Such approaches should not replace field measurements without validation; rather, they can serve as complementary tools to improve model calibration, identify influential factors, and support the transferability of the proposed methodology across different traffic conditions.

Author Contributions

Conceptualization, K.Č. and A.K.; methodology, K.Č. and M.P.; software, K.Č.; validation, K.Č., A.K. and P.F.; formal analysis, A.K.; investigation, K.Č.; resources, A.K.; data curation, P.F.; writing—original draft preparation, K.Č.; writing—review and editing, P.F.; visualization, K.Č.; supervision, A.K.; project administration, M.P.; funding acquisition, A.K. and M.P. All authors have read and agreed to the published version of the manuscript.

Funding

This paper has been developed under support of the project: MŠVVŠ SR VEGA No. 1/0411/25 KALAŠOVÁ, A.: Shared mobility in Slovakia and its economic impacts on enhancing the competitiveness of public transportation in urban environments.

Institutional Review Board Statement

Not applicable.

Informed Consent Statement

Not applicable.

Data Availability Statement

All used data are available on request from the author.

Conflicts of Interest

The authors declare no conflicts of interest.

Abbreviations

The following abbreviations are used in this manuscript:
ABArticulated bus
APHAfternoon peak hour
ATCAutomatic traffic counter
BBus
CCyclist
HVHeavy vehicle
LOSLevel of service
LVLight vehicle
MMotorcycle
MPHMorning peak hour
NCVNon-classified vehicle
PCPassenger car
PCEPassenger car equivalent
PCTPassenger car/van with trailer
PCUPassenger car unit
TTruck
TSTractor–semitrailer combination
TTTruck–trailer combination
VVan

References

  1. Shen, Y.; Bao, Q.; Hermans, E. Applying an Alternative Approach for Assessing Sustainable Road Transport: A Benchmarking Analysis on EU Countries. Sustainability 2020, 12, 10391. [Google Scholar] [CrossRef]
  2. Cigu, E.; Agheorghiesei, D.T.; Gavriluță, A.F.; Toader, E. Transport Infrastructure Development, Public Performance and Long-Run Economic Growth: A Case Study for the Eu-28 Countries. Sustainability 2019, 11, 67. [Google Scholar] [CrossRef]
  3. Sun, C.; Leng, J.; Lu, B. Interactive Left-Turning of Autonomous Vehicles at Uncontrolled Intersections. IEEE Trans. Autom. Sci. Eng. 2024, 21, 204–214. [Google Scholar] [CrossRef]
  4. Tang, X.; Zhong, G.; Li, S.; Yang, K.; Shu, K.; Cao, D.; Lin, X. Uncertainty-Aware Decision-Making for Autonomous Driving at Uncontrolled Intersections. IEEE Trans. Intell. Transp. Syst. 2023, 24, 9725–9735. [Google Scholar] [CrossRef]
  5. Elgharbi, E.; Zöldy, M.; Layeb, S.B. Autonomous Vehicle and Pedestrian Interaction. Cogn. Sustain. 2024, 3, 15–31. [Google Scholar] [CrossRef]
  6. Jurecki, R.S.; Jaskiewicz, M. Analysis of Road Accidents in Poland over the Last Ten Years. Sci. J. Marit. Univ. Szczec. 2012, 32, 65–70. [Google Scholar]
  7. Richnak, P. New Development Directions of Logistics in an Industrial Company. In Proceedings of the Edamba 2016: International Scientific Conference for Doctoral Students and Post-Doctoral Scholars: Open Science & Open Innovation: Opportunities for Economics, Business, Management and Related Disciplines; Wallner, J., Ed.; Ekonom: Bratislava, Slovakia, 2016; pp. 315–323. [Google Scholar]
  8. Dupal’, A.; Richnak, P.; Gubova, K. Reingeneering of Reverse Logistics in Context of Sustainable Development in Production Businesses in Slovakia. AD ALTA J. Interdiscip. Res. 2016, 6, 21–24. [Google Scholar]
  9. Shepelev, V.; Glushkov, A.; Gritsenko, A.; Nevolin, D.; Vorobyev, A. Assessing the Traffic Capacity of Urban Road Intersections. Front. Built Environ. 2022, 8, 968846. [Google Scholar] [CrossRef]
  10. Shestha, S.; Suman, G.C.; Dangi, K.; Mehta, S.; Yadav, P.K.; Das, R. Capacity & Level of Service Assessment of Gwarko Intersection. J. Transp. Syst. 2024, 9, 30–39. [Google Scholar] [CrossRef]
  11. Slovak Road Administration: Technical Conditions TP 102 Calculation of Road Traffic Capacities, Valid from 2025. Available online: https://www.ssc.sk/files/documents/technicke-predpisy/tp/tp_102-2024.pdf (accessed on 28 May 2026).
  12. Slovak Road Administration: Technical Conditions TP 102 Calculation of Road Traffic Capacities, Valid from 2015. Available online: https://www.ssc.sk/files/documents/technicke-predpisy/tp/tp_102.pdf (accessed on 28 May 2026).
  13. Erd, A.; Jaskiewicz, M.; Koralewski, G.; Rutkowski, D.; Stoklosa, J. Experimental Research of Effectiveness of Brakes in Passenger Cars Under Selected Conditions. In Proceedings of the 2018 Xi International Science-Technical Conference Automotive Safety; IEEE: New York, NY, USA, 2018. [Google Scholar]
  14. Sarkan, B.; Jaskiewicz, M.; Kiktova, M. The Impact of the Truck Loads on the Braking Efficiency Assessment. Open Eng. 2020, 10, 105–112. [Google Scholar] [CrossRef]
  15. Sarraj, Y.; Jadili, I. Estimating Passenger Car Unit Factors for Buses and Animal Driven Carts in Gaza City, Palestine. IUG J. Nat. Stud. 2016, 20, 99–116. [Google Scholar]
  16. Mardani, M.N.; Chandra, S.; Ghosh, I. Passenger Car Unit of Vehicles on Undivided Intercity Roads in India. Procedia Comput. Sci. 2015, 52, 926–931. [Google Scholar] [CrossRef]
  17. Biswas, S.; Prasad, H.; Jaiswal, A.; Gehlot, A.R. Estimation of PCU and Saturation Flow at Signalised Intersection. In Proceedings of the Advances in Transportation Engineering; Pulugurtha, S., Ghosh, I., Biswas, S., Eds.; Springer: Singapore, 2019; pp. 35–45. [Google Scholar]
  18. Raju, M.M.; Chand, S.; Thomas, J. Estimation of PCU and Saturation Flow for Mixed Traffic Condition at Urban Signalized Intersections. Transp. Res. Rec. 2021, 2675, 1184–1195. [Google Scholar]
  19. Committee on Highway Capacity; Department of Traffic and Operations; Highway Research Board. Highway Capacity Manual: Practical Applications of Research; U.S. Department of Commerce, Bureau of Public Roads: Washington, DC, USA, 1950.
  20. Ondruš, J.; Jančár, A.; Gogola, M.; Varga, P.; Šarić, Ž.; Caban, J. Smartphone Sensors in Motion: Advancing Traffic Safety with Mobile Technology. Appl. Sci. 2024, 14, 5404. [Google Scholar] [CrossRef]
  21. Chitaria, J.V.; Raol, J.D. Estimation of Dynamic PCU Values at Signalized Intersection in Ahmedabad City. J. Emerg. Technol. Innov. Res. 2020, 7, 140–145. [Google Scholar]
  22. Alex, S.; Isaac, K.P. Dynamic Pcu Values at Signalised Intersections in India for Mixed Traffic. Int. J. Traffic Transp. Eng. 2015, 5, 197–209. [Google Scholar] [CrossRef] [PubMed]
  23. Nieoczym, A.; Caban, J.; Dudziak, A.; Stoma, M. Autonomous Vans-the Planning Process of Transport Tasks. Open Eng. 2020, 10, 18–25. [Google Scholar] [CrossRef]
  24. Caban, J.; Nieoczym, A.; Dudziak, A.; Krajka, T.; Stopkova, M. The Planning Process of Transport Tasks for Autonomous Vans-Case Study. Appl. Sci. 2022, 12, 2993. [Google Scholar] [CrossRef]
  25. Ingle, A. Development of Passenger Car Equivalents for Basic Freeway Segments. Master’s Thesis, Virginia Tech, Blacksburg, VA, USA, 2004. [Google Scholar]
  26. Bathla, G.; Bhadane, K.; Singh, R.K.; Kumar, R.; Aluvalu, R.; Krishnamurthi, R.; Kumar, A.; Thakur, R.N.; Basheer, S. Autonomous Vehicles and Intelligent Automation: Applications, Challenges, and Opportunities. Mob. Inf. Syst. 2022, 2022, 7632892. [Google Scholar] [CrossRef]
  27. González-Saavedra, J.F.; Figueroa, M.; Céspedes, S.; Montejo-Sánchez, S. Survey of Cooperative Advanced Driver Assistance Systems: From a Holistic and Systemic Vision. Sensors 2022, 22, 3040. [Google Scholar] [CrossRef] [PubMed]
  28. Mishra, A.; Purohit, J.; Nizam, M.; Gawre, S.K. Recent Advancement in Autonomous Vehicle and Driver Assistance Systems. In Proceedings of the 2023 IEEE International Students’ Conference on Electrical, Electronics and Computer Science (SCEECS); IEEE: Bhopal, India, 2023; pp. 1–5. [Google Scholar]
  29. Peng, H.; Chen, F.; Chen, P. Examining the Effects of Visibility and Time Headway on the Takeover Risk during Conditionally Automated Driving. Int. J. Environ. Res. Public Health 2022, 19, 13904. [Google Scholar] [CrossRef] [PubMed]
  30. Luu, L.; Phan, T.L.; Pham, H.T.; Hoang, T.; Le, M. Stability of Adaptive Cruise Control of Automated Vehicle Platoon under Constant Time Headway Policy. Int. J. Autom. Sci. Technol. 2024, 8, 397–403. [Google Scholar] [CrossRef]
  31. Khan, A.A.; Dass, S. Revisiting PCU Values of Various Vehicles in Mixed Traffic Conditions: Estimation and Comparison. Commun. Sci. Lett. Univ. Zilina 2025, 27, 76–89. [Google Scholar] [CrossRef]
  32. Chen, X.; Wu, Z.; Liang, Y. Modeling Mixed Traffic Flow with Connected Autonomous Vehicles and Human-Driven Vehicles in Off-Ramp Diverging Areas. Sustainability 2023, 15, 5651. [Google Scholar] [CrossRef]
  33. Torbic, D.; Elefteriadou, L.; Ho, T.-J.; Wang, Y. Passenger Car Equivalents for Highway Cost Allocation. Transp. Res. Rec. 1997, 1576, 37–45. [Google Scholar] [CrossRef]
  34. Sharma, M.; Biswas, S. Estimation of Passenger Car Unit on Urban Roads: A Literature Review. Int. J. Transp. Sci. Technol. 2021, 10, 283–298. [Google Scholar] [CrossRef]
  35. Mohan, M.; Chandra, S. Three Methods of PCU Estimation at Unsignalized Intersections. Transp. Lett. 2018, 10, 68–74. [Google Scholar] [CrossRef]
  36. Pal, D.; Sen, S.; Chakraborty, S.; Roy, S.K. Effect of PCU Estimation Methods on Capacity of Two-Lane Rural Roads in India: A Case Study. Transp. Res. Procedia 2020, 48, 734–746. [Google Scholar] [CrossRef]
  37. Khisty, C.J. Transportation Engineering: An Introduction. In Proceedings of the Choice Reviews Online; Prentice Hall: Englewood Cliffs, NJ, USA, 1990; Volume 27, pp. 27–6354. [Google Scholar]
  38. Alhassan, H. Evaluation of Passenger Car Equivalent Values under Rainfall. In Proceedings of the International Conference on Traffic and Transportation Engineering (ICTTE 2012); City Net Scientific Research Center: Belgrade, Serbia, 2020. [Google Scholar]
  39. Šarić, Ž.; Kučinić, T.; Kunštek, A.; Ondruš, J. The Impact of Speed Bumps on Traffic Flow Speed in Urban Road Networks. Appl. Sci. 2025, 15, 12221. [Google Scholar] [CrossRef]
  40. Yeung, J.S.; Wong, Y.D.; Secadiningrat, J.R. Lane-Harmonised Passenger Car Equivalents for Heterogeneous Expressway Traffic. Transp. Res. Part A Policy Pract. 2015, 78, 361–370. [Google Scholar] [CrossRef]
  41. Hasanat, H.A.A.; Alothman, D.; AlHarasees, O. Capacity of Single-Lane Roundabouts in Hungary. Period. Polytech. Transp. Eng. 2025, 53, 124–134. [Google Scholar] [CrossRef]
  42. Kumar, P.; Raju, N.; Mishra, A.; Arkatkar, S.S.; Joshi, G. Validating Area Occupancy–Based Passenger Car Units and Homogeneous Equivalent Concept under Mixed Traffic Conditions in India. J. Transp. Eng. Part A Syst. 2018, 144, 04018064. [Google Scholar] [CrossRef]
  43. Cunagin, W.D.; Messer, C.J. Passenger Car Equivalents for Rural Highways; U.S. Department of Transportation, Federal Highway Administration: Washington, DC, USA, 1982.
  44. Biswas, S.; Chakraborty, S.; Chandra, S.; Ghosh, I. Kriging-Based Approach for Estimation of Vehicular Speed and Passenger Car Units on an Urban Arterial. J. Transp. Eng. Part A Syst. 2017, 143, 04016013. [Google Scholar] [CrossRef]
  45. Biswas, S.; Chandra, S.; Ghosh, I. Estimation of Vehicular Speed and Passenger Car Equivalent Under Mixed Traffic Condition Using Artificial Neural Network. Arab. J. Sci. Eng. 2017, 42, 4099–4110. [Google Scholar] [CrossRef]
  46. Biswas, S.; Chandra, S.; Ghosh, I. Side Friction Parameters and Their Influences on Capacity of Indian Undivided Urban Streets. Int. J. Transp. Sci. Technol. 2021, 10, 1–19. [Google Scholar] [CrossRef]
  47. Adnan, M. Passenger Car Equivalent Factors in Heterogenous Traffic Environment-Are We Using the Right Numbers? Procedia Eng. 2014, 77, 106–113. [Google Scholar] [CrossRef]
  48. van Aerde, M.; Yagar, S. Capacity, Speed, and Platooning Vehicle Equivalents for Two-Lane Rural Highways. Transp. Res. Rec. 1984, 971, 58–67. [Google Scholar]
  49. Fisher, P.G.; Hughes Hallett, A.J. Iterative Techniques for Solving Simultaneous Equation Systems: A View from the Economics Literature. J. Comput. Appl. Math. 1988, 24, 241–255. [Google Scholar] [CrossRef]
  50. Dhamaniya, A.; Chandra, S. Conceptual Approach for Estimating Dynamic Passenger Car Units on Urban Arterial Roads by Using Simultaneous Equations. Transp. Res. Rec. 2016, 2553, 108–116. [Google Scholar] [CrossRef]
  51. Huber, M.J. Estimation of Passenger-Car Equivalents of Trucks in Traffic Stream. Transp. Res. Rec. 1982, 869, 60–70. [Google Scholar]
  52. Pajecki, R.; Ahmed, F.; Qu, X.; Zheng, X.; Yang, Y.; Easa, S. Estimating Passenger Car Equivalent of Heavy Vehicles at Roundabout Entry Using Micro-Traffic Simulation. Front. Built Environ. 2019, 5, 77. [Google Scholar] [CrossRef]
  53. Webster, N.; Elefteriadou, L. A Simulation Study of Truck Passenger Car Equivalents (PCE) on Basic Freeway Sections. Transp. Res. Part B Methodol. 1999, 33, 323–336. [Google Scholar] [CrossRef]
  54. Arasan, V.T.; Arkatkar, S.S. Microsimulation Study of Effect of Volume and Road Width on PCU of Vehicles under Heterogeneous Traffic. J. Transp. Eng. 2010, 136, 1110–1119. [Google Scholar] [CrossRef]
  55. Mehar, A.; Chandra, S.; Velmurugan, S. Passenger Car Units at Different Levels of Service for Capacity Analysis of Multilane Interurban Highways in India. J. Transp. Eng. 2014, 140, 81–88. [Google Scholar] [CrossRef]
  56. Morgos, J.; Klco, P.; Hrudkay, K. Artificial Neural Network Based Mppt Algorithm for Modern Household with Electric Vehicle. Komun. Ved. Listy Zilinskej Univ. Ziline 2022, 24, C18–C26. [Google Scholar] [CrossRef]
  57. Bindzar, P.; Marasova, D.; Brodny, J.; Tutak, M.; Ulewicz, R.; Sliva, A. Modeling the Impact of Intersection Design Configurations on Traffic Flow During Peak Hour in Smart Cities: A Case Study on Urban Roads in Slovakia. IEEE Access 2024, 12, 83072–83090. [Google Scholar] [CrossRef]
  58. Stepanović, N.; Tubić, V.; Milenković, M.; Halaj, K. The Impact of Basic Traffic Flow Characteristics on Traffic Accident Occurrence on 2-Lane Rural Roads in Serbia. Transport 2025, 40, 64–73. [Google Scholar] [CrossRef]
  59. Ding, H.; Yuan, H.; Zheng, X.; Ma, H.; Bai, H. Spatial Partition for Heterogeneous City Networks Composed of Factors That Influence the Distribution of the Macroscopic Fundamental Diagram. Transport 2023, 38, 152–164. [Google Scholar] [CrossRef]
  60. Sumner, R.; Hill, D.; Shapiro, S. Segment Passenger Car Equivalent Values for Cost Allocation on Urban Arterial Roads. Transp. Res. Part A General. 1984, 18, 399–406. [Google Scholar] [CrossRef]
  61. Bindzar, P.; Macuga, D.; Brodny, J.; Tutak, M.; Malindzakova, M. Use of Universal Simulation Software Tools for Optimization of Signal Plans at Urban Intersections. Sustainability 2022, 14, 2079. [Google Scholar] [CrossRef]
  62. Slovak Road Administration: Technical Conditions TP 070 Forecasting of Prospective Intensities on the Road Network Until 2040. Available online: https://www.ssc.sk/files/documents/technicke-predpisy/tp/tp_070.pdf (accessed on 28 May 2026).
  63. Slovak Road Administration: Technical Conditions TP 100 Designing Turbo-Roundabouts. Available online: https://www.ssc.sk/files/documents/technicke-predpisy/tp/tp_100.pdf (accessed on 28 May 2026).
  64. Medelská, V.; Jirava, P.; Nop, D.; Rojan, J. Dopravné Inžinierstvo; ALFA: Bratislava, Czechoslovakia, 1991. [Google Scholar]
  65. Slovak Road Administration: Technical Conditions TP 01/2006 Calculation of the Capacity of Roads and Their Facilities. Slovak Road Administration: Bratislava, Slovakia, 2006. Available online: https://www.ssc.sk/en/technological-standards-of-the-ministry-of-transport/summary-of-technological-standards.ssc (accessed on 5 July 2026).
  66. Slovak Road Administration: Technical Conditions TP 16/2015 Calculation of the Capacity of Roads and Their Facilities. Slovak Road Administration: Bratislava, Slovakia, 2015. Available online: https://www.ssc.sk/en/technological-standards-of-the-ministry-of-transport/summary-of-technological-standards.ssc (accessed on 5 July 2026).
  67. Zero, B.; Ali, N. Speed-Density Relationships of Urban Road in Erbil City Using Moving Vehicle Method; IEEE: Erbil, Iraq, 2022; p. 29. [Google Scholar]
  68. Panda, J.; Barve, H.; Sugandhi, S. Modified Passenger Car Unit for Highway Traffic: A Review. Int. J. Eng. Sci. Res. Technol. 2017, 6, 584–587. [Google Scholar] [CrossRef]
  69. The Highway Capacity Manual 2000; Transportation Research Board: Washington, DC, USA, 2000.
  70. Jatoth, J.; Mehar, A. Modeling Passenger Car Unit and Delay at Signalized Intersections in Mixed Traffic Conditions. U. Porto J. Eng. 2023, 9, 28–40. [Google Scholar] [CrossRef]
  71. Garmi, M.; Adams, C.A. Estimation of PCE Factors for Traffic at Signalized Intersections for Capacity Analysis in Monrovia. Transp. Res. Procedia 2025, 89, 211–226. [Google Scholar] [CrossRef]
  72. Jithender, J.; Sushmitha, R. Passenger Car Unit Estimation Based on Queued Vehicles at Approaches of Signalized Intersection in Mixed Traffic Conditions. Int. J. Intell. Transp. Syst. Res. 2024, 22, 282–289. [Google Scholar] [CrossRef]
  73. Gayen, S.; Saldivar-Carranza, E.D.; Sakhare, R.S.; Shellhamer, N.; Ruble, T.; McCoy, D.; Gallagher, J.; Bullock, D.M. Statewide Screening of Signalized Intersections for Capacity Improvements. Available online: https://rosap.ntl.bts.gov (accessed on 28 May 2026).
  74. Luitel, S.; Pokhrel, A.; Tiwari, H.; Dhakal, A. Evaluation of Operational Performance of Intersection and Optimizing Signal Timing: A Case Study of the Buspark Intersection in Birgunj Metropolitan. J. Adv. Res. Civ. Environ. Eng. 2023, 10, 22–33. [Google Scholar] [CrossRef]
  75. Lage, B.; Shrestha, A.; Kainchi, S. Evaluating Intersection Efficiency through NURS-Derived PCU Values and the Indo-HCM Methodology: A Case Study at Kamalbinayak. Int. J. Traffic Manag. Transp. Netw. 2025, 1, 9–16. [Google Scholar] [CrossRef]
  76. Sonu, M.; Dhamaniya, A.; Arkatkar, S.; Joshi, G. Time Occupancy as Measure of PCU at Four Legged Roundabouts. Transp. Lett. 2023, 15, 1251–1262. [Google Scholar] [CrossRef]
  77. Pratelli, A.; Lupi, M.; Pratelli, C.; Farina, A. Mini-Roundabouts for Improving Urban Accessibility. In Modelling of the Interaction of the Different Vehicles and Various Transport Modes; Sładkowski, A., Ed.; Springer International Publishing: Cham, Switzerland, 2020; pp. 333–382. [Google Scholar]
  78. Horváth, B.; Horváth, R.; Mohammed, D. Issues in Video-Based Data Collection of Traffic Flows. Eur. Transp. Stud. 2026, 3, 100051. [Google Scholar] [CrossRef]
  79. Slimani, I.; Zaarane, A.; Atouf, I. Traffic Monitoring System for Vehicle Detection in Day and Night Conditions. Transp. Telecommun. J. 2023, 24, 256–265. [Google Scholar] [CrossRef]
  80. Geodetic and Cartographic Institute Bratislava. Ortofotomozaika SR. Available online: https://www.skgeodesy.sk/en/ (accessed on 28 May 2026).
  81. Caban, J.; Nieoczym, A.; Gardynski, L. Strength Analysis of a Container Semi-Truck Frame. Eng. Fail. Anal. 2021, 127, 105487. [Google Scholar] [CrossRef]
  82. Gorzelanczyk, P. Impact of Weather Conditions and Road Type on Traffic Safety. Eur. Transp. Stud. 2025, 2, 100042. [Google Scholar] [CrossRef]
  83. Khalladi, S.A.; Ouessai, A.; Benamara, N.K.; Keche, M. Efficient Road Traffic Video Congestion Classification Based on the Multi-Head Self-Attention Vision Transformer Model. Transp. Telecommun. J. 2024, 25, 20–30. [Google Scholar] [CrossRef]
  84. Dayyabu, A.; Lawal, A.A.; Amuda, A.G.; Mambo, A.D.; Mohammed, A. Estimation of Three-Wheeler Passenger Unit (Pcu) Using Headway Method Case Study of Abuja Nigeria. In Proceedings of the 2019 15th International Conference on Electronics, Computer and Computation (ICECCO); IEEE: Abuja, Nigeria, 2019; pp. 1–7. [Google Scholar]
  85. Sun, Y.; Xie, B.; Wu, D. Three Methods of PCU Estimation at Signalized Intersections under Mixed Traffic with UAV Monitoring Data. J. Transp. Eng. Part A Syst. 2022, 148, 04021118. [Google Scholar] [CrossRef]
  86. Balid, W.; Tafish, H.; Refai, H.H. Intelligent Vehicle Counting and Classification Sensor for Real-Time Traffic Surveillance. IEEE Trans. Intell. Transp. Syst. 2018, 19, 1784–1794. [Google Scholar] [CrossRef]
  87. Hilmani, A.; Maizate, A.; Hassouni, L. Automated Real-Time Intelligent Traffic Control System for Smart Cities Using Wireless Sensor Networks. Wirel. Commun. Mob. Comput. 2020, 2020, 8841893. [Google Scholar] [CrossRef]
  88. Wang, Q.; Chen, J.; Song, Y.; Li, X.; Xu, W. Fusing Visual Quantified Features for Heterogeneous Traffic Flow Prediction. Promet-Traffic&Trans. 2024, 36, 1068–1077. [Google Scholar] [CrossRef]
  89. Yi, X.; Zhou, H.; Zhong, S. Real-Time Adaptive Traffic Flow Prediction Based on a GE-GRU-KNN Model. Promet-Traffic&Transp. 2025, 37, 754–772. [Google Scholar] [CrossRef]
  90. Ferencz, C.; Zöldy, M. Road Traffic Queue Length Estimation with Artificial Intelligence (AI) Methods. Cogn. Sustain. 2023, 2, 65. [Google Scholar] [CrossRef]
  91. Asaithambi, G.; Mourie, H.S.; Sivanandan, R. Passenger Car Unit Estimation at Signalized Intersection for Non-Lane Based Mixed Traffic Using Microscopic Simulation Model. Period. Polytech. Transp. Eng. 2017, 45, 12–20. [Google Scholar] [CrossRef]
  92. Maheshwary, P.; Bhattacharyya, K.; Maitra, B.; Boltze, M. A Methodology for Calibration of Traffic Micro-Simulator for Urban Heterogeneous Traffic Operations. J. Traffic Transp. Eng. 2020, 7, 507–519. [Google Scholar] [CrossRef]
  93. Otković, I.I.; Tollazzi, T.; Šraml, M.; Varevac, D. Calibration of the Microsimulation Traffic Model Using Different Neural Network Applications. Future Transp. 2023, 3, 150–168. [Google Scholar] [CrossRef]
Figure 1. Graphical representation of the development of PCU values in Slovakia [11,12,64,65,66].
Vehicles 08 00160 g001
Figure 2. Time headways and input of TCA.
Vehicles 08 00160 g002
Figure 3. Vehicle categories and groups.
Vehicles 08 00160 g003
Figure 4. Designation of the single-lane roundabout arms (1–4): (a) satellite image; (b) camera view.
Vehicles 08 00160 g004
Figure 5. Location of cameras K1–K4 and K6 during the traffic survey; arrows indicate the direction of recording.
Vehicles 08 00160 g005
Figure 6. Location of ATCs (A; B) on the arms (1–5) of the TR.
Vehicles 08 00160 g006
Figure 7. Traffic-load diagrams of arms (1–4) of the analyzed intersection: (a) MPH; (b) APH.
Vehicles 08 00160 g007
Figure 8. Comparison of maximum average waiting time: the value determined by direct field measurement (blue) and the value calculated using the TCA procedure for the analyzed intersection (orange). * 6-h period.
Vehicles 08 00160 g008
Figure 9. Total number of vehicles passing through the intersection in 15-min intervals.
Vehicles 08 00160 g009
Figure 10. Evolution of the waiting time according to different PCU values.
Vehicles 08 00160 g010
Table 1. Measurement of travel times in the 2–4 direction during the MPH.
Vehicle CategoryCounted Vehicles 1Counted Vehicles 2Success
Rate
[%]
Sum of Travel Times
[s]
Average travel Time [s]Multiple of PC Travel Time [-]
PC15014798523135.61.00
V101010036736.71.03
T4410018045.01.26
TT988938147.61.34
TS2210010653.01.49
Sum175171986265--
Table 2. Measurement of travel times in the 4–2 direction during the APH.
Vehicle CategoryCounted Vehicles 1Counted Vehicles 2Success
Rate
[%]
Sum of Travel Times
[s]
Average Travel Time [s]Multiple of PC Travel Time [-]
PC14213998470333.81.00
V221007537.51.11
T221009145.51.34
TS181810089549.71.47
Sum164161985764
Table 3. Example of coefficient calculation based on data from ATC-A.
VariableValueUnit
Share of LV0.891[-]
Share of HV0.109[-]
Average time headway10.38[s/veh]
Average time headway of LV9.40[s/veh]
Number of LV observations2539[-]
Number of HV observations487[-]
PCU coefficient1.96[-]
Table 4. Example of coefficient calculation based on data from ATC-B.
VariableValueUnit
Share of LV0.819[-]
Share of HV0.171[-]
Average time headway9.78[s/veh]
Average time headway of LV9.14[s/veh]
Number of LV observations2856[-]
Number of HV observations332[-]
PCU coefficient1.47[-]
Disclaimer/Publisher’s Note: The statements, opinions and data contained in all publications are solely those of the individual author(s) and contributor(s) and not of MDPI and/or the editor(s). MDPI and/or the editor(s) disclaim responsibility for any injury to people or property resulting from any ideas, methods, instructions or products referred to in the content.